taming db2 for z/os application performance: analysis and
TRANSCRIPT

Taming DB2 for z/OS Application Performance: Analysis and Trending Techniques ”
Speaker:
Robert Cummings, Avnet Inc.
Norbert Jenninger, IBM
Session Code: B18 Thu, May 07, 2015 (02:15 PM - 03:15 PM) : Grand Ballroom – North Platform: DB2 z/OS - II
© Copyright IBM Corporation 2014. All rights reserved. •U.S. Government Users Restricted Rights - Use, duplication or disclosure restricted by GSA ADP Schedule Contract with IBM Corp.
IBM, the IBM logo, ibm.com, Information Management, Tivoli, DB2, DRDA, OMEGAMON, Optim, z/OS, CICS, VTAM, SMP/E, and AIX are trademarks or registered trademarks of International Business Machines Corporation in the United States, other countries, or both. Netezza is a registered trademark of Netezza Corporation, an IBM Company. If these and other IBM trademarked terms are marked on their first occurrence in this information with a trademark symbol (® or ™), these symbols indicate U.S. registered or common law trademarks owned by IBM at the time this information was published. Such trademarks may also be registered or common law trademarks in other countries. A current list of IBM trademarks is available on the Web at “Copyright and trademark information” at www.ibm.com/legal/copytrade.shtml
Java and all Java-based trademarks and logos are trademarks of Sun Microsystems, Inc. in the United States, other countries, or both. UNIX is a registered trademark of The Open Group in the United States and other countries. Other company, product, or service names may be trademarks or service marks of others.
Availability. References in this presentation to IBM products, programs, or services do not imply that they will be available in all
countries in which IBM operates.
The workshops, sessions and materials have been prepared by IBM or the session speakers and reflect their own views. They are
provided for informational purposes only, and are neither intended to, nor shall have the effect of being, legal or other guidance or
advice to any participant. While efforts were made to verify the completeness and accuracy of the information contained in this
presentation, it is provided AS-IS without warranty of any kind, express or implied. IBM shall not be responsible for any damages
arising out of the use of, or otherwise related to, this presentation or any other materials. Nothing contained in this presentation is
intended to, nor shall have the effect of, creating any warranties or representations from IBM or its suppliers or licensors, or altering
the terms and conditions of the applicable license agreement governing the use of IBM software.
All customer examples described are presented as illustrations of how those customers have used IBM products and the results they
may have achieved. Actual environmental costs and performance characteristics may vary by customer. Nothing contained in these
materials is intended to, nor shall have the effect of, stating or implying that any activities undertaken by you will result in any specific
sales, revenue growth or other results.
Acknowledgements and disclaimers

Preface and Objectives Identifying bottlenecks, trends, and spikes in workload as well as isolating poorly running transactions and programs are the challenges DBAs at Avnet are faced with. Bob will share how he is using the OMEGAMON XE for DB2 Performance Expert (OMPE) features like the Performance database and spread sheet tools for his performance analysis. In addition, he’ll show how DB2 Query Monitor (QM) helps him to review SQL and object metrics then finally how InfoSphere Optim Query Workload Tuner (OQWT) helps him to improve the system application performance. Please welcome Robert Cummings from Avnet Inc.

Agenda • Introduction
• Avnet Database Tools
• Trend Analysis Methods & Tools
• SQL Performance Analysis and Tuning
• Looking Forward
• QA
• Some additional comments
Introduction
• Robert Cummings • Enterprise Database Administrator
Avnet Inc.
• Currently working for Avnet for 13 years
• DBA since 1982
• Supporting both IMS & DB2
• Banking, Power, & Distribution industries
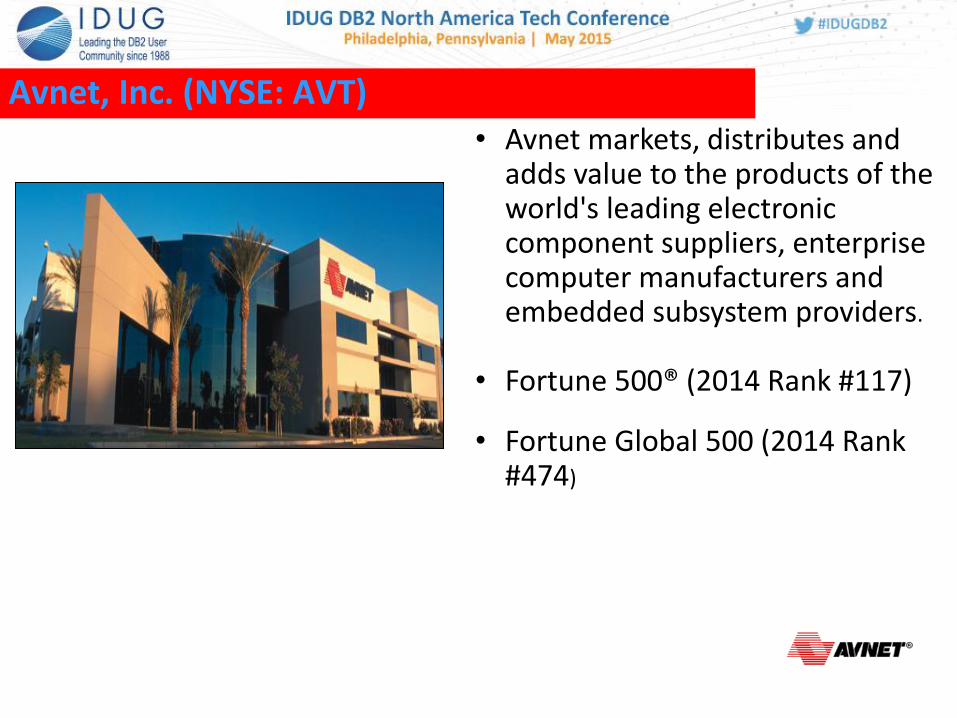
Avnet, Inc. (NYSE: AVT) • Avnet markets, distributes and
adds value to the products of the world's leading electronic component suppliers, enterprise computer manufacturers and embedded subsystem providers.
• Fortune 500® (2014 Rank #117)
• Fortune Global 500 (2014 Rank #474)
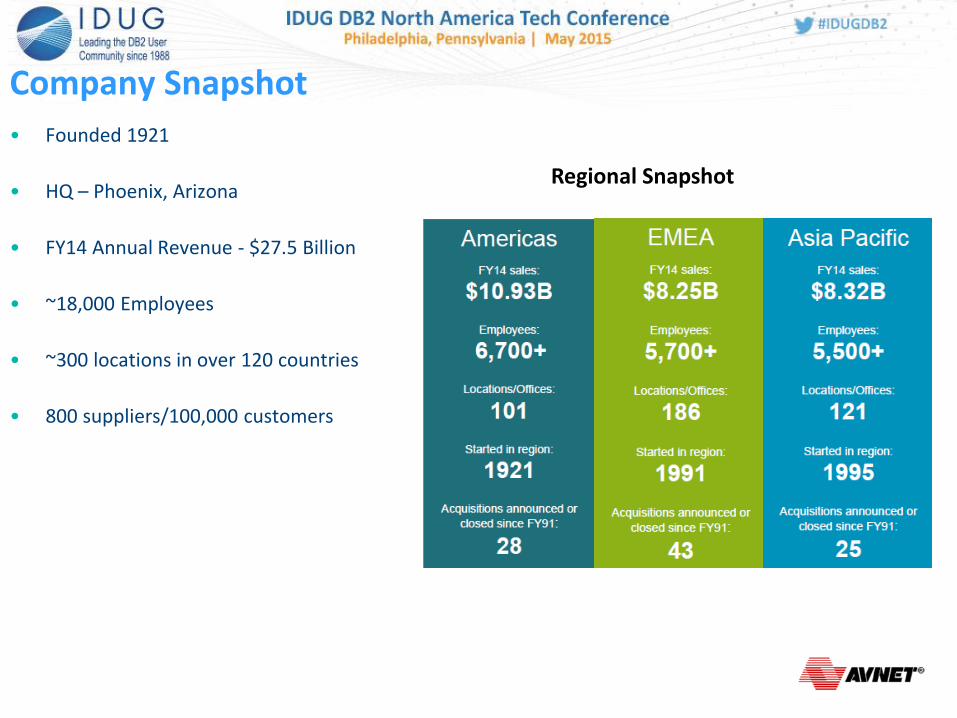
Company Snapshot
• Founded 1921
• HQ – Phoenix, Arizona
• FY14 Annual Revenue - $27.5 Billion
• ~18,000 Employees
• ~300 locations in over 120 countries
• 800 suppliers/100,000 customers
Regional Snapshot
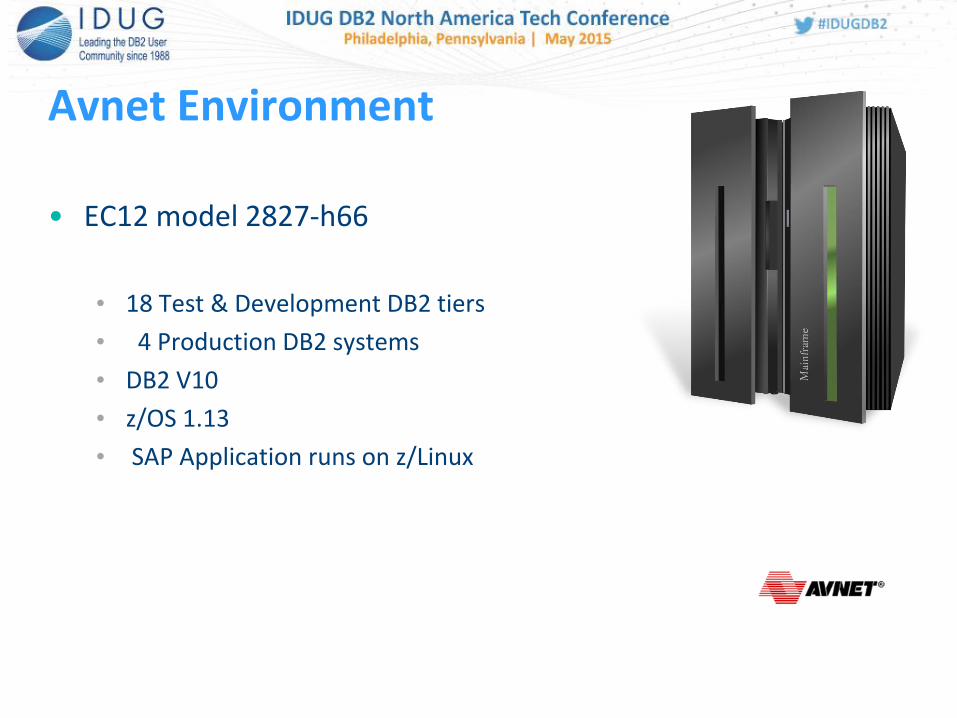
Avnet Environment
• EC12 model 2827-h66
• 18 Test & Development DB2 tiers
• 4 Production DB2 systems
• DB2 V10
• z/OS 1.13
• SAP Application runs on z/Linux

Big Business Big Data
• In today's Big data environments
• Database performance becomes critical
• Growing online and batch demand
What happens if we do nothing
• Poor customer experience
• Critical batch deadlines missed
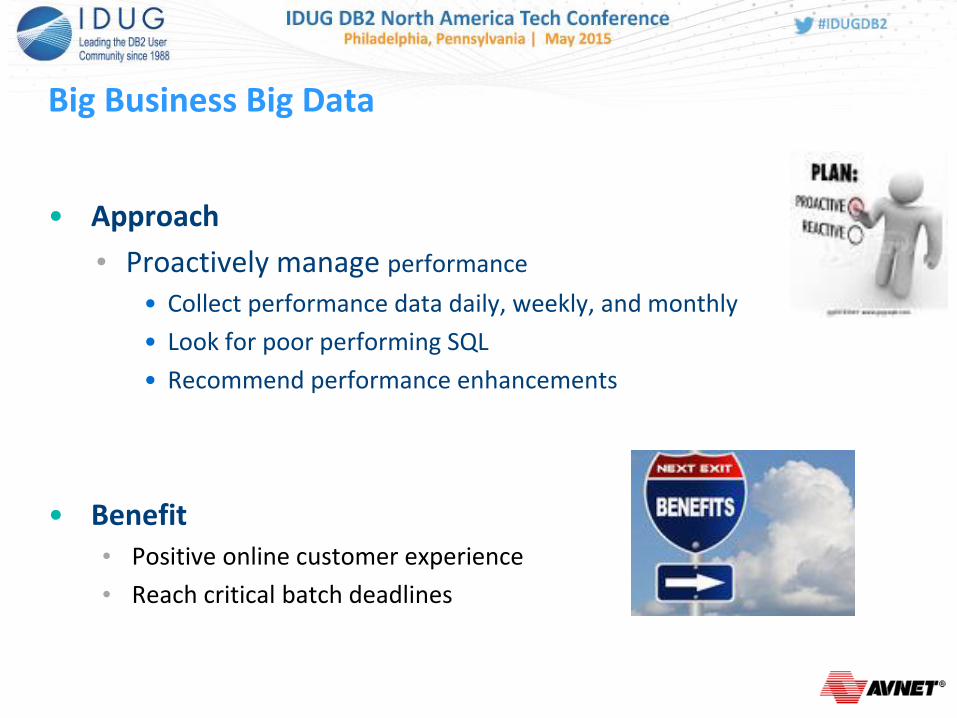
Big Business Big Data
• Approach
• Proactively manage performance
• Collect performance data daily, weekly, and monthly
• Look for poor performing SQL
• Recommend performance enhancements
• Benefit • Positive online customer experience
• Reach critical batch deadlines
Avnet Database Performance Tools
• IBM Tivoli OMEGAMON XE for DB2 Performance Expert on z/OS – v5.1
• OMEGAMON Classic Online Monitor
• DB2 Query Monitor - CQM V3R1M0
• InfoSphere Optim Query Workload Tuner for DB2, Version 4.1
Every day DBA Challenges
• The SYSTEM is running slow
• Application transactions are running slow
• Batch is running slow
• Why are we getting Deadlocks
• Many more…
It’s a Database problem…..?
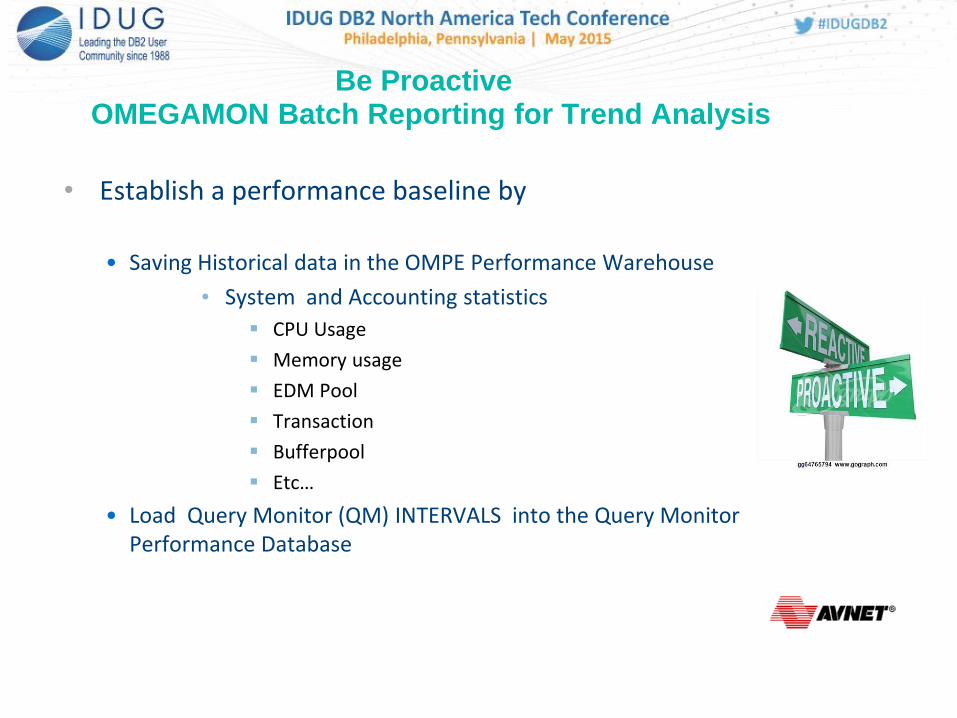
Be Proactive OMEGAMON Batch Reporting for Trend Analysis
• Establish a performance baseline by
• Saving Historical data in the OMPE Performance Warehouse
• System and Accounting statistics
CPU Usage
Memory usage
EDM Pool
Transaction
Bufferpool
Etc…
• Load Query Monitor (QM) INTERVALS into the Query Monitor Performance Database
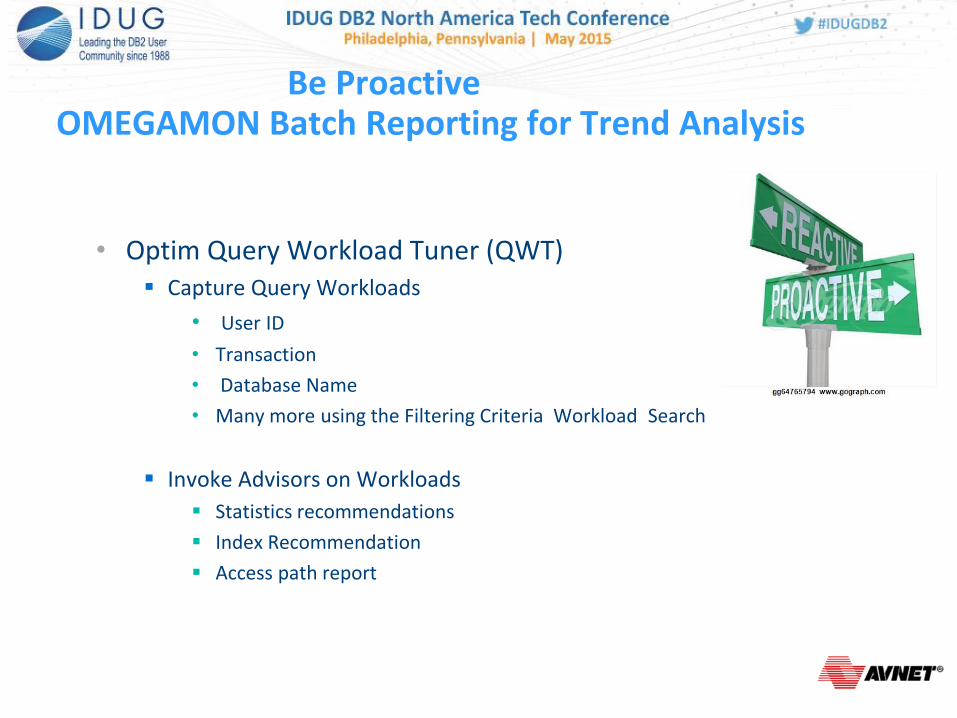
Be Proactive OMEGAMON Batch Reporting for Trend Analysis
• Optim Query Workload Tuner (QWT) Capture Query Workloads
• User ID
• Transaction
• Database Name
• Many more using the Filtering Criteria Workload Search
Invoke Advisors on Workloads
Statistics recommendations
Index Recommendation
Access path report
Database Tools Trend Analysis & SQL Performance Tuning
OMEGAMON – OMPE
Query Monitor
Optim Query Workload Tuner – OQWT
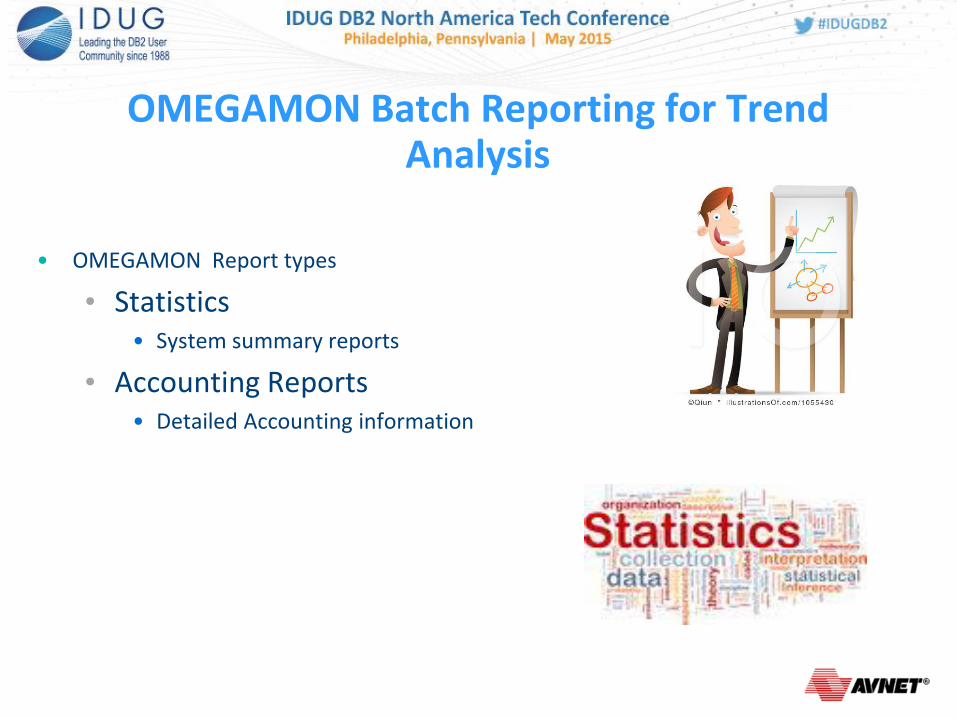
OMEGAMON Batch Reporting for Trend Analysis
• OMEGAMON Report types
• Statistics • System summary reports
• Accounting Reports • Detailed Accounting information

OMEGAMON Statistics report
• Step3 – LOAD STATS TO DB2 PERFORMANCE WAREHOUSE
• LOAD DATA INDDN(SYSREC)
RESUME YES LOG NO
INTO TABLE DB2PM.DB2PM_STAT_GENERAL
WHEN (9:
• Step 4 – Query Performance Warehouse
Step1 – run DB2PM Reading SMF data //SYSIN DD * GLOBAL TIMEZONE(+07:00) STATISTICS REPORT DDNAME(STRPTDD) SAVE DDNAME(STSAVDD) EXEC /* Step 2 – DGOPMICO,PARM=CONVERT
• CONVERT STAT VSAM FILE TO DB2 LOADABLE SEQUENTIAL FILE
• This will convert the saved data located in
//STSAVDD • Output can be loaded to PWH DB
**Note** This step is no longer needed if OMEGAMON maintenance level is V520

OMEGAMON Statistics report
0
500
1000
1500
2000
2/1
0/2
01
4
2/2
4/2
01
4
3/1
0/2
01
4
3/2
4/2
01
4
4/7
/20
14
4/2
1/2
01
4
5/5
/20
14
5/1
9/2
01
4
6/2
/20
14
6/1
6/2
01
4
6/3
0/2
01
4
7/1
4/2
01
4
7/2
8/2
01
4
CP
U u
sage
DB2 MASTER
DB2AMSTR
DB2BMSTR0
100020003000400050006000
2/1
0/2
01
4
2/2
4/2
01
4
3/1
0/2
01
4
3/2
4/2
01
4
4/7
/20
14
4/2
1/2
01
4
5/5
/20
14
5/1
9/2
01
4
6/2
/20
14
6/1
6/2
01
4
6/3
0/2
01
4
7/1
4/2
01
4
7/2
8/2
01
4
CP
U U
sage
Database DBM1
DB2ADBM1
DB2BDBM1
DB2CDBM1
Retrieve data from Performance Warehouse

OMEGAMON Statistics report
000036 //STEPST01 EXEC PGM=DB2PM,PARM='DATEFORMAT=YY-MM-DD'
000037 //STEPLIB DD DSN=IBM.OMEG.V511.RKANMOD,DISP=SHR
000038 // DD DSN=IBM.OMEG.V511.RKANMODU,DISP=SHR
000039 //INPUTDD DD DSN=SYSBAK.SMF.WEEKLY(-4),DISP=SHR
000040 // DD DSN=SYSBAK.SMF.WEEKLY(-3),DISP=SHR
000041 // DD DSN=SYSBAK.SMF.WEEKLY(-2),DISP=SHR SMF INPUT
000042 // DD DSN=SYSBAK.SMF.WEEKLY(-1),DISP=SHR
000043 // DD DSN=SYSBAK.SMF.WEEKLY(0),DISP=SHR
000045 //STSAVDD DD DSN=DBA.STATSAVE,DISP=OLD
000059 //SYSIN DD *
000060 GLOBAL
000061 TIMEZONE(-02:00)
000062 FROM(15-01-05,00:00),TO(15-02-18,23:59)
000063 STATISTICS
000064 REDUCE INTERVAL(1440)
000065 * REPORT LAYOUT(LONG)
000066 * DDNAME(STRPTDD)
000067 * ORDER(INTERVAL)
000068 SAVE
000069 DDNAME(STSAVDD)
000070 EXEC
000071 /*
000077 //STEPCNV EXEC PGM=DGOPMICO,PARM=CONVERT
000078 //STEPLIB DD DISP=SHR,DSN=IBM.OMEG.V511.RKANMOD
000079 //SYSPRINT DD SYSOUT=*
000080 //INPUT DD DISP=SHR,DSN=DBA.STATSAVE
000081 //OUTPUT DD DSN=DBA.DB2PE.STAT.FILE,DISP=SHR
000082 //*
000083 //* STATISTICS SAVE -----------------------------------------------
000084 // EXEC PROC=FPEPCSVP,TYPE=SGEN,PERSEC=N,HDRROW=Y,HDRPDCOL=N,
000085 // DELIM=',',DECSEP='.',
000086 // SAMPDIR=IBM.OMEG.V511.TKO2SAMP,
000087 // FLDSELDS=DBA.IBM.OMEG.V511.FPECSVU(STATGEN),
000088 // INPUTDS=DBA.DB2PE.STAT.FILE,
000089 // OUTPUTDS=DBA.DB2PE.STAT.FILE,OUTDISP=OLD
000090 //*********************************************************
MODULE NAME : FPEPCSVP DESCRIPTION : Spreadsheet Utility sample job for creation of STATISTICS SAVE spreadsheets
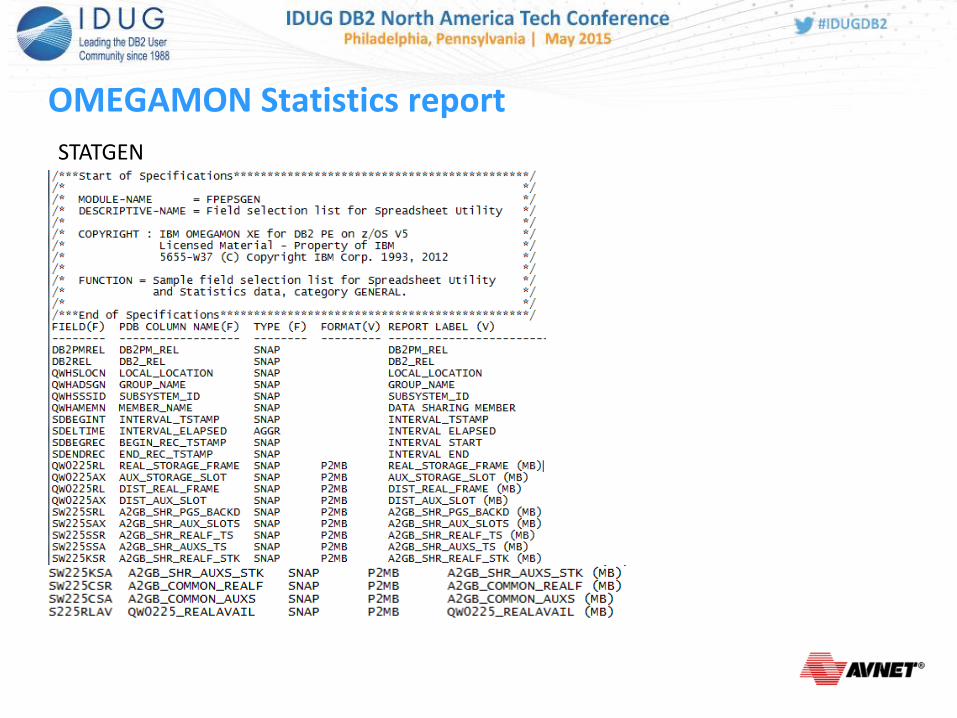
OMEGAMON Statistics report
STATGEN
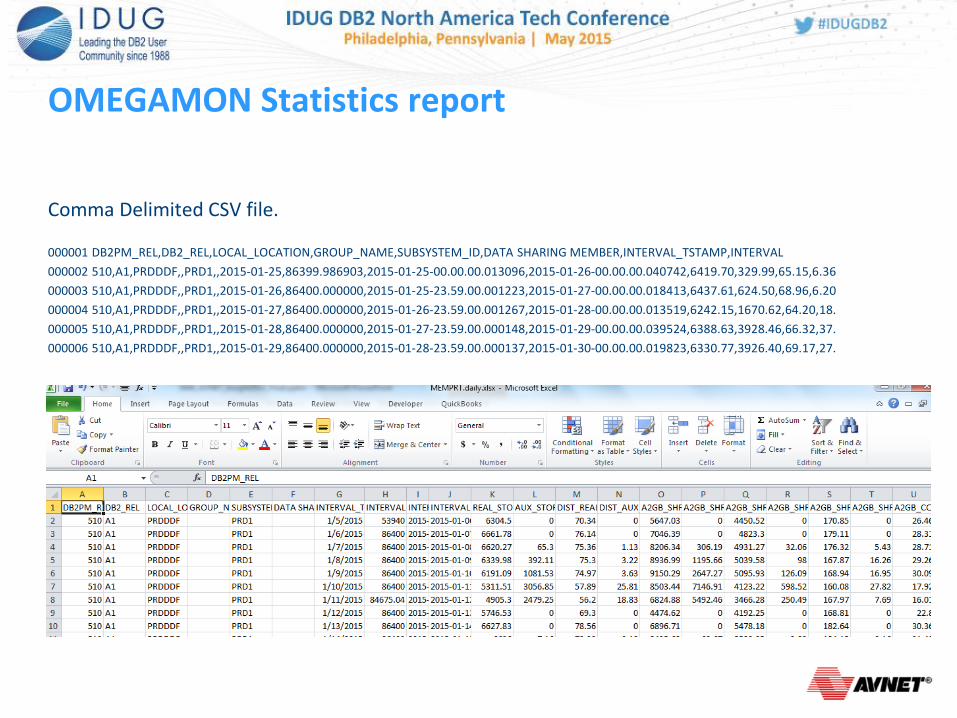
OMEGAMON Statistics report
Comma Delimited CSV file.
000001 DB2PM_REL,DB2_REL,LOCAL_LOCATION,GROUP_NAME,SUBSYSTEM_ID,DATA SHARING MEMBER,INTERVAL_TSTAMP,INTERVAL
000002 510,A1,PRDDDF,,PRD1,,2015-01-25,86399.986903,2015-01-25-00.00.00.013096,2015-01-26-00.00.00.040742,6419.70,329.99,65.15,6.36
000003 510,A1,PRDDDF,,PRD1,,2015-01-26,86400.000000,2015-01-25-23.59.00.001223,2015-01-27-00.00.00.018413,6437.61,624.50,68.96,6.20
000004 510,A1,PRDDDF,,PRD1,,2015-01-27,86400.000000,2015-01-26-23.59.00.001267,2015-01-28-00.00.00.013519,6242.15,1670.62,64.20,18.
000005 510,A1,PRDDDF,,PRD1,,2015-01-28,86400.000000,2015-01-27-23.59.00.000148,2015-01-29-00.00.00.039524,6388.63,3928.46,66.32,37.
000006 510,A1,PRDDDF,,PRD1,,2015-01-29,86400.000000,2015-01-28-23.59.00.000137,2015-01-30-00.00.00.019823,6330.77,3926.40,69.17,27.
Import into EXECL

OMEGAMON Statistics report

OMEGAMON Statistics report Memory Formulas

OMEGAMON Accounting report
• OMEGAMON XE for DB2 PE identifiers • What are PE identifiers?
• DB2 trace records contain identifiers that OMEGAMON XE for DB2 PE uses to:
• Group data
• Order reports
• Identify trace records
• Include or exclude specific data
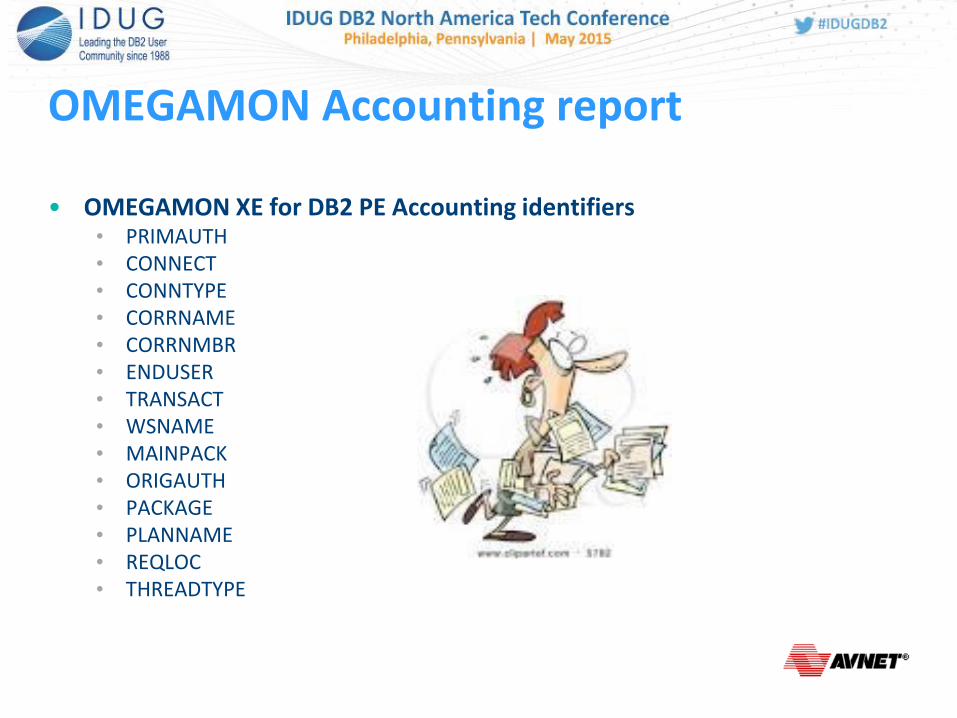
OMEGAMON Accounting report
• OMEGAMON XE for DB2 PE Accounting identifiers • PRIMAUTH • CONNECT • CONNTYPE • CORRNAME • CORRNMBR • ENDUSER • TRANSACT • WSNAME • MAINPACK • ORIGAUTH • PACKAGE • PLANNAME • REQLOC • THREADTYPE

OMEGAMON Accounting report
• Grouping data using DB2 PE identifiers
Define the GROUP command
• GROUP command • //SYSIN DD * • GROUP (PRIMAUTH (PRIMGRP(*) )) • GROUP (CONNECT (CONNGRP(*) )) • GROUP (CONNTYPE (CONTGRP(*) )) • GROUP (CORRNAME (CORNGRP(*) )) • GROUP (CORRNMBR (CORNBR(*) )) • GROUP (ENDUSER (USERGRP(Name1, name2,name3. )) • GROUP (TRANSACT (TRANGRP(*) )) • GROUP (WSNAME (WSNMGRP(*) )) • GROUP (MAINPACK (MAINGRP(*) )) • GROUP (ORIGAUTH (ORIGGRP(*) )) • GROUP (PACKAGE (PACKGRP(*) )) • GROUP (PLANNAME (PLANGRP(*) )) • GROUP (REQLOC (REQLGRP(*) )) • GROUP (THREADTYPE (TTYPGRP(*) ))
Use the GROUP command to collect several OMEGAMON XE for DB2 PE identifier values under one name. When you request a report and specify this name by using the INCLUDE or EXCLUDE subcommand option, the events for all individual items are consolidated into one.
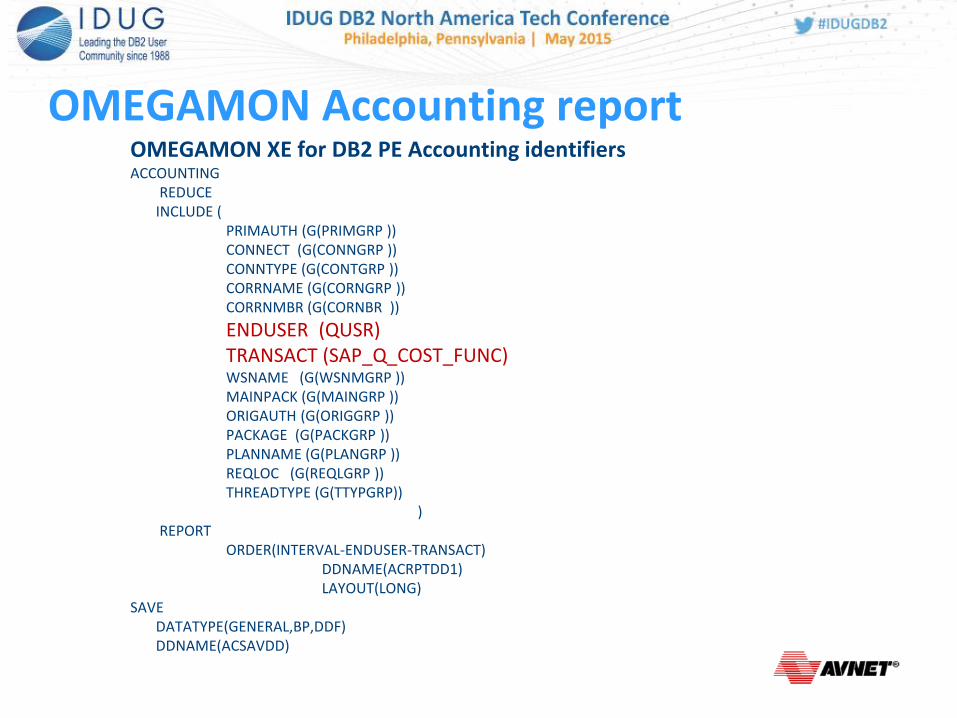
OMEGAMON Accounting report OMEGAMON XE for DB2 PE Accounting identifiers ACCOUNTING REDUCE INCLUDE ( PRIMAUTH (G(PRIMGRP )) CONNECT (G(CONNGRP )) CONNTYPE (G(CONTGRP )) CORRNAME (G(CORNGRP )) CORRNMBR (G(CORNBR ))
ENDUSER (QUSR) TRANSACT (SAP_Q_COST_FUNC) WSNAME (G(WSNMGRP )) MAINPACK (G(MAINGRP )) ORIGAUTH (G(ORIGGRP )) PACKAGE (G(PACKGRP )) PLANNAME (G(PLANGRP )) REQLOC (G(REQLGRP )) THREADTYPE (G(TTYPGRP)) ) REPORT ORDER(INTERVAL-ENDUSER-TRANSACT) DDNAME(ACRPTDD1) LAYOUT(LONG) SAVE DATATYPE(GENERAL,BP,DDF) DDNAME(ACSAVDD)

Save file DB2PM_REL LOCAL_LOCATION SUBSYSTEM_ID REQ_LOCATION CONNECT_TYPE CONNECT_ID CLIENT_ENDUSER TRANSACT ---------+------------+---------+---------+---------+---------+--------+--------+-----------+---------+---------+---------+---------+----------+------------- 510 DB2DDF DB21 REQLGRP CONTGRP CONNGRP QUSR SAP_Q_COST….. 510 DB2DDF DB21 REQLGRP CONTGRP CONNGRP QUSR SAP_Q_COST….. . . . . .
• ACCOUNTING REDUCE
INCLUDE ( CONNTYPE (G(CONTGRP ))
CONNECT (G(CONNGRP ))
REQLOC (G(REQLGRP )) ENDUSER (QUSR) TRANSACT (SAP_Q_COST_FUNC) )
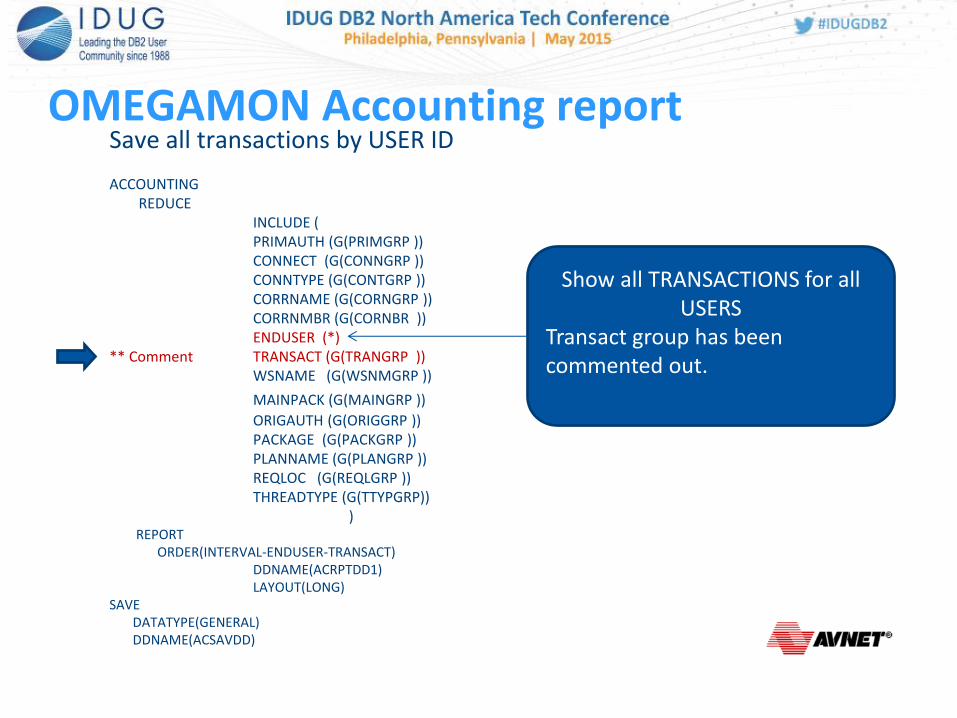
OMEGAMON Accounting report Save all transactions by USER ID ACCOUNTING REDUCE INCLUDE ( PRIMAUTH (G(PRIMGRP )) CONNECT (G(CONNGRP )) CONNTYPE (G(CONTGRP )) CORRNAME (G(CORNGRP )) CORRNMBR (G(CORNBR )) ENDUSER (*) ** Comment TRANSACT (G(TRANGRP )) WSNAME (G(WSNMGRP ))
MAINPACK (G(MAINGRP ))
ORIGAUTH (G(ORIGGRP )) PACKAGE (G(PACKGRP )) PLANNAME (G(PLANGRP )) REQLOC (G(REQLGRP )) THREADTYPE (G(TTYPGRP)) ) REPORT ORDER(INTERVAL-ENDUSER-TRANSACT) DDNAME(ACRPTDD1) LAYOUT(LONG) SAVE DATATYPE(GENERAL) DDNAME(ACSAVDD)
Show all TRANSACTIONS for all USERS
Transact group has been commented out.

Q_Tran Slowness Reported
• Why is the Q_Tran Transaction running so slow?
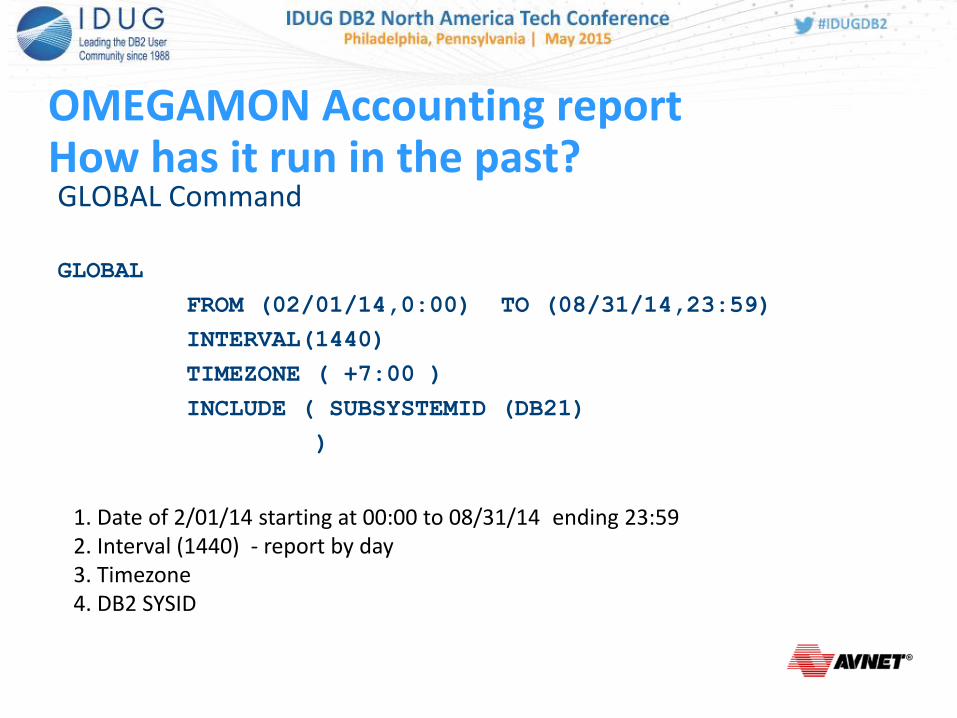
OMEGAMON Accounting report How has it run in the past?
GLOBAL Command
GLOBAL
FROM (02/01/14,0:00) TO (08/31/14,23:59)
INTERVAL(1440)
TIMEZONE ( +7:00 )
INCLUDE ( SUBSYSTEMID (DB21)
)
1. Date of 2/01/14 starting at 00:00 to 08/31/14 ending 23:59 2. Interval (1440) - report by day 3. Timezone 4. DB2 SYSID
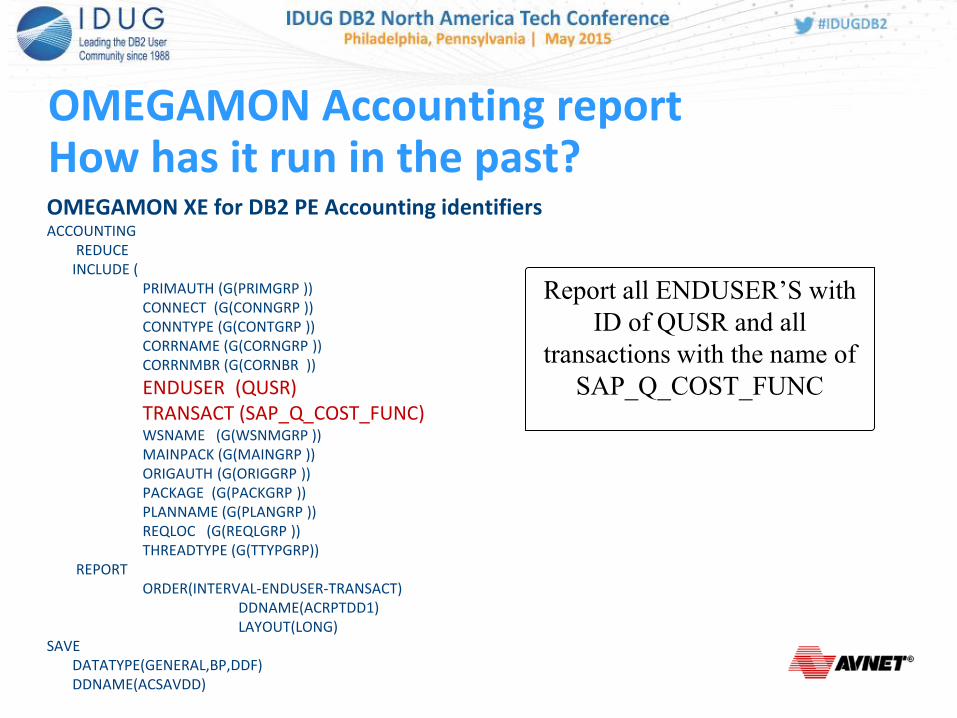
OMEGAMON Accounting report How has it run in the past? OMEGAMON XE for DB2 PE Accounting identifiers ACCOUNTING REDUCE INCLUDE ( PRIMAUTH (G(PRIMGRP )) CONNECT (G(CONNGRP )) CONNTYPE (G(CONTGRP )) CORRNAME (G(CORNGRP )) CORRNMBR (G(CORNBR ))
ENDUSER (QUSR) TRANSACT (SAP_Q_COST_FUNC) WSNAME (G(WSNMGRP )) MAINPACK (G(MAINGRP )) ORIGAUTH (G(ORIGGRP )) PACKAGE (G(PACKGRP )) PLANNAME (G(PLANGRP )) REQLOC (G(REQLGRP )) THREADTYPE (G(TTYPGRP)) REPORT ORDER(INTERVAL-ENDUSER-TRANSACT) DDNAME(ACRPTDD1) LAYOUT(LONG) SAVE DATATYPE(GENERAL,BP,DDF) DDNAME(ACSAVDD)
Report all ENDUSER’S with
ID of QUSR and all
transactions with the name of
SAP_Q_COST_FUNC
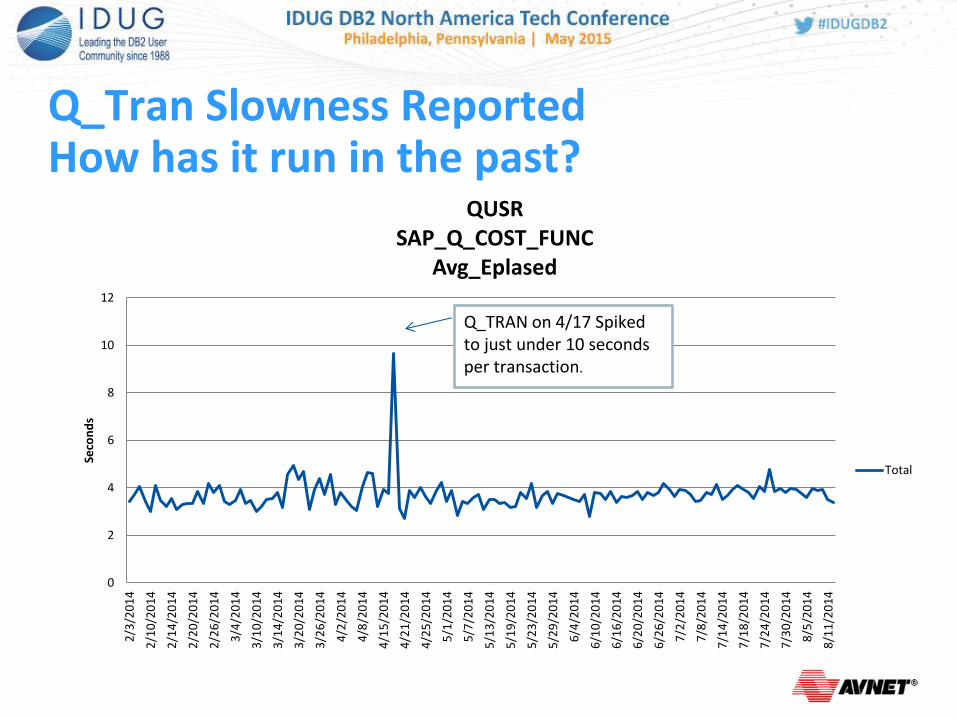
Q_Tran Slowness Reported How has it run in the past?
0
2
4
6
8
10
12
2/3
/20
14
2/1
0/2
01
4
2/1
4/2
01
4
2/2
0/2
01
4
2/2
6/2
01
4
3/4
/20
14
3/1
0/2
01
4
3/1
4/2
01
4
3/2
0/2
01
4
3/2
6/2
01
4
4/2
/20
14
4/8
/20
14
4/1
5/2
01
4
4/2
1/2
01
4
4/2
5/2
01
4
5/1
/20
14
5/7
/20
14
5/1
3/2
01
4
5/1
9/2
01
4
5/2
3/2
01
4
5/2
9/2
01
4
6/4
/20
14
6/1
0/2
01
4
6/1
6/2
01
4
6/2
0/2
01
4
6/2
6/2
01
4
7/2
/20
14
7/8
/20
14
7/1
4/2
01
4
7/1
8/2
01
4
7/2
4/2
01
4
7/3
0/2
01
4
8/5
/20
14
8/1
1/2
01
4
Seco
nd
s
QUSR SAP_Q_COST_FUNC
Avg_Eplased
Total
Q_TRAN on 4/17 Spiked to just under 10 seconds per transaction.

OMEGAMON Accounting report What time was it running slow?
GLOBAL Command
GLOBAL
FROM (04/17/14,0:00) TO (04/17/14,23:59)
INTERVAL(60)
TIMEZONE ( +7:00 )
INCLUDE ( SUBSYSTEMID (DB21)
)
1. Date of 4/17/14 starting at 00:00 to 04/17/14 ending 23:59 2. Interval (60) - report by hour 3. Timezone 4. DB2 SYSID
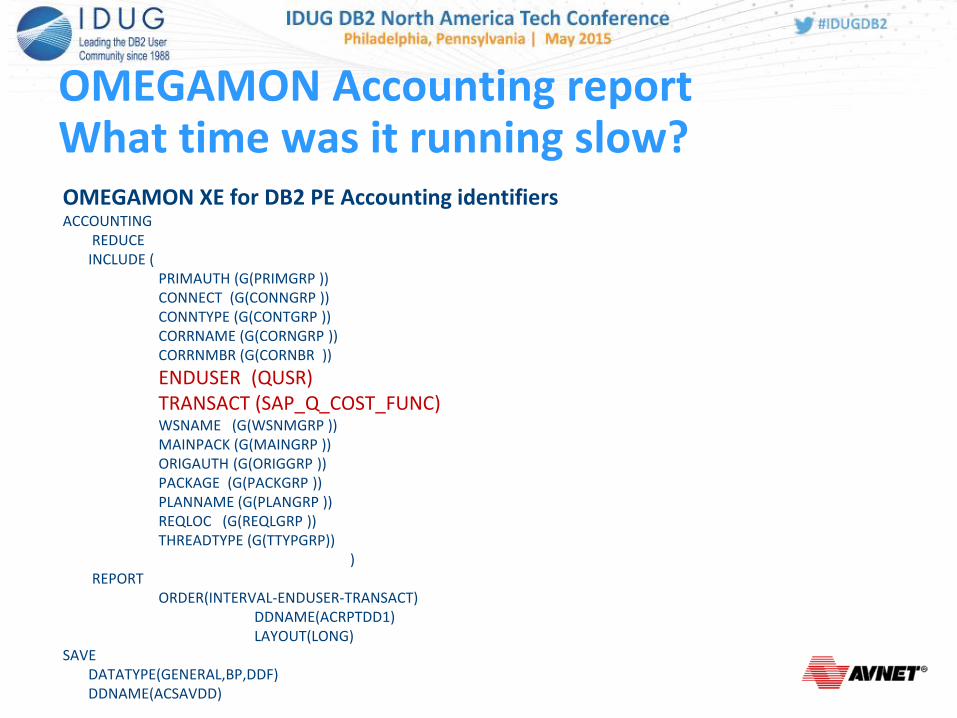
OMEGAMON Accounting report What time was it running slow? OMEGAMON XE for DB2 PE Accounting identifiers ACCOUNTING REDUCE INCLUDE ( PRIMAUTH (G(PRIMGRP )) CONNECT (G(CONNGRP )) CONNTYPE (G(CONTGRP )) CORRNAME (G(CORNGRP )) CORRNMBR (G(CORNBR ))
ENDUSER (QUSR) TRANSACT (SAP_Q_COST_FUNC) WSNAME (G(WSNMGRP )) MAINPACK (G(MAINGRP )) ORIGAUTH (G(ORIGGRP )) PACKAGE (G(PACKGRP )) PLANNAME (G(PLANGRP )) REQLOC (G(REQLGRP )) THREADTYPE (G(TTYPGRP)) ) REPORT ORDER(INTERVAL-ENDUSER-TRANSACT) DDNAME(ACRPTDD1) LAYOUT(LONG) SAVE DATATYPE(GENERAL,BP,DDF) DDNAME(ACSAVDD)
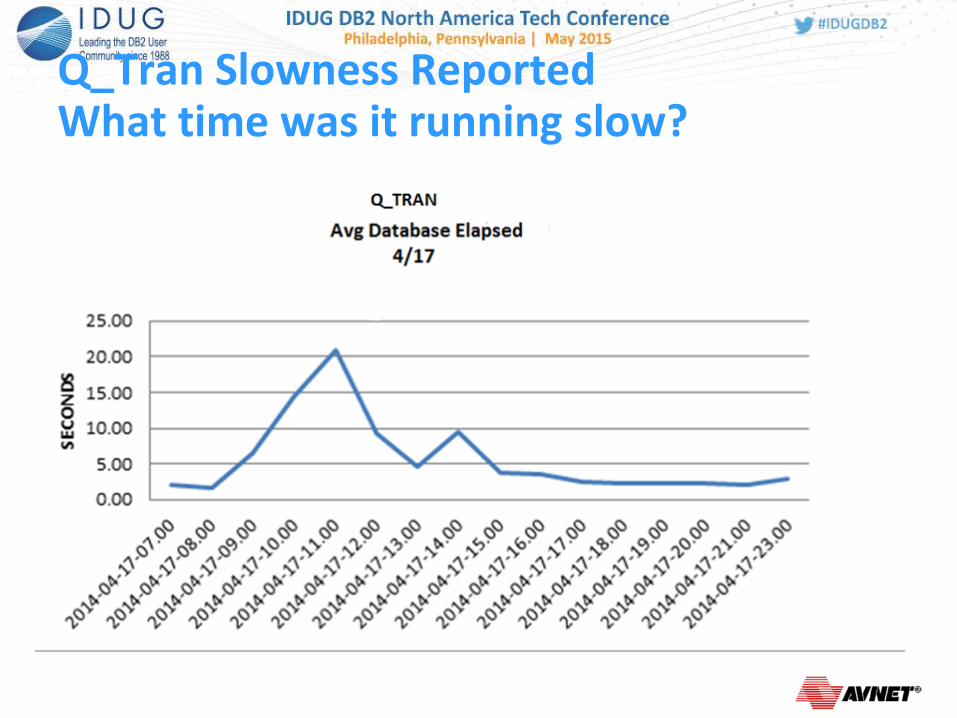
Q_Tran Slowness Reported What time was it running slow?
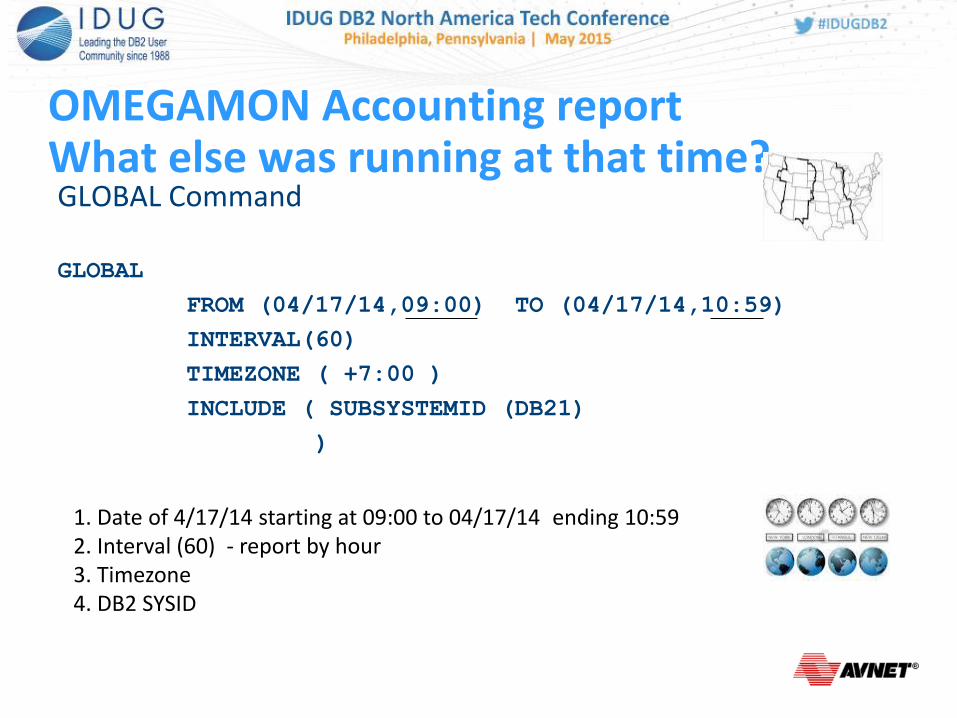
OMEGAMON Accounting report What else was running at that time?
GLOBAL Command
GLOBAL
FROM (04/17/14,09:00) TO (04/17/14,10:59)
INTERVAL(60)
TIMEZONE ( +7:00 )
INCLUDE ( SUBSYSTEMID (DB21)
)
1. Date of 4/17/14 starting at 09:00 to 04/17/14 ending 10:59 2. Interval (60) - report by hour 3. Timezone 4. DB2 SYSID
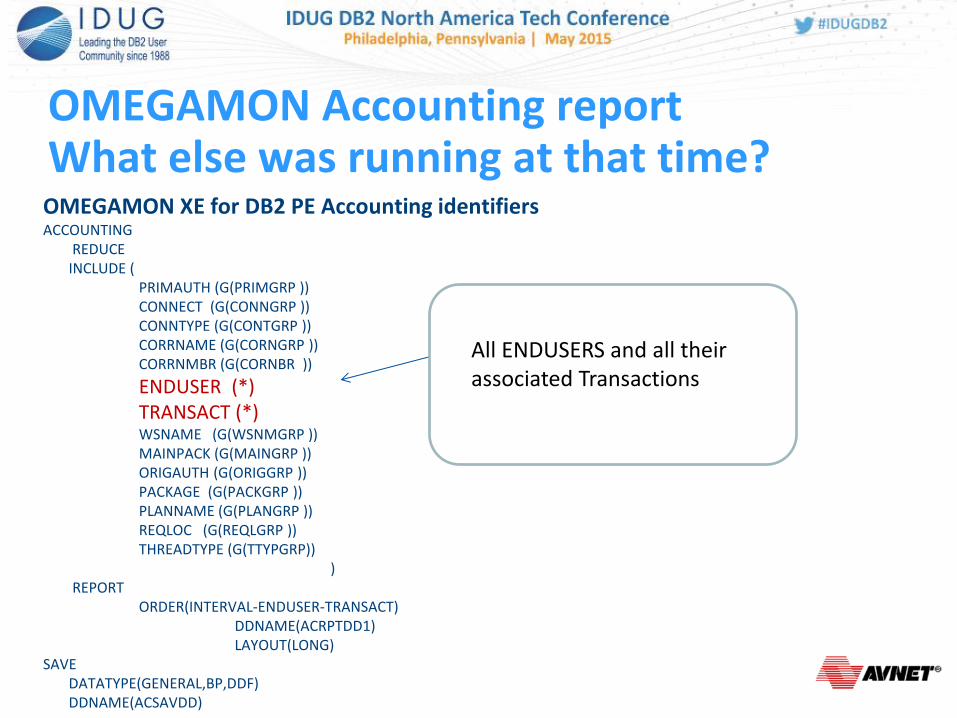
OMEGAMON Accounting report What else was running at that time? OMEGAMON XE for DB2 PE Accounting identifiers ACCOUNTING REDUCE INCLUDE ( PRIMAUTH (G(PRIMGRP )) CONNECT (G(CONNGRP )) CONNTYPE (G(CONTGRP )) CORRNAME (G(CORNGRP )) CORRNMBR (G(CORNBR ))
ENDUSER (*) TRANSACT (*) WSNAME (G(WSNMGRP )) MAINPACK (G(MAINGRP )) ORIGAUTH (G(ORIGGRP )) PACKAGE (G(PACKGRP )) PLANNAME (G(PLANGRP )) REQLOC (G(REQLGRP )) THREADTYPE (G(TTYPGRP)) ) REPORT ORDER(INTERVAL-ENDUSER-TRANSACT) DDNAME(ACRPTDD1) LAYOUT(LONG) SAVE DATATYPE(GENERAL,BP,DDF) DDNAME(ACSAVDD)
All ENDUSERS and all their associated Transactions
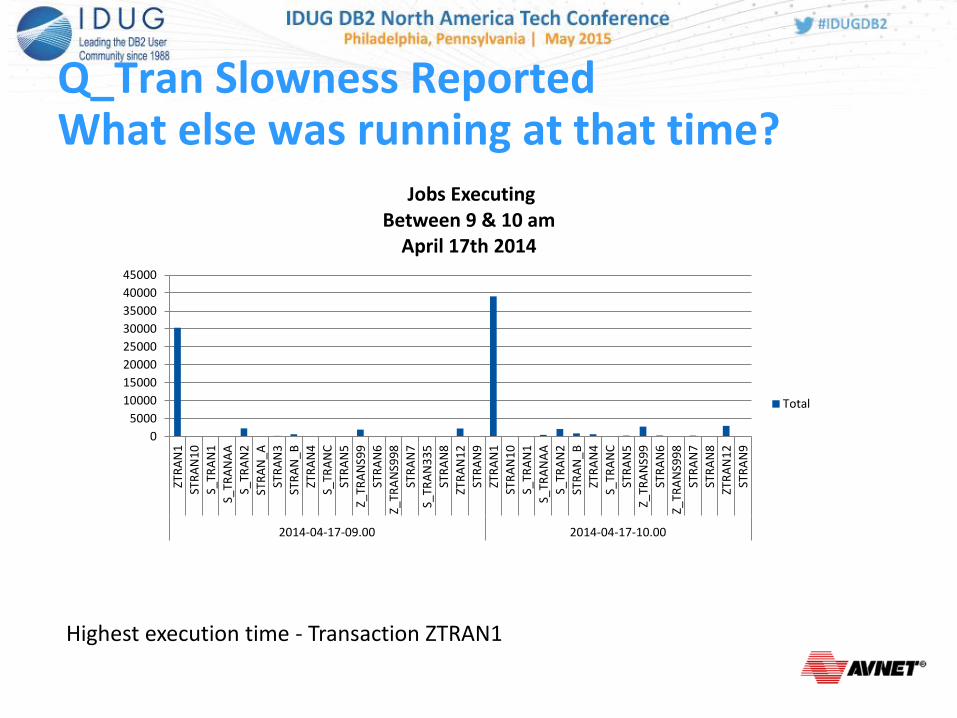
Q_Tran Slowness Reported What else was running at that time?
0
5000
10000
15000
20000
25000
30000
35000
40000
45000
ZTR
AN
1
STR
AN
10
S_TR
AN
1
S_TR
AN
AA
S_TR
AN
2
STR
AN
_A
STR
AN
3
STR
AN
_B
ZTR
AN
4
S_TR
AN
C
STR
AN
5
Z_TR
AN
S99
STR
AN
6
Z_TR
AN
S99
8
STR
AN
7
S_TR
AN
33
5
STR
AN
8
ZTR
AN
12
STR
AN
9
ZTR
AN
1
STR
AN
10
S_TR
AN
1
S_TR
AN
AA
S_TR
AN
2
STR
AN
_B
ZTR
AN
4
S_TR
AN
C
STR
AN
5
Z_TR
AN
S99
STR
AN
6
Z_TR
AN
S99
8
STR
AN
7
STR
AN
8
ZTR
AN
12
STR
AN
9
2014-04-17-09.00 2014-04-17-10.00
Jobs Executing Between 9 & 10 am
April 17th 2014
Total
Highest execution time - Transaction ZTRAN1
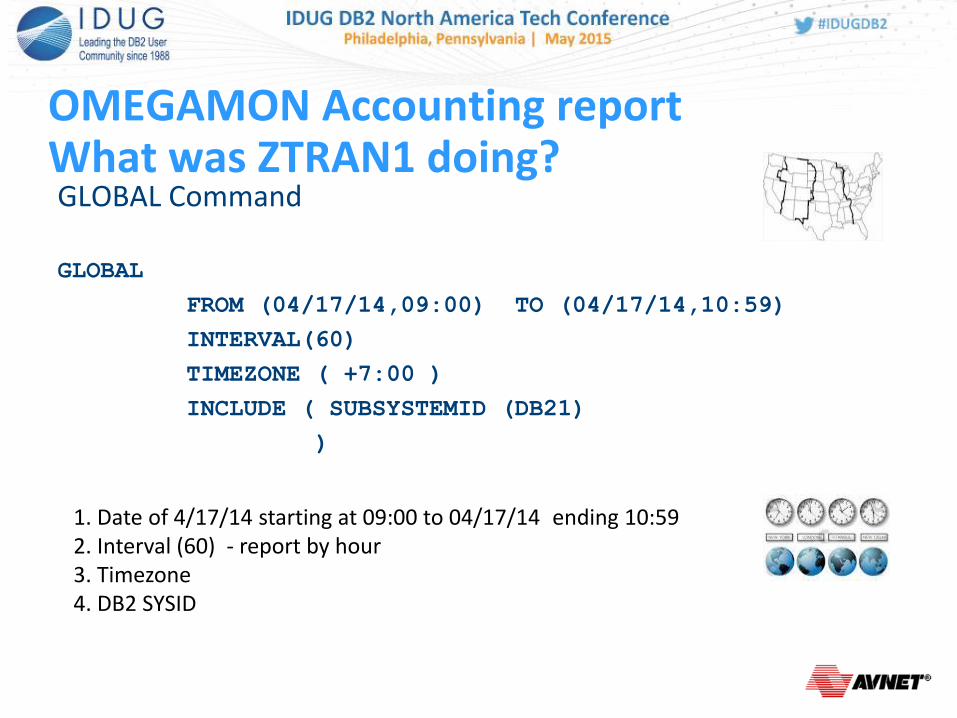
OMEGAMON Accounting report What was ZTRAN1 doing?
GLOBAL Command
GLOBAL
FROM (04/17/14,09:00) TO (04/17/14,10:59)
INTERVAL(60)
TIMEZONE ( +7:00 )
INCLUDE ( SUBSYSTEMID (DB21)
)
1. Date of 4/17/14 starting at 09:00 to 04/17/14 ending 10:59 2. Interval (60) - report by hour 3. Timezone 4. DB2 SYSID
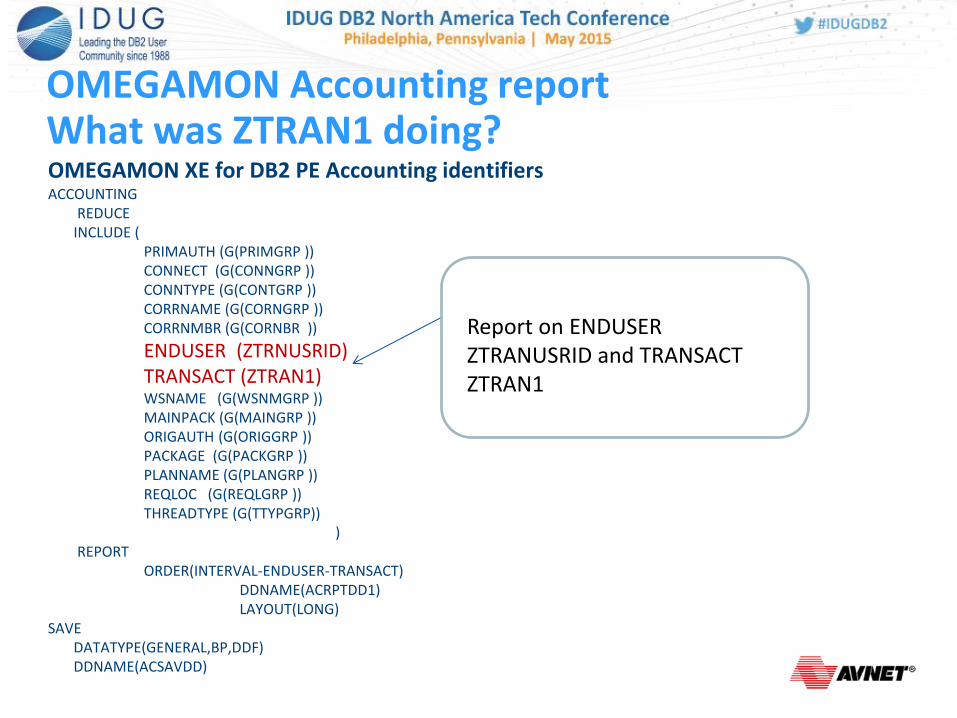
OMEGAMON Accounting report What was ZTRAN1 doing? OMEGAMON XE for DB2 PE Accounting identifiers ACCOUNTING REDUCE INCLUDE ( PRIMAUTH (G(PRIMGRP )) CONNECT (G(CONNGRP )) CONNTYPE (G(CONTGRP )) CORRNAME (G(CORNGRP )) CORRNMBR (G(CORNBR ))
ENDUSER (ZTRNUSRID) TRANSACT (ZTRAN1) WSNAME (G(WSNMGRP )) MAINPACK (G(MAINGRP )) ORIGAUTH (G(ORIGGRP )) PACKAGE (G(PACKGRP )) PLANNAME (G(PLANGRP )) REQLOC (G(REQLGRP )) THREADTYPE (G(TTYPGRP)) ) REPORT ORDER(INTERVAL-ENDUSER-TRANSACT) DDNAME(ACRPTDD1) LAYOUT(LONG) SAVE DATATYPE(GENERAL,BP,DDF) DDNAME(ACSAVDD)
Report on ENDUSER ZTRANUSRID and TRANSACT ZTRAN1

Q_Tran Slowness Reported What was ZTRAN1 doing?
ZTRAN1
LOCK REQUEST 13120264
INSERT - ROWS 2763715
DELETE - ROWS 753868
DB2 LATCH - AVERAGE TIME/ELAPSED TIME 13.220644
UPDATE - ROWS 753565
0
2000000
4000000
6000000
8000000
10000000
12000000
14000000
Nu
mb
er
of
Ro
ws
ZTRAN1 09:00 - 11:00 am CEST
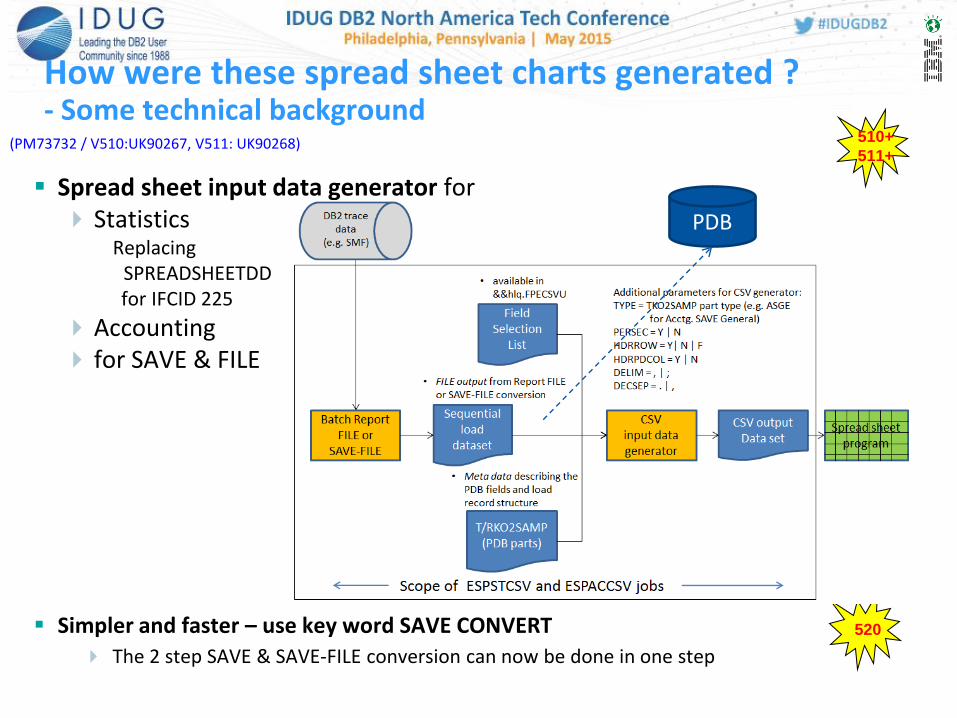
How were these spread sheet charts generated ? - Some technical background
(PM73732 / V510:UK90267, V511: UK90268)
Spread sheet input data generator for Statistics Replacing
SPREADSHEETDD for IFCID 225
Accounting for SAVE & FILE
Simpler and faster – use key word SAVE CONVERT
The 2 step SAVE & SAVE-FILE conversion can now be done in one step
510+
511+
520
PDB
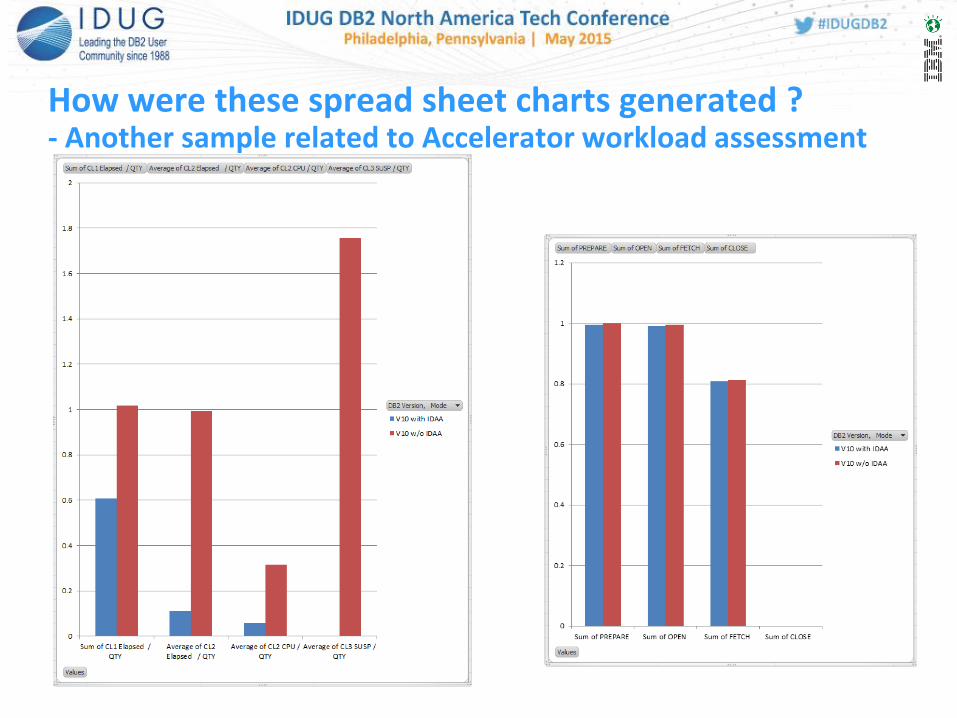
How were these spread sheet charts generated ? - Another sample related to Accelerator workload assessment

How were these spread sheet charts generated ? - …and the workload with and w/o acceleration
Running with SQL acceleration
The above graph shows 1
single transaction execution
over 2 hours with the CL2
elapsed (blue) and CL2
CPU time (red).
At the left it show all 24 txs:
(~2,600 execution / hour)
In the 1st hour 4 out of 24
transactions / SQL were
accelerated. In the 2nd hour
none. Because of few SQL
off-loaded the rest of txs
not off-loaded benefitted
from the free resources and
had almost not wait time.
SQL Performance analysis and Tuning
OMEGAMON – OMPE
Query Monitor
Optim Query Workload Tuner – OQWT
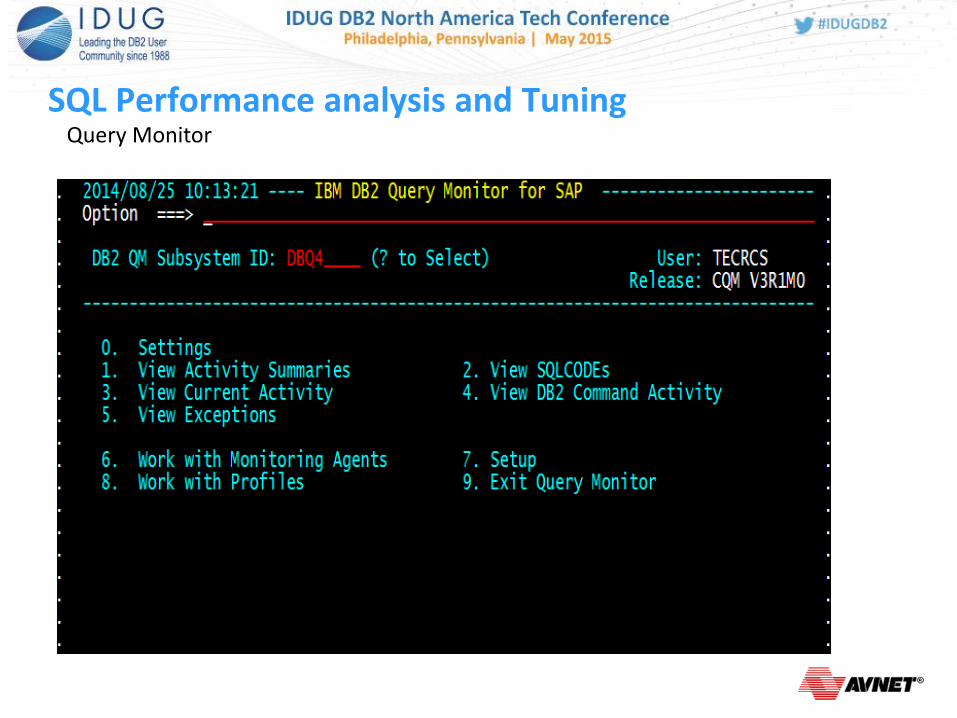
SQL Performance analysis and Tuning
Query Monitor
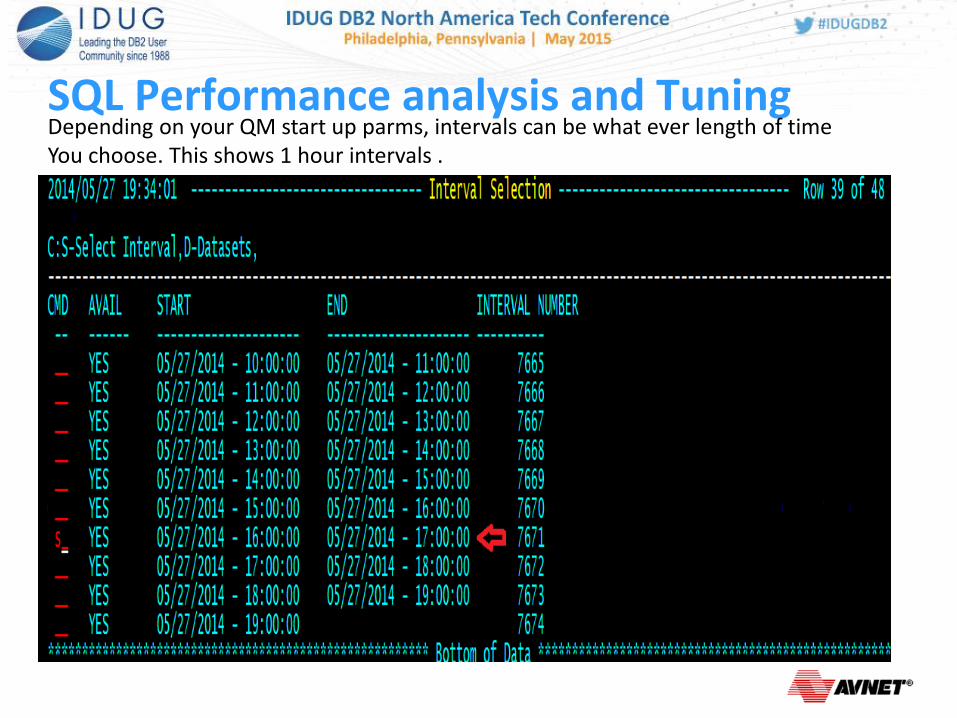
SQL Performance analysis and Tuning
Depending on your QM start up parms, intervals can be what ever length of time You choose. This shows 1 hour intervals .

SQL Performance analysis and Tuning
V
Query Monitor allows you to view the SQL by WSUser and WSTran
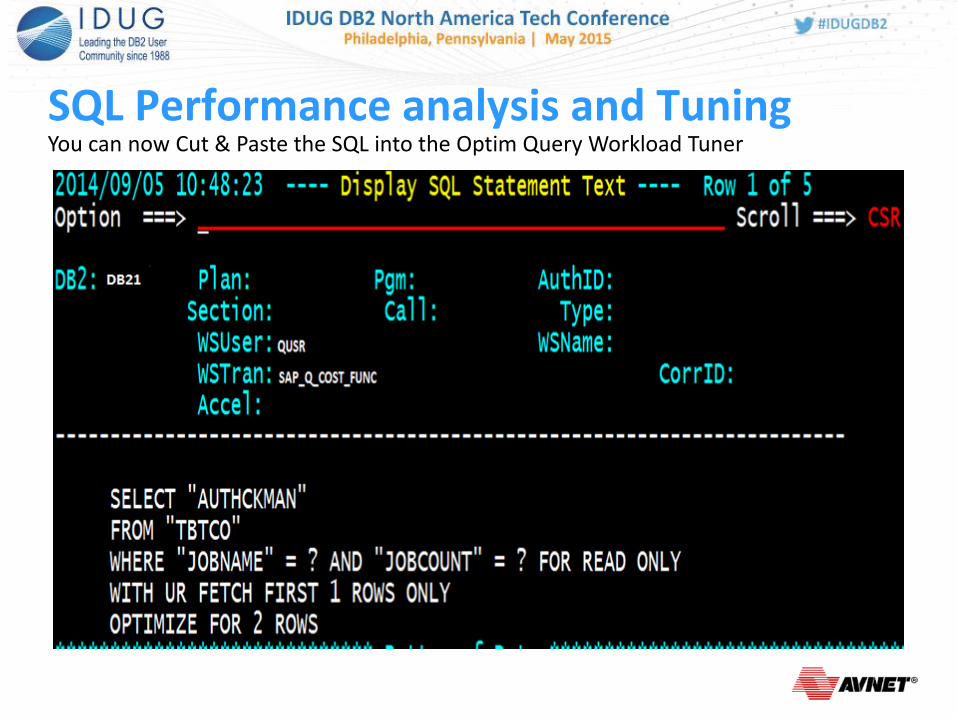
SQL Performance analysis and Tuning You can now Cut & Paste the SQL into the Optim Query Workload Tuner
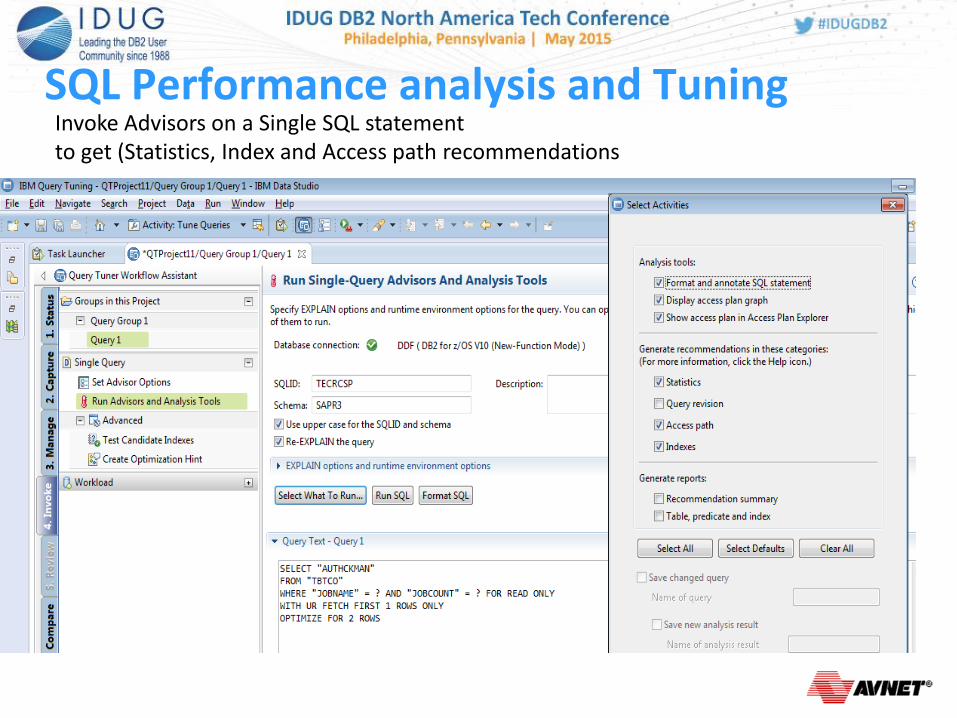
SQL Performance analysis and Tuning
Invoke Advisors on a Single SQL statement to get (Statistics, Index and Access path recommendations
SQL Performance analysis and Tuning
Query Monitor • Query monitor has a Performance Database that allows you to Save
Query Monitor Data.
• METRICS,DB2CMDS,SQLCODES,EXCEPTIONS,
OBJECTS,SQLTEXT,INTERVALS
• Load Current or Previous Query Monitor information into the Query Monitor Performance Database.
• Using Optim Query Workload Tuner you can create (OQWT Workloads) reading the Query Monitor Performance Database.
SQL Performance analysis and Tuning
OMEGAMON – OMPE
Query Monitor
Query Workload Tuner
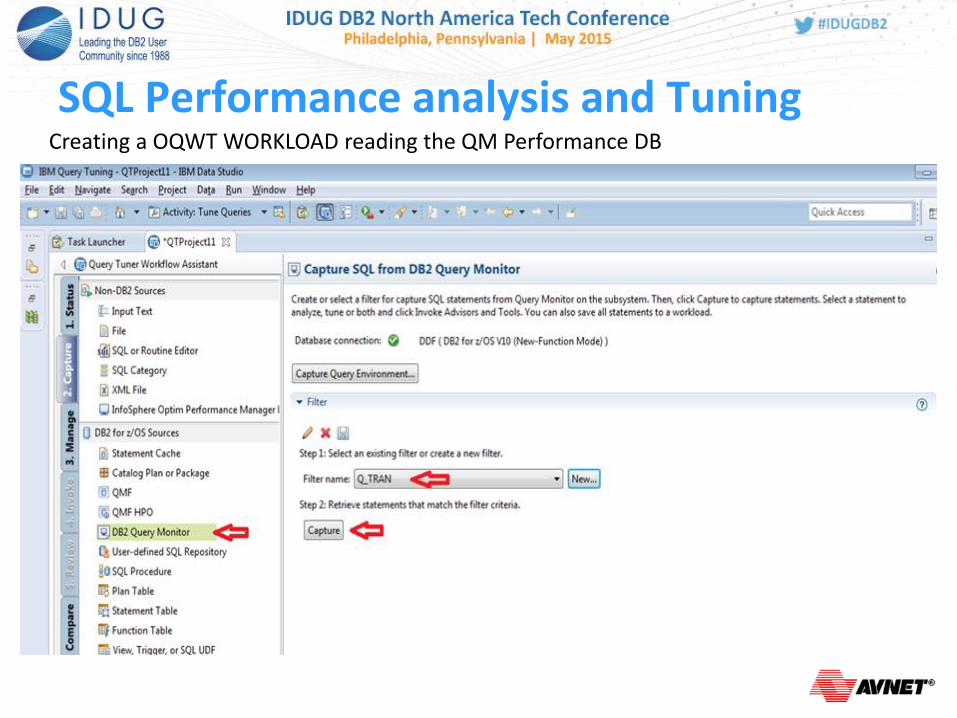
SQL Performance analysis and Tuning
Creating a OQWT WORKLOAD reading the QM Performance DB
SQL Performance analysis and Tuning
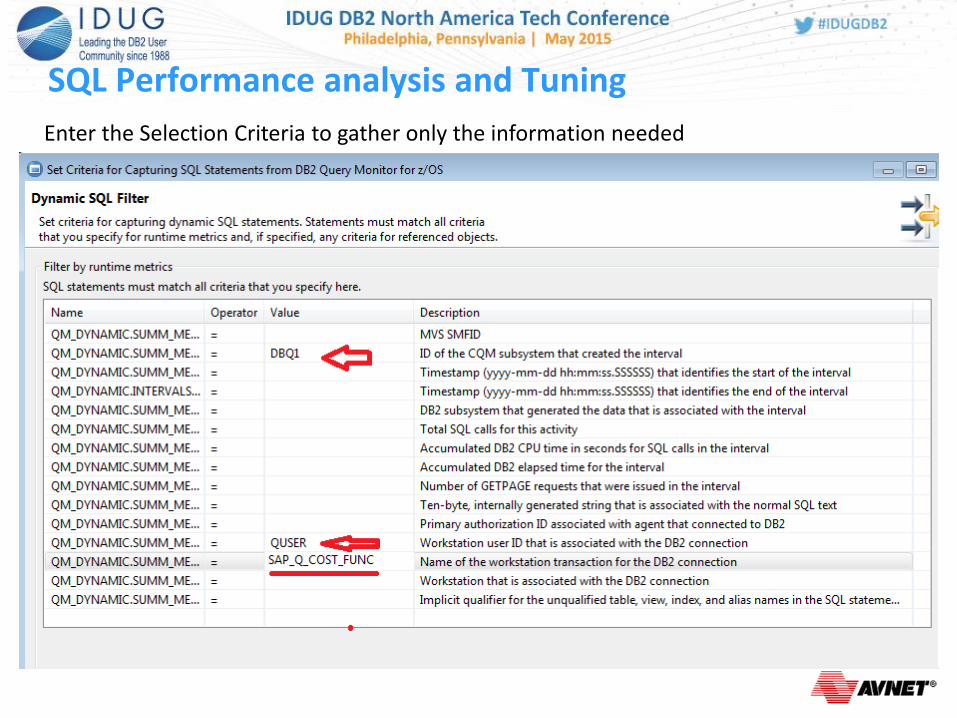
Enter the Selection Criteria to gather only the information needed

SQL Performance analysis and Tuning Invoke the Advisors against a single SQL statement Or save all SQL to a Workload then Invoke Advisors
SQL Performance analysis and Tuning
OMEGAMON – OMPE
Query Monitor
Query Workload Tuner
Looking forward
• InfoSphere Optim Performance Manager
• Extended Insight end-to-end SQL monitoring function for z/OS

Some additional topics on OMPE - The SQL Dashboard showing Dyn. & Static SQL cache content

Some additional topics on OMPE - The SQL Dashboard showing Dyn. & Static SQL cache content Compare unique SQL
execution at various time
periods, e.g. current
against last month

Some additional topics on OMPE - For distributed SQL you may look in addition into the Extended SQL Analysis Dashboard
Response time break down
Refine the workload groups to your application /SQL monitoring needs.
Response time break down per layer allows to isolate the problem area (DB2 for
z/OS, the network, the data server driver, the (WAS) application server, or the
application program itself)
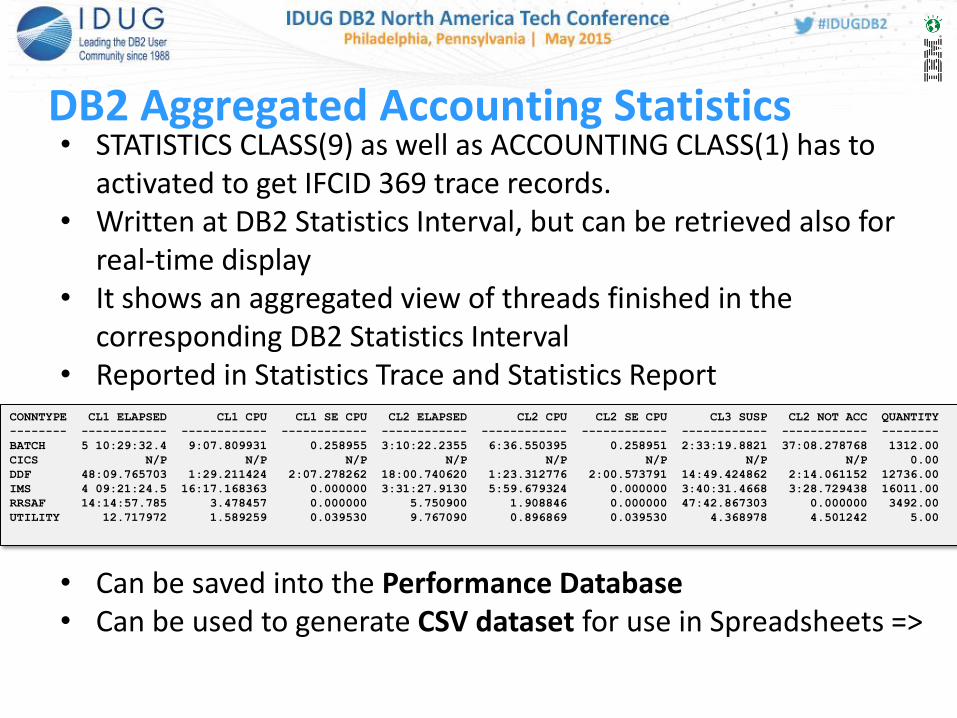
DB2 Aggregated Accounting Statistics • STATISTICS CLASS(9) as well as ACCOUNTING CLASS(1) has to
activated to get IFCID 369 trace records. • Written at DB2 Statistics Interval, but can be retrieved also for
real-time display • It shows an aggregated view of threads finished in the
corresponding DB2 Statistics Interval • Reported in Statistics Trace and Statistics Report
• Can be saved into the Performance Database • Can be used to generate CSV dataset for use in Spreadsheets =>
CONNTYPE CL1 ELAPSED CL1 CPU CL1 SE CPU CL2 ELAPSED CL2 CPU CL2 SE CPU CL3 SUSP CL2 NOT ACC QUANTITY
-------- ------------ ------------ ------------ ------------ ------------ ------------ ------------ ------------ --------
BATCH 5 10:29:32.4 9:07.809931 0.258955 3:10:22.2355 6:36.550395 0.258951 2:33:19.8821 37:08.278768 1312.00
CICS N/P N/P N/P N/P N/P N/P N/P N/P 0.00
DDF 48:09.765703 1:29.211424 2:07.278262 18:00.740620 1:23.312776 2:00.573791 14:49.424862 2:14.061152 12736.00
IMS 4 09:21:24.5 16:17.168363 0.000000 3:31:27.9130 5:59.679324 0.000000 3:40:31.4668 3:28.729438 16011.00
RRSAF 14:14:57.785 3.478457 0.000000 5.750900 1.908846 0.000000 47:42.867303 0.000000 3492.00
UTILITY 12.717972 1.589259 0.039530 9.767090 0.896869 0.039530 4.368978 4.501242 5.00
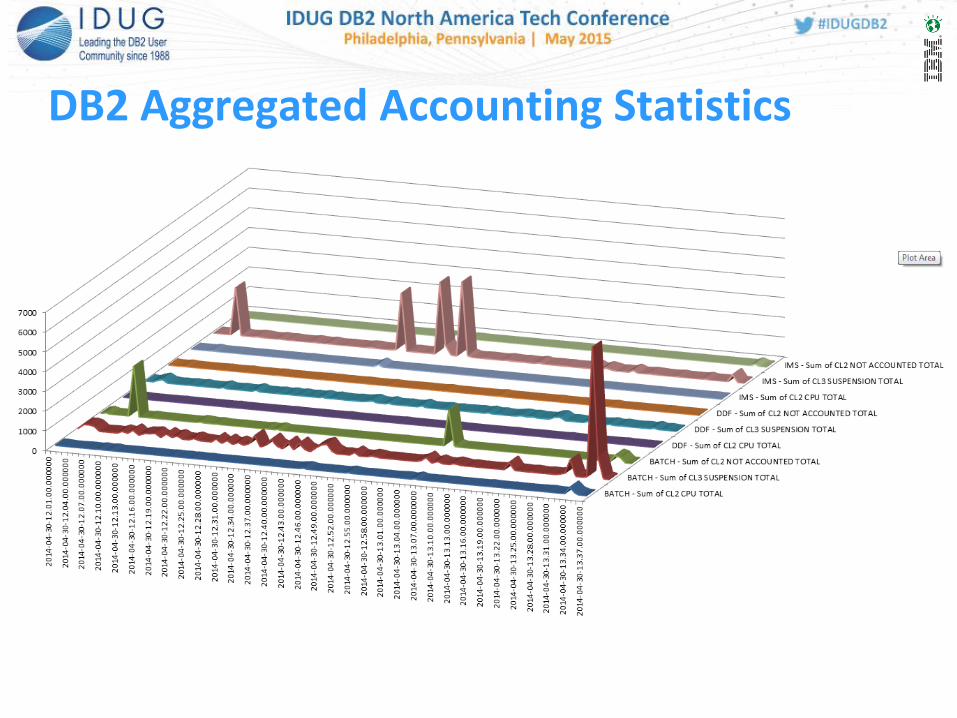
DB2 Aggregated Accounting Statistics

Valuable DB2 traces (Record trace) • Record trace - IFCID 376 - Incompatible Functions Executed
TYPE The change indicator is incompatible. It can have the following values:
1 V9 SYSIBM.CHAR(decimal-expr) function 2 V9 SYSIBM.VARCHAR(decimal-expr) function. CAST (decimal as VARCHAR or CHAR) 3 Unsupported character string representation of a timestamp 1101 Insert into an XML column without XMLDOCUMENT function 1102 XPath evaluation error 1103 RLF governing 1104 Long CLIENT_ACCTNG Special Reg value 1105 Long CLIENT_APPLNAME Special Reg value 1106 Long CLIENT_USERID Special Reg value 1107 Long CLIENT_WRKSTNNAME Special Reg value 1108 Long client Special Reg value for RLF 1109 CAST(string AS TIMESTAMP) 1110 SPACE integer argument greater than 32764 1111 VARCHAR int argument greater than 32764

Summary and Conclusion • Tools are helping to easily and quickly analyze situations.
Integrating and covering the whole spectrum of real-time, past analysis with advisors and tuning recommendations
• Analysis of trends and past activties is important to quickly find explanations of spikes in worse response times and high workload, Using spread sheets and analysis tools, e.g. using graphical visualization.
• Quick access to large data volumes for analysis - think about performance databases and repositories.
• Finally, Thank you Bob for sharing his experience and usage scenarios

Questions ?
Taming DB2 for z/OS Application Performance: Analysis and Trending Techniques ”
Speaker:
Robert Cummings, Avnet Inc.
Norbert Jenninger, IBM (email: [email protected])
Thank You Your feedback is important!