ta~lwalerra'f~ gcur.vea alyses - nalcor energy · nalcor reference no....
TRANSCRIPT

SNC~ LAVAllN
Prepared by:
Checked by:
Approved by:
Approved by:
nalcor en e rgy
TA~lWAlERRA'f~ GCUR.VEA AlYSES
SLI Document No. 505573·3001-4HER-0023-00
Nalcor Reference No. MFA-SN-CD-2000-CV-RP-0005-01 Rev. B1
S. Thomas Lavender Sr. Hydraulics Engineer
Date: 07-Jun-2012
JM/ier Patarroyo Jr. Hydraulics Engineer

+)) TAIL WATER RATING CURVE ANALYSES Revision
Nalcor Doc. No. MFA-SN-CD-2000-CV-RP-0005-01 81 Date Page SNC • LA VALIN SLI Doc. No. 505573-3001-4HER-0023 00 07-Jun-2012 i
REVISION LIST
Revision Remarks No By Chec Appr. Appr. Date
00 sw DO GS NB 07-Jun-2012 Issued for cl ient acceptance.
PB JP DO MT GS 18-May-2012 Issued for client review and comments.
PA JP DO MT GS 02-May-2012 Issued for internal review and comments.
SNC-Lavalin Inc.

TAIL WATER RATING CURVE ANALYSES Revision Nalcor Doc. No. MFA-SN-CD-2000-CV-RP-0005-01 B1 Date Page
SLI Doc. No. 505573-3001-4HER-0023 00 07-Jun-2012 ii
SNC-Lavalin Inc.
TABLE OF CONTENTS
PAGE
1 INTRODUCTION ................................................................................................................ 1 1.1 General ...................................................................................................................... 1 1.2 Objectives of the Technical Report ............................................................................ 4
2 EXISTING REFERENCES ADDRESSING TAIL WATER AT MUSKRAT FALLS .............. 5
3 HYDROMETEOROLOGICAL DATA .................................................................................. 7 3.1 Hydrometric Station Records ..................................................................................... 7 3.2 Meteorological Station Records ................................................................................13
4 RIVER MORPHOLOGY CHANGES AT MUSKRAT FALLS ..............................................14
5 OPEN WATER RATING CURVES ....................................................................................16
6 FREEZE-UP RATING CURVES ........................................................................................20
7 WINTER RATING CURVES ..............................................................................................30
8 CONCLUSIONS ................................................................................................................35
9 RECOMMENDATIONS ......................................................................................................36

TAIL WATER RATING CURVE ANALYSES Revision Nalcor Doc. No. MFA-SN-CD-2000-CV-RP-0005-01 B1 Date Page
SLI Doc. No. 505573-3001-4HER-0023 00 07-Jun-2012 iii
SNC-Lavalin Inc.
List of Figures
Figure 1-1: WSC Station 03OE007 Rating Curve Ranges (At the Foot of Lower Muskrat Falls) 2Figure 1-2: WSC Station 03OE014 Rating Curve Ranges (6.15 km Downstream of Muskrat
Falls) ..................................................................................................................... 3Figure 1-3: At the Foot of Lower Muskrat Falls - Rating Curve Ranges ..................................... 3Figure 3-1: Locations of Stations 03OE001, 03OE007 and 03OE014 ....................................... 8Figure 3-2: Water Levels Station 03OE007 at the Foot of Lower Muskrat Falls ......................... 9Figure 3-3: Water Levels Station 03OE014 - 6.15 km Downstream of Muskrat Falls ................10Figure 3-4: Correlation between Water Level, Discharge and Temperature at Station 03OE014
.............................................................................................................................11Figure 3-5: Total Flows at Muskrat Falls Station 03OE001 1978-2009 .....................................12Figure 3-6: Mean Daily Air Temperature at Station 8501900 Goose Bay 1978-2009 ................13Figure 4-1: Water Level Evolution at Stations 03OE007 at the Foot of Lower Muskrat Falls ....14Figure 5-1: WSC Station 03OE007 Open Water Rating Curve .................................................17Figure 5-2: WSC Station 03OE014 Open Water Rating Curve .................................................18Figure 5-3: At the Foot of Lower Muskrat Falls Open Water Rating Curve ...............................19Figure 6-1: Mud Lake Crossing Looking U/S – Left: 1 Day before Freeze-up –Right: 1 Day after
Freeze-up .............................................................................................................21Figure 6-2: Process of Juxtaposition – 1a ................................................................................21Figure 6-3: Process of Juxtaposition – 1b ................................................................................22Figure 6-4: Process of Juxtaposition – 1c .................................................................................23Figure 6-5: Process of Juxtaposition – 1d ................................................................................23Figure 6-6: Lower Muskrat Falls Flooded (March 14th, 2012) ...................................................25Figure 6-7: The Freeze-up Process ..........................................................................................26Figure 6-8: WSC Station 03OE007 - Freeze-up Rating Curve ..................................................28Figure 6-9: WSC Station 03OE014 - Freeze-up Rating Curve ..................................................28Figure 6-10: At the Foot of Lower Muskrat Falls - Freeze-up Rating Curve ..............................29Figure 7-1: WSC Station 03OE007 – Early Winter Rating Curve ..............................................32Figure 7-2: WSC Station 03OE014 – Early Winter Rating Curve ..............................................33Figure 7-3: WSC Station 03OE014 – Whole Winter Season Rating Curve ...............................33Figure 7-4: At the Foot of Lower Muskrat Falls – Whole Winter Season Rating Curve .............34Figure 9-1: Rating Curves Downstream of Muskrat Falls .........................................................36
TAIL WATER RATING CURVE ANALYSES Revision Nalcor Doc. No. MFA-SN-CD-2000-CV-RP-0005-01 B1 Date Page
SLI Doc. No. 505573-3001-4HER-0023 00 07-Jun-2012 iv
SNC-Lavalin Inc.
List of Tables
Table 3-1: Muskrat Falls Hydrometric Stations .......................................................................... 7Table 3-2: Goose Bay Meteorological Stations .........................................................................13

TAIL WATER RATING CURVE ANALYSES Revision Nalcor Doc. No. MFA-SN-CD-2000-CV-RP-0005-01 B1 Date Page
SLI Doc. No. 505573-3001-4HER-0023 00 07-Jun-2012 v
SNC-Lavalin Inc.
References
No. Description
(1) SNC, Churchill River Complex, Energy Studies, January 1991
(2) SNC–AGRA, Muskrat Falls Hydroelectric Development, Final Feasibility Study Report, January 1999
(3) HATCH, Ice Dynamics of the Lower Churchill River, October 2007
(4) ACRES, Proposed Blackrock Bridge: Estimate of Backwater effects, April 2002
(5) HATCH, MF-1330. Hydraulic Modeling of the River, October 2010
(6) A.I.G.S Robertson; Logarithmic Plotting of Stage-Discharge Observations; Technical Note 3; Water Resources Board; Reading Bridge House, U.K; May 1962.
(7) HATCH, MF-1330. Muskrat Falls Ice Study, March 2011
(8) Kivisild, H.R. (1959), "Hanging Ice Dams" IAHR 8th Congress, Seminar No. 1. Montreal, Quebec
(9) Michel, B. (1971) "Winter Regime of Rivers and Lakes" Corp of Engineers, U.S. Army, Hanover NH, No. AD.724-121

TAIL WATER RATING CURVE ANALYSES Revision Nalcor Doc. No. MFA-SN-CD-2000-CV-RP-0005-01 B1 Date Page
SLI Doc. No. 505573-3001-4HER-0023 00 07-Jun-2012 1
SNC-Lavalin Inc.
1 INTRODUCTION
1.1 GENERAL
SNC-Lavalin Inc. has signed an agreement with Nalcor Energy (the Client) to deliver
engineering, procurement and construction management services for the Lower Churchill
Project (LCP) in Newfoundland and Labrador, Canada.
As part of the LCP, the Muskrat Falls Hydroelectric Development is located on the Churchill
River, about 291 km downstream of the Churchill Falls Hydroelectric Development which
was developed in the early 1970’s. The installed capacity of the project will be 824 MW (4
units of 206 MW each).
It is necessary for the purposes of project design, estimating power and energy yield and
operation planning to have knowledge of the water level in the tail race of a hydroelectric
power development as determined by water flow rates. The purpose of the analyses
described herein is to establish this relationship for the Muskrat Falls Development.
Because of the process by which an ice cover develops on the Lower Churchill River in the
early winter months and the cover’s prevalence thereafter to the end of winter, three
different discharge-level relationships are required; namely open water, freeze-up and ice
covered.
Each of the foregoing three states of flow has a degree of uncertainty as follows:
• Open Water: the active alluvial bed of the river results in seasonal and year to year
variations in channel geometry as a consequence of variations in flood flows and winter
freeze-up conditions;
• Freeze-up: in addition to the alluvial bed uncertainty, variation in the properties of ice at
the time of cover development result in variations in freeze-up levels; and
• Ice Covered: in addition to the two foregoing uncertainties, the hydraulic roughness of
the under surface of the established winter ice cover can vary with variations in the
thermal regime of the river in response to climate and flow variations.
As a consequence of the foregoing uncertainties, each state of flow has a range of possible
levels for a specific discharge. This is illustrated by the overview in Figure 1-1 and Figure

TAIL WATER RATING CURVE ANALYSES Revision Nalcor Doc. No. MFA-SN-CD-2000-CV-RP-0005-01 B1 Date Page
SLI Doc. No. 505573-3001-4HER-0023 00 07-Jun-2012 2
SNC-Lavalin Inc.
1-2 showing the results obtained for each of the two hydrometric stations subject to study
herein. Figure 1-3 presents the three states for the foot of Lower Muskrat Falls using
03OE014 as surrogate station and applying one-dimensional backwater analysis.
Figure 1-1: WSC Station 03OE007 Rating Curve Ranges (At the Foot of Lower Muskrat Falls)
1.0
1.5
2.0
2.5
3.0
3.5
4.0
4.5
5.0
5.5
6.0
6.5
7.0
7.5
500 1,000 1,500 2,000 2,500 3,000 3,500 4,000 4,500 5,000
Gauge Height (m
)
Flow Rate (m3/s)
Open Water
Freeze‐up

TAIL WATER RATING CURVE ANALYSES Revision Nalcor Doc. No. MFA-SN-CD-2000-CV-RP-0005-01 B1 Date Page
SLI Doc. No. 505573-3001-4HER-0023 00 07-Jun-2012 3
SNC-Lavalin Inc.
Figure 1-2: WSC Station 03OE014 Rating Curve Ranges (6.15 km Downstream of Muskrat Falls)
Figure 1-3: At the Foot of Lower Muskrat Falls - Rating Curve Ranges
1.0
1.5
2.0
2.5
3.0
3.5
4.0
4.5
5.0
5.5
6.0
6.5
7.0
7.5
500 1,000 1,500 2,000 2,500 3,000 3,500 4,000 4,500 5,000
Gauge Height (m
)
Flow Rate (m3/s)
Open Water
Freeze‐up
1.0
1.5
2.0
2.5
3.0
3.5
4.0
4.5
5.0
5.5
6.0
6.5
7.0
7.5
500 1,000 1,500 2,000 2,500 3,000 3,500 4,000 4,500 5,000
Gau
ge Height (m
)
Flow Rate (m3/s)
Open Water
Freeze‐up

TAIL WATER RATING CURVE ANALYSES Revision Nalcor Doc. No. MFA-SN-CD-2000-CV-RP-0005-01 B1 Date Page
SLI Doc. No. 505573-3001-4HER-0023 00 07-Jun-2012 4
SNC-Lavalin Inc.
1.2 OBJECTIVES OF THE TECHNICAL REPORT
The main objectives of the present report are:
• Establish a rating curve at the foot of Lower Muskrat Falls in open water conditions;
• Obtain a rating curve range during the freeze-up period for design purposes; and
• Establish a rating curve during winter conditions for long-term operations.

TAIL WATER RATING CURVE ANALYSES Revision Nalcor Doc. No. MFA-SN-CD-2000-CV-RP-0005-01 B1 Date Page
SLI Doc. No. 505573-3001-4HER-0023 00 07-Jun-2012 5
SNC-Lavalin Inc.
2 EXISTING REFERENCES ADDRESSING TAIL WATER AT MUSKRAT FALLS
Various studies have addressed directly or implicitly the increase in water level due to ice
presence in winter conditions after commissioning of Muskrat Falls. Hereafter are listed four
sources where this condition is mentioned.
− SNC, Churchill River Complex, Energy Studies, January 1991
In this report, it is stated in Appendix C that “modifications of the Churchill river bed due to
the huge ice jams which form every winter since commissioning of Churchill Falls (these
jams deepen the river immediately downstream and create sediment deposits further away)”
and “In winter, after commissioning of Muskrat Falls power plant, huge ice jams will not form
anymore, but friction on the ice cover on the 48 kilometres reach will increase tail water
levels by one to two meters.”
− SNC–AGRA, Muskrat Falls Hydroelectric Development, Final Feasibility Study Report, January 1999
Although this study does not refer directly to the increase in water level due to the ice
formation downstream of Muskrat Falls, the rating curve during winter time is illustrated with
a dotted line, showing an increase in water level due to an ice cover.
− HATCH, Ice Dynamics of the Lower Churchill River, October 2007
This study report mentions that the ice progression from Goose Bay to Muskrat Falls will
continue after the project construction with some delay. “The dam at Muskrat Falls will cut
off the supply of ice to the downstream reach and hence it will take longer for the cover to
progress from Goose Bay towards Muskrat Falls. Results indicate that the progression from
Goose Bay to Blackrock Bridge could take between one and four weeks longer in the post-
project case, and the progression from Goose Bay to the base of Muskrat Falls could take
between one and five months longer in the post-project case, depending on the climate and
flow conditions of the winter. Also due to the lack of frazil ice supplied to the reach once the
dam is in place, there will be no hanging dam at the base of the falls. It is expected that
there will be little difference in the thickness of ice in the reach downstream of the falls.”

TAIL WATER RATING CURVE ANALYSES Revision Nalcor Doc. No. MFA-SN-CD-2000-CV-RP-0005-01 B1 Date Page
SLI Doc. No. 505573-3001-4HER-0023 00 07-Jun-2012 6
SNC-Lavalin Inc.
− SNC-LAVALIN, JANUARY 2012
With a letter sent on February 10th 2012, SNC-Lavalin informed Nalcor about the increase in
water level in winter conditions due to processes associated with the ice formation
downstream of Muskrat Falls.
As a result of the letter, Nalcor requested SNC-Lavalin to provide further clarification to
better understand the ice conditions after the implementation of the Muskrat Falls Project,
and define the water level that would be expected during winter conditions.

TAIL WATER RATING CURVE ANALYSES Revision Nalcor Doc. No. MFA-SN-CD-2000-CV-RP-0005-01 B1 Date Page
SLI Doc. No. 505573-3001-4HER-0023 00 07-Jun-2012 7
SNC-Lavalin Inc.
3 HYDROMETEOROLOGICAL DATA
3.1 HYDROMETRIC STATION RECORDS
Water level data are available from two Water Survey of Canada (WSC) hydrometric
stations near the dam site. Flow data is available from one WSC hydrometric station
immediately upstream of Upper Muskrat Falls. Details of the hydrometric stations are
presented in Table 3-1 and their location is shown on Figure 3-1. The two hydrometric
stations reporting water level are located downstream of Muskrat Falls (Station 03OE007
and 03OE014).
It is noted that while the levels recorded at Station 03OE014 are referenced to the Geodetic
Datum, those at Station 03OE007 are to a local gauge datum with unknown geodetic
reference.
Table 3-1: Muskrat Falls Hydrometric Stations
Station Name Latitude Longitude Operation Type
03OE001 Churchill River above
Upper Muskrat Falls 53°14’52’’ N 60°47’21’’ W 1953-present Flow
03OE007 Churchill River at foot
of Lower MF 53°14’57’’ N 60°46’08’’ W 1980-1995 Level
03OE014 Churchill River 6.15 km
downstream of MF 53°14’15’’ N 60°40’30’’ W 2008-present Level

TAIL WATER RATING CURVE ANALYSES Revision Nalcor Doc. No. MFA-SN-CD-2000-CV-RP-0005-01 B1 Date Page
SLI Doc. No. 505573-3001-4HER-0023 00 07-Jun-2012 8
SNC-Lavalin Inc.
Figure 3-1: Locations of Stations 03OE001, 03OE007 and 03OE014
Figure 3-2 presents the water level records at station 03OE007 from 1980 to 1995. Three
periods with distinct water conditions are identified. The first period is from May to October
where there is no presence of ice on the Churchill River and the river is considered flowing
in open water conditions. The second period is found between November and December,
where a rapid increase in water level of about 2.5 m is observed and corresponds to the
freeze-up period of the river. The third period from January to April is characterized with a
super elevation in water levels due to the formation of a hanging ice dam downstream of
Muskrat Falls. Station 03OE007 was discontinued after 1995.

TAIL WATER RATING CURVE ANALYSES Revision Nalcor Doc. No. MFA-SN-CD-2000-CV-RP-0005-01 B1 Date Page
SLI Doc. No. 505573-3001-4HER-0023 00 07-Jun-2012 9
SNC-Lavalin Inc.
Figure 3-2: Water Levels Station 03OE007 at the Foot of Lower Muskrat Falls
In 2008, a hydrometric station 03OE014 was installed 6.15 km downstream of Muskrat Falls.
While not as close to the foot of the falls, it is nevertheless situated strategically at the outlet
of the Muskrat falls tail water pool stretching about four kilometres downstream of Muskrat
Falls. Figure 3-3 shows the water levels reported from Station 03OE014 from 2008 to 2011.
Three periods can be observed; the first period corresponds to open water conditions, from
May to October. The second period observed is the freeze-up in late November and early
December and the third period comprises the December to April winter season.
0
2
4
6
8
10
12
14
16
18
Jan-01 Feb-01 Mar-01 Apr-01 May-01 Jun-01 Jul-01 Aug-01 Sep-01 Oct-01 Nov-01 Dec-01 Jan-01
Leve
l (m
)
1980 1981
1982 1983
1984 1985
1986 1987
1988 1989
1990 1991
1992 1993
1994 1995
Freeze-up
Open Water
Ice Jam
Local Datum

TAIL WATER RATING CURVE ANALYSES Revision Nalcor Doc. No. MFA-SN-CD-2000-CV-RP-0005-01 B1 Date Page
SLI Doc. No. 505573-3001-4HER-0023 00 07-Jun-2012 10
SNC-Lavalin Inc.
Figure 3-3: Water Levels Station 03OE014 - 6.15 km Downstream of Muskrat Falls
Figure 3-4 presents the correlation between the water level, discharge and temperature
observed at Station 03OE014. It is clear from the upper chart that there is a correlation
between the water level and the discharge in open water conditions and during the winter
season the water level increases. It can be also seen that there is correlation between
water level and discharge in winter, with the exception of some periods that can be
attributed to local ice jams or clogging.
0
1
2
3
4
5
6
7
8
01-Jan 01-Feb 01-Mar 01-Apr 01-May 01-Jun 01-Jul 01-Aug 01-Sep 01-Oct 01-Nov 01-Dec
Leve
l (m
)
2008
2009
2010
2011
Geodetic Datum
Open Water
Freeze-up
Ice Covered
Local Ice Jams

TAIL WATER RATING CURVE ANALYSES Revision Nalcor Doc. No. MFA-SN-CD-2000-CV-RP-0005-01 B1 Date Page
SLI Doc. No. 505573-3001-4HER-0023 00 07-Jun-2012 11
SNC-Lavalin Inc.
Figure 3-4: Correlation between Water Level, Discharge and Temperature at Station 03OE014
-1100
-100
900
1900
2900
3900
4900
5900
0
1
2
3
4
5
6
7
01-S
ep-0
8
31-O
ct-0
8
30-D
ec-0
8
28-F
eb-0
9
29-A
pr-0
9
28-J
un-0
9
27-A
ug-0
9
26-O
ct-0
9
25-D
ec-0
9
23-F
eb-1
0
24-A
pr-1
0
23-J
un-1
0
22-A
ug-1
0
21-O
ct-1
0
20-D
ec-1
0
18-F
eb-1
1
19-A
pr-1
1
18-J
un-1
1
17-A
ug-1
1
16-O
ct-1
1
15-D
ec-1
1
13-F
eb-1
2
Dis
char
ge (m
³/s)
Wat
er L
evel
(m)
Gauge Height (m)
Flow Rate (m³/s)
-60
-40
-20
0
20
40
60
80
0
1
2
3
4
5
6
7
01-S
ep-0
8
31-O
ct-0
8
30-D
ec-0
8
28-F
eb-0
9
29-A
pr-0
9
28-J
un-0
9
27-A
ug-0
9
26-O
ct-0
9
25-D
ec-0
9
23-F
eb-1
0
24-A
pr-1
0
23-J
un-1
0
22-A
ug-1
0
21-O
ct-1
0
20-D
ec-1
0
18-F
eb-1
1
19-A
pr-1
1
18-J
un-1
1
17-A
ug-1
1
16-O
ct-1
1
15-D
ec-1
1
13-F
eb-1
2
Tem
pera
ture
(°C)
Wat
er L
evel
(m)
Gauge Height (m)
Temperature (°C)
TAIL WATER RATING CURVE ANALYSES Revision Nalcor Doc. No. MFA-SN-CD-2000-CV-RP-0005-01 B1 Date Page
SLI Doc. No. 505573-3001-4HER-0023 00 07-Jun-2012 12
SNC-Lavalin Inc.
In the absence of concurrent data which would permit a direct correlation of the gauge
heights at the stations 03OE007 and 03OE014, one-dimensional backwater analysis with
HEC-RAS was applied to develop such a relationship at the foot of Lower Muskrat Falls.
This relationship permits the use of WSC Station 03OE014 as a surrogate gauge for the
project tail water levels. It is deemed of critical importance to undertake the field surveys
necessary to validate this relationship.
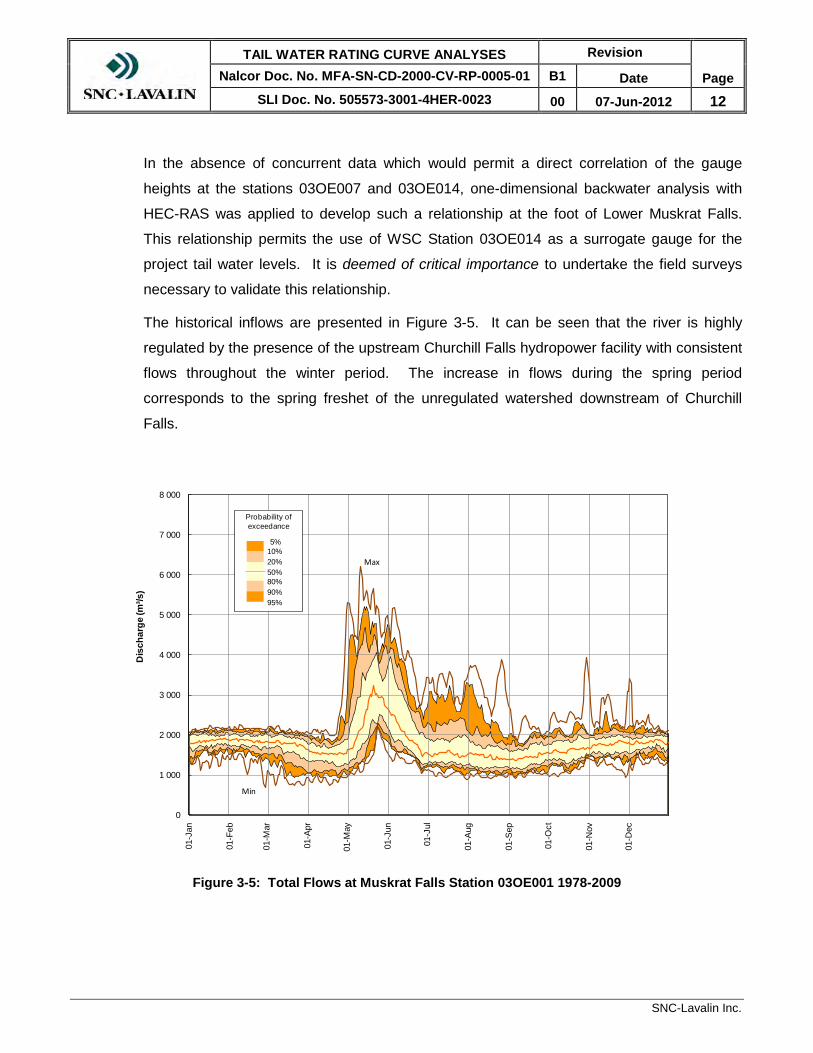
The historical inflows are presented in Figure 3-5. It can be seen that the river is highly
regulated by the presence of the upstream Churchill Falls hydropower facility with consistent
flows throughout the winter period. The increase in flows during the spring period
corresponds to the spring freshet of the unregulated watershed downstream of Churchill
Falls.
Figure 3-5: Total Flows at Muskrat Falls Station 03OE001 1978-2009
0.0
1000.0
2000.0
3000.0
4000.0
5000.0
6000.0
7000.0
8000.0
01-J
an
01-F
eb
01-M
ar
01-A
pr
01-M
ay
01-J
un
01-J
ul
01-A
ug
01-S
ep
01-O
ct
01-N
ov
01-D
ec
0
1 000
2 000
3 000
4 000
5 000
6 000
7 000
8 000
Dis
char
ge (m
³/s)
Max
Min
5%10%20%50%80%
Probability of exceedance
90%95%
TAIL WATER RATING CURVE ANALYSES Revision Nalcor Doc. No. MFA-SN-CD-2000-CV-RP-0005-01 B1 Date Page
SLI Doc. No. 505573-3001-4HER-0023 00 07-Jun-2012 13
SNC-Lavalin Inc.
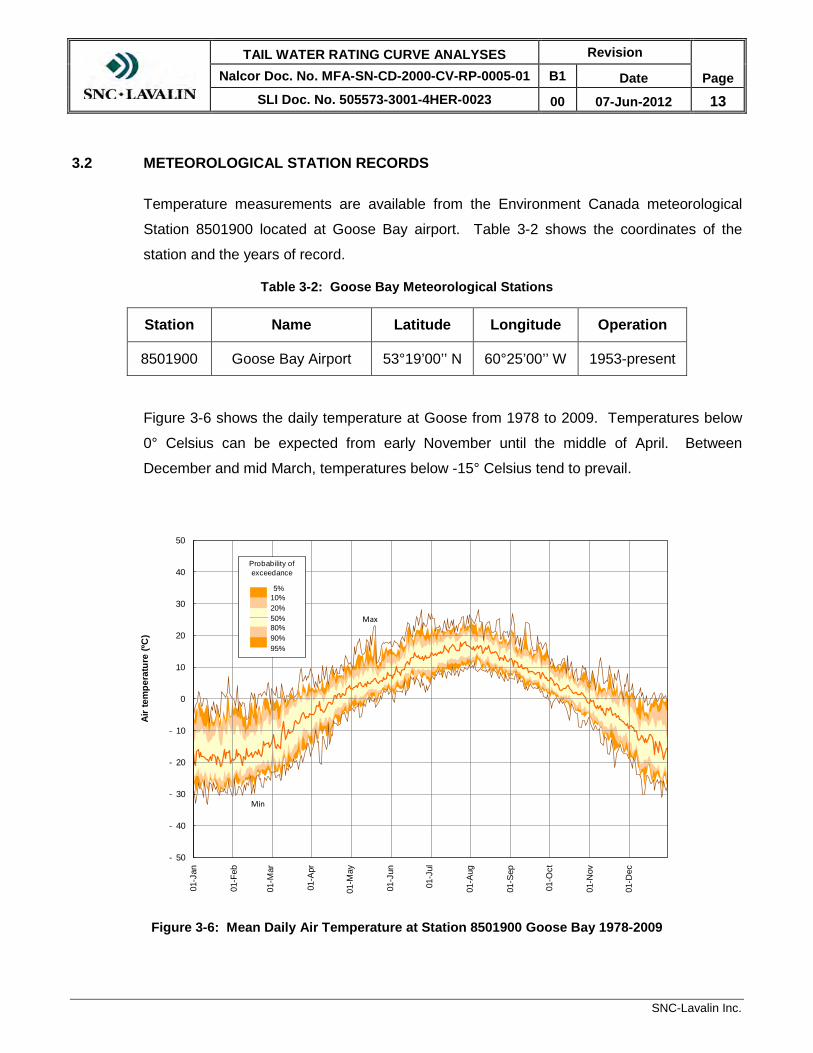
3.2 METEOROLOGICAL STATION RECORDS
Temperature measurements are available from the Environment Canada meteorological
Station 8501900 located at Goose Bay airport. Table 3-2 shows the coordinates of the
station and the years of record.
Table 3-2: Goose Bay Meteorological Stations
Station Name Latitude Longitude Operation
8501900 Goose Bay Airport 53°19’00’’ N 60°25’00’’ W 1953-present
Figure 3-6 shows the daily temperature at Goose from 1978 to 2009. Temperatures below
0° Celsius can be expected from early November until the middle of April. Between
December and mid March, temperatures below -15° Celsius tend to prevail.
Figure 3-6: Mean Daily Air Temperature at Station 8501900 Goose Bay 1978-2009
-50.0
-40.0
-30.0
-20.0
-10.0
0.0
10.0
20.0
30.0
40.0
50.0
01-J
an
01-F
eb
01-M
ar
01-A
pr
01-M
ay
01-J
un
01-J
ul
01-A
ug
01-S
ep
01-O
ct
01-N
ov
01-D
ec
- 50
- 40
- 30
- 20
- 10
0
10
20
30
40
50
Air t
empe
ratu
re (º
C)
Max
Min
5%10%20%50%80%
Probability of exceedance
90%95%

TAIL WATER RATING CURVE ANALYSES Revision Nalcor Doc. No. MFA-SN-CD-2000-CV-RP-0005-01 B1 Date Page
SLI Doc. No. 505573-3001-4HER-0023 00 07-Jun-2012 14
SNC-Lavalin Inc.
4 RIVER MORPHOLOGY CHANGES AT MUSKRAT FALLS
Figure 4-1 presents open water levels reported from station 03OE007 vs. the discharge
reported from Station 03OE001, between July to October 1980 to 1995. It is noted that
there is a trend of the water level constantly increasing over the years of records. This is an
indication of morphological changes in the river bed of the river. There are three factors that
can be the cause of these continuous changes in water level.
Figure 4-1: Water Level Evolution at Stations 03OE007 at the Foot of Lower Muskrat Falls
The first factor, considers that after the commissioning of Churchill Falls hydropower facility
between 1971 and 1974, a disruption in the natural conditions of the Churchill River system
was introduced. It is known that when the balance of sediment load, hydrologic load (in this
case), and/or channel geometry and slope is changed, there is often a response or
adjustment of the fluvial system as it attempts to re-establish the equilibrium condition. In
other words when a stream is in adjustment, it is evolving toward equilibrium or working to
re-establish balance with its watershed inputs. The time required for a stream to adjust to a
given disturbance is difficult to predict owing to the fact that they are influenced by boundary
conditions, climate, and history or persistence of disturbance but can take decades or
centuries. Unfortunately, station 03OE007 stopped recording data in 1995 and it was not
3.0
3.5
4.0
4.5
5.0
600 800 1000 1200 1400 1600 1800 2000 2200 2400
Wat
er Le
vel (
m)
Discharge (m³/s)
1980
1981
1982
1983
1984
1985
1986
1987
1988
1989
1990
1991
1992
1993
1994
1995
1980
1995

TAIL WATER RATING CURVE ANALYSES Revision Nalcor Doc. No. MFA-SN-CD-2000-CV-RP-0005-01 B1 Date Page
SLI Doc. No. 505573-3001-4HER-0023 00 07-Jun-2012 15
SNC-Lavalin Inc.
possible to know whether the observed upward trend continued or decreased at a certain
point.
Another factor of change is the presence of the hanging ice dam that forms every winter
downstream of the falls. This ice dam is produced by the frazil ice coming from the fast
flowing river upstream of Muskrat Falls. The ice deposits over the course of the winter,
reducing the river conveyance and increasing the flow velocity. Whenever the equilibrium of
the deposition velocity of ice exceeds the threshold erosion velocity of the alluvial material,
further erosion of the river channel is occurring, contributing to the dynamic changes of the
river morphology.
The third factor is the construction in 2006 of the Blackrock Bridge 18 km downstream of
Muskrat Falls. This condition has changed the channel geometry and conveyance capacity.
One response of the river seeking equilibrium subsequent to this kind of disruption is
aggradation. Channel aggradation may occur when there is an introduction of a
downstream hydraulic constriction, such as bridges and culverts. In addition, the report
made by Acres in 2002 (Ref 4), states that the Blackrock Bridge will have a backwater effect
at the foot of Lower Muskrat Falls by about 0.23 m for a discharge of 2,500 m³/s. However,
this increase in water level is not possible to be confirmed since the station 03OE007 was
decommissioned in 1995.
In 2008 a hydrometric station 03OE014 was installed 6.15 km downstream of Muskrat Falls.
This station in georeferenced and was used to calibrate the HEC-RAS model prepared by
HATCH in 2007 (Ref 5) with water levels recorded in 2008 to 2011. According to this
calibration, the water levels in the rating curve presented in the SNC-AGRA report (Ref 2)
have raised by about 0.40 m for the period between 1998 and 2011.

TAIL WATER RATING CURVE ANALYSES Revision Nalcor Doc. No. MFA-SN-CD-2000-CV-RP-0005-01 B1 Date Page
SLI Doc. No. 505573-3001-4HER-0023 00 07-Jun-2012 16
SNC-Lavalin Inc.
5 OPEN WATER RATING CURVES
The open water rating curve analyses applied the methodology developed by A.I.G.S.
Robertson (Ref 6). This methodology logarithmically transforms the flow-level data set for a
gauging station, identifies the possibility of multiple hydraulic controls, separates the data
into inter-control segments and then linearizes the logarithmic relationship for each segment
by adjusting the gauge datum constant for each segment.
The resulting equation for each segment takes the traditional form:
Q a GH b
Where Q = flow rate;
GH = Gauge Height;
A = constant representing the cross-sectional area and hydraulic roughness
of the channel;
b = datum constant; and
c = a constant that represents the shape of the controlling channel cross-
section.
Inverting the equation yields:
GHQ
b,
which shows correctly the dependency of water level (GH) on flow rate (Q).
In the current work, only a single (channel friction) control was identified at each subject
station so that only a single datum constant (b) was required for the entire range of flow in
each case. The accepted adjustments were those that were found to maximize the
correlation coefficients for the logarithmic flow-water level relationship.

TAIL WATER RATING CURVE ANALYSES Revision Nalcor Doc. No. MFA-SN-CD-2000-CV-RP-0005-01 B1 Date Page
SLI Doc. No. 505573-3001-4HER-0023 00 07-Jun-2012 17
SNC-Lavalin Inc.
The slope of the relationship (1/c) thus derived was found to be characteristic of a near
parabolic cross-section, which is consistent with the known channel bathymetry, thereby
lending confidence to the result. In order to be able to compare results, the values of Station
03OE007 were adjusted with the georeferenced datum of Station 03OE014 translated to the
tail water of Muskrat Falls through the backwater computations of the calibrated HEC-RAS
model mentioned previously. The results of the analyses for 03OE007 and 03OE014 are
provided in Figure 5-1 and Figure 5-2, respectively, including envelope curves to define the
uncertainty previously noted.
Figure 5-1: WSC Station 03OE007 Open Water Rating Curve
1.0
1.2
1.4
1.6
1.8
2.0
2.2
2.4
2.6
2.8
3.0
3.2
3.4
3.6
3.8
4.0
4.2
4.4
500 1000 1500 2000 2500 3000 3500
Gau
ge H
eigt
h (m
)
Flow Rate (m³/s)
1980-1995 Data
GH=0.082*Q^0.513-0.805
GH=0.066*Q^0.537 -0.805 {+/-0.14}
GH=0.095*Q^0.498-0.805
Datum adjusted by translation of 03OE014 to the location of 03OE007 using HEC-RAS simulations
Note:

TAIL WATER RATING CURVE ANALYSES Revision Nalcor Doc. No. MFA-SN-CD-2000-CV-RP-0005-01 B1 Date Page
SLI Doc. No. 505573-3001-4HER-0023 00 07-Jun-2012 18
SNC-Lavalin Inc.
Figure 5-2: WSC Station 03OE014 Open Water Rating Curve
Knowing that Station 03OE007 was decommissioned in 1995, Station 03OE014 was
retained as more representative of the most recent riverbed conditions. Therefore, the
rating curve at the tail water of the falls was obtained with the HEC-RAS model calibrated
with Station 03OE014. Figure 5-3 presents the computed rating curve for open water
conditions immediately downstream of Muskrat Falls.
As mentioned before, it is of utmost importance to validate this curve through a hydrometric
survey and to confirm the geodetic datum at Station 03OE014.
1.0
1.2
1.4
1.6
1.8
2.0
2.2
2.4
2.6
2.8
3.0
3.2
3.4
3.6
3.8
4.0
4.2
4.4
500 1000 1500 2000 2500 3000 3500
Gau
ge H
eigt
h (m
)
Flow Rate (m³/s)
2008-2011 Data
GH=0.206*Q^0.410-1.30
GH=0.172*Q^0.430 -1.30 {+/-0.13}
GH=0.144*Q^0.450-1.30
Note: Geodetic Datum

TAIL WATER RATING CURVE ANALYSES Revision Nalcor Doc. No. MFA-SN-CD-2000-CV-RP-0005-01 B1 Date Page
SLI Doc. No. 505573-3001-4HER-0023 00 07-Jun-2012 19
SNC-Lavalin Inc.
Figure 5-3: At the Foot of Lower Muskrat Falls Open Water Rating Curve
1.0
1.2
1.4
1.6
1.8
2.0
2.2
2.4
2.6
2.8
3.0
3.2
3.4
3.6
3.8
4.0
4.2
4.4
500 1000 1500 2000 2500 3000 3500
Gau
ge H
eigt
h (m
)
Flow Rate (m³/s)
GH=0.189*Q^0.424-1.3
GH=0.168*Q^0.436 -1.3 {+/-0.13}
GH=0.148*Q^0.449-1.3
Note: Geodetic Datum

TAIL WATER RATING CURVE ANALYSES Revision Nalcor Doc. No. MFA-SN-CD-2000-CV-RP-0005-01 B1 Date Page
SLI Doc. No. 505573-3001-4HER-0023 00 07-Jun-2012 20
SNC-Lavalin Inc.
6 FREEZE-UP RATING CURVES
To understand the derivation of rating curves for the freeze-up period in which transition
from open water to an ice covered state is achieved, it is necessary to understand the
mechanics of ice cover development on the river. A brief description of this process follows.
The Lower Churchill River downstream of Muskrat Falls, while a gently sloping channel, has
a velocity of flow too great for a thermal ice cover to develop. A cover develops instead by
the following processes:
• Shore-fast border ice grows throughout the length of the river, narrowing the open water
top width of open water flow. Figure 6-1 shows the Mud Lake crossing during the
freeze-up process. In the photo to the left, ice pans are seen to be floating through the
section at Mud Lake crossing of the Lower Churchill River (landing area in center
background). The spaces between pans are also seen to be growing in the downstream
direction from the landing section, this being the consequence of the ice pans
accelerating away from the ‘closure’ section. In the photo to the right, the previously
moving ice pans are seen to be arrested and frozen in place. From its downstream
(trailing) edge, to a point upstream of the Mud Lake crossing section, the ice pans are
clearly identifiable. Upstream of this, the ice texture is rougher for a short reach of the
river, with thickening by shoving having occurred to attain equilibrium thickness of the
cover through this reach. Upstream of this shoved reach, the form of the ice pans is
again evident. The leading edge Froude number appears to have been low enough to
permit the progression of the cover from the initial closure on upstream to beyond the
limits of the photo. Also note the striations in the border ice on the near bank in the
photo, these being a consequence of the buttering process.

TAIL WATER RATING CURVE ANALYSES Revision Nalcor Doc. No. MFA-SN-CD-2000-CV-RP-0005-01 B1 Date Page
SLI Doc. No. 505573-3001-4HER-0023 00 07-Jun-2012 21
SNC-Lavalin Inc.
Figure 6-1: Mud Lake Crossing Looking U/S – Left: 1 Day before Freeze-up –Right: 1 Day after Freeze-up
• At the river mouth, a full ice cover develops across the full width of the channel by
thermal growth in the relatively quiescent flow at the entrance of the river into Goose
Bay.
• Pans and cakes of ice generated on the upstream open water reaches up to and beyond
Muskrat Falls arrive at the downstream closure to juxtapose against the downstream
(leading edge) closure. With continuing juxtaposition of the incoming ice, the leading
edge of the established downstream cover steadily advances upstream, effecting full
cover of the channel across its width as it goes (Figure 6-2).
Figure 6-2: Process of Juxtaposition – 1a
• At the leading edge, a certain minimum thickness of cover is required to maintain
mechanical equilibrium between the hydraulic forces acting on the juxtaposing ice and
the resistance provided by the already established cover.

TAIL WATER RATING CURVE ANALYSES Revision Nalcor Doc. No. MFA-SN-CD-2000-CV-RP-0005-01 B1 Date Page
SLI Doc. No. 505573-3001-4HER-0023 00 07-Jun-2012 22
SNC-Lavalin Inc.
• Once established the cover loses heat to the atmosphere, gaining strength and, if the
initial formation thickness is less than the thermal equilibrium thickness for the
accumulating degree-days of freezing, continues to thicken with thermal growth, as
shown in Figure 6-3.
Figure 6-3: Process of Juxtaposition – 1b
• In its upstream advance, the juxtaposing cover will arrive at sections of the channel
where velocities are too high to permit mechanical equilibrium for the ice arriving at the
leading edge. In this instance, incoming ice is submerged by the hydraulic forces at the
leading edge and is carried under the leading edge to be deposited at the first location
downstream where the velocity is low enough to permit it to do so.
• As the deposition advances downstream from the leading edge, the hydraulic resistance
to flow under the downstream cover increases, and thereby the depth of flow at the
leading edge is increased, with a corresponding reduction in the velocity of flow there.
• When enough deposition has occurred to increase the leading edge water depth
sufficiently, mechanical equilibrium of the inflowing ice at the leading edge is achieved
and the upstream progress of the ice cover by juxtaposition can resume until the next
channel section with excessive velocity is reached. Thereafter, the process repeats.
This stage of the process can be seen in Figure 6-4.

TAIL WATER RATING CURVE ANALYSES Revision Nalcor Doc. No. MFA-SN-CD-2000-CV-RP-0005-01 B1 Date Page
SLI Doc. No. 505573-3001-4HER-0023 00 07-Jun-2012 23
SNC-Lavalin Inc.
Figure 6-4: Process of Juxtaposition – 1c
In some instances, the mechanical strength of the established ice cover on the water
surface slope steepened by deposition under it will be inadequate to carry the hydraulic
forces and its own body weight and the cover will “telescope” to a greater thickness to
achieve internal mechanical equilibrium. Such thickening contributes to the achievement
of greater leading edge depths of flow, as is presented in Figure 6-5.
Figure 6-5: Process of Juxtaposition – 1d
The water levels in a reach of river between controlling sections is determined largely by
the requirement for mechanical equilibrium of the leading edge at its downstream
controlling section and to a lesser degree by the hydraulic resistance of the reach.
Field observation and theoretical analyses have shown that a Froude number can define
the state of equilibrium at a critical section. If the Froude number at the leading edge is
less than a critical value a state of equilibrium will exist: i.e. if / , then
equilibrium will prevail, where:

TAIL WATER RATING CURVE ANALYSES Revision Nalcor Doc. No. MFA-SN-CD-2000-CV-RP-0005-01 B1 Date Page
SLI Doc. No. 505573-3001-4HER-0023 00 07-Jun-2012 24
SNC-Lavalin Inc.
F = Froude number,
v = velocity at the leading edge,
g = gravitational constant;
y = depth of flow at the leading edge; and
Fc = critical Froude number value.
• Field observation and theoretical analyses have shown that the value of Fc lies between
0.080 and 0.140 and that the prevailing value at any specific site and time depends upon
the properties of the inflowing ice.
• The first critical section downstream of the Muskrat Falls tail water pool is in the river
reach in which the WSC gauging station 03OE014 is situated. Thus, during the initial
formation of an ice cover on the pool, the water level in the pool is primarily determined
by the leading edge stability requirement in the downstream channel in which the
03OE014 gauging site is located.
• Under current conditions, the ice leading edge stalls at the foot of Lower Muskrat Falls
and inflowing ice generated in the falls and on open water upstream reaches of the river
accumulates under the established cover in the pool at the foot of the falls as described
previously. In this case, the water level rise required to achieve leading edge stability is
so great that only on rare occasions is the winter cold enough to generate the volume of
ice required to raise the pool level enough to drown out even the upper part of Muskrat
Falls. Figure 6-6 shows the lower falls flooded on March 14th, 2012.

TAIL WATER RATING CURVE ANALYSES Revision Nalcor Doc. No. MFA-SN-CD-2000-CV-RP-0005-01 B1 Date Page
SLI Doc. No. 505573-3001-4HER-0023 00 07-Jun-2012 25
SNC-Lavalin Inc.
Figure 6-6: Lower Muskrat Falls Flooded (March 14th, 2012)
Completion of the second stage diversion river closure will raise the water level immediately
upstream of Muskrat Falls (km 43) to El 25 m, ceasing flow over the falls and permitting a
full ice cover over the upstream channel to develop almost to Sandy Lake (km 80).
Generation of ice in these areas will cease. Analyses by Hatch (Ref 7) indicate clearly that
there would be sufficient capacity in the reservoir to store the total supply of ice generated in
open water reaches upstream of the diversion head pond even in the severest winter of
record (1972-73). Thus the development of an ice cover on the Muskrat tail water pool will
be complete with its initial freeze-up as described before and the formation of a hanging
dam of any significance will be eliminated.
• Subsequent to its initial formation, the ice cover in any given reach is subject to two
possible changes; namely,
a. a smoothing of the underside of the cover, thereby reducing the hydraulic resistance
of the ice covered channel and resulting in a corresponding reduction in depth of flow
for a given flow rate, and
b. thermal erosion of the cover to yield open water reaches or patches, if the initial
cover leading edge equilibrium thickness is greater than the thermal equilibrium
thickness for the prevailing air temperatures over and flow velocity under the cover.
Such smoothing and erosion, result in a drop in the water level from the formation level.
That is, the Froude leading edge stability requirement no longer prevails and water level

TAIL WATER RATING CURVE ANALYSES Revision Nalcor Doc. No. MFA-SN-CD-2000-CV-RP-0005-01 B1 Date Page
SLI Doc. No. 505573-3001-4HER-0023 00 07-Jun-2012 26
SNC-Lavalin Inc.
control reverts to the hydraulics of flow in an open channel, albeit with an increased wetted
perimeter due to the presence of the ice cover.
• It is clear, then, that there are three flow regimes for the Muskrat Falls tail water pool;
namely,
a. open water state;
b. freeze-up state; and
c. ice covered state.
These three states are illustrated in the following Figure 6-7. In this case, the transition from
open water to freeze-up required about 8-days, with the freeze-up enduring for about 4-
days. Subsequent smoothing of the cover to arrive at the ice covered state required
between 3 and 4 days.
Figure 6-7: The Freeze-up Process
It is clear from the chart that the highest levels realized for any given freeze-up flow rate will
be determined by the need for leading edge stability. Thus a rating curve for this condition is
useful.
0.0
0.5
1.0
1.5
2.0
2.5
3.0
3.5
4.0
4.5
5.0
5.5
6.0
1 49 97 145 193 241 289 337 385 433 481 529 577 625 673 721 769 817
Wat
er L
evel
m
Number of Hours from Start Time
Hourly Water Levels
Average for Indicated Period
Open Water State
Rise with approaching ice front
Freeze-Up State
Fall with smoothing anderosion of ice cover
Ice Covered State
Station 03OE0142011-11-15 12:00 AM -2011-12-20 12:00 AM

TAIL WATER RATING CURVE ANALYSES Revision Nalcor Doc. No. MFA-SN-CD-2000-CV-RP-0005-01 B1 Date Page
SLI Doc. No. 505573-3001-4HER-0023 00 07-Jun-2012 27
SNC-Lavalin Inc.
Rearranging the foregoing Froude equation and substituting v Q/By, where B = channel
top width and y = hydraulic mean depth yields;
yQ
B F/ c ,
in which the terms are as before and c’ is a datum constant relating the water level
measured at a gauging station to the elevation of the leading edge control section.
Evidently, the water level as determined by leading edge stability is proportional to the
ratio Q
B/ . A plot of water level data available from a gauge site for this state of flow
charted against the corresponding value of Q
B/ would thus be expected, with an
appropriate datum adjustment, to lie in a ‘cloud’ bounded by two straight lines the slopes of
which are determined by the limiting values for Fc of 0.080 (upper bound, Ref 8) and 0.140
(lower bound, Ref 9).
The results of application of this methodology to the data sets in terms of flow rate vs. gauge
height from the subject gauging Stations 03OE007 and 03OE014 are shown in Figure 6-8
and Figure 6-9, respectively. Figure 6-10 shows the freeze-up rating curve at the foot of
Lower Muskrat Falls using 03OE014 as surrogate station. Taking into account that the
upper bound limit and the lower bound limit have to remain the same, the datum adjustment
was found using the one-dimensional model, where the upper and lower freeze-up rating
curves found for 03OE014 were imposed as control sections respectively.

TAIL WATER RATING CURVE ANALYSES Revision Nalcor Doc. No. MFA-SN-CD-2000-CV-RP-0005-01 B1 Date Page
SLI Doc. No. 505573-3001-4HER-0023 00 07-Jun-2012 28
SNC-Lavalin Inc.
Figure 6-8: WSC Station 03OE007 - Freeze-up Rating Curve
Figure 6-9: WSC Station 03OE014 - Freeze-up Rating Curve
2.0
2.5
3.0
3.5
4.0
4.5
5.0
5.5
6.0
6.5
7.0
7.5
500 1000 1500 2000 2500 3000
Gauge Height (m)
Flow Rate m3/s
1983 ‐ 1994 Freeze‐up Data
Froude # = 0.140: GH = [(Q/960)^(2/3)]*1.730 + 2.30
Froude # = 0.080: GH = [(Q/960)^(2/3)]*2.518 + 2.30
Winter Data 1985‐1995
Datum adjusted by translation of 03OE014 to the location of 03OE007 usingHEC‐RAS simulations
Note:
2.0
2.5
3.0
3.5
4.0
4.5
5.0
5.5
6.0
6.5
7.0
7.5
500 1000 1500 2000 2500 3000
Gauge Height GH (m)
Flow Rate m3/s
2008 ‐ 2011 Freeze‐up Data
Froude # = 0.080: GH = [(Q/960)^(2/3)]*2.518 + 1.50
Froude # = 0.140: GH = [(Q/960)^(2/3)]*1.730 + 1.50
Winter Data 2008‐2011
Note: Geodetic Datum

TAIL WATER RATING CURVE ANALYSES Revision Nalcor Doc. No. MFA-SN-CD-2000-CV-RP-0005-01 B1 Date Page
SLI Doc. No. 505573-3001-4HER-0023 00 07-Jun-2012 29
SNC-Lavalin Inc.
Figure 6-10: At the Foot of Lower Muskrat Falls - Freeze-up Rating Curve
2.0
2.5
3.0
3.5
4.0
4.5
5.0
5.5
6.0
6.5
7.0
7.5
500 1000 1500 2000 2500 3000
Gau
ge H
eigh
t GH
m
Flow Rate m3/s
Froude # = 0.080: GH = [(Q/960)^(2/3)]*2.518 + 1.68
Froude # = 0.140: GH = [(Q/960)^(2/3)]*1.730 + 1.68
Note: Geodetic Datum

TAIL WATER RATING CURVE ANALYSES Revision Nalcor Doc. No. MFA-SN-CD-2000-CV-RP-0005-01 B1 Date Page
SLI Doc. No. 505573-3001-4HER-0023 00 07-Jun-2012 30
SNC-Lavalin Inc.
7 WINTER RATING CURVES
Immediately following the freeze-up state, the established cover undergoes another
transition as previously noted, with “smoothing” of the underside of the cover and in some
cases where the velocities are higher (e.g. at the Blackrock Bridge crossing), the
development of open water reaches or longitudinal leads along the thalweg as a state of
thermal equilibrium develops for the recently established cover. The consequence of these
adjustments is a reduction in the hydraulic resistance to flow with a consequent reduction in
water depth required to carry the prevailing flow.
Subsequent to this adjustment, a steady state condition prevails and the hydraulics of the
flow reverts to an “open water” regime, but now with the additional hydraulic resistance
rendered by the presence of the ice cover. The ice cover increases the wetted perimeter of
the flow, consequently reduces the hydraulic radius for the channel and increases the depth
of flow required to carry the prevailing flow. In addition, the overall hydraulic roughness of
the channel is altered by the addition of the ice cover roughness. The consequences of
these alterations can be demonstrated algebraically as follows.
Rearranging the Manning open channel flow equation to separate the independent variables
(LHS) from the independent variables (RHS) yields:
AR / nQ/S / ,
where A = area, R = hydraulic radius, n = Manning’s roughness coefficient, Q = flow rate
and S = channel slope.
Substituting the appropriate approximations for a wide rectangular channel yields:
byyx
by
xnQ/S / ,
where b = channel top width, y = hydraulic mean depth, x = 1 for open water flow and x = 2
for ice covered flow.
Solving for the hydraulic mean depth then yields:
y ~ xnQ
bS /
/
TAIL WATER RATING CURVE ANALYSES Revision Nalcor Doc. No. MFA-SN-CD-2000-CV-RP-0005-01 B1 Date Page
SLI Doc. No. 505573-3001-4HER-0023 00 07-Jun-2012 31
SNC-Lavalin Inc.
Taking the ratio of values for the two states x1 = 1 and x2 = 2 with Q, b and S held constant
yields:
yy
~ 2nn
~ 1.32nn
Thus, adding an ice cover to a wide-open channel is seen to require about 1/3rd more depth
of flow to compensate for the change in hydraulic radius with the introduction of an ice
cover. For example, a 6 m open water flow depth would increase for the same discharge to
about 8 m with an ice cover in place.
The effect of a change in average roughness coefficient for the channel section with an ice
cover in place is also evident. This roughness adjustment may be positive or negative,
depending upon the roughness of the channel bed relative to that of the ice cover.
Referring again to the Manning open channel flow equation, Q a GH b , the
proportionality constant ‘a’ would be expected to change with the addition of an ice cover
because this constant represents the cross-sectional area and the roughness coefficient and
as noted, the hydraulic mean depth and roughness would be altered by the addition of an
ice cover.
The datum constant ‘b’ and the index ‘c’ would be expected to remain the same as for the
open water condition; the former because it represents the physical difference between the
gauge zero and the true elevation of the hydraulic control for the river reach; the latter
because it represents the channel cross-section shape and as this is a function of the
alluvial bed material, which has not changed, would not be expected to be different from the
open water state.
On the basis of this reasoning, the ice covered rating curves have been derived for the
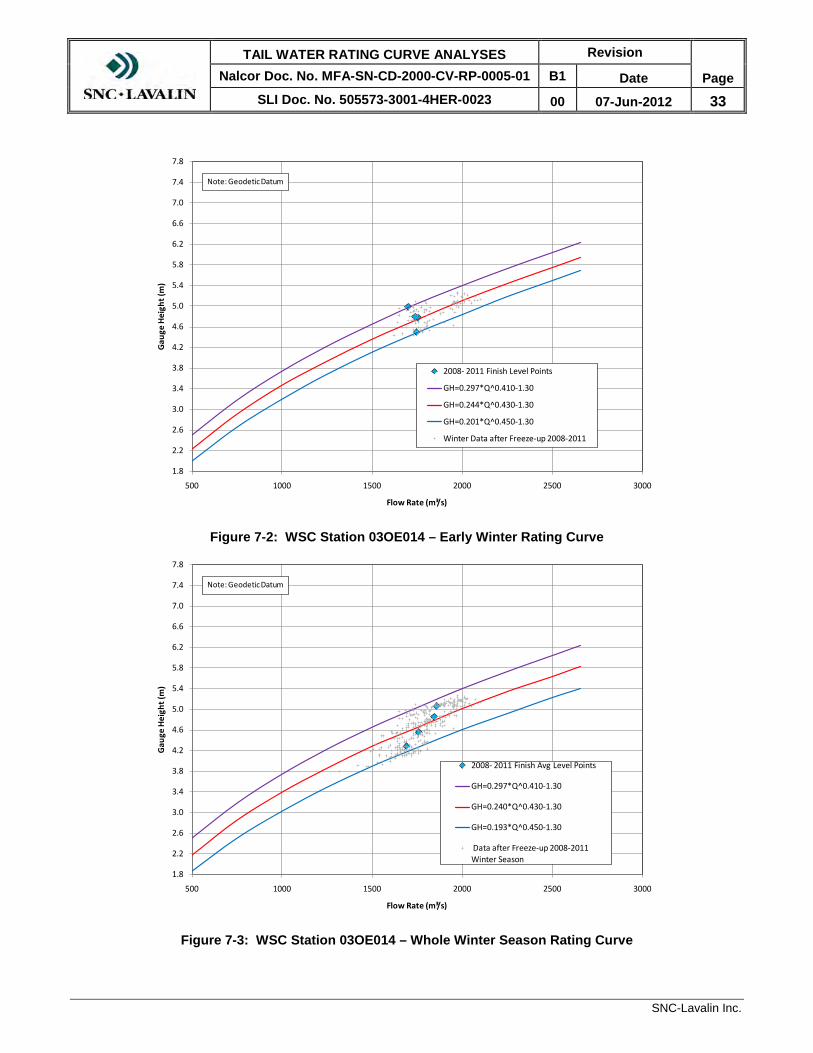
subject gauging stations as shown in Figure 7-1 and Figure 7-2.
In Figure 7-1, it is noted that the level/data sets available for this analysis were limited to one
observation per year, taken as a short term average immediately after completion of the
smoothing transition for the developing ice cover. Levels beyond a short time after
conclusion of this transition were rendered unusable because of the onset of the process of
deposition at the foot of Lower Muskrat Falls, as previously noted, influences the water
levels in the pool. With the termination of this process, this influence is no longer relevant.

TAIL WATER RATING CURVE ANALYSES Revision Nalcor Doc. No. MFA-SN-CD-2000-CV-RP-0005-01 B1 Date Page
SLI Doc. No. 505573-3001-4HER-0023 00 07-Jun-2012 32
SNC-Lavalin Inc.
Also as previously noted, it is expected that once the diversion closure of the Stage II of
construction is effected, the development of any significant hanging dam in the Muskrat Falls
tail water is expected to cease.
Figure 7-1: WSC Station 03OE007 – Early Winter Rating Curve
Figure 7-2 shows the early rating curves immediately after completion of the smoothing
transition for the developing ice cover for station 03OE014. Figure 7-3 presents the rating
curve for the winter season at station 03OE014. Using backwater computations with the
one-dimensional hydraulic model HEC-RAS, the long-term average winter curve was
calculated at the foot of Lower Muskrat Falls (Figure 7-4).
1.8
2.2
2.6
3.0
3.4
3.8
4.2
4.6
5.0
5.4
5.8
6.2
6.6
7.0
7.4
7.8
500 1000 1500 2000 2500 3000
Gau
ge H
aigt
h (m
)
Flow Rate (m³/s)
g
1983-1992 Finish Level Points
GH=0.161*Q^0.513-0.805
GH=0.133*Q^0.537-0.805
GH=0.101*Q^0.498-0.805
Winter Data after Freeze-up 1983-1992 Begining of Winter
Datum adjusted by translation of 03OE014 to the location of 03OE007 using HEC-RAS simulations
Note:
TAIL WATER RATING CURVE ANALYSES Revision Nalcor Doc. No. MFA-SN-CD-2000-CV-RP-0005-01 B1 Date Page
SLI Doc. No. 505573-3001-4HER-0023 00 07-Jun-2012 33
SNC-Lavalin Inc.
Figure 7-2: WSC Station 03OE014 – Early Winter Rating Curve
Figure 7-3: WSC Station 03OE014 – Whole Winter Season Rating Curve
1.8
2.2
2.6
3.0
3.4
3.8
4.2
4.6
5.0
5.4
5.8
6.2
6.6
7.0
7.4
7.8
500 1000 1500 2000 2500 3000
Gau
ge H
eigh
t (m
)
Flow Rate (m³/s)
2008- 2011 Finish Level Points
GH=0.297*Q^0.410-1.30
GH=0.244*Q^0.430-1.30
GH=0.201*Q^0.450-1.30
Winter Data after Freeze-up 2008-2011
Note: Geodetic Datum
1.8
2.2
2.6
3.0
3.4
3.8
4.2
4.6
5.0
5.4
5.8
6.2
6.6
7.0
7.4
7.8
500 1000 1500 2000 2500 3000
Gau
ge H
eigh
t (m
)
Flow Rate (m³/s)
2008- 2011 Finish Avg Level Points
GH=0.297*Q^0.410-1.30
GH=0.240*Q^0.430-1.30
GH=0.193*Q^0.450-1.30
Data after Freeze-up 2008-2011 Winter Season
Note: Geodetic Datum

TAIL WATER RATING CURVE ANALYSES Revision Nalcor Doc. No. MFA-SN-CD-2000-CV-RP-0005-01 B1 Date Page
SLI Doc. No. 505573-3001-4HER-0023 00 07-Jun-2012 34
SNC-Lavalin Inc.
Figure 7-4: At the Foot of Lower Muskrat Falls – Whole Winter Season Rating Curve
1.8
2.2
2.6
3.0
3.4
3.8
4.2
4.6
5.0
5.4
5.8
6.2
6.6
7.0
7.4
7.8
500 1000 1500 2000 2500 3000
Gau
ge H
eigh
t (m
)
Flow Rate (m³/s)
GH=0.275*Q^0.424-1.30
GH=0.235*Q^0.436-1.30
GH=0.199*Q^0.449-1.30
Note: Geodetic Datum

TAIL WATER RATING CURVE ANALYSES Revision Nalcor Doc. No. MFA-SN-CD-2000-CV-RP-0005-01 B1 Date Page
SLI Doc. No. 505573-3001-4HER-0023 00 07-Jun-2012 35
SNC-Lavalin Inc.
8 CONCLUSIONS
General conclusions regarding the overall study are provided below:
• There are three different discharge-level relationships on the Lower Churchill River
downstream of Muskrat Falls; namely open water, freeze-up and ice covered;
• On the basis of the open water rating curve found in the current analysis, the water
levels in the rating curve presented in the SNC-AGRA report (Ref 2) have increased by
about 0.40 m for the period between 1998 and 2011;
• It is expected that once the diversion closure of the Stage II of construction is effected,
the development of any significant hanging dam in the Muskrat Falls tail water is
expected to cease; and
• Adding an ice cover to a wide-open channel is seen to require about 1/3rd more depth of
flow to compensate for the change in hydraulic radius with the introduction of an ice
cover.

TAIL WATER RATING CURVE ANALYSES Revision Nalcor Doc. No. MFA-SN-CD-2000-CV-RP-0005-01 B1 Date Page
SLI Doc. No. 505573-3001-4HER-0023 00 07-Jun-2012 36
SNC-Lavalin Inc.
9 RECOMMENDATIONS
• The rating curves presented in this study are to be used as follows:
• Setting infrastructure design criteria:
o Freeze-up extreme values have to be used.
• Values to be used for estimation of power and energy yield:
o average values to obtain long term average energy;
o extreme values to define upper and lower values for dependable capacity.
• Figure 9-1 shows the established three different discharge-level relationships
downstream of Muskrat Falls.
Figure 9-1: Rating Curves Downstream of Muskrat Falls
• It is deemed of critical importance to undertake water level measurements at the
downstream pool of Muskrat Falls in order to validate the open water rating curve found
in the present study and to confirm the geodetic datum at the hydrometric stations.
1.0
1.5
2.0
2.5
3.0
3.5
4.0
4.5
5.0
5.5
6.0
6.5
7.0
500 1000 1500 2000 2500 3000 3500 4000 4500 5000
Gau
ge H
eigh
t (m
)
Flow Rate (m³/s)
Freeze-up Rating Curve GH=[(Q/960)^(2/3)]*2.518+1.68
Winter Long-Term Average Rating Curve GH=0.235*Q^0.436-1.30
Open Water Long-Term Average Rating Curve GH=0.168*Q^0.436-1.30