talent recruitment and firm performance: the … · this paper is a revised version of talent...
TRANSCRIPT
TALENT RECRUITMENT AND FIRM PERFORMANCE: THE BUSINESS OF MAJOR LEAGUE SPORTS
By
Daniel H. Weinberg U.S. Census Bureau
CES 13-54R February, 2014
The research program of the Center for Economic Studies (CES) produces a wide range of economic analyses to improve the statistical programs of the U.S. Census Bureau. Many of these analyses take the form of CES research papers. The papers have not undergone the review accorded Census Bureau publications and no endorsement should be inferred. Any opinions and conclusions expressed herein are those of the author(s) and do not necessarily represent the views of the U.S. Census Bureau. All results have been reviewed to ensure that no confidential information is disclosed. Republication in whole or part must be cleared with the authors.
To obtain information about the series, see www.census.gov/ces or contact Fariha Kamal, Editor, Discussion Papers, U.S. Census Bureau, Center for Economic Studies 2K132B, 4600 Silver Hill Road, Washington, DC 20233, [email protected].
This paper is a revised version of TALENT RECRUITMENT AND FIRM PERFORMANCE: THE BUSINESS OF MAJOR LEAGUE SPORTS (CES-WP-13-54) from November 2013. A
copy of the original paper is available upon request.
ABSTRACT
Firms rely heavily on their investments in human capital to achieve profits. This research takes advantage of detailed information on worker performance and confidential information on firm revenue and operating costs to investigate the relationship between talent migration and firm profitability in major league sports, one of the few industries in which detailed information about the past performance of each individual worker (athlete) is known to all potential employers. I use confidential microdata from the 2007 Economic Censuses, and from the 2007 and 2008 Service Annual Surveys to investigate the link between individual worker performance and team profitability, controlling for many other aspects of the sports business, specifically taking account of the mobility of athletic “stars” and “superstars” from one team to another. The investigations in this paper provide limited support for the hypothesis that hiring talented individuals (stars) will increase a firm’s profit. However, there is not convincing support for the incremental benefit of hiring superstars. The peculiar characteristics of major league sports suggest that these results are probably not generalizable.
ACKNOWLEDGEMENTS
Any opinions and conclusions expressed herein are those of the author and do not necessarily represent the views of the U.S. Census Bureau. All results have been reviewed to ensure that no confidential information is disclosed. The author wants to thank James Davis for his help in assembling the census and survey data for this study and Ron S. Jarmin, C.J. Krizan, Thomas A. Louis, and participants at a Census Bureau seminar for suggestions.
1
1. INTRODUCTION
Firms rely heavily on their investments in human capital to achieve profits. This
observation is more salient in service industries than in manufacturing since in the latter,
investments in land, capital, and intermediate materials are very important to creation of the
firm’s physical output. One key problem that all firms have is performance measurement –
identifying measurable outcomes for its workforce. This research will attempt to take advantage
of detailed information on worker performance and confidential information on firm revenue
and operating costs to investigate the relationship between talent migration and firm
profitability. It is hoped that any insights gained from a focus on a specific industry wherein
performance is relatively easy to measure can be useful in inferences about other industries.
In contrast to nearly all other industries, detailed information about the past
performance of each individual worker (athlete) in the industry of professional team sports is
known to all potential employers; indeed such statistics are publicized widely. Ichniowski and
Preston (2012, p. 34) have recently lamented the lack of research on the link between the data
on player performance to revenue: “We have no information that allows us to calculate the
relationship of these statistics to making the postseason or winning a championship, much less
to marginal revenue effects of differences in these statistics through their effects on gate receipts
or television contracts.”
Section 2 below summarizes the literature on both the relocation of talent (high-
performing workers) from one firm to another, and the literature on the economics of
professional sports teams. I focus on U.S. firms owning teams in the four major professional
sports leagues in the United States: Major League Baseball (MLB), the National Basketball
Association (NBA), the National Football League (NFL), and the National Hockey League
(NHL).1 Section 3 discusses the data and their sources and presents the proposed empirical
1 Out of scope are the eight Canadian teams (one baseball, one basketball, and six hockey) as firm-specific data are not available for them. Also out of scope are (1) Major League Soccer both because of its recent origin (the first season was 1996) but also because all teams in the league are owned by one corporation; (2) Women’s NBA because of its recent origin (1997) and its ownership structure (teams and the league were collectively owned by the NBA until the end of 2002, when the NBA sold WNBA teams either to their NBA counterparts in the same city or to independent organizations); and (3) World Team Tennis because of its fluctuating fortunes, complicating the development of lagged variables (it operated from 1974 to 1978 and was reestablished in 1981, fluctuating in size since then from 4 to 12 teams).
2
strategy. Section 4 describes the data I use – both public data on athletes and teams, and
confidential microdata from the 2007 Economic Censuses, and from the 2007 and 2008 Service
Annual Surveys on teams and the firms that own them. Section 5 presents the results and
Section 6 my conclusions.
2. LITERATURE REVIEW
2.1 The Effects of Talent Relocation
The literature on the effects of talent relocation is sparse, mainly because of the
aforementioned difficulty of accurately measuring worker performance. It fits into a relatively
new sub-specialty of labor economics, specifically personnel economics (Lazear and Oyer 2007,
Lazear and Shaw 2007, Oyer and Schaefer 2011) in that it focuses on “interactions between a
firm and workers [that] explicitly or implicitly consider a firm trying to maximize some objective
(usually profits)” (Lazear and Oyer 2007, p. 2). The work is also related to organization
(institutional) economics in that it is intended to illuminate how firms behave on the demand
side of a labor market (Oyer and Schaefer 2010, p. 2).
Studies have attempted to measure worker performance in a variety of ways. For
example, Lenzi (2009) uses patents to measure the productivity of Italian inventors in a study of
the role of worker mobility on knowledge transfer for knowledge workers (e.g., scientists,
researchers, inventors, technicians). Zucker et al. (2002) measure the performance of biologists
as the number of genetic sequences discovered and the number of citations of their work. Shaw
and Lazear (2008) measure the productivity of autoglass installers as the number of windshields
installed per day.
The research on star performance can be traced to the seminal work of Rosen (1981) and
Adler (1985). As characterized by Franck and Nüesch (2012, p. 202), “Although Sherwin Rosen
explains how small differences in talent can translate into large differences in earnings, Moshe
Adler argues that superstars might even emerge among equally talented performers due to the
positive network externalities of popularity.” They go on to note (p. 204) that “In team sports,
for example, superstars may have personal appeal or charisma, an element that attracts fan
interest even after controlling for their contribution to the team’s (increased) playing quality.”
They used press publicity as measured in the LexisNexis database as a measure of soccer star
popularity, defining superstars (as did Rosen) as the players at the top end of the market value
distribution.
Other studies of labor mobility include Ravid (1999) who used the number of Academy
Awards and nominations received, as well as participation in top-grossing films, to identify
3
stars; Gardner (2005), who studied talent mobility in the software industry, but did not attempt
to quantify the role individual worker performance plays in labor mobility; and Groysberg et al.
(2008) who studied security analysts using independent assessment of analysts to identify stars,
also used by Clarke et al. (2007). An innovative study using matched employer-employee data
by Andersson et al. (2009, p. 34) concluded that “software firms that operate in product markets
with highly skewed returns to innovation, or high variance payoffs, care more likely to attract
and pay for star workers.” Another recent study that exploited matched employer-employee data
is Campbell et al. (2012). While their focus was on entrepreneurship efforts by employees in the
legal services industry, they find different results for high and low performers, and thus suggest
that attempts to distinguish between such workers is a fruitful line of inquiry. Other studies of
star mobility include Krautmann and Oppenheimer (1994) and MacDonald and Reynolds (1994)
who studied baseball.
Labor markets are not monolithic: “The extent to which matching, search, and
asymmetric information are prevalent is likely to vary across labor markets” (Oyer and Schaefer
2011, p. 1785). The market for athletic labor is not typical. For the most part, potential
employers have extensive information about the athletes’ past performances, and on how those
performances in a team environment contributed to maximizing their previous employer’s
intermediate objective (achieving a high ratio of wins to losses). Similarly, the worker knows a
great deal about the firm’s past employment practices, at least for the establishment (the team)
for which the employer wants him to work. The unknowns involve the potential employee’s
ability to mesh with other workers in the work environment (the game) and with supervisory
personnel (the team’s manager), though word-of-mouth circulates relevant information about
intangible aspects of both the worker’s performance (e.g., ‘Does he listen to the coaches?’) and
the team environment (e.g., ‘Are team behavior rules strictly enforced?’).
New prospective employers must also be wary. As Groysberg et al. (2008, p. 1215) note,
“Firms may hire stars whose performance, divorced from its previous context, fails to meet
expectations.” This could be both because the player who changes teams loses firm-specific
human capital (e.g., their personal and professional interactions with their teammates such as
the ability for the shortstop and second baseman in baseball to execute double plays) but also
because the new firm (team) could offer lower-quality support (i.e., less-talented teammates).
Glenn et al. (2001) have shown that firm-specific human capital is important in baseball, with
the value of trades varying by player position.
Nevertheless, with close-to-perfect information on both sides of the employer-employee
relationship, it seems that the business of professional sports is a good venue to understand the
4
value of talent relocation. Yet a note of caution is called for. As Groysberg et al. (2008, p. 1217)
note, “When a firm that possesses an informational advantage fails to make a counteroffer to
keep the employee from leaving, the hiring firm is likely to suffer a winner’s curse.” On the other
hand, the acquiring firm may be able to take more advantage of externalities generated by the
new employee than the old firm. For example, Yang and Shi (2011, p. 353) note that while “the
rise of a star athlete is accompanied by exceptional individual performance[; …] being in a good
team and having good teammates help.”
Another note of caution is that it is quite difficult to specify all the dynamics involved in a
firm-athlete interaction. Each party wants to maximize their own “profit” from the transaction.
The firm wants to maximize the discounted net present value of the future stream of revenues
(from all sources) less costs. The player wants to maximize the discounted net present value of
future salary and endorsements. Both calculations require a multi-year perspective, and neither
perspective may be totally aligned with a team’s objective (presumably winning a championship,
or making high profits – see Lewis 2003). For example, a player about to become a free agent
might be interested in maximizing his individual statistics, even to the detriment of the team’s
overall performance.
2.2 The Business of Sports
Professional sports holds a unique place in American life. As Humphries and Howard
(2008, p. vii) note, “From one perspective, the sports industry is just another industry in a
modern economy. The sports industry … is a collection of firms producing an array of products
and services that meet the demands of modern consumers. … But from another perspective, the
sports industry differs in profound ways from other industries. What other industry has an
entire section devoted to it in most local newspapers across the country?”
Stewart and Jones (2010, p. 488) characterize teams: “The essential premise of sports
economics is that teams may be modeled as profit maximizing firms serving a demand for their
product in their output market”; they argue that teams are actually multiproduct firms with two
outputs – performance and entertainment. Yet teams are not necessarily the entity to analyze
for profit motives. Teams are establishments, often controlled by firms with other interests.
Firms often own more than one team, manage arenas, and sell other services such as
concessions, parking, and local broadcast rights. In some cases, they have their own cable
networks. It is the revenue minus costs for the enterprise (firm) as a whole we need to examine,
and if possible profit over multiple years, not just one year, as sports teams will invest in players
and arenas for multiple years, hoping to reap rewards for early developmental investments. This
perspective is echoed in the following quote from a team owner: “If you just looked at the
5

[Cleveland] Cavaliers in terms of revenues, profits and balance sheets … people would say
‘You’re insane! You’re nuts!’ But if you look at all the tentacles, the impact on our other venues,
it makes tremendous sense” (quoted in Gladwell 2011, endnote 1).
There are at least three recent studies of the impact of NBA stars on revenue (sales) –
Hausman and Leonard (1997), Berri et al. (2004), and Berri and Schmitt (2006). Hausman and
Leonard (p. 586) analyze game attendance and conclude that “superstars are quite important for
generating revenue, not only for their own teams but for other teams as well.” They attribute this
to factors beyond improvements in team quality (p. 591): “The superstar may have a ‘personal
appeal’ that attracts fans.” Berri et al. temper Hausman and Leonard’s conclusion a bit (p. 45):
“Although star power was found to be statistically significant, … the ability of a team to generate
wins appears to be the engine that drives consumer demand.”2 MacDonald and Reynolds (1994,
p. 444) found that “the salaries of the very highest paid players in MLB disproportionately
exceed their relative productivity advantage.”
In analyzing the business of sports, one can start with the basic premise of a profit-
maximizing firm hiring workers: “Each owner will bid up to the player’s expected marginal
revenue product. None of the owners know what the player’s output will be, but each forms an
expectation.” (Zimbalist 2011, p. 12); see also Quirk and Fort (1992). Yet the labor market for
professional sports athletes is not a free market. Leagues have formed because spectators want
to witness contests between teams, and leagues can efficiently organize such contests.3 Rosner
and Shropshire (2004, p. 21) argue that
Leagues combine elements of cooperation and competition and allow independent team owners to seek monetary gains that might otherwise be unavailable if purchased unilaterally through the playing of disparate contests. … Leagues benefit owners by providing regular and championship seasons of play and offering a unitary set of playing rules, both of which are designed to maximize fan interest and consequently, team profits. Off the field, competition among teams is generally limited to the pursuit of scarce playing and managerial talent. Professional sports leagues are cooperative endeavors away from the playing field, with teams jointly engaging in numerous practices that maximize the profits of the collective entity.
2 However, Berri and Schmitt (2006) confirm the superstar externality that Hausman and Leonard found. 3 Leagues have been around for quite some time. Kouvet (1977) noted: “In the ancient republic of Rome, … the leading chariot drivers … belonged to four teams. … All four teams were organized into a league run by the four corporations. … Almost two thousand years before Catfish Hunter got $3.75 million for switching teams, an ex-slave named Diocles got 35 million sesterces ($1.8 million) for switching stables … an income one hundred times that of the entire Roman Senate.”
6
However, collusion among firms is per se illegal under existing antitrust laws so Congress has
granted exemptions to specific professional sports leagues. U.S. leagues also differ from most
others in the world.4
Kahn (2000) argued that “Sports owners are a small and interconnected group, which
suggests that they have some ability to bond together and act as monopsonists in paying players.
The result is that player pay is held below marginal revenue product.” Yet the players have
countervailing power -- the limited supply of athletes with the requisite skills to play the sport at
a high level conveys some bargaining power on the workers.5 Thus, leagues have placed
numerous restrictions on player bargaining rights and mobility. Frick and Simmons (2008)
illuminate these restrictions, which include a player draft, a reserve clause, free agency only after
an initial period of employment, and a salary cap.
It has been argued that consumers will lose interest, even in dominant “home” teams, if the
contests are too lopsided. As Berri et al. (2004, p. 33) note: “The theoretical literature argues
competitive imbalance, or the on-the-field domination of one or a small number of
organizations, reduces the level of uncertainty of outcome, and consequently reduces the level of
consumer demand. The empirical literature … has also generally confirmed a relationship
between uncertainty of outcome or competitive balance and demand for tickets to sporting
events.” Thus, the leagues have introduced the above-noted restrictions to maintain
“competitive balance”, that is, to ensure that some equality of quality (and thus the
competitiveness of each game) is maintained across the teams in the league.
Frick and Simmons (2008, pp. 181-2) make the following points. “Without limits, teams
from [small markets] would stand little chance of attracting the best players because they cannot
afford to pay salaries that match those offered by teams from [big markets]. This, in turn, would
endanger competitive balance, as teams from large cities would regularly win more games and
more championships than teams from small cities. A league that that lacks competitive balance
would endanger teams from large and small cities alike, as fans ultimately lose interest in games
whose outcome is a foregone conclusion.” Krautmann and Oppenheimer (1994) reinforce the
need for league restrictions.
4 In the U.S., membership in professional leagues is fixed (except for expansions and contractions). In the rest of the world, leagues have promotion and relegation – the strongest teams get promoted from lower-ranking divisions to higher-ranked ones, replacing the poorest performers in those higher divisions (which are “relegated”—demoted); this makes each division more competitive. 5 Worker-owner conflict is not new either. Kouvet (1977) also noted: “The increasing strife between players and owners is mirrored by Diocles’ statement two millennia earlier: ‘I do not care that I am exploited,’ he said, “I exploit those that exploit me.’” [cf. footnote 3]
7
New sources of revenue beyond ticket sales have become increasingly important, as
Mason and Howard (2008) note. Key sources of revenue to the firms owning teams are
premium seating (e.g., ‘club seats’), personal seat licenses (the right to buy a season ticket),
arena naming rights (e.g., ‘Verizon Center’), media rights (broadcast, cable, local), new media
(Internet, digital television, mobile phones), merchandising, sponsorships, expansion fees,
parking, advertising, concessions and restaurants, facility tours and associate entertainment
activities (e.g., museums), retail stores, and regional sports networks.6 Some teams even sell
stock in their companies, albeit with limited voting power.7
Owning a firm with multiple lines of business can enhance profitability. As Rosner and
Stropshire (2004, p. 2) note “Viewing sports franchises as entertainment assets, corporations
have attempted to use them to garner additional revenues through the team’s playing facility
and media rights. In theory, the ownership of the team and both its playing facility and
programming rights allows the corporate owner to enhance its value through the exploitation of
a wide range of synergies, including cross-promotional opportunities, the creation of additional
distribution outlets, and higher visibility in the marketplace, as well as risk reduction and cost
savings through economies of scale.” This wider scope of activity can allow a firm to harness
some of the synergies and bid higher for a player’s contact than another firm in a smaller market
or with fewer ancillary businesses. As Ichniowski and Preston (2012, p. 35) note, “teams may
receive especially large economic payoffs from identifying ‘franchise players’ around whom they
can build championship caliber teams.”
3. THE ANALYSIS APPROACH
The gaps in the existing literature are twofold. First, there are few studies that are able to
convincingly measure worker performance and relate that to business outcomes. This may be
important because if one views firms as profit-maximizing, the sports establishments which
they manage may be given objective functions different than profit-maximization, due to
externalities generated by workers in those establishments (athletes) for the enterprise as a
6 For the merchandising aspect, “Licensees – the manufacturers of these products – typically pay the sports property a royalty of approximately 8.5% of the wholesale selling price of the goods in exchange for the right to sell products containing league and team names, logos, and marks. These monies are distributed equally across all league teams, similar to the manner in which revenues generated from the sale of national media rights are apportioned” (Rosner and Shropshire 2004, p. 177). 7 Stroz (2001, p. 20) terms the sale of stock as “a ‘victimless’ crime, involving fans who are more than willing to part with hard-earned dollars for the novelty and prestige of part ownership in a sports franchise and unscrupulous owners who are more than willing to accept their money.” The NFL Green Bay Packers were the first team to offer shares to the public (in 1923), and they publically acknowledge the limited value of the shares. [<http://packersowner.com/faq>, accessed 6 January 2012]. Public ownership likely prevents team relocation (Green Bay is the smallest media market in the four leagues).
8
whole. Second, no study has heretofore used data from teams in more than one sports league to
provide insights into outcomes in the sports industry.
My analysis plan is as follows. First, I categorize players into three (admittedly arbitrary)
categories: journeyman players, stars, and superstars. Second, I estimate the effect of stars and
superstars on firm (and team) profitability, testing the effects of four different definitions of
stars and superstars, and four different definitions of profit.
3.1 Definition of Stars and Superstars
Past researchers have used different methods to identify stars and superstars. These
include selections to All-Star games (Hausman and Leonard 1997, Scott et al. 1985, Brown et al.
1991, Ichniowski and Preston 2012), All-Star votes (Berri et al. 2004, Yang and Shi 2011), and
media designations (Burdekin and Idson 1991). I test four alternate combinations of definitions
for stars and superstars – either restrictive or expansive for both – that involve league awards,
all-star selections, and significant performance in selected skill areas.8 The restrictive definition
identifies 7 percent of players as stars (or superstars) and 3 percent as superstars; the expansive
definition identifies 10 and 5 percent, respectively.9 Past performance is obviously not a perfect
measure of future performance, but it plus judgment is the basis on which athletes are hired.
Major League Baseball. MLB stars were (a) On the all-star team in two or three of the
past 3 seasons, OR (b) In the top 5% in a major statistical category five times (expansive) or six
times (restrictive) in past 3 seasons, OR (c) Received one major award in past 3 seasons (both),
OR (d) Received two minor awards in past 3 seasons (expansive only). MLB Superstars were (a)
On the all-star team in two or three of past 3 seasons, OR (b) In the top 1% in a major statistical
category three times (expansive) or four times (restrictive) in past 3 seasons, OR (c) Received
one (expansive) or two (restrictive) major awards in past 3 seasons, OR (d) Received two minor
awards in past 3 seasons (expansive only).
National Basketball Association. NBA Stars were (a) On the all-star team in two or three
of past 3 seasons, OR (b) In the top 5% in a major statistical category three times (expansive) or
four times (restrictive) in past 3 seasons, OR (c) on the first, second, or third all-NBA team or
first or second all-NBA defensive team two times in past 3 seasons. NBA Superstars were (a) On
the all-star team in two or three of past 3 seasons, OR (b) In the top 1% in a major statistical
category two times (expansive) or three times (restrictive) in past 3 seasons, OR (c) On the first,
second, or third all-NBA team or first or second all-NBA defensive team two times (expansive),
8 No player is identified as a superstar unless that person is also a star using the restrictive definition. The number of stars counts superstars. All statistical categories used to define stars, and the list of awards also used, are shown in Appendix A. 9 If a player is traded mid-season, he is counted as 0.5 player for each team.
9
or on first or second all-NBA team or first all-NBA defensive team three times (restrictive) in
past 3 seasons.
National Football League. NFL Stars were (a) On the all-star team in two or three of past
3 seasons, OR (b) In the top 5% in a major statistical category two times (quarterbacks and
kickers, or expansive) or three times (restrictive for offense and defense) in past 3 seasons, OR
(c) Received one major award in past 3 seasons (both). NBA Superstars were (a) On the all-star
team in two (expansive) or three (restrictive) of past 3 seasons, OR (b) In the top 1% in a major
statistical category two times (quarterbacks and kickers, or expansive) or three times (restrictive
for offense and defense) in past 3 seasons, OR (c) Received one major award in past 3 seasons
(both).
National Hockey League. NHL Stars were (a) On the all-star team in two or three of past
3 seasons,10 OR (b) In the top 5% in a major statistical category two times (once for goalies)
(expansive) or three times (two times for goalies) (restrictive) in past 3 seasons, OR (c) Received
one major award in past 3 seasons. NHL Superstars were (a) On the all-star team in two or three
of past 3 seasons, OR (b) In the top 1% in a major statistical category once (expansive) or two
times (once for goalies) (restrictive) in past 3 seasons, OR (c) Received two major awards in past
3 seasons.
In addition to the stock of exceptional performers available to each team, I define eight
turnover variables for each team: Number of stars/superstars acquired pre-season, Number of
stars/superstars lost pre-season, Number of stars/superstars acquired mid-season, Number of
stars/superstars lost mid-season. A player may be lost to/acquired by a team pre-season if he is
traded, lost or signed through free agency, retires, is released, or is otherwise unavailable (e.g., is
in jail). It is not uncommon for a team to trade a good player to a more successful team mid-
season if that player would be a free agent at the end of the season, especially if the team sending
the star to another team has little chance of reaching the playoffs that year.
3.2 Definition of Profit
The second step is to estimate the effect of stars and superstars on firm (and team)
profitability. I take two approaches – (1) estimation using several different definitions of profits
(see the “Data” section below for the definitions and data sources) as a function of a number of
independent variables (noted below) and a count of stars and superstars on (adjusting for mid-
season trades), and flowing to and from the team, and (2) a ‘difference of differences’ approach
that looks at the year-to-year change in profits as a team acquires or loses a star or a superstar.
10 For the NHL, “past 3 seasons” excludes the lockout year of 2004-2005 and therefore includes the 2003-2004 season.
10
While the first can be estimated for all firms using data from the Economic Censuses; the latter
can be estimated only for single-unit firms (that is, those with one Employer Identification
Number) who are surveyed by the Service Annual Survey (SAS) in consecutive years.
One concern is the presence of endogeneity in that more highly profitable teams can
afford to outbid other teams for stars. As described above, this is mitigated in part by the leagues
themselves attempting to maintain competitive balance by imposing such strictures as “luxury
taxes”, payroll caps, etc. I adjust the profit measures for heterogeneity (see below).
Professional sports firms are classified into North American Industry Classification
System (NAICS) code 711211 (Sports teams and clubs), as businesses “primarily engaged in
participating in live sporting events, such as baseball, basketball, football, hockey, soccer, and jai
alai games, before a paying audience.” In 2007, there were 750 firms operating professional
sports teams or clubs, up from 621 in 2002 and 453 in 1997. Industry 711211 clearly includes
firms without franchises in the four sports leagues included in this study. Since worker
performance in those other sports will not be measured in this study, I exclude those firms from
the regression analysis.
Based on review of the literature, I hypothesize that profit is a function of the following
factors, cumulated over all teams owned by the firm when applicable.
1. Team won/loss record, including lagged values, and playoff appearances and league
championships in the previous 2 years (better past performance leading to more season
ticket sales, higher attendance, and greater profits). A contemporaneous measure and a 1-
year lag are used; 2- and 3-year lagged winning percentages added no explanatory power.
2. Number of playoff games played that year (leading to more gate revenue and higher profits).
3. If a firm owns a team in more than one league (no one firm may own more than one team
per league), and which leagues the teams are in. As noted earlier in the text, reliance on
teammates can help determine the success of a star, and since player interaction varies by
sport (see Berman et al. 2002), the league could well affect the profitability of the firm, as
would other characteristics of the sport. Also, MLB has substantial expenses for minor
league player development and the other leagues do not. Owning multiple teams could affect
profitability in that the teams could share facilities (such as the playing arena).
4. How the arena was financed (specifically, were public funds used). The extent of public
financing varies greatly across teams. The complexity of arrangements and the
inaccessibility of complete documentation precluded the specification of a more complex
variable indicating the extent of public versus private financing or the allocation of revenue
for ticket sales, concessions, and the like.
11
5. When the arena was built or substantially renovated (a proxy for fan amenities and the
opportunity for owner profit such as through luxury suites, with younger age likely leading
to higher profits).
6. Whether the firm engages in non-sports businesses, measured by whether the firm has more
than one establishment (subdivided into firms with tow or three and those with four or
more).
7. Market size, measured as metropolitan area population and per capita personal income, with
a larger and richer fan base likely leading to higher profits.11
8. Whether there is competition for fans, measured by whether there is another team in the
same metropolitan area in the same league.12
9. Recent material change of ownership in the past 3 years.
10. Presence and number of “stars” and “superstars”, and possibly the flow of stars, not just the
stock.
In exploratory regressions, I included three other variables – bankruptcy or league takeover of
the team, franchise relocation, or league entry in the past 5 years. They had no effect on profits;
further they serve to uniquely identify just a few teams and so are excluded from the regressions
to improve disclosure avoidance. Lockouts or strikes could affect revenue and profit. However,
in the 2003-2008 period, there was only one – a lockout for the entire 2004-2005 NHL season
– so the NHL dummy variable will capture any effects of that lockout.
Similarly, change in profit from one year to the next may also be related to changes in
some variables, but is possibly also related to the acquisition or loss of stars and superstars
between or during those years.
4. DESCRIPTION OF THE DATA
The 2007 Census of Services (CS) has measures of employment, revenue (sales), and
total annual payroll, but not other expenses.13 Some recent studies using CS microdata include
Dunne et al. (2009) on dentistry and chiropractic services, Garicano and Hubbard (2009) on
law firm specialization, Arzaghi et al. (2012) and Silk and King (2013) on the advertising and
11 MacDonald and Reynolds (1994) used metropolitan area total personal income. I include both per capita income and population as independent variables. 12 The presence of sports teams in the same metropolitan area in other leagues did not affect profits in exploratory regression estimates. 13 For the Economic Censuses and the Census Bureau’s annual economic surveys, reported values, tax records, past reports, and expert judgment are all used by Census Bureau analysts to edit the microdata and impute missing values in the file. The rate of imputation is low. For teams in the sample, the imputation rates for sales, annual payroll, and employment are 10.2, 11.1, and 13.0 percent, respectively. The microdata from the Economic Censuses and business surveys such as the Service Annual Survey are available on a restricted basis at the Census Bureau Research Data Centers.
12
marketing services industry, Carnahan et al. (2012) on mobility in the legal services industry,
and Limehouse and McCormick (2011) on law firm location. Microdata from the other Economic
Censuses are available for firms with establishments outside the service sector. For the 109 firms
with establishments in industry 711211, profit will be defined using CS data as revenue minus
labor cost, or “Non-Labor Surplus” (NLS) for all establishments that are part of the firm. These
regressions will also be carried out for the 105 teams for which it was possible to identify their
individual microdata.
Microdata from the Service Annual Survey (SAS) are not as widely used (Silk and King
2013 is the sole recent reference) but have the distinct advantage of allowing the researcher to
define profit as operating revenue minus operating expenses, including payroll, rather than as
operating revenue minus payroll alone, coupled with the disadvantages of a smaller sample size
and no measure of employment. NLS is measured using 2007 SAS data in an attempt to
replicate CS results, and also for 2008, and then the broader measure of profit is estimated for
the same years, and in a difference equation (change in profit from 2007 to 2008). There were
30 teams in the 2007 CS and also in the 2007 and 2008 SAS. Since the SAS is a survey of service
industries, survey information on non-service sector establishments in all the firms is not
available, so the analysis of SAS data focuses on team-level data. I attempted to create a third
measure of profit by matching in data on depreciation/amortization from the 2007 Annual
Capital Expenditures Survey (ACES). Too few firms in the ACES were also in the SAS sample to
proceed.
Since the regressions might be skewed by the presence of both small and large firms, I
normalize the profit measures in two ways: NLS or profit per employee, and NLS or profit as a
proportion of revenue. Since SAS does not collect employment data, CS employment is used for
normalization of the SAS-based NLS and profit measures.
5. RESULTS
5.1 Background Information
The Standard Statistical Establishment List was used to determine that the 109 firms
that owned the 114 U.S. teams had 1,962 establishments in 2007. Of these, there are no data
available at the Census Bureau for three agricultural establishments. Table 1 shows the
distribution of the remaining 1,959 establishments by firm size. There were only three very large
firms (with more than 100 establishments), and 66 of the 109 firms had only one establishment.
Multi-establishment firms include both multi-unit firms (that is, firms reporting data for more
than one Employer Identification Number) and single-unit firms that have more than one
13
establishment. Note that it is only the large firms with more than 20 establishments that operate
in more than five two-digit NAICS sectors on average (of 17); many multi-establishment firms
operate in just a small number of sectors.
Table 2 shows the summary statistics for the two untransformed dependent variables, for
the CS sample of 109 firms, for the CS sample of 105 teams, and for the SAS sample of 30 teams.
Firms with at least one sports team had average revenue of $631 million but median revenue of
only $177 million (results of the skewed distribution shown in Table 1). Their non-labor surplus
(NLS) was 38 percent of sales, and NLS per employee was $216 thousand. When the sample is
restricted to teams, sales are naturally on average lower, but there is reasonable agreement
between the CS estimates for the 105-team CS sample and the estimates for the 30-team (SAS)
sample ($156 million and $159 million in average sales, respectively; $155 and $163 million for
median sales).14 Mean and median NLS as percent of sales also match closely, as does NLS per
employee. Sales estimates from the SAS for the SAS sample are slightly lower than for the same
firms from the CS but are reasonably close ($151 million versus $159 million at the mean and
$154 million versus $163 million at the median, for the CS and SAS data respectively; labor costs
are close). In contrast, profit for these teams in the SAS sample is widely variable and negative
on average (recall that some firms may accept negative profits for their teams if other firm-
owned establishments benefit), but profits improve between 2007 and 2008. The 30-team SAS
sample may not be representative of all teams, but these comparison suggest that further work
with the smaller sample and the SAS data is not likely to be misleading.
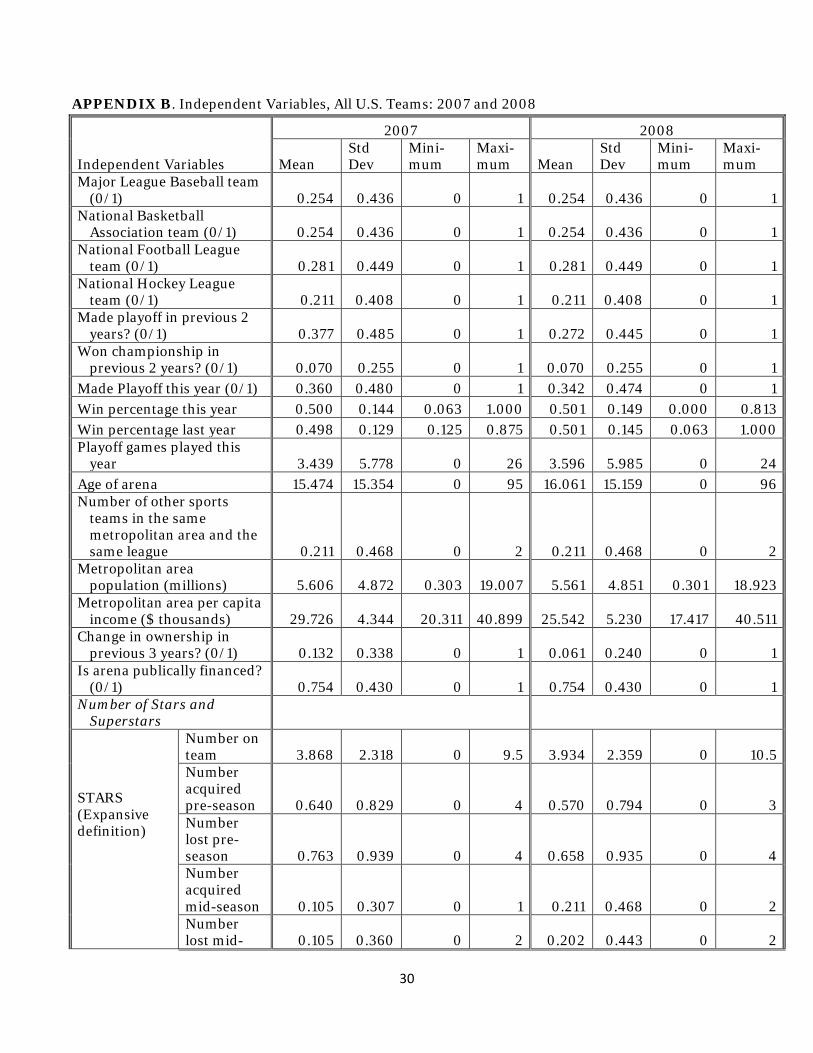
Section 3 described the variables I hypothesized might affect profit. I obtained
information for all the independent variables from public records; the ones included in the
estimation are shown in Appendix B, which includes summary statistics for 2007 and 2008 for
these variables and the variables that characterize stars and superstars for the full sample of 114
U.S. teams.15 There are no particular surprises in these data (for example, the average team won
half its games). The average team played in 3.4 playoff games in 2007, but the range was from 0
14 USA Today publishes an estimated player payroll for all teams in the sample but one (see, for example, <http://content.usatoday.com/sportsdata/football/nfl/salaries/team>). For the 104 teams identified, the mean ratio of USA Today estimated player payroll to Census of Services annual payroll was 0.75 with a relatively low standard deviation of 0.25. However, there were five teams for which the estimated payroll exceeded the CS payroll. This discrepancy can be result of many factors, among them one noted for NFL players: “contracts are not guaranteed and [the player] may not have received the entire amount” specified in his contract, and the more general comment that “Total team payrolls can also fluctuate significantly from year to year, depending on how a team accounts for its players’ base salaries, bonuses, etc.” When the regressions reported below were estimated for the 100 teams whose CS annual payroll did not exceed the USA Today estimated payroll, no coefficient was significantly different between the regressions for the 100-team and the 105-team samples. 15 For the five pairs of teams owned by firms, new variables are constructed for the firm regressions that sum or average the data across the teams as appropriate.
14
to 26; more games presumably means more profit. In 2007, the average team played in an arena
that was 15 years old, 75 percent of stadiums and arenas were publically financed, and 13
percent of sports teams had had a change of ownership in the previous 3 years.
Using the restrictive definition for stars and superstars, the typical team had 2.7 stars
and 1.1 superstars in 2007, though the former ranged from 0 to 8, and the latter from 0 to 5.
There is not a lot of mobility from team to team, with an average team gaining or losing 0.4 stars
pre-season and 0.05 stars mid-season (the figures for superstars are even lower of course, at 0.2
and 0.03, respectively). Even though this lack of mobility might make it difficult to find
significant results for the flow variables, the regressions with only stock variables (number of
starts and superstars) explained a significant fraction of the variance in NLS for the CS sample
only for one team-level regression (and no firm-level regression). Once the flow variables are
included, all four regressions explain a significant fraction of the variance; thus, the regressions
described below contain both stock and flow stardom variables.
5.2 Effect of Stardom on Profitability
Presented first are the NLS regressions for the full sample of 109 firms. Then I discuss
the results for the team-level NLS regressions. This is followed by a discussion of the SAS
sample results for the NLS and profit measures.
Table 3 presents the results for the firm-level regressions using the Economic Census
data.16 The R2 are reasonably high (0.37 and 0.44) for cross-section regressions. Few
explanatory variables other than stardom-related ones had significant coefficients: firms with
more than three establishments, firms with higher metropolitan populations, and firms with
lower 2006 winning percentages had higher NLS as a proportion of sales. Adding the stardom
flow variables significantly increased the explanatory power of the independent variables (the
stock variables alone did not). Several stardom characteristics had significant coefficients in the
NLS per employee regression; the NLS as a proportion of sales regression had none. A number
of measures of stardom do significantly affect NLS per employee. Stars acquired pre-season and
stars lost mid-season have the expected effect (positive and negative, respectively) on NLS per
employee. There are unexpected results for superstars at the firm level, however. The number of
superstars acquired (lost) pre-season reduces (increases) NLS per employee (the opposite of
expectations). This is not the result of teams shedding their roster of stars in favor of superstars
and neither is it the result of acquiring superstars by trade versus free agency.17
16 The restrictive-restrictive definition of stardom had the best fit and the highest number of significant stardom variables. 17 When the variable superstars acquired pre-season is split between the two sources, the estimated coefficients are not different; all superstars acquired mid-season are through trades.
15
Due to the potential for multi-collinearity and the fact that six of the eight omitted
Canadian teams are hockey teams, more parsimonious specifications for regressions at the team
level stratified by league were used to choose the best stardom definition for use in the pooled
team regressions, based on best goodness of fit. The highest R2s were found for the following
combinations – restrictive for stars for all leagues except the NBA, and expansive for superstars
for all leagues except the NFL.
Table 4 presents the results for the team-level regressions using the CS data and the
empirically determined stardom definitions. Some team-level independent variables now have
some effect on both measures of NLS. NFL teams make higher profit than any of the other
leagues ceteris paribus, with the hierarchy being NFL (highest NLS), MLB, NBA, NHL (lowest).
If a team is part of a firm that owns more than one team, NLS per employee is higher (but not
NLS as a percent of sales).
Seven of the ten stardom variables are significant in the NLS per employee regression,
and two of ten for the NLS as a proportion of sales regressions. In accordance with expectations,
the number of stars and the number of superstars acquired pre-season both increase both
measures of NLS, and the number of stars lost pre-season decreases and the number of
superstars acquired mid-season increases NLS per employee. There are some unexpected
results, however – the number of superstars decreases, the number of stars acquired (lost) mid-
season decreases (increases) NLS per employee and the number of stars acquired pre-season
decreases NLS as a proportion of sales.
Table 5 presents the marginal effects of selected stardom variables for the 109 firms and
the 105 teams evaluated at the means of the other variables. As noted earlier, adding a star pre-
season adds to firm-level NLS per employee – an estimated $174 thousand per employee – but
not to NLS as a proportion of sales. Also as noted, adding a superstar pre-season or mid-season
reduces firm-level NLS per employee –by $69 thousand and $200 thousand, respectively.
Similarly, losing a superstar increases NLS per employee at the firm level, both pre-season and
mid-season, by $363 and $328 thousand, respectively. Note however that all these are 1-year
effects and may not persist. That is, longer-term changes in NLS could be different.
Estimates of the overall effect at the team level differ from the firm-level estimates.
Adding a superstar pre-season increases NLS per employee for teams by $58 thousand, and NLS
as a proportion of sales by 4.8 percentage points and losing a superstar pre-season decreases
NLS per employee by $345 thousand and NLS as a proportion of sales by 13.4 percentage points.
The results from focusing on the 30 teams represented in the Service Annual Survey data
are broadly consistent with the findings presented so far (see Appendix C). The ranking of the
16
leagues in terms of NLS and profit per employee and as a proportion of sales stays the same:
NFL>MLB>NBA>NHL (though MLB is not significantly less than the NFL, and the NHL is not
significantly less than the NBA). Making the playoffs in the previous 2 years reduces NLS and
profit in the current year, and a higher current win percentage increases NLS and profit. With
respect to the stardom variables, the number of stars and the number of stars acquired pre-
season have positive and negative effects, respectively, for 2007 for both NLS and profit per
employee, but had no effect in 2008 (when mean and median profit was close to zero). The
number of superstars lost pre-season increased NLS and profit as a proportion of sales in 2007
and 2008, respectively.
Table 6 examines the change in NLS and profit from 2007 to 2008, using a reduced set
of independent variables that focus on change. Increases in the number of playoff games
increases both NLS and profit per employee. No stardom variables are significant in any of the
four regressions, though consistency of the signs of the coefficients across the four regressions
are suggestive. The higher the number of stars acquired pre-season, the lower is the increase in
NLS and profit, while the reverse is true of the number of superstars acquired pre-season.
6. CONCLUSIONS
The investigations in this paper provide only limited support for the hypothesis that
hiring talented individuals (stars) will increase a firm’s profit. Moreover, there is not
convincing support for the incremental benefit of hiring superstars.
At the firm level, the number of stars acquired pre-season increases Non-Labor Surplus
(sales minus annual payroll, or NLS) per employee, and the number of stars lost mid-season
reduces that NLS measure. At the sample means of sales and employees, this means a 1-year
increase in NLS at the firm level of $174 million per employee from adding a star and a loss of
$7 million per employee from losing a star. A puzzling result was found for superstars at the
firm level however. The number of superstars acquired (lost) pre-season reduces (increases)
NLS per employee (the opposite of expectations).
At the team level, the number of stars increases and the number of superstars reduces
NLS per employee. However, the number of superstars acquired pre-season increases both
measures of NLS for teams. For the smaller SAS sample using SAS data, however, the number of
stars increases and the number of stars acquired pre-season reduces both NLS and profit per
employee for teams. A much smaller sample was used to examine the change in profits (sales
minus operating expenses) from 2007 to 2008. In those regressions, no stardom variables were
significant.
17

The robustness of the findings could be supported by repeating the analysis using many
more years of data; that research is theoretically possible at least as far back as the 1997
Economic Censuses (the first coded into the NAICS classification system), and 2002, and
forward to 2012. The major constraint is the availability of team and player statistics as
independent variables. While in principle available on the major sports websites, these data are
either difficult to access and download in bulk.18 The data preparation of team and player
statistics for just the 4 years covered by the study took several weeks of detailed work.
Unfortunately, data resellers charge substantial amounts (I was quoted “six figures”), making
further historical analysis impracticable.
Another robustness check would be to repeat the analysis taking account of the multiyear
nature of player contracts. Firms might hire superstars without the expectation of an immediate
return, but rather a stream of additional revenue over several years. Further, since success in
these sports leagues requires complementary players, it might take some time to acquire the
players needed to complement the superstars’ skills. It would be possible to cumulate revenue,
sales, and non-labor operating expenses over several years of the Service Annual Survey to
examine this alternative, albeit for a small sample of teams (not firms), reducing the
generalizability of a multiyear study.
Is this result – that firms can make extra profits by hiring stars (and perhaps superstars)
– broadly applicable to other industries? It almost goes without saying that it is worth hiring a
“star” worker if the business owner can pay that worker less than his or her marginal revenue
product (MRP). But, for major league sports, it is perhaps the institutional constraints on entry
(the player draft) that keep salaries of new players down until they can become free agents that
can permit such firms to make extra profit in the short-term beyond the MRP. Perhaps the
perverse finding for superstars (that a firm would lose money, at least in the short-term by
acquiring a superstar) is an outcome of free agency, whereby underpaid superstars try to extract
high salaries, but this could be part of a long-term strategy by the firm to profit maximize. So
pending further research applying this same approach, I would be hesitant to apply this finding
across industries.
18 As of 2014, MLB website provides annual statistics back to 1876, the NBA back to 1996-1997, the NFL back to 1932, and the NHL back to 1997-1998.
18
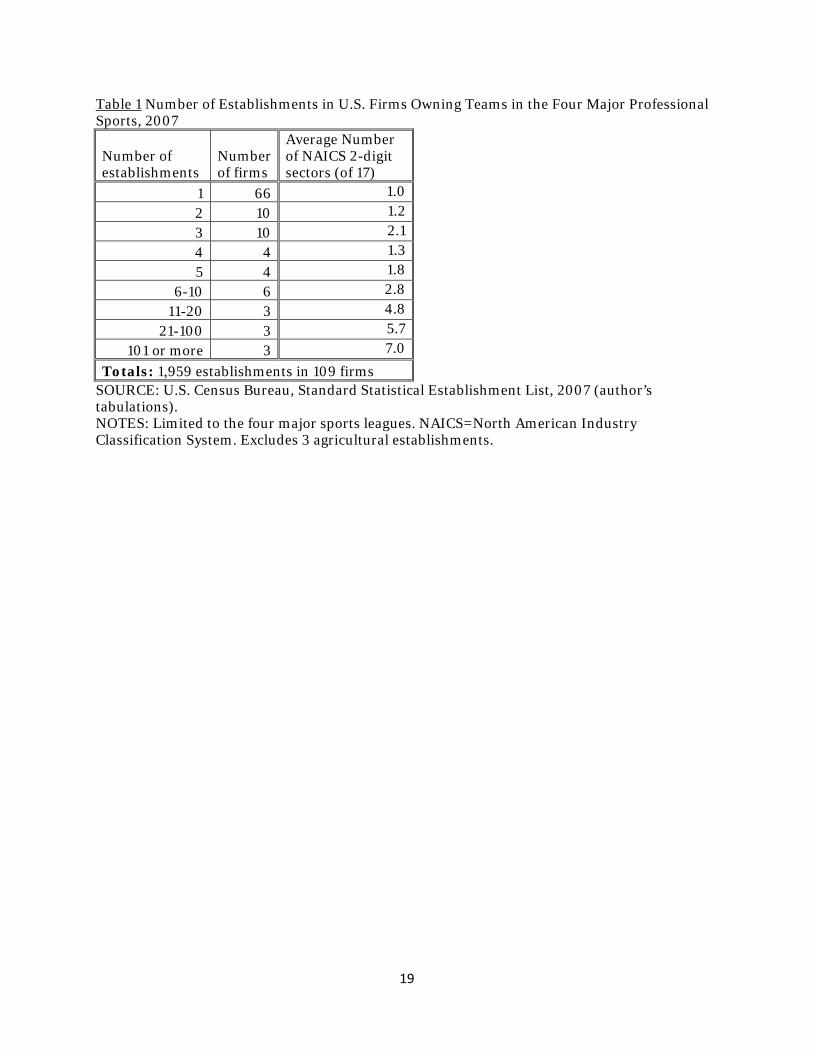
Table 1 Number of Establishments in U.S. Firms Owning Teams in the Four Major Professional Sports, 2007
Number of establishments
Number of firms
Average Number of NAICS 2-digit sectors (of 17)
1 66 1.0 2 10 1.2 3 10 2.1 4 4 1.3 5 4 1.8
6-10 6 2.8 11-20 3 4.8
21-100 3 5.7 101 or more 3 7.0
Totals: 1,959 establishments in 109 firms SOURCE: U.S. Census Bureau, Standard Statistical Establishment List, 2007 (author’s tabulations). NOTES: Limited to the four major sports leagues. NAICS=North American Industry Classification System. Excludes 3 agricultural establishments.
19
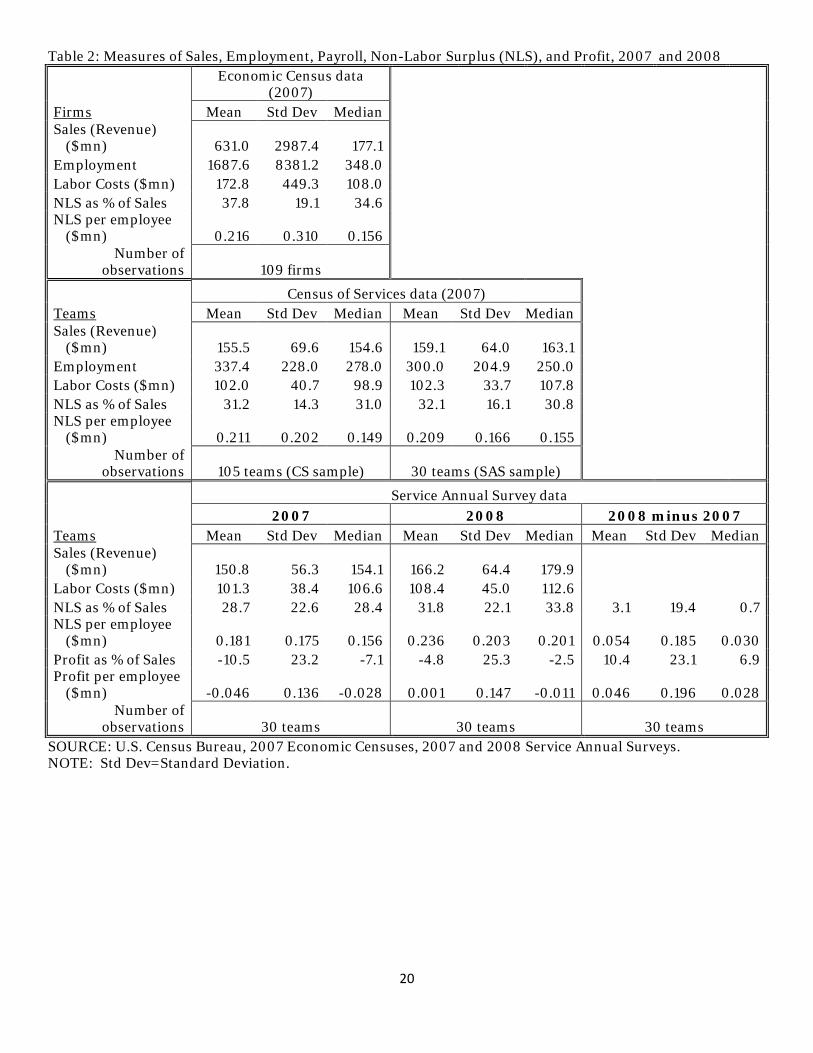
Table 2: Measures of Sales, Employment, Payroll, Non-Labor Surplus (NLS), and Profit, 2007 and 2008
Economic Census data
(2007) Firms Mean Std Dev Median
Sales (Revenue) ($mn) 631.0 2987.4 177.1
Employment 1687.6 8381.2 348.0
Labor Costs ($mn) 172.8 449.3 108.0
NLS as % of Sales 37.8 19.1 34.6
NLS per employee
($mn) 0.216 0.310 0.156
Number of
observations 109 firms
Census of Services data (2007)
Teams Mean Std Dev Median Mean Std Dev Median
Sales (Revenue) ($mn) 155.5 69.6 154.6 159.1 64.0 163.1
Employment 337.4 228.0 278.0 300.0 204.9 250.0
Labor Costs ($mn) 102.0 40.7 98.9 102.3 33.7 107.8
NLS as % of Sales 31.2 14.3 31.0 32.1 16.1 30.8
NLS per employee
($mn) 0.211 0.202 0.149 0.209 0.166 0.155
Number of
observations 105 teams (CS sample) 30 teams (SAS sample)
Service Annual Survey data 2007 2008 2008 minus 2007 Teams Mean Std Dev Median Mean Std Dev Median Mean Std Dev Median Sales (Revenue)
($mn) 150.8 56.3 154.1 166.2 64.4 179.9 Labor Costs ($mn) 101.3 38.4 106.6 108.4 45.0 112.6 NLS as % of Sales 28.7 22.6 28.4 31.8 22.1 33.8 3.1 19.4 0.7 NLS per employee
($mn) 0.181 0.175 0.156 0.236 0.203 0.201 0.054 0.185 0.030 Profit as % of Sales -10.5 23.2 -7.1 -4.8 25.3 -2.5 10.4 23.1 6.9 Profit per employee
($mn) -0.046 0.136 -0.028 0.001 0.147 -0.011 0.046 0.196 0.028 Number of
observations 30 teams 30 teams 30 teams SOURCE: U.S. Census Bureau, 2007 Economic Censuses, 2007 and 2008 Service Annual Surveys. NOTE: Std Dev=Standard Deviation.
20
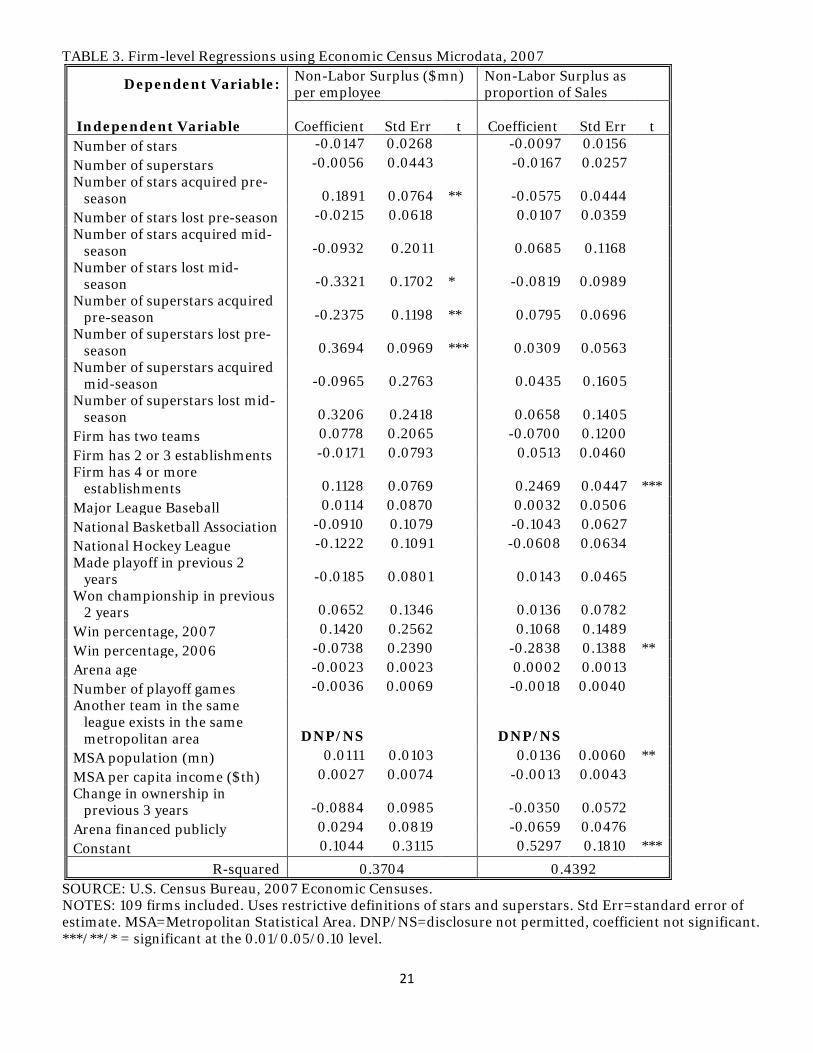
TABLE 3. Firm-level Regressions using Economic Census Microdata, 2007
Dependent Variable: Non-Labor Surplus ($mn) per employee
Non-Labor Surplus as proportion of Sales
Independent Variable
Coefficient Std Err t
Coefficient Std Err t Number of stars -0.0147 0.0268
-0.0097 0.0156
Number of superstars -0.0056 0.0443
-0.0167 0.0257 Number of stars acquired pre-
season 0.1891 0.0764 ** -0.0575 0.0444 Number of stars lost pre-season -0.0215 0.0618
0.0107 0.0359
Number of stars acquired mid-season -0.0932 0.2011
0.0685 0.1168
Number of stars lost mid-season -0.3321 0.1702 * -0.0819 0.0989
Number of superstars acquired pre-season -0.2375 0.1198 ** 0.0795 0.0696
Number of superstars lost pre-season 0.3694 0.0969 *** 0.0309 0.0563
Number of superstars acquired mid-season -0.0965 0.2763
0.0435 0.1605
Number of superstars lost mid-season 0.3206 0.2418
0.0658 0.1405
Firm has two teams 0.0778 0.2065
-0.0700 0.1200 Firm has 2 or 3 establishments -0.0171 0.0793
0.0513 0.0460
Firm has 4 or more establishments 0.1128 0.0769 0.2469 0.0447 ***
Major League Baseball 0.0114 0.0870
0.0032 0.0506 National Basketball Association -0.0910 0.1079
-0.1043 0.0627
National Hockey League -0.1222 0.1091
-0.0608 0.0634 Made playoff in previous 2
years -0.0185 0.0801
0.0143 0.0465 Won championship in previous
2 years 0.0652 0.1346
0.0136 0.0782 Win percentage, 2007 0.1420 0.2562
0.1068 0.1489
Win percentage, 2006 -0.0738 0.2390
-0.2838 0.1388 ** Arena age -0.0023 0.0023
0.0002 0.0013
Number of playoff games -0.0036 0.0069
-0.0018 0.0040 Another team in the same
league exists in the same metropolitan area DNP/NS
DNP/NS
MSA population (mn) 0.0111 0.0103
0.0136 0.0060 ** MSA per capita income ($th) 0.0027 0.0074
-0.0013 0.0043
Change in ownership in previous 3 years -0.0884 0.0985
-0.0350 0.0572
Arena financed publicly 0.0294 0.0819 -0.0659 0.0476 Constant 0.1044 0.3115
0.5297 0.1810 ***
R-squared 0.3704 0.4392 SOURCE: U.S. Census Bureau, 2007 Economic Censuses.
NOTES: 109 firms included. Uses restrictive definitions of stars and superstars. Std Err=standard error of estimate. MSA=Metropolitan Statistical Area. DNP/NS=disclosure not permitted, coefficient not significant. ***/**/* = significant at the 0.01/0.05/0.10 level.
21
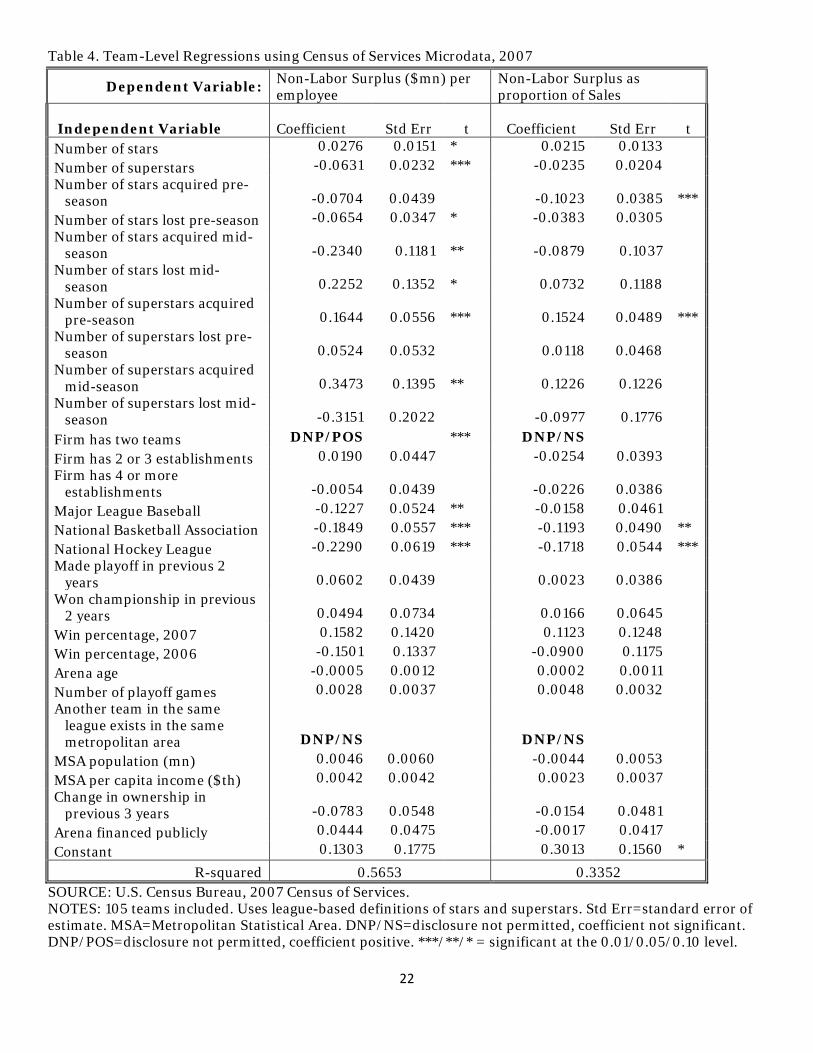
Table 4. Team-Level Regressions using Census of Services Microdata, 2007
Dependent Variable: Non-Labor Surplus ($mn) per employee
Non-Labor Surplus as proportion of Sales
Independent Variable Coefficient Std Err t Coefficient Std Err t
Number of stars 0.0276 0.0151 * 0.0215 0.0133 Number of superstars -0.0631 0.0232 *** -0.0235 0.0204 Number of stars acquired pre-
season -0.0704 0.0439 -0.1023 0.0385 *** Number of stars lost pre-season -0.0654 0.0347 * -0.0383 0.0305 Number of stars acquired mid-
season -0.2340 0.1181 ** -0.0879 0.1037 Number of stars lost mid-
season 0.2252 0.1352 * 0.0732 0.1188 Number of superstars acquired
pre-season 0.1644 0.0556 *** 0.1524 0.0489 *** Number of superstars lost pre-
season 0.0524 0.0532 0.0118 0.0468 Number of superstars acquired
mid-season 0.3473 0.1395 ** 0.1226 0.1226 Number of superstars lost mid-
season -0.3151 0.2022 -0.0977 0.1776 Firm has two teams DNP/POS *** DNP/NS Firm has 2 or 3 establishments 0.0190 0.0447 -0.0254 0.0393 Firm has 4 or more
establishments -0.0054 0.0439 -0.0226 0.0386 Major League Baseball -0.1227 0.0524 ** -0.0158 0.0461 National Basketball Association -0.1849 0.0557 *** -0.1193 0.0490 ** National Hockey League -0.2290 0.0619 *** -0.1718 0.0544 *** Made playoff in previous 2
years 0.0602 0.0439 0.0023 0.0386 Won championship in previous
2 years 0.0494 0.0734 0.0166 0.0645 Win percentage, 2007 0.1582 0.1420 0.1123 0.1248 Win percentage, 2006 -0.1501 0.1337 -0.0900 0.1175 Arena age -0.0005 0.0012 0.0002 0.0011 Number of playoff games 0.0028 0.0037 0.0048 0.0032 Another team in the same
league exists in the same metropolitan area DNP/NS DNP/NS
MSA population (mn) 0.0046 0.0060 -0.0044 0.0053 MSA per capita income ($th) 0.0042 0.0042 0.0023 0.0037 Change in ownership in
previous 3 years -0.0783 0.0548 -0.0154 0.0481 Arena financed publicly 0.0444 0.0475 -0.0017 0.0417 Constant 0.1303 0.1775 0.3013 0.1560 *
R-squared 0.5653 0.3352 SOURCE: U.S. Census Bureau, 2007 Census of Services. NOTES: 105 teams included. Uses league-based definitions of stars and superstars. Std Err=standard error of estimate. MSA=Metropolitan Statistical Area. DNP/NS=disclosure not permitted, coefficient not significant. DNP/POS=disclosure not permitted, coefficient positive. ***/**/* = significant at the 0.01/0.05/0.10 level.
22
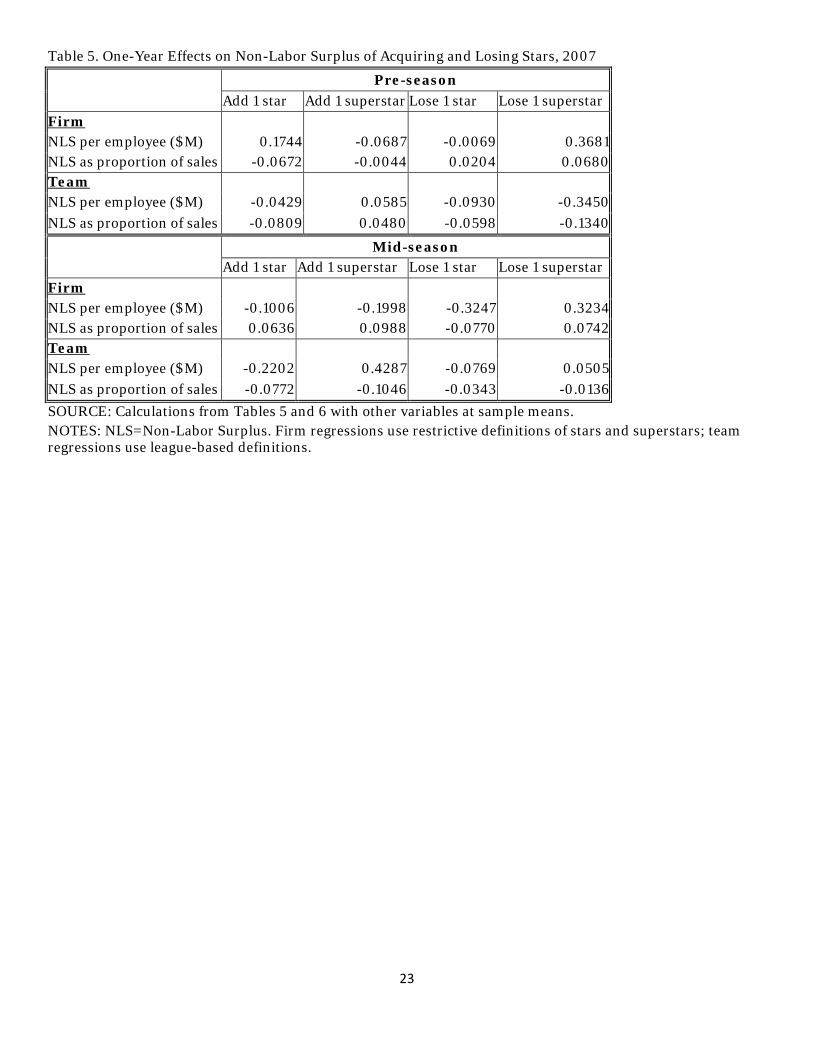
Table 5. One-Year Effects on Non-Labor Surplus of Acquiring and Losing Stars, 2007
Pre-season Add 1 star Add 1 superstar Lose 1 star Lose 1 superstar Firm NLS per employee ($M) 0.1744 -0.0687 -0.0069 0.3681 NLS as proportion of sales -0.0672 -0.0044 0.0204 0.0680 Team NLS per employee ($M) -0.0429 0.0585 -0.0930 -0.3450 NLS as proportion of sales -0.0809 0.0480 -0.0598 -0.1340
Mid-season Add 1 star Add 1 superstar Lose 1 star Lose 1 superstar Firm NLS per employee ($M) -0.1006 -0.1998 -0.3247 0.3234 NLS as proportion of sales 0.0636 0.0988 -0.0770 0.0742 Team NLS per employee ($M) -0.2202 0.4287 -0.0769 0.0505 NLS as proportion of sales -0.0772 -0.1046 -0.0343 -0.0136 SOURCE: Calculations from Tables 5 and 6 with other variables at sample means. NOTES: NLS=Non-Labor Surplus. Firm regressions use restrictive definitions of stars and superstars; team regressions use league-based definitions.
23
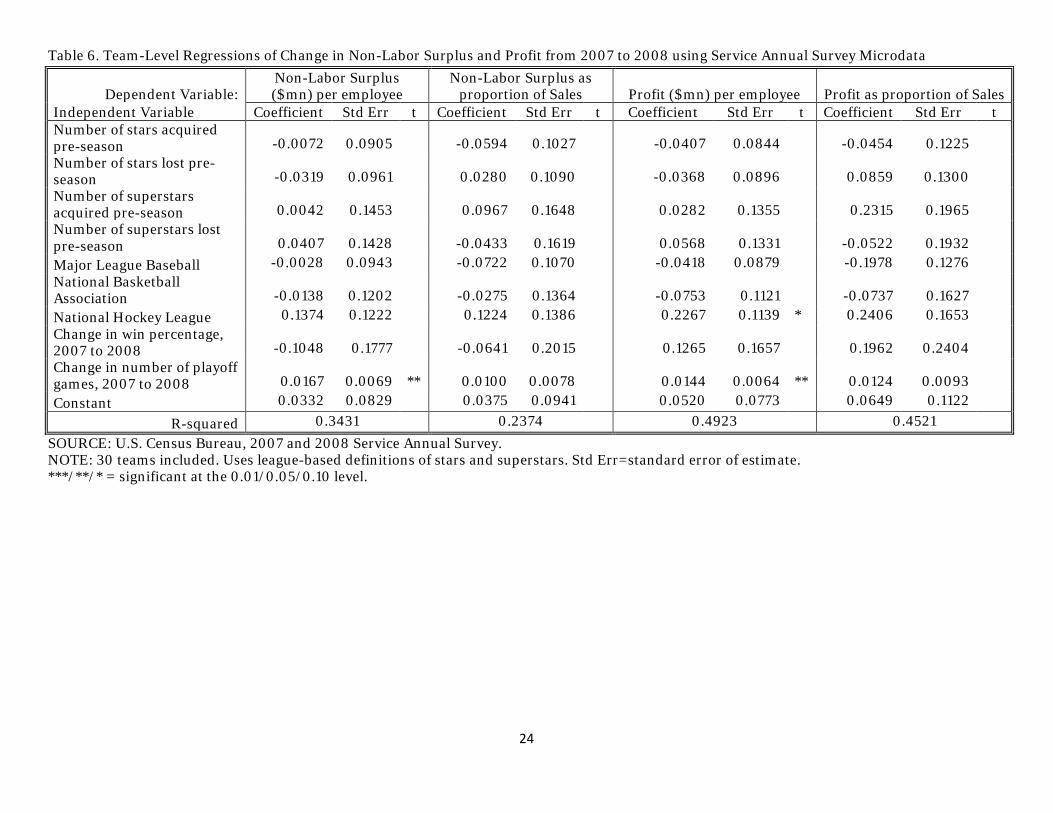
Table 6. Team-Level Regressions of Change in Non-Labor Surplus and Profit from 2007 to 2008 using Service Annual Survey Microdata
Dependent Variable: Non-Labor Surplus ($mn) per employee
Non-Labor Surplus as proportion of Sales Profit ($mn) per employee Profit as proportion of Sales
Independent Variable Coefficient Std Err t Coefficient Std Err t Coefficient Std Err t Coefficient Std Err t Number of stars acquired pre-season -0.0072 0.0905 -0.0594 0.1027 -0.0407 0.0844 -0.0454 0.1225 Number of stars lost pre-season -0.0319 0.0961 0.0280 0.1090 -0.0368 0.0896 0.0859 0.1300 Number of superstars acquired pre-season 0.0042 0.1453 0.0967 0.1648 0.0282 0.1355 0.2315 0.1965 Number of superstars lost pre-season 0.0407 0.1428 -0.0433 0.1619 0.0568 0.1331 -0.0522 0.1932 Major League Baseball -0.0028 0.0943 -0.0722 0.1070 -0.0418 0.0879 -0.1978 0.1276 National Basketball Association -0.0138 0.1202 -0.0275 0.1364 -0.0753 0.1121 -0.0737 0.1627 National Hockey League 0.1374 0.1222 0.1224 0.1386 0.2267 0.1139 * 0.2406 0.1653 Change in win percentage, 2007 to 2008 -0.1048 0.1777 -0.0641 0.2015 0.1265 0.1657 0.1962 0.2404 Change in number of playoff games, 2007 to 2008 0.0167 0.0069 ** 0.0100 0.0078 0.0144 0.0064 ** 0.0124 0.0093 Constant 0.0332 0.0829 0.0375 0.0941 0.0520 0.0773 0.0649 0.1122
R-squared 0.3431 0.2374 0.4923 0.4521 SOURCE: U.S. Census Bureau, 2007 and 2008 Service Annual Survey. NOTE: 30 teams included. Uses league-based definitions of stars and superstars. Std Err=standard error of estimate. ***/**/* = significant at the 0.01/0.05/0.10 level.
24

REFERENCES
Adler, Moshe. 1985. “Stardom and Talent.” American Economic Review 75(1): 208-12. Andersson, Frederik, Matthew Friedman, John Haltiwanger, Julia Lane, and Kathryn Shaw. 2009. “Reaching for the Stars: Who Pays for Talent in Innovative Industries?” Economic Journal 119: F308–32. Arzaghi, Mohammad, Ernst R. Berndt, James C. Davis, and Alvin J. Silk. 2012. “The Unbundling of Advertising Agency Services: An Economic Analysis.” Review of Marketing Science 10(1): Article 4. Berman, Shawn L. Jonathan Down, and Charles W.L. Hill. 2002. “Tacit Knowledge as a Source of Competitive Advantage in the National Basketball Association.” Academy of Management Journal 45(1): 13-31. Berri, David J. and Schmidt, Martin B. 2006. “On the Road with the National Basketball Association’s Superstar Externality.” Journal of Sports Economics 7(4): 347–58. Berri, David J., Martin B. Schmidt, and Stacey L. Brook. 2004. “Stars at the Gate: The Impact of Star Power on NBA Gate Revenues.” Journal of Sports Economics 5(1): 33-50. Brown, E., R. Spiro, and D. Keenan. 1991. “Wage and Non-wage Discrimination in Professional Basketball: Do Fans Affect It?” American Journal of Economics and Sociology 50(3): 333-345. Burdekin, R.C. and T.L. Idson. 1991. “Customer Preferences, Attendance, and the Racial Structure of Professional Basketball Teams.” Applied Economics 23: 179-186. Campbell, Benjamin A., Martin Ganco, April M. Franco, and Rajshree Agarwal. 2012. “Who Leaves, Where to, and Why Worry? Employee Mobility, Entrepreneurship, and Effects on Source Firm Performance.” Strategic Management Journal 33(1): 65-87. Carnahan, Seth, Rajshree Agarwal, Benjamin Campbell, and April Franco. 2012. “Heterogeneity in Turnover: The Effect of Relative Compensation Dispersion of Firms on the Mobility and Entrepreneurship of Extreme Performers.” Strategic Management Journal 33: 1411–1430. Clarke, Jonathan, Ajay Khorana, Ajay Patel, and P. Raghavendra Rau. 2007. “The Impact of All-star Analyst Job Changes on their Coverage Choices and Investment Banking Deal Flow.” Journal of Financial Economics 84(3): 713-737. Davis, Michael C. “New Franchise Location in Major- and Minor-League Baseball.” Chapter 8 in Brad R. Humphries and Dennis R. Howard (eds.) The Business of Sports Volume 3: Bridging Research and Practice. Westport CT: Praeger, 2008. Pp. 147-166. Dunne, Timothy, Shawn Klimek, Mark Roberts, and Yi Xu. 2009. “The Dynamics of Market Structure and Market Size in Two Health Services Industries.” In Timothy Dunne, J. Bradford Jensen, and Mark J.Roberts (eds.) Producer Dynamics: New Evidence from Micro Data. Chicago: University of Chicago Press for the National Bureau of Economic Research, pp. 303-327. Franck, Egon and Stephan Nüesch. 2012. “Talent and/or Popularity: What Does it Take to be a Superstar?” Economic Inquiry 50(1): 202-216. Frick, Bernd and Rob Simmons. “Pay and Performance of Players in Sports Leagues: International Comparisons.” Chapter 7 in Brad R. Humphries and Dennis R. Howard (eds.) The Business of Sports Volume 2: Economic Perspectives on Sport. Westport CT: Praeger, 2008, pp. 153-180. Gardner, Timothy M. 2005. “Interfirm Competition for Human Resources: Evidence from the Software Industry.” Academy of Management Journal 48(2): 237-256.
25

Garicano, Luis and Thomas N. Hubbard. 2009. “Specialization, Firms, and Markets: The Division of Labor within and between Law Firms.” Journal of Law, Economics, and Organization 25(2): 339-371. Gladwell, Malcom. 2011. “The Nets and NBA Economics.” At <http://grantland.com/features/the-nets-nba-economics/>; accessed 28 February 2014. Glenn, Andrew, Joseph P. McGarrity, and Jim Weller. 2001. “Firm-specific Human Capital, Job Matching, and Turnover: Evidence from Major League Baseball, 1900–1992.” Economic Inquiry 39(1): 86–93. Groysberg, Boris, Linda-Eling Lee, and Ashish Nanda. 2008. “Can They Take It With Them? The Portability of Star Knowledge Workers' Performance.” Management Science 54(7): 1213-1230. Hausman, Jerry A. and Gregory K. Leonard. 1997. “Superstars in the National Basketball Association: Economic Value and Policy.” Journal of Labor Economics 15(4): 586-624. Humphries, Brad R. and Dennis R. Howard. 2008. The Business of Sports. Volume 1: Perspectives on the Sports Industry. Westport CT: Praeger. Ichniowski, Casey and Anne E. Preston. 2012. “Does March Madness Lead to Irrational Exuberance in the NBA Draft? High-Value Employee Selection Decisions and Decision-Making Bias.” NBER Working Paper No. 17928, March. Kahn, Lawrence M. 2000, “The Sports Business as a Labor Market Laboratory.” Journal of Economic Perspectives 13(3): 75-94, Excerpted in Chapter 9 of Scott R. Rosner and Kenneth L. Shropshire (eds.) The Business of Sports. Boston: Jones and Bartlett, 2004. Pp. 242-251. Kouvet, Don. 1977. The Rich Who Own Sports. New York: Random House. Excerpted in Chapter 1 of Scott R. Rosner and Kenneth L. Shropshire (eds.) The Business of Sports. Boston: Jones and Bartlett, 2004, pp. 5-7. Krautmann, Anthony C. and Margaret Oppenheimer. 1994. “Free Agency and the Allocation of Labor in Major League Baseball.” Managerial and Decision Economics 15(5): 459–469. Lazear, Edward P. and Paul Oyer. 2007. “Personnel Economics.” NBER Working Paper 13480. October. Lazear, Edward P. and Kathryn L. Shaw. 2007. “Personnel Economics: The Economist’s View of Human Resources.” Journal of Economic Perspectives 21 (4): 91-114. Lenzi, Camilla. 2009, “Patterns and Determinants of Skilled Workers’ Mobility: Evidence from a Survey of Italian Inventors.” Economics of Innovation and New Technology 18 (2): 161-179. Lewis, Michael. 2003. Moneyball: The Art of Winning an Unfair Game. New York: W.W. Norton and Company. Limehouse, Frank, and Robert McCormick. 2011. “Impacts of Central Business District Location: A Hedonic Analysis of Legal Service Establishments.” U.S. Census Bureau Center for Economic Studies Discussion Paper CES-WP-11-21. July. MacDonald, Don N. and Morgan O. Reynolds. 1994. “Are Baseball Players Paid their Marginal Products?" Managerial and Decision Economics 5: 443–457. Mason, Daniel S. and Dennis R. Howard. 2008. “New Revenue Streams in Professional Sports.” Chapter 6 in Brad R. Humphries and Dennis R. Howard (eds.) The Business of Sports Volume 1: Perspectives on the Sports Industry. Westport CT: Praeger, 2008, pp. 125-151.
26
Oyer, Paul and Scott Schaefer. 2011. “Personnel Economics: Hiring and Incentives.” Chapter 20 in Orley Ashenfelter and David Card (eds.) Handbook of Labor Economics, Vol. 4B. Quirk, James and Rodney D. Fort. 1992. Pay Dirt: The Business of Professional Team Sports. Princeton University Press. Excerpted in Chapter 9 of Scott R. Rosner and Kenneth L. Shropshire (eds.) The Business of Sports. Boston: Jones and Bartlett, 2004, pp. 235-241. Rascher, Daniel A. “Franchise Relocations, Expansions, and Mergers in Professional Sports Leagues. In Brad R. Humphries and Dennis R. Howard (eds.) The Business of Sports Volume 2: Economic Perspectives on Sport. Westport CT: Praeger, 2008, pp. 67-105. Ravid, S. Abraham. 1999. “Information, Blockbusters, and Stars: A Study of the Film Industry.” Journal of Business 72(4): 463-492. Rosen, Sherwin. 1981. “The Economics of Superstars.” American Economic Review 71(5): 845-858. Rosner, Scott R. and Kenneth L. Shropshire (eds.). 2004. The Business of Sports. Boston: Jones and Bartlett. Scott, F., Jr., J. Long, and K. Sompii. 1985. “Salary vs. Marginal Revenue Product under Monopsony Competition: The Case of Professional Basketball.” Atlanta Economic Journal 13(3): 50-59. Shaw, Kathryn and Edward F. Lazear. 2008. “Tenure and Output.” Labour Economics 15: 705-724. Silk, Alvin, and Charles King III. 2013. “How Concentrated is the U.S. Advertising and Marketing Services Industry? Myth vs. Reality.” Journal of Current Issues and Research in Advertising 34(1): 166-193. Stewart, Kenneth G. and J.C.H. Jones. 2010. “Are Sports Teams Multiproduct Firms?” Empirical Economics 39(2): 487-514. Stroz, Eugene P., Jr. 2001. “Public Ownership of Sports Franchises: Investment, Novelty, or Fraud?” Rutgers Law Review 53(517), Winter. Excerpted in Chapter 1 of Scott R. Rosner and Kenneth L. Shropshire (eds.) The Business of Sports. Boston: Jones and Bartlett, 2004, pp. 15-20.
U.S. Census Bureau. 2000. 1997 Economic Census: Comparative Statistics [for United States: 1987 SIC Basis: Service Industries]. 1997 Economic Census Report EC97X-CS2. June; revised 2011. <http://www.census.gov/epcd/ec97sic/E97SUSI.HTM#I79>; accessed 13 February 2012. Yang, Yupin and Mengze Shi. 2011. “Rise and Fall of Stars: Investigating the Evolution of Star Status in Professional Team Sports.” International Journal of Research in Marketing 28(4): 352–366. Zimbalist, Andrew. 2011. Circling the Bases: Essays on the Challenges and Prospects of the Sports Industry. Philadelphia: Temple University Press. Zucker, Lynne G., Michael R. Darby, and Maximo Torero. 2002. “Labor Mobility from Academia to Commerce.” Journal of Labor Economics 20 (3): 629-660.
27
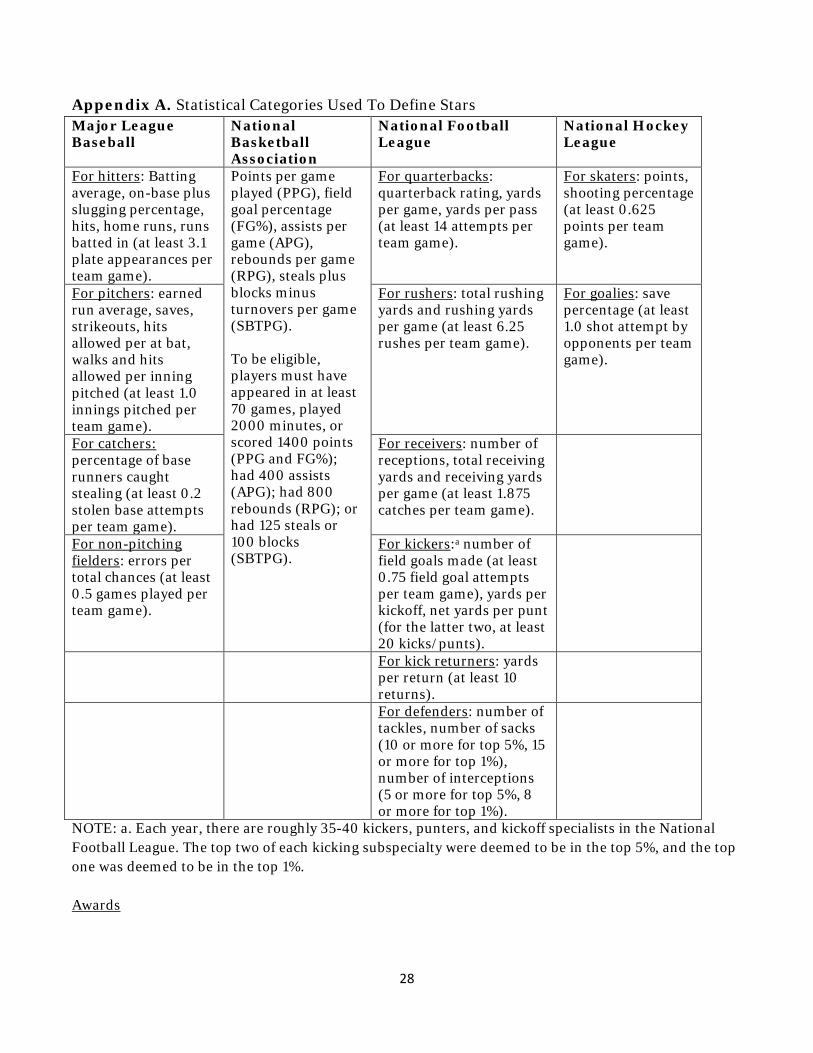
Appendix A. Statistical Categories Used To Define Stars Major League Baseball
National Basketball Association
National Football League
National Hockey League
For hitters: Batting average, on-base plus slugging percentage, hits, home runs, runs batted in (at least 3.1 plate appearances per team game).
Points per game played (PPG), field goal percentage (FG%), assists per game (APG), rebounds per game (RPG), steals plus blocks minus turnovers per game (SBTPG). To be eligible, players must have appeared in at least 70 games, played 2000 minutes, or scored 1400 points (PPG and FG%); had 400 assists (APG); had 800 rebounds (RPG); or had 125 steals or 100 blocks (SBTPG).
For quarterbacks: quarterback rating, yards per game, yards per pass (at least 14 attempts per team game).
For skaters: points, shooting percentage (at least 0.625 points per team game).
For pitchers: earned run average, saves, strikeouts, hits allowed per at bat, walks and hits allowed per inning pitched (at least 1.0 innings pitched per team game).
For rushers: total rushing yards and rushing yards per game (at least 6.25 rushes per team game).
For goalies: save percentage (at least 1.0 shot attempt by opponents per team game).
For catchers: percentage of base runners caught stealing (at least 0.2 stolen base attempts per team game).
For receivers: number of receptions, total receiving yards and receiving yards per game (at least 1.875 catches per team game).
For non-pitching fielders: errors per total chances (at least 0.5 games played per team game).
For kickers:a number of field goals made (at least 0.75 field goal attempts per team game), yards per kickoff, net yards per punt (for the latter two, at least 20 kicks/punts).
For kick returners: yards per return (at least 10 returns).
For defenders: number of tackles, number of sacks (10 or more for top 5%, 15 or more for top 1%), number of interceptions (5 or more for top 5%, 8 or more for top 1%).
NOTE: a. Each year, there are roughly 35-40 kickers, punters, and kickoff specialists in the National Football League. The top two of each kicking subspecialty were deemed to be in the top 5%, and the top one was deemed to be in the top 1%. Awards
28

MLB: Major MLB awards are: American/National League Most Valuable Player, Offensive Player of the
Year, Cy Young (best pitcher), Relief Pitcher (2004-6), Delivery Man of the Year (one for MLB,
2007). Minor MLB awards are: American/National League Gold Glove (best fielder at each
position), Silver Slugger (best offensive player at each position).
NBA: Most Valuable NBA Player and Defensive Player of the Year awardees were all members of the all-
NBA teams, so those awards are not included separately.
NFL: Major NFL awards are: Most Valuable Player, Offensive Player of the Year, Defensive Player of
the Year.
NHL: Major NHL awards are: Art Ross Trophy (Top Point Scorer), Conn Smythe Trophy (Most
Valuable Player in the Stanley Cup Playoffs), Frank J. Selke Trophy (Top Defensive Forward),
Hart Memorial Trophy (Most Valuable Player), James Norris Memorial Trophy (Top
Defenseman), Lester B. Pearson Award (Most Valuable Player as Selected by the NHL Players
Association), Vezina Trophy (Top Goalie).
29
APPENDIX B. Independent Variables, All U.S. Teams: 2007 and 2008
2007 2008
Independent Variables Mean Std Dev
Mini-mum
Maxi-mum Mean
Std Dev
Mini-mum
Maxi-mum
Major League Baseball team (0/1) 0.254 0.436 0 1 0.254 0.436 0 1
National Basketball Association team (0/1) 0.254 0.436 0 1 0.254 0.436 0 1
National Football League team (0/1) 0.281 0.449 0 1 0.281 0.449 0 1
National Hockey League team (0/1) 0.211 0.408 0 1 0.211 0.408 0 1
Made playoff in previous 2 years? (0/1) 0.377 0.485 0 1 0.272 0.445 0 1
Won championship in previous 2 years? (0/1) 0.070 0.255 0 1 0.070 0.255 0 1
Made Playoff this year (0/1) 0.360 0.480 0 1 0.342 0.474 0 1 Win percentage this year 0.500 0.144 0.063 1.000 0.501 0.149 0.000 0.813 Win percentage last year 0.498 0.129 0.125 0.875 0.501 0.145 0.063 1.000 Playoff games played this
year 3.439 5.778 0 26 3.596 5.985 0 24 Age of arena 15.474 15.354 0 95 16.061 15.159 0 96 Number of other sports
teams in the same metropolitan area and the same league 0.211 0.468 0 2 0.211 0.468 0 2
Metropolitan area population (millions) 5.606 4.872 0.303 19.007 5.561 4.851 0.301 18.923
Metropolitan area per capita income ($ thousands) 29.726 4.344 20.311 40.899 25.542 5.230 17.417 40.511
Change in ownership in previous 3 years? (0/1) 0.132 0.338 0 1 0.061 0.240 0 1
Is arena publically financed? (0/1) 0.754 0.430 0 1 0.754 0.430 0 1
Number of Stars and Superstars
STARS (Expansive definition)
Number on team 3.868 2.318 0 9.5 3.934 2.359 0 10.5 Number acquired pre-season 0.640 0.829 0 4 0.570 0.794 0 3 Number lost pre-season 0.763 0.939 0 4 0.658 0.935 0 4 Number acquired mid-season 0.105 0.307 0 1 0.211 0.468 0 2 Number lost mid- 0.105 0.360 0 2 0.202 0.443 0 2
30
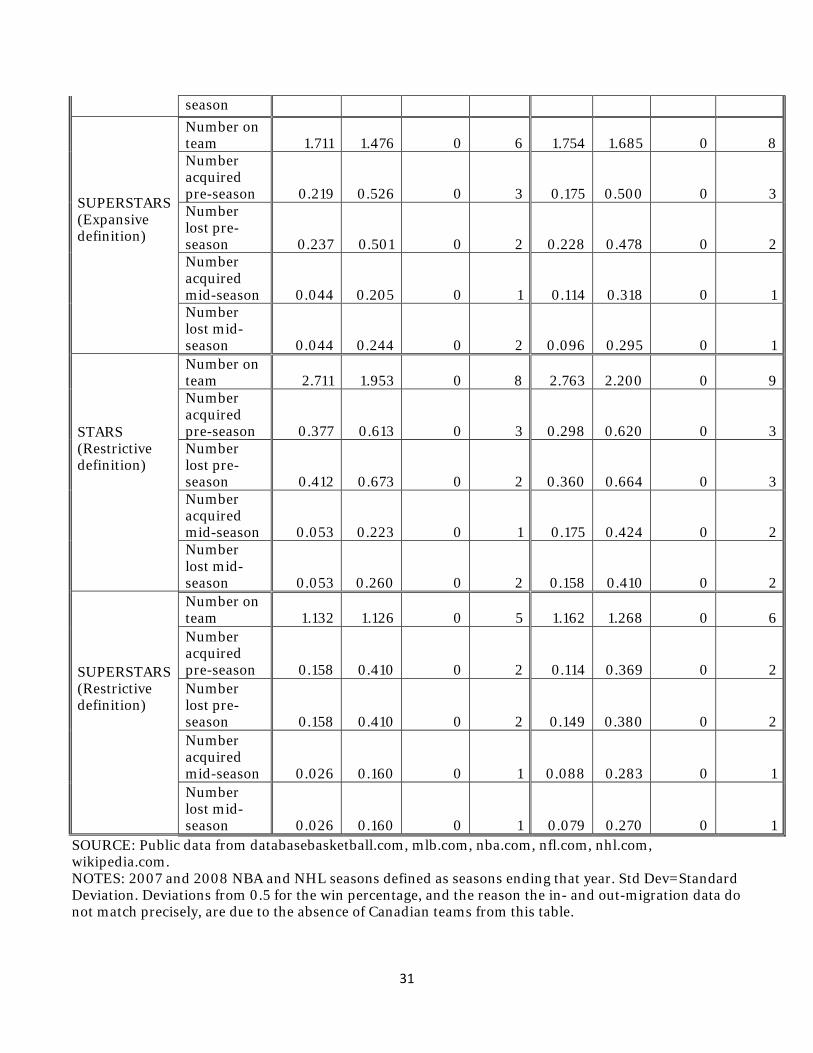
season
SUPERSTARS (Expansive definition)
Number on team 1.711 1.476 0 6 1.754 1.685 0 8 Number acquired pre-season 0.219 0.526 0 3 0.175 0.500 0 3 Number lost pre-season 0.237 0.501 0 2 0.228 0.478 0 2 Number acquired mid-season 0.044 0.205 0 1 0.114 0.318 0 1 Number lost mid-season 0.044 0.244 0 2 0.096 0.295 0 1
STARS (Restrictive definition)
Number on team 2.711 1.953 0 8 2.763 2.200 0 9 Number acquired pre-season 0.377 0.613 0 3 0.298 0.620 0 3 Number lost pre-season 0.412 0.673 0 2 0.360 0.664 0 3 Number acquired mid-season 0.053 0.223 0 1 0.175 0.424 0 2 Number lost mid-season 0.053 0.260 0 2 0.158 0.410 0 2
SUPERSTARS (Restrictive definition)
Number on team 1.132 1.126 0 5 1.162 1.268 0 6 Number acquired pre-season 0.158 0.410 0 2 0.114 0.369 0 2 Number lost pre-season 0.158 0.410 0 2 0.149 0.380 0 2 Number acquired mid-season 0.026 0.160 0 1 0.088 0.283 0 1 Number lost mid-season 0.026 0.160 0 1 0.079 0.270 0 1
SOURCE: Public data from databasebasketball.com, mlb.com, nba.com, nfl.com, nhl.com, wikipedia.com. NOTES: 2007 and 2008 NBA and NHL seasons defined as seasons ending that year. Std Dev=Standard Deviation. Deviations from 0.5 for the win percentage, and the reason the in- and out-migration data do not match precisely, are due to the absence of Canadian teams from this table.
31
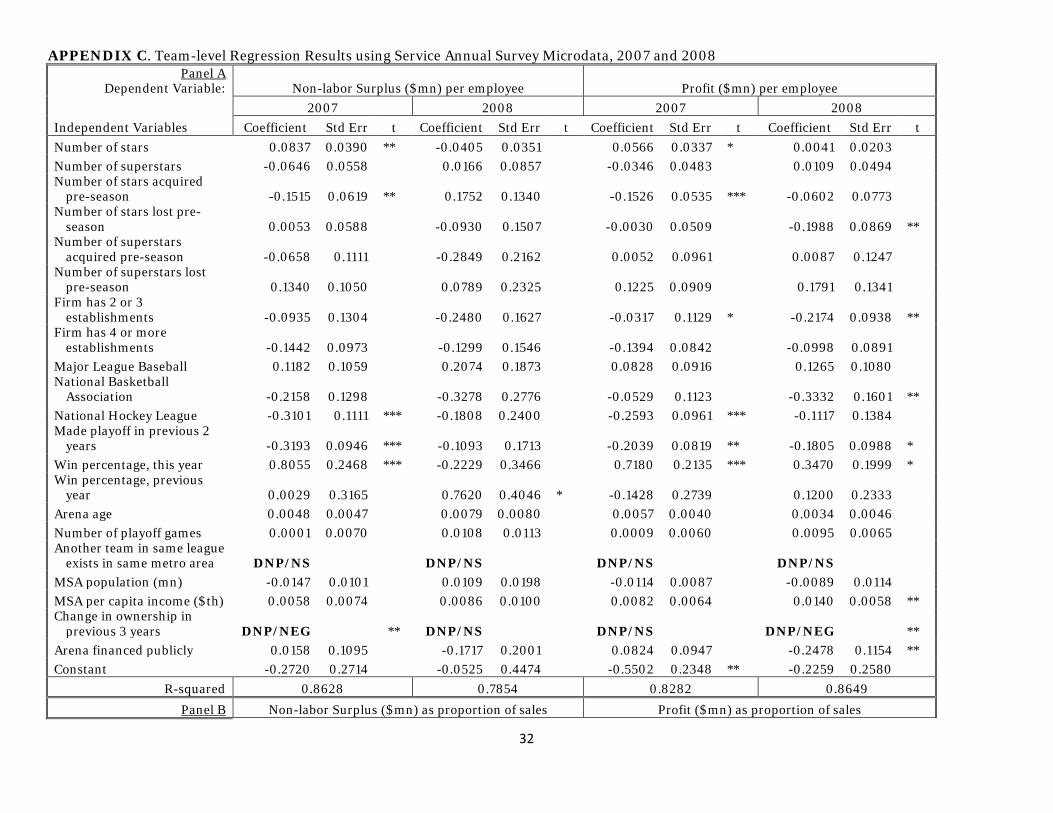
APPENDIX C. Team-level Regression Results using Service Annual Survey Microdata, 2007 and 2008 Panel A
Dependent Variable: Non-labor Surplus ($mn) per employee Profit ($mn) per employee
2007 2008 2007 2008
Independent Variables Coefficient Std Err t Coefficient Std Err t Coefficient Std Err t Coefficient Std Err t Number of stars 0.0837 0.0390 ** -0.0405 0.0351
0.0566 0.0337 * 0.0041 0.0203
Number of superstars -0.0646 0.0558
0.0166 0.0857
-0.0346 0.0483
0.0109 0.0494 Number of stars acquired
pre-season -0.1515 0.0619 ** 0.1752 0.1340
-0.1526 0.0535 *** -0.0602 0.0773 Number of stars lost pre-
season 0.0053 0.0588
-0.0930 0.1507
-0.0030 0.0509
-0.1988 0.0869 ** Number of superstars
acquired pre-season -0.0658 0.1111
-0.2849 0.2162
0.0052 0.0961
0.0087 0.1247 Number of superstars lost
pre-season 0.1340 0.1050
0.0789 0.2325
0.1225 0.0909
0.1791 0.1341 Firm has 2 or 3
establishments -0.0935 0.1304
-0.2480 0.1627
-0.0317 0.1129 * -0.2174 0.0938 ** Firm has 4 or more
establishments -0.1442 0.0973
-0.1299 0.1546
-0.1394 0.0842
-0.0998 0.0891 Major League Baseball 0.1182 0.1059
0.2074 0.1873
0.0828 0.0916
0.1265 0.1080
National Basketball Association -0.2158 0.1298
-0.3278 0.2776
-0.0529 0.1123
-0.3332 0.1601 **
National Hockey League -0.3101 0.1111 *** -0.1808 0.2400
-0.2593 0.0961 *** -0.1117 0.1384 Made playoff in previous 2
years -0.3193 0.0946 *** -0.1093 0.1713
-0.2039 0.0819 ** -0.1805 0.0988 * Win percentage, this year 0.8055 0.2468 *** -0.2229 0.3466
0.7180 0.2135 *** 0.3470 0.1999 *
Win percentage, previous year 0.0029 0.3165
0.7620 0.4046 * -0.1428 0.2739
0.1200 0.2333
Arena age 0.0048 0.0047
0.0079 0.0080
0.0057 0.0040
0.0034 0.0046 Number of playoff games 0.0001 0.0070
0.0108 0.0113
0.0009 0.0060
0.0095 0.0065
Another team in same league exists in same metro area DNP/NS
DNP/NS
DNP/NS
DNP/NS
MSA population (mn) -0.0147 0.0101
0.0109 0.0198
-0.0114 0.0087
-0.0089 0.0114 MSA per capita income ($th) 0.0058 0.0074
0.0086 0.0100
0.0082 0.0064
0.0140 0.0058 **
Change in ownership in previous 3 years DNP/NEG
** DNP/NS
DNP/NS
DNP/NEG **
Arena financed publicly 0.0158 0.1095
-0.1717 0.2001
0.0824 0.0947
-0.2478 0.1154 ** Constant -0.2720 0.2714
-0.0525 0.4474
-0.5502 0.2348 ** -0.2259 0.2580
R-squared 0.8628 0.7854 0.8282 0.8649
Panel B Non-labor Surplus ($mn) as proportion of sales Profit ($mn) as proportion of sales
32
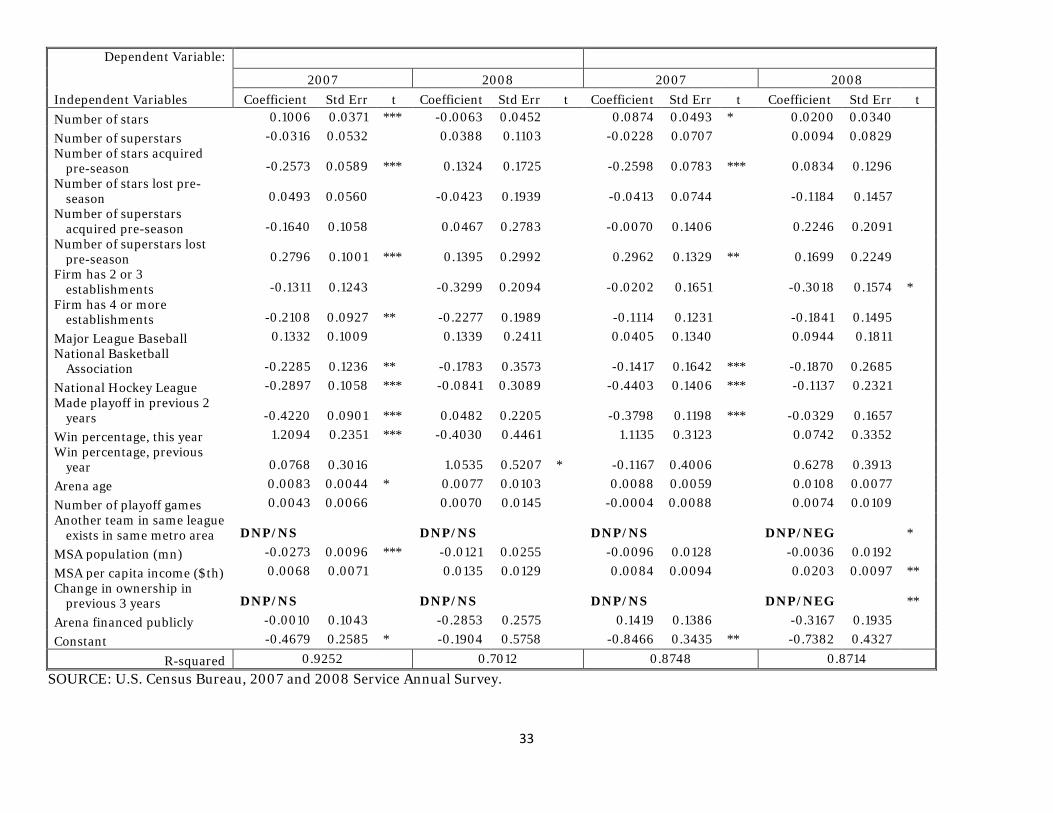
Dependent Variable:
2007 2008 2007 2008
Independent Variables Coefficient Std Err t Coefficient Std Err t Coefficient Std Err t Coefficient Std Err t Number of stars 0.1006 0.0371 *** -0.0063 0.0452 0.0874 0.0493 * 0.0200 0.0340
Number of superstars -0.0316 0.0532 0.0388 0.1103 -0.0228 0.0707 0.0094 0.0829 Number of stars acquired
pre-season -0.2573 0.0589 *** 0.1324 0.1725 -0.2598 0.0783 *** 0.0834 0.1296 Number of stars lost pre-
season 0.0493 0.0560 -0.0423 0.1939 -0.0413 0.0744 -0.1184 0.1457 Number of superstars
acquired pre-season -0.1640 0.1058 0.0467 0.2783 -0.0070 0.1406 0.2246 0.2091 Number of superstars lost
pre-season 0.2796 0.1001 *** 0.1395 0.2992 0.2962 0.1329 ** 0.1699 0.2249 Firm has 2 or 3
establishments -0.1311 0.1243 -0.3299 0.2094 -0.0202 0.1651 -0.3018 0.1574 * Firm has 4 or more
establishments -0.2108 0.0927 ** -0.2277 0.1989 -0.1114 0.1231 -0.1841 0.1495
Major League Baseball 0.1332 0.1009 0.1339 0.2411 0.0405 0.1340 0.0944 0.1811 National Basketball
Association -0.2285 0.1236 ** -0.1783 0.3573 -0.1417 0.1642 *** -0.1870 0.2685
National Hockey League -0.2897 0.1058 *** -0.0841 0.3089 -0.4403 0.1406 *** -0.1137 0.2321 Made playoff in previous 2
years -0.4220 0.0901 *** 0.0482 0.2205 -0.3798 0.1198 *** -0.0329 0.1657
Win percentage, this year 1.2094 0.2351 *** -0.4030 0.4461 1.1135 0.3123 0.0742 0.3352 Win percentage, previous
year 0.0768 0.3016 1.0535 0.5207 * -0.1167 0.4006 0.6278 0.3913
Arena age 0.0083 0.0044 * 0.0077 0.0103 0.0088 0.0059 0.0108 0.0077
Number of playoff games 0.0043 0.0066 0.0070 0.0145 -0.0004 0.0088 0.0074 0.0109 Another team in same league
exists in same metro area DNP/NS DNP/NS DNP/NS DNP/NEG *
MSA population (mn) -0.0273 0.0096 *** -0.0121 0.0255 -0.0096 0.0128 -0.0036 0.0192
MSA per capita income ($th) 0.0068 0.0071 0.0135 0.0129 0.0084 0.0094 0.0203 0.0097 ** Change in ownership in
previous 3 years DNP/NS DNP/NS DNP/NS DNP/NEG **
Arena financed publicly -0.0010 0.1043 -0.2853 0.2575 0.1419 0.1386 -0.3167 0.1935 Constant -0.4679 0.2585 * -0.1904 0.5758 -0.8466 0.3435 ** -0.7382 0.4327
R-squared 0.9252 0.7012 0.8748 0.8714 SOURCE: U.S. Census Bureau, 2007 and 2008 Service Annual Survey.
33

NOTE: 30 teams included. Uses league-based definitions of stars and superstars. Std Err=standard error of estimate. MSA=Metropolitan Statistical Area. DNP/NS= disclosure not permitted, coefficient not significant. DNP/NEG=disclosure not permitted, coefficient negative. ***/**/* = significant at the 0.01/0.05/0.10 level.
34