tale of two spains
TRANSCRIPT
8/9/2019 Tale of Two Spains
http://slidepdf.com/reader/full/tale-of-two-spains 1/70
Spain 2010
What are the markets waiting for?
Marisa Mazo, CFAHead of Strategy & Research
[email protected], 2010
Ahorro Corporación Financiera, S.V., S.A. See important disclosure on the last two pages of this document Ahorro Corporación Financiera, S.V., S.A. See important disclosure on the last two pages of this document

8/9/2019 Tale of Two Spains
http://slidepdf.com/reader/full/tale-of-two-spains 2/70
June, 2010
Index
Spain: The recession continues
Spain, at a glance.
Worst is over ut...
Main problems (and challenges) of the Spanish economy.
External sector: restoring competitiveness a must.
mp oymen .: wa ng or a our mar e re orm.
Budget deficit: additional measures in the pipeline?
Suffering from public debt.
.
The financial sector.
Annex.
Ahorro Corporación Financiera, S.V., S.A. 2
8/9/2019 Tale of Two Spains
http://slidepdf.com/reader/full/tale-of-two-spains 3/70
June, 2010
Spain (I): Recession continues in 2010.
Spanish GDP may decline by –0.9% in 2010e, after the –3.6% drop in 2009. Positive rates are expected 2011eonwards. However,
’
The new problems:
Unemployment rate: 20.8% by 2011e. Bud et deficit: –9.8% in 2010e.
The everlasting weaknesses:
Current account deficit: how to reduce it to under –4.0%?
Excessive reliance on the residential construction sector: despite the crisis, still c. 6.0% of GDP in 2010e.
Restoring competitiveness: “THE” challenge Are politicians willing to implement structural reforms?
Short-term reforms:
Reduce companies’ overall taxation
Labour reform
Medium-term reforms:
Energy sector.
Distribution of competences among the different public administrations.
Ahorro Corporación Financiera, S.V., S.A. 3
8/9/2019 Tale of Two Spains
http://slidepdf.com/reader/full/tale-of-two-spains 4/70
June, 2010
Spain, at a glance
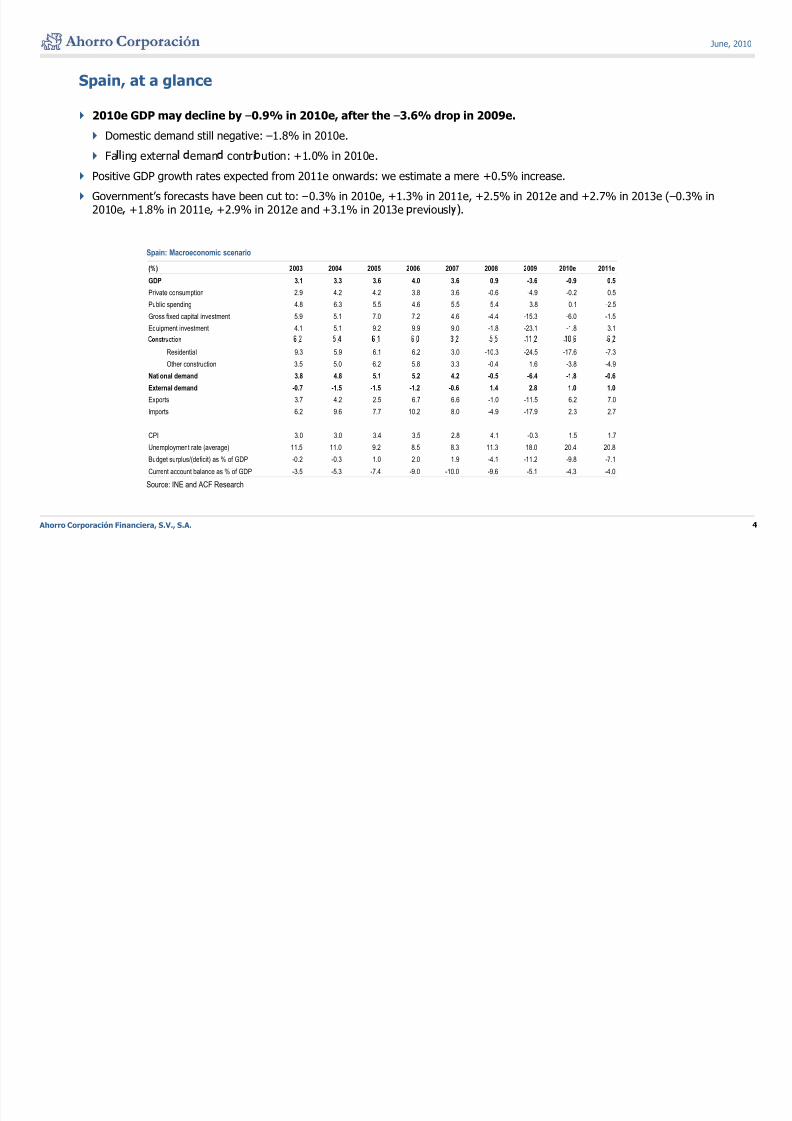
2010e GDP may decline by –0.9% in 2010e, after the –3.6% drop in 2009e.
Domestic demand still negative: –1.8% in 2010e.
Fa ing externa eman contri ution: +1.0% in 2010e.
Positive GDP growth rates expected from 2011e onwards: we estimate a mere +0.5% increase.
Government’s forecasts have been cut to: –0.3% in 2010e, +1.3% in 2011e, +2.5% in 2012e and +2.7% in 2013e (–0.3% in2010e +1.8% in 2011e +2.9% in 2012e and +3.1% in 2013e reviousl .
Spain: Macroeconomic scenario
(%) 2003 2004 2005 2006 2007 2008 2009 2010e 2011e
GDP 3.1 3.3 3.6 4.0 3.6 0.9 -3.6 -0.9 0.5
Private consumption 2.9 4.2 4.2 3.8 3.6 -0.6 -4.9 -0.2 0.5Public spending 4.8 6.3 5.5 4.6 5.5 5.4 3.8 0.1 -2.5
Gross fixed capital investment 5.9 5.1 7.0 7.2 4.6 -4.4 -15.3 -6.0 -1.5
Equipment investment 4.1 5.1 9.2 9.9 9.0 -1.8 -23.1 -1.8 3.1
- - - -. . . . . . . . .
Residential 9.3 5.9 6.1 6.2 3.0 -10.3 -24.5 -17.6 -7.3
Other construction 3.5 5.0 6.2 5.8 3.3 -0.4 1.6 -3.8 -4.9
National demand 3.8 4.8 5.1 5.2 4.2 -0.5 -6.4 -1.8 -0.6
External demand -0.7 -1.5 -1.5 -1.2 -0.6 1.4 2.8 1.0 1.0Exports 3.7 4.2 2.5 6.7 6.6 -1.0 -11.5 6.2 7.0
Imports 6.2 9.6 7.7 10.2 8.0 -4.9 -17.9 2.3 2.7
CPI 3.0 3.0 3.4 3.5 2.8 4.1 -0.3 1.5 1.7
Unemployment rate (average) 11.5 11.0 9.2 8.5 8.3 11.3 18.0 20.4 20.8
Budget surplus/(deficit) as % of GDP -0.2 -0.3 1.0 2.0 1.9 -4.1 -11.2 -9.8 -7.1
Ahorro Corporación Financiera, S.V., S.A. 4
Source: INE and ACF Research
Current account balance as % of GDP -3.5 -5.3 -7.4 -9.0 -10.0 -9.6 -5.1 -4.3 -4.0
8/9/2019 Tale of Two Spains
http://slidepdf.com/reader/full/tale-of-two-spains 5/70
June, 2010
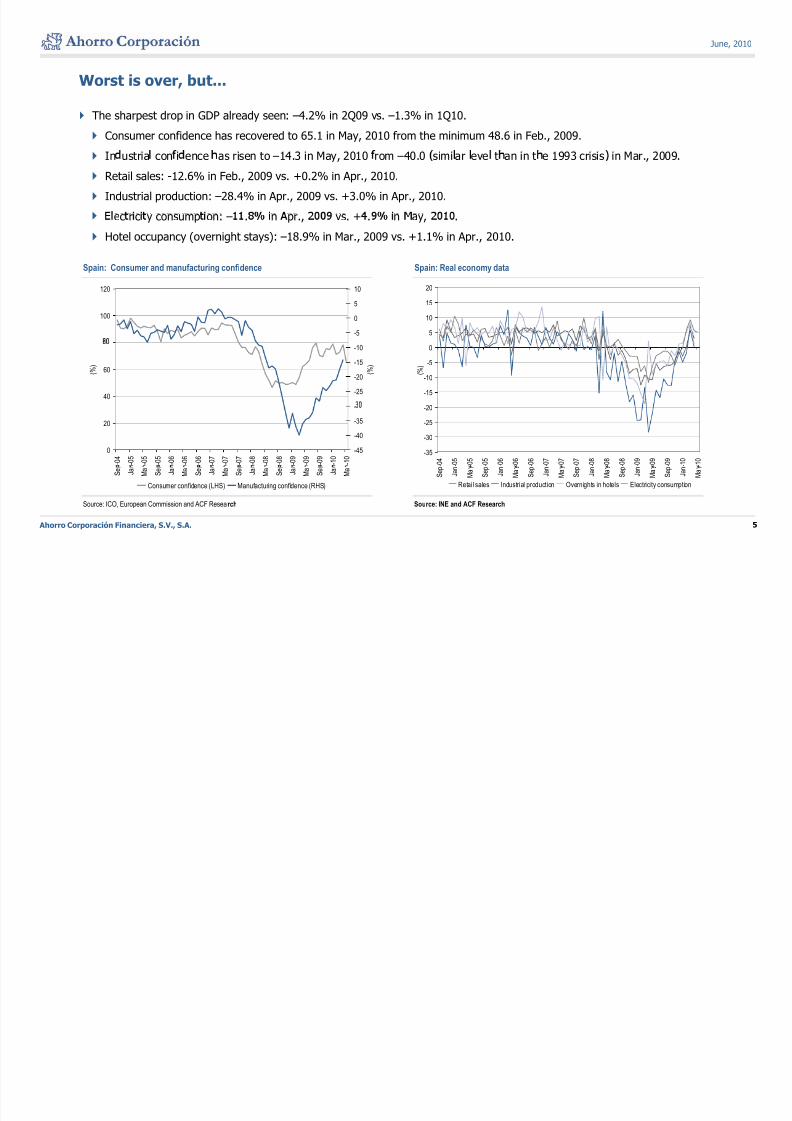
Worst is over, but...
The sharpest drop in GDP already seen: –4.2% in 2Q09 vs. –1.3% in 1Q10.
Consumer confidence has recovered to 65.1 in May, 2010 from the minimum 48.6 in Feb., 2009.
In ustria con i ence as risen to –14.3 in May, 2010 rom –40.0 simi ar eve t an in t e 1993 crisis in Mar., 2009.
Retail sales: -12.6% in Feb., 2009 vs. +0.2% in Apr., 2010.
Industrial production: –28.4% in Apr., 2009 vs. +3.0% in Apr., 2010.
ec r c y consump on: – . n pr., vs. + . n ay, .
Hotel occupancy (overnight stays): –18.9% in Mar., 2009 vs. +1.1% in Apr., 2010.
Spain: Consumer and manufacturing confidence Spain: Real economy data
100
120
-5
0
5
10
5
10
15
20
40
60 ( % )
-25
-20
-15
-10
( % )
-15
-10
-5
0
( % )
0
20
- 0 4
- 0 5
y - 0
5 - 0
5 - 0
6
y - 0
6 - 0
6 - 0
7
y - 0
7 - 0
7 - 0
8
y - 0
8 - 0
8 - 0
9
y - 0
9 - 0
9 - 1
0
y - 1
0-45
-40
-35
-
-35
-30
-25
-20
- 0 4
- 0 5
- 0 5
- 0 5
- 0 6
- 0 6
- 0 6
- 0 7
- 0 7
- 0 7
- 0 8
- 0 8
- 0 8
- 0 9
- 0 9
- 0 9
- 1 0
- 1 0
Ahorro Corporación Financiera, S.V., S.A. 5
Source: ICO, European Commission and ACF Research Source: INE and ACF Research
S e
J a
M a
S e
J a
M a
S e
J a
M a
S e
J a
M a
S e
J a
M a
S e
J a
M a
Consumer confidence (LHS) Manufacturing confidence (RHS)
S e p
J a n
M a
S e p
J a n
M a
S e p
J a n
M a
S e p
J a n
M a
S e p
J a n
M a
S e p
J a n
M a
Retail sales Industrial production Overnights in hotels Electricity consumption
8/9/2019 Tale of Two Spains
http://slidepdf.com/reader/full/tale-of-two-spains 6/70
June, 2010
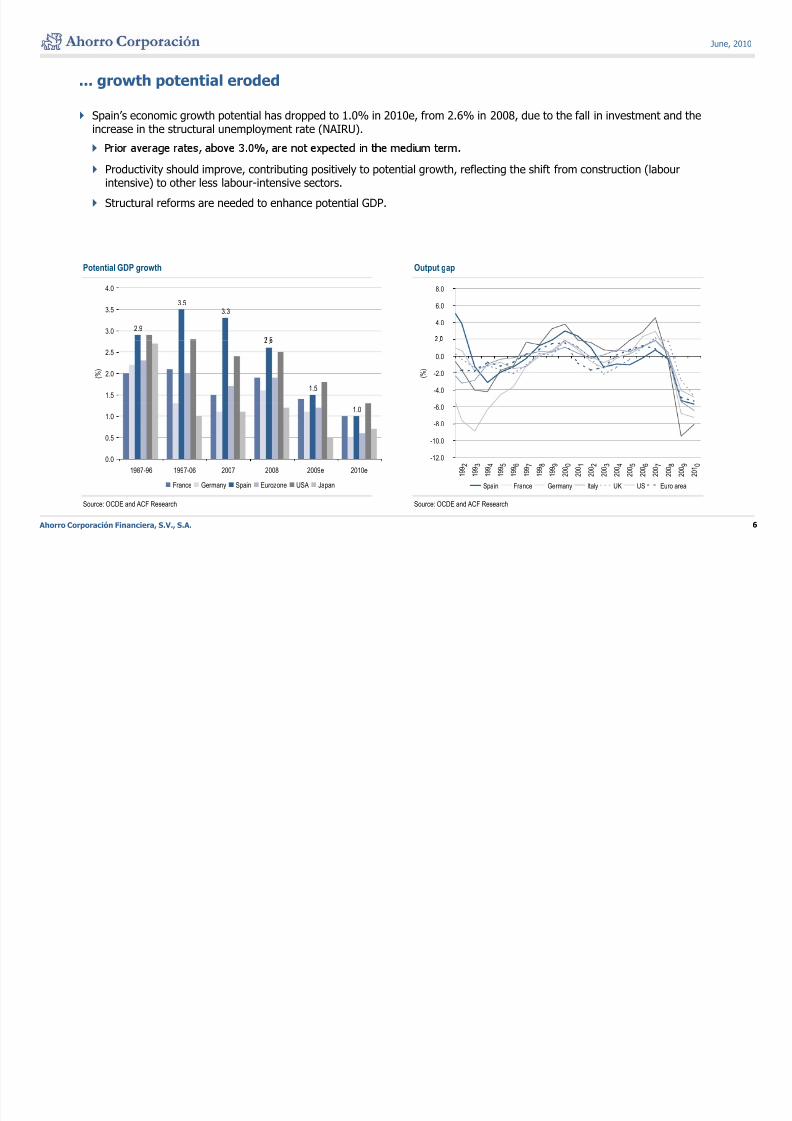
... growth potential eroded
Spain’s economic growth potential has dropped to 1.0% in 2010e, from 2.6% in 2008, due to the fall in investment and theincrease in the structural unemployment rate (NAIRU).
Productivity should improve, contributing positively to potential growth, reflecting the shift from construction (labourintensive) to other less labour-intensive sectors.
Structural reforms are needed to enhance potential GDP.
Potential GDP growth Output gap
4.0
6.0
8.0
2.9
3.53.3
3.0
3.5
4.0
-4.0
-2.0
0.0
.
( % )
.
1.51.5
2.0
2.5
( % )
-12.0
-10.0
-8.0
-6.0
2 3 4 5 6 7 8 9 0 1 2 3 4 5 6 7 8 9 0
1.0
0.0
0.5
1.0
Ahorro Corporación Financiera, S.V., S.A. 6
Source: OCDE and ACF Research Source: OCDE and ACF Research
1 9 9
1 9 9
1 9 9
1 9 9
1 9 9
1 9 9
1 9 9
1 9 9
2 0 0
2 0 0
2 0 0
2 0 0
2 0 0
2 0 0
2 0 0
2 0 0
2 0 0
2 0 0
2 0 1
Spain France Germany Italy UK US Euro area
1987-96 1997-06 2007 2008 2009e 2010e
France Germany Spain Eurozone USA Japan
8/9/2019 Tale of Two Spains
http://slidepdf.com/reader/full/tale-of-two-spains 7/70
June, 2010
Main problems (and challenges) in 2010e onwards.
The main threats that the Spanish economy was facing in 2007 are now our main problems:
The high current account deficit and, consequently, massive external financing needs.
A t oug iminis ing, it may sti represent some 3.0%-4.0% o GDP, me ium term.
Net external investment position already accounts for –91% of GDP.
Key challenge: restore the competitiveness of Spanish companies.
xcess ve epen ence on e res en a cons ruc on sec or.
In spite of the crisis, the sector still represents c. 6.0% of GDP in 2010e.
Key challenge: the stabilisation of the sector at a sustainable “cruising speed”.
- .
0.27Mn jobs to be destroyed in 2010e, totalling, c. 2.0Mn since 2008. Unemployment rate may reach 20.8% in 2011e.
The dual economy: the employed (fixed contracts) and the unemployed (temporary labour contracts).
Ke challen e: reform of the labour market.
Budget deficit: from a 2.3% surplus in 2007 to a -9.8% deficit in 2010e (-11.2% in 2009).
Public debt would represent 66% of GDP in 2010e vs. 36% in 2007. Risk of ratings downgrades.
Key challenge: looking for sustainability.
Are politicians willing to implement structural reforms?
Ahorro Corporación Financiera, S.V., S.A. 7
8/9/2019 Tale of Two Spains
http://slidepdf.com/reader/full/tale-of-two-spains 8/70
June, 2010
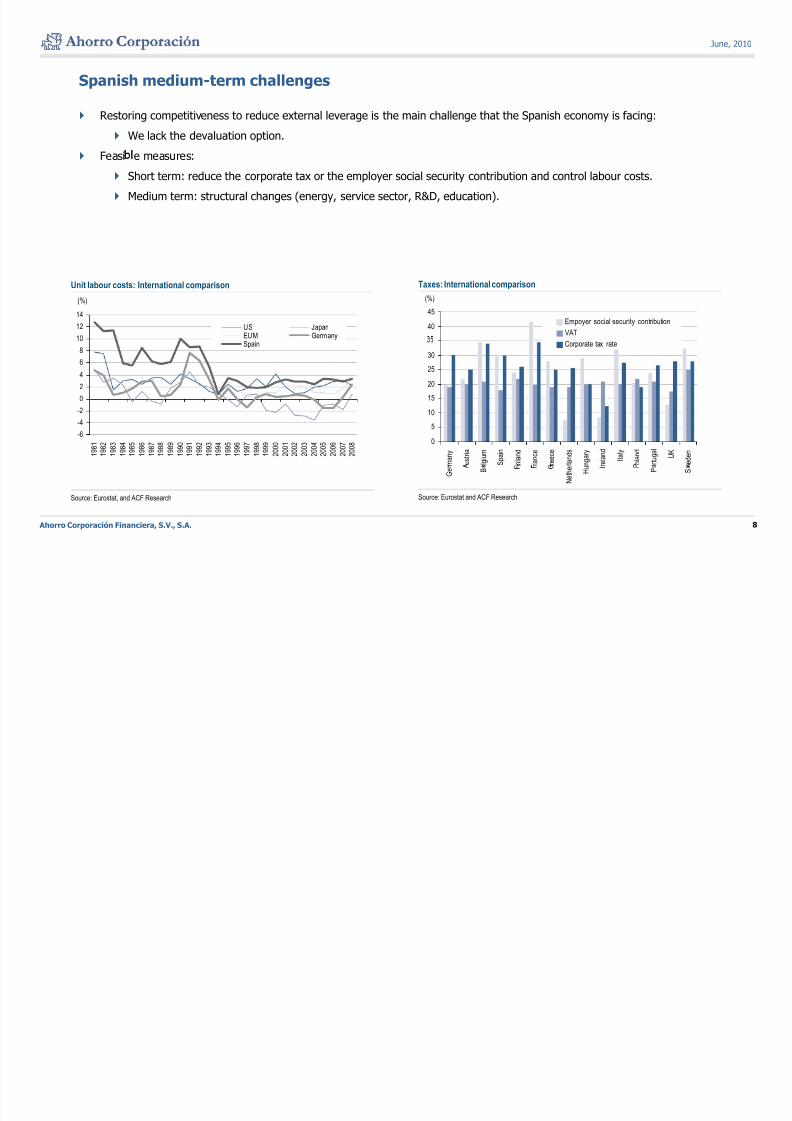
Spanish medium-term challenges
Restoring competitiveness to reduce external leverage is the main challenge that the Spanish economy is facing:
We lack the devaluation option.
Feasi e measures:
Short term: reduce the corporate tax or the employer social security contribution and control labour costs.
Medium term: structural changes (energy, service sector, R&D, education).
40
45Empoyer social security contribution
VAT
(%)
10
12
14
US JapanEUM Germany
(%)
Taxes: International comparisonUnit labour costs: International comparison
15
20
25
30
Corporate tax rate
0
2
4
6
8Spain
0
5
10
m a n y
u s t r i a
l g i u m
S p a i n
i n l a n d
r a n c e
r e e c e
r l a n d s
n g a r y
r e l a n d
I t a l y
o l a n d
r t u g a l
U K
e d e n
-6
-4
-2
1 9 8 1
1 9 8 2
1 9 8 3
1 9 8 4
1 9 8 5
1 9 8 6
1 9 8 7
1 9 8 8
1 9 8 9
1 9 9 0
1 9 9 1
1 9 9 2
1 9 9 3
1 9 9 4
1 9 9 5
1 9 9 6
1 9 9 7
1 9 9 8
1 9 9 9
2 0 0 0
2 0 0 1
2 0 0 2
2 0 0 3
2 0 0 4
2 0 0 5
2 0 0 6
2 0 0 7
2 0 0 8
Ahorro Corporación Financiera, S.V., S.A. 8
G e B
N e t h e
H u I
P S
Source: Eurostat and ACF ResearchSource: Eurostat, and ACF Research
8/9/2019 Tale of Two Spains
http://slidepdf.com/reader/full/tale-of-two-spains 9/70
June, 2010
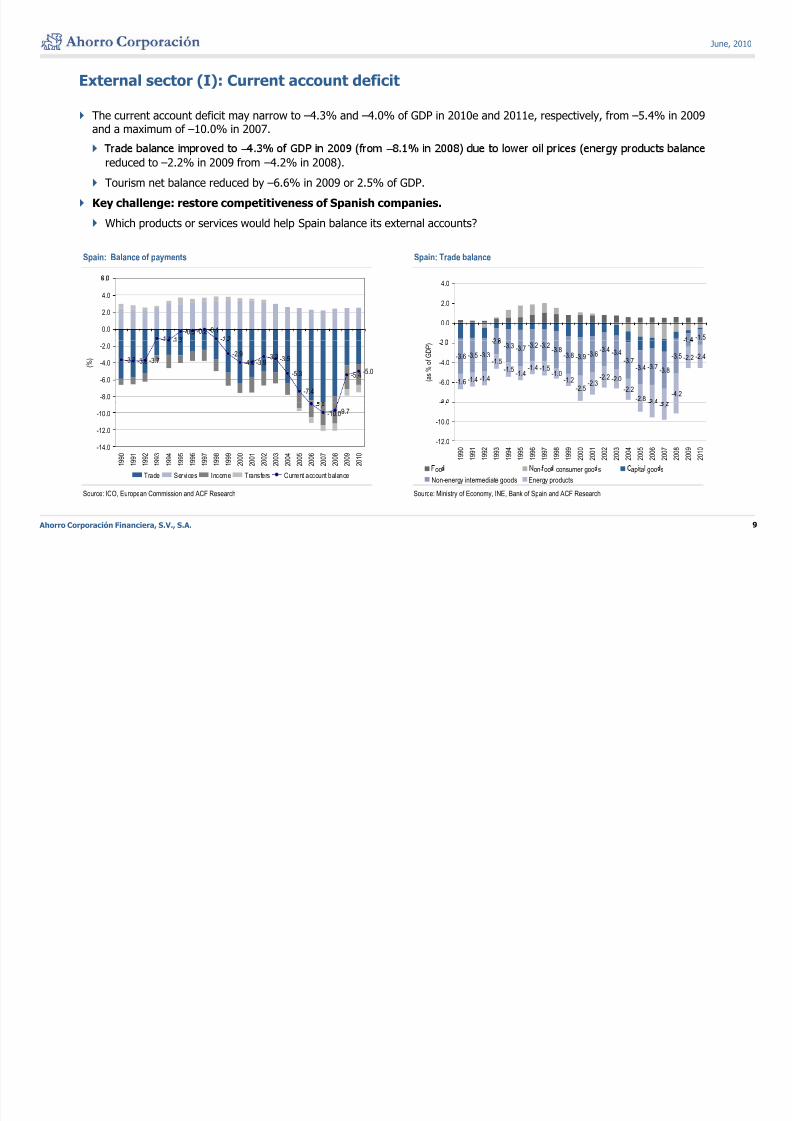
External sector (I): Current account deficit
The current account deficit may narrow to –4.3% and –4.0% of GDP in 2010e and 2011e, respectively, from –5.4% in 2009and a maximum of –10.0% in 2007.
– – reduced to –2.2% in 2009 from –4.2% in 2008).
Tourism net balance reduced by –6.6% in 2009 or 2.5% of GDP.
Key challenge: restore competitiveness of Spanish companies.
Which products or services would help Spain balance its external accounts?
Spain: Balance of payments Spain: Trade balance
-1.1 -
-0.3 -0.2 -0.1
-1 2
0.0
2.0
4.0
.
- -1.5
0.0
2.0
4.0
-3.7 -3.8 -3.7
. - . .
-2.9
-4.0 -3.9-3.3 -3.5
-5.3
-7.4
-5.4-5.0
-8.0
-6.0
-4.0
-2.0
( % ) -3.6 -3.5 -3.3
- .-3.3 -3.7 -3.2 -3.2
-3.8-3.8 -3.9 -3.6
-3.4 -3.4-3.7
-3.4 -3.7-3.8
-3.5
- .
-1.6 -1.4 -1.4
-1.5-1.5
-1.4-1.4 -1.5
-1.0-1.2
-2.5
-2.3-2.2 -2.0
-2.2-2.8 -3.4
-4.2
-2.2 -2.4
-8 0
-6.0
-4.0
- .
( a s
% o
f G D P )
- .
-10.0-9.7
-14.0
-12.0
-10.0
1 9 9 0
1 9 9 1
1 9 9 2
1 9 9 3
1 9 9 4
1 9 9 5
1 9 9 6
1 9 9 7
1 9 9 8
1 9 9 9
2 0 0 0
2 0 0 1
2 0 0 2
2 0 0 3
2 0 0 4
2 0 0 5
2 0 0 6
2 0 0 7
2 0 0 8
2 0 0 9
2 0 1 0
. - .
-12.0
-10.0
.
1 9 9 0
1 9 9 1
1 9 9 2
1 9 9 3
1 9 9 4
1 9 9 5
1 9 9 6
1 9 9 7
1 9 9 8
1 9 9 9
2 0 0 0
2 0 0 1
2 0 0 2
2 0 0 3
2 0 0 4
2 0 0 5
2 0 0 6
2 0 0 7
2 0 0 8
2 0 0 9
2 0 1 0
Ahorro Corporación Financiera, S.V., S.A. 9
Source: ICO, European Commission and ACF Research Source: Ministry of Economy, INE, Bank of Spain and ACF Research
Trade Services Income Transfers Current account balanceoo on- oo consumer goo s ap ta goo s
Non-energy intermediate goods Energy products
8/9/2019 Tale of Two Spains
http://slidepdf.com/reader/full/tale-of-two-spains 10/70
June, 2010
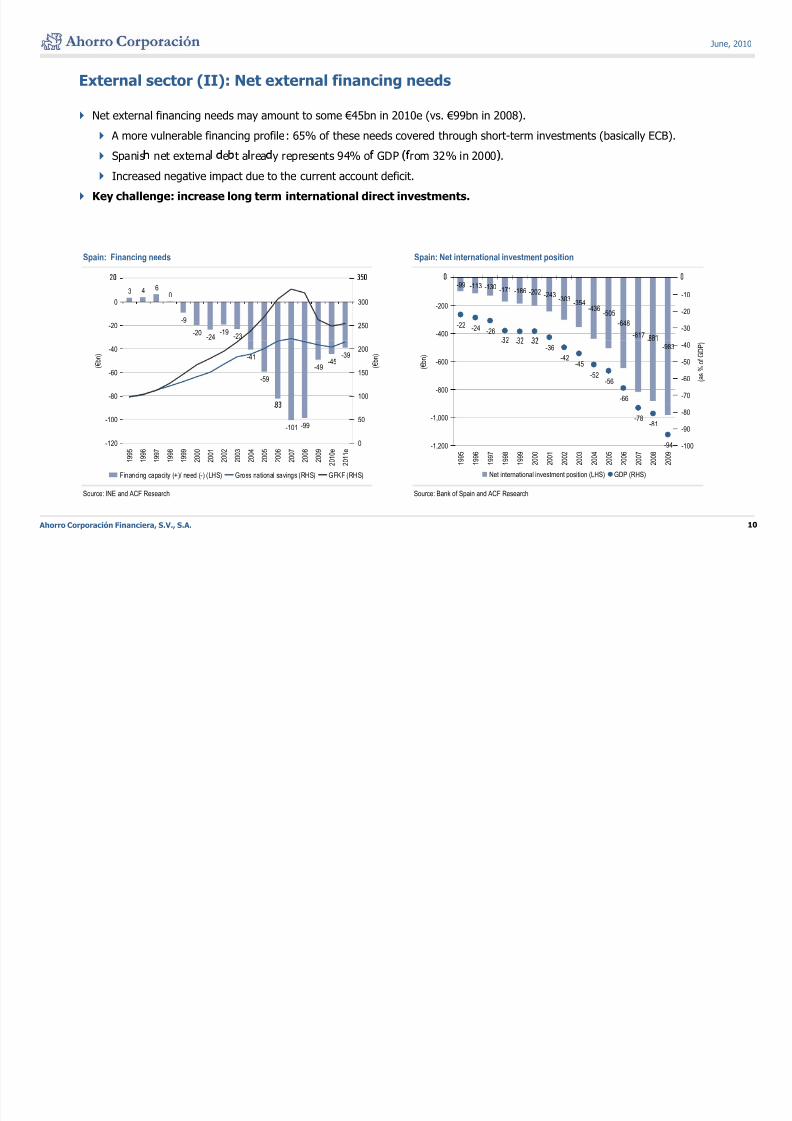
External sector (II): Net external financing needs
Net external financing needs may amount to some €45bn in 2010e (vs. €99bn in 2008).
A more vulnerable financing profile: 65% of these needs covered through short-term investments (basically ECB).
Spanis net externa e t a rea y represents 94% o GDP rom 32% in 2000 .
Increased negative impact due to the current account deficit.
Key challenge: increase long term international direct investments.
Spain: Financing needs Spain: Net international investment position
3 4
6
0
-9
-20-24
-19-23
-20
0
250
300
-99 -113 -130 -171-186 -202 -243 -303
-354-436
-505
-648
-817-
-22 -24 -26-400
-200
-30
-20
-10
-41
-59
-49-45
-39
-80
-60
-40
( € b n
)
100
150
200
( € b n
)
-983- - -
-36
-42-45
-52-56
-66-800
-600 ( € b n )
-70
-60
-50
-40
( a s %
o f G D P )
-
-101 -99
-120
-100
1 9 9 5
1 9 9 6
1 9 9 7
1 9 9 8
1 9 9 9
2 0 0 0
2 0 0 1
2 0 0 2
2 0 0 3
2 0 0 4
2 0 0 5
2 0 0 6
2 0 0 7
2 0 0 8
2 0 0 9
2 0 1 0 e
2 0 1 1 e
0
50 -78-81
-94-1,200
-1,000
1 9 9 5
1 9 9 6
1 9 9 7
1 9 9 8
1 9 9 9
2 0 0 0
2 0 0 1
2 0 0 2
2 0 0 3
2 0 0 4
2 0 0 5
2 0 0 6
2 0 0 7
2 0 0 8
2 0 0 9
-100
-90
-80
Ahorro Corporación Financiera, S.V., S.A. 10
Source: INE and ACF Research Source: Bank of Spain and ACF Research
Financing capacity (+)/ need (-) (LHS) Gross national savings (RHS) GFKF (RHS) Net international investment position (LHS) GDP (RHS)
8/9/2019 Tale of Two Spains
http://slidepdf.com/reader/full/tale-of-two-spains 11/70
June, 2010
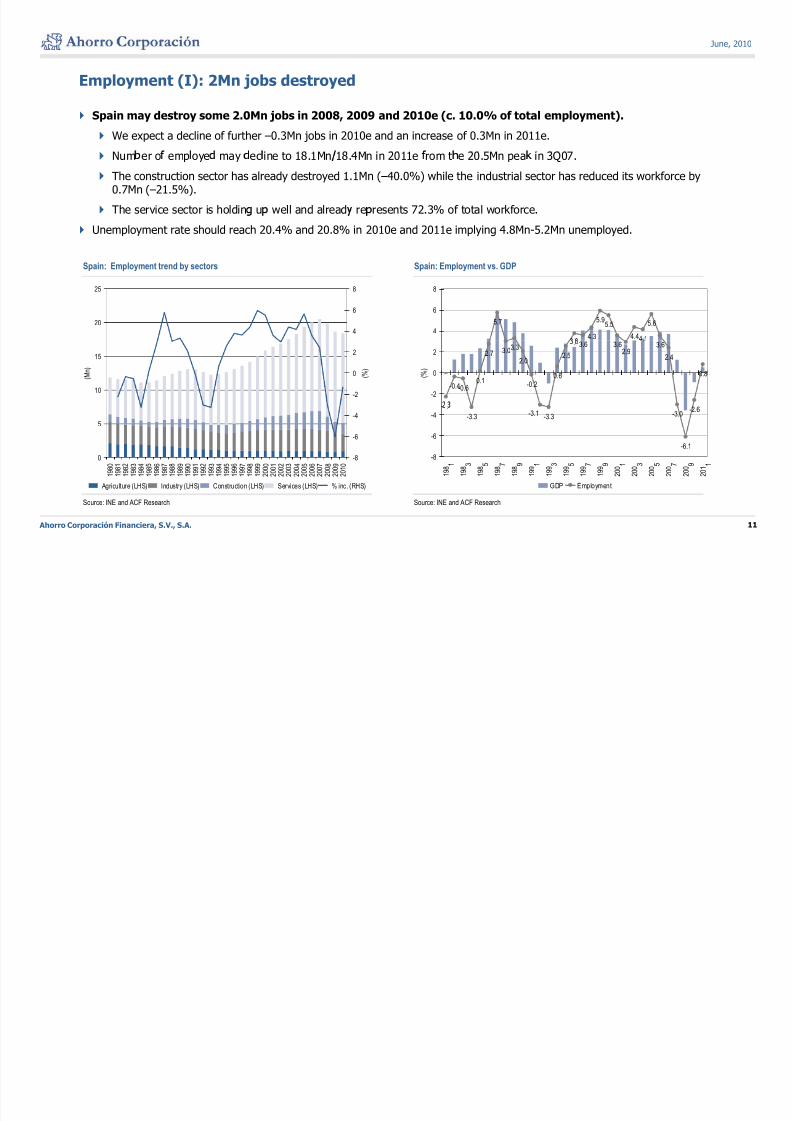
Employment (I): 2Mn jobs destroyed
Spain may destroy some 2.0Mn jobs in 2008, 2009 and 2010e (c. 10.0% of total employment).
We expect a decline of further –0.3Mn jobs in 2010e and an increase of 0.3Mn in 2011e.
Num er o emp oye may ec ine to 18.1Mn 18.4Mn in 2011e rom t e 20.5Mn pea in 3Q07.
The construction sector has already destroyed 1.1Mn (–40.0%) while the industrial sector has reduced its workforce by0.7Mn (–21.5%).
The service sector is holdin u well and alread re resents 72.3% of total workforce.
Unemployment rate should reach 20.4% and 20.8% in 2010e and 2011e implying 4.8Mn-5.2Mn unemployed.
Spain: Employment trend by sectors Spain: Employment vs. GDP
5.7
4.3
5.95.5
4.44.1
5.64
6
8
20
25
4
6
8
-0.4-0.60.1
2.7 3.03.3
2.0
-0.20.6
2.5
. 3.6 3.62.9
.3.6
2.4
0.8
-2
0
2
( % )
10
15
( M n
)
-2
0
2
( % )
- .
-3.3 -3.3 -3.0
-6.1
-2.6-3.1
-8
-6
-4
1 3 5 7 9 1 3 5 7 9 1 3 5 7 9 10
5
0 1 2 3 4 5 6 7 8 9 0 1 2 3 4 5 6 7 8 9 0 1 2 3 4 5 6 7 8 9 0-8
-6
-4
Ahorro Corporación Financiera, S.V., S.A. 11
Source: INE and ACF Research Source: INE and ACF Research
1 9 8
1 9 8
1 9 8
1 9 8
1 9 8
1 9 9
1 9 9
1 9 9
1 9 9
1 9 9
2 0 0
2 0 0
2 0 0
2 0 0
2 0 0
2 0 1
GDP Employment
1 9 8
1 9 8
1 9 8
1 9 8
1 9 8
1 9 8
1 9 8
1 9 8
1 9 8
1 9 8
1 9 9
1 9 9
1 9 9
1 9 9
1 9 9
1 9 9
1 9 9
1 9 9
1 9 9
1 9 9
2 0 0
2 0 0
2 0 0
2 0 0
2 0 0
2 0 0
2 0 0
2 0 0
2 0 0
2 0 0
2 0 1
Agriculture (LHS) Industry (LHS) Construction (LHS) Services (LHS) % inc. (RHS)
8/9/2019 Tale of Two Spains
http://slidepdf.com/reader/full/tale-of-two-spains 12/70
June, 2010
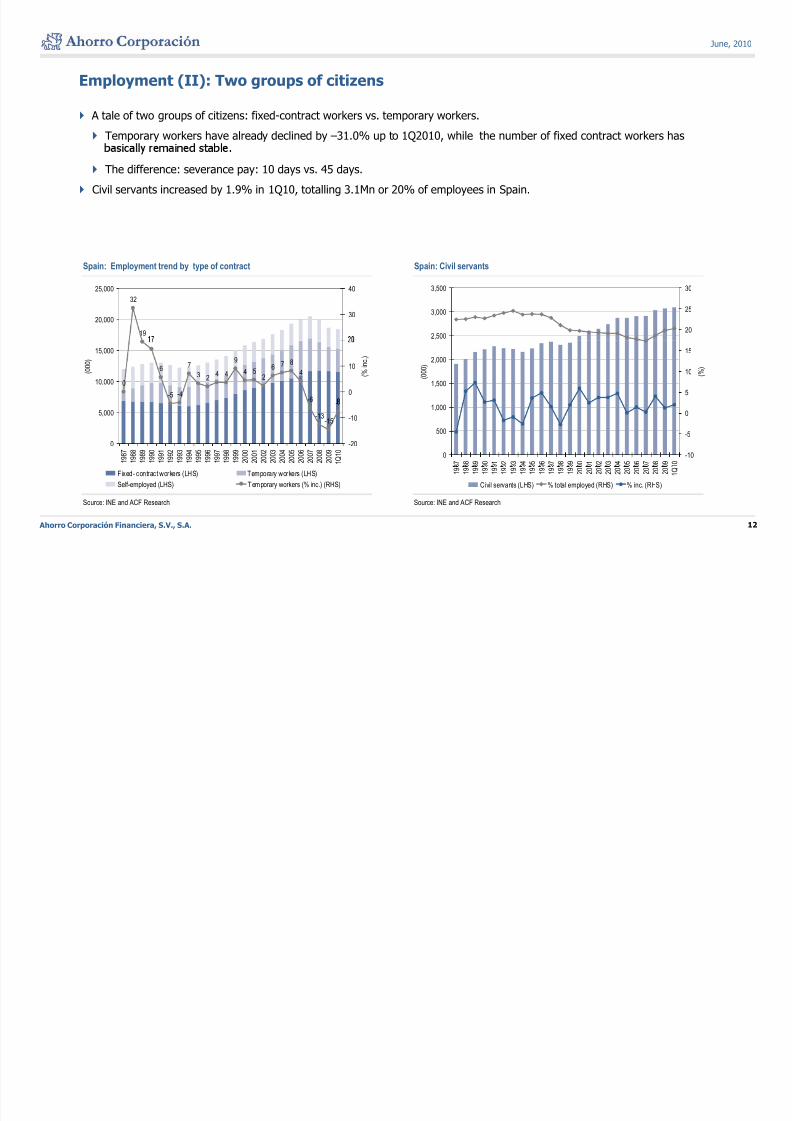
Employment (II): Two groups of citizens
A tale of two groups of citizens: fixed-contract workers vs. temporary workers.
Temporary workers have already declined by –31.0% up to 1Q2010, while the number of fixed contract workers has
The difference: severance pay: 10 days vs. 45 days.
Civil servants increased by 1.9% in 1Q10, totalling 3.1Mn or 20% of employees in Spain.
Spain: Employment trend by type of contract Spain: Civil servants
32
19
20,000
25,000
30
40
2,500
3,000
3,500
20
25
30
0
6
-5 -4
7
3 24 4
9
4 52
6 7 8
4
-6 -
10,000
15,000
( 0 0 0 )
0
10 ( %
i n c . )
1,500
2,000
( 0 0 0 )
5
10
15
( % )
-13-15
0
5,000
1 9 8 7
1 9 8 8
1 9 8 9
1 9 9 0
1 9 9 1
1 9 9 2
1 9 9 3
1 9 9 4
1 9 9 5
1 9 9 6
1 9 9 7
1 9 9 8
1 9 9 9
2 0 0 0
2 0 0 1
2 0 0 2
2 0 0 3
2 0 0 4
2 0 0 5
2 0 0 6
2 0 0 7
2 0 0 8
2 0 0 9
1 Q 1 0
-20
-10
0
500
1,000
8 7
8 8
8 9
9 0
9 1
9 2
9 3
9 4
9 5
9 6
9 7
9 8
9 9
0 0
0 1
0 2
0 3
0 4
0 5
0 6
0 7
0 8
0 9
1 0
-10
-5
0
Ahorro Corporación Financiera, S.V., S.A. 12
Source: INE and ACF Research Source: INE and ACF Research
Fixed- contract workers (LHS) Temporary workers (LHS)
Self-employed (LHS) Temporary workers (% inc.) (RHS)
1 9
1 9
1 9
1 9
1 9
1 9
1 9
1 9
1 9
1 9
1 9
1 9
1 9
2 0
2 0
2 0
2 0
2 0
2 0
2 0
2 0
2 0
2 0
1 Q
Civil servants (LHS) % total employed (RHS) % inc. (RHS)
8/9/2019 Tale of Two Spains
http://slidepdf.com/reader/full/tale-of-two-spains 13/70
June, 2010
Employment (III): The long awaited labour market reform
Trade unions and national business association(CEOE) to reach an agreement before the deadline date: June, 11th
(deadline pushed back twice).
Consensus is highly unlikely mainly because of differences on severance payment
Government draft to be approved by Royal-Decree next June, 16th (according to the press):
Severance a ment to be reduced from 45 to 20 da s if com anies have economic roblems currentl onl a lied tocompanies in the red).
The contract to promote employment , with just 33 days of severance payment, to be applied to all new contracts.
Penalize overuse of temporary contracts (limit short contracts to maximum 2 years).
Increase severance payment for subcontracts.
Promote part-time contracts (German model).
Set up a severance payment fund (Austrian model) which would pay 8 of the 33 days of severance pay for long-termcontracts.
If the Government approves this draft without consensus, trade unions will go on strike next June, 28th.
In our view, there are important elements that are not in this “ informal” proposal:
Collective agreements.
Social security costs: amongst the highest in Europe.
Linkage of salary increases to productivity instead of CPI.
Ahorro Corporación Financiera, S.V., S.A. 13
8/9/2019 Tale of Two Spains
http://slidepdf.com/reader/full/tale-of-two-spains 14/70
June, 2010
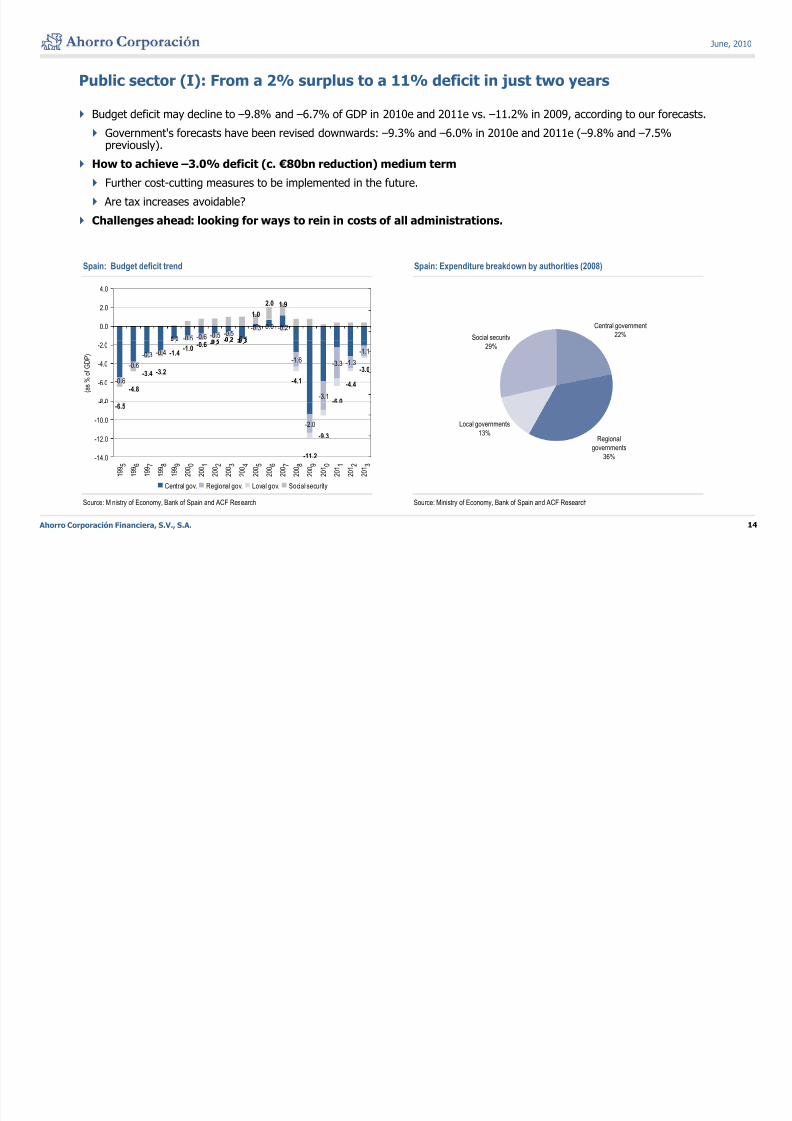
Public sector (I): From a 2% surplus to a 11% deficit in just two years
Budget deficit may decline to –9.8% and –6.7% of GDP in 2010e and 2011e vs. –11.2% in 2009, according to our forecasts.
Government's forecasts have been revised downwards: –9.3% and –6.0% in 2010e and 2011e (–9.8% and –7.5%previously).
How to achieve –3.0% deficit (c. €80bn reduction) medium term
Further cost-cutting measures to be implemented in the future.
Are tax increases avoidable?
Challenges ahead: looking for ways to rein in costs of all administrations.
Spain: Budget deficit trend Spain: Expenditure breakdown by authorities (2008)
Central government
22%Social security- -0.5 -0.6 -0.5 -0.5-0.1
-0.3 0.0 -0.2
-
1.0
2.0 1.9
0.0
2.0
4.0
29%
-0.6
-0.6
-0.3 -0.4
. .
-1.6
-3.1
-3.3 -1.3
-1.1
-4.8
-3.4 -3.2
-1.4-1.0
-0.6 - . - . - .
-4.1
-6.0
-4.4
-3.0
-8.0
-6.0
-4.0
-2.0
( a s
% o
f G D P )
Regional
governments
36%
Local governments
13%-2.0
-6.5
-11.2
-9.3
-14.0
-12.0
-10.0
.
5 6 7 8 9 0 1 2 3 4 5 6 7 8 9 0 1 2 3
Ahorro Corporación Financiera, S.V., S.A. 14
Source: Ministry of Economy, Bank of Spain and ACF Research Source: Ministry of Economy, Bank of Spain and ACF Research
1 9 9
1 9 9
1 9 9
1 9 9
1 9 9
2 0 0
2 0 0
2 0 0
2 0 0
2 0 0
2 0 0
2 0 0
2 0 0
2 0 0
2 0 0
2 0 1
2 0 1
2 0 1
2 0 1
Central gov. Regional gov. Loval gov. Social security
8/9/2019 Tale of Two Spains
http://slidepdf.com/reader/full/tale-of-two-spains 15/70
June, 2010
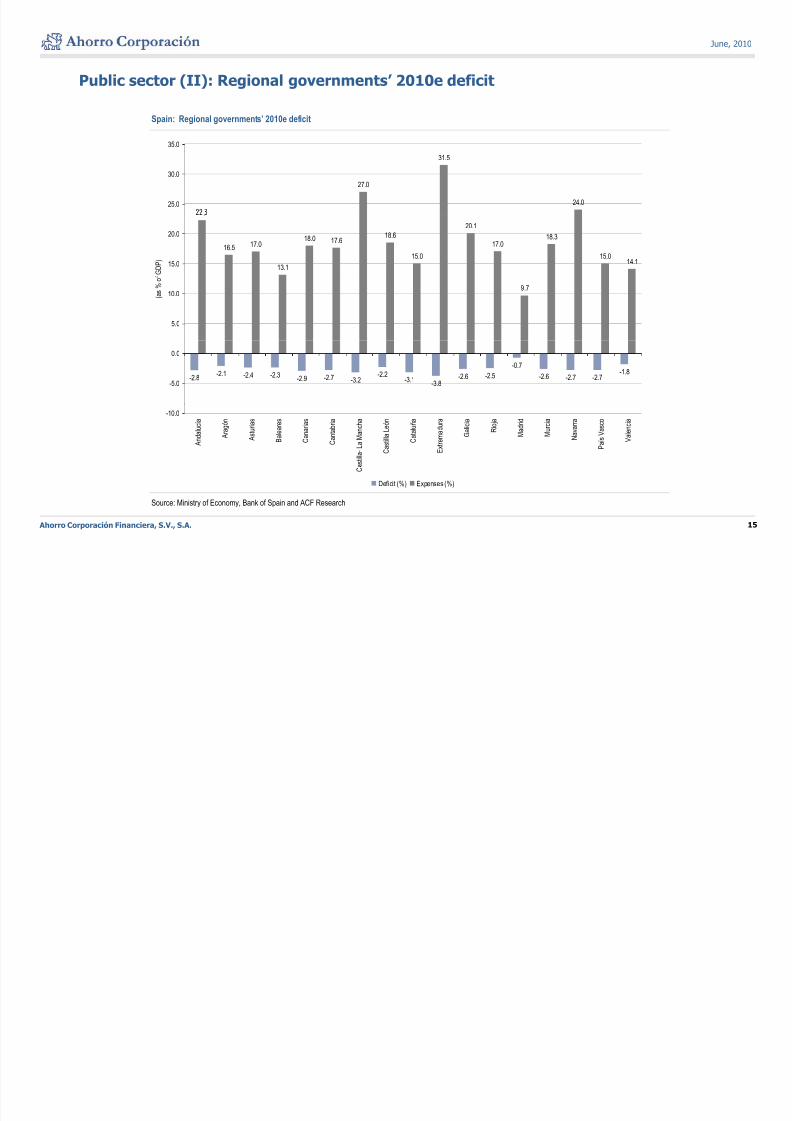
Public sector (II): Regional governments’ 2010e deficit
Spain: Regional governments’ 2010e deficit
35.0
27.0
31.5
24.025.0
30.0
.
16.5 17.0
13.1
18.0 17.618.6
15.0
20.1
17.018.3
15.014.115.0
20.0
f G D P )
9.7
5.0
10.0 ( a
s %
o
-2.8-2.1 -2.4 -2.3
-2.9 -2.7 -3.2-2.2
-3.1-3.8
-2.6 -2.5
-0.7
-2.6 -2.7 -2.7-1.8
-5.0
0.0
-10.0
A n
d a
l u c
í a
A r a g
ó n
A s
t u r i a s
B a
l e a r e s
C a n a r i a s
C a n
t a b r i a
a s
t i l l a -
L a
M a n c
h a
C a s
t i l l a L e
ó n
C a
t a l u ñ a
E x
t r e m a
d u r a
G a
l i c i a
R i o j a
M a
d r i d
M u r c
i a
N a v a r r a
P a
í s V a s c o
V a
l e n c
i a
Ahorro Corporación Financiera, S.V., S.A. 15
Source: Ministry of Economy, Bank of Spain and ACF Research
C
Deficit (%) Expenses (%)
8/9/2019 Tale of Two Spains
http://slidepdf.com/reader/full/tale-of-two-spains 16/70
June, 2010
Public sector (III): Government stimulus packages
Total stimulus packages implemented since 2008 amount to some €47.5bn (4.3% of GDP).
Revenues measures:€28.5bn, including personal income tax reduction and wealth tax elimination.
Expenses measures: €19.0Mn, inc u ing oca governments civi wor s, strategic sectors an t e car in ustry.
The Sustainable Economy Law (to be approved):
Aim: to improve the economy, competitiveness and environment.e orms o superv sory con ro organ sms , , mprovemen o nanc a regu a on, re uce ureaucracy,
reduction of the payment periods of the public administrations.
Specific measures:
Tax measures related to real-estate market: elimination of the deduction on acquisition of first home in 2011.
Financial instruments: €20.0bn co-financed (ICO and financial institutions). The March 2010 government proposal (March, 2010):
VAT reduction and tax deductions for home remodelling.
Loans and credit: promoting direct financing to SMEs (ICO) and speeding up the payment deadline for Public Administration’s to 30d and to 60d for large companies.
Increasing competitiveness: simplify administrative processes, international expansion of SMEs, R&D, define energy
policy for 2020, promote off-season tourism.
Giving a boost to industrial policy: increasing the industrial sector’s weight from 15.5% to 18% of GDP, definingthe new strategic sectors (automotive, aerospace, IT and Agri-food).
Reigning in budget deficit: cut personnel expenditure (-4%) and a plan to “streamline” government (cut pay for top-
Ahorro Corporación Financiera, S.V., S.A. 16
Easy financing for SMEs and families: speeding up consolidation of the financial system and use of FROBprogramme.
8/9/2019 Tale of Two Spains
http://slidepdf.com/reader/full/tale-of-two-spains 17/70
June, 2010
Public sector (IV): The “PLAN” (May, 2010)
Goal: reduction of the budget deficit by additional €16bn in 2010 and 2011 on top the €15bn already announced in January.
Measures an estimate savings:
Average reduction in civil servants’ pay of 5% in 2010 and freezing in 2011: €3,169Mn and €2,472Mn, respectively.
Reduction in infrastructure investments: €2,125Mn in 2010 and €2,125Mn in 2011.ens on paymen s reez ng n : , n.
Elimination of transitory early retirement system: €250Mn in 2010 and €150Mn in 2011.
Elimination of the childbirth allowance of €2,500: €1,250Mn in 2011.
, .
Foreign aid cuts: €300Mn in 2010 and €500Mn in 2011.
End to retroactive payments for new applicants for dependency allowances: €300Mn in 2011.
Re ional and local overnments will make an additional savin of €1 200Mn 2010-11 .
Breakdown of total savings: €6.7bn in 2010e and €10.0bn in 2011e (or 0.6% of GDP and 1.0% of GDP).
Impact on Spanish GDP: –0.5% in 2011e:
Private consumption to be eroded by –0.2%.
Non-residential construction investment reduced by –0.2%
Public expenditure to be reduced by an additional –0.1%.
Ahorro Corporación Financiera, S.V., S.A. 17
8/9/2019 Tale of Two Spains
http://slidepdf.com/reader/full/tale-of-two-spains 18/70
June, 2010
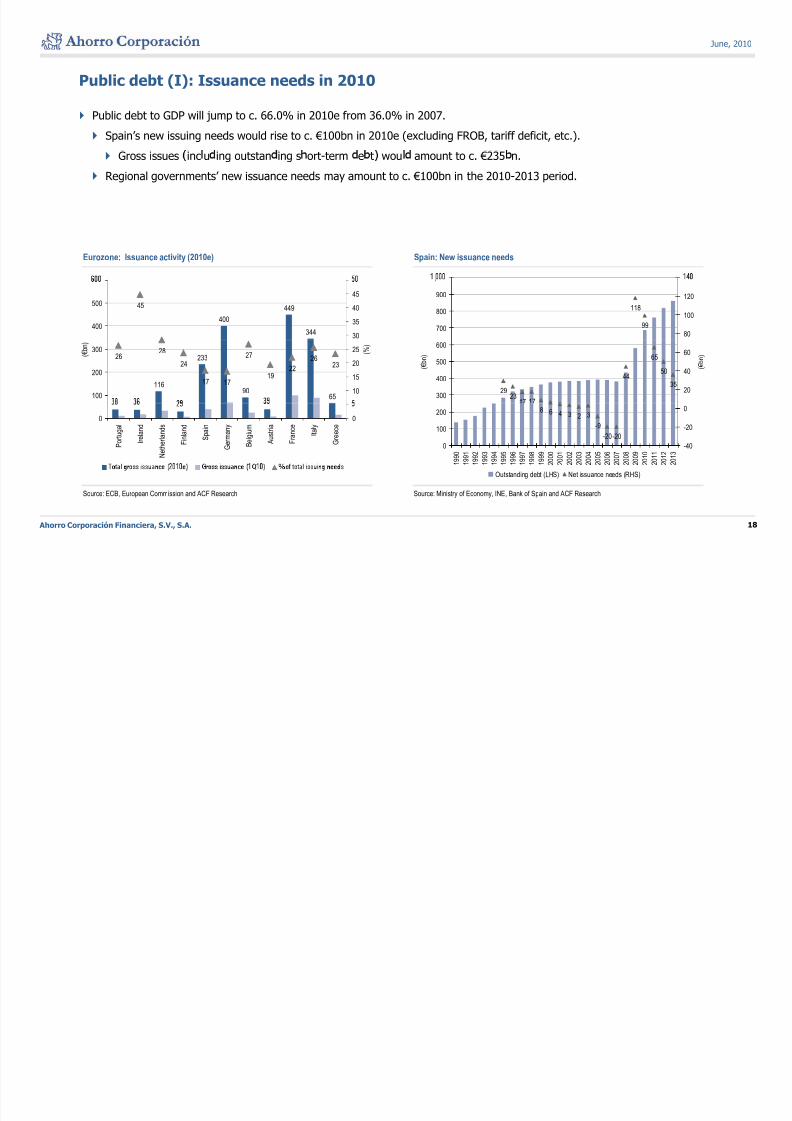
Public debt (I): Issuance needs in 2010
Public debt to GDP will jump to c. 66.0% in 2010e from 36.0% in 2007.
Spain’s new issuing needs would rise to c. €100bn in 2010e (excluding FROB, tariff deficit, etc.).
Gross issues inc u ing outstan ing s ort-term e t wou amount to c. €235 n.
Regional governments’ new issuance needs may amount to c. €100bn in the 2010-2013 period.
Eurozone: Issuance activity (2010e) Spain: New issuance needs
118
99700
800
900
,
80
100
120
400
449
344
45
400
500
30
35
4045
29 2317 17
44
65
50
35
300
400
500
600
( € b n
)
20
40
60
( € b n
)
116
233
90 65
2628
24
17 17
27
1922
2623
100
200
300 ( € b n )
10
15
20
25 ( % )
8 6 4 3 2 3
-9
-20-20
0
100
200
1 9 9 0
1 9 9 1
1 9 9 2
1 9 9 3
1 9 9 4
1 9 9 5
1 9 9 6
1 9 9 7
1 9 9 8
1 9 9 9
2 0 0 0
2 0 0 1
2 0 0 2
2 0 0 3
2 0 0 4
2 0 0 5
2 0 0 6
2 0 0 7
2 0 0 8
2 0 0 9
2 0 1 0
2 0 1 1
2 0 1 2
2 0 1 3
-40
-20
0
0
P o r t u g a l
I r e l a n d
N e t h e r l a n d s
F i n l a n d
S p a i n
G e r m a n y
B e l g i u m
A u s t r i a
F r a n c e
I t a l y
G r e e c e
0
Ahorro Corporación Financiera, S.V., S.A. 18
Source: ECB, European Commission and ACF Research Source: Ministry of Economy, INE, Bank of Spain and ACF Research
Outstanding debt (LHS) Net issuance needs (RHS)
8/9/2019 Tale of Two Spains
http://slidepdf.com/reader/full/tale-of-two-spains 19/70
June, 2010
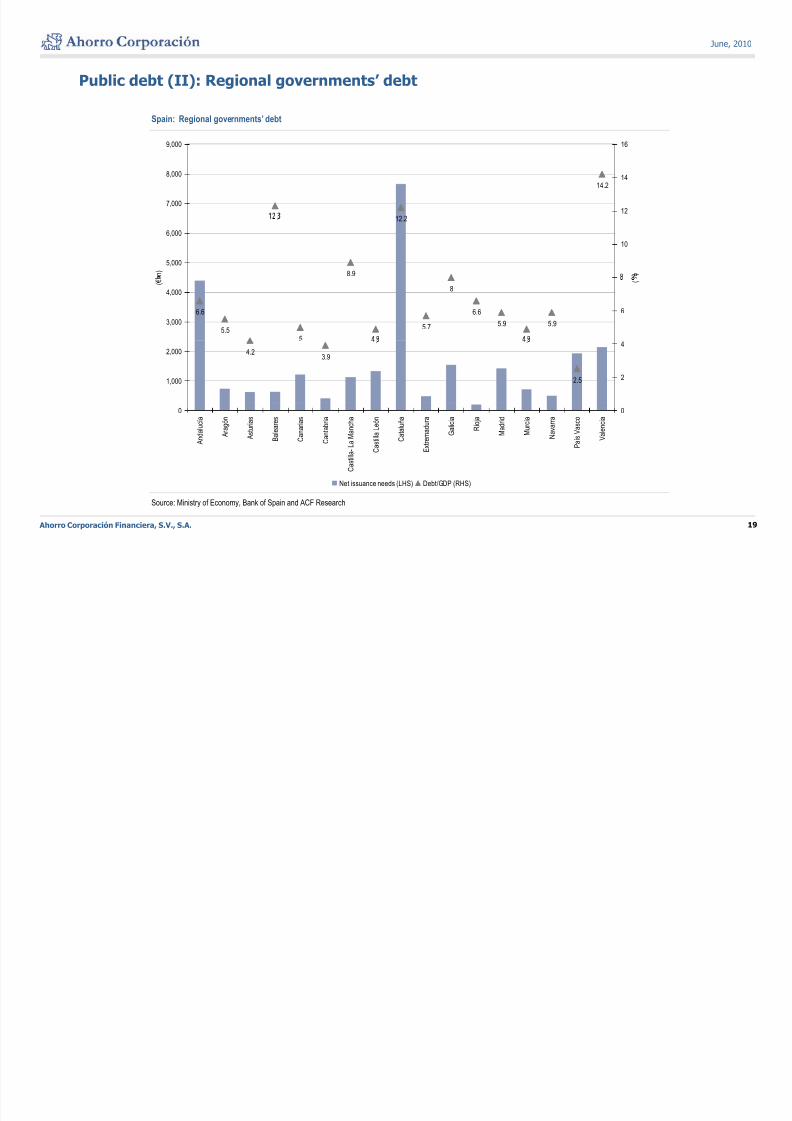
Public debt (II): Regional governments’ debt
Spain: Regional governments’ debt
9,000 16
14.2
7,000
8,000
12
14
.
8.9
12.2
5,000
6,000
n )
10
)
6.6
5.55
5.7
8
6.6
5.9 5.93,000
4,000
( €
6
(
4.23.9
. .
2.51,000
2,000
2
4
0
A n d a l u c í a
A r a g ó n
A s t u r i a s
B a l e a r e s
C a n a r i a s
C a n t a b r i a
a s t i l l a -
L a M a n c h a
C a s t i l l a L e ó n
C a t a l u ñ a
E x t r e m a d u r a
G a l i c i a
R i o j a
M a d r i d
M u r c i a
N a v a r r a
P a í s V a s c o
V a l e n c i a
0
Ahorro Corporación Financiera, S.V., S.A. 19
Source: Ministry of Economy, Bank of Spain and ACF Research
C
Net issuance needs (LHS) Debt/GDP (RHS)
8/9/2019 Tale of Two Spains
http://slidepdf.com/reader/full/tale-of-two-spains 20/70
June, 2010
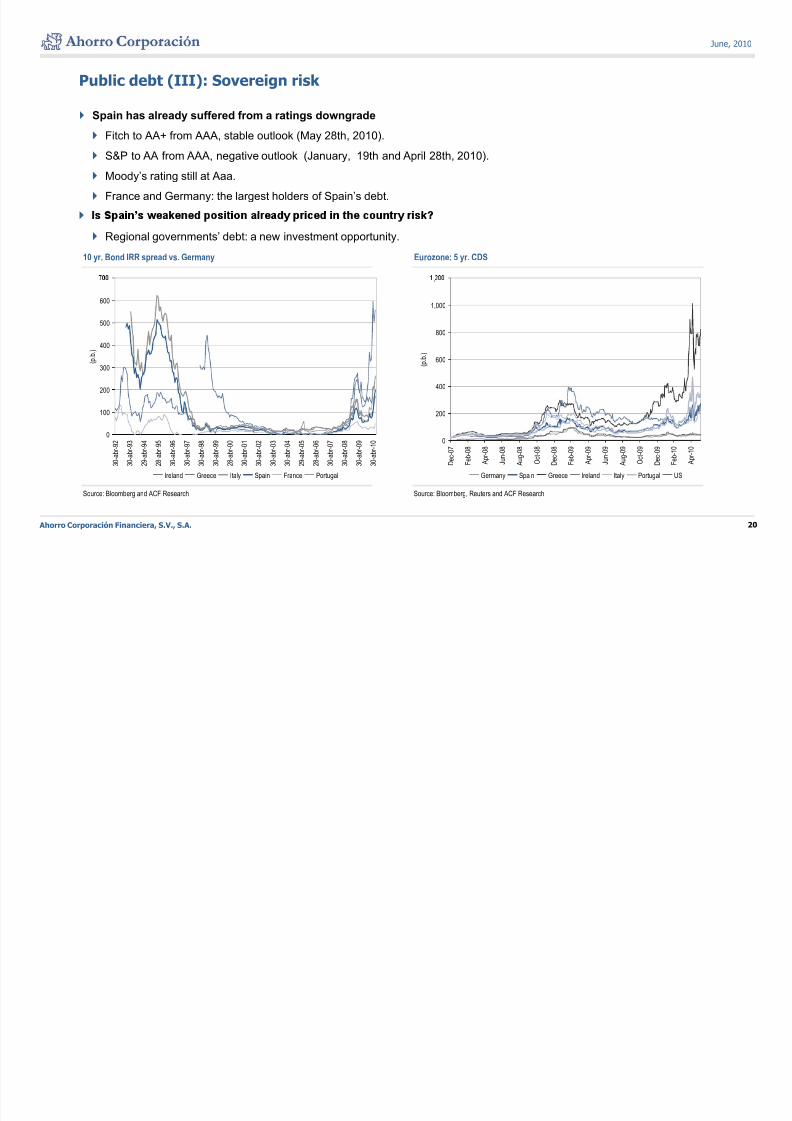
Public debt (III): Sovereign risk
Spain has already suffered from a ratings downgrade
Fitch to AA+ from AAA, stable outlook (May 28th, 2010).
S&P to AA from AAA, negative outlook (January, 19th and April 28th, 2010).
Moody’s rating still at Aaa.
France and Germany: the largest holders of Spain’s debt.
Regional governments’ debt: a new investment opportunity.
10 yr. Bond IRR spread vs. Germany Eurozone: 5 yr. CDS
500
600
800
1,000
,
200
300
400
( p . b . )
400
600 ( p
. b . )
0
100
3 0
- a b r - 9
2
3 0
- a b r - 9
3
2 9
- a b r - 9
4
2 8
- a b r - 9
5
3 0
- a b r - 9
6
3 0
- a b r - 9
7
3 0
- a b r - 9
8
3 0
- a b r - 9
9
2 8
- a b r - 0
0
3 0
- a b r - 0
1
3 0
- a b r - 0
2
3 0
- a b r - 0
3
3 0
- a b r - 0
4
2 9
- a b r - 0
5
2 8
- a b r - 0
6
3 0
- a b r - 0
7
3 0
- a b r - 0
8
3 0
- a b r - 0
9
3 0
- a b r - 1
0 0
200
D e c - 0
7
F e
b - 0
8
A p r - 0
8
J u n - 0
8
A u g - 0
8
O c
t - 0 8
D e c - 0
8
F e
b - 0
9
A p r - 0
9
J u n - 0
9
A u g - 0
9
O c
t - 0 9
D e c - 0
9
F e
b - 1
0
A p r - 1
0
Ahorro Corporación Financiera, S.V., S.A. 20
Source: Bloomberg and ACF Research Source: Bloomberg, Reuters and ACF Research
Ireland Greece Italy Spain France Portugal Germany Spain Greece Ireland Italy Portugal US
8/9/2019 Tale of Two Spains
http://slidepdf.com/reader/full/tale-of-two-spains 21/70
June, 2010
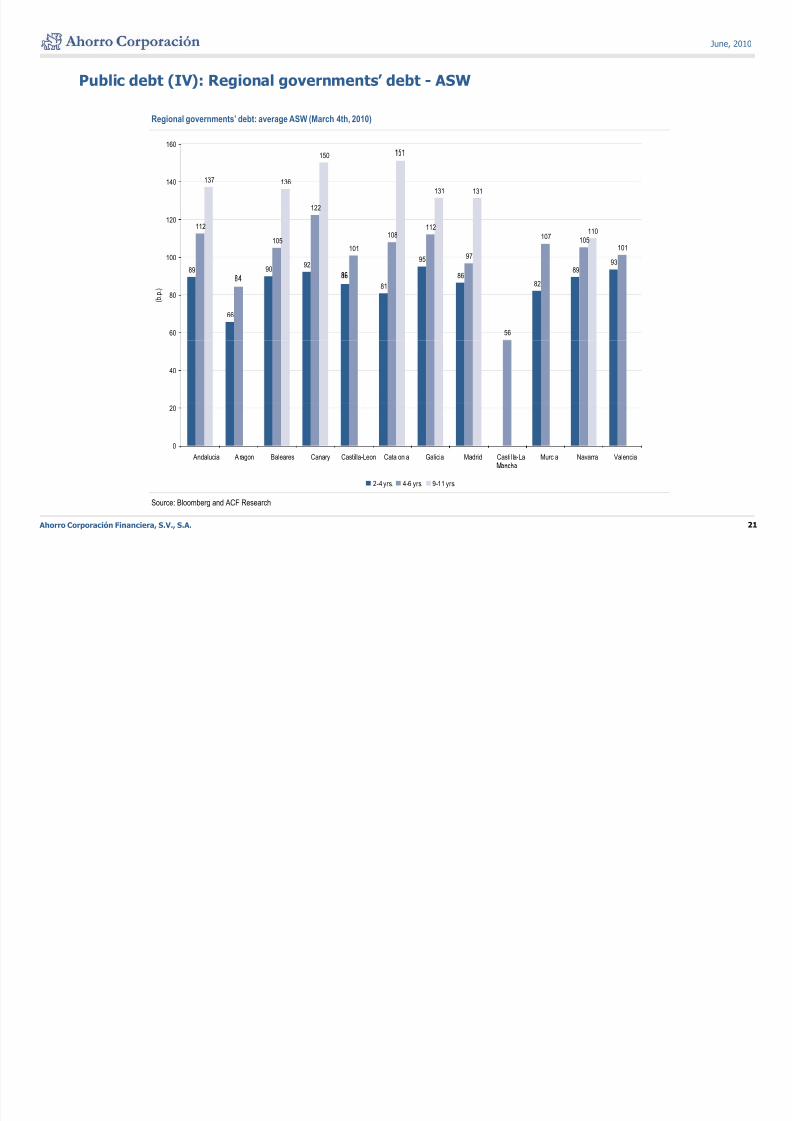
Public debt (IV): Regional governments’ debt - ASW
Regional governments’ debt: average ASW (March 4th, 2010)
160
122
137 136
150
131 131
140
89 9092
95
8689
93
112
105101
108112
97
107105
101
110
100
120
66
81 82
5660
80 ( b . p . )
40
0
20
Andalucia Aragon Baleares Canary Castilla-Leon Catalonia Galicia Madrid Castil la-La Murcia Navarra Valencia
Ahorro Corporación Financiera, S.V., S.A. 21
Source: Bloomberg and ACF Research
2-4 yrs. 4-6 yrs. 9-11 yrs.

8/9/2019 Tale of Two Spains
http://slidepdf.com/reader/full/tale-of-two-spains 22/70
June, 2010
Real estate sector (I): Has it touched bottom?
We estimate a –17.6% drop in investment in residential construction in 2010e and –7.3% in 2011e (–24.5% in 2009).
Housing starts: c. 150,000 in 2009e and 2010e. (–57% vs. 2008 and –80% vs. peak housing starts)
Finis e ouses may reac ow in 2011e or 2012e.
Investment in residential construction may represent c. 6.0% of GDP in 2011e from maximum of 9.0% in 2006.
Still above lows of the early nineties.ey c a enge: re uce epen ence on e res en a cons ruc on sec or.
Spanish GDP: Investment in construction Spain: Housing starts
14 14 13 1312 12 12
1315
161614
14 1413
12 1213
1314
1516
16 17
1818 18
1615 15
14
16
18
600,000
700,000
800,000
,
60
80
100
6
8
10
12
( a s
% o
f G D P )
300,000
400,000
500,000
( u n
i t s )
-20
0
20
40
( % )
6 6 6 5 5 4 4 5 5 5 5 5 4 4 4 4 5 5 5 5 6 7 7 8 8 7 7 6
0
2
4
1 9 8 0
1 9 8 2
1 9 8 4
1 9 8 6
1 9 8 8
1 9 9 0
1 9 9 2
1 9 9 4
1 9 9 6
1 9 9 8
2 0 0 0
2 0 0 2
2 0 0 4
2 0 0 6
2 0 0 8
2 0 1 0 e
0
100,000
200,000
1 9 7 1
1 9 7 4
1 9 7 7
1 9 8 0
1 9 8 3
1 9 8 6
1 9 8 9
1 9 9 2
1 9 9 5
1 9 9 8
2 0 0 1
2 0 0 4
2 0 0 7
2 0 1 0
-80
-60
-40
Ahorro Corporación Financiera, S.V., S.A. 22
Source: INE and ACF Research Source: INE and ACF Research
Investment in construction of which housing Housing starts (LHS) % inc. (LHS)
8/9/2019 Tale of Two Spains
http://slidepdf.com/reader/full/tale-of-two-spains 23/70
June, 2010
Real estate sector (II): Cruising speed
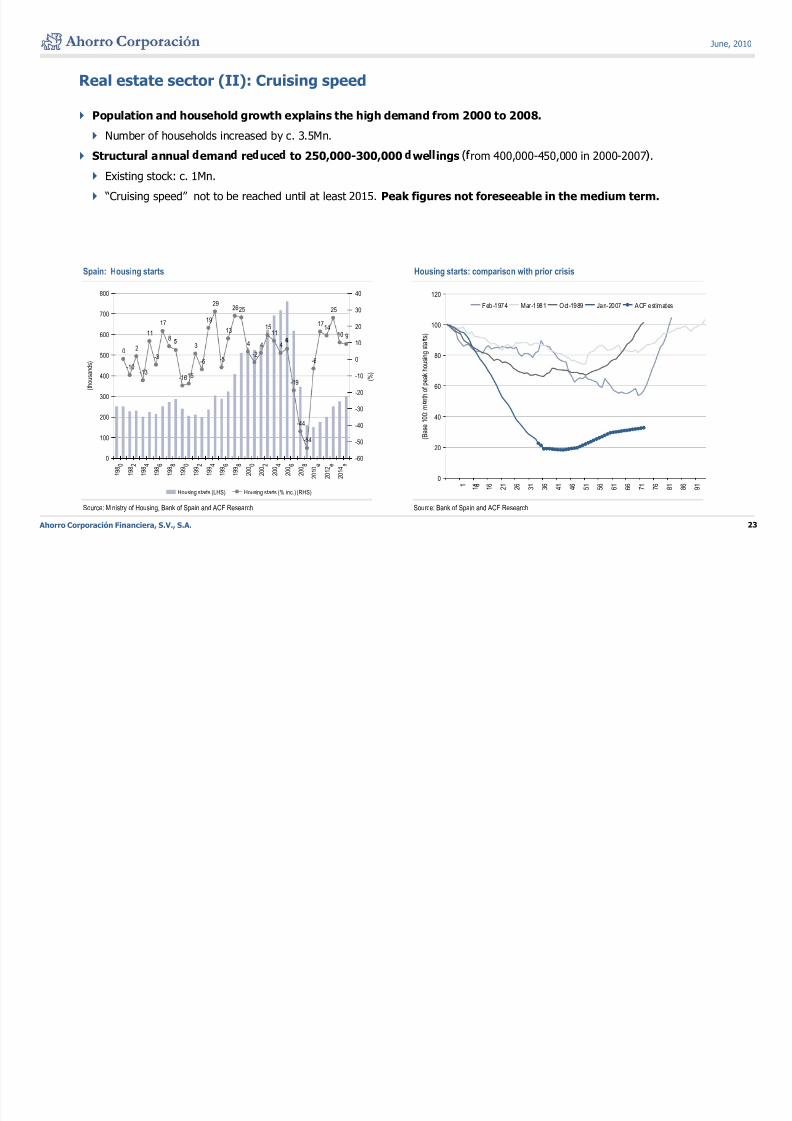
Population and household growth explains the high demand from 2000 to 2008.
Number of households increased by c. 3.5Mn.
Structura annua eman re uce to 250,000-300,000 we ings rom 400,000-450,000 in 2000-2007 .
Existing stock: c. 1Mn.
“Cruising speed” not to be reached until at least 2015. Peak figures not foreseeable in the medium term.
Spain: Housing starts Housing starts: comparison with prior crisis
100
120
t s )
Feb-1974 Mar-1981 Oct-1989 Jan-2007 ACF est imates
11
17
8
19
29
13
2625
1511
1714
25
10 9600
700
800
20
30
40
60
80
n t h
o f p e a k h o u s i n g s t a
0
-10
2
-13
-3
-16
3
-6 -5
4
-2
4 4
-19
-6
-15
300
400
500
( t h o u s a n d s )
-20
-10
0
10
( % )
20
40
( B a s e 1 0 0 : m
-44
-54
0
100
200
0 2 4 6 8 0 2 4 6 8 0 2 4 6 8 e e e
-60
-50
-40
-30
Ahorro Corporación Financiera, S.V., S.A. 23
Source: Ministry of Housing, Bank of Spain and ACF Research Source: Bank of Spain and ACF Research
0 1 6
1 1
1 6
2 1
2 6
3 1
3 6
4 1
4 6
5 1
5 6
6 1
6 6
7 1
7 6
8 1
8 6
9 1
1 9 8
1 9 8
1 9 8
1 9 8
1 9 8
1 9 9
1 9 9
1 9 9
1 9 9
1 9 9
2 0 0
2 0 0
2 0 0
2 0 0
2 0 0
2 0 1 0
2 0 1 2
2 0 1 4
Housing starts (LHS) Housing starts (% inc.) (RHS)

8/9/2019 Tale of Two Spains
http://slidepdf.com/reader/full/tale-of-two-spains 24/70
June, 2010
Real estate sector (III): Prices
Prices may fall by –1.0%/ –5.0% in nominal terms in 2010e (– 6.3% in 2009), totalling a – 11.0%/ –15.0% drop from peak levels (–19.0%/ – 24.0% in real terms).
–
We expect 0% price increases in the medium term, implying c. –35% in real prices in eight years.
Price per square metre (% inc.) Price per square metre trend
25
30
35
Less than 2 years old More than 2 yrs.
Real price (Sociedad de Tasación) Average (Sociedad de Tasación)
Average2,500
3,000
,
)
5
10
15
( % i n
c . )
1,000
1,500
2,000
( € p e r s q u a r e m e t e r
-15
-10
-5
9 8 6
9 8 8
9 9 0
9 9 2
9 9 4
9 9 6
9 9 8
0 0 0
0 0 2
0 0 4
0 0 6
0 0 8
0 1 0
0
500
1 9 9 5
1 9 9 6
1 9 9 7
1 9 9 8
1 9 9 9
2 0 0 0
2 0 0 1
2 0 0 2
2 0 0 3
2 0 0 4
2 0 0 5
2 0 0 6
2 0 0 7
2 0 0 8
2 0 0 9
2 0 1 0
Ahorro Corporación Financiera, S.V., S.A. 24
Source: Ministry o f Housing, Sociedad de Tasación and ACF Research Source: Ministry of Housing, Sociedad de Tasación and ACF Research
1 1 1 1 1 1 1 2 2 2 2 2 2
Average Less than 2 years o ld More than 2 y rs . Madrid País Vasco Ext remadura

8/9/2019 Tale of Two Spains
http://slidepdf.com/reader/full/tale-of-two-spains 25/70
June, 2010
Real estate sector (IV): Why prices have not fallen much
Average payment declined by –27.3% in 2009.
We expected payments to be stable in 2010e but they may increase by c. 17.0% in 2011e due to higher interest rates.
A or a i ity ratio roppe to 27.9% in 1Q10 rom 34.1% in 1Q09 an a maximum o 42.5% in 3Q08.
We expect this level to hold steady in the coming years.
Higher interest rates impact to be offset by increasing family income and flat property prices.ax sav ngs o e e m na e as o or ren a s g er an , : c. . p.p. mpac
Annual mortgage payments Affordablity ratio
-
-9
-5 -5
-1410,000
12,000
-10
0
50.0
60.0
-40 -39
-29
-23-25 -26
-19
-24
-27.3
6,000
8,000
( € )
-30
-20
( % ) 30.0
40.0
( % )
-50 -50 -50 -49
-44
0
2,000
4,000
-60
-50
-40
0.0
10.0
.
Ahorro Corporación Financiera, S.V., S.A. 25
Source: AHE, Bank of Spain ACF Research Source: AHE, Bank of Spain ACF Research
1 9 9 0
1 9 9 1
1 9 9 2
1 9 9 3
1 9 9
1 9 9 5
1 9 9 6
1 9 9 7
1 9 9 8
1 9 9 9
2 0 0 0
2 0 0 1
2 0 0 2
2 0 0 3
2 0 0
2 0 0 5
2 0 0 6
2 0 0 7
2 0 0 8
2 0 0 9 e
2 0 1 0 e
2 0 1 1 e
2 0 1 2 e
Initial payment 2009e payment 2011e payment Payment reduction (%) (RHS)
1 9 9 5
1 9 9 6
1 9 9 7
1 9 9 8
1 9 9 9
2 0 0 0
2 0 0 1
2 0 0 2
2 0 0 3
2 0 0 4
2 0 0 5
2 0 0 6
2 0 0 7
2 0 0 8
2 0 0 9
2 0 1 0
Affordabilty ratio Affordabilty ratio (inc. tax savings)
8/9/2019 Tale of Two Spains
http://slidepdf.com/reader/full/tale-of-two-spains 26/70
June, 2010
Financial sector (I): Earnings outlook
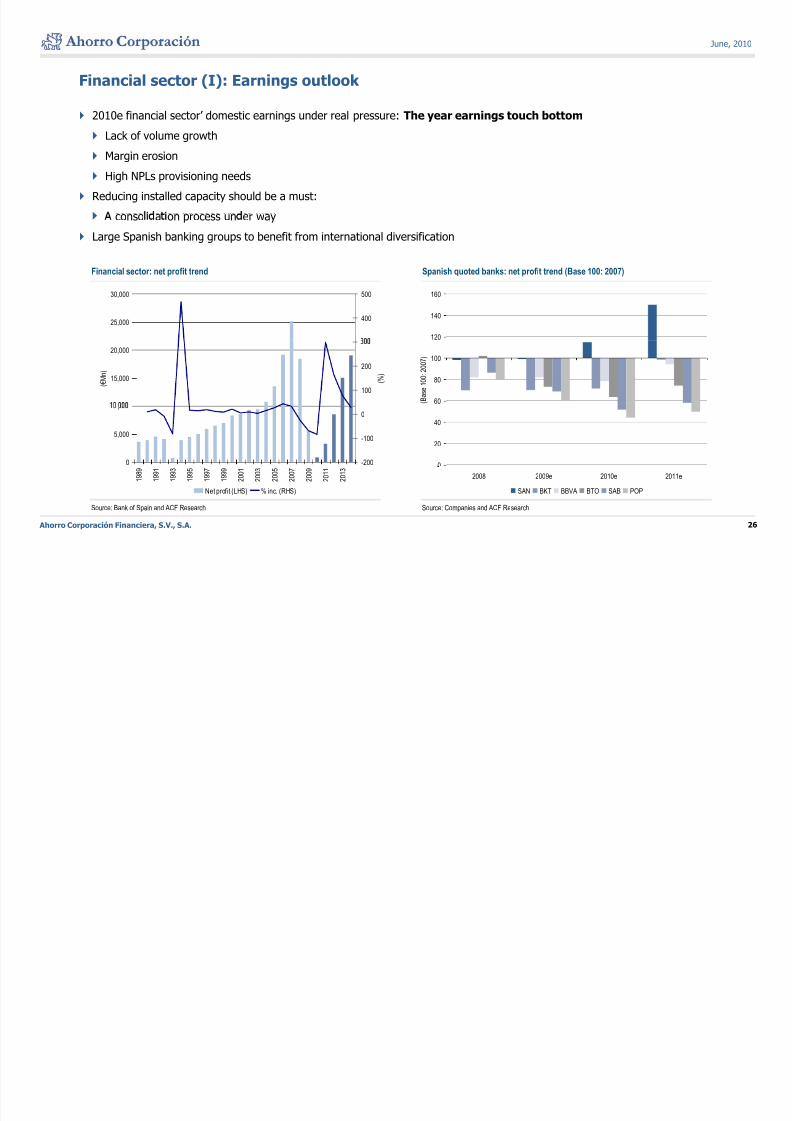
2010e financial sector’ domestic earnings under real pressure: The year earnings touch bottom
Lack of volume growth
Margin erosion
High NPLs provisioning needs
Reducing installed capacity should be a must:
conso a on process un er way
Large Spanish banking groups to benefit from international diversification
Financial sector: net profit trend Spanish quoted banks: net profit trend (Base 100: 2007)
25,000
30,000
400
500
120
140
160
15,000
20,000
( € M n )
100
200
( % )
60
80
100
( B a
s e 1 0 0 : 2 0 0 7 )
0
5,000
,
-200
-100
0
0
20
40
Ahorro Corporación Financiera, S.V., S.A. 26
Source: Bank of Spain and ACF Research Source: Companies and ACF Research
1 9 8 9
1 9 9 1
1 9 9 3
1 9 9 5
1 9 9 7
1 9 9 9
2 0 0 1
2 0 0 3
2 0 0 5
2 0 0 7
2 0 0 9
2 0 1 1
2 0 1 3
Net profit (LHS) % inc. (RHS)
2008 2009e 2010e 2011e
SAN BKT BBVA BTO SAB POP
8/9/2019 Tale of Two Spains
http://slidepdf.com/reader/full/tale-of-two-spains 27/70
June, 2010
Financial sector (II): Volume growth
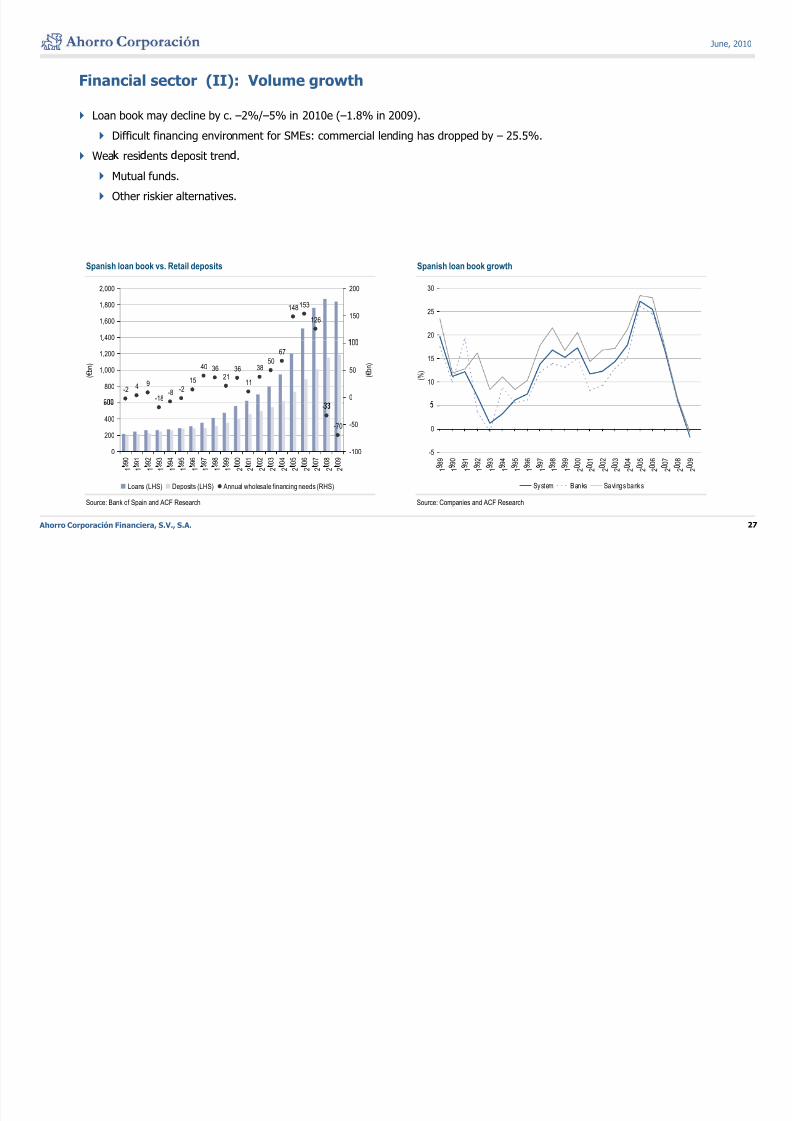
Loan book may decline by c. –2%/–5% in 2010e (–1.8% in 2009).
Difficult financing environment for SMEs: commercial lending has dropped by – 25.5%.
Wea resi ents eposit tren .
Mutual funds.
Other riskier alternatives.
Spanish loan book vs. Retail deposits Spanish loan book growth
20
25
30
148153
126
1,400
1,600
1,800
2,000
150
200
10
15
( % )
-2 4 9
-18 -8
-215
40 3621
36
11
3850
67
800
1,000
1,200
( € b n )
0
50 ( € b n )
-5
0
8 9
9 0
9 1
9 2
9 3
9 4
9 5
9 6
9 7
9 8
9 9
0 0
0 1
0 2
0 3
0 4
0 5
0 6
0 7
0 8
0 9
-
-70
0
200
400
9 9 0
9 9 1
9 9 2
9 9 3
9 9 4
9 9 5
9 9 6
9 9 7
9 9 8
9 9 9
0 0 0
0 0 1
0 0 2
0 0 3
0 0 4
0 0 5
0 0 6
0 0 7
0 0 8
0 0 9
-100
-50
Ahorro Corporación Financiera, S.V., S.A. 27
Source: Bank of Spain and ACF Research Source: Companies and ACF Research
1 1 1 1 1 1 1 1 1 1 1 2 2 2 2 2 2 2 2 2 2
System Banks Savings banks
1 1 1 1 1 1 1 1 1 1 2 2 2 2 2 2 2 2 2 2
Loans (LHS) Deposits (LHS) Annual wholesale financing needs (RHS)
8/9/2019 Tale of Two Spains
http://slidepdf.com/reader/full/tale-of-two-spains 28/70
June, 2010
Financial sector (III): Asset quality
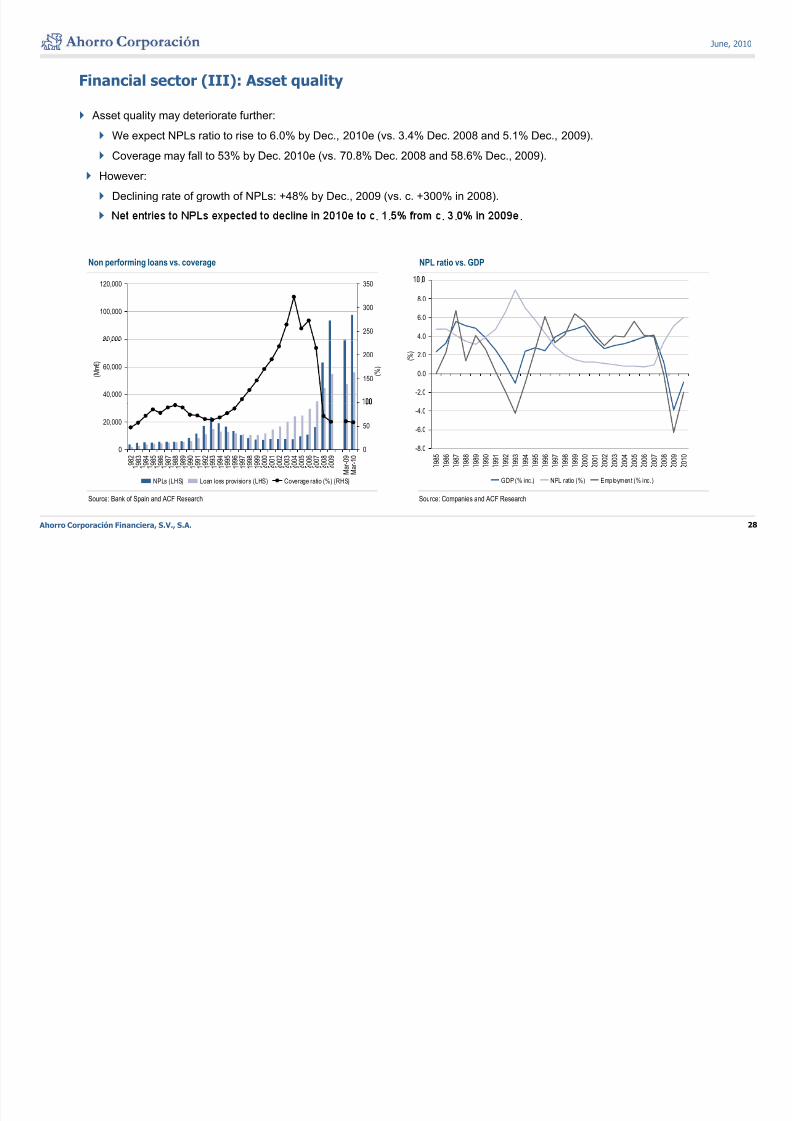
Asset quality may deteriorate further:
We expect NPLs ratio to rise to 6.0% by Dec., 2010e (vs. 3.4% Dec. 2008 and 5.1% Dec., 2009).
Coverage may fall to 53% by Dec. 2010e (vs. 70.8% Dec. 2008 and 58.6% Dec., 2009).
However:
Declining rate of growth of NPLs: +48% by Dec., 2009 (vs. c. +300% in 2008).
. . . . .
Non performing loans vs. coverage NPL ratio vs. GDP
4.0
6.0
8.0
.
80 000
100,000
120,000
250
300
350
-2.0
0.0
2.0 ( % )
40,000
60,000
,
( M n € )
150
200
( % )
-8.0
-6.0
-4.0
1 9 8 5
1 9 8 6
1 9 8 7
1 9 8 8
1 9 8 9
1 9 9 0
1 9 9 1
1 9 9 2
1 9 9 3
1 9 9 4
1 9 9 5
1 9 9 6
1 9 9 7
1 9 9 8
1 9 9 9
2 0 0 0
2 0 0 1
2 0 0 2
2 0 0 3
2 0 0 4
2 0 0 5
2 0 0 6
2 0 0 7
2 0 0 8
2 0 0 9
2 0 1 0
0
20,000
9 8 2
9 8 3
9 8 4
9 8 5
9 8 6
9 8 7
9 8 8
9 8 9
9 9 0
9 9 1
9 9 2
9 9 3
9 9 4
9 9 5
9 9 6
9 9 7
9 9 8
9 9 9
0 0 0
0 0 1
0 0 2
0 0 3
0 0 4
0 0 5
0 0 6
0 0 7
0 0 8
0 0 9
r - 0 9
r - 1 0
0
50
Ahorro Corporación Financiera, S.V., S.A. 28
Source: Bank of Spain and ACF Research Source: Companies and ACF Research
GDP (% inc.) NPL ratio (%) Employment (% inc.)
1 1 1 1 1 1 1 1 1 1 1 1 1 1 1 1 1 1 M a
M a
NPLs (LHS) Loan loss provisions (LHS) Coverage ratio (%) (RHS)
8/9/2019 Tale of Two Spains
http://slidepdf.com/reader/full/tale-of-two-spains 29/70
June, 2010
Financial sector (IV): The solvency issue
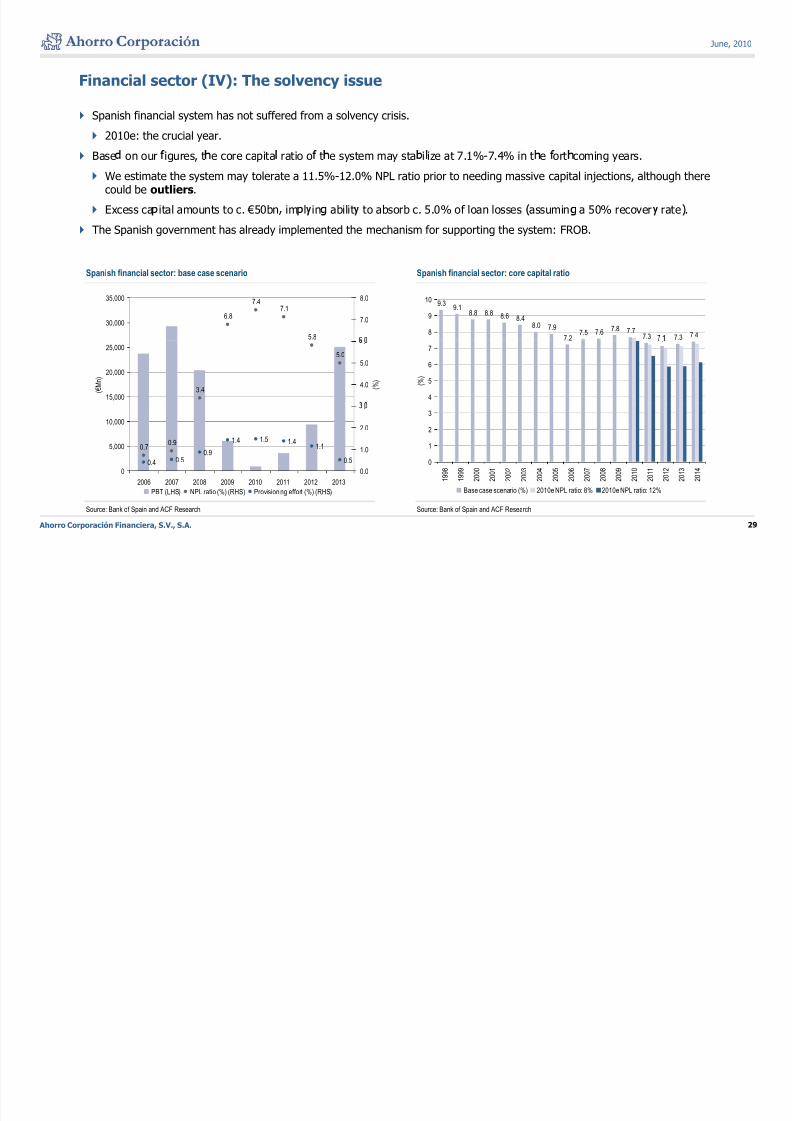
Spanish financial system has not suffered from a solvency crisis.
2010e: the crucial year.
Base on our igures, t e core capita ratio o t e system may sta i ize at 7.1%-7.4% in t e ort coming years.
We estimate the system may tolerate a 11.5%-12.0% NPL ratio prior to needing massive capital injections, although therecould be outliers.
Excess ca ital amounts to c. €50bn im l in abilit to absorb c. 5.0% of loan losses assumin a 50% recover rate .
The Spanish government has already implemented the mechanism for supporting the system: FROB.
Spanish financial sector: base case scenario Spanish financial sector: core capital ratio
6.8
7.47.1
5.8
30,000
35,000
7.0
8.0 9.39.1
8.8 8.8 8.6 8.48.0 7.9
7.27.5 7.6 7.8 7.7
7.3 7.3 7.48
9
10
3.4
5.0
15,000
20,000
25,000
( € M n )
4.0
5.0
.
( % )
.
4
5
6
7
( % )
0.70.9
0.4 0.50.9
1.4 1.5 1.41.1
0.5
5,000
10,000
1.0
2.0
.
0
1
2
3
Ahorro Corporación Financiera, S.V., S.A. 29
Source: Bank of Spain and ACF Research Source: Bank of Spain and ACF Research
0
2006 2007 2008 2009 2010 2011 2012 2013
0.0
PBT (LHS) NPL ratio (%) (RHS) Provisioning effort (%) (RHS)
1 9 9 8
1 9 9 9
2 0 0 0
2 0 0 1
2 0 0 2
2 0 0 3
2 0 0 4
2 0 0 5
2 0 0 6
2 0 0 7
2 0 0 8
2 0 0 9
2 0 1 0
2 0 1 1
2 0 1 2
2 0 1 3
2 0 1 4
Base case scenario (%) 2010e NPL ratio: 8% 2010e NPL ratio: 12%
8/9/2019 Tale of Two Spains
http://slidepdf.com/reader/full/tale-of-two-spains 30/70
June, 2010
Financial sector (V): FROB
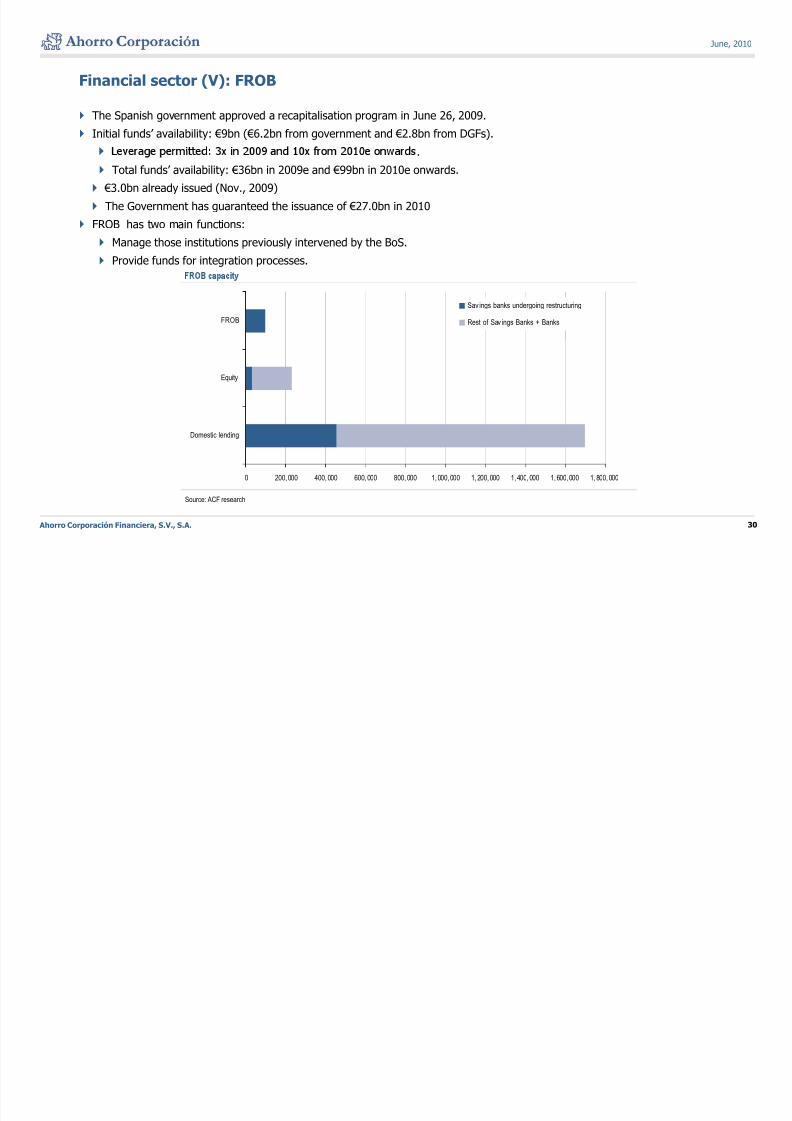
The Spanish government approved a recapitalisation program in June 26, 2009.
Initial funds’ availability: €9bn (€6.2bn from government and €2.8bn from DGFs).
.
Total funds’ availability: €36bn in 2009e and €99bn in 2010e onwards.
€3.0bn already issued (Nov., 2009)
The Government has guaranteed the issuance of €27.0bn in 2010
FROB has two main functions:
Manage those institutions previously intervened by the BoS.
Provide funds for integration processes.
FROB
Sav ings banks undergoing restructuring
Rest of Sav ings Banks + Banks
Equity
Domestic lending
Ahorro Corporación Financiera, S.V., S.A. 30
0 200,000 400,000 600,000 800,000 1,000,000 1,200,000 1,400,000 1,600,000 1,800,000
Source: ACF research
J 2010
8/9/2019 Tale of Two Spains
http://slidepdf.com/reader/full/tale-of-two-spains 31/70
June, 2010
Financial sector (VI): Consolidation process
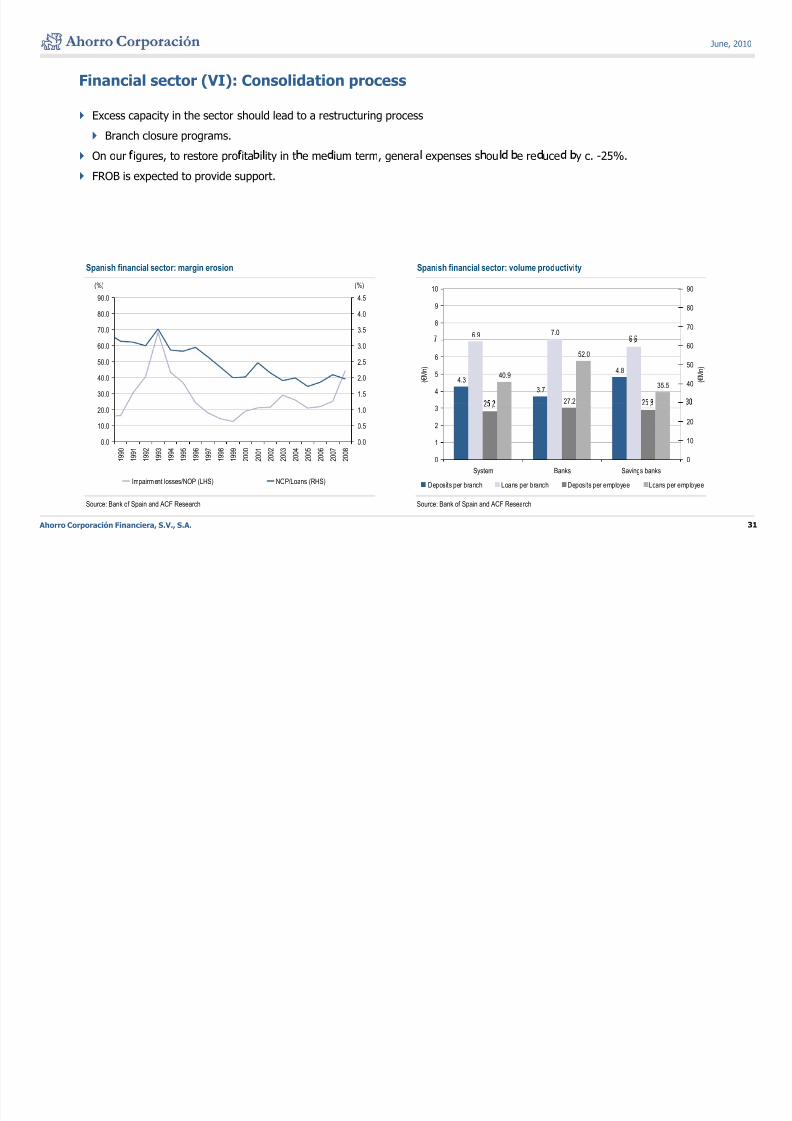
Excess capacity in the sector should lead to a restructuring process
Branch closure programs.
On our igures, to restore pro ita i ity in t e me ium term, genera expenses s ou e re uce y c. -25%.
FROB is expected to provide support.
Spanish financial sector: margin erosion Spanish financial sector: volume productivity
6.9 7.0
8
9
10
70
80
90
70.0
80.0
90.0
(%)
3.5
4.0
4.5
(%)
4.3
3.7
4.8
.
27.2
40.9
52.0
35.54
5
6
( € M n )
40
50
60
( € M n )
30.0
40.0
50.0
60.0
1.5
2.0
2.5
3.0
. .
0
1
2
3
0
10
20
0.0
10.0
20.0
1 9 9 0
1 9 9 1
1 9 9 2
1 9 9 3
1 9 9 4
1 9 9 5
1 9 9 6
1 9 9 7
1 9 9 8
1 9 9 9
2 0 0 0
2 0 0 1
2 0 0 2
2 0 0 3
2 0 0 4
2 0 0 5
2 0 0 6
2 0 0 7
2 0 0 8
0.0
0.5
1.0
Ahorro Corporación Financiera, S.V., S.A. 31
Source: Bank of Spain and ACF Research Source: Bank of Spain and ACF Research
System Banks Savings banks
Deposits per branch Loans per branch Deposits per employee Loans per employeeImpairment losses/NOP (LHS) NOP/Loans (RHS)
J ne 2010
8/9/2019 Tale of Two Spains
http://slidepdf.com/reader/full/tale-of-two-spains 32/70
June, 2010
Financial sector (VII): Savings banks
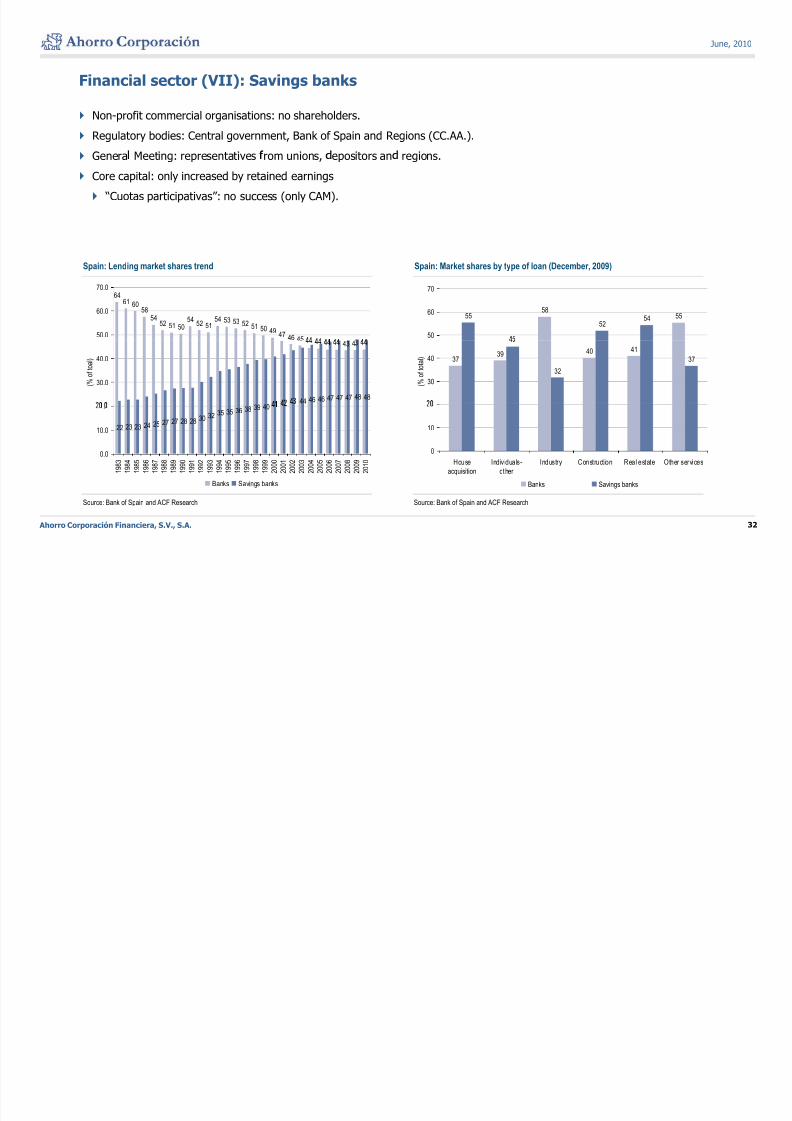
Non-profit commercial organisations: no shareholders.
Regulatory bodies: Central government, Bank of Spain and Regions (CC.AA.).
Genera Meeting: representatives rom unions, epositors an regions.
Core capital: only increased by retained earnings
“Cuotas participativas”: no success (only CAM).
Spain: Lending market shares trend Spain: Market shares by type of loan (December, 2009)
6461 60
5854
52 51 5054
52 5154 53 53 52 51 50 49
47 46 4550.0
60.0
70.0
585555
5254
50
60
70
43 4
44 46 46 47 47 47 48 48
30.0
40.0
( % o
f t o a l ) 37
39 40 41
32
37
30
40
( % o
f t o t a l )
22 23 23 24 25 27 27 28 28 30 32 35 35 36 38 39 40
0.0
10.0
.
8 3
8 4
8 5
8 6
8 7
8 8
8 9
9 0
9 1
9 2
9 3
9 4
9 5
9 6
9 7
9 8
9 9
0 0
0 1
0 2
0 3
0 4
0 5
0 6
0 7
0 8
0 9
1 0
0
10
House Individuals- Industry Construction Real estate Other services
Ahorro Corporación Financiera, S.V., S.A. 32
Source: Bank of Spain and ACF Research Source: Bank of Spain and ACF Research
1 9
1 9
1 9
1 9
1 9
1 9
1 9
1 9
1 9
1 9
1 9
1 9
1 9
1 9
1 9
1 9
1 9
2 0
2 0
2 0
2 0
2 0
2 0
2 0
2 0
2 0
2 0
2 0
Banks Savings banks
acquisition other
Banks Savings banks
June 2010
8/9/2019 Tale of Two Spains
http://slidepdf.com/reader/full/tale-of-two-spains 33/70
June, 2010
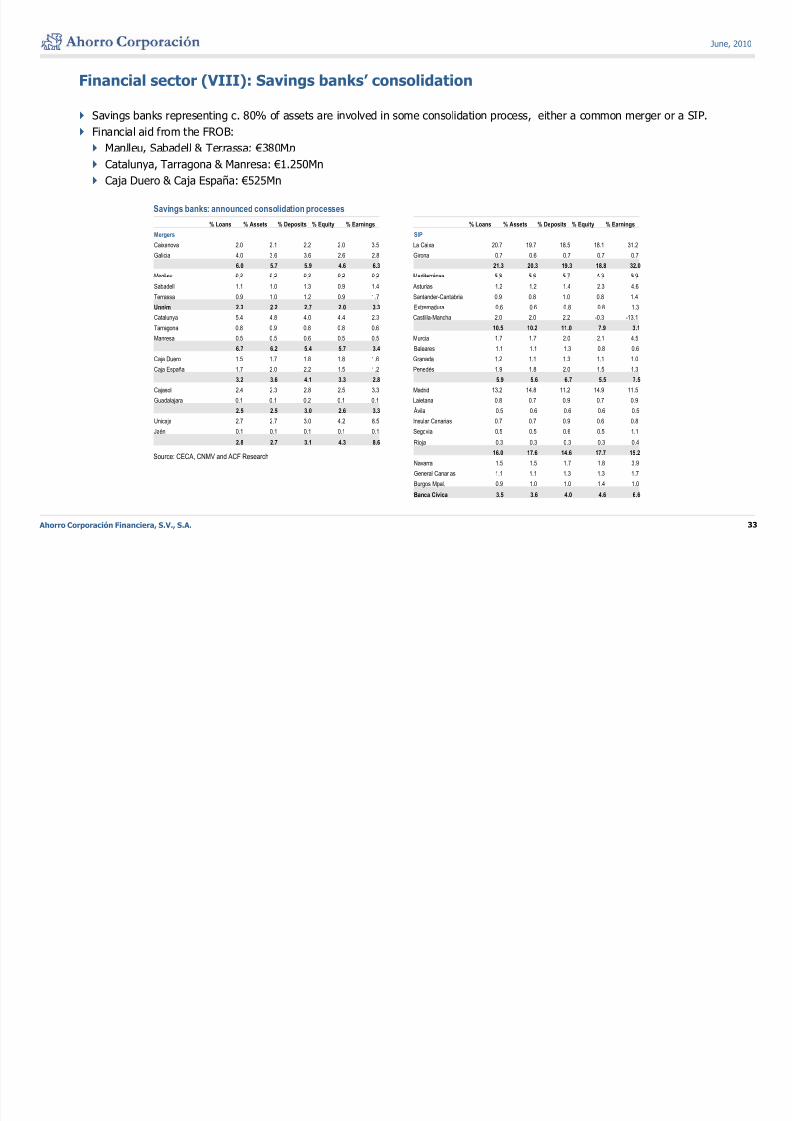
Financial sector (VIII): Savings banks’ consolidation
Savings banks representing c. 80% of assets are involved in some consolidation process, either a common merger or a SIP.
Financial aid from the FROB:
Manlleu Sabadell & Terrassa: €380Mn
Catalunya, Tarragona & Manresa: €1.250Mn
Caja Duero & Caja España: €525Mn
Savings banks: announced consolidation processes
% Loans % Assets % Deposits % Equity % Earnings % Loans % Assets % Deposits % Equity % Earnings
Mergers SIP
Caixanova 2.0 2.1 2.2 2.0 3.5 La Caixa 20.7 19.7 18.5 18.1 31.2
Galicia 4.0 3.6 3.6 2.6 2.8 Girona 0.7 0.6 0.7 0.7 0.7
6.0 5.7 5.9 4.6 6.3 21.3 20.3 19.3 18.8 32.0
Manlleu 0.3 0.2 0.3 0.2 0.2 Mediterráneo 5.8 5.6 5.7 4.3 8.9. . . . . . . . . .
Sabadell 1.1 1.0 1.3 0.9 1.4 Asturias 1.2 1.2 1.4 2.3 4.6
Terrassa 0.9 1.0 1.2 0.9 1.7 Santander-Cantabria 0.9 0.8 1.0 0.8 1.4Unnim 2.3 2.2 2.7 2.0 3.3 Extremadura 0.6 0.6 0.8 0.8 1.3
Catalunya 5.4 4.8 4.0 4.4 2.3 Castilla-Mancha 2.0 2.0 2.2 -0.3 -13.1
Tarragona 0.8 0.9 0.8 0.8 0.6 10.5 10.2 11.0 7.9 3.1
Manresa 0.5 0.5 0.6 0.5 0.5 Murcia 1.7 1.7 2.0 2.1 4.5
6.7 6.2 5.4 5.7 3.4 Baleares 1.1 1.1 1.3 0.8 0.6
Caja Duero 1.5 1.7 1.8 1.8 1.6 Granada 1.2 1.1 1.3 1.1 1.0
Caja España 1.7 2.0 2.2 1.5 1.2 Penedés 1.9 1.8 2.0 1.5 1.3
3.2 3.6 4.1 3.3 2.8 5.9 5.6 6.7 5.5 7.5
Cajasol 2.4 2.3 2.8 2.5 3.3 Madrid 13.2 14.8 11.2 14.9 11.5
Guadalajara 0.1 0.1 0.2 0.1 0.1 Laietana 0.8 0.7 0.9 0.7 0.92.5 2.5 3.0 2.6 3.3 Ávila 0.5 0.6 0.6 0.6 0.5
Unicaja 2.7 2.7 3.0 4.2 8.5 Insular Canarias 0.7 0.7 0.9 0.6 0.8
Jaén 0.1 0.1 0.1 0.1 0.1 Segovia 0.5 0.5 0.6 0.5 1.1
2.8 2.7 3.1 4.3 8.6 Rioja 0.3 0.3 0.3 0.3 0.4
16.0 17.6 14.6 17.7 15.2
Navarra 1.5 1.5 1.7 1.8 3.9Source: CECA, CNMV and ACF Research
Ahorro Corporación Financiera, S.V., S.A. 33
General Canarias 1.1 1.1 1.3 1.3 1.7
Burgos Mpal. 0.9 1.0 1.0 1.4 1.0
Banca Cívica 3.5 3.6 4.0 4.6 6.6
June 2010
8/9/2019 Tale of Two Spains
http://slidepdf.com/reader/full/tale-of-two-spains 34/70
June, 2010
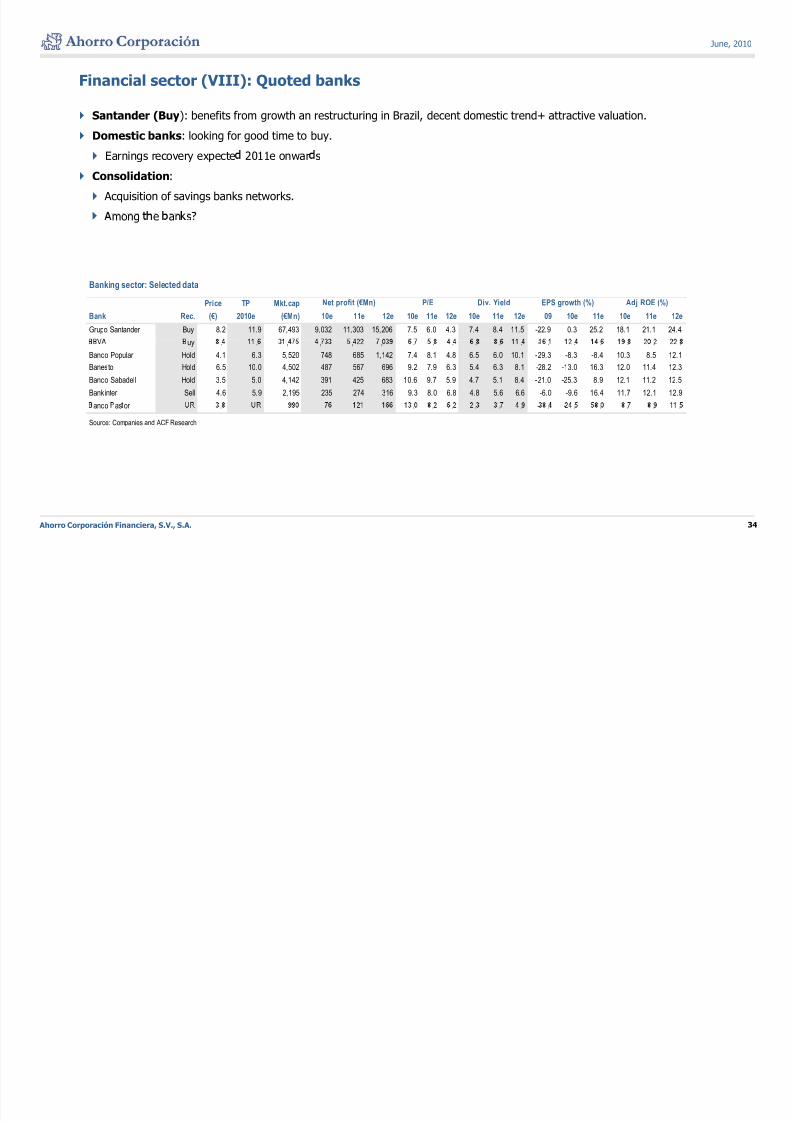
Financial sector (VIII): Quoted banks
Santander (Buy): benefits from growth an restructuring in Brazil, decent domestic trend+ attractive valuation.
Domestic banks: looking for good time to buy.
Earnings recovery expecte 2011e onwar s
Consolidation:
Acquisition of savings banks networks.
mong e an s
Banking sector: Selected data
Price TP Mkt.cap
Bank Rec. (€) 2010e (€Mn) 10e 11e 12e 10e 11e 12e 10e 11e 12e 09 10e 11e 10e 11e 12e
Grupo Santander Buy 8.2 11.9 67,493 9,032 11,303 15,206 7.5 6.0 4.3 7.4 8.4 11.5 -22.9 0.3 25.2 18.1 21.1 24.4
Net profit (€Mn) Adj ROE (%)EPS growth (%)P/E Div. Yield
uy . . , , , , . . . . . . - . . . . . .
Banco Popular Hold 4.1 6.3 5,520 748 685 1,142 7.4 8.1 4.8 6.5 6.0 10.1 -29.3 -8.3 -8.4 10.3 8.5 12.1
Banesto Hold 6.5 10.0 4,502 487 567 696 9.2 7.9 6.3 5.4 6.3 8.1 -28.2 -13.0 16.3 12.0 11.4 12.3
Banco Sabadell Hold 3.5 5.0 4,142 391 425 683 10.6 9.7 5.9 4.7 5.1 8.4 -21.0 -25.3 8.9 12.1 11.2 12.5
Bankinter Sell 4.6 5.9 2,195 235 274 316 9.3 8.0 6.8 4.8 5.6 6.6 -6.0 -9.6 16.4 11.7 12.1 12.9
Source: Companies and ACF Research
anco as or . . . . . . . - . - . . . . .
Ahorro Corporación Financiera, S.V., S.A. 34
June, 2010
8/9/2019 Tale of Two Spains
http://slidepdf.com/reader/full/tale-of-two-spains 35/70
June, 2010
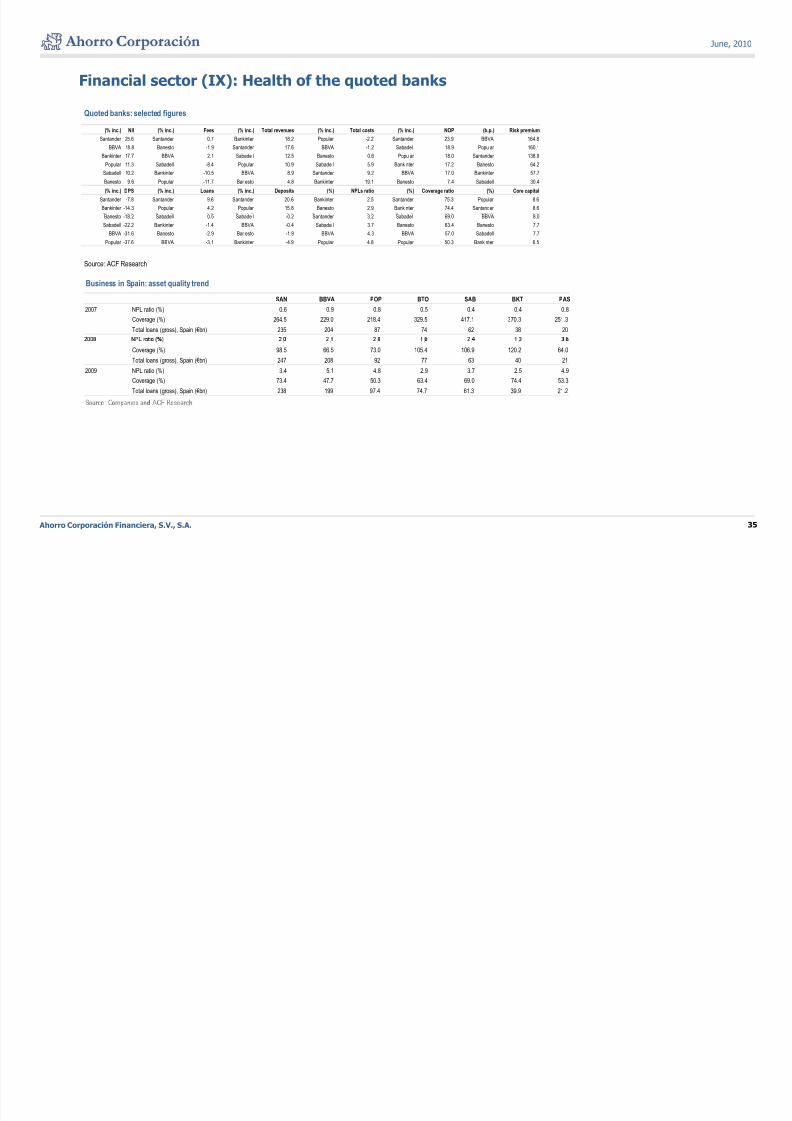
Financial sector (IX): Health of the quoted banks
Quoted banks: selected figures
(% inc.) NII (% inc.) Fees (% inc.) Total revenues (% inc.) Total costs (% inc.) NOP (b.p.) Risk premium
Santander 25.6 Santander 0.7 Bankinter 18.2 Popular -2.2 Santander 23.9 BBVA 164.8
BBVA 18.8 Banesto -1.9 Santander 17.6 BBVA -1.2 Sabadell 18.9 Popular 160.1
Bankinter 17.7 BBVA -2.1 Sabadell 12.5 Banesto 0.6 Popular 18.0 Santander 138.9
Popular 11.3 Sabadell -8.4 Popular 10.9 Sabadell 5.9 Bankinter 17.2 Banesto 64.2
Sabadell 10.2 Bankinter -10.5 BBVA 8.9 Santander 9.2 BBVA 17.0 Bankinter 57.7
Banesto 9.6 Popular -11.7 Banesto 4.8 Bankinter 19.1 Banesto 7.4 Sabadell 30.4
(% inc.) DPS (% inc.) Loans (% inc.) Deposits (%) NPLs ratio (%) Coverage ratio (%) Core capital
Santander -7.8 Santander 9.6 Santander 20.6 Bankinter 2.5 Santander 75.3 Popular 8.6
Bankinter -14.3 Popular 4.2 Popular 15.8 Banesto 2.9 Bankinter 74.4 Santander 8.6
Source: ACF Research
Banesto -18.2 Sabadell 0.5 Sabadell -0.2 Santander 3.2 Sabadell 69.0 BBVA 8.0
Sabadell -22.2 Bankinter -1.4 BBVA -0.4 Sabadell 3.7 Banesto 63.4 Banesto 7.7
BBVA -31.6 Banesto -2.9 Banesto -1.9 BBVA 4.3 BBVA 57.0 Sabadell 7.7
Popular -37.6 BBVA -3.1 Bankinter -4.9 Popular 4.8 Popular 50.3 Bankinter 6.5
Business in Spain: asset quality trend
SAN BBVA POP BTO SAB BKT PAS2007 NPL ratio (%) 0.6 0.9 0.8 0.5 0.4 0.4 0.8
Coverage (%) 264.5 229.0 218.4 329.5 417.1 370.3 251.3
Total loans (gross), Spain (€bn) 235 204 87 74 62 38 20
. . . . . . .
Coverage (%) 98.5 66.5 73.0 105.4 106.9 120.2 64.0
Total loans (gross), Spain (€bn) 247 208 92 77 63 40 21
2009 NPL ratio (%) 3.4 5.1 4.8 2.9 3.7 2.5 4.9
Coverage (%) 73.4 47.7 50.3 63.4 69.0 74.4 53.3
Total loans (gross), Spain (€bn) 238 199 97.4 74.7 61.3 39.9 21.2
Ahorro Corporación Financiera, S.V., S.A. 35
June, 2010

8/9/2019 Tale of Two Spains
http://slidepdf.com/reader/full/tale-of-two-spains 36/70
,
Ahorro Corporación Financiera, S.V., S.A. 36
June, 2010

8/9/2019 Tale of Two Spains
http://slidepdf.com/reader/full/tale-of-two-spains 37/70
Annex
Annex 1. Population and employment
Annex 2. Housing mar et in Spain
Annex 3. Spanish financial system
Annex 4. Spanish Government and external debt
Ahorro Corporación Financiera, S.V., S.A. 37
June, 2010
8/9/2019 Tale of Two Spains
http://slidepdf.com/reader/full/tale-of-two-spains 38/70
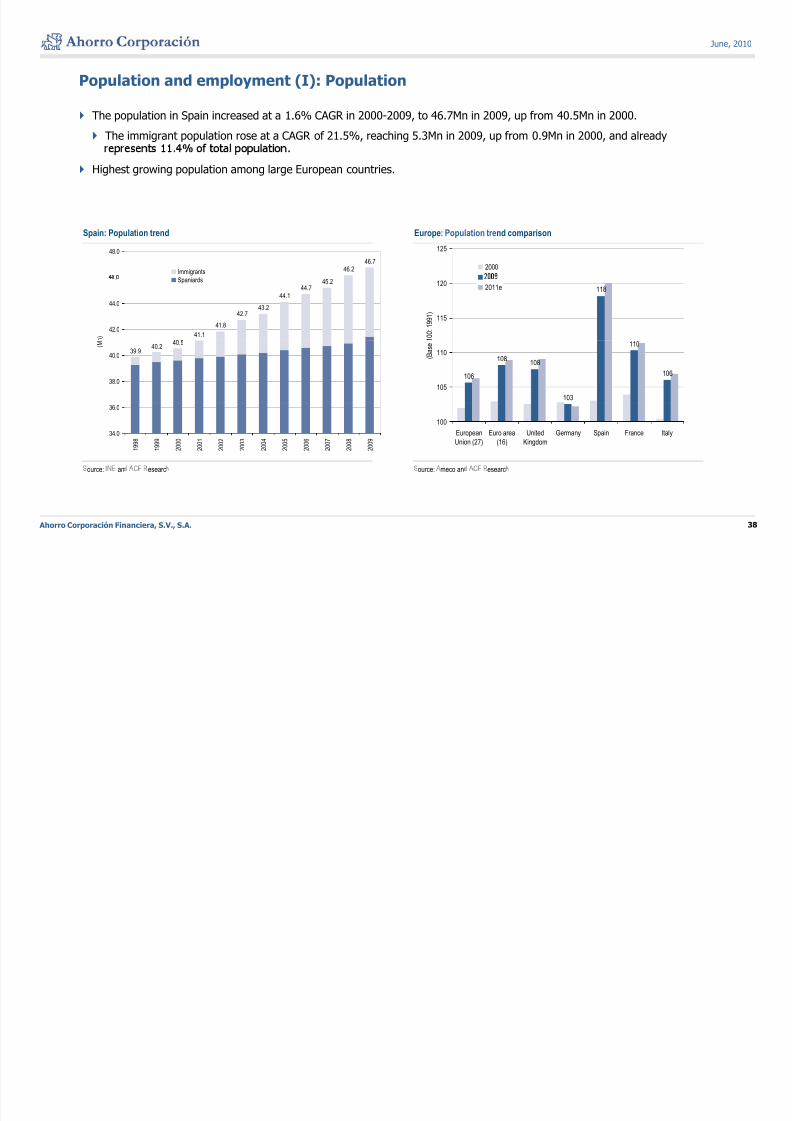
Population and employment (I): Population
The population in Spain increased at a 1.6% CAGR in 2000-2009, to 46.7Mn in 2009, up from 40.5Mn in 2000.
The immigrant population rose at a CAGR of 21.5%, reaching 5.3Mn in 2009, up from 0.9Mn in 2000, and already
Highest growing population among large European countries.
Spain: Population trend Europe: Population trend comparison
125
200046.246.7
48.0
Immigrants
118
115
120
1 0 0 : 1 9 9 1 )
2011e
41.1
41.8
42.743.2
44.144.7
45.2
42.0
44.0
.
n )
Spaniards
106
108108
103
110
106
105
110 ( B a s e
39.940.2
40.5
38.0
40.0
( M
100
European
Union (27)
Euro area
(16)
United
Kingdom
Germany Spain France Italy34.0
36.0
1 9 9 8
1 9 9 9
2 0 0 0
2 0 0 1
2 0 0 2
2 0 0 3
2 0 0 4
2 0 0 5
2 0 0 6
2 0 0 7
2 0 0 8
2 0 0 9
Ahorro Corporación Financiera, S.V., S.A. 38
ource: an esearc ource: meco an esearc
June, 2010
8/9/2019 Tale of Two Spains
http://slidepdf.com/reader/full/tale-of-two-spains 39/70
Population and employment (II): Population estimates
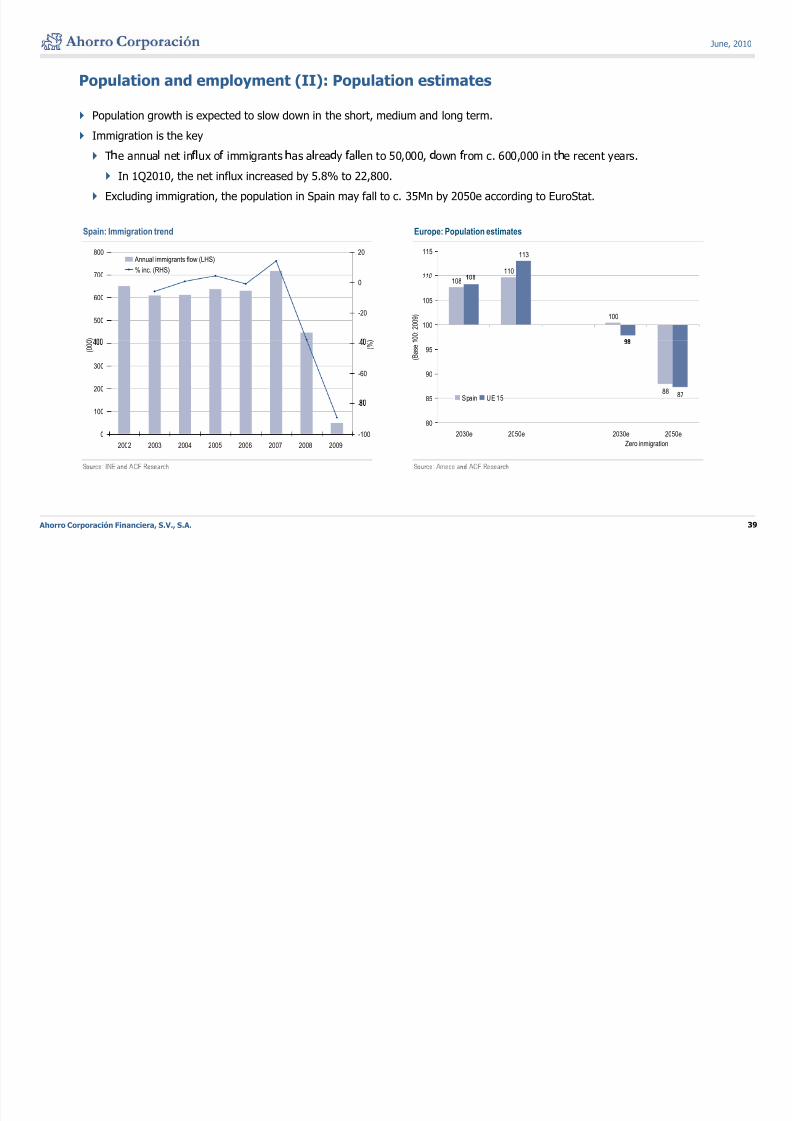
Population growth is expected to slow down in the short, medium and long term.
Immigration is the key
T e annua net in ux o immigrants as a rea y a en to 50,000, own rom c. 600,000 in t e recent years.
In 1Q2010, the net influx increased by 5.8% to 22,800.
Excluding immigration, the population in Spain may fall to c. 35Mn by 2050e according to EuroStat.
Spain: Immigration trend Europe: Population estimates
110
113
110
115
700
800 20 Annual immigrants flow (LHS)
% inc. (RHS)
108
100
100
105
0 0 :
2 0 0 9 )
500
600
)
-20
0
88 8785
90
95 ( B a s e
1
Spain UE 15
200
300
( 0 0 0
-60
- ( % )
80
2030e 2050e 2030e 2050e
Zero inmigration
0
100
2002 2003 2004 2005 2006 2007 2008 2009
-100
-
Ahorro Corporación Financiera, S.V., S.A. 39
June, 2010
8/9/2019 Tale of Two Spains
http://slidepdf.com/reader/full/tale-of-two-spains 40/70
Population and employment (III): Active population
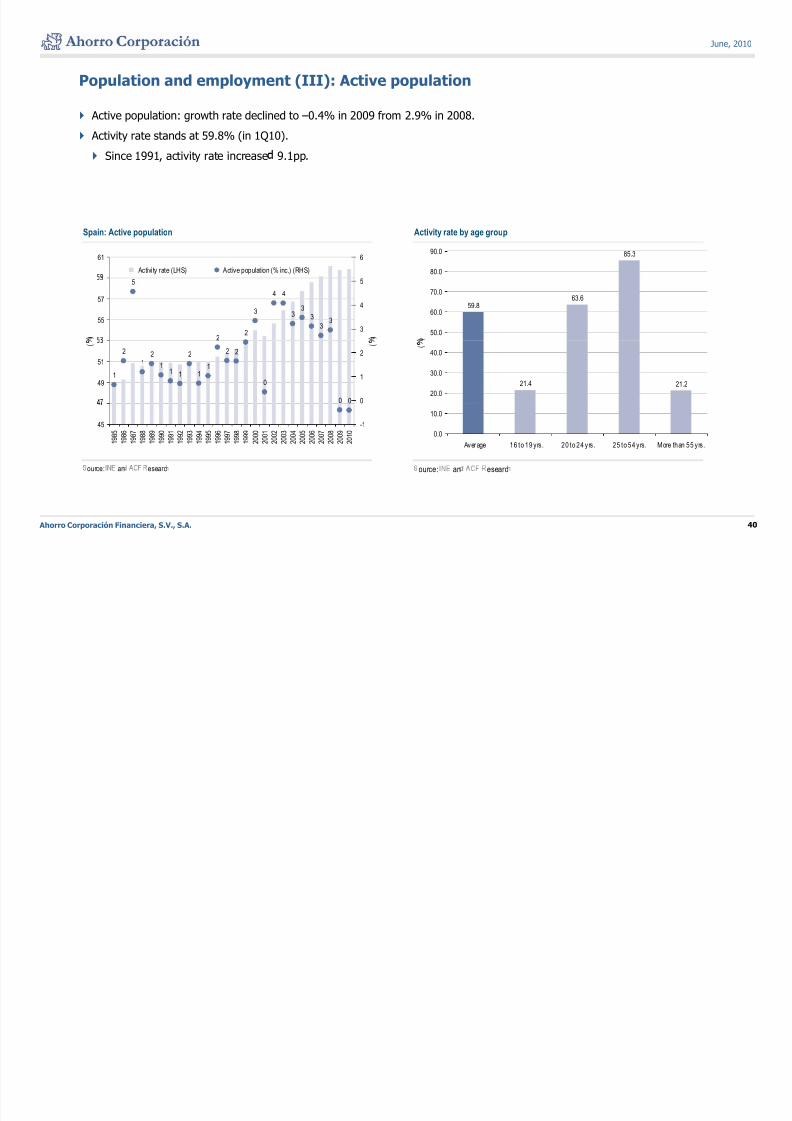
Active population: growth rate declined to –0.4% in 2009 from 2.9% in 2008.
Activity rate stands at 59.8% (in 1Q10).
Since 1991, activity rate increase 9.1pp.
Spain: Active population Activity rate by age group
61 6
Activity rate (LHS) Active population (% inc.) (RHS)
85.3
80.0
90.0
5
22
3
4 4
33
3
3355
57
)
3
4
5
)
59.8 63.6
50.0
60.0
70.0
)
1
2
12
11 1
2
11
2 2
0
0 0
49
51
(
0
1
2
(
21.4 21.2
20.0
30.0
40.0 (
45
1 9 8 5
1 9 8 6
1 9 8 7
1 9 8 8
1 9 8 9
1 9 9 0
1 9 9 1
1 9 9 2
1 9 9 3
1 9 9 4
1 9 9 5
1 9 9 6
1 9 9 7
1 9 9 8
1 9 9 9
2 0 0 0
2 0 0 1
2 0 0 2
2 0 0 3
2 0 0 4
2 0 0 5
2 0 0 6
2 0 0 7
2 0 0 8
2 0 0 9
2 0 1 0
-1
0.0
10.0
Average 16 to 19 yrs. 20 to 24 yrs. 25 to 54 yrs. More than 55 yrs.
Ahorro Corporación Financiera, S.V., S.A. 40
ource: an esearc ource: an esearc
June, 2010
8/9/2019 Tale of Two Spains
http://slidepdf.com/reader/full/tale-of-two-spains 41/70
Population and employment (IV): Employment
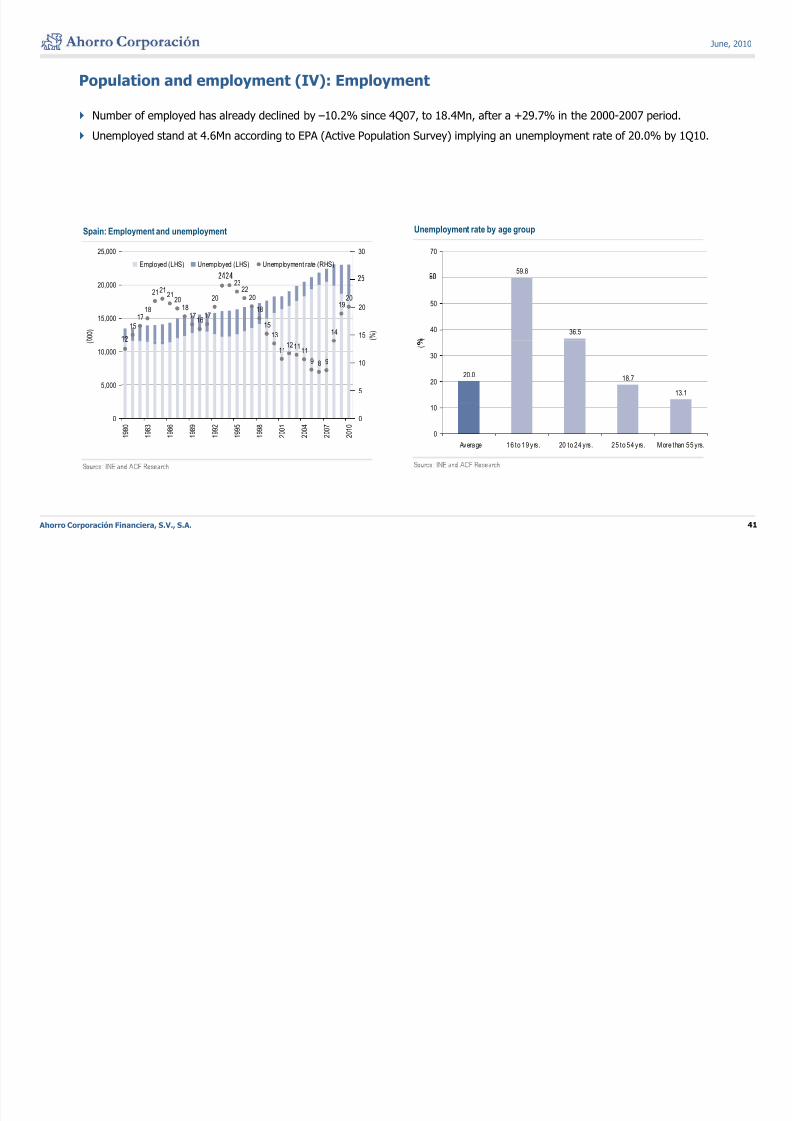
Number of employed has already declined by –10.2% since 4Q07, to 18.4Mn, after a +29.7% in the 2000-2007 period.
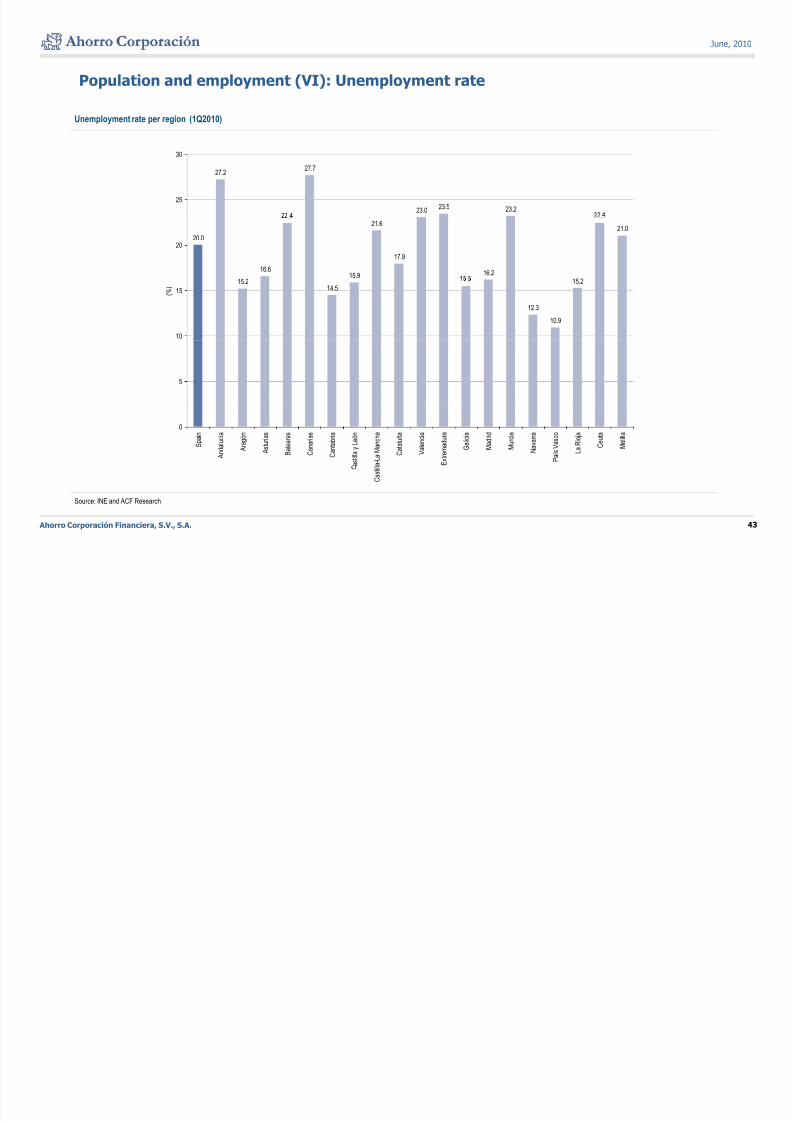
Unemployed stand at 4.6Mn according to EPA (Active Population Survey) implying an unemployment rate of 20.0% by 1Q10.
Spain: Employment and unemployment Unemployment rate by age group
25,000 30
Employed (LHS) Unemployed (LHS) Unemployment rate (RHS)59.8
70
15
1718
212121
201817
1617
20
2322
20
18
15
13 14
1920
15,000
20,000
0 0 0 )
15
20
( % ) 36.540
50
)
111211
11
9 8 9
5,000
10,000
(
5
10
20.0 18.7
13.1
20
30
(
0
1 9 8 0
1 9 8 3
1 9 8 6
1 9 8 9
1 9 9 2
1 9 9 5
1 9 9 8
2 0 0 1
2 0 0 4
2 0 0 7
2 0 1 0
0
0
10
Average 16 to 19 yrs. 20 to 24 yrs. 25 to 54 yrs. More than 55 yrs.
Ahorro Corporación Financiera, S.V., S.A. 41
June, 2010
8/9/2019 Tale of Two Spains
http://slidepdf.com/reader/full/tale-of-two-spains 42/70
Population and employment (V): Employment (cont.)
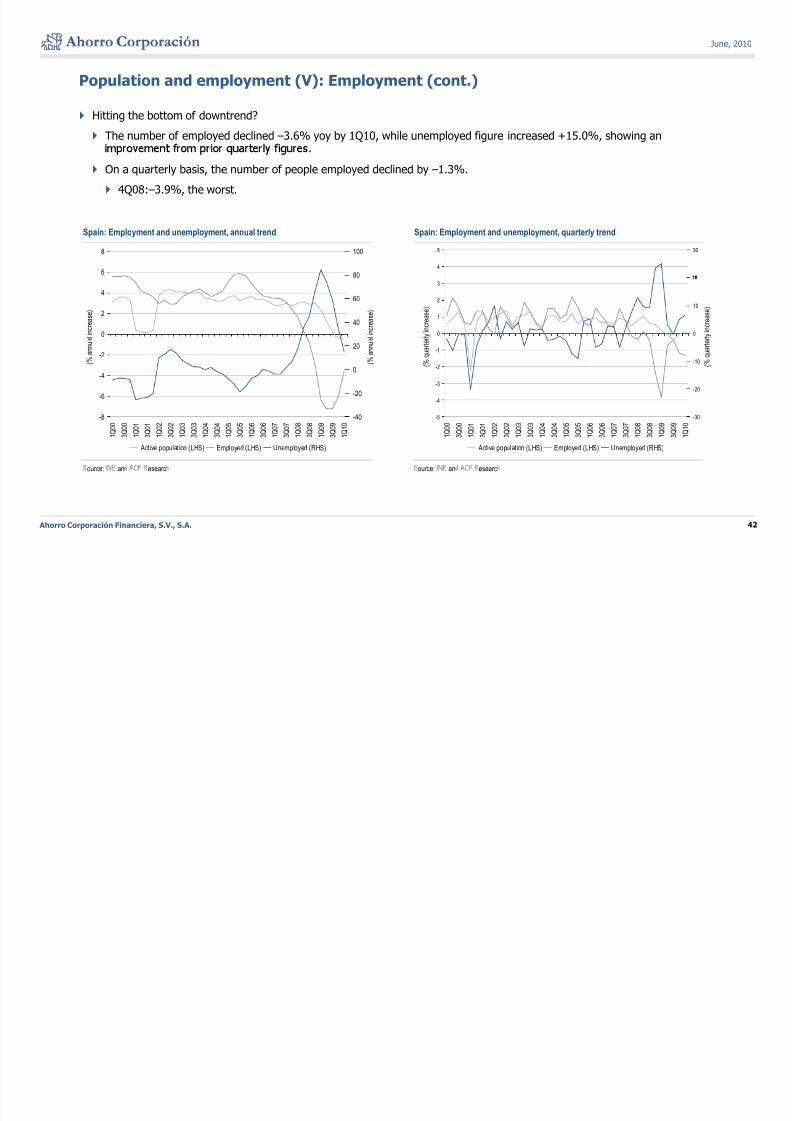
Hitting the bottom of downtrend?
The number of employed declined –3.6% yoy by 1Q10, while unemployed figure increased +15.0%, showing an
On a quarterly basis, the number of people employed declined by –1.3%.
4Q08:–3.9%, the worst.
Spain: Employment and unemployment, annual trend Spain: Employment and unemployment, quarterly trend
6
8
80
100
4
5 30
0
2
4
a l i n c r e a s e )
40
60
a l i n c r e a s e )
0
1
2
3
r l y i n c r e a s e )
0
10
r l y i n c r e a s e )
-6
-4
-2 ( %
a n n u
-20
0
20
( % a
n n u
-4
-3
-2
-1
( % q
u a r t e
-20
-10 ( %
q u a r t e
-8
1 Q 0 0
3 Q 0 0
1 Q 0 1
3 Q 0 1
1 Q 0 2
3 Q 0 2
1 Q 0 3
3 Q 0 3
1 Q 0 4
3 Q 0 4
1 Q 0 5
3 Q 0 5
1 Q 0 6
3 Q 0 6
1 Q 0 7
3 Q 0 7
1 Q 0 8
3 Q 0 8
1 Q 0 9
3 Q 0 9
1 Q 1 0
-40
Active population (LHS) Employed (LHS) Unemployed (RHS)
-5
1 Q 0 0
3 Q 0 0
1 Q 0 1
3 Q 0 1
1 Q 0 2
3 Q 0 2
1 Q 0 3
3 Q 0 3
1 Q 0 4
3 Q 0 4
1 Q 0 5
3 Q 0 5
1 Q 0 6
3 Q 0 6
1 Q 0 7
3 Q 0 7
1 Q 0 8
3 Q 0 8
1 Q 0 9
3 Q 0 9
1 Q 1 0
-30
Active population (LHS) Employed (LHS) Unemployed (RHS)
Ahorro Corporación Financiera, S.V., S.A. 42
ource: an esearc ource: an esearc
June, 2010
8/9/2019 Tale of Two Spains
http://slidepdf.com/reader/full/tale-of-two-spains 43/70
Population and employment (VI): Unemployment rate
Unemployment rate per region (1Q2010)
27.227.7
23.0 23.5 23.2
25
30
20.0
16.6
.
15.9
21.6
17.9
16.2
.
21.0
20
15.214.5
.
12.3
10.9
15.2
10
15 ( % )
5
0
S p a i n
A n d a l u c í a
A r a g ó n
A s t u r i a s
B a l e a r e s
C a n a r i a s
C a n t a b r i a
a s t i l l a y L e ó n
l a - L a M a n c h a
C a t a l u ñ a
V a l e n c i a
E x t r e m a d u r a
G a l i c i a
M a d r i d
M u r c i a
N a v a r r a
P a í s V a s c o
L a R i o j a
C e u t a
M e l i l l a
Ahorro Corporación Financiera, S.V., S.A. 43
Source: INE and ACF Research
C a s t i l
June, 2010
8/9/2019 Tale of Two Spains
http://slidepdf.com/reader/full/tale-of-two-spains 44/70
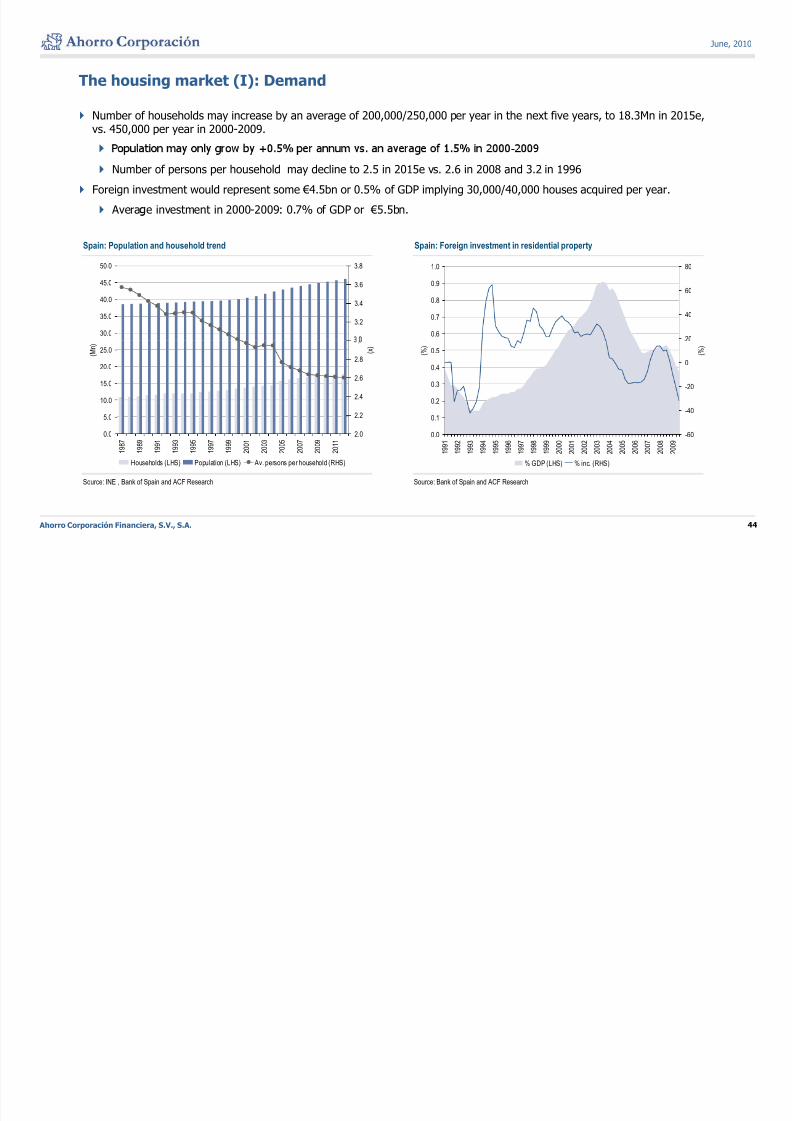
The housing market (I): Demand
Number of households may increase by an average of 200,000/250,000 per year in the next five years, to 18.3Mn in 2015e,vs. 450,000 per year in 2000-2009.
-
Number of persons per household may decline to 2.5 in 2015e vs. 2.6 in 2008 and 3.2 in 1996
Foreign investment would represent some €4.5bn or 0.5% of GDP implying 30,000/40,000 houses acquired per year.
Avera e investment in 2000-2009: 0.7% of GDP or €5.5bn.
Spain: Population and household trend Spain: Foreign investment in residential property
50.0 3.8 1.0 80
30.0
35.0
40.0
45.0
3.2
3.4
3.6
0.6
0.7
0.8
0.9
20
40
60
10.0
15.0
20.0
25.0 ( M n )
2.4
2.6
2.8
.
( x )
0.2
0.3
0.4
0.5 ( % )
-20
0
( % )
0.0
5.0
1 9 8 7
1 9 8 9
1 9 9 1
1 9 9 3
1 9 9 5
1 9 9 7
1 9 9 9
2 0 0 1
2 0 0 3
2 0 0 5
2 0 0 7
2 0 0 9
2 0 1 1
2.0
2.2
Households (LHS) Population (LHS) Av. persons per household (RHS)
0.0
0.1
1 9 9 1
1 9 9 2
1 9 9 3
1 9 9 4
1 9 9 5
1 9 9 6
1 9 9 7
1 9 9 8
1 9 9 9
2 0 0 0
2 0 0 1
2 0 0 2
2 0 0 3
2 0 0 4
2 0 0 5
2 0 0 6
2 0 0 7
2 0 0 8
2 0 0 9
-60
-40
% GDP (LHS) % inc. (RHS)
Ahorro Corporación Financiera, S.V., S.A. 44
Source: INE , Bank of Spain and ACF Research Source: Bank of Spain and ACF Research
June, 2010
8/9/2019 Tale of Two Spains
http://slidepdf.com/reader/full/tale-of-two-spains 45/70
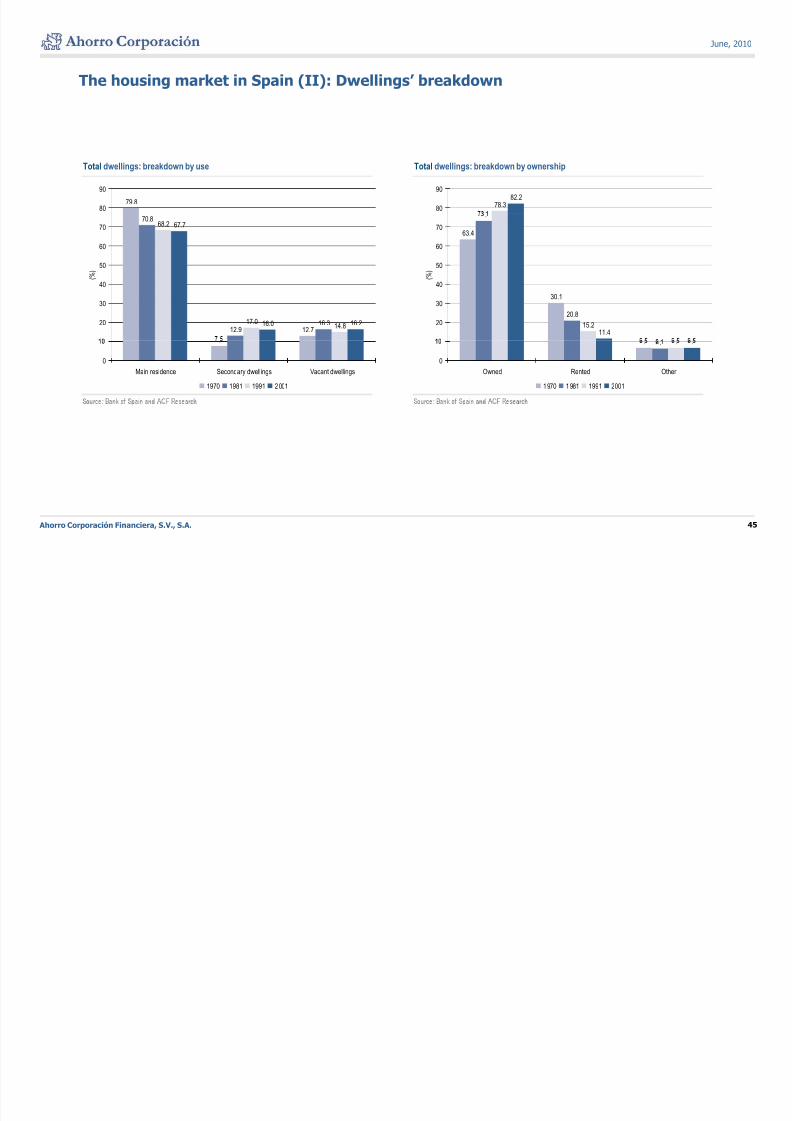
The housing market in Spain (II): Dwellings’ breakdown
Total dwellings: breakdown by use Total dwellings: breakdown by ownership
78.3
82.2
80
90
79.880
90
63.4
.
50
60
70
% )
70.868.2 67.7
50
60
70
% )
30.1
20.8
15.211.4
20
30
40 (
12.712.916.317.0
14.816.0 16.220
30
40 (
. . . .
0
Owned Rented Other
1970 1981 1991 2001
.
0
Main residence Secondary dwellings Vacant dwellings
1970 1981 1991 2001
Ahorro Corporación Financiera, S.V., S.A. 45
June, 2010
8/9/2019 Tale of Two Spains
http://slidepdf.com/reader/full/tale-of-two-spains 46/70
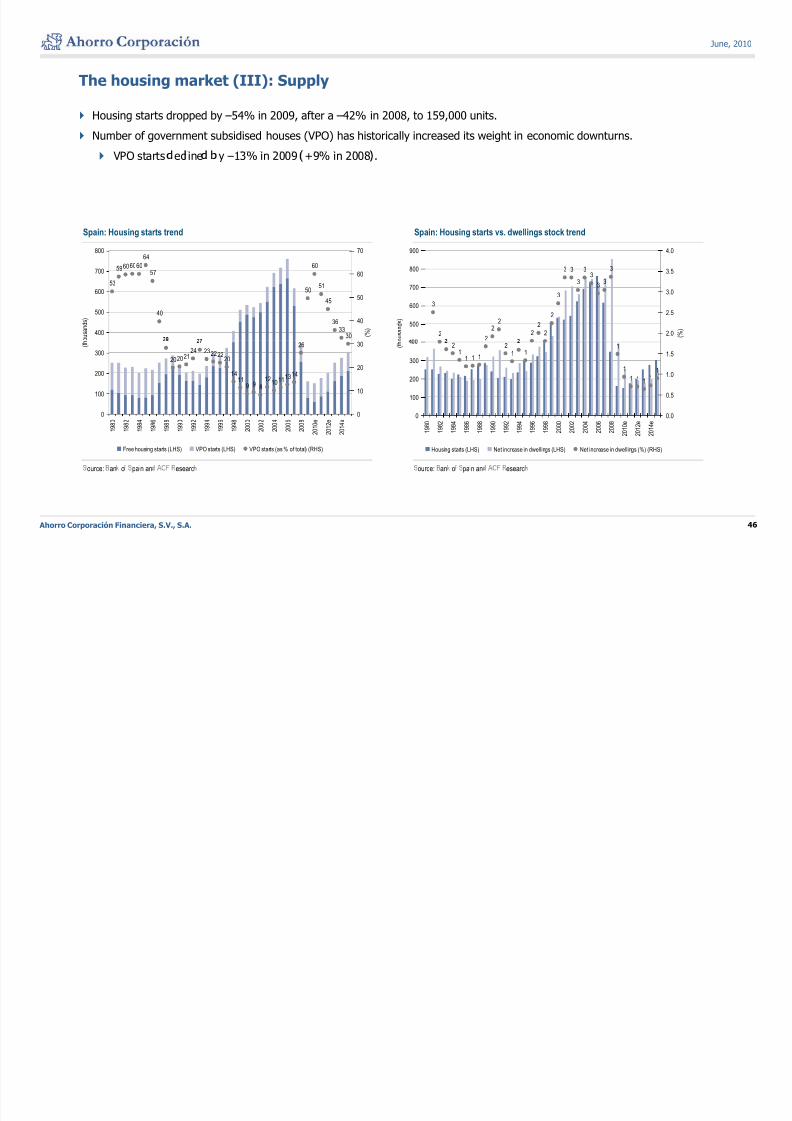
The housing market (III): Supply
Housing starts dropped by –54% in 2009, after a –42% in 2008, to 159,000 units.
Number of government subsidised houses (VPO) has historically increased its weight in economic downturns.
VPO starts ec ine y –13% in 2009 +9% in 2008 .
Spain: Housing starts trend Spain: Housing starts vs. dwellings stock trend
59606060
64
5760
700
800
60
70
3 3 33
3800
900
3.5
4.0
53
40
5051
45
3633
30400
500
600
o u s a n d s )
40
50
( % )
3
22
22
2
2
2
3
33
3
2500
600
700
o u s a n d s )
2.0
2.5
3.0
( % )
20202124 232222
20
1411
9 9 8
1210111314
26
100
200
300
( t h
10
20
30 21
1 1 1
21 1
1
1
1 1 11
1
100
200
300
( t h
0.5
1.0
1.5
0
1 9 8 0
1 9 8 2
1 9 8 4
1 9 8 6
1 9 8 8
1 9 9 0
1 9 9 2
1 9 9 4
1 9 9 6
1 9 9 8
2 0 0 0
2 0 0 2
2 0 0 4
2 0 0 6
2 0 0 8
2 0 1 0 e
2 0 1 2 e
2 0 1 4 e
0
Free housing starts (LHS) VPO starts (LHS) VPO starts (as % of total) (RHS)
0
1 9 8 0
1 9 8 2
1 9 8 4
1 9 8 6
1 9 8 8
1 9 9 0
1 9 9 2
1 9 9 4
1 9 9 6
1 9 9 8
2 0 0 0
2 0 0 2
2 0 0 4
2 0 0 6
2 0 0 8
2 0 1 0 e
2 0 1 2 e
2 0 1 4 e
0.0
Housing starts (LHS) Net increase in dwellings (LHS) Net increase in dwellings (%) (RHS)
Ahorro Corporación Financiera, S.V., S.A. 46
ource: an o pa n an esearc ource: an o pa n an esearc
June, 2010
8/9/2019 Tale of Two Spains
http://slidepdf.com/reader/full/tale-of-two-spains 47/70
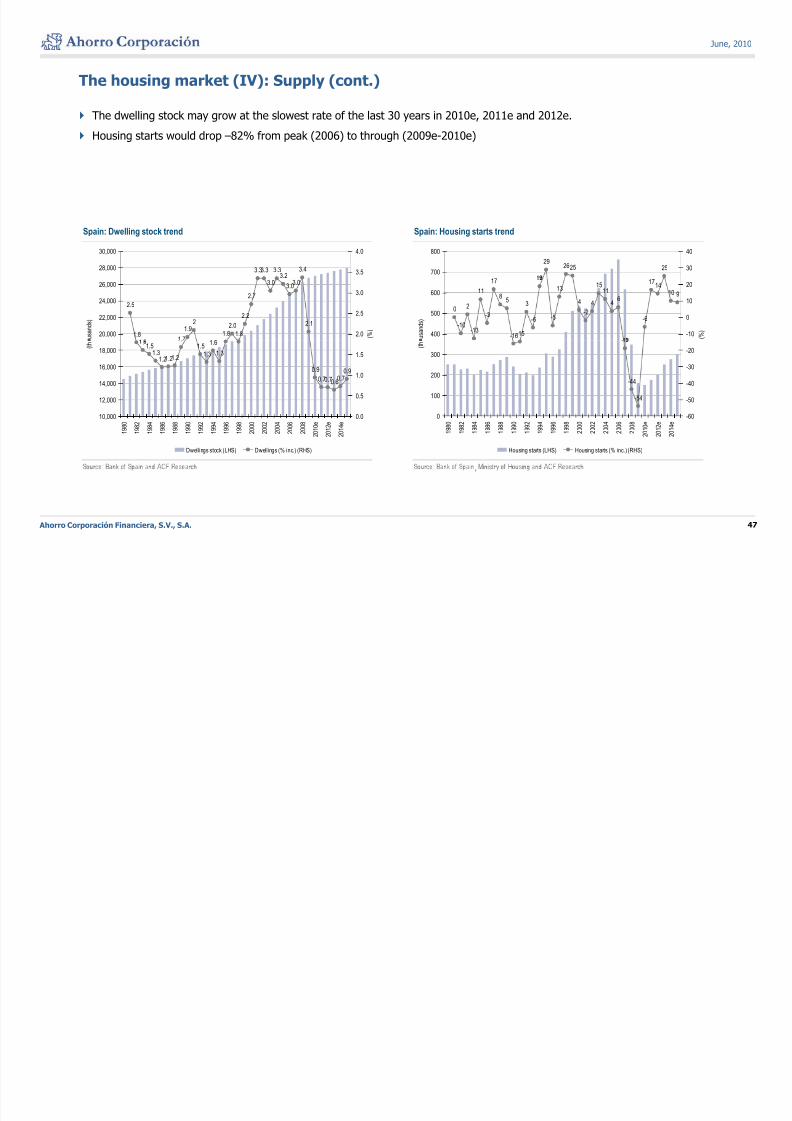
The housing market (IV): Supply (cont.)
The dwelling stock may grow at the slowest rate of the last 30 years in 2010e, 2011e and 2012e.
Housing starts would drop –82% from peak (2006) to through (2009e-2010e)
Spain: Dwelling stock trend Spain: Housing starts trend
3.33.3 3.33.2
3.428,000
30,000
3.5
4.0
292625 25
700
800
30
40
2.5
1.81.7
1.91.8
2.0
1.8
2.2
2.7
3.03.0
3.0
2.12
20,000
22,000
24,000
26,000
u s a n d s )
2.0
2.5
3.0
( % )
0
-10
2
-13
11
-3
17
8
5
-16
3
-6 -5
13
4-2
4
1511
46
-
-6
1714
10 9
-15400
500
600
u s a n d s )
-10
0
10
20
( % )
.1.5
1.31.21.21.2
.1.5
1.3
1.6
1.3
0.9
0.70.70.60.7
0.9
12,000
14,000
16,000
18,000 ( t h
0.5
1.0
1.5
-
-44
-54
100
200
300
( t h
-50
-40
-30
-20
10,000
1 9 8 0
1 9 8 2
1 9 8 4
1 9 8 6
1 9 8 8
1 9 9 0
1 9 9 2
1 9 9 4
1 9 9 6
1 9 9 8
2 0 0 0
2 0 0 2
2 0 0 4
2 0 0 6
2 0 0 8
2 0 1 0 e
2 0 1 2 e
2 0 1 4 e
0.0
Dwellings stock (LHS) Dwellings (% inc.) (RHS)
0
1 9 8 0
1 9 8 2
1 9 8 4
1 9 8 6
1 9 8 8
1 9 9 0
1 9 9 2
1 9 9 4
1 9 9 6
1 9 9 8
2 0 0 0
2 0 0 2
2 0 0 4
2 0 0 6
2 0 0 8
2 0 1 0 e
2 0 1 2 e
2 0 1 4 e
-60
Housing starts (LHS) Housing starts (% inc.) (RHS)
Ahorro Corporación Financiera, S.V., S.A. 47
,
June, 2010
8/9/2019 Tale of Two Spains
http://slidepdf.com/reader/full/tale-of-two-spains 48/70
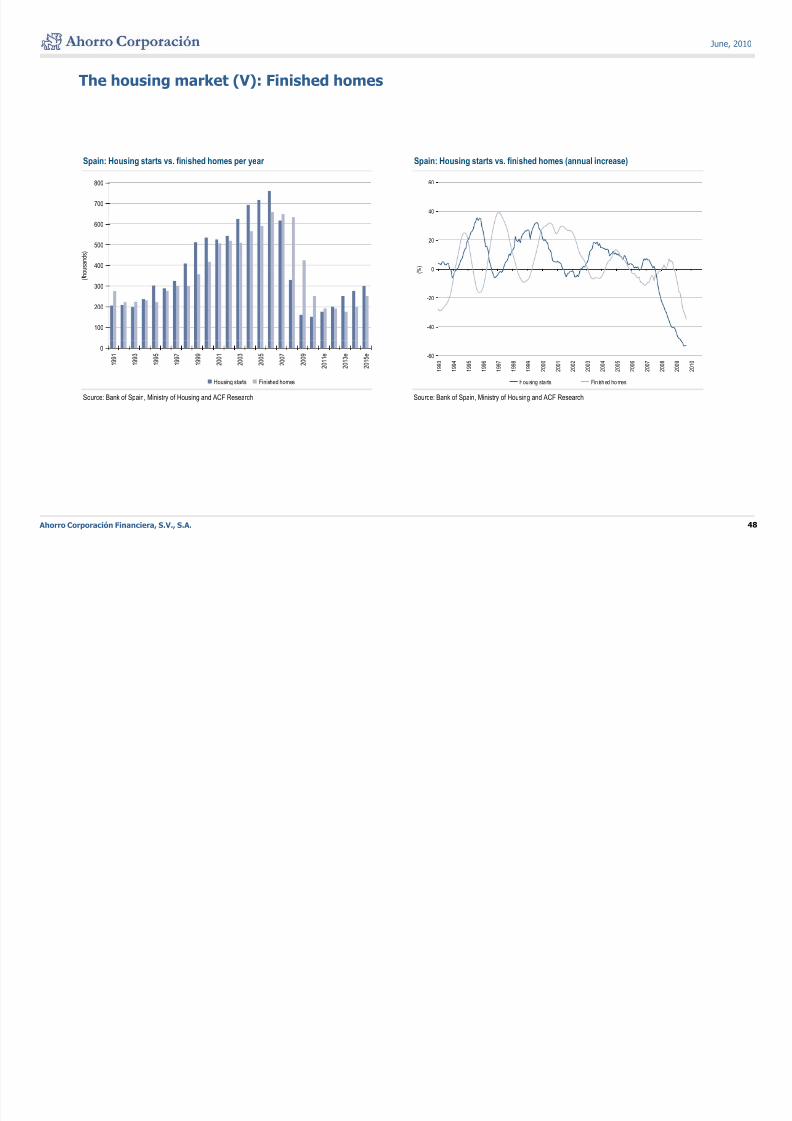
The housing market (V): Finished homes
Spain: Housing starts vs. finished homes per year Spain: Housing starts vs. finished homes (annual increase)
700
800
40
60
400
500
600
h o u s a n d s )
0
20
( % )
100
200
300
(
-40
-20
Source: Bank of Spain, Ministry of Housing and ACF Research Source: Bank of Spain, Ministry of Housing and ACF Research
0
1 9 9 1
1 9 9 3
1 9 9 5
1 9 9 7
1 9 9 9
2 0 0 1
2 0 0 3
2 0 0 5
2 0 0 7
2 0 0 9
2 0 1 1 e
2 0 1 3 e
2 0 1 5 e
Housing starts Finished homes
-60
1 9 9 3
1 9 9 4
1 9 9 5
1 9 9 6
1 9 9 7
1 9 9 8
1 9 9 9
2 0 0 0
2 0 0 1
2 0 0 2
2 0 0 3
2 0 0 4
2 0 0 5
2 0 0 6
2 0 0 7
2 0 0 8
2 0 0 9
2 0 1 0
Hou sing sta rts Fin ish ed ho mes
Ahorro Corporación Financiera, S.V., S.A. 48
June, 2010
8/9/2019 Tale of Two Spains
http://slidepdf.com/reader/full/tale-of-two-spains 49/70
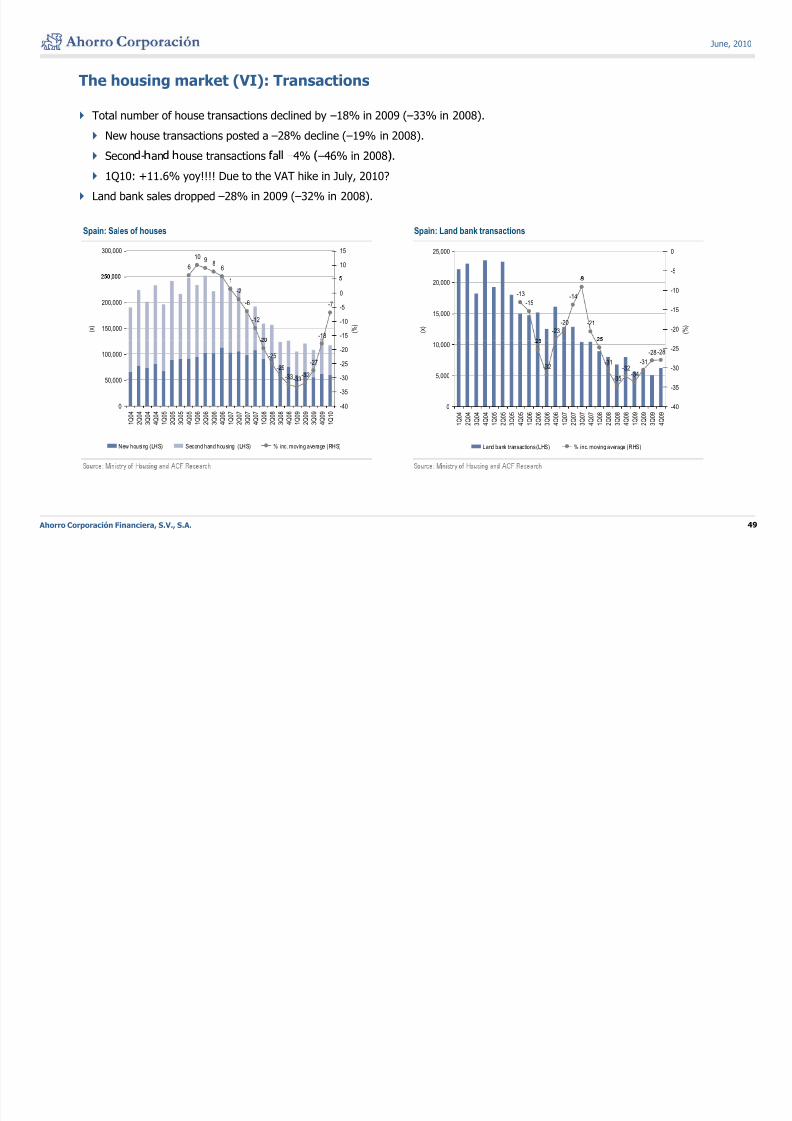
The housing market (VI): Transactions
Total number of house transactions declined by –18% in 2009 (–33% in 2008).
New house transactions posted a –28% decline (–19% in 2008).
Secon - an ouse transactions a –4% –46% in 2008 .
1Q10: +11.6% yoy!!!! Due to the VAT hike in July, 2010?
Land bank sales dropped –28% in 2009 (–32% in 2008).
Spain: Sales of houses Spain: Land bank transactions
6
10 98
6
300,000
10
15 25,000
-5
0
1
-2
-6
-12
--18
-7
150,000
200,000
,
( x )
-15
-10
-5
0
( % )
-13
-15
-23
-20
-14
-
-21
-
15,000
20,000
( x )
-20
-15
-10
( % )
-
-25
-29
-33-33-32
-27
50,000
100,000
-35
-30
-25
-20
-
-32-31
-35
-32-34
-31
-28 -28
5,000
10,000
-35
-30
-25
0
1 Q 0 4
2 Q 0 4
3 Q 0 4
4 Q 0 4
1 Q 0 5
2 Q 0 5
3 Q 0 5
4 Q 0 5
1 Q 0 6
2 Q 0 6
3 Q 0 6
4 Q 0 6
1 Q 0 7
2 Q 0 7
3 Q 0 7
4 Q 0 7
1 Q 0 8
2 Q 0 8
3 Q 0 8
4 Q 0 8
1 Q 0 9
2 Q 0 9
3 Q 0 9
4 Q 0 9
1 Q 1 0
-40
New housing (LHS) Second hand housing (LHS) % inc. moving average (RHS)
0
1 Q 0 4
2 Q 0 4
3 Q 0 4
4 Q 0 4
1 Q 0 5
2 Q 0 5
3 Q 0 5
4 Q 0 5
1 Q 0 6
2 Q 0 6
3 Q 0 6
4 Q 0 6
1 Q 0 7
2 Q 0 7
3 Q 0 7
4 Q 0 7
1 Q 0 8
2 Q 0 8
3 Q 0 8
4 Q 0 8
1 Q 0 9
2 Q 0 9
3 Q 0 9
4 Q 0 9
-40
Land bank transactions (LHS) % inc. moving average (RHS)
Ahorro Corporación Financiera, S.V., S.A. 49
June, 2010
8/9/2019 Tale of Two Spains
http://slidepdf.com/reader/full/tale-of-two-spains 50/70
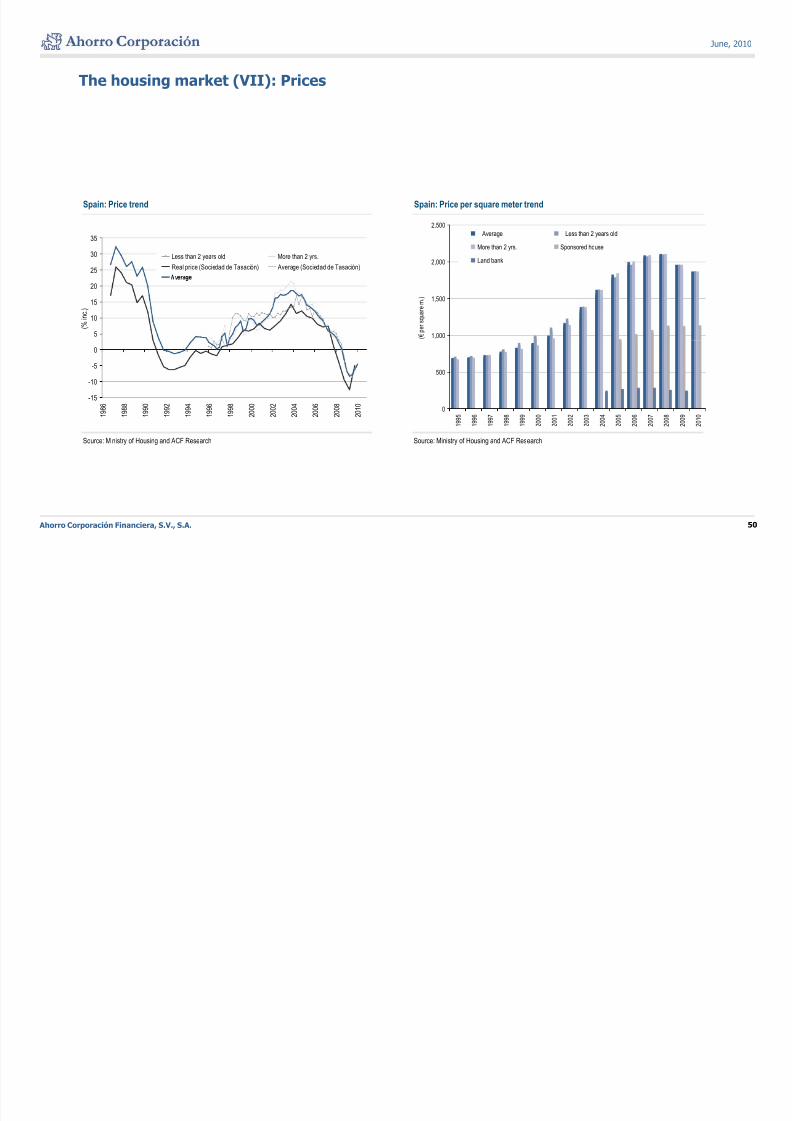
The housing market (VII): Prices
Spain: Price trend Spain: Price per square meter trend
25
30
35
Less than 2 years old More than 2 yrs.
Real price (Sociedad de Tasación) Average (Sociedad de Tasación)2,000
2,500
Average Less than 2 years old
More than 2 yrs. Sponsored house
Land bank
5
10
15
20
( % i n
c . )
1,000
1,500
( € p e r s q u a r e m
. )
-15
-10
-5
0
500
Source: Ministry of Housing and ACF Research Source: Ministry of Housing and ACF Research
1 9 8 6
1 9 8 8
1 9 9 0
1 9 9 2
1 9 9 4
1 9 9 6
1 9 9 8
2 0 0 0
2 0 0 2
2 0 0 4
2 0 0 6
2 0 0 8
2 0 1 0
0
1 9 9 5
1 9 9 6
1 9 9 7
1 9 9 8
1 9 9 9
2 0 0 0
2 0 0 1
2 0 0 2
2 0 0 3
2 0 0 4
2 0 0 5
2 0 0 6
2 0 0 7
2 0 0 8
2 0 0 9
2 0 1 0
Ahorro Corporación Financiera, S.V., S.A. 50
June, 2010
8/9/2019 Tale of Two Spains
http://slidepdf.com/reader/full/tale-of-two-spains 51/70
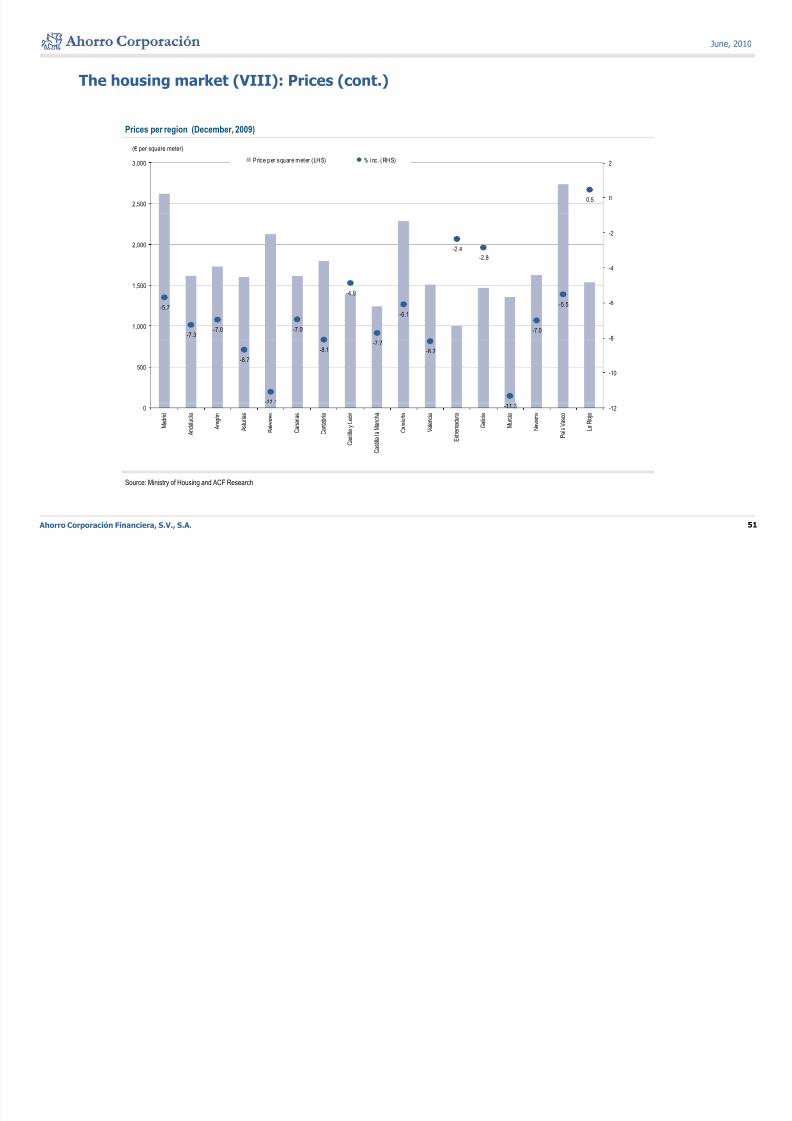
The housing market (VIII): Prices (cont.)
Prices per region (December, 2009)
(€ per square meter)
0.5
2,500
3,000
0
2Price per square meter (LHS) % inc . (RHS)
-2.4
-2.8
2,000
-4
-2
-5.7
-7.3-7.0 -7.0
-4.9
-6.1
-7.0
-5.5
1,000
1,500
-8
-6
-8.7
-11.1
-8.1-7.7
-8.2
500-10
. -11.30
M a d r i d
A n d a l u c í a
A r a g ó n
A s t u r i a s
B a l e a r e s
C a n a r i a s
C a n t a b r i a
C a s t i l l a y L e ó n
C a s t i l l a l a M a n c h a
C a t a l u ñ a
V a l e n c i a
E x t r e m a d u r a
G a l i c i a
M u r c i a
N a v a r r a
P a í s V a s c o
L a R i o j a
-12
Ahorro Corporación Financiera, S.V., S.A. 51
Source: Ministry of Housing and ACF Research
June, 2010
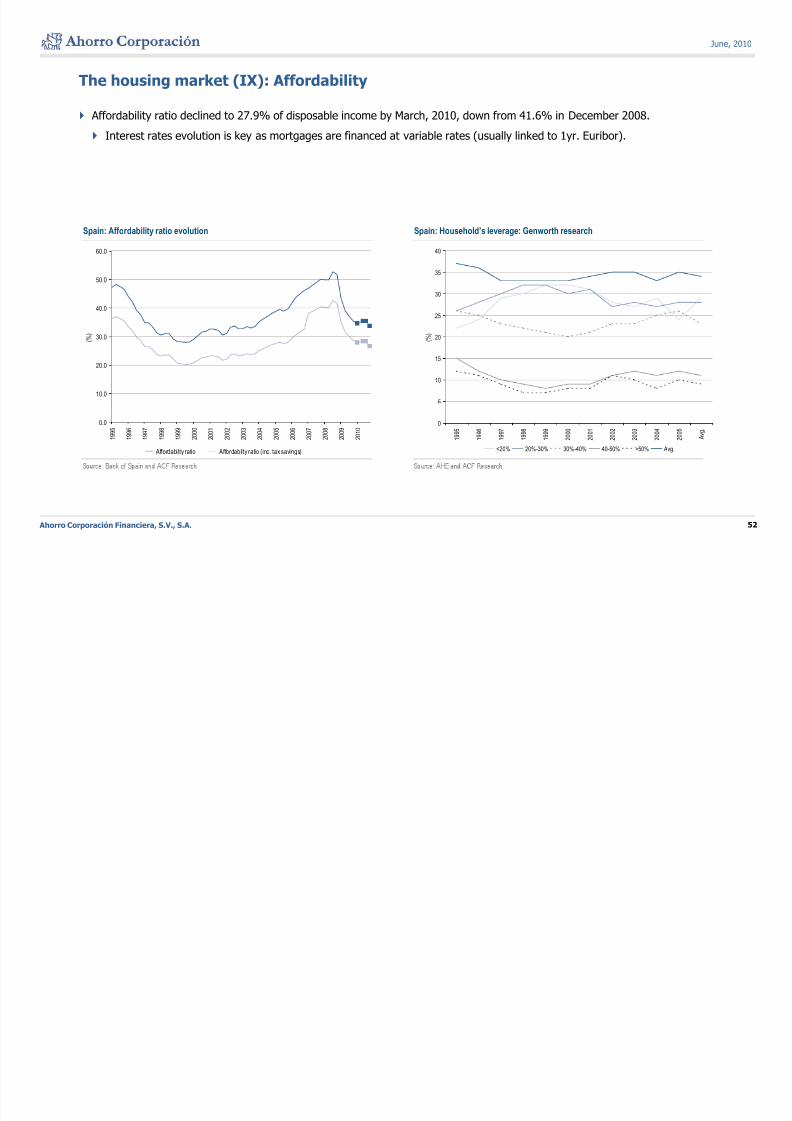
8/9/2019 Tale of Two Spains
http://slidepdf.com/reader/full/tale-of-two-spains 52/70
The housing market (IX): Affordability
Affordability ratio declined to 27.9% of disposable income by March, 2010, down from 41.6% in December 2008.
Interest rates evolution is key as mortgages are financed at variable rates (usually linked to 1yr. Euribor).
Spain: Affordability ratio evolution Spain: Household’s leverage: Genworth research
35
4060.0
20
25
30
% )
30.0
40.0
50.0
% )
5
10
15
(
10.0
20.0
(
0
1 9 9 5
1 9 9 6
1 9 9 7
1 9 9 8
1 9 9 9
2 0 0 0
2 0 0 1
2 0 0 2
2 0 0 3
2 0 0 4
2 0 0 5
A v g .
<20% 20%-30% 30%-40% 40-50% >50% Avg.
0.0
1 9 9 5
1 9 9 6
1 9 9 7
1 9 9 8
1 9 9 9
2 0 0 0
2 0 0 1
2 0 0 2
2 0 0 3
2 0 0 4
2 0 0 5
2 0 0 6
2 0 0 7
2 0 0 8
2 0 0 9
2 0 1 0
Affordabilty ratio Affordabilty ratio (inc. tax savings)
Ahorro Corporación Financiera, S.V., S.A. 52
June, 2010
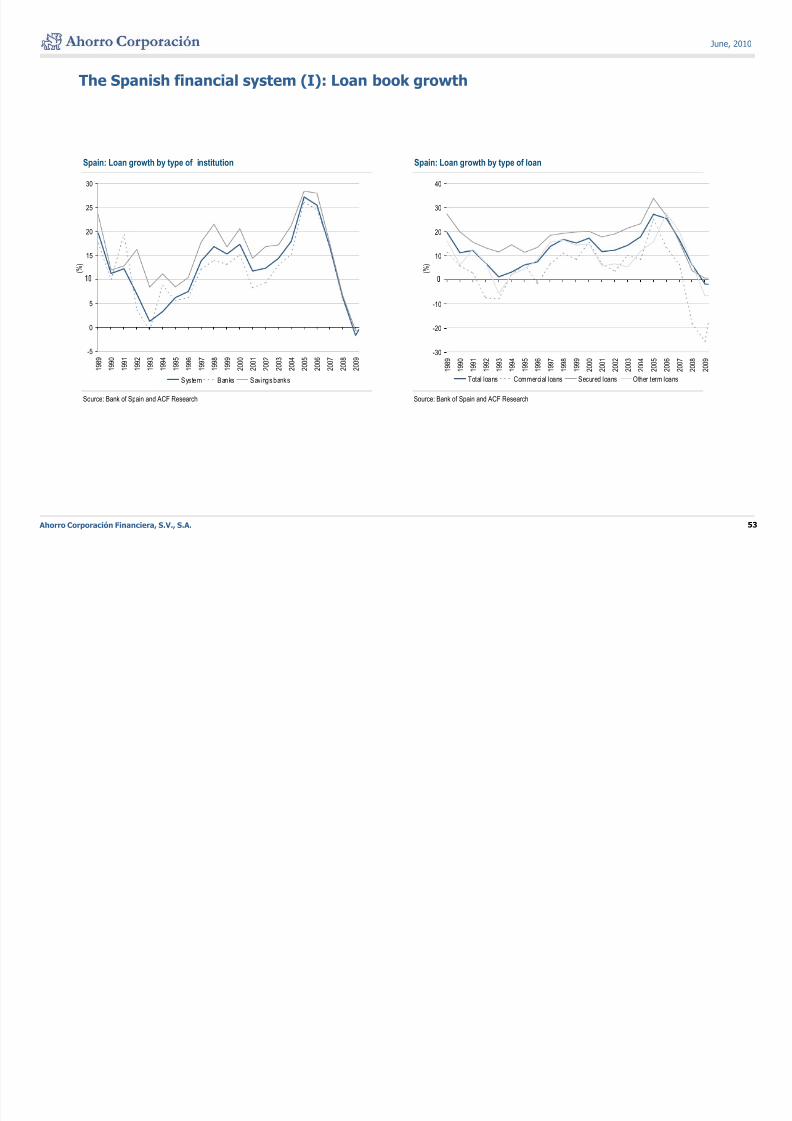
8/9/2019 Tale of Two Spains
http://slidepdf.com/reader/full/tale-of-two-spains 53/70
The Spanish financial system (I): Loan book growth
Spain: Loan growth by type of institution Spain: Loan growth by type of loan
25
30
30
40
15
20
( % )
10
20
( % )
0
5
-20
-10
Source: Bank of Spain and ACF Research Source: Bank of Spain and ACF Research
-5
1 9 8 9
1 9 9 0
1 9 9 1
1 9 9 2
1 9 9 3
1 9 9 4
1 9 9 5
1 9 9 6
1 9 9 7
1 9 9 8
1 9 9 9
2 0 0 0
2 0 0 1
2 0 0 2
2 0 0 3
2 0 0 4
2 0 0 5
2 0 0 6
2 0 0 7
2 0 0 8
2 0 0 9
System Banks Savings banks
-30
1 9 8 9
1 9 9 0
1 9 9 1
1 9 9 2
1 9 9 3
1 9 9 4
1 9 9 5
1 9 9 6
1 9 9 7
1 9 9 8
1 9 9 9
2 0 0 0
2 0 0 1
2 0 0 2
2 0 0 3
2 0 0 4
2 0 0 5
2 0 0 6
2 0 0 7
2 0 0 8
2 0 0 9
Total loans Commercial loans Secured loans Other term loans
Ahorro Corporación Financiera, S.V., S.A. 53
June, 2010
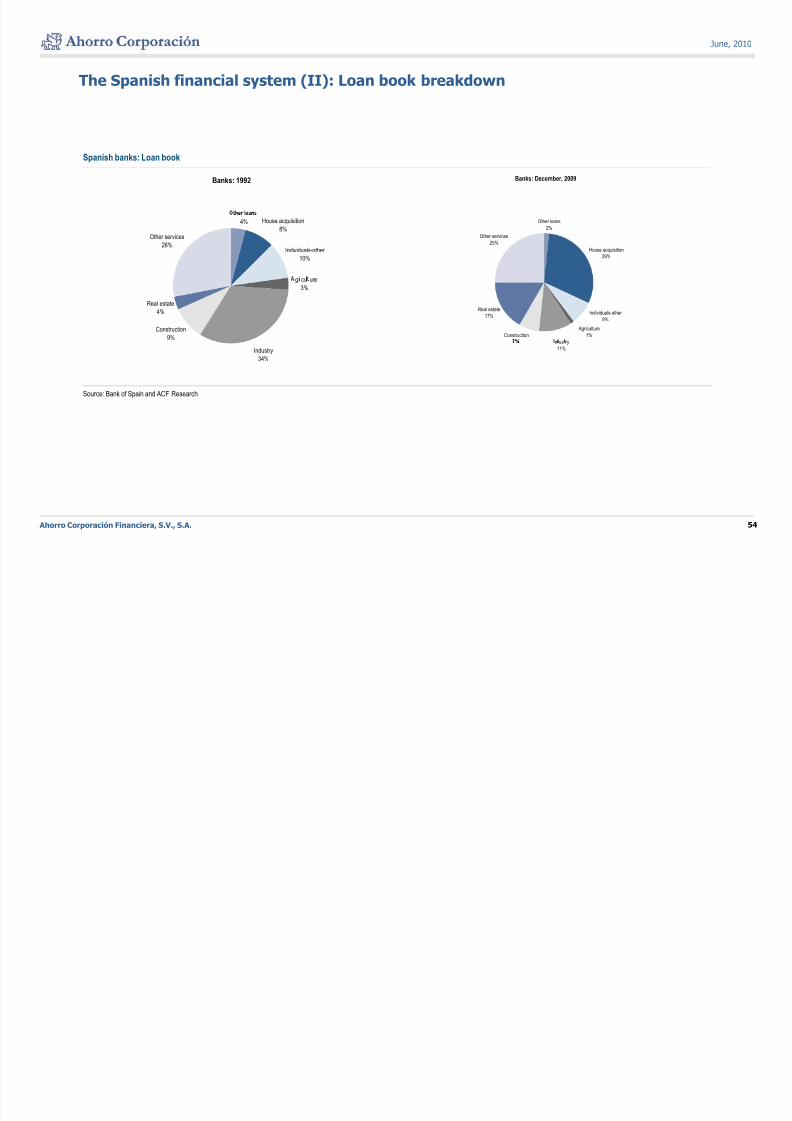
8/9/2019 Tale of Two Spains
http://slidepdf.com/reader/full/tale-of-two-spains 54/70
The Spanish financial system (II): Loan book breakdown
Spanish banks: Loan book
Banks: 1992
Banks: December, 2009
4% House acquisition
8%
Individuals-other
10%
Other services
28%
Other loans
2%
House acquisition
29%
Other services
25%
gr cu ure
3%
Construction
9%
Real estate4% Individuals-other
8%
Agriculture
1%Construction
Real estate
17%
Source: Bank of Spain and ACF Research
Industry
34%
n us ry
11%
Ahorro Corporación Financiera, S.V., S.A. 54
June, 2010
f
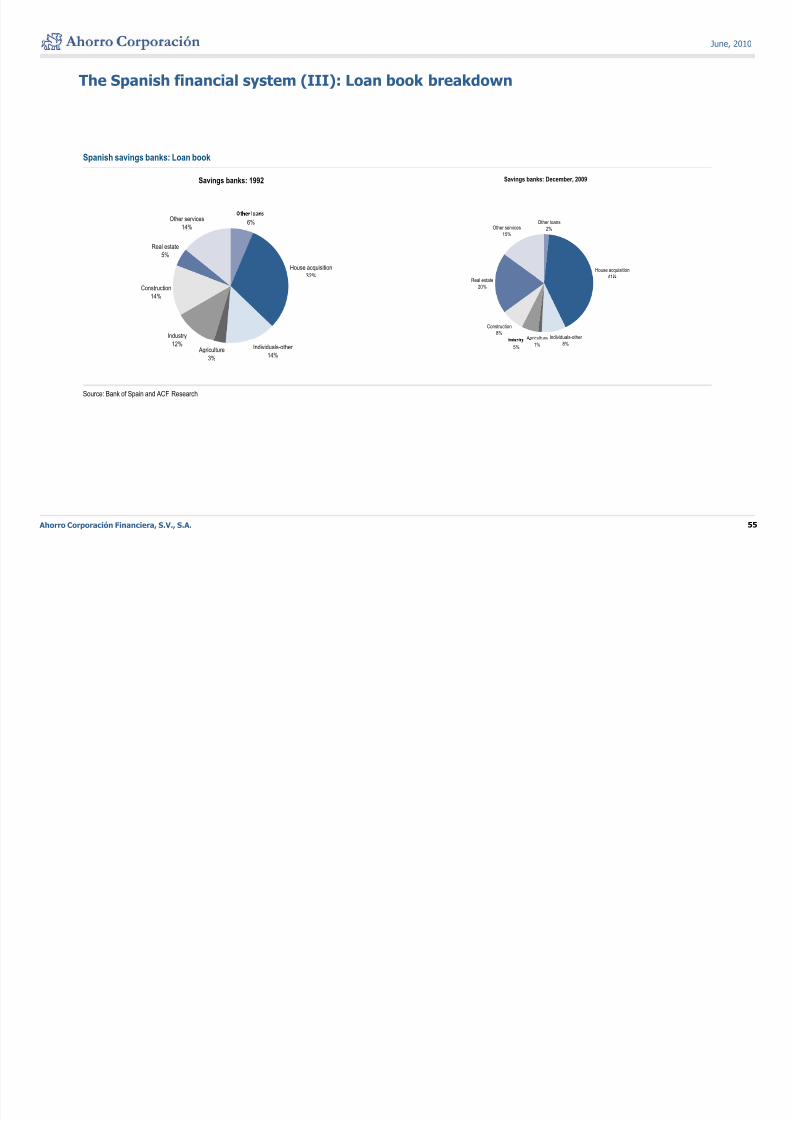
8/9/2019 Tale of Two Spains
http://slidepdf.com/reader/full/tale-of-two-spains 55/70
The Spanish financial system (III): Loan book breakdown
Spanish savings banks: Loan book
Savings banks: 1992
Savings banks: December, 2009
6%
House acquisition
32%
Real estate
5%
Other services
14%Other loans
2%
House acquisition
41%
Other services
15%
Construction
14%
Industry Individuals-other Agriculture
Construction
8%
Real estate
20%
Source: Bank of Spain and ACF Research
Individuals-other
14% Agriculture
3%
12% 8%1%5%
Ahorro Corporación Financiera, S.V., S.A. 55
June, 2010
Th S i h fi i l t (IV) M k t h
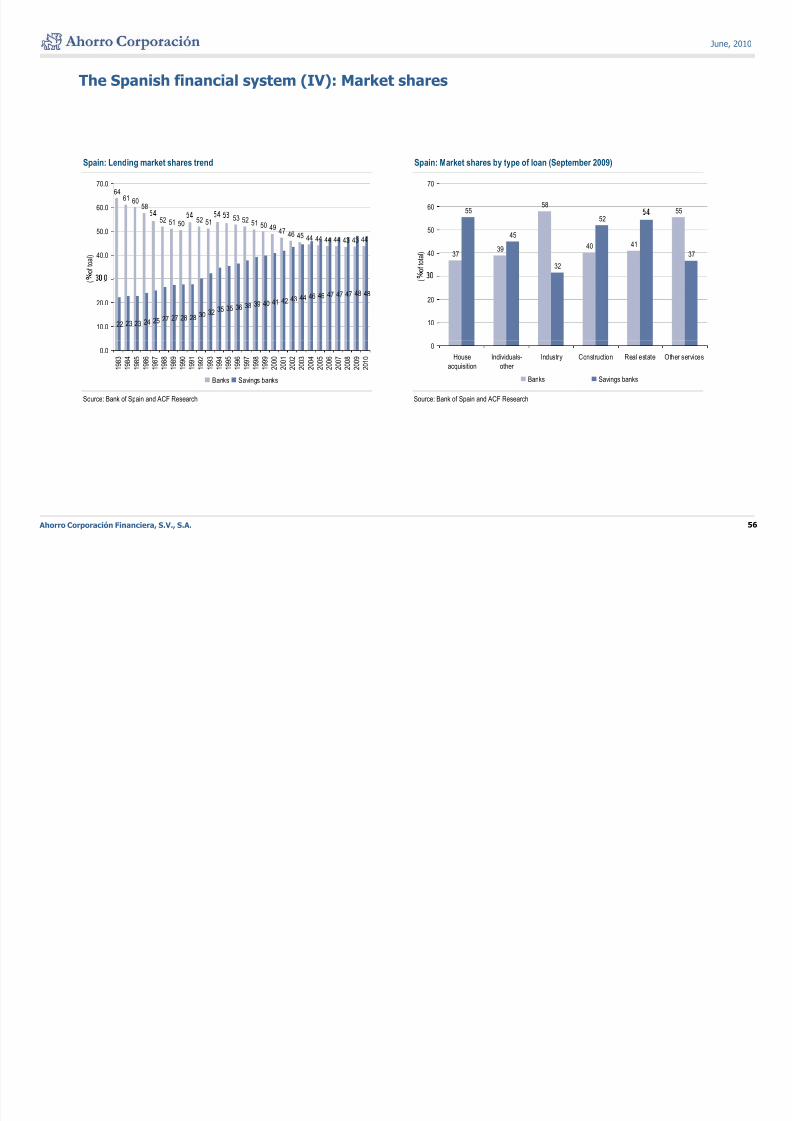
8/9/2019 Tale of Two Spains
http://slidepdf.com/reader/full/tale-of-two-spains 56/70
The Spanish financial system (IV): Market shares
Spain: Lending market shares trend Spain: Market shares by type of loan (September 2009)
6461 60
5860.0
70.0
58 555560
70
52 51 5052 51
53 52 51 50 4947 46 45 44 44 44 44 43 43 44
40.0
50.0
o f t o a l ) 37
39 40 41
45
32
52
3740
50
o f t o t a l )
22 23 23 24 25 27 27 28 28 30 32 35 35 36 38 39 40 4142 43 44 46 46 47 47 47 48 48
10.0
20.0
. (
10
20
(
Source: Bank of Spain and ACF Research Source: Bank of Spain and ACF Research
0.0
1 9 8 3
1 9 8 4
1 9 8 5
1 9 8 6
1 9 8 7
1 9 8 8
1 9 8 9
1 9 9 0
1 9 9 1
1 9 9 2
1 9 9 3
1 9 9 4
1 9 9 5
1 9 9 6
1 9 9 7
1 9 9 8
1 9 9 9
2 0 0 0
2 0 0 1
2 0 0 2
2 0 0 3
2 0 0 4
2 0 0 5
2 0 0 6
2 0 0 7
2 0 0 8
2 0 0 9
2 0 1 0
Banks Savings banks
0
House
acquisition
Individuals-
other
Industry Construction Real estate Other services
Banks Savings banks
Ahorro Corporación Financiera, S.V., S.A. 56
June, 2010
Th S i h fi i l t (V) A t lit
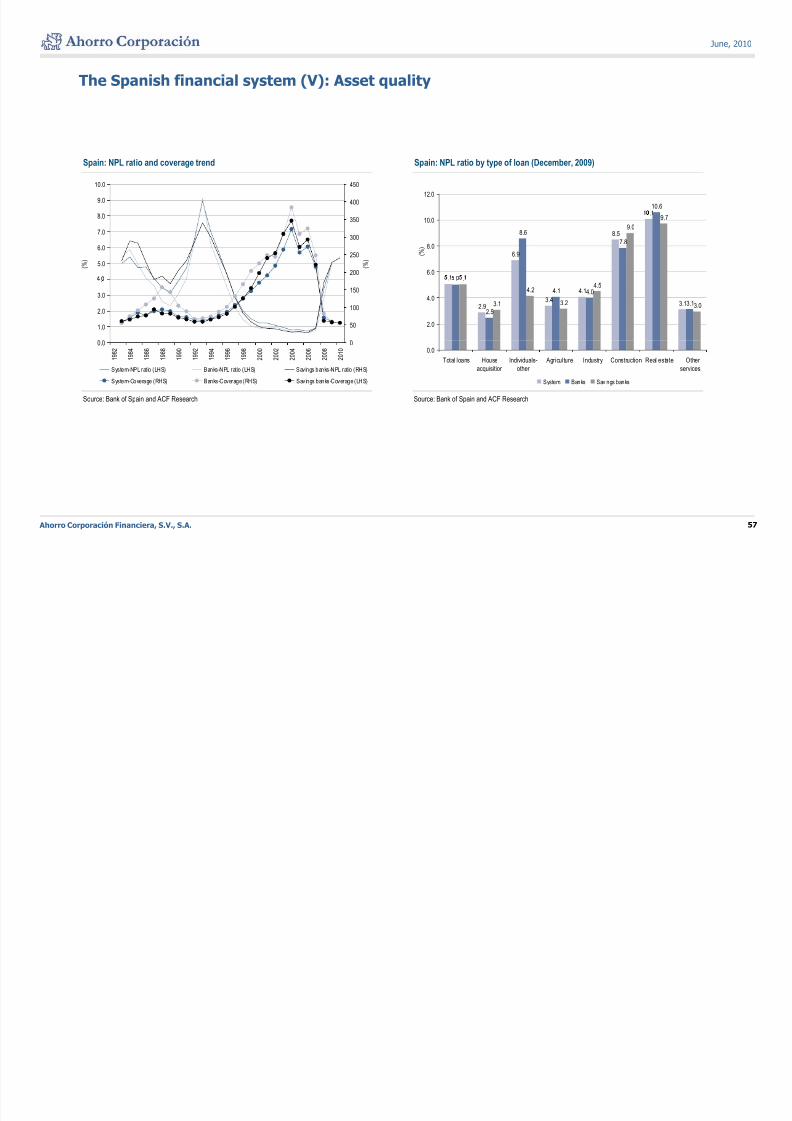
8/9/2019 Tale of Two Spains
http://slidepdf.com/reader/full/tale-of-two-spains 57/70
The Spanish financial system (V): Asset quality
Spain: NPL ratio and coverage trend Spain: NPL ratio by type of loan (December, 2009)
10.6
12.09.0
10.0
400
450
6.9
8.5
.
8.6
7.8
9.0
9.7
6.0
8.0
10.0
( % )
5.0
6.0
7.0
8.0
( % )
200
250
300
350
( % )
.
2.9
3.4
4.1
3.1
.
2.5
4.1 4.0
3.1
.
3.1
4.2
3.2
4.5
3.0
2.0
4.0
1.0
2.0
3.0
.
50
100
150
Source: Bank of Spain and ACF Research Source: Bank of Spain and ACF Research
0.0
Total loans House
acquisition
Individuals-
other
Agriculture Industry Construction Real estate Other
services
System Banks Savings banks
0.0
1 9 8 2
1 9 8 4
1 9 8 6
1 9 8 8
1 9 9 0
1 9 9 2
1 9 9 4
1 9 9 6
1 9 9 8
2 0 0 0
2 0 0 2
2 0 0 4
2 0 0 6
2 0 0 8
2 0 1 0
0
System-NPL rat io (LHS) Banks-NPL rat io (LHS) Savings banks-NPL rat io (RHS)
System-Coverage (RHS) Banks-Coverage (RHS) Savings banks-Coverage (LHS)
Ahorro Corporación Financiera, S.V., S.A. 57
The Spanish financial system (VI): Loan loss provision
June, 2010
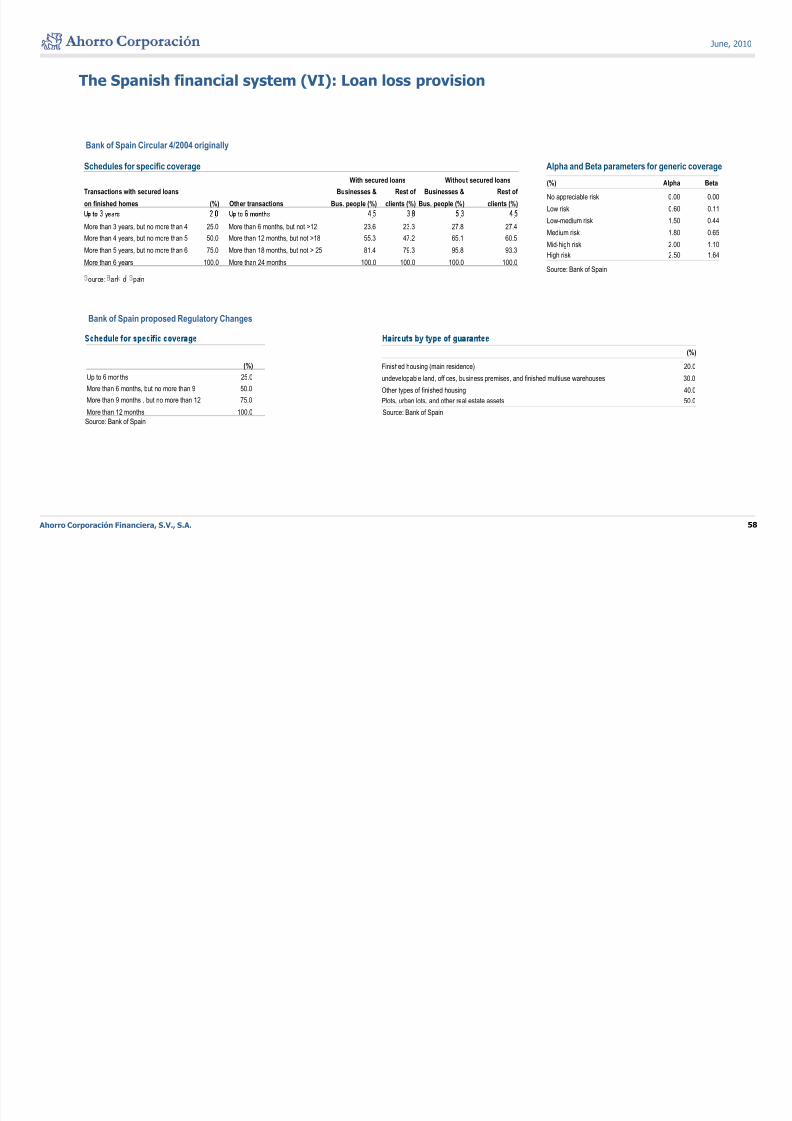
8/9/2019 Tale of Two Spains
http://slidepdf.com/reader/full/tale-of-two-spains 58/70
The Spanish financial system (VI): Loan loss provision
Bank of Spain Circular 4/2004 originally
Alpha and Beta parameters for generic coverage
(%) Alpha Beta
No appreciable risk 0.00 0.00
Low risk 0.60 0.11
Schedules for specific coverage
With secured loans Without secured loans
Transactions with secured loans Businesses & Rest of Businesses & Rest of
on finished homes (%) Other transactions Bus. people (%) clients (%) Bus. people (%) clients (%)
Source: Bank of Spain
Low-medium risk 1.50 0.44
Medium risk 1.80 0.65
Mid-high risk 2.00 1.10
High risk 2.50 1.64
. . . . .
More than 3 years, but no more than 4 25.0 More than 6 months, but not >12 23.6 23.3 27.8 27.4
More than 4 years, but no more than 5 50.0 More than 12 months, but not >18 55.3 47.2 65.1 60.5
More than 5 years, but no more than 6 75.0 More than 18 months, but not > 25 81.4 79.3 95.8 93.3
More than 6 years 100.0 More than 24 months 100.0 100.0 100.0 100.0
ource: an o pan
Bank of Spain proposed Regulatory Changes
(%)
Finished housing (main residence) 20.0
undevelopable land, offices, business premises, and finished multiuse warehouses 30.0
Other types of finished housing 40.0
Plots, urban lots, and other real estate assets 50.0
(%)
Up to 6 months 25.0
More than 6 months, but no more than 9 50.0
More than 9 months , but no more than 12 75.0
More than 12 months 100.0Source: Bank of Spain
Source: Bank of Spain
Ahorro Corporación Financiera, S.V., S.A. 58
June, 2010
The Spanish financial system (VII): Deposits growth
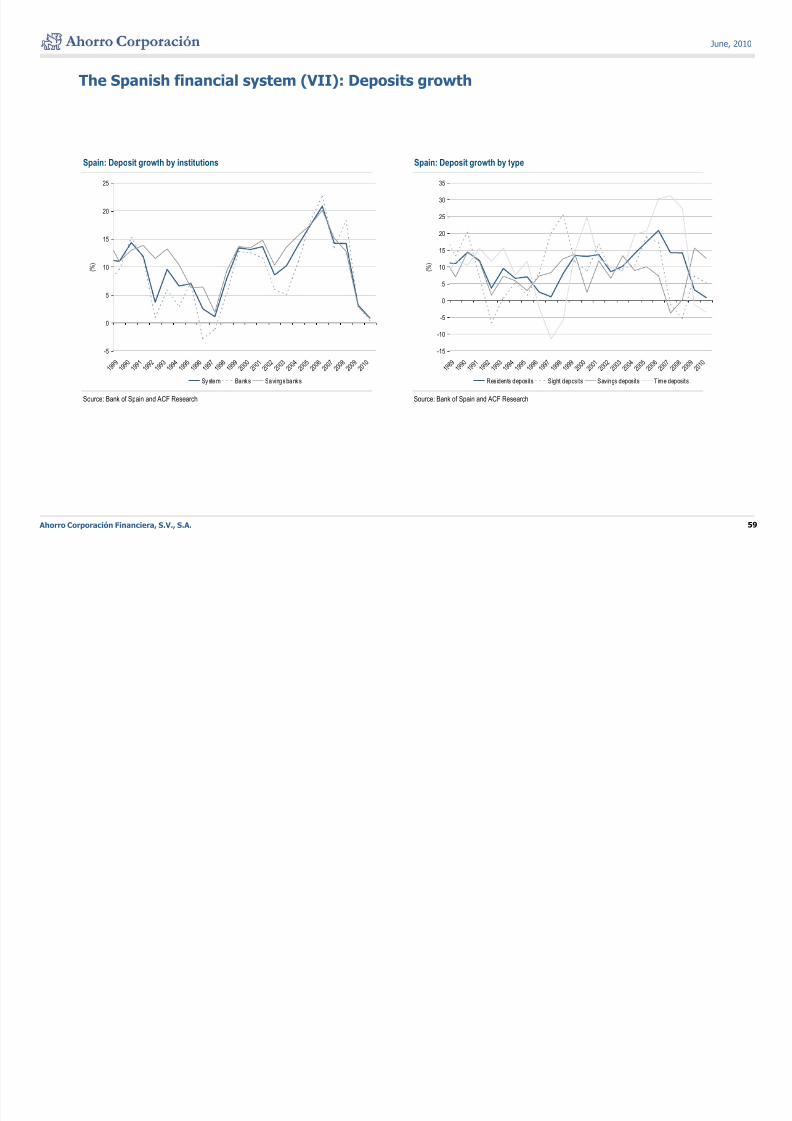
8/9/2019 Tale of Two Spains
http://slidepdf.com/reader/full/tale-of-two-spains 59/70
The Spanish financial system (VII): Deposits growth
Spain: Deposit growth by institutions Spain: Deposit growth by type
20
25
30
35
10
15
( % )
10
15
20
25
( % )
0
5
-10
-5
0
5
Source: Bank of Spain and ACF Research Source: Bank of Spain and ACF Research
-5
1 9 8 9
1 9 9 0
1 9 9 1
1 9 9 2
1 9 9 3
1 9 9 4
1 9 9 5
1 9 9 6
1 9 9 7
1 9 9 8
1 9 9 9
2 0 0 0
2 0 0 1
2 0 0 2
2 0 0 3
2 0 0 4
2 0 0 5
2 0 0 6
2 0 0 7
2 0 0 8
2 0 0 9
2 0 1 0
System Banks Savings banks
-15
1 9 8 9
1 9 9 0
1 9 9 1
1 9 9 2
1 9 9 3
1 9 9 4
1 9 9 5
1 9 9 6
1 9 9 7
1 9 9 8
1 9 9 9
2 0 0 0
2 0 0 1
2 0 0 2
2 0 0 3
2 0 0 4
2 0 0 5
2 0 0 6
2 0 0 7
2 0 0 8
2 0 0 9
2 0 1 0
Residents deposits Sight deposits Savings deposits Time deposits
Ahorro Corporación Financiera, S.V., S.A. 59
June, 2010
The Spanish financial system (VIII): Margins
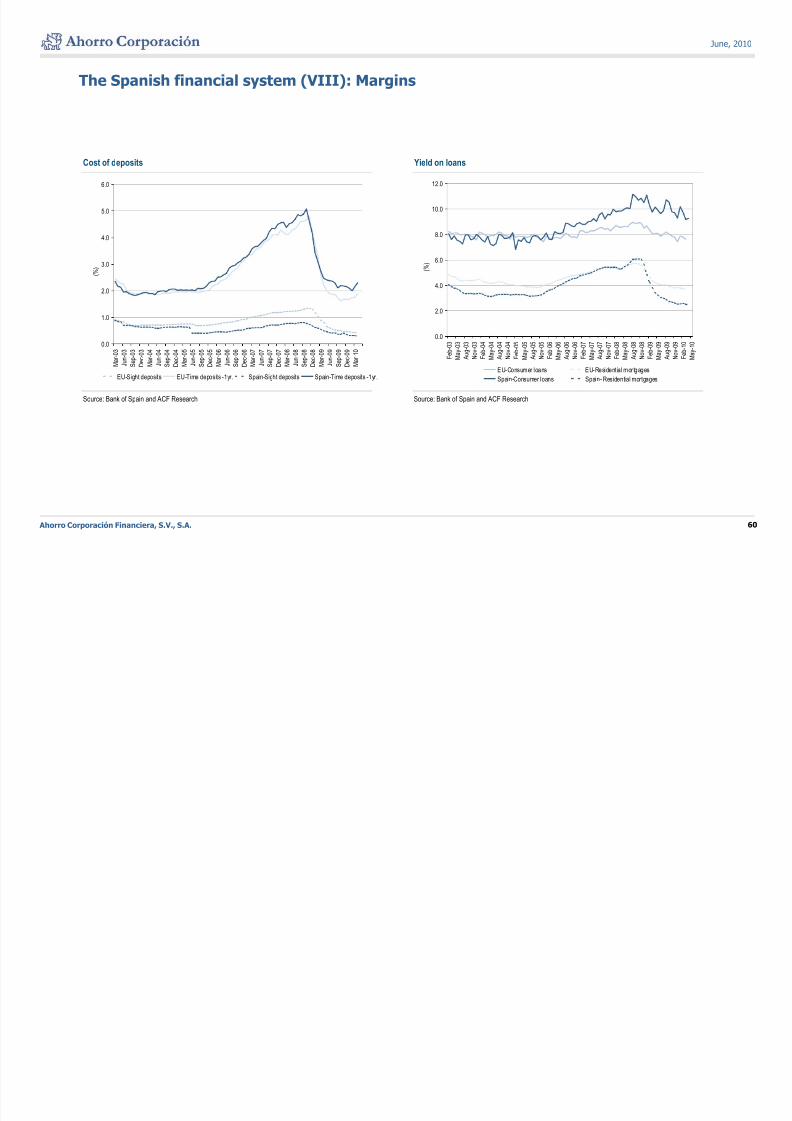
8/9/2019 Tale of Two Spains
http://slidepdf.com/reader/full/tale-of-two-spains 60/70
The Spanish financial system (VIII): Margins
Cost of deposits Yield on loans
5.0
6.0
10.0
12.0
3.0
4.0
( % )
6.0
8.0
( % )
1.0
2.0
0.0
2.0
4.0
Source: Bank of Spain and ACF Research Source: Bank of Spain and ACF Research
0.0
M a r - 0 3
J u n - 0
3
S e p - 0
3
D e c - 0
3
M a r - 0 4
J u n - 0
4
S e p - 0
4
D e c - 0
4
M a r - 0 5
J u n - 0
5
S e p - 0
5
D e c - 0
5
M a r - 0 6
J u n - 0
6
S e p - 0
6
D e c - 0
6
M a r - 0 7
J u n - 0
7
S e p - 0
7
D e c - 0
7
M a r - 0 8
J u n - 0
8
S e p - 0
8
D e c - 0
8
M a r - 0 9
J u n - 0
9
S e p - 0
9
D e c - 0
9
M a r - 1 0
EU-Sight deposits EU-Time deposits -1yr. Spain-Sight deposits Spain-Time deposits -1yr.
F e b - 0
3
M a y - 0
3
A u g - 0
3
N o v - 0
3
F e b - 0
4
M a y - 0
4
A u g - 0
4
N o v - 0
4
F e b - 0
5
M a y - 0
5
A u g - 0
5
N o v - 0
5
F e b - 0
6
M a y - 0
6
A u g - 0
6
N o v - 0
6
F e b - 0
7
M a y - 0
7
A u g - 0
7
N o v - 0
7
F e b - 0
8
M a y - 0
8
A u g - 0
8
N o v - 0
8
F e b - 0
9
M a y - 0
9
A u g - 0
9
N o v - 0
9
F e b - 1
0
M a y - 1
0
EU-Consumer loans EU-Resident ial mortgages
Spain-Consumer loans Spain- Residential mortgages
Ahorro Corporación Financiera, S.V., S.A. 60
June, 2010
The Spanish financial system (IX): Margins (cont )
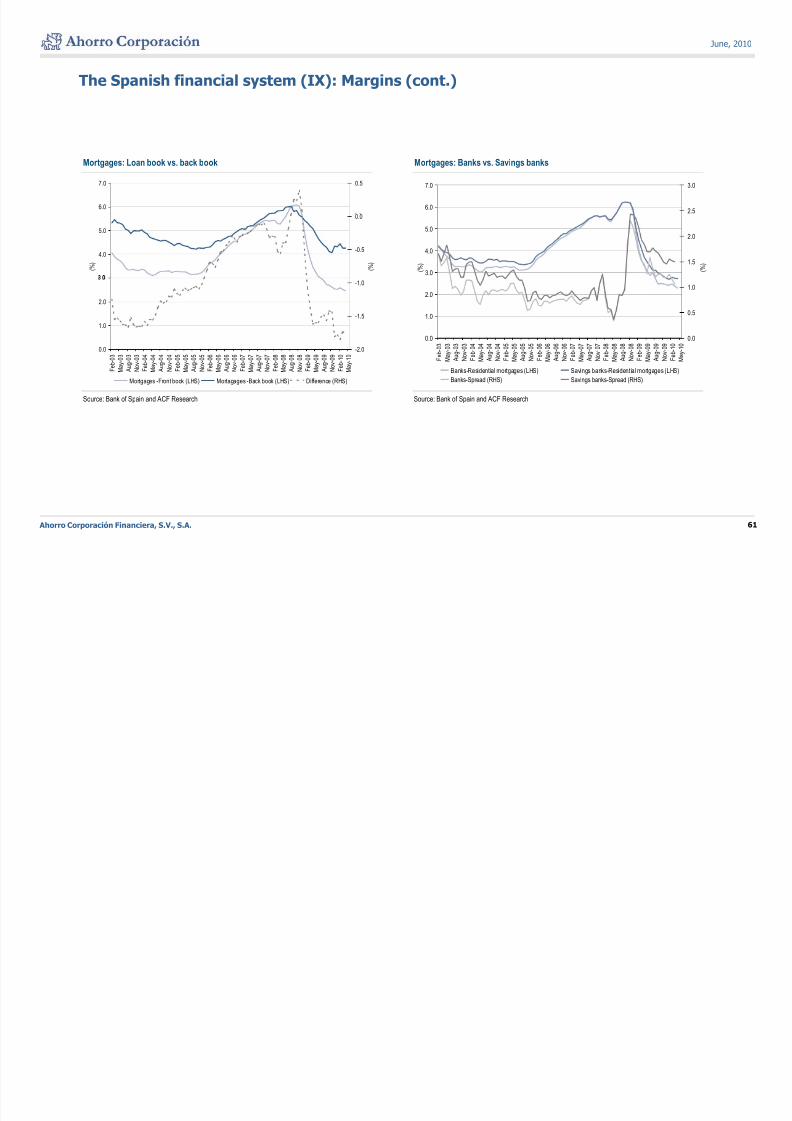
8/9/2019 Tale of Two Spains
http://slidepdf.com/reader/full/tale-of-two-spains 61/70
The Spanish financial system (IX): Margins (cont.)
Mortgages: Loan book vs. back book Mortgages: Banks vs. Savings banks
6.0
7.0 0.5
6.0
7.0
2.5
3.0
4.0
5.0
( % )
-0.5
0.0
( % )
3.0
4.0
5.0
( % ) 1.5
2.0
( % )
1.0
2.0
.
-1.5
-1.0
0.0
1.0
2.0
0.0
0.5
1.0
Source: Bank of Spain and ACF Research Source: Bank of Spain and ACF Research
0.0
F e b - 0
3
M a y - 0
3
A u g - 0
3
N o v - 0
3
F e b - 0
4
M a y - 0
4
A u g - 0
4
N o v - 0
4
F e b - 0
5
M a y - 0
5
A u g - 0
5
N o v - 0
5
F e b - 0
6
M a y - 0
6
A u g - 0
6
N o v - 0
6
F e b - 0
7
M a y - 0
7
A u g - 0
7
N o v - 0
7
F e b - 0
8
M a y - 0
8
A u g - 0
8
N o v - 0
8
F e b - 0
9
M a y - 0
9
A u g - 0
9
N o v - 0
9
F e b - 1
0
M a y - 1
0
-2.0
Mortgages -Front book (LHS) Mortagages -Back book (LHS) Difference (RHS)
F e b - 0
3
M a y - 0
3
A u g - 0
3
N o v - 0
3
F e b - 0
4
M a y - 0
4
A u g - 0
4
N o v - 0
4
F e b - 0
5
M a y - 0
5
A u g - 0
5
N o v - 0
5
F e b - 0
6
M a y - 0
6
A u g - 0
6
N o v - 0
6
F e b - 0
7
M a y - 0
7
A u g - 0
7
N o v - 0
7
F e b - 0
8
M a y - 0
8
A u g - 0
8
N o v - 0
8
F e b - 0
9
M a y - 0
9
A u g - 0
9
N o v - 0
9
F e b - 1
0
M a y - 1
0
Banks-Residential mortgages (LHS) Savings banks-Residential mortgages (LHS)
Banks-Spread (RHS) Savings banks-Spread (RHS)
Ahorro Corporación Financiera, S.V., S.A. 61
June, 2010
Spanish government and external debt (I): Issues and amortizations
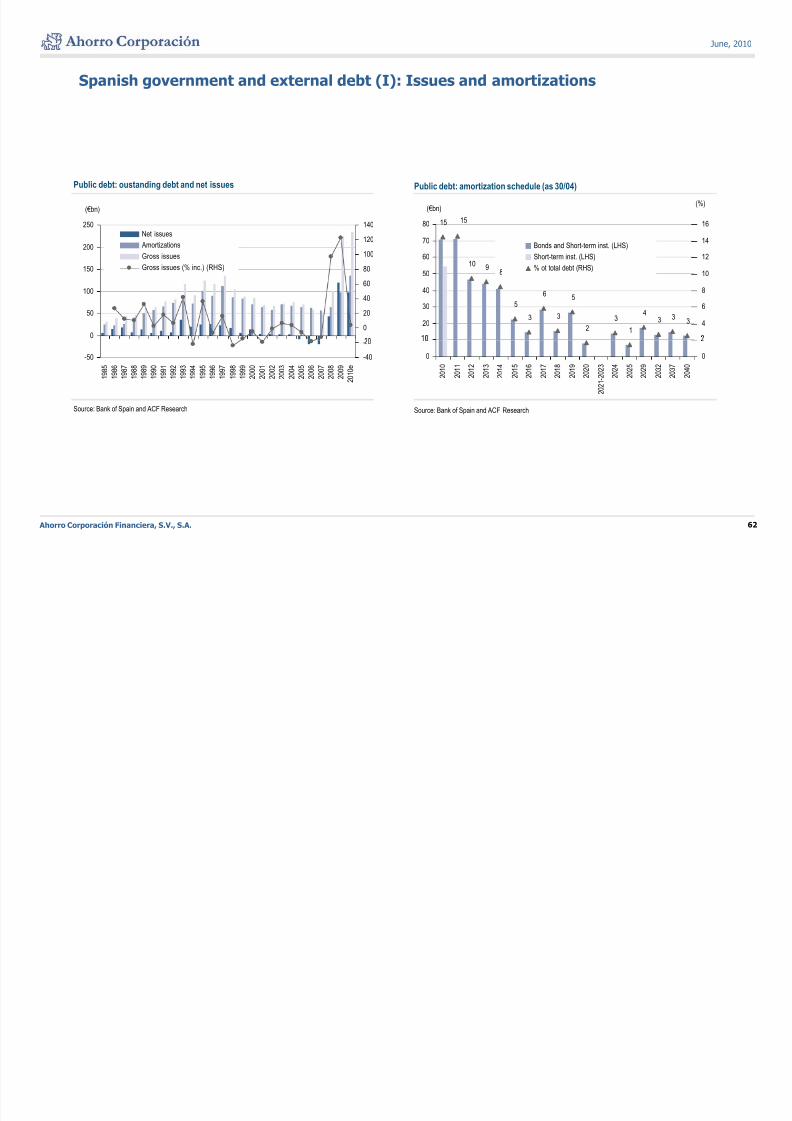
8/9/2019 Tale of Two Spains
http://slidepdf.com/reader/full/tale-of-two-spains 62/70
Spanish government and external debt (I): Issues and amortizations
Public debt: oustanding debt and net issues Public debt: amortization schedule (as 30/04)
(€bn) (€bn)
(%)
150
200
250
80
100
120
140
Net issues
Amortizations
Gross issues
Gross issues (% inc.) (RHS)
15
10 98
15
50
60
70
80
10
12
14
16
Bonds and Short-term inst. (LHS)
Short-term inst. (LHS)
% ot total debt (RHS)
0
50
100
0
20
40
60
53
6
3
5
2
3
1
43 3
320
30
40
4
6
8
-50
1 9 8 5
1 9 8 6
1 9 8 7
1 9 8 8
1 9 8 9
1 9 9 0
1 9 9 1
1 9 9 2
1 9 9 3
1 9 9 4
1 9 9 5
1 9 9 6
1 9 9 7
1 9 9 8
1 9 9 9
2 0 0 0
2 0 0 1
2 0 0 2
2 0 0 3
2 0 0 4
2 0 0 5
2 0 0 6
2 0 0 7
2 0 0 8
2 0 0 9
2 0 1 0 e
-40
-
0
2 0 1 0
2 0 1 1
2 0 1 2
2 0 1 3
2 0 1 4
2 0 1 5
2 0 1 6
2 0 1 7
2 0 1 8
2 0 1 9
2 0 2 0
2 0 2 1 - 2
0 2 3
2 0 2 4
2 0 2 5
2 0 2 9
2 0 3 2
2 0 3 7
2 0 4 0
0
Source: Bank of Spain and ACF Research Source: Bank of Spain and ACF Research
Ahorro Corporación Financiera, S.V., S.A. 62
June, 2010
Spanish government and external debt (II): Redemptions and gross issues
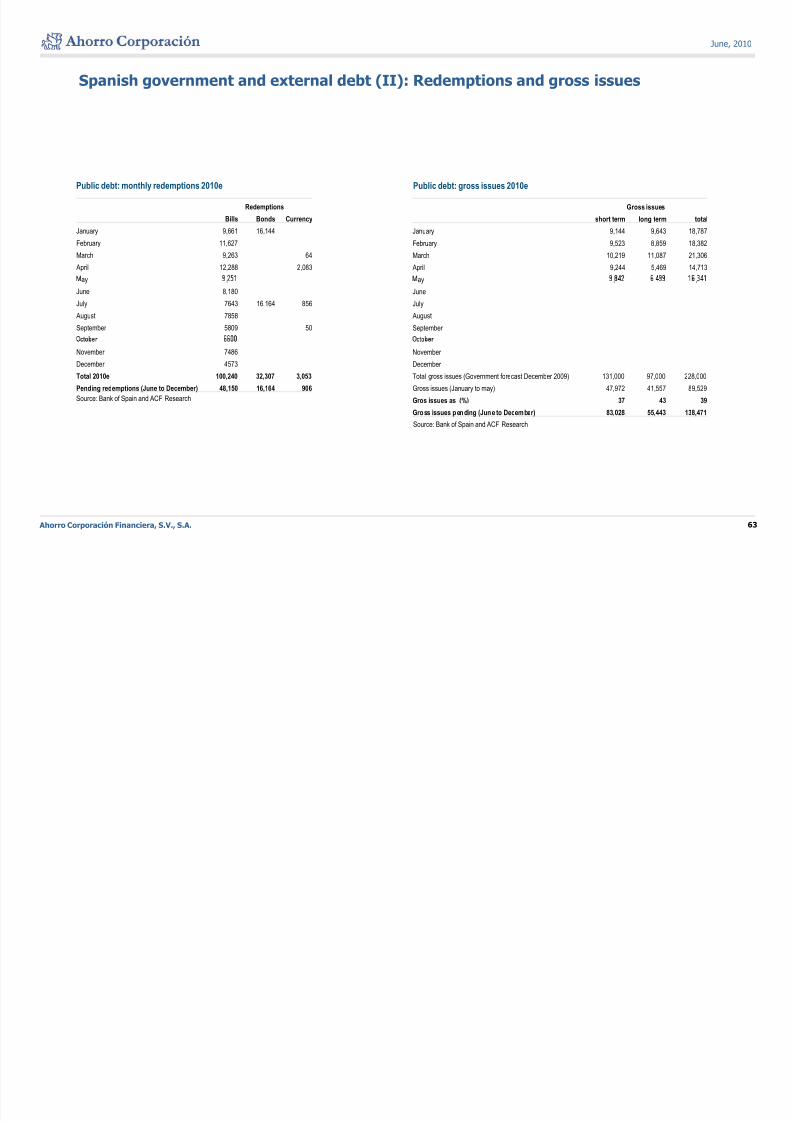
8/9/2019 Tale of Two Spains
http://slidepdf.com/reader/full/tale-of-two-spains 63/70
Spanish government and external debt (II): Redemptions and gross issues
Public debt: monthly redemptions 2010e Public debt: gross issues 2010e
Redemptions Gross issuesBills Bonds Currency
January 9,661 16,144
February 11,627
March 9,263 64
April 12,288 2,083
short term long term total
January 9,144 9,643 18,787
February 9,523 8,859 18,382
March 10,219 11,087 21,306
April 9,244 5,469 14,713
ay ,
June 8,180
July 7643 16,164 856August 7858
September 5809 50
ay , , ,
June
JulyAugust
September
Source: Bank of Spain and ACF Research
November 7486
December 4573
Total 2010e 100,240 32,307 3,053
Pending redemptions (June to December) 48,150 16,164 906
November
December
Total gross issues (Government forecast December 2009) 131,000 97,000 228,000
Gross issues (January to may) 47,972 41,557 89,529
Gros issues as (%) 37 43 39
Source: Bank of Spain and ACF Research
Gross issues pending (June to December) 83,028 55,443 138,471
Ahorro Corporación Financiera, S.V., S.A. 63
June, 2010
Spanish government and external debt (III): Public debt
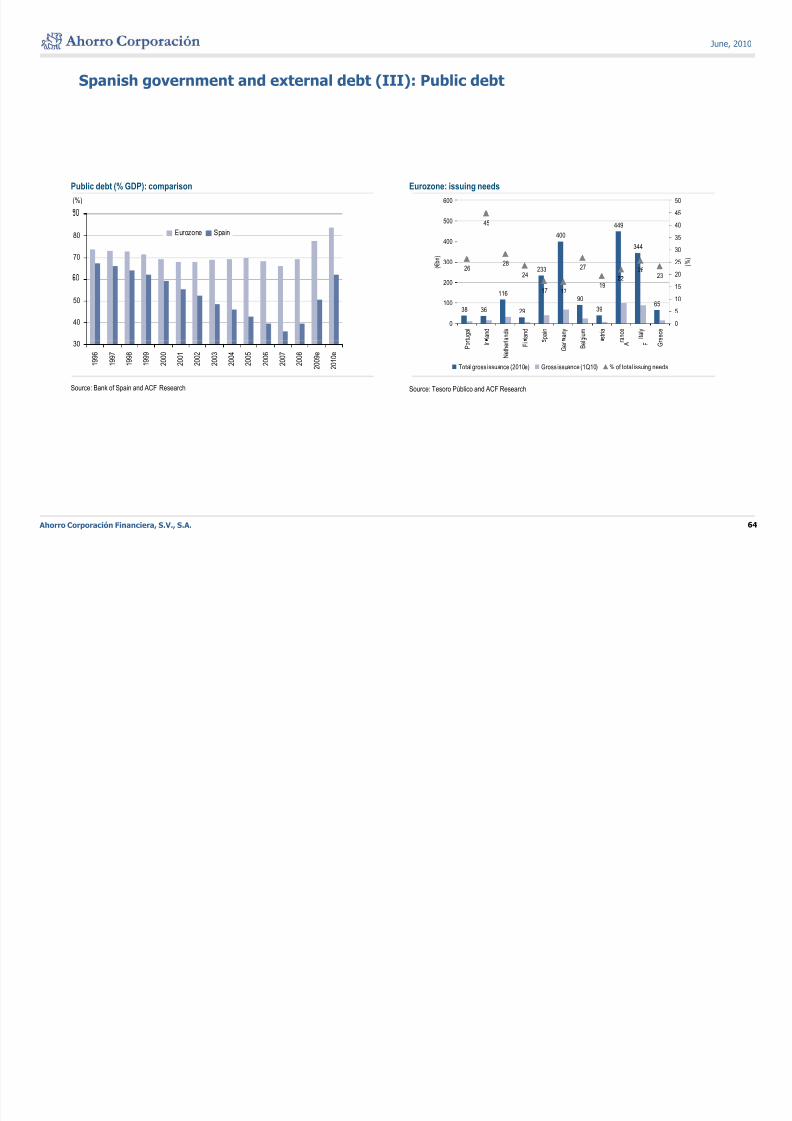
8/9/2019 Tale of Two Spains
http://slidepdf.com/reader/full/tale-of-two-spains 64/70
p g ( )
Eurozone: issuing needs
(%)
Public debt (% GDP): comparison
600
45
50
70
80 Eurozone Spain
233
400
449
344
26
45
28
2427 26
23
300
400
500
( € b n )
20
25
30
35
40
( % )
40
50
38 36
116
29
90
3965
17 1719
0
100
200
t u g a l
l a n d
a n d s
l a n d
p a i n
a n y
g i u m
s t r i a
a n c e
I t a l y
e e c e
0
5
10
15
Source: Tesoro Público and ACF Research
30
1 9 9 6
1 9 9 7
1 9 9 8
1 9 9 9
2 0 0 0
2 0 0 1
2 0 0 2
2 0 0 3
2 0 0 4
2 0 0 5
2 0 0 6
2 0 0 7
2 0 0 8
2 0 0 9 e
2 0 1 0 e
Source: Bank of Spain and ACF Research
P o r
I r
N e t h e r l
F i
G e r
B e l
A F r
G r
Total gross issuance (2010e) Gross issuance (1Q10) % of total issuing needs
Ahorro Corporación Financiera, S.V., S.A. 64
June, 2010
Spanish government and external debt (IV): Public debt tenors
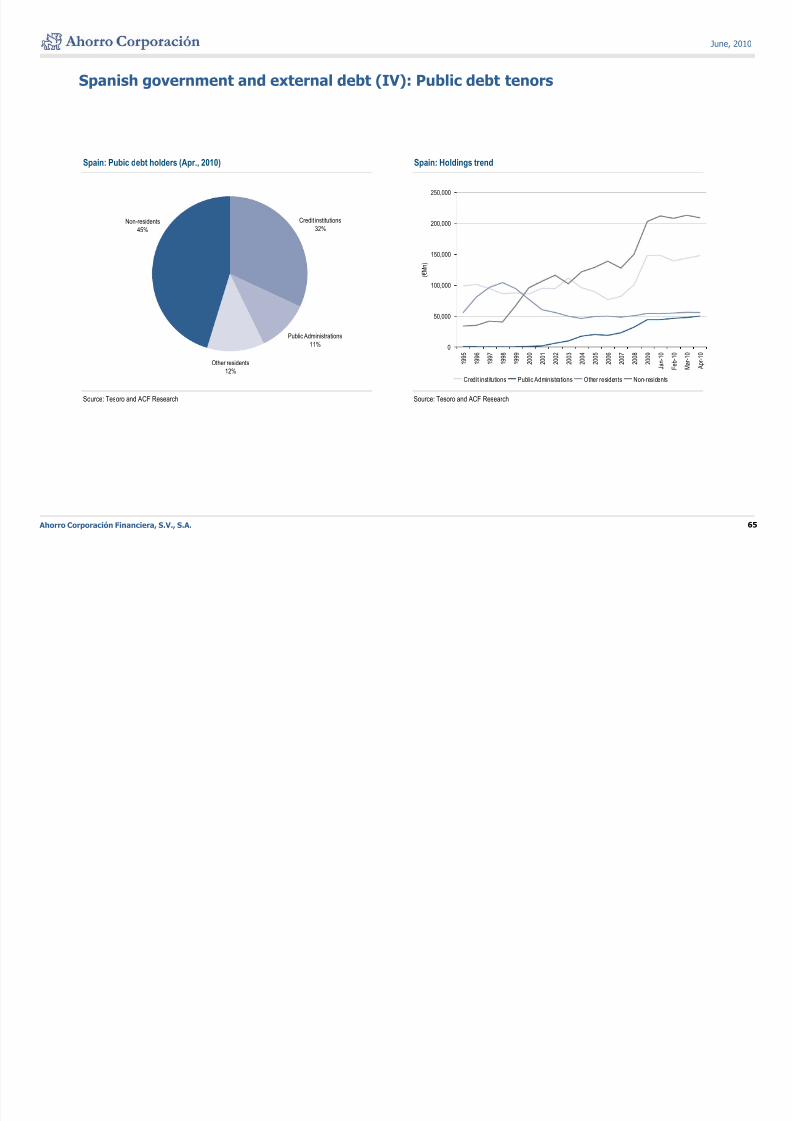
8/9/2019 Tale of Two Spains
http://slidepdf.com/reader/full/tale-of-two-spains 65/70
p g ( )
Spain: Pubic debt holders (Apr., 2010) Spain: Holdings trend
250,000
Credit institutions
32%Non-residents
45%
150,000
200,000
( € M n )
Public Administrations
50,000
100,000
Source: Tesoro and ACF Research Source: Tesoro and ACF Research
11%
Other residents
12%
0
1 9 9 5
1 9 9 6
1 9 9 7
1 9 9 8
1 9 9 9
2 0 0 0
2 0 0 1
2 0 0 2
2 0 0 3
2 0 0 4
2 0 0 5
2 0 0 6
2 0 0 7
2 0 0 8
2 0 0 9
J a n - 1
0
F e b - 1
0
M a r - 1 0
A p r - 1 0
Credit institutions Public Administrations Other residents Non-residents
Ahorro Corporación Financiera, S.V., S.A. 65
June, 2010
Spanish government and external debt (V): International holders
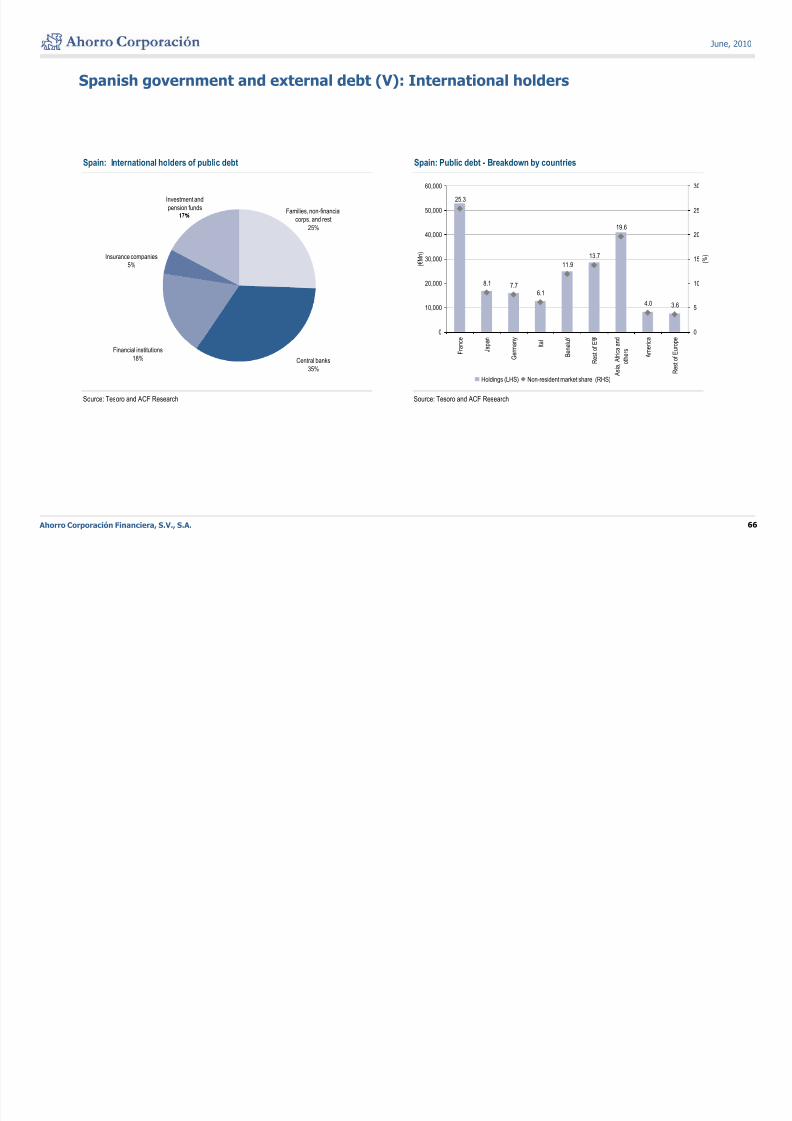
8/9/2019 Tale of Two Spains
http://slidepdf.com/reader/full/tale-of-two-spains 66/70
Spain: International holders of public debt Spain: Public debt - Breakdown by countries
Families, non-financial
Investment and
pension funds
25.3
50,000
60,000
25
30
corps. and rest
25%
Insurance companies
5% 11.9
13.7
19.6
30,000
40,000
( € M n )
15
20
( % )
8.1 7.76.1
4.03.6
0
10,000
20,000
e n y l y xU d a e0
5
10
Source: Tesoro and ACF Research Source: Tesoro and ACF Research
Central banks
35%
Financial institutions
18% F r a n c
J a p a
G e r m a n
I t a l
B e n e l u
R e s t o f E
A s i a
, A f r i c a a n
o t h e r s
A m e r i c
R e s t o f E u r o p
Holdings (LHS) Non-resident market share (RHS)
Ahorro Corporación Financiera, S.V., S.A. 66
June, 2010
Spanish government and external debt (VI): External debt

8/9/2019 Tale of Two Spains
http://slidepdf.com/reader/full/tale-of-two-spains 67/70
€Mn
Reported portfolio investment assets by economy of non resident issuer (2008)Change in main sources of financing (net)
100.000
150.000
200.000Direct investment Portfo lio investment
Other investments* Bank of Spain
Financial deriv ativ es
U.K.
8% USA
7%
-
0
50.000
UEM
53%
-100.000
.
2 0 0 7
2 0 0 8
0 0 8 ( J a n .
t o
J u l y )
0 0 9 ( J a n .
t o
J u l y )
32%
2 2
Source: IiMF and ACF ResearchSource: Bank of Spain ACF ResearchNote: (*) Loans, deposits and temporary transactions
Ahorro Corporación Financiera, S.V., S.A. 67
June, 2010
Spanish government and external debt (VII): Cross country’ holdings
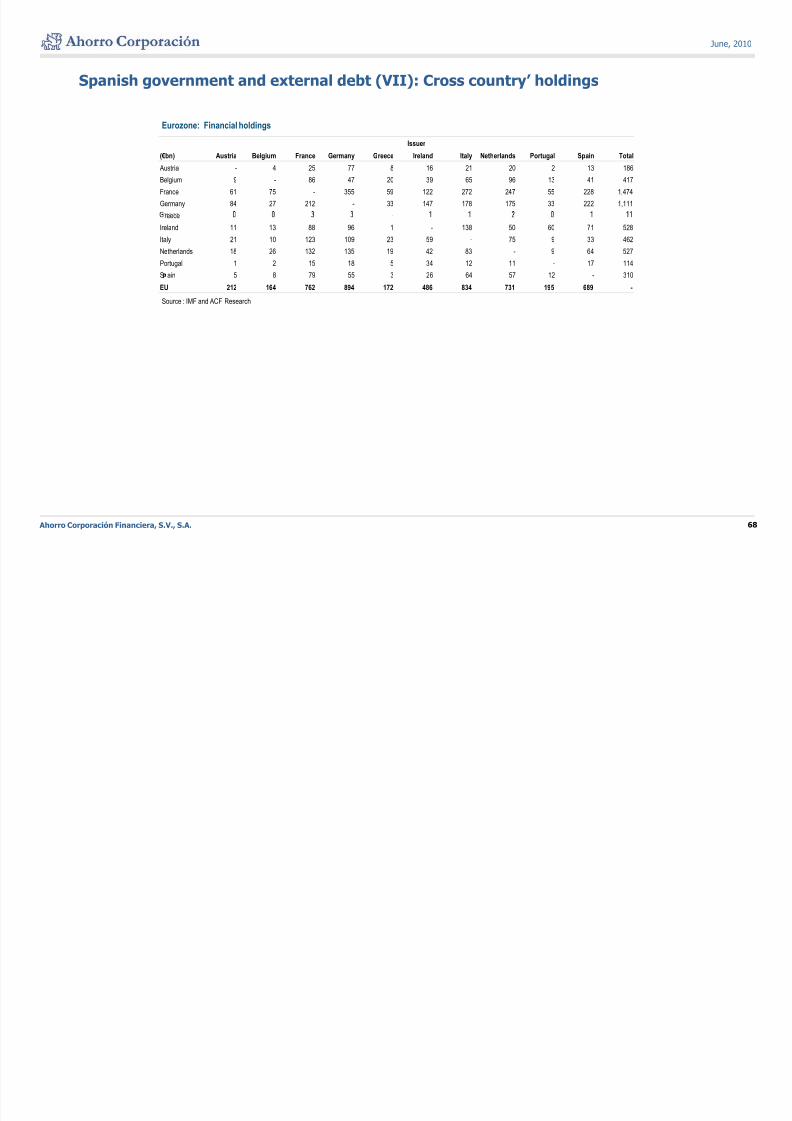
8/9/2019 Tale of Two Spains
http://slidepdf.com/reader/full/tale-of-two-spains 68/70
Issuer
Eurozone: Financial holdings
(€bn) Austria Belgium France Germany Greece Ireland Italy Netherlands Portugal Spain Total
Austria - 4 25 77 8 16 21 20 2 13 186
Belgium 9 - 86 47 20 39 65 96 13 41 417
France 61 75 - 355 59 122 272 247 55 228 1,474
Germany 84 27 212 - 33 147 178 175 33 222 1,111
reece -
Ireland 11 13 88 96 1 - 138 50 60 71 528
Italy 21 10 123 109 23 59 - 75 9 33 462
Netherlands 18 26 132 135 19 42 83 - 9 64 527
Portugal 1 2 15 18 5 34 12 11 - 17 114
S ain 5 8 79 55 3 26 64 57 12 - 310
EU 212 164 762 894 172 486 834 731 195 689 -
Source : IMF and ACF Research
Ahorro Corporación Financiera, S.V., S.A. 68
8/9/2019 Tale of Two Spains
http://slidepdf.com/reader/full/tale-of-two-spains 69/70
8/9/2019 Tale of Two Spains
http://slidepdf.com/reader/full/tale-of-two-spains 70/70