talbert house project pass 2004-2005 goals and outcomes
Post on 20-Dec-2015
218 views
TRANSCRIPT

Talbert HouseTalbert HouseProject PASSProject PASS
2004-20052004-2005
Goals and OutcomesGoals and Outcomes

Project PASSProject PASSEvaluation ToolsEvaluation Tools
Modified Aggression ScaleModified Aggression ScaleFacilitator, Parent, Teacher Behavior ChecklistFacilitator, Parent, Teacher Behavior ChecklistIn ControlIn ControlConflict Resolution ScaleConflict Resolution ScaleRosenberg Self-EsteemRosenberg Self-EsteemSchool BondingSchool BondingMood SurveyMood SurveySocial Attributes ScaleSocial Attributes ScaleGrade Point AverageGrade Point AverageProficiency TestProficiency TestAttendanceAttendance

Project PASSProject PASSEvaluation PlanEvaluation Plan
Ensuring Reliability and ValidityEnsuring Reliability and Validity Development of ProtocolDevelopment of Protocol
Being Clear on Program GoalsBeing Clear on Program Goals Being Clear on PrioritiesBeing Clear on Priorities Site Collection RatesSite Collection Rates AdministrationAdministration ScoringScoring Data ManagementData Management Communication and ReviewCommunication and Review

Project PASSProject PASSData ManagementData Management
Data is collected by site coordinators and is submitted to Data is collected by site coordinators and is submitted to an independent evaluation team (an independent evaluation team (INNOVATIONSINNOVATIONS of of Cincinnati Children’s Hospital) for data entry, analysis, Cincinnati Children’s Hospital) for data entry, analysis, and summary. and summary.
Outcome data is entered into databases especially Outcome data is entered into databases especially designed to evaluate the outcomes of Project PASS.designed to evaluate the outcomes of Project PASS.
Currently, data has been collected on over 1800 Currently, data has been collected on over 1800 students for the 2004-2005 academic year, including students for the 2004-2005 academic year, including 1131 students receiving prevention or intervention 1131 students receiving prevention or intervention services. Pre and post data were available on 794 of services. Pre and post data were available on 794 of these students, numbers sufficient to ensure validity and these students, numbers sufficient to ensure validity and statistical power in pre-post comparisons. statistical power in pre-post comparisons.

Project PASSProject PASSProgram Goals and Outcomes: 2004-05Program Goals and Outcomes: 2004-05
Goal 1:Goal 1:Increasing Anger Management/ ConflictIncreasing Anger Management/ ConflictResolution SkillsResolution Skills
2004-2005 Outcome:2004-2005 Outcome:**89.9% of students showed an increase in knowledge **89.9% of students showed an increase in knowledge of anger management and/or conflict resolution of anger management and/or conflict resolution strategiesstrategies
**74.4% showed improvement on overall problem **74.4% showed improvement on overall problem behaviors as rated on the Parent, Facilitator, or behaviors as rated on the Parent, Facilitator, or Teacher Behavior ChecklistTeacher Behavior Checklist
** data analyzed by an Independent Evaluator using CPS and Project PASS Databases**** data analyzed by an Independent Evaluator using CPS and Project PASS Databases**

Project PASSProject PASSProgram Goals and Outcomes: 2004-05Program Goals and Outcomes: 2004-05
Goal 2:Goal 2:
Decreasing Aggression RatesDecreasing Aggression Rates
2004-2005 Outcome:2004-2005 Outcome:**72.7% of 441 students demonstrated an increase in **72.7% of 441 students demonstrated an increase in Caring/Cooperation and/or decrease in Bulling or Caring/Cooperation and/or decrease in Bulling or AggressionAggression
** data analyzed by an Independent Evaluator using CPS and Project PASS Databases**** data analyzed by an Independent Evaluator using CPS and Project PASS Databases**

Project PASSProject PASSProgram Goals and Outcomes: 2004-05Program Goals and Outcomes: 2004-05
Goal 3: Goal 3: Increasing Self-EsteemIncreasing Self-Esteem
2004-2005 Outcome2004-2005 Outcome**78.7% of 194 students showed increased/positive self-**78.7% of 194 students showed increased/positive self-esteem and/or increase/positive mood at post-esteem and/or increase/positive mood at post-assessmentassessment
** data analyzed by an Independent Evaluator using CPS and Project PASS Databases**** data analyzed by an Independent Evaluator using CPS and Project PASS Databases**
Project PASSProject PASSProgram Goals and Outcomes: 2004-05Program Goals and Outcomes: 2004-05
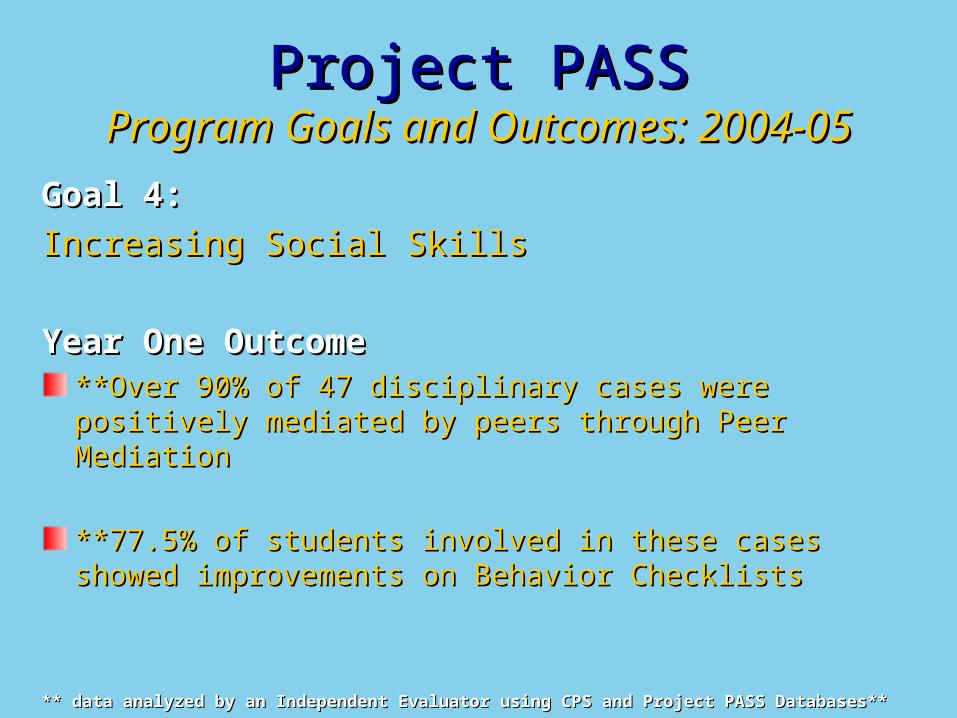
Goal 4:Goal 4:
Increasing Social SkillsIncreasing Social Skills
Year One OutcomeYear One Outcome**Over 90% of 47 disciplinary cases were positively **Over 90% of 47 disciplinary cases were positively mediated by peers through Peer Mediationmediated by peers through Peer Mediation
**77.5% of students involved in these cases showed **77.5% of students involved in these cases showed improvements on Behavior Checklistsimprovements on Behavior Checklists
** data analyzed by an Independent Evaluator using CPS and Project PASS Databases**** data analyzed by an Independent Evaluator using CPS and Project PASS Databases**

Project PASSProject PASSProgram Goals and Outcomes: 2004-05Program Goals and Outcomes: 2004-05
Goal 5:Goal 5:Decreasing Behavioral/ Conduct ProblemsDecreasing Behavioral/ Conduct Problems
2004-2005 Outcome2004-2005 Outcome**74.4% showed improvement on overall problem **74.4% showed improvement on overall problem behaviors as rated on the Parent, Facilitator, or behaviors as rated on the Parent, Facilitator, or Teacher Behavior ChecklistTeacher Behavior Checklist
Over 90% of conflicts were resolved successfully Over 90% of conflicts were resolved successfully through peer mediationthrough peer mediation
** data analyzed by an Independent Evaluator using CPS and Project PASS Databases**** data analyzed by an Independent Evaluator using CPS and Project PASS Databases**
Project PASSProject PASSProgram Goals and Outcomes: 2004-05Program Goals and Outcomes: 2004-05
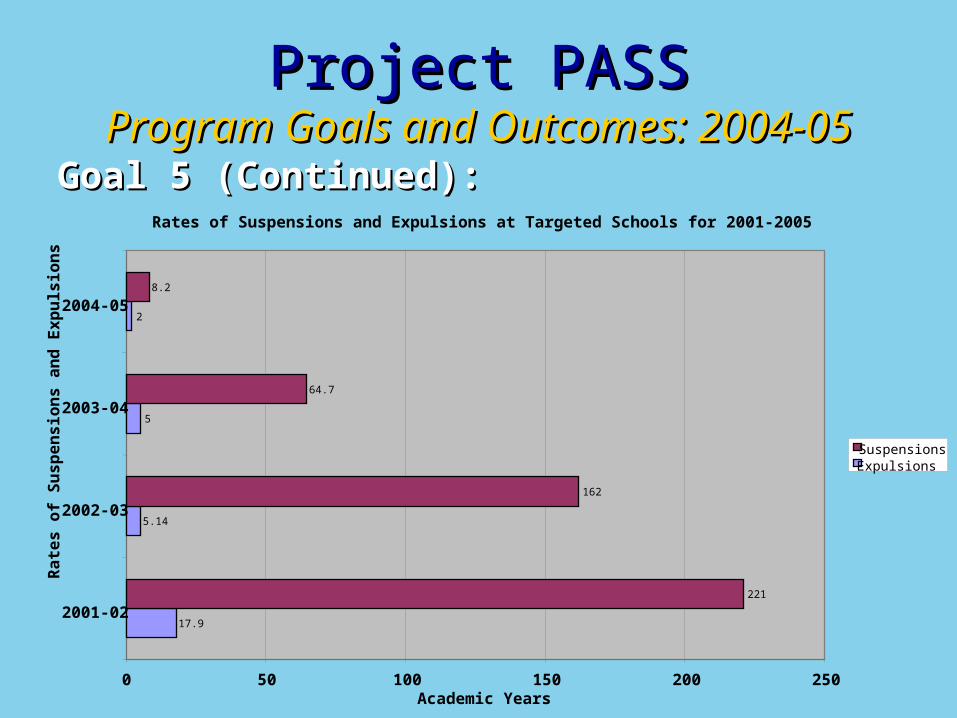
Goal 5 (Continued):Goal 5 (Continued):Rates of Suspensions and Expulsions at Targeted Schools for 2001-2005
17.9
5.14
5
2
221
162
64.7
8.2
0 50 100 150 200 250
2001-02
2002-03
2003-04
2004-05
Ra
tes
of
Su
sp
en
sio
ns
an
d E
xp
uls
ion
s
Academic Years
SuspensionsExpulsions

Project PASSProject PASSProgram Goals and Outcomes: 2004-05Program Goals and Outcomes: 2004-05
Goal 6:Goal 6:Improving School/Test PerformanceImproving School/Test Performance
2004-2005 Outcome2004-2005 Outcome93.2% out of 257 students receiving intervention/ 93.2% out of 257 students receiving intervention/ prevention services improved in their overall grade point prevention services improved in their overall grade point averageaverage
** data analyzed by an Independent Evaluator using CPS and Project PASS Databases**** data analyzed by an Independent Evaluator using CPS and Project PASS Databases**

Project PASSProject PASSProgram Goals and Outcomes: 2004-05Program Goals and Outcomes: 2004-05
Goal 6 (Continued):Goal 6 (Continued):Percentage of Students Passing the Reading Proficiency Test at Targeted Schools
49.10%
52.40%
59.90%
0.00% 10.00% 20.00% 30.00% 40.00% 50.00% 60.00% 70.00%
2001-2002
2002-2003
2003-2004

Project PASSProject PASSProgram Goals and Outcomes: 2004-05Program Goals and Outcomes: 2004-05
Goal 7:Goal 7:Increasing School Attendance/ School BondingIncreasing School Attendance/ School Bonding
2004-2005 Outcome2004-2005 OutcomeData from 2004-2005 showed positive trends with Data from 2004-2005 showed positive trends with attendance rates being above the state goal of 93% and attendance rates being above the state goal of 93% and the District Average of 94.2% across all schools.the District Average of 94.2% across all schools.
** data analyzed by an Independent Evaluator using CPS and Project PASS Databases**** data analyzed by an Independent Evaluator using CPS and Project PASS Databases**

Project PASSProject PASSProgram Goals and Outcomes: 2004-05Program Goals and Outcomes: 2004-05
Goal 7 (Continued):Goal 7 (Continued):Average Daily Attendance for Targeted Schools
88 89 90 91 92 93 94 95 96
2001-02
2002-03
2003-04
2004-05
Ac
ad
em
ic Y
ea
rs
Percentage of Students Attending Daily
Average Daily Attendance

Project PASSProject PASSProgram Goals and Outcomes: 2004-05Program Goals and Outcomes: 2004-05
Goal 8:Goal 8:
Improving Proficiency Test PerformanceImproving Proficiency Test Performance
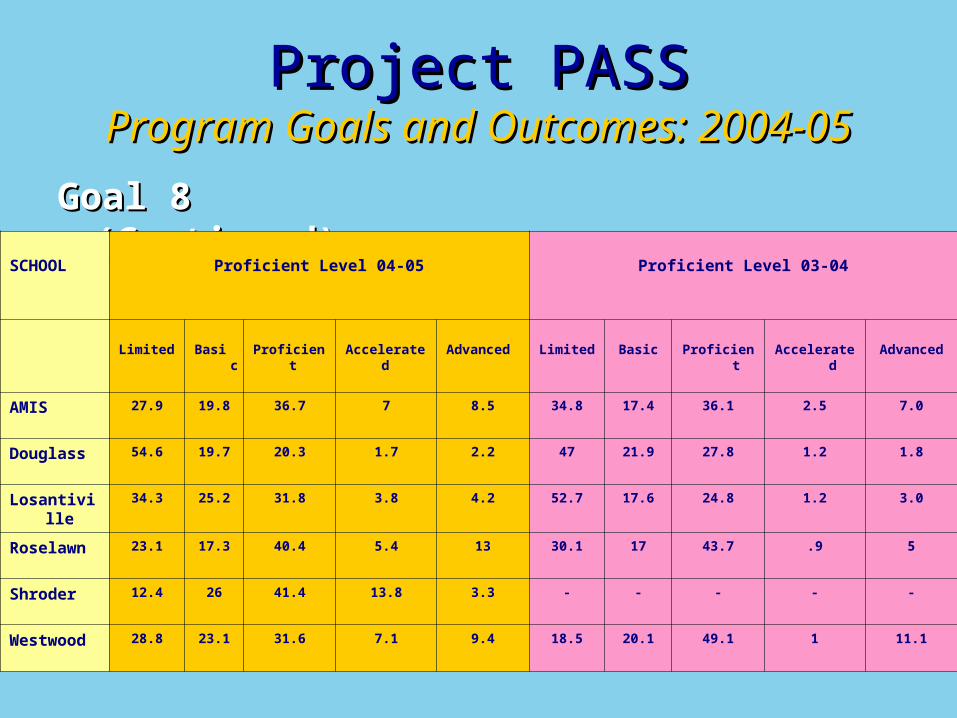
2004-2005 Outcome2004-2005 OutcomeThe number of students at the “proficient,” “accelerated,” The number of students at the “proficient,” “accelerated,” and “advanced” levels is higher in 2004-05 than it was in and “advanced” levels is higher in 2004-05 than it was in 2004-03 at 7 of the 8 schools for which this comparison 2004-03 at 7 of the 8 schools for which this comparison could be made. could be made.
** data analyzed by an Independent Evaluator using CPS and Project PASS Databases**** data analyzed by an Independent Evaluator using CPS and Project PASS Databases**
Project PASSProject PASSProgram Goals and Outcomes: 2004-05Program Goals and Outcomes: 2004-05
Goal 8 (Continued):Goal 8 (Continued):
SCHOOL Proficient Level 04-05 Proficient Level 03-04
Limited Basic Proficient Accelerated Advanced Limited Basic Proficient Accelerated Advanced
AMIS 27.9 19.8 36.7 7 8.5 34.8 17.4 36.1 2.5 7.0
Douglass 54.6 19.7 20.3 1.7 2.2 47 21.9 27.8 1.2 1.8
Losantiville 34.3 25.2 31.8 3.8 4.2 52.7 17.6 24.8 1.2 3.0
Roselawn 23.1 17.3 40.4 5.4 13 30.1 17 43.7 .9 5
Shroder 12.4 26 41.4 13.8 3.3 - - - - -
Westwood 28.8 23.1 31.6 7.1 9.4 18.5 20.1 49.1 1 11.1

Project PASSProject PASSProgram Goals and Outcomes: 2004-05Program Goals and Outcomes: 2004-05
Goal 9:Goal 9:Enhancing Participation and Parenting SkillsEnhancing Participation and Parenting Skills
2004-2005 Outcome2004-2005 OutcomeParent participation in FF, TH or school events ranged from Parent participation in FF, TH or school events ranged from 57 to 85% at respective schools57 to 85% at respective schools
Parents also reported reading more to their children, using Parents also reported reading more to their children, using more appropriate disciplinary strategies, increasing their more appropriate disciplinary strategies, increasing their parenting knowledge, and volunteering more at school as a parenting knowledge, and volunteering more at school as a result of participation in various programs offered through result of participation in various programs offered through the Challenge Grant. the Challenge Grant.
** data analyzed by an Independent Evaluator using CPS and Project PASS Databases**** data analyzed by an Independent Evaluator using CPS and Project PASS Databases**

Project PASSProject PASSProgram Goals and Outcomes: 2004-05Program Goals and Outcomes: 2004-05
Goal 10:Goal 10:
Improving Promotion RatesImproving Promotion Rates
2004-2005 Outcome2004-2005 OutcomeIn addition to the promotion rates reported in the In addition to the promotion rates reported in the following chart, it should be noted that the District following chart, it should be noted that the District reported its highest graduation rate over the past 5 reported its highest graduation rate over the past 5 years. Withrow University is scheduled to graduate its years. Withrow University is scheduled to graduate its
first class in 2005-06.first class in 2005-06.
** data analyzed by an Independent Evaluator using CPS and Project PASS Databases**** data analyzed by an Independent Evaluator using CPS and Project PASS Databases**

Project PASSProject PASSProgram Goals and Outcomes: 2004-05Program Goals and Outcomes: 2004-05
Goal 10 (Continued):Goal 10 (Continued):Promotion Rates for Targeted Schools by Academic Year
84 86 88 90 92 94 96 98 100
2001-02
2002-03
2003-04
2004-05
Ac
ad
em
ic
Ye
ar
Percentage of Students Promoted
Promotion Rates

Project PASSProject PASSProgram Goals and Outcomes: 2004-05Program Goals and Outcomes: 2004-05
Goal 11:Goal 11:Enhance Professional Development and Enhance Professional Development and TrainingTraining
2004-2005 Outcome2004-2005 Outcome30 hours of professional development included local 30 hours of professional development included local and regional training in mental health and behavioral and regional training in mental health and behavioral screening, use of best practices in school intervention screening, use of best practices in school intervention and prevention, and provision of integrative school and prevention, and provision of integrative school services to improve academic and behavioral services to improve academic and behavioral outcomes.outcomes.

Principal FeedbackPrincipal Feedback““Project PASS serves at the center for gathering information for Project PASS serves at the center for gathering information for other organizations. I see Talbert House as the key player for other organizations. I see Talbert House as the key player for serving the needs of individual students for AMIS. That’s how serving the needs of individual students for AMIS. That’s how we’ve incorporated the Talbert House into our One-Plan.”we’ve incorporated the Talbert House into our One-Plan.”
““Talbert House has assisted our students with tutoring. The staff Talbert House has assisted our students with tutoring. The staff has welcomed the opportunity to reach beyond the social and has welcomed the opportunity to reach beyond the social and emotional needs to promote academics. If our students have emotional needs to promote academics. If our students have peace of mind the learning becomes easier.” peace of mind the learning becomes easier.”
““Project PASS helps to reduce discipline referrals builds self Project PASS helps to reduce discipline referrals builds self esteem, promotes social consciousness.” esteem, promotes social consciousness.”
““The program has a positive impact on our school climate The program has a positive impact on our school climate because school personnel as well as students feel free to use because school personnel as well as students feel free to use PASS services.”PASS services.”
Teacher/ Student FeedbackTeacher/ Student Feedback
““I loved this program. The staff are real nice. I learned I loved this program. The staff are real nice. I learned how to control my anger, I'm glad Project PASS is in our how to control my anger, I'm glad Project PASS is in our school.” school.”
““When we drew the faces and talk about it, I really like When we drew the faces and talk about it, I really like the program because I got to learn new things I have no the program because I got to learn new things I have no learn year. I'm really happy to have this program, I liked learn year. I'm really happy to have this program, I liked how they talked about eye to eye I think that was how they talked about eye to eye I think that was something good to talk about.” something good to talk about.”
““The Talbert House staff does an excellent job working The Talbert House staff does an excellent job working with the students. “with the students. “

Summary of AccomplishmentsSummary of Accomplishments
Available data indicates that each of the goals of Project Available data indicates that each of the goals of Project PASS are being met or progress is being achieved. PASS are being met or progress is being achieved.
In all, over 5000 forms were collected on over 1800 In all, over 5000 forms were collected on over 1800 students. students.
Students receiving long-term and/or intensive services Students receiving long-term and/or intensive services are being triaged to the appropriate services. are being triaged to the appropriate services.
There is increased clarity with respect to the assessment There is increased clarity with respect to the assessment and intervention protocols that are being implemented. and intervention protocols that are being implemented.

Lessons LearnedLessons Learned
Expand collaborations with other school and Expand collaborations with other school and community resources community resources Improve efficiency in assessment and program Improve efficiency in assessment and program evaluationevaluationBetter align pre/post assessment data to involve Better align pre/post assessment data to involve more parents and familiesmore parents and familiesBolster activities to improve school culture for Bolster activities to improve school culture for school bondingschool bondingIncrease parent involvementIncrease parent involvement

Setting New GoalsSetting New Goals• Creating a Data Feedback LoopCreating a Data Feedback Loop• Being Our Work Critic and Best AdvocateBeing Our Work Critic and Best Advocate• Understanding Overlap and Integration of Understanding Overlap and Integration of
ServicesServices• Use of the Ohio ScalesUse of the Ohio Scales• Use of the of S-BayUse of the of S-Bay• Achieving Higher Data Collection RatesAchieving Higher Data Collection Rates• Assessing School-Wide and Community Assessing School-Wide and Community
ImpactImpact• Ensuring Input from All StaffEnsuring Input from All Staff• Being Aware of New Trends and OpportunitiesBeing Aware of New Trends and Opportunities