taking stock - sec sri lanka€¦ · taking stock 03 table of contents ... o indices influenced by...
TRANSCRIPT

C T SMITH STOCKBROKERS (PVT) LTD
TakingStock30 August 2013


Taking Stock
Table of Contents03
Market Outlook 04 Sectoral Earnings Analysis 20
Treasury Bills vs. ASPI 21
Economic Update 05 Regional Market Comparisons 22
Interest Rates 06 Summary Market Performance 23
Gross Domestic Product 08 Top 20 Stocks by Market Cap. 24
Inflation 09
Fiscal Policy 10 Banking Finance & Insurance Sector 25
Balance of Trade 12 Banks 26
Balance of Payments 13 Non-Banking Financial Institutions 29
Exchange Rates 14 Insurance Companies 31
Economic Indicators 15
Tourism Sector 33
Stock Market Update 17 Tourism – Sri Lanka 34
Key Events 18 Tourism Maldives 36
Foreign Investor Participation 19 Casino & Gaming 37

04Market Outlook
Global concerns and macroeconomic obstacles challenging upward market momentum In 2013YTD, the market has witnessed relatively high volatility; ASI up 3% (with the index both rising 14% and falling 11% since early April 2013)
whilst S&P SL20 up 6% (vs. -7% and +18% respectively in 2012)o Indices influenced by volatility in illiquid market heavyweights Ceylon Tobacco Company (CTC, up 41% 2013YTD, high of +67% in
2013YTD, 9.7% of total market cap) and Nestle Lanka (NEST, up 39% 2013YTD, high of +68%, 5.1% of market cap) and conglomerate JohnKeells Holdings (JKH, down 2% 2013YTD, high of +36%, 8.2% of market cap)
Foreign participation high, but easing slightly amid emerging market concerns and heightened risk aversion Despite concerns over the US Federal Reserve tapering off its stimulus package, unrest in Syria and the attractiveness of global emerging and
frontier markets waning, the local market has witnessed continued net foreign inflows into the Banking & Finance, Diversified Holdings and Food,Beverage & Tobacco sectors
o Relatively illiquid stock market and economy is better insulated from global forces, but net foreign buying has eased in recent months,with Sri Lanka’s GDP growth also yet to fully recover amid macro concerns
Foreign participation accounted for ~38% of total market activity in 2013YTD (vs. 25% in 2012)
Retail interest remains subdued, while local institutions mostly focused on listed debt Steep declines in low cap and mid cap share prices and continuing high market lending rates have sapped retail enthusiasm for equities
despite uptick in M&A activity Local institutions big backers of listed corporate debt issues (~Rs.25bn worth of new debentures in 2013YTD vs. only Rs.494mn new IPO equity)
amid tax benefits; secondary market trading in listed debt though remains negligible
Bottom up stock selection required amid challenging global and macro views Banking & Finance sector faces near term headwinds due to slower than anticipated recovery in demand for credit, currency fluctuations and
higher impairment charges – certain valuations though may be at a sufficient discount Select consumer plays offer long term consistency, despite trading at rich valuations, although high inflation environment likely to act as
constraint in short term Hotel sector still trading at a premium; challenges in managing declining occupancies at Sri Lanka resort hotels (despite record high tourist
arrivals) amid increasing capacity Select manufacturing sector stocks with strong brands and operating efficiencies to benefit from medium term recovery in consumer demand Plantation and motor sectors trading at low valuations – mostly justified due to rise in cost of production subsequent to wage hike from April 2013
(and volatile selling prices) and high import duties respectively Mini hydro plays in power sector to benefit from improved rainfall but remain vulnerable to unpredictable weather patterns
Prudent stock selection to continue to reward patient investors, but caution warranted Current market valuations of 11.7X 2013E and 10.7X 2014E are at discounts to historical levels Recent developments of abrupt policy changes, governance issues and rising global risks may however warrant higher risk premium
Taking Stock
EconomicUpdate
Taking Stock

Policy Rate Jul-10 Aug-10 Jan-11 Apr-11 Feb-12 Apr-12 Dec-12 May-13 Jul-13RR (%) 7.25 7.25 7.00 7.00 7.50 7.75 7.50 7.00 7.00 RRR (%) 9.50 9.00 8.50 8.50 9.00 9.75 9.50 9.00 9.00 SRR (%) 7.00 7.00 7.00 8.00 8.00 8.00 8.00 8.00 6.00 PR Cor (%) 2.25 1.75 1.50 1.50 1.50 2.00 2.00 2.00 2.00
RR - Repurchase Rate SRR - Statutory Reserve RatioRRR - Reverse Repurchase Rate PR Cor - Policy Rate Corridor
Interest Rates
Recent revisions in key CBSL policy rates
Sri Lanka: Private sector credit growth
Source : CBSL
Sri Lanka: Money market liquidity and Govt. security holdings
-20
0
20
40
60
0
50
100
150
200
250
2-Aug-12 26-Oct-13 29-Jan-13 2-May-13 29-Jul-13
Govt Security holdings (Rs bn) :LHS Liquidity (Rs bn) :RHS
“The Central Bank of Sri Lanka (CBSL) adopted a dovish monetary policy
since Dec 2012 to stimulate demand for credit”
“Money market liquidity remained relatively low during the early part of
the year. The CBSL’s initiative to reduce the Statutory Reserve Ratio (SRR) effective 1 Jul 2013 however
temporarily increased liquidity in the money market”
“The CBSL’s relaxed monetary policy thus far has not resulted in increasing private sector demand for credit with
Jun 2013 YoY growth numbers still remaining in high single digits “
(6.5)(3.6)0.4
4.7 12.7
20.1 25.0
29.4 34.3 33.3 34.5 31.2
23.5 17.4
13.1 10.1 8.9
YoY growth (%)
-0.50.00.51.01.52.02.53.03.54.0
1,000
1,500
2,000
2,500
3,000
Dec-09 Jun-10 Dec-10 Jun-11 Dec-11 Jun-12 Dec-12 Jun-13
Credit to private sector (Rs bn):LHS MoM growth (%) :RHS
Source : CBSL
06Source : CBSL
Taking Stock

Interest Rates07
Sri Lanka: Treasury yields (%)
Sri Lanka: Average Weighted Prime Lending Rate (AWPLR) and Average Weighted Deposit Rate (AWDR)
“Although short term and long term interest rates are expected to decline in the near term, we expect that to reverse by end 4Q2013, on account of higher than expected fiscal expenditure forecasts (which we expect to overshoot GoSL’s stipulated target of 5.8% for 2013E) and lower deposit growth.”
“We forecast the CBSL to further reduce policy rates by 25bps in Sep / Oct 2013
amidst relatively lower inflation, in order to increase private sector credit growth above single digit levels. With Banks expected to
reprise deposits faster than advances, excessive pressure seen on NIMs are likely
to reduce in the near term”
We forecast Avg Prime Lending Rate at 12.80% for 2013E and 13.25% for 2014E and Average 12m T-bill yield at 10.75% for 2013E and 11.00% for 2014E
Source : CBSL
Source : CBSL
4
9
14
19
24
28-Dec-07 3-Oct-08 10-Jul-09 16-Apr-10 21-Jan-11 28-Oct-11 3-Aug-12 10-May-13
5yr T-Bond Yield 12 Month T-Bill Yield
5
10
15
20
25
28-Dec-07 28-Dec-08 28-Dec-09 28-Dec-10 28-Dec-11 28-Dec-12
AWPLR (%) AWDR (%)
Sri Lanka: Foreign holdings in Government Treasury securities (%)
“Despite the CBSL allowing the foreign holdings in G- Secs to exceed the (CBSL’s)
cap of 12.5%, we expect foreign holdings to decline in the near term owing to the recent
emerging market-currency sell off”12.0%
13.0%
14.0%
26-Dec-12 9-Feb-13 26-Mar-13 10-May-13 24-Jun-13 8-Aug-13Source : CBSL
Taking Stock

Agriculture, Forestry &FishingFood & Beverages
Factory Industry - Other
Construction
Industry - Other
Domestic Trade
Import & Export Trade
Passenger & GoodsTransportBanks, Insurance, RealEstateServices - Other
Agriculture, Forestry &FishingFood & Beverages
Factory Industry - Other
Construction
Industry - Other
Domestic Trade
Import & Export Trade
Passenger & GoodsTransportBanks, Insurance, RealEstateServices - Other
Gross Domestic Product
“Economic growth to be modest in 2013E”Recovering from 6.4% in 2012 to 6.9% in 2013E and further to 7.4% in 2014E
Contribution to 2013E-2014E GDP Growth
Industry | 30% of GDP
Services | 59% of GDP
Agriculture, Forestry & Fishing | 11% of GDP
Projects initiated by both private and public sectors to drive construction sub sector Higher water levels in hydro catchment areas has increased hydro power generation during
1H2013, boosting the electricity sub segment, and reducing demand for (imported) oil drivethermal power
Manufacturing sector to benefit from higher export volumes in 2014E amidst likely modesteconomic recovery in Europe and USA (55% of total apparel exports)
Softer interest rates and removal of Rupee credit ceiling on commercial banks to directlybenefit the banking, insurance and real estate sector and indirectly boost investment
Banking sector and rural economy to further benefit from rising worker remittance inflows Increased contribution from Hotels and Restaurants sector, amidst rising tourist arrivals
Output of key components (Paddy, Tea and coconut) remains unpredictable upon weatherconditions
Sector remains as an important employment generator, despite low contribution to GDP
Composition of GDP – 2012
Source: CTS estimates
-6
-3
0
3
6
9
12
15
1Q2011 2Q2011 3Q2011 4Q2011 1Q2012 2Q2012 3Q2012 4Q2012 1Q2013
Agriculture Industry Services Total GDP Growth
08Source : DCS
Source : DCS
Taking Stock

Inflation09
Non Food Inflation(59% of Basket)
Following energy price hikes: significant impact on transportation costs
(12% of basket)
Structural reforms to curb losses at state-owned
energy enterprises.Modify country's energy mix to cheaper energy
sources
Food Inflation(41% of Basket)
Unfavourable and erratic weather conditions and
external shocks
Measures to improve domestic agriculture
output
ImportedInflation
Global commodity price volatility.
Import duties to protect domestic industries and
boost tax revenue
Slower currency depreciation of 6% in 2013E (vs.12% in 2012)
DemandSide Inflation
Dovish monetary policy, relaxation of bank credit
limits
Slow credit growth and surplus capacity in
economy. Low expectations of wage
increases
Date Energy Category Price Change (%) New Price (Rs)Feb-12 Diesel (CPC) +37% per litre 115
90-Octane Petrol (CPC) +9% per litre 149Kerosene +50% per litre 106
Feb-12 Electricity +15-40% per unit
May-12 LP Gas +17% per 12.5kg cylinder 2,396Diesel (LIOC) +2% per litre 117
Jul-12 LP Gas -6% per 12.5kg cylinder 2,246
Oct-12 Diesel (LIOC) +3% per litre 121
Dec-12 90-Octane Petrol (CPC & LIOC) +7% per litre 159
Jan-13 LP Gas +7% per 12.5kg cylinder 2,396
Feb-13 Diesel (CPC) +5% per litre 12190-Octane Petrol (CPC & LIOC) +2% per litre 162Kerosene (Industrial) +4% per litre 115
Apr-13 Electricity +10-40% per unit
Inflation to remain in highsingle digits (6-9%) in2013E and ease slightly(5-8%) in 2014E Annual avg. inflation :
7.7% 2013E (vs. 7.5%2012, 8.0% August 2013)and 6.0% 2014E
Sri Lanka experienceddouble digit inflationduring 2005 – 2008 Po
sitiv
esN
egat
ives
Food & Non-Food Inflation (Point to Point) (%)
Source: Department of Census & Statistics Source: Consumer Affairs Authority
-5
0
5
10
15
Jan-09 Dec-09 Nov-10 Oct-11 Sep-12 Aug-13
CCPI CCPI - Food CCPI - Non-Food
Taking Stock

Fiscal Policy
Salaries and Wages23%
Interest25%Subsidies
and Transfers
15%
Other Goods and Services
8%
Education and Health
3%
Other Infra. Develop.
26%
“GoSL Budget deficit target of 5.8% of GDP in 2013E unlikely to be met”
Provisional annualised data for 1H2013 points to budget deficit in excess of 8% of GDP in 2013E Aggressive policies undertaken in 2H2013 to improve revenue and bridge this gap to 6.1% of
GDP Taxes on demerit goods tobacco and alcohol increased w.e.f 31 July 2013 Special commodity levy on over 30 essential food items w.e.f 05 August 2013 Extension of VAT coverage to supermarkets and large scale trading operations is a significant
new initiative in 20135
6
7
8
9
10
11
150
250
350
450
550
2009 2010 2011 2012 2013E
Budget Deficit (Rs bn)As a % of GDP - RHS
Government Fiscal Deficit (Rs bn) and as a % of GDP
“GoSL recurrent expenditure targets unlikely to be met due to large proportion of
relatively inflexible expenses”
Interest and Salaries & Wages account for68% of total recurrent expenditure
Defence expenditure as a % of GDP stillremains at ~3%, despite the end of thewar in 2009 (3.0% of GDP)
Discretionary capex in infrastructure likelyto be reduced to avoid excessive budgetovershooting
Composition of GoSL Total Expenditure 2013E
Composition of Total GoSL Revenue 2013E
Income Tax17%
Taxes on Goods
and Services
51%
Taxes on External Trade21%
Non-Tax Revenue
9%
Grants2%
Source : Ministry of Finance & Planning
Source : CBSL
Expenditure on Civil Admin & Defence (Rs.bn)
2%
8%
14%
20%
26%
40
80
120
160
200
240
2008 2009 2010 2011 2012
Civil Adminstration & Defence
Civil Admin & Defence as % of Tot. GDP
Civil Admin & Defence as % of Tot. Exp.
10Source : CBSL
Taking Stock

050
100150200250300350400
2009 2010 2011 2012 2013E
Domestic Financing (Rs bn)Foreign Financing (Rs bn)
Total foreign financing to fall to 29% of deficit in 2013E (from ~54% during past two years) Central Bank of Sri Lanka (CBSL) confirmed that no new program is to be pursued
with the IMF
Total domestic financing forecast to rise to 71% in 2013E DFCC Bank (DFCC) and National Development Bank (NDB) expected to raise
US$500mn (13% of budget deficit) for SME development, with funds temporarilyinvested in Treasury securities funds
DFCC raised US$45mn in April 2013 NDB resolved to issue US$ bonds up to a maximum of US$250mn in the
international bond market (subject to approval) National Savings Bank (NSB) is to raise a minimum US$500mn through the sale of a
five-year bond with a target yield ~7% Meanwhile, Bank of Ceylon (BOC) sold US$500mn five year bonds at 5.3%
attracting US$2bn
GoSL Debt to GDP ratio estimated at ~80% for 2013E (vs. GoSL ‘s target 74% for 2013E) Foreign funding accounted close to half of GoSL debt to GDP ratio of 79% in 2012 Increasing commercialisation of GoSL debt, with outstanding concessional loan
portion falling from 34% in 2008 to 23% in 2012
Deficit to further improve in 2014E Deficit forecast of 6.0% is anticipated for 2014E, given the continued aggressive
policies to increase tax revenues Tax Revenue as a % of GDP is expected to improve whilst anticipating a
GDP growth of 7.4% for 2014E Expenditure to remain high given aggressive infrastructure development
and limitations in reducing a large part of recurrent expenditure74
76
78
80
82
84
86
88
0
1,000
2,000
3,000
4,000
5,000
6,000
7,000
2008 2009 2010 2011 2012
Commercial LoansConcessional LoansDomestic DebtGovernment Debt/GDP (%) - RHS
Fiscal Policy11
Financing of GoSL Deficit: Total Domestic Financing (Rs bn) vs. Foreign Financing (Rs bn)
Outstanding GoSL Debt (Rs bn as at end of year)
23%
23%
54%
19%
55%
26%
17%
28%
56%
12%
31%
58%60%
34%
6%
Source : CBSL Annual Report 2012
Source : CBSL Annual Report 2012
52%
48%
55%45%
51%49%
59%41%
71%
29%
Taking Stock

0
5
10
15
20
20022007
2012
Investment Goods
Food Imports
Non Food ConsumerImportsCrude Oil
Other Intermediategoods
12
0
3
6
9
12
20022007
2012
Textiles & Garments
Rubber Products
Tea
Other
Balance of Trade
Major Sources of Export Income (US$ ‘Bn) Major Sources of Import Expenditure (US$ ‘Bn)
Export earnings to reach US$10.4bn by 2014E (13% of GDP, to rise at a CAGR of 3% during 2012-2014E; -5% YoY in 1H2013)
Industrial exports (+4% CAGR; -5% YoY in 1H2013) to be driven bytextiles & garments amidst an anticipated recovery in the EU andUS in the medium term (~55% of total garment exports)
Agricultural exports (+1% CAGR; -2% YoY in 1H2013) remainlargely dependent on the tea market and Middle East & Russianeconomies (43% and 16% respectively of total tea exports)
Import expenditure to reach US$19.7bn by 2014E (26% of GDP, to rise at a CAGR of 2% during 2012-2014E; -6% YoY during 1H2013)
Intermediate goods (+4% CAGR; -6% YoY in 1H2013) dominatedby petroleum imports and textile imports (used for exports)
Consumer goods (+1% CAGR; -6% YoY in 1H2013) subdued dueto continued stringent fiscal policy stance adopted since 2012
Investment goods (-4% CAGR; -5% YoY in 1H2013) largelydependent on public investment. Private investment howeverlikely to benefit from relatively low interest rates and anexpected recovery in economic activities in 2014E
“Balance of trade deficit forecast to fall 6% YoY to -US$8.8bn in 2013E (13% of GDP) and rise 7% YoY to –
US$9.3bn in 2014E (12% of GDP)”
Trade Deficit (US$ bn) and Trade Deficit as a % of GDP
-18-15-12-9-6-30
-11-9-8-6-5-3-20
1997 1999 2001 2003 2005 2007 2009 2011 2013E
Trade Deficit Trade Deficit as a % of GDP (RHS)
35%
26%
23%
9%7%
10 Year CAGR 12%
10 Year CAGR 10%
34%
43%
15%9%
All Sources : CBSL
Taking Stock

Balance of Payments13
Gross worker remittances to rise at a CAGR of 7%
to US$6.9bn during 2012-2014E (vs. a CAGR of 24%
in 2007-2012; up 9% YoY in 1H2013)
“High trade deficit to be compensated by services account, transfers and capital account”
“Despite the CBSL stating that the GoSL will be
reducing its direct foreign borrowings in 2013E,
commercial banks and corporates are
expected to take advantage of greater flexibility of CBSL exchange regulations”
“BOP surplus estimated
at US$217mn for 2013E
and US$443mn for
2014E”(vs. US$151mn in 2012)
Tourism related receipts projected to rise at a
CAGR of 25% to US$1.6bn during 2012-2014E (up
23% YoY in 1H2013)
• Tourist arrivals forecast to rise 13% YoY to 1.1mn
visitors in 2013E and 17% YoY to 1.3mn visitors in
2014E
FDI forecast to rise 35% YoY to US$1.2bn in 2013E
and 10% YoY to US$1.3bn in 2014E
• Led by investments in tourism and infrastructure
(ports, power, roads, urban development etc.)
• Portfolio investments are expected to remain
healthy in the medium term (US$304mn in 2012;
US$120mn in 1H2013)
Trade Deficit and Current Account Deficit (US$ bn)
Middle East
EuropeanUnion Far East Asia
Other
Origin of Workers’ Remittances
45
65
85
105
125
0
3
6
9
12
2007 2008 2009 2010 2011 2012 2013E 2014E
Trade DeficitCurent Account DeficitWorker's Remittances : Trade Deficit (%) RHS
All Sources : CBSL
Taking Stock

14
1.922.12.22.32.42.52.62.7
1.2
1.3
1.4
1.5
1.6
1.7
1.8
SLR per Japanese Yen (JPY)
SLR Per Indian Rupee (INR - RHS)
Exchange Rates
95
105
115
125
135
SLR per US$
Source : CBSL Average Rates
+1.9 -5.5 -1.5 +1.3 -6.0 +2.9 -2.6 -11.6 -4.8
Currency Appreciation/ Depreciation
500
2,500
4,500
6,500
8,500
Jan-07 Apr-08 Jul-09 Oct-10 Jan-12 Apr-13
SLR has come under pressure since June 2013
amidst the emerging market currency sell off due
to anticipated reduction in US monetary stimulus.
Foreign holding in government securities has
reduced from 14.0% in Jan 2013 to 13.3% as at end
Aug 2013
Gross Official Reserves (US$ mn)
Relative Depreciation of Emerging Market Currencies vs. US$SLR vs. Major Import Trading Partners CBSL tightened regulations
to curb increased imports
from major trading partners
subsequent to currency
depreciation against SLR
(100% margin deposit
requirement against the
Letters of Credit issued for
the importation of vehicles)
“SLR. is forecast to depreciate 6.1% in 2013E to
Rs.135 per US$ by year end and by 2.5% in 2014E to
Rs.138 per US$ “
• 2013 YTD HighRs. 125.2 per US$ [Mid April]
• Depreciated to Rs. 133.8 towards end August 2013
90
100
110
120
130
Jan-13 Feb-13 Mar-13 Apr-13 May-13 Jun-13 Jul-13 Aug-13
Indian Rupee (INR) Indonesian Rupiah (IDR)
Thai Baht (THB) Bangladesh Taka (BDT)
SLR
Source : Bloomberg Source : Bloomberg
Source : CBSL
Taking Stock
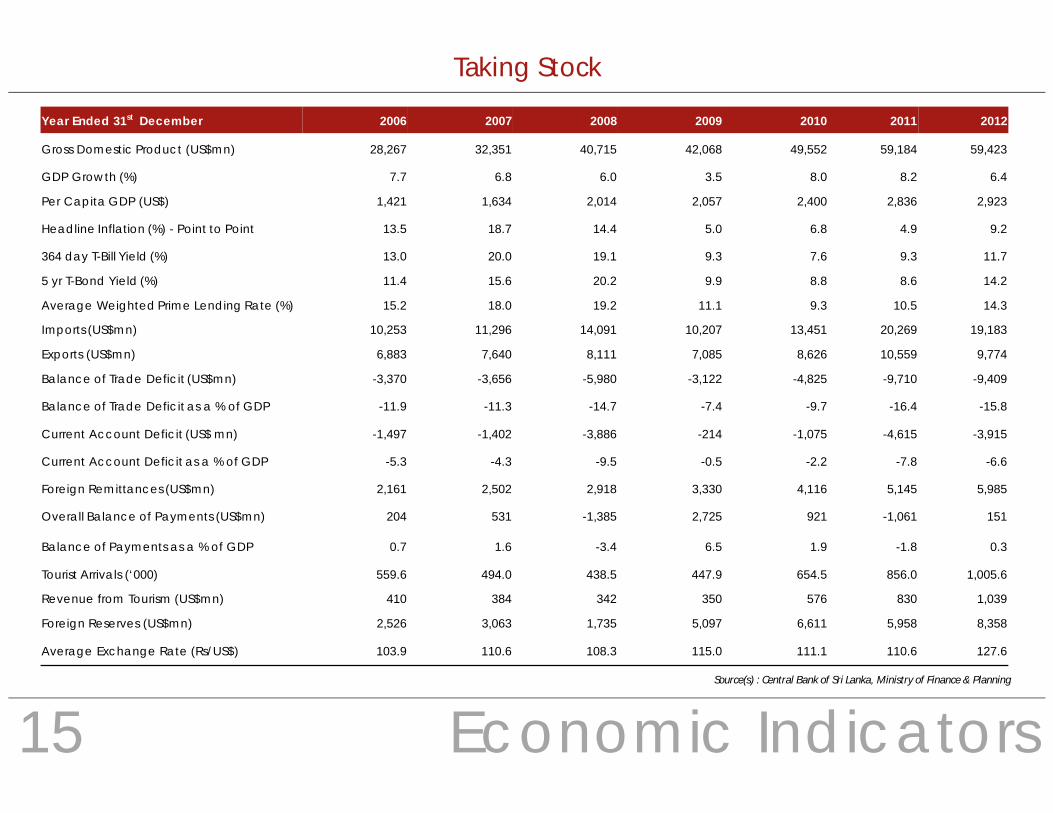
Year Ended 31st December 2006 2007 2008 2009 2010 2011 2012
Gross Domestic Product (US$mn) 28,267 32,351 40,715 42,068 49,552 59,184 59,423
GDP Growth (%) 7.7 6.8 6.0 3.5 8.0 8.2 6.4
Per Capita GDP (US$) 1,421 1,634 2,014 2,057 2,400 2,836 2,923
Headline Inflation (%) - Point to Point 13.5 18.7 14.4 5.0 6.8 4.9 9.2
364 day T-Bill Yield (%) 13.0 20.0 19.1 9.3 7.6 9.3 11.7
5 yr T-Bond Yield (%) 11.4 15.6 20.2 9.9 8.8 8.6 14.2
Average Weighted Prime Lending Rate (%) 15.2 18.0 19.2 11.1 9.3 10.5 14.3
Imports (US$mn) 10,253 11,296 14,091 10,207 13,451 20,269 19,183
Exports (US$mn) 6,883 7,640 8,111 7,085 8,626 10,559 9,774
Balance of Trade Deficit (US$mn) -3,370 -3,656 -5,980 -3,122 -4,825 -9,710 -9,409
Balance of Trade Deficit as a % of GDP -11.9 -11.3 -14.7 -7.4 -9.7 -16.4 -15.8
Current Account Deficit (US$ mn) -1,497 -1,402 -3,886 -214 -1,075 -4,615 -3,915
Current Account Deficit as a % of GDP -5.3 -4.3 -9.5 -0.5 -2.2 -7.8 -6.6
Foreign Remittances (US$mn) 2,161 2,502 2,918 3,330 4,116 5,145 5,985
Overall Balance of Payments (US$mn) 204 531 -1,385 2,725 921 -1,061 151
Balance of Payments as a % of GDP 0.7 1.6 -3.4 6.5 1.9 -1.8 0.3
Tourist Arrivals (‘000) 559.6 494.0 438.5 447.9 654.5 856.0 1,005.6
Revenue from Tourism (US$mn) 410 384 342 350 576 830 1,039
Foreign Reserves (US$mn) 2,526 3,063 1,735 5,097 6,611 5,958 8,358
Average Exchange Rate (Rs/US$) 103.9 110.6 108.3 115.0 111.1 110.6 127.6
Economic Indicators15Source(s) : Central Bank of Sri Lanka, Ministry of Finance & Planning
Taking Stock

Economic Indicators
Year Ended 31st December 2006 2007 2008 2009 2010 2011 2012
Total Outstanding Govt Debt (Rs bn) 2,583 3,042 3,589 4,161 4,590 5,133 6,000
Total Domestic Debt (Rs bn) 1,479 1,715 2,140 2,401 2,566 2,804 3,233
Total Foreign Debt (Rs bn) 1,103 1,327 1,449 1,761 2,025 2,329 2,767
Government Debt as a % of GDP 87.8 85.0 81.4 86.2 81.9 78.5 79.1
Fiscal Revenue Deficit (Rs bn) -70 -58 -89 -180 -120 -72 -106
Fiscal Revenue Deficit as a % of GDP -2.4 -1.6 -2.0 -3.7 -2.1 -1.1 -1.4
Overall Budget Deficit (Rs bn) -206 -246 -310 -476 -446 -450 -489
Overall Budget Deficit as a % of GDP -7.0 -6.9 -7.0 -9.9 -8.0 -6.9 -6.4
Consumption as a % of GDP 83.0 82.4 86.1 82.1 80.7 84.6 83.0
Private 67.7 67.2 70.0 64.4 65.2 69.8 69.6
Government 15.4 15.3 16.2 17.6 15.6 14.8 13.5
Savings as a % of GDP 17.0 17.6 13.9 17.9 19.3 15.4 17.0
Private Investment as a % of GDP 23.9 22.6 21.1 17.9 21.4 23.7 23.7
Government Investment as a % of GDP 6.0 5.4 6.5 6.6 6.2 6.3 6.9
Defence Expenditure as a % of GDP 3.6 3.8 4.0 3.9 3.4 2.4 2.2
Colombo Port Volumes (‘000 TEUs) 3,079 3,381 3,6912 3,464 4,137 4,263 4187
Domestic (‘000 TEUs) 749 803 813 752 932 1,047 1,020
Transshipment (‘000 TEUs) 2,250 2,469 2,785 2,633 3,096 3,124 3,065
Labour Force (mn) 7.6 7.5 7.6 7.6 8.3 8.6 8.5
Employed (mn) 7.1 7.5 7.2 7.1 7.9 8.2 8.1
Unemployed (mn) 0.5 0.4 0.4 0.4 0.4 0.4 0.3
Unemployment Rate (%) 6.5 6.0 5.2 5.7 4.5 4.2 4.0
Source(s) : Central Bank of Sri Lanka, Ministry of Finance & Planning
16
Taking Stock

Stock MarketUpdate
Taking Stock

2,000
3,000
4,000
5,000
6,000
7,000
8,000
Key Events
8.7 -7.3 1.8 0.8 -8.0 0.3 0.5 -1.4 -6.8 -3.7 -0.2 -6.3 -4.1 -0.7 0.0 -10.8 2.8 -0.4 -0.1 4.8 15.3 -7.7 -2.9 5.5 3.1 -3.1 1.8 3.8 8.6 -5.3 -1.4 -2.3% MoM
Rules on Price Bands relaxed; 1 year lock-
in for private placements
SL’s sovereign rating upgraded; issues
US$1bn 10Yr Bond
SEC Director General resigns
Expropriation Bill passed
NSB – TFC controversy
Policy rates cut by 25bps
IMF releases final tranche of
US$2.6bn SBA
Policy rates lowered
CBSL limits LCB’s exposure to the market
National Budget 2012; SLR devalued
by 3%
SEC Chairperson
replaced
UNHRC votes against Sri
Lanka
New SEC Chairman
takes office
Impeachment of the Chief
Justice
Tax on retail business
increased at Budget
Introduction of S&P SL 20
Index
Policy rates increased; CBSL
reduces intervention in forex market
ASPIDown 12% from 01 Jan 2011 to 30 August 2013
Policy rates cut by 50bps
SRR reduced by 200bps to 6% from 8%
Moody's downgrade SL 'B1' credit rating outlook to 'stable'
from 'positive'
CBSL capped penal rate at 2%
18
Taking Stock

Foreign Investor Participation19
-50-250255075100125150
-30
-20
-10
0
10
20
30
40
2002 2003 2004 2005 2006 2007 2008 2009 2010 2011 2012 2013YTD
Net Foreign In/Out (Rs bn)Foreign T/O as a % of Market - RHSASPI % YoY Movement - RHS
Foreign Investor ParticipationForeign Turnover in CSE (Rs bn)
Foreign selling in 2010 and 2011, subsequent to the post conflict bull run (ASPI rose 125% in 2009 and 96% in 2010), resulting in significant
profit taking
Foreign institutional investors have traditionally focused on the larger and more liquid stocks in the banking and diversified sectors,
although recently interest has emerged even in less liquid stocks in the F&B sector as well as in the multi-national companies
Reversal of net foreign outflow in 2012 led by inflows via strategic
acquisitions in John Keells Holdings (JKH), Aitken Spence (SPEN) and
Asiri Hospital Holdings (ASIR)
Inflow in 2013YTD largely as a result of net foreign buying in
Sampath Bank (SAMP), despite net foreign selling in Hatton National
Bank - Voting (HNB-N) and Commercial Bank of Ceylon - Voting
(COMB-N)
Foreign Share Holding %Company 31 Dec 11 31 Dec 12 30 Aug 13CTC 95.4 96.2 96.4NEST 93.2 94.6 95.0JKH 38.5 53.8 55.7SPEN 37.4 45.2 44.9COMB - N 35.9 36.2 35.2LION 24.2 32.0 33.5LLUB 23.0 29.0 30.6ASIR 0.5 26.2 26.5HNB - N 23.7 22.5 20.4SAMP 4.9 5.7 13.4
0
5
10
15
20
252011 2012 2013 YTD
All Source(s) : CSE, CTS Research
Taking Stock

Sectoral Earnings Analysis
Banks, Finance & Insurance (BFI)
Diversified Holdings
Beverage, Food & Tobacco (BFT)
Manufacturing
Motors
Telecommunications
Hotels & Travels
Others
2Q2013 Trailing Earnings
Composition
Sectoral Market Cap as at 30 August 2013
“Market cap and earnings are both dominated
by the BFI, Diversified Holdings and BFT sectors”
The BFI sector trades below
market multiples despite
above average TTM EPS
growth, suggesting possible room for multiple
expansion
Trailing earnings are based on reported values and not adjusted for non-recurring items
21.216.0 15.9
11.7 10.5 10.0 9.8 9.0 7.6
05
10152025
BFT
Div.
Hol
ding
s
Hote
ls &
Trav
els
Mar
ket
Telc
o
Oth
ers
Mot
ors
Man
ufac
.
BFI
Sectoral Trailing 12 Month PE (X)Sectoral Trailing 12 Month PER (X)
All Sources : CSE, Quarterly Financial Interims
50.935.8
20.38.9
-6.6 -13.2 -16.5 -72.5
-80
-60
-40
-20
0
20
40
60
Hote
ls &
Tra
vels
Oth
ers
BFI
Mar
ket
BFT
Man
ufac
.
Div.
Hol
ding
s
Mot
ors
Sectoral Trailing 12 Month PE (X)Sectoral Trailing 12 Month EPS Growth (%)
20
Taking Stock

Treasury Bills vs. ASPI21
Correlation between the Market and the 12 Month T-Bill Yield
Source : CSE, CBSL
5
8
11
14
17
20
23
0
1,500
3,000
4,500
6,000
7,500
9,000
Jan-01 Jan-03 Jan-05 Jan-07 Jan-09 Jan-11 Jan-13
ASPI
12M T-Bill Yield (%) - RHS
Taking Stock

Regional Market Comparisons
Pakistan
VietnamIndia
MalaysiaThailand
South Korea Singapore
Japan
Sri Lanka
0
2
4
6
8
10
12
14
6 8 10 12 14 16 18
10-y
ear T
-bon
d Yi
eld
(%)
Market PER - 2013E (X)
Market PER and 10 Yr T-bond Yield
Pakistan
Vietnam
India
MalaysiaThailand
South Korea
Singapore
JapanSri Lanka
0
5
10
15
20
25
6 8 10 12 14 16 18
EPS
Gro
wth
(%)
Market PER - 2013E (X)
Market PER and EPS Growth
All Sources : Bloomberg, www.tradingeconomics.com
0 25 50 75 100 125
PakistanVietnamSri Lanka
IndiaJapan
South KoreaMalaysiaThailand
Singapore
Market Cap as a % of GDP
0 2 4 6 8 10 12
PakistanSri LankaVietnam
IndiaThailandMalaysia
South KoreaSingapore
Japan
10 Yr Bond Yield %
22
Taking Stock

Summary Market Performance23• The Milanka Price Index was discontinued from December 2012 and the S&P SL20 Index was introduced in June 2012
2005 2006 2007 2008 2009 2010 2011 2012 2013 YTD
All Share Price Index 1,922 2,722 2,541 1,503 3,386 6,636 6,074 5,643 5,834
% YoY 27.5 41.6 -6.7 -40.8 125.3 96.0 -8.5 -7.1 3.4
Milanka Price Index/S&P SL20 * 2,451 3,712 3,292 1,631 3,849 7,061 5,229 5,119 3,261*
% YoY 18.2 51.4 -11.3 -50.4 136.0 83.4 -25.9 -2.1 5.7
Total Turnover (US$ mn) 1,122.5 976.3 965.6 976.3 1,237.4 5,067.0 4,948.6 1,691.9 1,138.6
Average Daily Turnover (US$ mn) 4.7 4.0 4.0 4.1 5.2 21.2 20.7 7.0 7.1
Foreign Purchases (US$ mn) 269.3 345.1 430.4 589.7 365.6 820.5 451.1 572.9 504.7
Foreign Sales (US$ mn) 215.2 295.1 326.9 466.0 349.7 1,056.2 623.4 268.4 358.8
Net Foreign in/(out) flow (US$ mn) 54.1 49.9 103.5 123.7 16.0 -235.7 -172.3 304.5 145.9
Market PER (X) 12.4 14.0 11.6 5.4 16.6 25.2 15.8 15.9 16.6
Dividend Yield % 2.7 2.2 2.5 5.6 3.0 1.2 1.8 2.4 2.7
Market PBV (x) 1.7 2.0 1.8 0.8 1.7 3.0 2.0 2.1 2.2
Market Cap (Rs bn) 584 835 821 489 1,092 2,210 2,214 2,168 2,403
Market Cap (US$ mn) 5,719 7,750 7,549 4,320 9,547 19,968 19,463 17,054 18,033
All Sources : CSE, Quarterly Financial Interims
Taking Stock

Top 20 Stocks by Market Cap*Voting** Includes capital gain of disposal of associate, A I A Insurance Lanka (CTCE)
Company CodeMarket Cap
30 August 2013 (Rs bn)
Market Cap
%
MPS 30 August 2013 (Rs)
2012 Var
%
2013 YTDVar
%
Trailing PER (X)
YTD Avg. Daily Turnover (Rs mn)
As a % of Market
Turnover
Ceylon Tobacco Company CTC 219.2 9.7 1,170.0 69.4 41.0 25.6 12.3 1.4
John Keells Holdings JKH 184.5 8.2 215.0 28.6 -2.2 13.6 155.7 17.2
Nestle Lanka NEST 115.5 5.1 2,150.0 76.1 38.7 33.5 5.8 0.6
Commercial Bank of Ceylon COMB * 96.3 4.1 115.0 3.0 11.7 9.6 120.3 13.3
Sri Lanka Telecom SLTL 74.0 3.2 41.0 -9.1 -6.8 14.6 0.8 0.1
Carsons Cumberbatch CARS 71.7 3.2 365.0 -17.5 -17.1 15.1 5.3 0.6
The Bukit Darah BUKI 69.4 3.1 680.0 -32.2 -2.7 13.6 2.5 0.3
Dialog Axiata DIAL 66.8 3.0 8.2 5.1 -1.2 8.1 9.3 1.0
Distilleries Company of Sri Lanka DIST 55.7 2.5 185.5 12.9 11.8 9.8 20.0 2.2
Hatton National Bank HNB * 57.5 2.2 152.5 -1.3 3.0 6.8 55.6 6.1
Aitken Spence SPEN 47.1 2.1 116.0 -4.0 -3.3 14.3 20.2 2.2
Cargills (Ceylon) CARG 35.2 1.6 157.0 -28.3 6.8 76.8 10.5 1.2
Chevron Lubricants Lanka LLUB 34.8 1.5 290.0 18.8 43.6 14.3 13.5 1.5
DFCC Bank DFCC 32.5 1.4 122.5 0.1 8.4 9.2 5.8 0.6
Sampath Bank SAMP 31.4 1.4 187.2 2.6 -6.4 7.5 44.1 4.9
Asian Hotels & Properties AHPL 30.6 1.4 69.0 -4.8 -9.1 12.3 2.8 0.3
The Lion Brewery Ceylon LION 28.0 1.3 350.0 41.4 29.6 27.5 4.2 0.5
C T Holdings CTHR 25.6 1.1 140.0 -29.1 11.1 15.8 2.2 0.2
National Development Bank NDB 24.3 1.1 147.5 -1.4 6.9 2.8** 22.9 2.5
Commercial Leasing and Finance CLC 24.2 1.1 3.8 26.7 0.0 22.2 1.3 0.1
Total Market ASPI 2,402.9 5,834.0 -7.1 3.4 16.6 906.6 100.0
Trailing PERs are based on reported earnings and not adjusted for non-recurring items
24All Sources : CSE, Quarterly Financial Interims
Taking Stock

Banking, Finance& Insurance Sector
Taking Stock

Banks
Sri Lankan Banking Sector
Licensed CommercialBanks (LCBs)*
Licensed SpecializedBanks (LSBs)**
24
9
• Of the LCBs, 12 Local and 12 foreign
• Local LCBs account for 93% of total marketshare of total LCB assets
• Largest 2 LCBs are Government owned(47% market share)
• Largest 6 domestic LCBs identified as beingsystemically important and account for81% of market share
• Cargills Agriculture and Commercial Bank isset to open in 2H2013E
Major LCB Market Share %^Bank of Ceylon (Govt owned) 24.8 Peoples Bank (Govt. owned) 22.0 Commercial Bank of Ceylon 11.8 Hatton National Bank 10.5 Sampath Bank 7.2 HSBC – Sri Lanka 6.3Seylan Bank 4.3 National Development Bank 4.0 DFCC Bank 3.1 Nations Trust Bank 2.8 Standard Ch. Bank – Sri Lanka 2.3 ^Mkt. Share (Assets / LCB Assets) as at 31.12.12
“The Sri Lankan banking sector has delivered strong returns in recent years, benefiting from generous interest margins and healthy non interest income,
while maintaining NPAs and exposurerisks at manageable levels”
STA
TISTIC
AL
OVE
RVIE
W
Rs bn 2011 2012 YoY %
Interest Inc. 358 495 38Interest Exp. 193 298 55
Net Interest Inc. 165 197 19
Non-Interest Inc. 61 79 30
Forex Inc. 15 27 79
Non-Interest Exp. 117 135 16
Staff Cost 59 66 12Loan Loss Prov. -3 6 N/A
Profit before Tax 94 116 24
Profit after Tax 66 82 26
% NIM ROA ROE T1 CAR Tot CAR G. NPA N. NPA
2007 4.4 1.1 14.0 12.6 14.1 - -
2008 4.4 1.1 13.4 12.5 14.5 6.3 3.4
2009 4.6 1.0 11.8 14.1 16.1 8.5 5.0
2010 4.6 1.8 22.0 14.3 16.2 5.4 3.0
2011 4.2 1.7 19.7 14.4 16.0 3.8 2.1
2012 4.1 1.7 20.2 14.0 16.0 3.6 2.1
As at 31 December 2012 %
Agriculture and fishing 13
Consumption 14Manufacturing 11Construction 14Trading 15Financial Services 5Infrastructure 5Tourism 2Transport 2Other loans 19
100
Rs bn 2011 2012 YoY %
AssetsLoans 2,602 3,143 20.8Investments 1,057 1,197 13.2Others 593 762 28.5
LiabilitiesDeposits 3,073 3,598 17.1Borrowings 635 805 26.8Capital Funds 371 436 17.5
Other 173 263 52.0
Total 4,252 5,102 20.0
Profitability, Stability & Delinquency Indicators
Credit Exposure(by sector) Sector Financial Position Sector Performance Analysis
* Accounts for 85% of total banking sector assets ** Accounts for 15% of total banking sector assets. Includes Govt. owned National Savings Bank (70% of LSB assets as at 31 Dec 2012)
26All Sources : CSE, CBSL, CTS Research
Taking Stock
Banks27
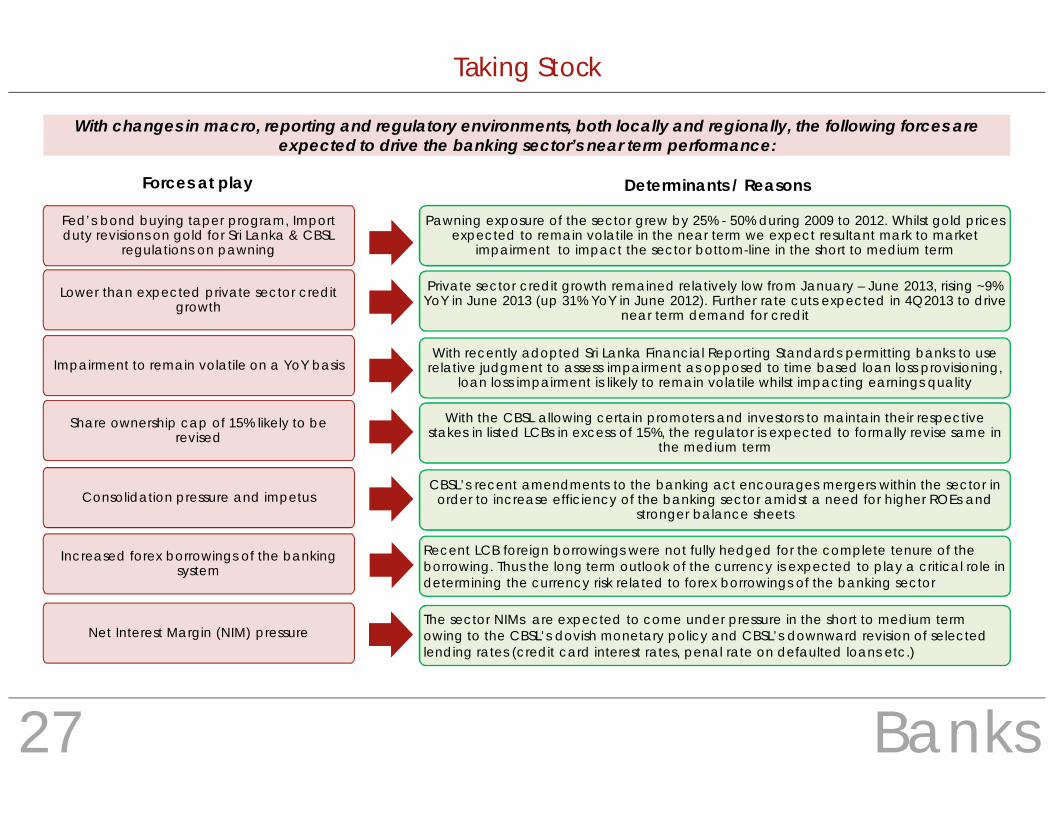
With changes in macro, reporting and regulatory environments, both locally and regionally, the following forces are expected to drive the banking sector’s near term performance:
Fed’s bond buying taper program, Import duty revisions on gold for Sri Lanka & CBSL
regulations on pawning
Pawning exposure of the sector grew by 25% - 50% during 2009 to 2012. Whilst gold prices expected to remain volatile in the near term we expect resultant mark to market
impairment to impact the sector bottom-line in the short to medium term
Forces at play Determinants / Reasons
Lower than expected private sector credit growth
Impairment to remain volatile on a YoY basis
Share ownership cap of 15% likely to be revised
Consolidation pressure and impetus
Private sector credit growth remained relatively low from January – June 2013, rising ~9% YoY in June 2013 (up 31% YoY in June 2012). Further rate cuts expected in 4Q2013 to drive
near term demand for credit
With recently adopted Sri Lanka Financial Reporting Standards permitting banks to use relative judgment to assess impairment as opposed to time based loan loss provisioning,
loan loss impairment is likely to remain volatile whilst impacting earnings quality
With the CBSL allowing certain promoters and investors to maintain their respective stakes in listed LCBs in excess of 15%, the regulator is expected to formally revise same in
the medium term
CBSL’s recent amendments to the banking act encourages mergers within the sector in order to increase efficiency of the banking sector amidst a need for higher ROEs and
stronger balance sheets
Increased forex borrowings of the banking system
Recent LCB foreign borrowings were not fully hedged for the complete tenure of the borrowing. Thus the long term outlook of the currency is expected to play a critical role in determining the currency risk related to forex borrowings of the banking sector
Net Interest Margin (NIM) pressure The sector NIMs are expected to come under pressure in the short to medium term owing to the CBSL’s dovish monetary policy and CBSL’s downward revision of selected lending rates (credit card interest rates, penal rate on defaulted loans etc.)
Taking Stock

Banks
Major LCB valuations as at 30 August 2013
“Major listed LCBs trade at a discount to the market on 7.5X near term earnings and 1.1X PBV with ROEs in excess of 16%”
COMB Voting HNB Voting SAMP NDB NTB
2013E 2014E 2013E 2014E 2013E 2014E 2013E 2014E 2013E 2014E
MPS 115.0 115.0 152.5 152.5 187.2 187.2 147.5 147.5 59.5 59.5
PER (X) 9.2 8.2 8.6 7.2 6.4 5.5 7.6 7.0 6.4 5.3
PBV (X) 1.6 1.5 1.1 1.0 1.1 0.9 0.9 0.8 1.1 1.0
ROE (%) 18.9 19.0 13.8 14.8 17.5 17.9 12.2 12.2 19.7 20.0
EPS Growth (%) 4.6 11.6 -16.0 18.2 -8.9 16.3 8.5 8.9 10.5 19.7
Gross Dividend Yield (%) 5.8 6.2 4.5 5.0 5.5 6.3 5.9 6.5 2.3 2.3
Book Value per Share 70.4 77.8 135.0 148.8 178.1 203.2 167.2 178.9 52.1 60.7
Key : COMB - Commercial Bank of Ceylon; HNB - Hatton National Bank; SAMP - Sampath Bank;NTB - Nations Trust Bank; NDB - National Development Bank
28
All Sources : CSE, CTS Research
Taking Stock

Non-Bank Financial Institutions29
Sri Lankan NBFI Sector
Licensed FinanceCo.s (LFCs)
SpecializedLeasing Co.s (SLCs)
47
12
• Accounts for 7% of the total financialsector assets (LCBs and LSBs accountedfor 57% of the finance sector)
• LFCs account for 90% of NBFI assets• Pawning grew 48% YoY in 2012 (7% of
sector advances as at 31 Dec 2012)• Leasing and HP accounted for 57% of
sector assets at 31 Dec 2012
“Sector profits declined 21% YoY to Rs.15bn in 2012 due to increased vehicle import duties and also due to interest rate
mismatch and higher NPAs”
STA
TISTIC
AL
OVE
RVIE
W
% NIM ROA ROE G. NPA N. NPA
2008 4.6 1.5 9.7 5.8 2.8
2009 4.1 0.4 -2.8 9.1 4.5
2010 6.0 3.2 11.6 7.9 3.4
2011 6.7 5.9 34.3 5.1 1.9
2012 6.8 4.2 18.9 5.0 1.6
Profitability, Stability & Delinquency Indicators
New Registration of Motor Vehicles Sector Financial Position Sector Performance Analysis
Rs bn 2011 2012 YoY%
AssetsAccommodation 388 472 21
Finance Leasing 166 215 29Hire purchase 118 123 4Pawning
Investments2114
3115
4814
Others 88 110 25
LiabilitiesDeposits 186 254 37Borrowings 172 176 3Capital 77 95 23Total Funds 435 525 21Other 55 72 30Total Assets 490 597 22
Rs bn 2011 2012 YoY%
Interest Inc. 68 93 37
Interest Exp. 35 53 50
Net Interest Inc. 33 40 23
Non Interest Inc. 17 13 -23
Non Interest Exp. 26 31 18
Staff Cost 9 11 26
Loan Loss Prov. -1 2 -207
Profit Before Tax 26 21 -16
Tax 7 7 -2
Profit After Tax 19 15 -21
Top 5 NBFIs Market Share as a % of total NBFI sector assets
%
People’s Leasing & Finance* 16.2Central Finance Company 10.0
LB Finance 8.6
Lanka Orix Finance 7.6
Com. Leasing and Finance 4.2
Rest 53.4
There were 36 listed NBFIs as at 30th August 2013
* 75% State controlled
Note: All NBFIs are expected to be listed in themedium term as per the CBSL
CSE market capitalization : BFI sector (%)LCBs and LSBs 53.3NBFIs 36.4Insurance 10.3BFI sector 100.0
-40
-20
0
20
40
60
80
100
200
300
400
500
600
2007 2008 2009 2010 2011 2012 1H2013
New Registration of Motor Vehicles
% YoY Change - RHS
All Sources : CSE, CBSL, CTS Research
Taking Stock

Non-Bank Financial Institutions
All the forces impacting the banking sector (i.e. pawning, lower credit growth, volatile impairment, consolidation, near term margin pressure and forex borrowings) excluding the share ownership cap (which does not apply to the NBFI sector) is expected to impactthe near term NBFI sector performance. Sri Lankan NBFIs largely compete with the banking sector mainly targeting lower credit risk customers, smaller advances and niche rural markets (amidst maintaining higher margins and higher NPA levels) owing to speedy
and flexible disbursement mechanisms adopted by the NBFIs. The following additional forces are expected to play a key role in determining the near term returns of the Sri Lankan NBFI sector.
Relatively higher Asset and Liability maturity mismatches compared to
that of Banking sector
Higher vehicle import duties
LFCs to maintain a minimum core capital of Rs.300mn from January 2013
as opposed to Rs.200mn previously
NBFIs tend to lend long at fixed interest rates and borrow short, exposing themselves to interest rate risk due to the mismatch. SLCs are not
permitted to mobilize deposits
Slower growth in vehicle imports (owing to higher import duties) are however expected to impact the near term revenue growth as 72% of
the NBFI sector accommodations are driven by hire purchases and leases of vehicles
Will increase the risk absorption capacity of the LFC sector, but some of the distressed LFCs are expected to undergo severe restructuring in the
near term
On twelve month trailing earnings, major listed NBFIs trade at a discount
to the market on PE multiples of 5.0 –8.0X and PBV multiples of 1.0 -1.5X
Forces at play Reasons / Consequences
Top 5 NBFI trailing 12 month valuations PER (X) PBV (X)People’s Leasing & Finance 7.3 1.2Central Finance Company 6.3 1.1LB Finance 5.0 1.4Lanka Orix Finance 16.2 1.4Commercial Leasing and Finance 22.2 3.0
30
Taking Stock

Insurance Companies31
Sri Lankan Insurance
Sector
Composite Insurers (CIs)
ExclusiveInsurers (EIs)
12
9
Within the sector, 7 companies are listed on the CSE
Insurance sector accounted for a market cap of US$384mn as at end Aug 2013 (vs. Banking
sector’s US$1,992mn and NBFI’s US$1,323mn)
Life premiums grew at a 4 year CAGR of 12% to Rs.37bn in 2012
General premiums grew at a 4 year CAGR of 11% to Rs.52bn in 2012
Top 5 Insurer 2011 GWP Market Share Analysis: % Life General
Ceylinco Insurance 28 22Sri Lanka Insurance* 19 26AIA Insurance Lanka 22 6Union Assurance 13 9Janashakthi Insurance 5 12
Sect
or F
acts
Key Insurance Sector Indicators
2011 2012 YoY%Solvency Margin Ratio - Life 6.5 7.4 0.9
- General 2.0 2.5 0.5Retention Ratio - Life 96.2 96.2 0.0
- General 78.9 79.1 0.2Claims Ratio - Life 31.0 37.2 6.2
- General 63.8 59.9 -3.9Combined Operating Ratio - Life 74.2 81.7 7.5
- General 101.8 105.0 3.2Return On Assets - Life 5.0 3.4 -1.6
- General 5.1 6.7 1.6Return On Equity - General 10.2 12.3 2.1Underwriting Ratio - General 19.1 16.2 -2.9
Insurance Industry premiums growth
General Insurers Life Insurers6 3
Insurance Industry (Rs mn) 2008 2009 2010 2011 2012
Life 23,613 23,767 31,152 35,128 37,046YoY % 16 1 31 13 5Non - Life (General) 34,553 33,485 35,101 45,349 51,989
YoY % 11 -3 5 29 15Total Industry 58,166 57,252 66,253 80,477 89,035Industry Growth (%) 13 -2 16 21 11
“Overall industry premiums grew at a 4 year CAGR of 11% to Rs.89bn in 2012”
Top five players control 77% of the overall market. Rest (i.e. 23%) is shared by 16 players.
* State owned
Source : CBSL AR 2012 Source : Insurance Board of Sri Lanka (IBSL)
Taking Stock

Insurance Companies
The provisions of the Regulation of Insurance Industry Act, amended in January 2011, (which is expected to be implemented by 2015E-2016E) will change the operating landscape of the insurance sector in the medium to long term.
The main provisions include;
Long-term and general insurance business of composite insurers to be segregated into two separate companies by
2015E
“On 12 month trailing earnings, listed insurers trade at a slight premium to the market on PE multiples of 15.0X and PBV multiples of 1.7X”
Listing on the CSE by 2016E made mandatory for all insurance companies (with likely exemption for fully owned subsidiaries of listed foreign insurers). All new entrants to be listed within three years of operation
The regulation to increase minimum capital requirement from Rs.100mn per class of insurance business to Rs.500mn is expected to lead to consolidation in the industry in the medium term as majority of the players in the non life insurance sector in the industry continue to report underwriting losses due to increased competition which has driven down motor
insurance premiums (estimated at 63% of 2011 non life premium income)
Insurance companies to move to a Risk Based Capital (RBC) adequacy framework as opposed to a compliance
based system in line with the global initiatives
Minimum capital required for new entrants set at Rs.500mn each for Life and Non Life. The Insurance Board
of Sri Lanka (IBSL) is yet to stipulate a timeline for the existing companies (i.e. on meeting the minimum
requirement of Rs.500mn)
Al Futtaim, LOLC and RICH joined the sector as new entrants in the recent past
Aviva NDB Insurance was sold to the AIA group during 4Q2012
Life insurance penetration stood at 11.2% in 2012 (total population : 20.3mn)
Sector GWP Contribution to GDP stood at 1.2% in 2012
Third party motor insurance is mandatory in Sri Lanka
Fire GWP accounted for 12% of 2011 sector GWP
Oth
er
Indu
stry
Fa
cts
32
Taking Stock

TourismSector
Taking Stock
Tourism – Sri Lanka
20
60
100
140
Jan Mar May Jul Sep Nov
2010 20112012 2013 YTD
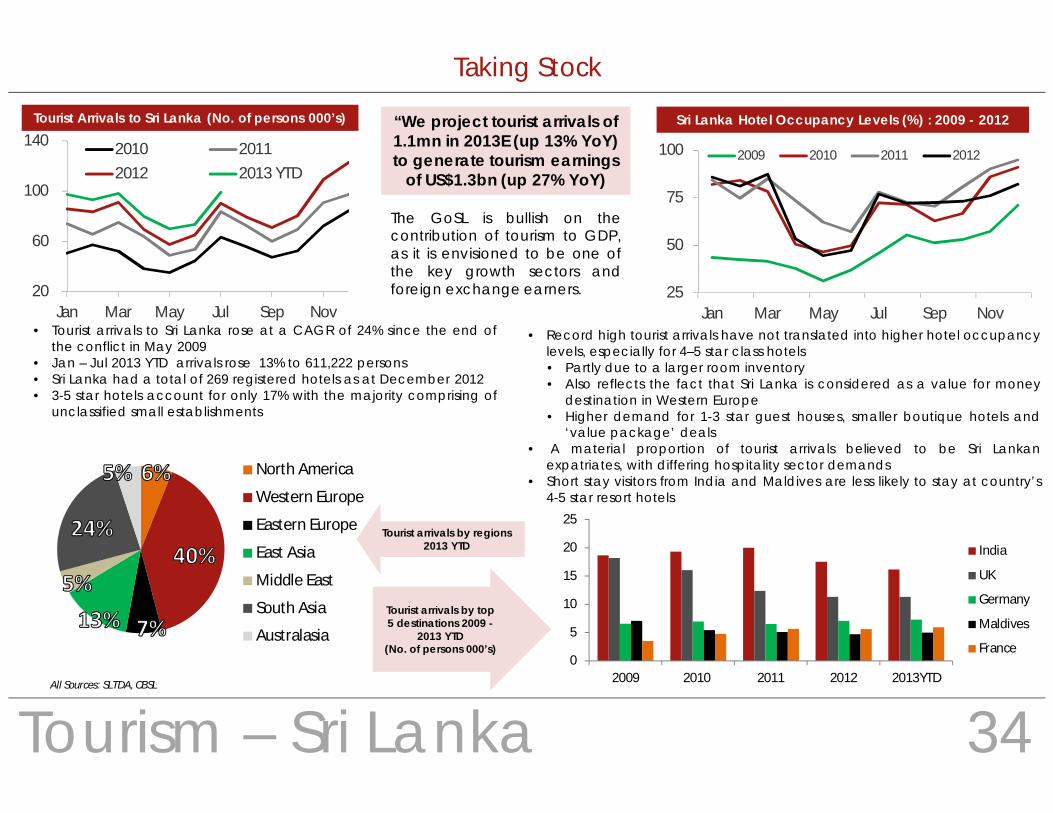
Tourist Arrivals to Sri Lanka (No. of persons 000’s) “We project tourist arrivals of 1.1mn in 2013E (up 13% YoY) to generate tourism earnings
of US$1.3bn (up 27% YoY)
25
50
75
100
Jan Mar May Jul Sep Nov
2009 2010 2011 2012
Sri Lanka Hotel Occupancy Levels (%) : 2009 - 2012
The GoSL is bullish on thecontribution of tourism to GDP,as it is envisioned to be one ofthe key growth sectors andforeign exchange earners.
• Tourist arrivals to Sri Lanka rose at a CAGR of 24% since the end ofthe conflict in May 2009
• Jan – Jul 2013 YTD arrivals rose 13% to 611,222 persons• Sri Lanka had a total of 269 registered hotels as at December 2012• 3-5 star hotels account for only 17% with the majority comprising of
unclassified small establishments
North America
Western Europe
Eastern Europe
East Asia
Middle East
South Asia
Australasia
• Record high tourist arrivals have not translated into higher hotel occupancylevels, especially for 4–5 star class hotels• Partly due to a larger room inventory• Also reflects the fact that Sri Lanka is considered as a value for money
destination in Western Europe• Higher demand for 1-3 star guest houses, smaller boutique hotels and
‘value package’ deals• A material proportion of tourist arrivals believed to be Sri Lankan
expatriates, with differing hospitality sector demands• Short stay visitors from India and Maldives are less likely to stay at country’s
4-5 star resort hotels
Tourist arrivals by regions 2013 YTD
All Sources: SLTDA, CBSL
0
5
10
15
20
25
2009 2010 2011 2012 2013YTD
India
UK
Germany
Maldives
France
Tourist arrivals by top 5 destinations 2009 -
2013 YTD(No. of persons 000’s)
34
Taking Stock

Tourism – Sri Lanka35
Upcoming New Hotels in Colombo
No of Rooms Star class Timeline
Hyatt Regency 475 * * * * * 2014Jetwing City Hotel 60 * * * * * 2014Marino Sands Hotel 270 N/A 2016Movenpick Hotel 224 * * * * * 2015OZO Sino Lanka Hotel 60 * * * 2014Sancity Hotel 243 * * * Apr 2014Shangri-La 661 * * * * * + 2H 2016Sheraton Premier Pacific Topaz 306 * * * * * Oct 2014
Colombo City Hotels Rooms Star class Renovation statusCinnamon Grand 501 * * * * * completedTaj Samudra 250 * * * * * ongoingHilton Colombo - Residence 168 * * * * * completedThe Kingsbury 229 * * * * * completedGalle Face Hotel 145 * * * * * ongoingHotel Galadari 446 * * * * * upcomingCinnamon Lakeside 340 * * * * * completedHilton Colombo 384 * * * * * upcomingRamada Colombo 94 * * * * * N/AGrand Oriental Hotel 75 * * * N/ARenuka City Hotel 99 * * * ongoing
The Tourism Sector representation in the CSE: 40 listed Companies (~6% of total market capitalization as at 30 August 2013) with a trailing sector PER of 13.5X, offering ROEs of 9.7%
with a PBV of 1.1X
Sources: Company Websites
Sources: Company Websites, www.agoda.com
Key demand drivers:• Business travel• Crew travelers• MICE travelers• Mega functions/ festivals (e.g. T20
World Cup 2012, CHOGM Nov-2013)
Peer City Hotel Comparison TTM PER (X) PBV (X)
Asian Hotels & Properties (AHPL) 12.3 1.5
Galadari Hotels (Lanka) (GHLL) 9.4 0.7
The Kingsbury (SERV) N/A 2.2
Renuka City Hotel (RENU)* 7.8 0.4
Taj Lanka Hotels (TAJ) 40.6 1.7
Trans Asia Hotels (TRAN) 15.4 2.7 *More rooms associated with mixed developments are also coming up
*Significant part of profit are from investment portfolio
Colombo City Hotel Sector
*Hotels are listed based on the Agoda minimum room only rate (excluding tax) during June 2013
Taking Stock

0
50
100
150
200
250
300
20072012
Jan-Jul2013YTD
Maldives
Sri Lanka
Tourism - Maldives
Tourist Arrivals to Maldives (No. of persons 000’s)
40
60
80
100
120
Jan Feb Mar Apr May Jun Jul Aug Sep Oct Nov Dec
2010 2011 2012 2013 YTD
Chinese tourist arrivals: SL & Maldives (No of Persons ‘000s) 2007,2012 & 2013YTD
• Tourist arrivals to Maldives rose at a CAGR of 13% to 958,027 persons during 2009 – 2012
• Jan – July 2013 YTD Tourist arrivals rose 17% to 627,639 persons• Estimate tourist arrivals of 1.1mn for 2013E (up 12% YoY)
Maldives – Tourist Arrivals Mkt Share of top destinations: (%) 2009 – 2013YTD
0
5
10
15
20
25
30
2009 2010 2011 2012 2013YTD
Italy UK Germany France Russia China
“Maldives provides higher returns than
Sri Lanka”
John Keells Hotels (KHL)
Aitken Spence Hotel Holdings (AHUN)
SL Maldives SL Maldives
No of Resorts 08 03 08 04
No of rooms 996 340 743 554
Occupancy (%) 63 92 63 85
ARR’s (US$) 136 386 126 276
Revenue (Rs mn) 4,047 5,735 3,788 10,335
Earnings (Rs mn)* 572 1,195 519 2,478
China dominates
arrivals mix 28% of total arrivals (vs. 3% of Sri Lanka total
arrivals)
*KHL Earnings – EBIT | AHUN Earnings - PBT
5 Year CAGR 45%
5 Year CAGR 17%
Source: Ministry of Tourism - Maldives
36
Source: Ministry of Tourism - Maldives
Source: SLTDA,Ministry of Tourism Maldives
Taking Stock
Casino & Gaming37
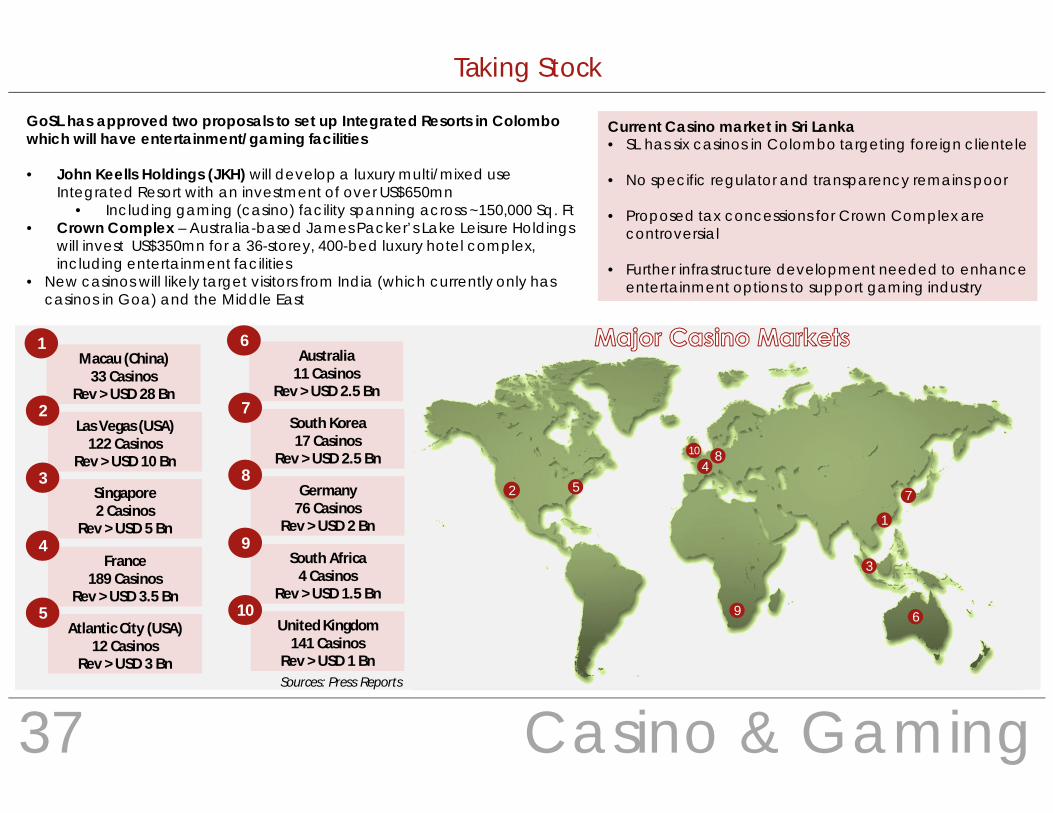
GoSL has approved two proposals to set up Integrated Resorts in Colombo which will have entertainment/gaming facilities
• John Keells Holdings (JKH) will develop a luxury multi/mixed use Integrated Resort with an investment of over US$650mn
• Including gaming (casino) facility spanning across ~150,000 Sq. Ft• Crown Complex – Australia-based James Packer’s Lake Leisure Holdings
will invest US$350mn for a 36-storey, 400-bed luxury hotel complex, including entertainment facilities
• New casinos will likely target visitors from India (which currently only has casinos in Goa) and the Middle East
1
2
3
45
6
7
8
9
10
Macau (China)33 Casinos
Rev > USD 28 Bn
1
Las Vegas (USA)122 Casinos
Rev > USD 10 Bn
2
Singapore2 Casinos
Rev > USD 5 Bn
3
France189 Casinos
Rev > USD 3.5 Bn
4
Atlantic City (USA)12 Casinos
Rev > USD 3 Bn
5
Australia11 Casinos
Rev > USD 2.5 Bn
6
South Korea17 Casinos
Rev > USD 2.5 Bn
7
Germany76 Casinos
Rev > USD 2 Bn
8
South Africa4 Casinos
Rev > USD 1.5 Bn
9
United Kingdom141 Casinos
Rev > USD 1 Bn
10
Current Casino market in Sri Lanka• SL has six casinos in Colombo targeting foreign clientele
• No specific regulator and transparency remains poor
• Proposed tax concessions for Crown Complex are controversial
• Further infrastructure development needed to enhance entertainment options to support gaming industry
Sources: Press Reports
Taking Stock

Acronyms 38
ASPI All Share Price Index LIOC Lanka Indian Oil CorporationAWPLR Average Weighted Prime Lending Rate MICE Meetings, Incentives, Conferences and Exhibitions
BoC Bank of Ceylon MPS Market Price per ShareBOP Balance of Payments NBFI Non Banking Financial Institution
BOT Balance of Trade NDB National Development BankCAGR Compounded Annual Growth Rate NIM Net Interest margin
CAR Capital Adequacy Ratio NPA Non Performing AdvancesCBSL Central Bank of Sri Lanka NSB Nations Saving Bank
CCPI Colombo Consumer Price Index PBV Price to Book ValueCHOGM Commonwealth Heads of Government Meeting PE Price/Earnings Ratio
CPC Ceylon Petroleum Corporation ROE Return on EquityCSE Colombo Stock Exchange SBA Stand By Agreement
DCS Department of Census and Statistics SEC Securities and Exchange CommissionDFCC DFCC Bank SL Sri Lanka
EPS Earnings per Share SLR Sri Lankan RupeeFDI Foreign Direct Investments SLTDA Sri Lanka Tourism Development Board
Forex Foreign Exchange SRR Statutory Reserve RatioGDP Gross Domestic Product T-Bill Treasury Bills
GoSL Government of Sri Lanka T-Bond Treasury BondsGWP Gross Written Premium TTM Trailing 12 Month
HP Hire Purchase VAT Value Added TaxIBSL Insurance Board of Sri Lanka w.e.f With Effect FromIMF International Monetary Fund YoY Year on YearLCB Licensed Commercial Banks YTD Year to Date
Taking Stock

C T SMITH STOCKBROKERS (PVT) LTD
TRADING & SALES
Rohan Fernando [email protected] +94 11 2552296
Gordon Nadesan [email protected] +94 11 2552297
Lasantha Iddamalgoda [email protected] +94 11 2552295
Dyan Morris [email protected] +94 11 2552290
Manura Hemachandra [email protected] +94 11 2552290
Dhammika de Silva [email protected] +94 11 2552290
Arusha Michael [email protected] +94 11 2552290
Rosco Todd [email protected] +94 11 2552290
RESEARCH
Sanjeeewa Fernando [email protected] +94 11 2552290
Chayanika Ranasinghe [email protected] +94 11 2552290
Terry Wong [email protected] +94 11 2552290
Chalitha Dissanayake [email protected] +94 11 2552290
Gayana Jayathilake [email protected] +94 11 2552290
Thavanesan Balachandran [email protected] +94 11 2552290
Maduranga Hettiarachchi [email protected] +94 11 2552290
DISCLAIMER
This document has been prepared and issued by C T Smith Stockbrokers (Pvt) Ltd. on the basis of publicly available information, internally developed data and other sources, believed tobe reliable. Whilst all reasonable care has been taken to ensure that the facts stated are accurate and the opinions given are fair and reasonable, neither C T Smith Stockbrokers (Pvt) Ltd.nor any director, officer or employee, shall in any way be responsible for the contents. C T Smith Stockbrokers (Pvt) Ltd. may act as a Broker in the investments which are the subject ofthis document or in related investments and may have acted upon or used the information contained in this document, or the research or analysis on which it is based, before itspublication. C T Smith Stockbrokers (Pvt) Ltd., its directors, officers or employees may also have a position or be otherwise interested in the investments referred to in this document. Thisis not an offer to buy or sell the investments referred to in this document.
CT Holdings Group
4-14 Majestic City10 Station Road
Colombo 4Sri Lanka
Tel : +94 11 255 2290Fax : +94 11 255 2289
Email : [email protected]
A MEMBER OF THE COLOMBO STOCK EXCHANGE