taking stock of the q1 earnings season
TRANSCRIPT

Zacks Earning Trends
April 3, 2014
Sheraz Mian [email protected]
www.Zacks.com
Taking Stock of the Q1 Earnings Season
The 2014 Q1 earnings season takes center stage from next week onwards even though the reporting cycle has actually been underway for a couple of weeks. The reports thus far (19 S&P 500 companies have reported results) are from companies with fiscal quarters ending in February, which we count as part of the Q1 tally. Results for companies with March ending quarter will start next week with Alcoa’s (AA) release on April 8th. Many of these early February quarter-ending companies aren’t obscure players as the list includes industry leaders like FedEx (FDX), Nike (NKE), Oracle (ORCL), and others. These initial reports don’t inspire much confidence and appear to be pointing towards another underwhelming reporting season ahead. But it’s perhaps premature to draw any firm conclusions based on such an unrepresentative sample of reports. The chart below shows weekly schedule for how Q1 results will come out.
Expectations for the Q1 earnings season as whole remain low, with total earnings expected to be down -2.6% from the same period last year on +1.0% higher revenues and modestly lower margins. As has been the trend for more than a year now, estimates for Q1 came down sharply as the quarter unfolded. The current -2.6% decline in total earnings in Q1 is down from +2.1% growth expected at the start of the quarter in January.

Zacks Earning Trends April 3, 2014
www.Zacks.com 2
Current estimates for total S&P 500 earnings in Q1 are down -2.9% from what was expected at the start of the quarter in early January. This magnitude of negative revision to Q1 earnings over the last three months is greater than what we witnessed in the comparable period in 2013 Q4, but is broadly in-line with the magnitude of the 4-quarter average of negative revision. The chart below shows the magnitude of negative earnings revision for 2014 Q1 and each of the preceding four quarters over the course of each quarter.

Zacks Earning Trends April 3, 2014
www.Zacks.com 3
Estimates for Q1 have fallen across the board, but the trend is particularly notable for the Retail, Basic Materials, Autos, Consumer Staples, and the Energy sectors, as the chart below shows.
With two-thirds of S&P 500 members typically beating earnings estimates in any reporting cycle, actual Q1 results will almost certainly be better than these pre-season expectations. But Q1 is unlikely to repeat the performance of the last few quarters when we would witness new all-time records for total earnings each quarter. Guidance has been overwhelmingly weak for more than a year now, keeping the revisions trend firmly in the negative direction. Odds are that we wouldn’t see any change on that front this earnings season either, bringing down estimates for the rest of the year. Investors haven’t cared about negative estimate revisions thus far, but it will be interesting that behavior will remain in place going forward as well.
Key Points
» The 2014 Q1 earnings season has gotten underway with results from 19 S&P 500 members (with fiscal quarters ending in February) already out. The reporting cycle gets into high gear from next week onwards.
» Total earnings for the 19 S&P 500 companies that have reported results are up +0.5%, with 57.9% beating earnings expectations. Revenues for these companies are up +4.3%, with a revenue ‘beat ratio’ of 47.4%. The performance from these companies is weaker than what we have seen from this same group of companies in recent quarters.
4.3%
14.6%
5.8%8.1%
-2.5%-2.1% -2.4%
-13.5%
-2.5%
-6.9%
-15.0%
-10.0%
-5.0%
0.0%
5.0%
10.0%
15.0%
20.0%
Cons. Staples Retail/Wholesale Autos Basic Materials Oil/Energy
Sectors with the Biggest Negative Revisions
Early January TodaySource: Zacks Investment Research

Zacks Earning Trends April 3, 2014
www.Zacks.com 4
» For the S&P 500 companies as whole, total Q1 earnings are expected to be down -2.6% from the same period last year, on +1% higher revenues and 35 basis points in lower margins. Sequentially, total earnings for the S&P 500 are expected to be down -6.3%.
» Estimates fell sharply as the quarter unfolded, with the current -2.6% decline in total earnings down from expectations of +2.1% positive growth in early January.
» The growth weakness is broad-based and not concentrated in any one sector, with 10 of the 16 Zacks sectors expected to show earnings declines in Q1. Among the major sectors, earnings are expected at this stage to be down -3.9% in Finance, -4.2% in Technology, -6.9% in Energy, and -13.5% in Autos. Business Services and Utilities are the only sectors expected to show double-digit earnings growth.
» The Q1 earnings season is expected to be the low point of this year’s earnings picture, both in terms of total earnings as well as the growth rate. Total quarterly earnings reached an all-time record in 2013 Q4, but are expected to fall short of that level in 2014 Q1. Expectations for the coming quarters reflect a strong ramp up, with each of the following three quarters a new all-time record.
» Guidance has overwhelmingly been negative in recent quarters and we saw the same trend in place with the initial Q1 reports. Continuation of that trend through the rest of this earnings season will result in the by-now all-too-familiar negative revisions to estimates for 2014 Q2.
» Total earnings in Q2 are currently expected to be up +5.4%, followed by growth rates of +7.2% in Q3 and +9.4% in Q4. For the full year, total earnings are expected to be up +7.8% in 2014 and +11.7% in 2015.
» The bottom-up ‘EPS’ estimate for the S&P 500 for 2014 currently stands at $116.60, while the top-down estimate for the same is currently at $117.25. For 2015, the bottom-up estimate remains $130.19.

Zacks Earning Trends April 3, 2014
www.Zacks.com 5
Q1 Earnings Season Gets Underway
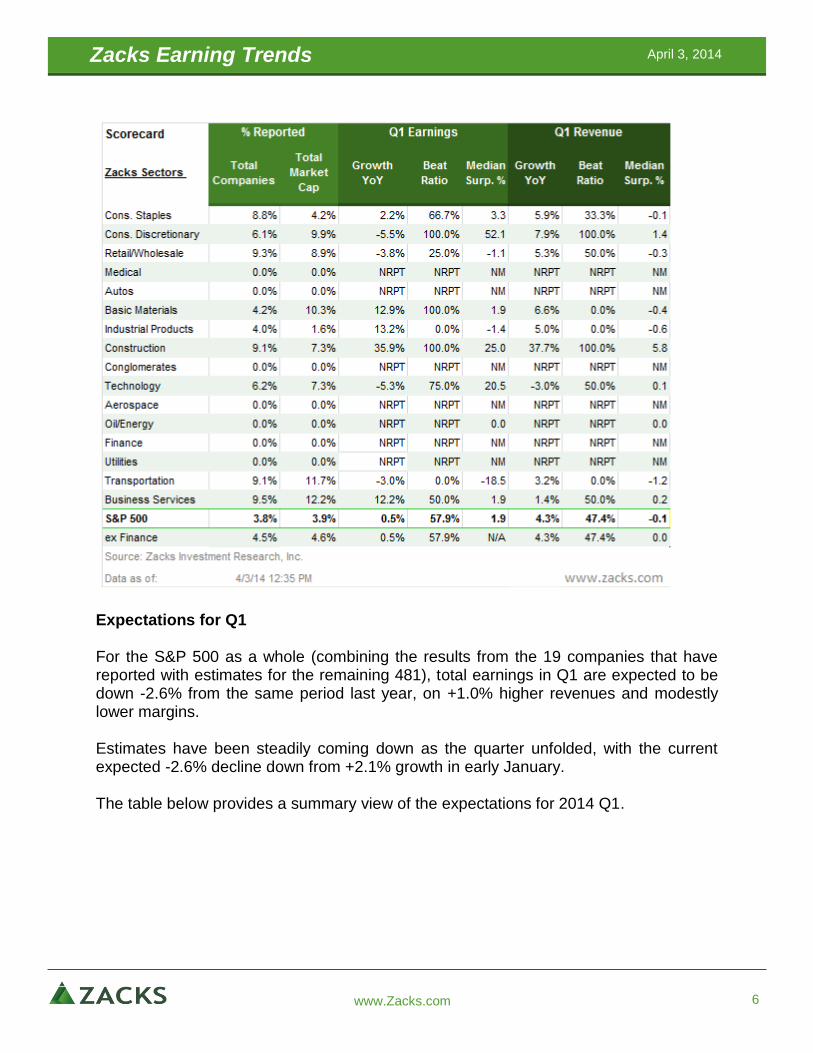
The 2014 Q1 earnings season gets into high gear, but the reporting cycle has gotten underway, with results from 19 S&P 500 companies already out. All of the companies that have reported thus far have fiscal quarters ending in February. Total earnings for the these 19 companies are up +0.5% from the same period last year, with 57.9% beating expectations. Total revenues for these companies are up +4.3%, with 47.4% beating revenue expectations. It’s premature to draw any conclusions from this small sample of results, but the growth rates and beat ratios for these 19 companies in Q1 are weaker than what we have seen from them in other recent quarters. It has overall been a fairly uninspiring start to the Q1 earnings season. The table below provides a Scorecard for the 19 companies that have reported results, as of Thursday April 3rd, 2014.
Zacks Earning Trends April 3, 2014
www.Zacks.com 6
Expectations for Q1 For the S&P 500 as a whole (combining the results from the 19 companies that have reported with estimates for the remaining 481), total earnings in Q1 are expected to be down -2.6% from the same period last year, on +1.0% higher revenues and modestly lower margins. Estimates have been steadily coming down as the quarter unfolded, with the current expected -2.6% decline down from +2.1% growth in early January. The table below provides a summary view of the expectations for 2014 Q1.

Zacks Earning Trends April 3, 2014
www.Zacks.com 7
Note: Here are few key points to keep in mind while reading this report. a. All the earnings analysis in this report pertains to the S&P 500 index, a handy proxy for the entire
business world. b. We divide the corporate world into 16 sectors compared to the official S&P 10 GICS. We have stand-
alone sectors like Autos, Construction, Conglomerates, Aerospace, Transportation and Business Services that provide for a better understanding of trends in these key areas of the economy.
c. All references to ‘earnings’ mean ‘total earnings’ and not ‘median EPS’. d. We make adjustments to reported GAAP earnings to account for non-recurring or one-time items, but
we do consider employee stock options (ESOs) as a legitimate business expense. Unlike Zacks, Wall Street and all other data vendors don’t treat ESO’s as a recurring business expense.
The 2014 Q1 weakness is broad-based and not concentrated in any sector, with 10 of the 16 Zacks sectors currently expected to experience earnings decline from the year-earlier period. Actual results will most certainly be better than these estimates, a function of management’s proven skills at under-promising and over-delivering (Remember – two thirds of the companies beat EPS expectations). Of the major sectors, Finance, Technology, Energy, Medical and Basic Materials are all expected to experience earnings declines. The Finance sector, a reliable driver of earnings growth in recent quarters, is expected to suffer a -3.9% decline in Q1, which

Zacks Earning Trends April 3, 2014
www.Zacks.com 8
follows +22.8% growth in the preceding quarter. The sector’s actual results will most likely be in the positive column, but its Q1 earnings growth is on track be the lowest in recent quarters. As you can see, overall expectations for the quarter remain fairly low, having fallen sharply over the last three months – a negative revisions trend that has been in place for more than a year now. Given how low expectations have fallen, it wouldn’t take much for companies to come out ahead of them. Roughly two-thirds of the S&P 500 members have been beating earnings expectations every quarter. So, more results along those lines would be nothing new and wouldn’t tell us much about the health of corporate earnings. What we haven’t seen for a while instead is some evidence of strength on the revenue front and favorable comments from management teams about the business outlook. Corporate guidance has been negative for almost two years now, causing estimates to keep coming down and the long hoped-for earnings growth turnaround getting pushed forward. Guidance is important in any earnings season, but it is particularly important this time around given the relatively elevated expectations for the second half of the year and beyond. Consensus estimates for 2014 Q3 and Q4 have held up quite well, even as expectations for Q1 and Q2 came down over the last few months. Total earnings are expected to be up +8.3% in the second half of the year after the +1.4% growth pace in the first half of the year. We started last year with somewhat similar hopes, but had to sharply ‘revise’ those estimates as the year unfolded, with the starting point of the hope-for growth turnaround getting pushed to this year instead. Finance Becoming Less of a Growth Contributor Finance is the biggest earnings contributor in the S&P 500 index, accounting for roughly 1/5th of the index’s total expected earnings in 2014 (Technology is expected to bring in about 1/6th of the total). For the large money-center banks and the brokers, the backdrop has been tough in the quarter, with lackluster consumer and corporate activities, soft trading volumes, and comparisons for mortgage banking remaining unfavorable. Additionally, reserve releases are slowing and legal costs remain high. The table below shows growth expectations for the 7 medium-level (or M-level) industries in the Finance sector.

Zacks Earning Trends April 3, 2014
www.Zacks.com 9
Of the notable sub-industries within the sector, the Major Banks, Insurance, and Investment Brokers & Managers combined account for almost 90% of the sector’s total earnings and are expected to show earnings declines. Industry players expected to show lower earnings than the year-earlier quarter include J.P. Morgan, Berkshire Hathaway, Goldman Sachs, and AIG, just to name a few. The table above shows the earnings growth rates on a year-over-year basis. Sequentially, earnings growth is essentially flat at the Major Banks and down at the Insurance and Investment Brokers/Managers. Will Technology Growth Ramp Up? The Technology sector, the second largest earnings contributor to the S&P 500 index, hasn’t been much of a growth driver in recent quarters. Q1 is no different, with total earnings for the sector expected to be down -4.2% on +1.6% higher revenues and a 95 basis-points decline in net margins. This follows +6.3% earnings growth for the sector in 2013 Q4 on +4.5% higher revenues and flat net margins. The table below shows the earnings growth expectations for the 7 industries in the sector. As you can see, we include the Telecom equipment and services industries within the Technology (Telecoms is a stand-alone sector in the official S&P GICs classification).

Zacks Earning Trends April 3, 2014
www.Zacks.com 10
Note: Industry totals at times don’t match exactly with the sector totals.
The Computer & Office Equipment industry (the largest industry in the sector accounting for more than 45% of its total earnings) has been the most growth challenged. All the major hardware makers like Apple, IBM, Cisco, and Hewlett-Packard are among the notable players in this industry. Total earnings for the industry are expected to be down -9.7% in Q1 from the same period last year, after being barely in the positive column last quarter. The outlook for the Software & Services industry, the second largest in the sector accounting for about 30% of its total earnings, is good enough, with new players like Google, Facebook and others offsetting the growth challenges for legacy players like Microsoft, and Adobe and others. The hardware industry has a bit of a seasonality element to it as well, with the last quarter of the year typically bringing in the most earnings. Unlike the hardware industry, there is not much seasonality in the software industry’s results. Sequentially, total earnings for the hardware industry are expected to be down -33.6%, while the sequential change for the software industry is -5.9%. The strong +27.4% growth in Q1 for the Semi-conductor industry (about 10% of the sector’s total earnings) is primarily due to easy comparisons, particularly at Micron Technology. Micron’s swing from a loss in 2013 Q1 to positive earnings this quarter more than offsets the expected year-over-year decline at Intel. The Context for Growth Expectations Let’s take a look at how consensus earnings expectations for 2014 Q1 compare to what companies earned in the last few quarters and what they are expected to earn in the coming quarters.

Zacks Earning Trends April 3, 2014
www.Zacks.com 11
Table 2 below presents the year over year earnings growth rates - expectations for Q1 and the following two quarters. It also shows consensus earnings growth expectations for 2014 and 2015. Table 3 presents the same data for revenues. Table 2 – Earnings Growth Context
Table 3 – Revenue Growth Context
Zacks Earning Trends April 3, 2014
www.Zacks.com 12
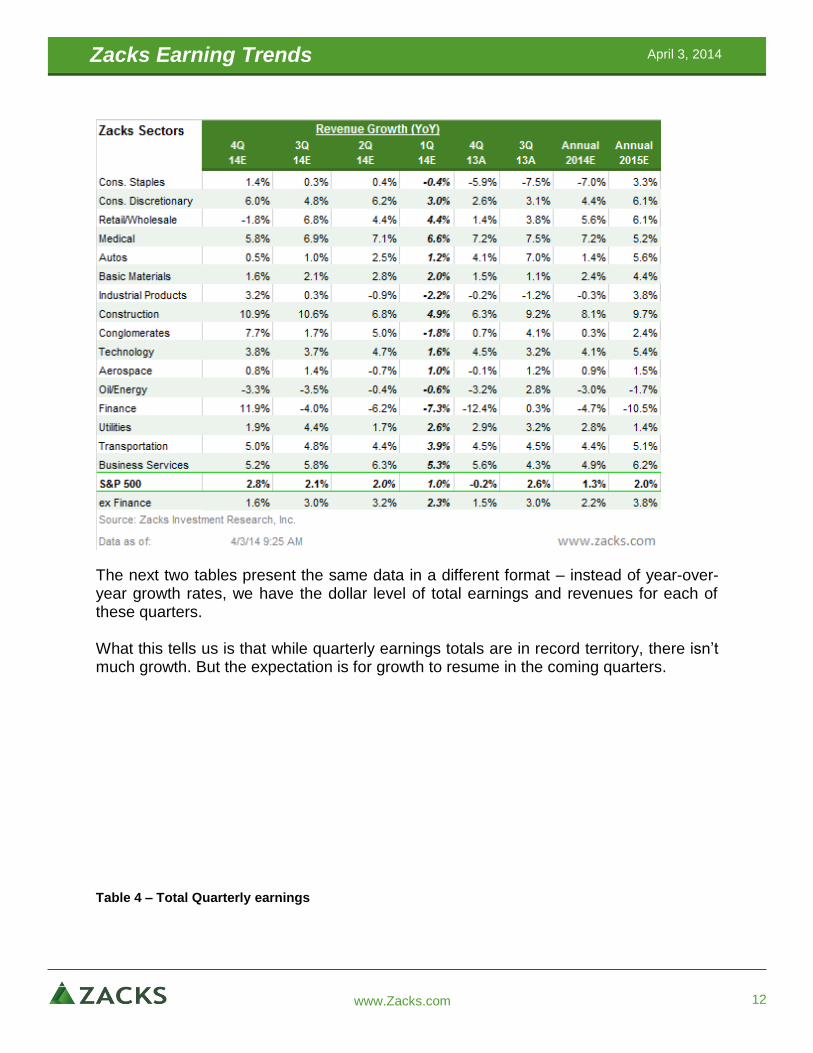
The next two tables present the same data in a different format – instead of year-over-year growth rates, we have the dollar level of total earnings and revenues for each of these quarters. What this tells us is that while quarterly earnings totals are in record territory, there isn’t much growth. But the expectation is for growth to resume in the coming quarters. Table 4 – Total Quarterly earnings

Zacks Earning Trends April 3, 2014
www.Zacks.com 13
Table 5 – Total Quarterly Revenues

Zacks Earning Trends April 3, 2014
www.Zacks.com 14
It may be obvious, but it’s still useful to explain what we mean by total earnings. This means the sum total of aggregate earnings for all the companies in the S&P 500. For historical periods through 2013 Q4, we have taken the total earnings (not EPS) for each company in the S&P 500 and added them up to arrive at the sector and index level totals (we do adjust reported GAAP earnings for non-recurring items, but consider employee stock options as a legitimate business expense). For the coming quarters, including Q1, we have taken the Zacks Consensus EPS for each company in the index, multiplied that by the corresponding share count (from the last reported quarter) to arrive at the total earnings for each company. And then we aggregated them to arrive at the totals for each sector and the index as a whole. The lack of accuracy in real-time share count notwithstanding, this gives us a fairly accurate view of the total earnings picture. In plain language, what Table 4 tells us is that companies in the S&P 500 are expected to earn $250.9 billion in 2014 Q1 vs. $267.7 billion in 2013 Q4 and $257.5 billion in 2013 Q1.

Zacks Earning Trends April 3, 2014
www.Zacks.com 15
The overall level of total earnings has been very high in recent quarters. In fact, the 2014 Q4 tally was a new all-time quarterly record in Q4, surpassing the records reached in each of the preceding two quarters. The consensus expectation is for a strong growth ramp up later in 2014, starting in Q2. Full-year 2014 earnings for the S&P 500 are expected to be up +7.8% and a further +11.7% the following year. The Margins Picture Net margins (total earnings/total revenues) are expected to be down in 2014 Q1, both year over year as well as sequentially. The table below shows net margin expectations for Q1 in the context of where they have been and where they are expected to go in the coming quarters. Table 6: Quarterly Net Margins

Zacks Earning Trends April 3, 2014
www.Zacks.com 16
The table 7 below shows net margins on a trailing four-quarter basis. So, the 9.6% net margin for 2014 Q1 reflects estimates for Q1 and actuals for the preceding three quarters, and so on. Table 7: Net Margins – Trailing 4 Quarters
Margins follow a cyclical pattern. They expand as the economy comes out of a recession and companies use existing resources in labor and capital to drive business. But eventually capacity constraints kick in, forcing companies to spend more for incremental business. At that stage, margins start to contract again.
We may not be at the contraction stage yet, but we do need to buy into fairly optimistic assumptions about productivity improvements for current consensus margin expansion expectations to pan out.
Market Cap vs. Total Earnings
The charts below show the share of total earnings for 2013 as well as the share of total market capitalization for each of the 16 Zacks sectors. Since the S&P 500 is a market-cap weighted index, each sector’s market cap share is also its index weight. Finance is on track to regain its leadership position in the index in terms of earnings contribution this year, though it still remains significantly below its record 27% share of the index

Zacks Earning Trends April 3, 2014
www.Zacks.com 17
earnings in 2007. The sector is expected to edge out Technology as the largest earnings contributor this year.
Consumer Stapls6.5%
Consumer Discrt4.1%
Retail7.1%
Medical11.1%
Auto/Tires/Trks1.9%
Basic Materials3.1%
Industrial Prod2.4%
Construction0.5%
Conglomerates3.3%
Computer & Tech17.5%
Aerospace1.6%
Oils/Energy11.5%
Finance19.7%
Utilities5.6%
Transportation1.9%
Business Svcs2.3%
Share of 2013 Income

Zacks Earning Trends April 3, 2014
www.Zacks.com 18
Want more information about this report or about Zacks Investment Research?
Contact Terry Ruffolo at 312-265-9213 or at [email protected]
Visit the Zacks Media Room at zacks.com/media-room
Disclosure: This material is being provided for informational purposes only and nothing herein constitutes investment, legal, accounting or tax advice, or a recommendation to buy, sell or hold a security. No recommendation or advice is being given as to whether any investment or strategy is suitable for a particular investor. It should not be assumed that any investments in securities, companies, sectors or markets identified and described were or will be profitable. All information is current as of the date of herein and is subject to change without notice. Any views or opinions expressed may not reflect those of the firm as a whole.
Consumer Stapls7.3%
Consumer Discrt5.0%
Retail8.6%
Medical12.3%
Auto/Tires/Trks1.5%
Basic Materials3.2%
Industrial Prod2.5%
Construction0.6%
Conglomerates3.5%
Computer & Tech17.7%
Aerospace1.6%Oils/Energy
9.7%
Finance16.3%
Utilities5.1%
Transportation2.0%
Business Svcs3.0%
% Share of Mkt Cap