taking shape
TRANSCRIPT

Lanka Tiles PLCIntegrated Annual Report 2018/19
T A K I N GS H A P E


TAKING SHAPEAt Lanka Tiles, we are shaping our future. As we explore new possibilities and expand our horizons, we look to the years ahead with confidence - forging ourselves to become stronger, refining our capabilities and undergoing an extraordinary transformation that will reinforce our ability to withstand the pressures around us.
Our strength, resilience, energy and vitality are corporate characteristics that set us apart, and our vision to excel drives us forward; shaping us into the entity we are today. Yet we continue to mould ourselves to become far better - pursuing perfection year after year. And now, as our strategy of expansion and transformation begins to take shape, we remain confident in our ability to reach our full potential in the years ahead.
T A K I N GS H A P E

2 Lanka Tiles PLC
CONTENTS
Management Discussion & Analysis
3 4Financial Reports
8 6
Financial Highlights
1 3Chairman’s Message
1 6The Strategic Report
2 4
The firing process explored in this report is an integral step in the manufacture of ceramic tiles. It begins a process that can transform the softest clay into an element that is durable, strong and enduring - and ensures long-lasting value.
Lanka Tiles PLCAnnual Report 2018/19
T A K I N GS H A P E
About The Report / 4Our Business Resume / 6Financial Highlights / 13Non-Financial Highlights /14Chairman’s Message / 16Managing Director’s Message / 20The Strategic Report / 24Management Discussion & Analysis / 34Capitals Report / 40Board of Director’s / 56Senior Management / 59Corporate Governance / 60Annual Report of The Board of Directors on The AffairsofTheCompany/ 70Statement of Directors’ Responsibility / 75ChiefExecutiveOfficer’sandChiefFinancialOfficer’s Responsibility Statement / 76Related Party Transactions Review Committee Report / 77Remuneration Committee Report / 78Audit Committee Report / 79GRI Index / 81
FINANCIAL REPORTSIndependent Auditor’s Report / 86Consolidated Statement of Financial Position / 90Consolidated Statement of Comprehensive Income / 91Statement of Changes In Equity / 92Consolidated Statement of Cash Flows / 93Notes To The Financial Statements / 94Five Year Summary Statement of Comprehensive Income / 135Five Year Summary Statement of Financial Position / 136Shareholder Information / 137Statement of Value Added / 139Corporate Information / 141Notice of Meeting / 142Proxy Form / 143

3Integrated Annual Report 2018/19

4 Lanka Tiles PLC
ABOUT THE REPORT
690 employees
4 new showrooms
266,777 new customers
8,500 m2 space expansion
122 branches
Revenue over Rs. 7 Bn.
Giving an integrated representation of the Group’s performance, Lanka Tiles PLC is pleased to present the Annual Report for the period ended 31st March 2019. This will be our 02nd Integrated Annual Report and reflects changes in our capitals, operating environment and business line reviews since our previous report for the financial year ended 31st March 2018.
The Board of directors fully acknowledge the responsibility of
the Annual report for the period ended 31st March 2019.
GRI 102-50 102-51 102-52

5Integrated Annual Report 2018/19
Scope and Boundary
This report covers the activities of Lanka Tiles PLC (LTPLC)
and subsidiary companies. Financial and non- financial
information presented in the report relate to the Group
unless indicated otherwise.
Reporting Frameworks
We have complied with the requirements set out in the following regulatory and voluntary framework
Regulatory Requirements Voluntarily Adopted Frameworks for Reporting
• Companies Act No.7 of 2007
• Continued Listing Requirements
of the Colombo Stock Exchange
• Sri Lanka Accounting & Auditing
Standards Act No.15 of 2015
• Sri Lanka Financial Reporting
Standards
• Integrated Reporting Framework issued by the
International Integrated Reporting Council.
• Core option of the GRI standards.
• Code of Best Practice on Corporate Governance issued by the Institute of
Chartered Accountants of Sri Lanka December 2017
• Communicating Sustainability issued by the Colombo Stock Exchange
• Sustainability Standards issued by the Global Reporting Initiative
• Sustainability Development Goals
Assurance
Assurance on the financial statements have been provided by Messrs. PricewaterhouseCoopers.
Changes in reporting
There were no re-statements of information and no changes to our reporting period during the year.
For any inquiries on the report, please contact
Mr. Tyrell Roche
General Manager (Finance)
Email: [email protected]
Telephone : 011 4526700
GRI 102-46 102-48 102-53102-49 102-54
REPORTING ENHANCEMENTS
• This year, we focused on improving the relevance and
conciseness of our annual report
• Included disclosure on our strategy
• Improved disclosure of our material topics.
• Page count was increased to 144 from 136 last year.
An OverviewManagement Discussion & AnalysisCapitals ReportGovernance ReportFinancial ReportsSupplementary Information

6 Lanka Tiles PLC
OUR BUSINESS RESUME
Incorporated in 1984 as a private Limited Company, Lanka Tiles PLC became a listed company in 1986. Today we have a market capitalization of Rs. 3,714 Mn.
The main activity of the company is the manufacture and sale of ceramic and porcelain floor tiles.
Group Structure
LANKA WALLTILES
PLC
LANKA TILES
PLC
SWISSTEK (CEYLON)
PLC
LWL DEVELOPMENT
(PVT) LIMITED
HORANA PLANTATIONS
PLC
UNI DIL PACKAGING
LIMITED
Swisstek Aluminium
Limited
Uni Dil Packaging (Pvt) Limited
Swisstek Development (Pvt) Limited
Beyond Paradise Collections
Limited
11.48%
47.80%
68.217%
100% 100%
100%
100% 51% 100%
100%
100%
51%
87.38%
Vallibel Plantation Management Limited
LTL Development (Pvt) Limited
Lankatiles Private Limited - India
V I S I O N
M I S S I O N
Our vision is of a future in which Lanka Tiles will have become not only a household name but a global one
Our mission is to be a company that sets and constantly exceeds the benchmark of the highest quality in producing ceramic products of exceptional beauty and functionality and to cater to every need of our discerning customers both in Sri Lanka and abroad.
These traits have kept us at the forefront of our chosen spheres, creating peerless career development opportunities within the organisation. We believe that improvement is a continuing process. It is the constant endeavour of our employees and the driving force behind our success.
GRI 102-1 102-5

7Integrated Annual Report 2018/19
At Lanka Tiles PLC, we take pride in what we do. As the biggest tile producer in Sri Lanka, we focus on delivering
the best possible product while being conscious about the environment we operate in.
GRI 102-5 102-18
An OverviewManagement Discussion & AnalysisCapitals ReportGovernance ReportFinancial ReportsSupplementary Information
Managing Director
General Manager (Finance)
General Manager
(Marketing)
Commercial Manager
Group Stores Manager
HR Manager
Management Accountant
Asst. General Manager (P/T)
Factory Manager
AM
AM
Group Finance Manager
AM
AMAM AMAMAM
Head of IT
AM AM
AM AM
Lanka Tiles organisation structure
Customer Relations Manager
Group Engineering
Manager
TPM Manager DFM Production
AFMHead of Design
Group Business
Development Manager
Sales Manager
Group Manager
(Sales Administration)

8 Lanka Tiles PLC
Our Product Portfolio
Xilosophy Senses Hearts of earth
Essential Concrete
ELEGANCE / DIGNITY NATURE / RAW SUBSTANCE PERSONALITY
WITH AN ENCHANTING EXPERIENCE OF NATURE
ENJOYING THE REFINED TREASURES OF THE EARTH
WITH THE PLUS OF BEING ESSENTIAL
WITH A CONCRETE ATTITUDE
O U R B U S I N E S S R E S U M E
GRI 102-2
9Integrated Annual Report 2018/19
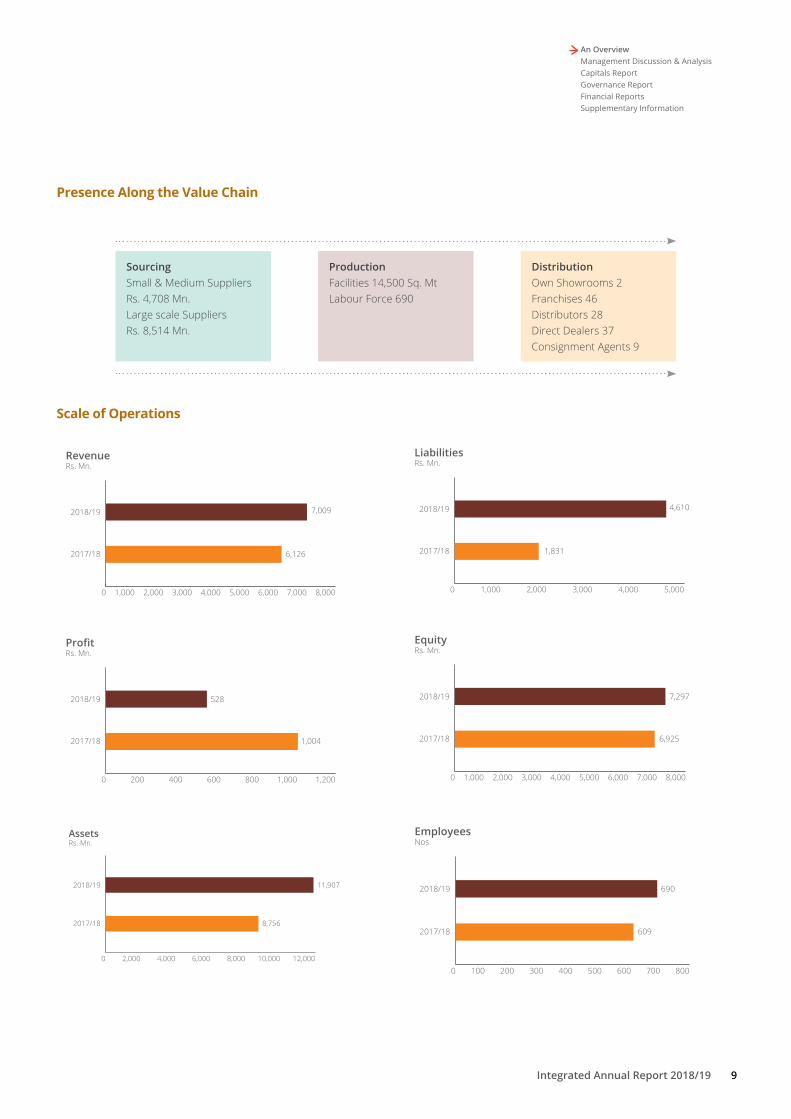
Scale of Operations
0 1,000 2,000 3,000 4,000 5,000 6,000 7,000 8,000
RevenueRs. Mn.
2018/19 7,009
6,1262017/18
0 200 400 600 800 1,000 1,200
ProfitRs. Mn.
2018/19 528
1,0042017/18
0 2,000 4,000 6,000 8,000 10,000 12,000
AssetsRs. Mn.
2018/19 11,907
8,7562017/18
0 1,000 2,000 3,000 4,000 5,000
LiabilitiesRs. Mn.
2018/19 4,610
1,8312017/18
0 1,000 2,000 3,000 4,000 5,000 6,000 7,000 8,000
EquityRs. Mn.
2018/19 7,297
6,9252017/18
0 100 200 300 400 500 600 700 800
EmployeesNos
2018/19 690
6092017/18
Presence Along the Value Chain
Sourcing Small & Medium Suppliers Rs. 4,708 Mn. Large scale Suppliers Rs. 8,514 Mn.
Production Facilities 14,500 Sq. Mt Labour Force 690
Distribution Own Showrooms 2 Franchises 46 Distributors 28 Direct Dealers 37Consignment Agents 9
An OverviewManagement Discussion & AnalysisCapitals ReportGovernance ReportFinancial ReportsSupplementary Information

10 Lanka Tiles PLC
Accolades
O U R B U S I N E S S R E S U M E
11Integrated Annual Report 2018/19
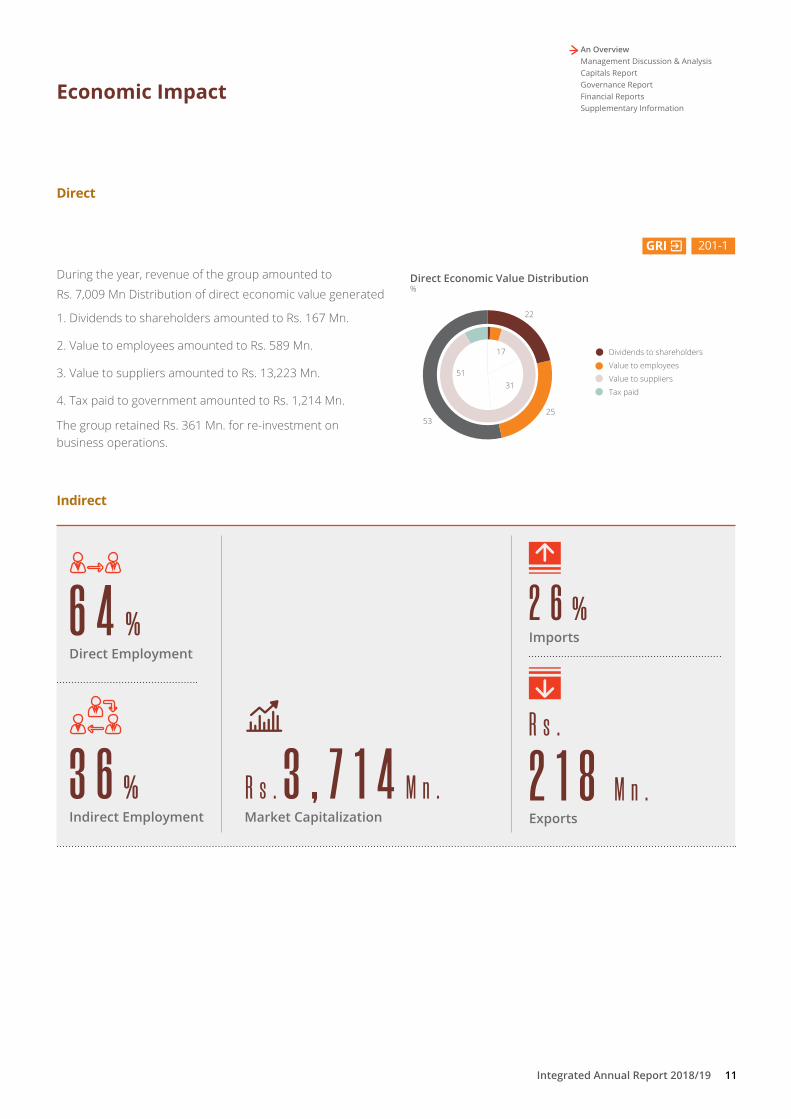
During the year, revenue of the group amounted to
Rs. 7,009 Mn Distribution of direct economic value generated
1. Dividends to shareholders amounted to Rs. 167 Mn.
2. Value to employees amounted to Rs. 589 Mn.
3. Value to suppliers amounted to Rs. 13,223 Mn.
4. Tax paid to government amounted to Rs. 1,214 Mn.
The group retained Rs. 361 Mn. for re-investment on business operations.
Economic Impact
Direct
R s . 2 1 8 M n .
Direct Employment
Market CapitalizationIndirect Employment Exports
R s . 3 , 7 1 4 M n .
2 6 %
3 6 %
6 4 % Imports
Indirect
Direct Economic Value Distribution%
22
2553
Dividends to shareholders
Value to employees
Value to suppliers
Tax paid
51
17
31
An OverviewManagement Discussion & AnalysisCapitals ReportGovernance ReportFinancial ReportsSupplementary Information
GRI 201-1

12 Lanka Tiles PLC
Our Presence
We have been rapidly expanding our distribution network in order to reach a wider customer base.
While we mainly supply to the local market we export 3% of our output to several international
destinations.
Jaffna
Vavuniya
Dambulla
Chillaw WariyapolaKurunegala
MataleKandyPeradeniyaKegalle
GampolaNittambuwa
MinuwangodaWarakapolaWennappuwa
NegomboJa Ela GampahaKadawatha
WattalaJawatteNawala
MoratuwaPanadura
AwissawellaKaduwelaKottawaHorana Ratnapura
MathugamaAluthgama
Ambalangoda
Galle Ambalantota
Embilipitiya
Balangoda WellawayaBandarawela
BadullaMonaragala
AmparaMahiyanganaya
Kalutara
Matara
Jaffna
W
ata
Alu
Am
p
ara
uthgamambi
a
anganaya
mb
wa
elawana
gam
Em
Balanaa
Ba
w
m
one
WarakapolaW
oh
aWa
od
aa
ngoda
nd
aaAA
avuv
egamb
aw
mb deamp
la
O U R B U S I N E S S R E S U M EEconomic Impact
1. Vancouver2. Los Angeles3. Charles’ Town4. Montreal5. Toronto6. Rotterdam7. Felixstowe
8. Gothenburg9. Male10. Oman11. Karachi12. Bangalore13. Kathmandu14. Singapore
15. Fremantle16. Adelaide17. Wellington18. Auckland19. Sydney20. Brisbane21. Kobe
1
2
3
45
6
78
9
10 11
12
13
14
15
16
17
18
19
20
21
GRI 102-6

13Integrated Annual Report 2018/19
FINANCIAL HIGHLIGHTS
Financial Performance Unit 2018/19 2017/18 Change %
Revenue Rs.’000 7,008,992 6,126,307 14%
Gross Profits Rs.’000 2,006,290 2,379,127 -16%Earnings Before Interest and Tax (EBIT) Rs.’000 751,879 1,098,834 -32%Profit before tax Rs.’000 745,606 1,352,792 -45%Profits after tax Rs.’000 528,012 1,003,997 -47%Profits attributable to shareholders Rs.’000 527,968 1,004,494 -47%Gross profit margin % 28.6% 38.8% -26%Net profit margin % 7.5% 16.4% -54%Return on assets (ROA) % 5.1% 11.7% -56%Return on equity (ROE) % 7.4% 14.8% -50%Interest cover No of times 34.1 50.5 -33%
Financial Position Unit 2018/19 2017/18 Change %
Assets Rs.’000 11,906,947 8,756,292 36%Capital expenditure Rs.’000 2,162,415 402,174 438%Debt Rs.’000 2,102,058 201,402 944%Other liabilities Rs.’000 2,507,649 1,629,743 54%Shareholders’ equity Rs.’000 7,297,240 6,925,147 5%Gearing % 29% 3% 890%Net assets per share Rs./share 137.55 130.54 5%Current ratio No of times 2.1 3.6 -43%Quick assets ratio No of times 0.8 1.75 -57%
Shareholder information Unit 2018/19 2017/18 Change %
No of shares in issue No 53,050,410 53,050,410 0%Market value per share Rs./share 70.00 99.70 -30%Dividend per share Rs./share 3.15 10.00 -69%Earnings per share Rs./share 9.95 18.93 -47%Market capitalization Rs. Mn. 3,714 5,289 -30%Dividend payout ratio % 32% 53% -40%
Other Unit 2018/19 2017/18 Change %
Number of employees No 690 609 13%Average revenue per employee Rs.’000 9,518.33 9,279.70 3%Average profit per employee Rs.’000 1,110.15 1,846.74 -40%Number of showrooms No 48 44 9%
An OverviewManagement Discussion & AnalysisCapitals ReportGovernance ReportFinancial ReportsSupplementary Information
GRI 102-7

14 Lanka Tiles PLC
NON-FINANCIAL HIGHLIGHTS
Unit 2018/19 2017/18 Change %
Human Capital No. Employees No. 690 609 13
New Recruits No. 170 60 183
Investment in Training Rs. Mn 7.3 7.5 (54)
Training Hours Hours 5,809 583 896
Workplace Injuries No. 20 4 400
Retention Rate % 92.8 93.4 (0.64)
Manufactured Capital Property, Plant & Equipment
Rs. Mn 5,743 3,856 49
Investments Rs. Mn 2,162 402 438
Social & Relationship capital
Own Showrooms No. 2 2 -
Franchise Showrooms No. 46 42 10
Dealers No. 37 25 48
Distributors No. 28 24 17
Consignment Agents No. 9 9 -
Suppliers No. 1,178 1,118 19
Payment to Suppliers Rs. Mn 13,223 5,671 133
Natural Capital Electricity No of unit/Mn 15.6 14.7 7
LPG Kg/Mn 8.6 7.7 12
Water Usage Lit 27,180,756 27,950,867 (3)
Water Recycled Lit 2,168,950 2,200,000 (1)
Environmental Standard Certification
No. 2 2 -
Intellectual Capital No. of new Designs No. 318 206 54
Investment in R&D Rs. Mn 12.3 15 18
Quality Certifications No. 3 3 -
Awards Received No. 2 2 -

15Integrated Annual Report 2018/19
E M P L O Y E E S
S O C I E T Y & E N V I R O N M E N T
Staff Strength
89
601
Mal
e
Fem
ale
6 9 0
Ragama Hospital Renovation
Volunteer Hosting Project
Foreign volunteers engaging in educational and social work
Pre-School Project
L K R 1 . 2 M n .
L K R 7 . 3 M n .
1 4 9 P r e - S c h o o l s
Male Female
Gender Diversity
8 7 % 1 3 % 0
100
200
300
400
500
600
700
800
Employees ExpensesNos
2014
.03.
31
2015
.03.
31
2016
.03.
31
2017
.03.
31
2018
.03.
31
2019
.03.
31
An OverviewManagement Discussion & AnalysisCapitals ReportGovernance ReportFinancial ReportsSupplementary Information

16 Lanka Tiles PLC
CHAIRMAN’S MESSAGE
Re-igniting the spirit of our vision
Dhammika PereraChairman

17Integrated Annual Report 2018/19
In an era where change is inevitable, Lanka Tiles is in the process of altering its own business model in order to retain its market leadership position. Over the years, the brand LANKATILES has been associated with high product standards and we continue to invest in our facilities and processes to sustain our position.
Dear Shareholders,
In an era where change is inevitable, Lanka Tiles is in the process of altering its own business model in order to retain its market leadership position. Over the years, the brand LANKATILES has been associated with high product standards and we continue to invest in our facilities and processes to sustain our position. Poor performance of the construction sector and the influx of cheaper imports have made our operating environment volatile and a re-evaluation of our business model was needed to ensure that we remain future fit as we move forward.
DRIVING CHANGE
Going back to the drawing board, we identified areas which needed urgent attention. Our product portfolio was outdated in terms of designs and sizes and needed an overhaul. We also needed a product range to compete with the imports priced at lower prices. Increased production capacity also needed to be utilised by developing our export markets and driving growth by inspiring customers with our designs. Therefore, the Board addressed these issues as a priority, allocating resources and setting up appropriate performance review mechanisms.
The transformation will inevitably straddle financial years as key strategies require significant time for implementation. However, we are pleased with what has been achieved to date and are confident that we are well positioned to deliver on more goals in the year that has commenced.
We have expanded our sourcing capabilities and as a result our supply chains have become more complex as we looked for solutions to many issues. Our contract manufacturing business in India has grown rapidly as we filled a lacuna in the market and our portfolio, retaining our promise of quality through our own quality control processes and people. Consequently, LANKATILES has become the single largest exporter of tiles as a brand in India. In the domestic market, we continue to maintain a relationship with key industry influencers such as architects and tilers and this has enabled us to maintain our visibility. We have also reinforced our domestic distribution by broadening our franchise showroom network. New product designs and sizes were introduced to our product portfolio in line with current market trends.
INSPIRING CUSTOMERS
As we understand the diversity of our customer requirements and have gone beyond focusing only on the design and quality of our products, the LANKATILES app was introduced with the aim of engaging an increasingly tech savvy clientele. The app allows customers to generate 3D images of their space using our products. We are confident that this innovative market tool will have a positive impact on our earnings. Our franchise showroom staff undergo regular training sessions in assisting customers to match their requirements.
FOCUS ON EXPORTS
We needed to look beyond the domestic market as the capacity enhancement coincided with a contraction in the domestic construction industry. Currently exports amount to a mere 3% of our total sales and in order to grow we need to grow our presence in established markets and also focus on developing new markets. Trade tensions between China and US together with and bilateral trade agreements may create opportunities that need to be seized. Encouragingly, we have observed renewed interest from these markets and we are working to convert these leads in to tangible orders.
An OverviewManagement Discussion & AnalysisCapitals ReportGovernance ReportFinancial ReportsSupplementary Information

18 Lanka Tiles PLC
C H A I R M A N ’ S M E S S A G E
PERFORMANCE
Reflecting the weak demand and decrease in productivity due to trial runs for new designs and sizes, Lanka Tile’s profit after tax for the year ended 31st March 2019 amounted to Rs. 528 Mn. reporting a decline of 47%. We had to shut down the old kiln during the year to install a new kiln with bigger capacity and this too had an adverse impact on our productivity. Growth of 14% in revenue was achieved mainly through volume growth which exerted pressure on margins. Finance costs increased by 1.4% as capital expenditure was funded by debt, further impacting the bottom line. In the long term, this trend is expected to reverse as loans get repaid, supporting bottom line growth.
On a more positive note, our asset base grew by 36% to reach Rs. 11,906 Mn. as we gear up for growth through new product and market developments.
Your Board paid a dividend of Rs.3.15 per share taking in to account the performance which amounts to Rs.167 Mn. as the interim dividend for the year ended 31st March 2019.
OUTLOOK
We have invested Rs. 2.2 Bn. in enhancing our production capacity with the ability to manufacture a wider range of tiles in terms of design and size. With this capacity enhancement we have become the single largest tile manufacturing facility in the county and are geared to be on top of evolving global trends.
We will continue to grow our contract manufacturing capabilities in India as we have identified this as a key area for potential growth while combating the intense competition coming from low priced imports.
GOVERNANCE
Corporate governance is vital for the growth of the Lanka Tiles Group and the Board continues to develop sound practices in order to comply with evolving practices. The International certifications and voluntarily adopted standards,
frameworks and codes also support evolution of this key subject. Consequently, we have seen the Board packs and agenda evolving over time as we incorporate technology and improve our decision support information systems which has facilitated better governance, balancing all stakeholder interests. Enhanced information has also increased the objectivity of decision making which has become more focused on data and application of principles in a consistent manner.
SUSTAINABILITY
Our journey in sustainability continues to evolve as we broaden the scope of application and drive harder to minimise impacts each year. It pervades all aspects of our business from selection of energy efficient equipment to simple daily routines across all levels. However, we realise that there is more that needs to be done and the Board continues to provide leadership in this regard as we pursue the mantra “to do more with less”. Sustainability, in fact makes commercial sense in this intensely competitive business landscape, particularly if the leadership is focused on the long term as we have always been. As global research and local events affirm, inequalities and environment are two of the greatest challenges that countries and corporates face and using the wider lens of sustainability ensures that we do our bit, addressing them in our workplace.
OPPORTUNITIES IN VOLATILITY
Domestic economic growth is likely to be hindered by the political and policy uncertainty. This, combined with rising interest rates pose several challenges for the current financial year. Despite the negative outlook we see potential opportunities which we will need to make use of in order to sustain our business both locally and internationally.
Trade wars between US and China have made Sri Lanka an alternative sourcing destination. This opportunity coupled with the depreciating Rupee is likely to make our products more competitive and attractive in the export market. The Country’s reputation for social and environmental compliance frameworks also provide a significant competitive advantage.

19Integrated Annual Report 2018/19
It is also necessary to monitor the developments in the country’s bilateral trade agreements to identify potential pathways for export growth opportunities.
Growth in the domestic market will be focused on maintaining and broadening our distribution network which we have built over the last 35 years by facilitating mutual growth.
APPRECIATION
I commend Mr. Mahendra Jayasekera for the leadership given to Lanka Tiles in order to navigate through challenging times. The dedication of the team at Lanka Tiles and its subsidiaries is commendable as the change within and adaptation required has been considerable and I thank them for their inspired work. I thank our franchise partners and our customers for their continued loyalty and all our other business partners who assist us in various ways in carrying out our operations. I am grateful for the counsel of my fellow Board members who discharge their duties with care and diligence. Finally, I wish to thank our shareholders for their support extended and look to the same as we continue on our transformational journey.
Dhammika PereraChairman
06th June 2019
An OverviewManagement Discussion & AnalysisCapitals ReportGovernance ReportFinancial ReportsSupplementary Information

20 Lanka Tiles PLC
MANAGING DIRECTOR’S MESSAGE
The passion to do things differently
J A P M JayasekeraManaging Director

21Integrated Annual Report 2018/19
Lanka Tiles completed a Rs. 2.2Bn. capacity expansion in our Ranala factory and with this we have become the single largest tile manufacturer in the country.
Operating Context
• Sri Lanka GDP 3.2%
• Per Capita Income $4,102
• Inflation 2.1%
• Construction Sectors 2.1%
• Private sector credit growth for construction activities 14.1%
• Credit granted for personal housing 13.1%
• AWPR 68 bp
As challenging conditions have prompted us to re-evaluate our business model, we have accepted this challenge and are currently in the process of altering our approach to be better suited to today’s market dynamics. We have taken measures to broaden our supply chain by expanding our contract manufacturing facilities in India, while market leadership in the domestic market combined with increased production capacity has inevitably led us to look for new market opportunities. Measures were taken during the year under review to address these issues and we look forward to the year that has commenced to deliver the results of these changes.
ENGAGING CUSTOMERS
High levels of customer engagement is of paramount importance in order to effectively compete in the market during times of modest economic growth. Continuous dialogue with our customers and influencers have helped us in getting a better understanding of our customers’ needs. Potential areas for improvements were identified through in-house customer surveys, and these findings were used in improving our product portfolio. Training sessions for franchise network staff continued in areas such as understanding customer requirements and how to provide solutions in line with these requirements.
Subsequent to the customer feedback obtained we identified expansion in contract manufacturing in India as a key area for potential growth. As disposable income of our customers decreased, we observed a gradual shift towards cheaper imported tiles. We took this market shift as an opportunity and allocated more resources to manufacture tiles in India where cost of production was relatively lower. By taking this
initiative we were able to provide products manufactured under LANKATILES brand, conforming to our stringent quality standards while pricing them at more competitive levels.
The Product portfolio was upgraded to meet modern day customer requirements and we introduced 128 new designs while older designs were discontinued. Significant capital investments were made in order to align our portfolio according to modern designs and sizes as our production facility in Ranala underwent a capacity expansion.
Further, in order to cater to the increasingly tech savvy customers we introduced the LANKATILES app which gives our customer the opportunity to obtain 3D images of their space using LANKATILES products. We also provided the same functionality online with a web-tool to engage customers on a wider screen format. Customer helplines were also established to expand channels of communication and assist in a limited manner to sort out potential issues.
An OverviewManagement Discussion & AnalysisCapitals ReportGovernance ReportFinancial ReportsSupplementary Information
GRI 102-14

22 Lanka Tiles PLC
M A N A G I N G D I R E C T O R ’ S M E S S A G E
CAPACITY EXPANSION IN PRODUCTION FACILITY
Lanka Tiles completed a Rs. 2.2 Bn. capacity expansion in our Ranala factory and with this we have become the single largest tile manufacturer in the country. The expansion resulted in production disruption as part of the facility had to be shut down and was unavailable for operations. Productivity was affected as trial runs for new designs and sizes had to be done.
Total Productive Maintenance (TPM), a group wide initiative which was introduced last year continued. However, benefits derived from this was mitigated by the production disruptions caused by the expansion. Once the improved facility is fully functional, we would be able to achieve operational efficiencies as well as an uninterrupted production process targeting a new and improved product line.
PERFORMANCE
Lanka Tiles recorded top-line growth of 14% to Rs.7.0 Bn. strongly supported by volume growth as we introduced a range of competitively priced products. This reflects the agility of the company as this growth was achieved during a contraction of the construction sector, intensifying competition and reduced disposable incomes which combined to soften demand in the reporting year. Cheap imports of inferior quality also exerted pressure on margins as we pursued a strategy to drive volume growth to maintain market share, strengthening our domestic franchise and facilitating recovery of high levels of fixed overheads.
Gross profit declined by 16% to Rs.2.0 Bn. due to increased raw material prices, inflation, devaluation of the rupee, high energy costs and labour costs. Distribution costs increased by 16% to Rs.1 Bn. as we increased incentives to drive sales volumes engaging our franchise network which accounts for a significant proportion of sales. Consequently, operating profit declined by 32% to Rs. 751 Mn. reflecting economic headwinds and increasing costs.
Net finance costs for the reporting period amounted to Rs.14.1 Mn. in comparison with net finance income of Rs.88 Mn. recorded in the prior year as deposits were liquidated to fund the expansions in the previous year. Despite the increase, the interest cover is very comfortable although depressing profitability. Additionally, the share of income from the equity accounted investee, Swisstek (Ceylon) also declined to Rs. 8 Mn. from Rs.165 Mn. in the previous year due to the subdued performance of the company, also stemming from the contraction in the construction sector
LANKATILES recorded top-line growth of 14% to Rs.7.0 Bn. strongly supported by volume growth as we introduced a range of competitively priced products. This reflects the agility of the company as this growth was achieved during a contraction of the construction sector

23Integrated Annual Report 2018/19
and overcapacity within the leading aluminium industry players. Consequently, profit before tax declined by 45% to Rs. 746 Mn. Taxation of 28% amounted to Rs.218 Mn. which resulted in a profit after tax of Rs. 528 Mn. which reflects a decline of 47% over the previous year.
We have embarked on an aggressive expansion of our franchise network in order to broaden our footprint in the domestic market. This will enable us to reach a wider customer base in the future.
We have already begun altering our course in order to face tough times that are ahead and we will continue to re-evaluate our model as we move forward.
ACKNOWLEDGEMENTS
I thank the Board for steering our course and providing guidance through the year, and the respective business heads for the leadership given to our team. I take this opportunity to thank all our employees for being a part of our legacy as we continue to grow together. My appreciation goes to our business partners and customers who have been a part of our journey and shared our growth. Finally, my sincere thanks go out to our shareholders for your continued confidence in us and look forward to another profitable year.
J A P M JayasekeraManaging Director
06th June 2019
STABILITY
Total assets increased by 36% to Rs.11.9 Bn. due to investments in capital expenditure of Rs. 2.2 Bn. and increased inventory and receivables as we geared for growth. At present, the Property, Plant & Equipment (PPE) of the Group Rs. 5.7 Bn. is testimony to the manufacturing capabilities of the Group. Borrowings increased significantly from Rs. 201 Mn. to Rs. 2.1 Bn. as capital expenditure was funded through borrowing, leveraging a strong balance sheet which is able to absorb the increased level of debt. The debt to equity ratio with the increased borrowing remains at a prudent 29% reflecting the stability of the Group.
OUTLOOK
Instability in the political environment and policy making is likely to dampen the economic activity in the domestic front while the global economic activity is likely to be hampered by the ongoing trade tensions and increasing vulnerabilities of some economies. Trade wars between China and US have made Sri Lanka a potential alternative and we are well positioned to seize the opportunity with our revamped product portfolio and improved production facility.
An OverviewManagement Discussion & AnalysisCapitals ReportGovernance ReportFinancial ReportsSupplementary Information

24 Lanka Tiles PLC
THE STRATEGIC REPORTValue Creation
MANUFACTURED CAPITAL
HUMAN CAPITAL
SOCIAL & RELATIONSHIP CAPITAL
FINANCIAL CAPITAL
Page
Page
Page
Page
5 0
4 2
4 5
4 8
INTELLECTUAL CAPITAL
Page
5 4
NATURAL CAPITAL
Page
5 2
Shareholder Funds
LANKATILES Registered Global Brand Brand
Land Extent
Manufacturing Facilities
R s . 1 . 5 0 B n
No. of Employees
Strong relationship with Customers
Debt
Systems and Processes Consumption
Energy Consumption
Equipment
R s . 3 . 0 6 B n
R s . 7 . 2 9 B n
9 , 2 5 3 P e r c h e s
6 9 0
R s . 2 . 1 0 B n
R s . 2 . 8 B n
R s . 1 . 3 2 B n
2 6 6 , 7 7 7
1 , 2 3 7
suppliers and distribution network of
CAPITAL USED
StrategyMaterial Matters & Risks
+
+
Value CreationO V E R V I E W
Stakeholder Engagement
Operating Environment
Value Creation
GRI 102-47

25Integrated Annual Report 2018/19
Our focus is on optimum usage of our capital resources in order to create value to all stakeholders. Our key strengths are brand image, customer base, wide distribution network and innovativeness.
SHAREHOLDERS
EMPLOYEES
CUSTOMERS
SUPPLIERS
GOVERNMENT
COMMUNITY
Dividend per Share
Employee opportunities
Taxes paid
Salaries and wages paid
Tiles manufactured
Floor Tiles -
G l o s s 7 , M a t t 3 1 , P o l i s h e d 1 2C a r v i n g d e s i g n 5 2 , F u l l B o d y 8 , S t r i p 1 0 , D o u b l e 8
New designs Introduced
Payment to international suppliers
Earnings per Share
CSR
Training Hours
Investment in Training
R s . 3 . 1 5
6 9 0
R s . 1 , 2 1 4 M n
R s . 5 8 9 M n
R s . 9 . 9 5
R s . 1 3 . 3 M n
5 , 8 0 9
R s . 7 . 3 3 M n
R s . 3 , 2 8 6 M n
R s . 9 , 9 3 7 M n
Payment to local suppliers
Sourcing good quality material from
reliable suppliers
Research and development for
innovation
Best practices in manufacturing
process and continuous product
testing
Delivery through a
wide distribution
network
Interaction with
customers to
understand market
trends
Production in our
manufacturing
facilitiesCreate
a pro
duct
portfolio
to m
eet
custo
mer
needs
Process of identifying, analysing, accepting or mitigating uncertainty.
Good governance is vital in order for the business to sustain and develop while it helps us to manage a better relationship with our stakeholders it also
makes us more transparent and accountable.
RISK MANAGEMENT
CORPORATE GOVERNANCE VALUE CREATED TO STAKEHOLDERS
An OverviewManagement Discussion & AnalysisCapitals ReportGovernance ReportFinancial ReportsSupplementary Information
GRI 204-1
26 Lanka Tiles PLC
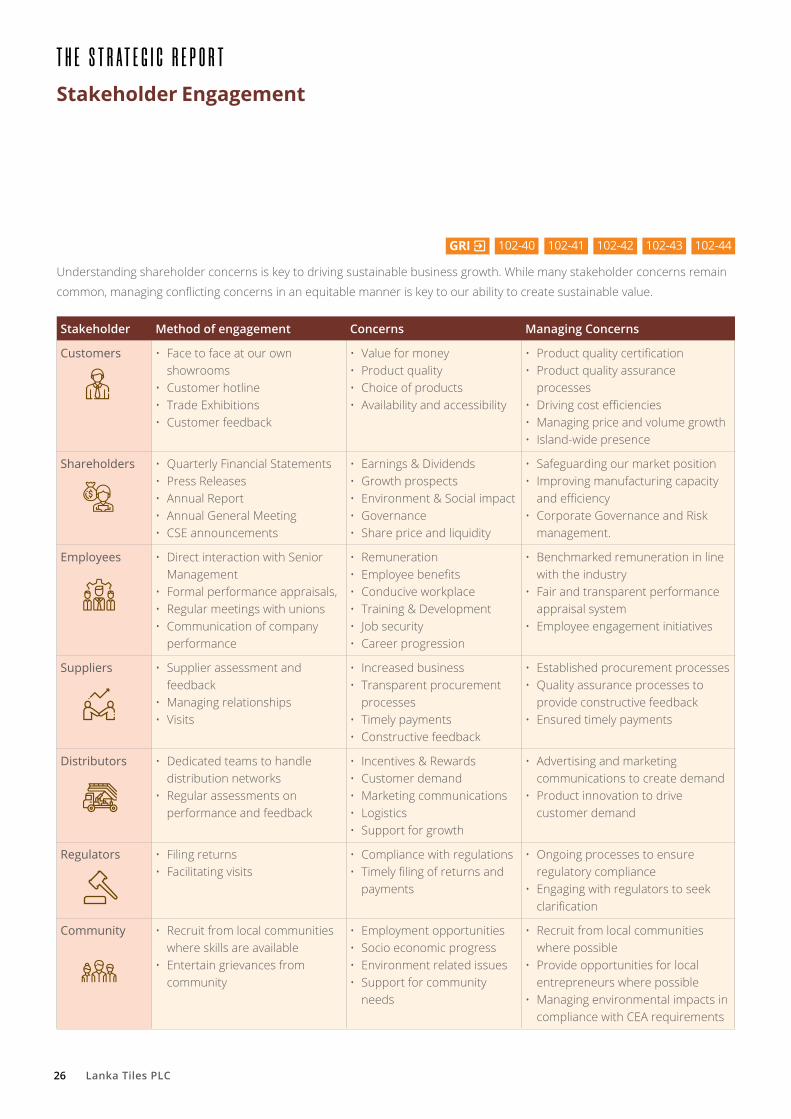
Understanding shareholder concerns is key to driving sustainable business growth. While many stakeholder concerns remain
common, managing conflicting concerns in an equitable manner is key to our ability to create sustainable value.
Stakeholder Method of engagement Concerns Managing Concerns
Customers • Face to face at our own showrooms
• Customer hotline• Trade Exhibitions• Customer feedback
• Value for money• Product quality• Choice of products• Availability and accessibility
• Product quality certification• Product quality assurance
processes• Driving cost efficiencies• Managing price and volume growth• Island-wide presence
Shareholders • Quarterly Financial Statements • Press Releases• Annual Report• Annual General Meeting• CSE announcements
• Earnings & Dividends• Growth prospects• Environment & Social impact• Governance • Share price and liquidity
• Safeguarding our market position• Improving manufacturing capacity
and efficiency• Corporate Governance and Risk
management.
Employees • Direct interaction with Senior Management
• Formal performance appraisals, • Regular meetings with unions• Communication of company
performance
• Remuneration • Employee benefits• Conducive workplace• Training & Development• Job security• Career progression
• Benchmarked remuneration in line with the industry
• Fair and transparent performance appraisal system
• Employee engagement initiatives
Suppliers • Supplier assessment and feedback
• Managing relationships• Visits
• Increased business• Transparent procurement
processes• Timely payments• Constructive feedback
• Established procurement processes• Quality assurance processes to
provide constructive feedback• Ensured timely payments
Distributors • Dedicated teams to handle distribution networks
• Regular assessments on performance and feedback
• Incentives & Rewards• Customer demand• Marketing communications• Logistics• Support for growth
• Advertising and marketing communications to create demand
• Product innovation to drive customer demand
Regulators • Filing returns• Facilitating visits
• Compliance with regulations• Timely filing of returns and
payments
• Ongoing processes to ensure regulatory compliance
• Engaging with regulators to seek clarification
Community • Recruit from local communities where skills are available
• Entertain grievances from community
• Employment opportunities• Socio economic progress• Environment related issues• Support for community
needs
• Recruit from local communities where possible
• Provide opportunities for local entrepreneurs where possible
• Managing environmental impacts in compliance with CEA requirements
T H E S T R A T E G I C R E P O R T
Stakeholder Engagement
GRI 102-40 102-41 102-42 102-43 102-44
27Integrated Annual Report 2018/19
Operating environment
Macro Economy
In order to maintain our leadership in the industry we continuously monitor our macro environment to assess potential risks and opportunities. Several key factors such as economic growth, interest rates, inflation and Government policies have a direct impact on our performance.
Construction sector and overall economic performance
2018 was a challenging year for the global economy as most markets were affected by geopolitical pressures, weakening financial markets and trade wars. Amidst political instability and changing Government policies Sri Lanka saw a GDP growth of 3.2% in 2018 compared to 3.4% of the previous year.
Growth in the construction sector which contributes to 6.8% of GDP was affected by high construction costs and low construction volume. During the first 3 quarters construction activity saw a decline of 2.1% compared to the 4.3% growth in the corresponding period of the previous year. This was reflected in the total cement manufactured and imported during the year which saw a decline of 6.3%. Credit extended by the Licensed Commercial Banks (LCBs) to the private sector for construction activities grew at a slower pace of 14.1% compared to the growth of 22.5% last year. Further, credit granted under personal housing loans by the LCBs saw a growth of 13.1% compared to the 21.4% growth in 2017.
Demand for floor tiles and wall tiles is heavily dependent on the construction and refurbishment of residential and commercial properties. Floor tiles takes up a significant portion of the local tile market while wall tiles are still considered as a niche product.
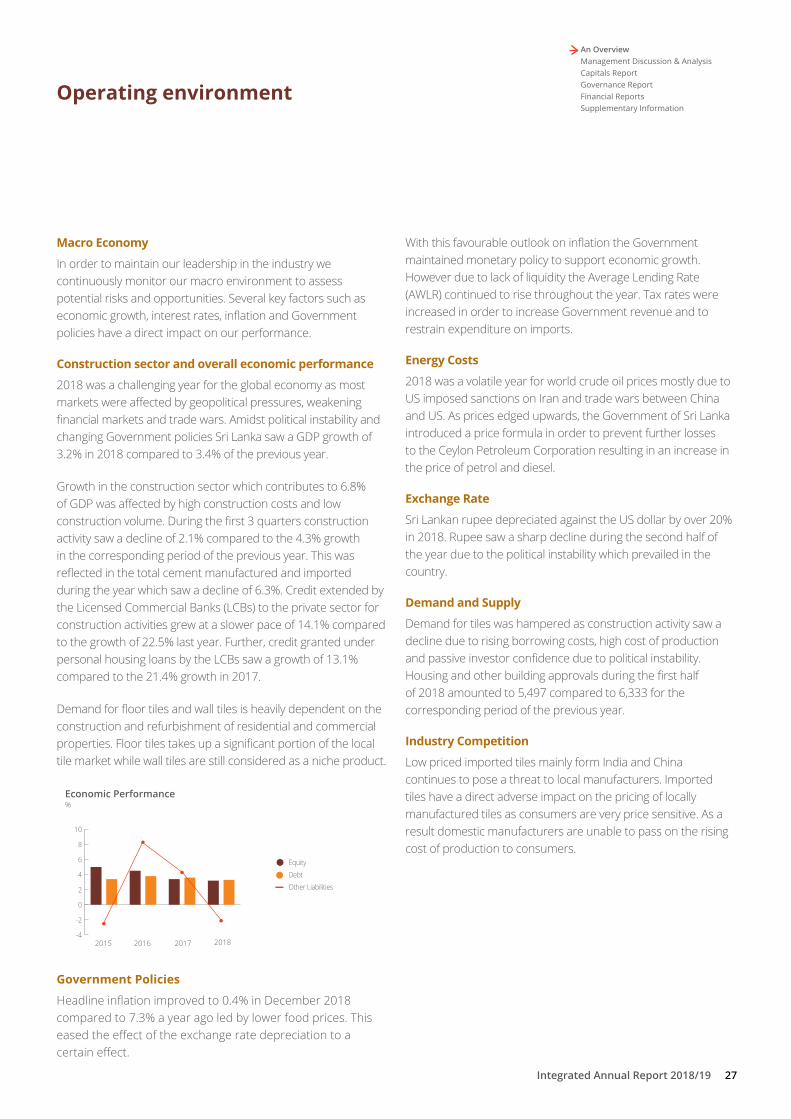
Economic Performance%
2015 2016 2017 2018
Equity
Debt
Other Liabilities
-4
-2
0
2
4
6
8
10
Government Policies
Headline inflation improved to 0.4% in December 2018 compared to 7.3% a year ago led by lower food prices. This eased the effect of the exchange rate depreciation to a certain effect.
With this favourable outlook on inflation the Government maintained monetary policy to support economic growth. However due to lack of liquidity the Average Lending Rate (AWLR) continued to rise throughout the year. Tax rates were increased in order to increase Government revenue and to restrain expenditure on imports.
Energy Costs
2018 was a volatile year for world crude oil prices mostly due to US imposed sanctions on Iran and trade wars between China and US. As prices edged upwards, the Government of Sri Lanka introduced a price formula in order to prevent further losses to the Ceylon Petroleum Corporation resulting in an increase in the price of petrol and diesel.
Exchange Rate
Sri Lankan rupee depreciated against the US dollar by over 20% in 2018. Rupee saw a sharp decline during the second half of the year due to the political instability which prevailed in the country.
Demand and Supply
Demand for tiles was hampered as construction activity saw a decline due to rising borrowing costs, high cost of production and passive investor confidence due to political instability. Housing and other building approvals during the first half of 2018 amounted to 5,497 compared to 6,333 for the corresponding period of the previous year.
Industry Competition
Low priced imported tiles mainly form India and China continues to pose a threat to local manufacturers. Imported tiles have a direct adverse impact on the pricing of locally manufactured tiles as consumers are very price sensitive. As a result domestic manufacturers are unable to pass on the rising cost of production to consumers.
An OverviewManagement Discussion & AnalysisCapitals ReportGovernance ReportFinancial ReportsSupplementary Information

28 Lanka Tiles PLC
T H E S T R A T E G I C R E P O R T
Strategy
Lanka Tiles is the proud market leader for floor tiles in Sri Lanka with a market share of over 20%. Strategy is developed
to increase our leadership of this sector and deliver value to our stakeholders including our supply chain partners.
Resource allocation is key to implementing strategy to facilitate delivery of our key performance indicators.
STRATEGIC PRIORITY HOW WE ADDRESSED FROM THEM
KEY PERFORMANCE INDICATORS
PLANS FOR 2019/20
Market Leadership
Operational Excellence
Financial Stability
Sustainability
• Research & development Expenditures Rs. 12.3 Mn.
• No. of new products launched
• Expansion in contract manufacturing in India
• Expansion to our distribution network
• Capacity expansion
• Total Productivity management initiatives
• Cost efficiencies
• Improving employee productivity
• Funding capacity expansion
• Managing liquidity
• Managing financial leverage
• CSR projects
• Conforming to environmental standards
• Waste management
• Customer satisfaction score 81%
• Revenue growth 14%
• Employee retention rate 92.8.
• Cost savings from TPM Rs. 63.6 Mn.
• Revenue per employee Rs.1,015 Mn.
• Gearing 29 %
• Inventory turnover 2.01
• Increase in shareholder funds 5%
• CSR Rs. 13.3 Mn.
• Developing innovative products
• Identifying new market segments
• Export expansion
• Widening our distribution network
• Focus on cost efficiencies
• Maintaining funding capacity
• Managing working capital
• Maintaining funding capacity
• Managing working capital

29Integrated Annual Report 2018/19
In order to grow as an organization, we need to identify, understand and balance the most important concerns of our
stakeholders. This will help us sharpen our focus on drivers of value creation while it also helps us identify emerging
opportunities and risks. The following graph depicts these identified issues assessed based on their impact to us as a company
and to our stakeholders. Reporting guidelines such as GRI was used to provide full disclosure on material topics within three
broad categories namely economic, social and environmental. The material topics were actively managed and monitored to
create value for the organisation or stakeholders or mitigated if the topic posed a threat and where practical and cost effective
to do so. In addition, these topics became a reference source to determine our principal risks and opportunities as described
in page 31.
Impo
rtan
ce to
Sta
keho
lder
Importance to Company
Product Quality
Availability of raw material
Satisfied Customer
Compliance
TechnologyCustomer Privacy
Child Labour
Supplier Assessment
Building Capacity
Productive Workforce
Climateaction
Packaging
Labelling Local Community
Earnings Growth
Strategy
ProductQualityCompliance
Prod
uctiv
e
Wor
kfor
ce
Availability of
Raw Material
SatisfiedCustomer
Earn
ings
G
row
th
Build
ing
Capac
ity
• Supplier Assessment
• Sustainable sourcing
• Revenue growth
• Liquidity
• Competition & market share
• Process efficiencies
• Environmental compliance
• Certifications & standards
• Training & development
• Health & Safety
• Labour relations
• Employee retention
• Broad supplier base
• Technology
• Capacity expansion
• Product pricing
• Innovation
• Marketing
• Wide product range
• Communication
Materiality
An OverviewManagement Discussion & AnalysisCapitals ReportGovernance ReportFinancial ReportsSupplementary Information

30 Lanka Tiles PLC
As a company we are exposed to risks related not only to the
tiling industry but to global and domestic macro economies.
Risk management is vital in managing market volatility and
we have identified key factors that have a significant impact
on our performance and value creation as the principal risks
which are discussed in page 31.
Risk Governance
The responsibility of the Risk Management Process lies
with the Board of Directors and this is supervised by the
company’s Executive Committee and reviewed by the Audit
Committee. Lanka Tiles PLC has the following structure to
facilitate risk management and risk reporting.
Board of Directors
Audit Committee
CEO
Executive Committee
Operational Managers
Lanka Tiles adopts an Enterprise Risk Management (ERM)
approach, thus giving an integrated approach to the
management of company’s business risk. The objective
is to improve performance and decision making through
identification, evaluation and management of key risks.
Lanka Tiles PLC has the following management structure to
facilitate risk management and risk reporting.
Corporate Governance
Risk Identification & Assessment
Risk Response & Reporting
Risk Management Roles & Responsibilities
Risk Management Policies and Procedures
Risk Management Strategy
Organisation Strategy
T H E S T R A T E G I C R E P O R T
Principal Risks

31Integrated Annual Report 2018/19
Our Principal risks in 2019
Risk Impact and Developments in 2018/19 How to Mitigate
Subdued demand in the domestic market
Weakening economy and rising interest rates had a direct adverse impact on the disposable income. This in turn was reflected in the poor construction activity
• Review opportunities to increase exports to existing markets
• Capturing markets in Australia, USA, India, Maldives, Madagascar and Seychelles.
• Explore opportunities to enter into new export markets
Political and policy uncertainty Introduction and implementation of new government policies and custom duties affecting mining and cost of production
• Industry representations to implement policies that support growth of the vital industry sector
Increased cost of key inputs Energy costs and imported raw material costs increased significantly during the year impacted by volatility in global markets and a depreciating rupee. As our revenues are derived mainly from the local market which remained subdued during the reporting year, we were unable to pass through increasing costs resulting in significant pressure on margins. The industry also witnessed a declining supply of kaolin, ball clay, feldspar, silica quartz and dolomite which also exerted upward pressure on costs
• Total Project Management (TPM) was implemented during the year to streamline processes and create a platform for continuous corporate and individual performance improvement
• Production being outsourced to factory facilities in India
The LTPLC risk management process can be explained by the three lines of defence concept of risk management as given below
First line Second line Third line
Day to day identification, assessment, managing and reporting of all risk within the span of control Ensuring risk exposures stay within limits Responding appropriately to challenge by the second line of defense Implementing recommendations by third line of defense
Clear and well communicated risk policies Effective control and monitoring systems Providing assurance that risks are being appropriately managed across the business Providing robust challenge to the first line Facilitating actions to respond to levels of risk deemed to be beyond or close to tolerance
Independent assurance and oversight on the effectiveness of : Systems of governance Risk management Internal control
Executives and Supervisors Corporate Management team The Board
Resp
onsi
bilit
yAc
coun
tabi
lity
An OverviewManagement Discussion & AnalysisCapitals ReportGovernance ReportFinancial ReportsSupplementary Information

32 Lanka Tiles PLC
T H E S T R A T E G I C R E P O R T
Principal Risks
Risk Impact and Developments in 2018/19 How to Mitigate
Changes in design trends Interior design trends drive demand necessitating an ever-widening portfolio of sizes, shapes, colours and textures at varying price points coupled with accessories
• Modifying manufacturing facilities to produce larger sizes to cater to current design trends
Market reach Ensuring that customers have the tiles they want at their preferred location is a significant challenge due to the space requirements
• Showrooms being opened and operated as franchise partnerships
• Consistent display systems to facilitate review of portfolios
• Launch of digital platforms to inspire/design such as the Virtual Design Hub by Rocell and the Lankatiles App driving demand
Statement of Risk Management and Internal Control adequacy
The Board confirms that an effective risk management and
internal control framework and an ongoing process is in
place to minimise all potential risks and its probability of
impact to the Company and its business.
The Board also confirms all risks were reviewed using internal
and external parties and were deliberated upon by the Board
and if necessary corrective actions were taken.
The Board assures the reliability of financial statements
presented herein has been done in according with applicable
accounting standards and regulatory requirements and
training in to account all risk factors.
The Board declares that it has not found any significant risks
that may impact the operation of the business as a going
concern, or will impact the finance stability or the business
materially.
Dhammika Perera J A P M Jayasekera
Chairman Managing Director

33Integrated Annual Report 2018/19
M A N A G E M E N T D I S C U S S I O N
& A N A L Y S I S

34 Lanka Tiles PLC
MANAGEMENT DISCUSSION & ANALYSISPerformance Review
Continuously evolving to deliver our promise of valueLanka Tiles PLC continues to be the market leader for floor tiles segment in the country with a market share of 20% and also became the largest manufacturer of tiles in the country with the completion of our expansion in Ranala. Our product portfolio has expanded beyond tiles to include mortar, pebbles, aluminium beading and grout providing our customers a one stop shop solution. Additionally, we have secured 13 manufacturing facilities in India and at present is the largest tile importer from India. Further we have expanded our markets beyond our shores to cover Australia, North America and India.
Group reported a revenue growth of 14% despite the sluggish demand and weak economic conditions.

35Integrated Annual Report 2018/19
NURTURING CAPITALS
• Completion of Ranala factory expansion increasing capacity to 14,500 m2 per day • Introduced new product range with varying textures and sizes• Continued to pursue export opportunities• Knowledge transfer from Indian factories to Sri Lankan factories
Financial Capital Manufacturing Capital Human Capital
18/19 17/18 18/19 17/18 18/19 17/18
Revenue (Rs. Mn.) 7,009 6,126 PPE (NBV) (Rs. Mn.) 5,743 3,856 Employees (Nos.) 690 609
PBT (Rs. Mn.) 746 1,353 Capex (Rs. Mn.) 2,162 402 Remuneration (Rs. Mn.) 589 623
GP margin 29% 39% Depreciation (Rs. Mn.) 268 236 Employee Productivity (SQM ’000/employee)
5,573 6,289
Total Assets (Rs. Mn.) 11,906 8,756 Capacity Utilization (%) 81.7 98.6 Investment in Training (Rs. Mn.)
7.33 7.49
Total Liabilities (Rs. Mn.)
4,610 1,831 Locations 7 6
ROCE (%) 9% 16%
Natural Capital Social & Relationship Capital Intellectual Capital
18/19 17/18 18/19 17/18 Lanka Tiles brand Equity in books (Rs. Mn.)
24
Materials (Mt) 87,177 81,021 Distributors 28 24 Awards 02
Dealers 37 25
Energy (No. of units) 15,675,184 14,787,945 Franchisees 46 42
Water (litres) 27,180,756 27,950,867 Consignment Agents 09 09
Waste water (litres) 2,168,950 2,200,000 Tiler Club Members 3,678 3,371
Waste (MT) 9,010 2,175 Suppliers 1,178 1,118
An OverviewManagement Discussion & AnalysisCapitals ReportGovernance ReportFinancial ReportsSupplementary Information
GRI 303-1 306-2

36 Lanka Tiles PLC
The supply chain in Sri Lanka is fairly short with 35% of the value of raw materials sourced from Sri Lanka while the balance comprising mainly chemicals are imported from Italy and China. Products manufactured in our factories in Sri Lanka account for 69% of our revenue. Tiles manufactured in India travel approximately 3,000 km to reach our warehouses with most of the transportation done via sea. Ball clay requirements for Indian tile factories are also situated in close proximity and chemicals are imported.
Performance
• Group reported a revenue growth of 14% despite the sluggish demand and weak economic conditions. Sales from the local market, which contribute 97% of total sales increased by 16% while exports sales saw a decline of 18%. Demand from Australia was affected by the poor performance in the construction industry while the sales from USA was hampered by the political tension between USA and China.
• Smaller kiln at our Ranala factory had to be shut down due to capacity expansion project and this resulted in loss of production and higher production cost which was reflected in a significant drop in our gross profit margin. Profit margins were further affected by the sharp increase in LPG. As a result the gross profit margin which was at 39% last year declined to 29% during the year.
• 4 new showrooms were opened during the year and the cost of this was reflected in a 16% increase in selling and distribution expenses. Administrative expenses remain at the same levels as last year.
• Group reported an operating profit of Rs.752 Mn., a sharp decline of 32% from the previous year. This was mainly due the increase in cost of production. We were unable to pass on the increased costs to our consumers due to the intense price competition in the market.
• Finance expenses increased to Rs. 14 Mn. compared to a finance income of Rs.88 Mn. previous year due to rising interest costs and new borrowing to funds the capacity expansion.
• Group’s income tax expenses came down by 38% due to the decline in profits. Lanka Tiles reported a net profit of Rs. 528 Mn. compared to Rs.1,004 Mn. reported in the previous year.
During 2019, we completed the capacity expansion of our Ranala production facility with a total cost of Rs. 2.2 Bn. and are in the process of commissioning the improved facility. On commissioning of this facility, we will be the largest tile manufacturer in the country with a daily production capacity of 14,500 Sq. Mt.
18/19 Sq. Mt.
17/18 Sq. mt
% Change
Domestic Production Mn. 3.8 3.8 -
Indian Production Mn. 1.3 0.5 160%
Manufacture of floor tiles
Lanka Tiles PLC
Manufacture of Tile Grout and
Mortar
Swisstek Ceylon Ltd.
Ball Clay
Lanka Ceramics PLC. & Other local suppliers
Chemicals
Utilities
M A N A G E M E N T D I S C U S S I O N & A N A L Y S I SPerformance Review
Our Supply Chain GRI 102-9 102-10

37Integrated Annual Report 2018/19
As competition from low cost imported tiles intensified over the past few years, Lanka Tiles PLC took measures to manufacture tiles in India under our own brand though a strategic partnership with a leading Indian tile manufacturer Ambani Vitrified (pvt) Ltd. as an outsourcing partner in 2017. This has enabled us to increase our output under Lanka Tiles brand at competitive prices without compromising on the quality of the products offered through stringent quality control measures. We are currently working with 13 factories situated in Morbi and Gujarat in India to manufacture a range of tiles in sizes and textures which are not manufactured in our local facilities. During 2018 we imported 1,091 containers from India and we are the largest importer of tiles from India.
Production by Country%
25
75
Sri Lanka
India
12
88
Total Productive Maintenance (TPM) is a Group wide in-depth and wide-reaching productivity improving initiative. This includes a comprehensive evaluation of existing production flows and procedures and will identify modifications needed in order to enhance overall productivity. This process also eliminates any repetitive activities, duplications and redundant steps within the production system.
During 2018 we succeeded in achieving cost savings of Rs. 64 Mn. compared to savings of Rs.148 Mn. achieved in 2017. Further savings and more efficiencies are anticipated as we continue to operate under TPM guidelines in order to further fine tune our production lines.
An OverviewManagement Discussion & AnalysisCapitals ReportGovernance ReportFinancial ReportsSupplementary Information
Exports
TorontoMontreal
Vancover
Los Angeles
Charles’ Town
Gothenburg
Felixstowe
RotterdamKobe
KathmanduKarachi
Oman Bangalore
MaleSingapore
Brisbane
Adelaide Sydney
Fremantle
Auckland
Wellington
38 Lanka Tiles PLC
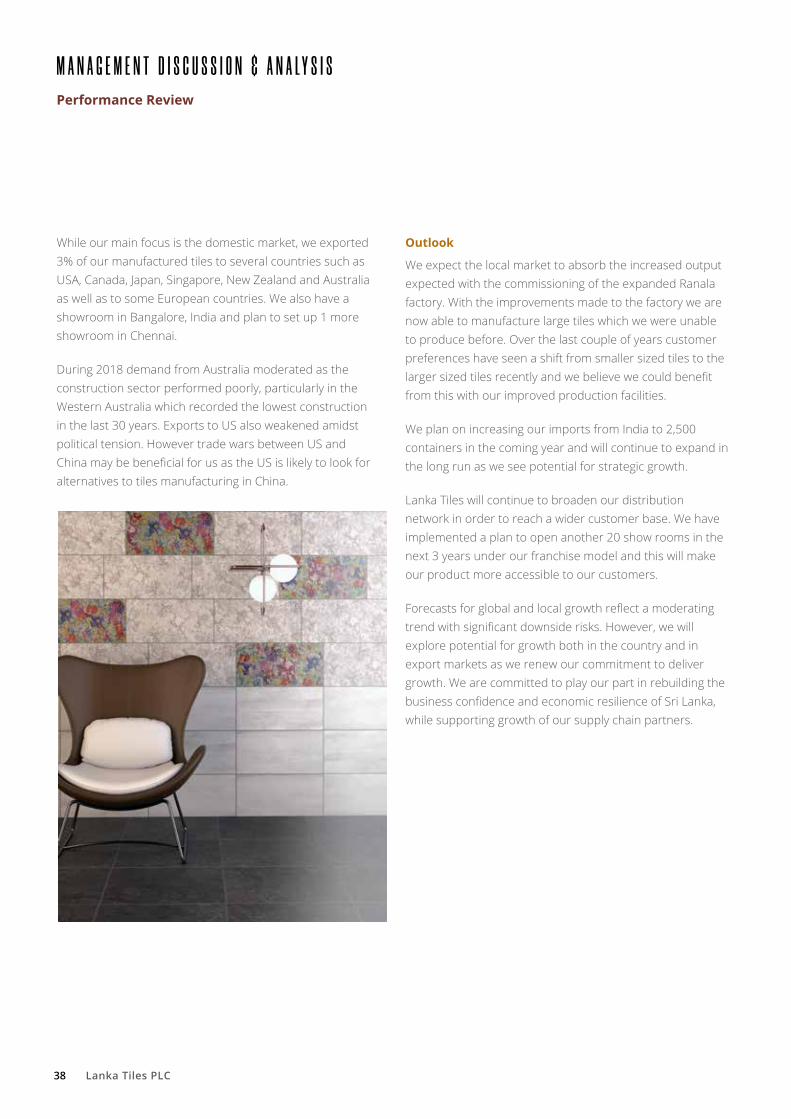
While our main focus is the domestic market, we exported 3% of our manufactured tiles to several countries such as USA, Canada, Japan, Singapore, New Zealand and Australia as well as to some European countries. We also have a showroom in Bangalore, India and plan to set up 1 more showroom in Chennai.
During 2018 demand from Australia moderated as the construction sector performed poorly, particularly in the Western Australia which recorded the lowest construction in the last 30 years. Exports to US also weakened amidst political tension. However trade wars between US and China may be beneficial for us as the US is likely to look for alternatives to tiles manufacturing in China.
M A N A G E M E N T D I S C U S S I O N & A N A L Y S I SPerformance Review
Outlook
We expect the local market to absorb the increased output expected with the commissioning of the expanded Ranala factory. With the improvements made to the factory we are now able to manufacture large tiles which we were unable to produce before. Over the last couple of years customer preferences have seen a shift from smaller sized tiles to the larger sized tiles recently and we believe we could benefit from this with our improved production facilities.
We plan on increasing our imports from India to 2,500 containers in the coming year and will continue to expand in the long run as we see potential for strategic growth.
Lanka Tiles will continue to broaden our distribution network in order to reach a wider customer base. We have implemented a plan to open another 20 show rooms in the next 3 years under our franchise model and this will make our product more accessible to our customers.
Forecasts for global and local growth reflect a moderating trend with significant downside risks. However, we will explore potential for growth both in the country and in export markets as we renew our commitment to deliver growth. We are committed to play our part in rebuilding the business confidence and economic resilience of Sri Lanka, while supporting growth of our supply chain partners.

39Integrated Annual Report 2018/19
C A P I T A L S R E P O R T
Trade-offs 41
Financial Capital 42
Human Capital 45
Social & Relationship Capital 49
Manufactured Capital 50
Natural Capital 53
Intellectual Capital 54

40 Lanka Tiles PLC
CAPITALS REPORT
FINANCIAL CAPITAL
MONETIZED (included in the asset value)
NON-MONETIZED (reflected in the intrinsic value)
HUMAN CAPITAL
SOCIAL & RELATIONSHIP CAPITAL
INTELLECTUAL CAPITAL
Page
Page
Page
Page
Page
Page
4 2
5 0
5 2
4 5
4 8
5 4
MANUFACTURED CAPITAL
NATURAL CAPITAL
Managing our capital according to a structured and disciplined process is key to our success. The capitals report sets out a brief description of our capital and our processes to develop the same. We recognize that actions taken to manage one capital portfolio is likely to impact another and strive to deepen our understanding of these interactions to facilitate optimal utilization of the same.

41Integrated Annual Report 2018/19
Understanding Our Trade Offs
We need to invest in managing our capital and as resources are finite, we have to allocate our resources in the most optimal manner, considering potential trade-offs between the capital portfolios. The list below sets out the key trade offs.
Investments in PP&E is necessary to ensure that we are fit for the future and support scalability which requires a significant outlay of financial capital
Developing new markets for exports requires an outlay of financial capital to build relationships in new geographies and aligning our business goals
Our investments in PP&E and IT drives higher levels of productivity and efficiency which necessitates re-skilling of employees and leaner teams driving a trade off between Human Capital and Manufactured Capital
Inevitable trade offs between value delivered to our employees and financial capital formation is carefully balanced by strong HR Governance processes ensuring sufficient investment in up-skilling the team and retaining them through competitive rewards and remuneration.
We invest financial capital in developing a strong domestic franchise through advertising and other brand building activities which absorb financial capital. Trade offs are balanced through budgeting and approvals processes.
Financial Capital & Manufactured Capital
Financial Capital & Social & Relationship Capital
Manufactured Capital and Human Capital
Financial Capital & Human Capital
Financial Capital & Intellectual Capital
An OverviewManagement Discussion & AnalysisCapitals ReportGovernance ReportFinancial ReportsSupplementary Information

42 Lanka Tiles PLC
A snapshot of our performance
KPIs Key Highlights
Profitability RevenueRs. Mn.
EBITRs. Mn.
Profit after Tax Rs. Mn.
AssetsRs. Mn.
LiabilitiesRs. Mn.ROA 5.1%
ROE 7.2% 7,009 752 528 11,907 4,610
Liquidity
Asset Turnover Return to Shareholders
LeverageDPS EPS Dividend Yield Net Assets Per Share
Debt/Equity 29%
Interest Cover 34.1% 3.15 9.95 4.5% 137.44
Revenue
Group reported a revenue of Rs.7,009 Mn, recording a healthy growth of 14% despite the weak economic conditions and sluggish demand. Although our key focus is on the domestic market (97% of total sales) we also cater to export markets such as USA, Canada, Japan, Singapore, New Zealand and Australia.
Revenue over TimeRs. Mn.
Total
Export
Growth in Local
Growth in Exports
0
1,000
2,000
3,000
4,000
5,000
6,000
7,000
-20
-10
0
10
20
30
40
50
14/15 15/16 16/17 17/18 18/19
%
Revenue from the local market grew by 16% despite the contraction in the construction industry. Our strategy to import low priced tiles from India manufactured under LANKATILES brand name was key in driving revenue growth. 1,091 containers were imported from India during the year in order to cater the demand for low price tiles. We have expanded our distribution network by adding 4 more showrooms under the franchise model.
C A P I T A L S R E P O R TFinancial Capital
Revenue from export market amounted to Rs .218 Mn reporting a decline of 18%. Demand from Australia was affected by the poor performance in the construction industry, particularly in the Western Australia which recorded the lowest construction activity in 30 years. Demand from USA was hampered by the destabilized market due to tensed trade relations between USA and China.
Gross profits
Gross profit declined by 16% to Rs. 2,006 Mn. despite the growth in revenue as gross profit margin narrowed to 29% from last year’s 39%. Smaller kiln in the Ranala factory had to be closed down due to the capacity expansion project and this resulted in loss of production as well as increased costs of production. With the introduction of new designs to our product range, particularly in terms of size our capacity utilization came down due to trial runs. Total saleable production declined by 6% resulting in higher per unit costs. Profit margin was further affected by the sharp increase in LPG prices.
Earnings before interest and tax (EBIT)
EBIT declined by 32% to Rs. 752 Mn. due to increase in production costs and selling and distribution costs. Cost of opening 4 new show rooms during the year was reflected in a 16% increase in selling and distribution cost. Administrative expenses remained constant at Rs. 404 Mn.

43Integrated Annual Report 2018/19
Net Finance costs
Net finance cost for the amounted to Rs. 14 Mn. compared to the net finance income of Rs. 88 Mn in the previous year. Finance income declined by 93% to Rs. 8 Mn. while finance expenses increased by 1% due to the new borrowings to fund the capacity expansion.
Income taxes
Tax on profit for the year amounted to Rs. 91 Mn. while the provisions made for deferred tax amounted to Rs. 127 Mn.
Financial positionAssets
Asset base grew by 36% during the year led by investments in property, plant and machinery and increase in inventories. Capital expenditure incurred during the year amounted to Rs. 2,162 Mn. compared to CAPEX of Rs. 402 Mn. previous year.
Financial positionRs. Mn.
PPE
Investment in subsidiaries
Investment in associate
Inventories
Trade and other receivables
Cash and cash equivalents
Other
Growth0
2,000
4,000
6,000
8,000
10,000
12,000
0
5
10
15
20
25
30
35
14/15 15/16 16/17 17/18 18/19
%
Composition of PPE%
66
21
53
16
20Freehold & clay mining land
Freehold building
Plant & machinery
Furniture & fittings
Tools & implements
Water supply scheme
Electrical distribution scheme
Motor vehicles
Roadway
Capital work in progress
Working capital
During the year, working capital for operation requirement increased by 7% or Rs.187 Mn. mainly due to the 55% increase in inventories. Despite this Group still maintained a healthy current ratio of 2.1
Liabilities
Total liabilities increased by 152% to Rs. 4,610 Mn., led by increase in borrowings and trade payables. Interest bearing borrowings which accounts for 46% of total liabilities increased from Rs. 201Mn, to Rs. 2,102 Mn. This was mainly to finance the capacity expansion project at the Ranala factory. As a result of increased borrowings Group’s debt to equity ratio increased to 29% from previous year’s 2.9%. Trade payables which amounts to 34% of liabilities increased by 101%.
Liabilities%
16
3416
4
30
Long term Borrowings
Deferred income tax liabilities
Retirement benefit obligations
Trade and other payables
Short term Borrowings
Equity
Equity funded 61% of group’s assets. During the year equity attributable to shareholders increased 5 % to reach Rs. 7,297 Mn driven by the increase in retained earnings.
Funding Growth
Total pool of funds used by the group amounted to Rs. 11,907 Mn, 36% increase from the previous year. The incremental amount of Rs. 3,151 Mn was used to fund the capacity expansion project, working capital requirement and repayments of debt obligations that occurred during the year.
An OverviewManagement Discussion & AnalysisCapitals ReportGovernance ReportFinancial ReportsSupplementary Information

44 Lanka Tiles PLC
Funding Profile%
Equity
Debt
Other Liabilities
0
20
40
60
80
100
120
14/15 15/16 16/17 17/18 18/19
Cash flows
Cash flow from operating activity declined by 78% to Rs. 155 Mn. due to the increase in inventories and drop in profitability. Cash outflow from investing activity increased by more than 5 folds to Rs. 1,810 Mn. due to increased capital expenditure. Financing activities generated an inflow of Rs. 2,191 Mn. supported by new borrowings.
C A P I T A L S R E P O R TFinancial Capital

45Integrated Annual Report 2018/19
Human Capital
Our capable and dynamic team is vital in value creation. At Lanka Tiles we take continuous measures to improve the quality of our team. Our skilled manufacturing team is comprised of 345 employees while we have a sales force of 33 employees, and they all fall under the categories of permanent, contract and outsourced.
The Human Resource Department reports to the General Manager – Finance responsible for the HR framework which supports the business needs of the Company. The HR Department is also responsible for reinforcing policy frameworks and ensuring regulatory compliance while balancing both company and employee interests.
Our Team Profile
Team by Category%
24
12
64
Permanent
Contract
Outsourced
Team by Region%
5
89
24
Western province
Central province
Southern province
Other
Human Capital at a Glance
No of employees
690
Training hours
5,809
Employee turnover
7.2%
Revenue per employee
Rs. Mn. 10.1
ProfitperEmployee
Rs. 765,235
Category Male Female Total
Senior management and above 9 2 11
Executive staff 40 6 46
Non-executive staff 449 22 471
Other 103 59 162
Total 601 89 690
An OverviewManagement Discussion & AnalysisCapitals ReportGovernance ReportFinancial ReportsSupplementary Information
GRI 102-8

46 Lanka Tiles PLC
Employment
Lanka Tiles, as an equal opportunity employer has a formal recruitment process which is based on merit and all recruitments are subjected to Board approval. During the year 170 employees were recruited to the company while 89 left our workforce.
New Recruitments by Gender%
19
81
Male
Female
New Recruitments by Age Group%
6
94
18-30 years
30-55 years
Freedom of Association
37% of the Company’s employees are members of the Inter Company Workers Union. Collective Agreements are signed every 3 years and Lanka Tiles does not restrict freedom of association and collective bargaining of our employees. During the year there was no labour unrest or industrial actions.
Employee Compensation and Benefits
A structured remunerations policy is in place in order to make compensation fair and competitive. Regular revisions are made in response to market conditions and trends and these revisions are evaluated by the Board Remunerations Committee.
Our basic salaries and wages are well above the stipulated minimum wage rates and our factory wage levels are maintained well above the minimum rates stipulated by the Ceramics Wages Board of the Department of Labour.
Our compensation package include,
• Basic salary and wage
• Defined benefit contributions such as Employee Provident Fund (EPF) and Employee Trust Fund (ETF)
• Parental Leave
• Health Insurance
• Gratuity payments on completion of 5 years
• Provisions for financial assistance for education qualifications
During the year, employee related costs amounted to Rs. 590 Mn. and a further Rs. 14 Mn. was paid as employee benefits.
Parental leave 2018/19
Employees entitled to parental leave 13
Employees on parental leave 16
Employees who returned to work during the period after parental leave
14
Employees who are still in employment 12 months after returning from parental leave
-
Total 43
Training and development
As a market leader in our business segment, our skills and competencies play a vital role in delivering a high quality product to our customers. We are committed in our attempt to improve our teams’ skills, increase efficiency and effectiveness.
A Performance management system is in place to identify training needs while specialist skills are identified through a skill mapping process.
C A P I T A L S R E P O R THuman Capital
GRI 202-1 401-1 401-2 401-3

47Integrated Annual Report 2018/19
During the year we invested in over Rs. 7.3 Mn. in training and development and programs conducted were in the following areas
• 5’S awareness programs
• Safety Operations & maintenance of forklifts
• Awareness of non-communicable diseases
• Awareness of Occupational Safety & Health
• Introduction to TPM
• Kaizen Suggestion System & awareness of Autonomous Maintenance
• Safety awareness and enhance customer relation
2018/19 2017/18
Investment in training Rs. Mn. 7.3 7.5
Total training Hours 5809 583
Number of employees trained 580 161
Average Hours of Training per Year 8.42 0.96
Health and safety
Lanka Tiles practices the Internationally accepted OHSAS 18001 (Occupational Health and Safety Assessment Series) safety standard in all our factory operations. A Safety Committee which is comprised of members from both the management and factory workers is in operation to monitor, review and advise on occupational health and safety initiatives.
Some of these initiatives include,
• As per the guidelines set out by the Department of labour and OHSAS 18001 standard, appropriate fire fighting and safety equipment is installed.
• Is compulsory for all workers to wear appropriate safety gear.
• Prominent display of safety information and instructions.
• Conducting safety awareness programs
Career progression
Lanka Tiles have adopted a “develop from within” philosophy in our HR practice. Accordingly existing employees are given priority when fulfilling vacancies. Further we have a standard succession plan in place where key senior level employees are identified for future senior management positions. The company also conducts career guidance and continuous professional development programs.
Promotions are given following performance appraisals and these routine performance appraisals take place bi-annually.
Employee Grievances
A grievance policy is in place supported by the Employee Grievance Committee, under the guidelines of OHSAS 18001
Type of Accident 2018/19 2017/18
Minor Accidents None None
Major Accidents 20 4
No. of days lost due to accidents 7 2
An OverviewManagement Discussion & AnalysisCapitals ReportGovernance ReportFinancial ReportsSupplementary Information
GRI 403-1 405-1403-2 404-2 404-3

48 Lanka Tiles PLC
We understand that the sustainability of our company depends on our ability to maintain strong relationship with our stakeholders to whom we also create value.
CustomersDuring the year our customer base generated a revenue of Rs.7 Bn, a growth of 14%. Our distribution network is focused mainly on a franchise model and during the year we added 4 showrooms to our network. Annual training sessions are conducted by the company for the franchise holders and they’re provided with standard operating procedures to facilitate mutual success.
Manufacture of Tile Grout
Swisstek Ceylon Ltd.
Customers• Distributors
• Franchisees & Retailers• Brokers
• Tilers• End Customers
Suppliers• Small scale suppliers• Large scale suppliers
• Sub-Contractors• Others
Community
Product quality Satisfaction Innovation
• Products subjected to quality assurance across all sectors
• Certification affirms compliance to international standards.
• Customer hotline• Monthly customer surveys
Social media interactions
• Product portfolio of over 318 designs
• Rs.12.3 Mn. investment in research and development
Customer base at a Glance
2 Own Stores
37 Direct Dealers
46 Franchisees & Retailers
3,678 Tiler Club members
28 Distributors
C A P I T A L S R E P O R T
Social and Relationship Capital
GRI 413-1

49Integrated Annual Report 2018/19
SuppliersWe seek to share our journey with our suppliers who are key business partners.
Fair Dealing Value Delivered Knowledge Sharing
• Timely payments• Transparency and trust• Procurement meetings
• Financial aid and support• Technical expertise when
needed.
• Ensuring that suppliers have the relevant licenses issued by the Central Environmental Authority
Communities
We’re committed towards maintaining a healthy relationship with communities and support many community development projects.
During the year we initiated the following CSR projects
Supplier base at a Glance
Rs. 4.9 Bn. Payments to SME Suppliers
Total Paid to all suppliers Rs. 13.2 Bn.
Rs. 8.3 Bn. paid to Large Scale suppliers
Total paid to local suppliers Rs. 4.7 Bn.
Rs. 8.5 Bn. paid to foreign suppliers
An OverviewManagement Discussion & AnalysisCapitals ReportGovernance ReportFinancial ReportsSupplementary Information
Foreign volunteers engaging in educational and social work
Donations to 149 Pre-Schools Ragama Hospital Renovation

50 Lanka Tiles PLC
Our Manufacturing facility
Location : RanalaProduces glazed, vitrified and ceramic floor tiles for Lanka
Tiles brand. Capacity was increased from 11,400m2 to 14,500 per day
No: of Showrooms: 48Additions during the year : 4
Manufactured Capital by Type%
1419
67
Building
Plant & machinery
Other
Manufactured Capital at a glance
Accounts for 38% of Total Assets
CAPEX as % of sales31%
Additions During YearRs. 2.1 Bn.
Asset Turnover 0.59 times
Jaffna
Vavuniya
Dambulla
Chillaw WariyapolaKurunegala
MataleKandyPeradeniyaKegalle
GampolaNittambuwa
MinuwangodaWarakapolaWennappuwa
NegomboJa Ela GampahaKadawatha
WattalaJawatteNawala
MoratuwaPanadura
AwissawellaKaduwelaKottawaHorana Ratnapura
MathugamaAluthgama
Ambalangoda
Galle Ambalantota
Embilipitiya
Balangoda WellawayaBandarawela
BadullaMonaragala
AmparaMahiyanganaya
Kalutara
Matara
Jaffna
W
ata
Alu
Am
p
ara
uthgamambi
a
anganaya
mb
wa
elawana
gam
Em
Balanaa
Ba
w
m
one
WarakapolaW
oh
aWa
od
aa
ngoda
nd
aaAA
avuv
egamb
aw
mb deamp
la
C A P I T A L S R E P O R TManufactured Capital
Our Footprint
Our manufactured capital comprises of buildings, plant & Machinery and other items including motor vehicles, furniture and fittings, tools and equipment etc. It excludes land, which are included in Natural Capital and amounts to Rs. 4,567 Mn. equivalent to 38% of the Group’s Total Assets. Capital work in progress at the end of the year was Rs. 369 Mn.
GRI 102-4 203-1

51Integrated Annual Report 2018/19
Flagship Show rooms
NAWALA215, Nawala Road, Narahenpita
PERCEPTIONS TILE GALLERY133, Jawatte Road, Colombo 5
Franchise ShowroomsBANDARAWELANo.482, Badulla Road, Bandarawela
CHILAWNo.160B , Colombo Road, Maikkulama, Chilaw
GALLENo. 357 B-3, Hiribura Road, Dangedara, Galle
GAMPAHANo.23, Queens Mary Road, Gampaha
GAMPOLANo.98A, Hospital Road, Gampola
HORANANo.580, Panadura Road, Galledadugoda, Horana
JA-ELANo.351, Colombo Road, Weligampitiya, Jaela
JAFFNANo.85, Stanley Rd. Jaffna
KADAWATHANo.572/A, Kandy Road, Ranmuthugala, Kadawatha
KADUWELANo.160/10/U, Bandarawatta, Biyagama, Kaduwela
KALUTARANo.365, Galle Road, Kalutara South
KANDYNo.121, Katugastota Road, Kandy
KEGALLENo.562A, Kandy Road, Meepitiya, Kegalle
KIRIBATHGODANo. 104/A/B, Kandy Road, Dalugama, Kelaniya
KOTTAWANo.360A, High level Road, Kottawa
KULIYAPITIYANo. 220 Hettipola Road, Kuliyapitiya.
KURUNEGALANo.250, Negombo Road, Kurunegala
MAHIYANGANAYANo.44 1/2 , Padiyathalawa Road, Mahiyanganaya.
MALAMBENo 302/6, Kaduwela Road, Koswaththa, Thalangama North.
MATALENo.575, Trincomalee Street, Matale
MATARANo.247, Gunawardana Mawatha, Kotuwegoda, Matara
MATHUGAMANo.206, Agalawatta Road, Mathugama
MINUWANGODANo.88/B, Airport Road, Boragodawatta, Minuwangoda
MONARAGALANo.132/1, Wellawaya Road, Monaragala
MORATUWANo.422, Galle Road, Moratuwa
NEGOMBONo.495, Colombo Road, Negombo
NITTAMBUWANo.02, Kandy Road, Nittambuwa
PANADURANo.04, Sri Medananda Road, Panadura
PERADENIYANo.255, Udaeriyagama, Peradeniya
RATNAPURANo.06, Main Street, Batugedara, Ratnapura
WARAKAPOLANo.229, Kandy Road, Warakapola
WARIYAPOLANo.22, Puttalam Road, Wariyapola
WATTALANo.3B, Negombo Road, Wattala
WELIMADANo.90,Badulla Road, Welimada.
WELLAWAYAWeerasekaragama, Wellawaya
WENNAPPUWANo.360/A, Kolinjadiya, Chilaw Road, Wennappuwa
ALUTHGAMAAluthgama, No 415, Galle road
AMBALANGODAAmbalangoda, No 10, Main Street
AMPARAAmpara, no. 774, Brown Junction, Hospital Road.
HAMBANTHOTAAmbalantota, Thissa road, Dehigahalanda
ATHURUGIRIYAAthurugiriya, No.182, Pore
AVISSAWELLAAvissawella, No.260, KiriwandalaUkwatta
BALANGODABalangoda, No 350g/350h, Ratnapura Road
BADULLA no 315, Passara road, Badulla
EMBILIPITIYAEmbilipitiya, Moraketiya Road, Pallegama,
VAVUNIYA, No 58, Jaffna RoadVavuniya
An OverviewManagement Discussion & AnalysisCapitals ReportGovernance ReportFinancial ReportsSupplementary Information

52 Lanka Tiles PLC
Natural capital accounts for a significant portion of our asset base. As a manufacturing company we’re heavily dependent on natural resources such as ball clay, feldspar, water and energy.
• Company’s monetized natural capital amounted to 10% of total assets.
• Freehold and Clay mining land value Rs.1,175 Mn.
• Land used for commercial purpose 8,412 Perches
• Land Used for mining purpose 841 Perches
As a responsible corporate citizen, we support responsible mining of natural resources. All mining activities are carried out in accordance with the license issued by the Central Environmental Authority (CEA) and is restored in compliance with the same.
C A P I T A L S R E P O R TNatural Capital
Input MaterialsMined Inputs
Non renewable raw materials are a key input in our production process. Managing consumption is vital not only to manage cost of production but also because these resources are finite.
99% of minerals used are recycled and reused for production while the balance 1% is used to fill mines. All our suppliers are assessed for environmental compliance by inspecting the CEA license. During the year 8 new suppliers were assessed and 3 were rejected due to non-compliance.
Input Quantity Used (Mt)
Cost Rs. Mn
Feldspar 47,739 204
Ball Clay 26,579 152
Silica Sand Dark 12,861 40
Energy & Water
Energy consumption by Type Units 2018/19 2017/18
Within the Company
Purchased electricity (from CEB)
Unit/Mn
15.6 14.7
LPG Kg/Mn 8.6 7.7Diesel Litres 355,016 595,543Outside the CompanyFuel consumed by Company owned vehicles
Litres 10,911 9,162
Fuel consumed for employee commute
Litres 10,082 6,538
Company’s energy saving processes are regularly reviewed and upgraded as we have understood that energy efficiency is vital in achieving production efficiency. Energy consumption is monitored monthly and we also have an energy audit process for our factory premises. During the year the company has energy savings of 2 Bn. Joules through various energy saving initiatives.
InputsMined Inputs
WaterEnergy
Manufacturing Process
ImpactsFinished Products
EmissionsEffluents &
waste
GRI 302-1 302-3 302-5302-2 302-4301-1
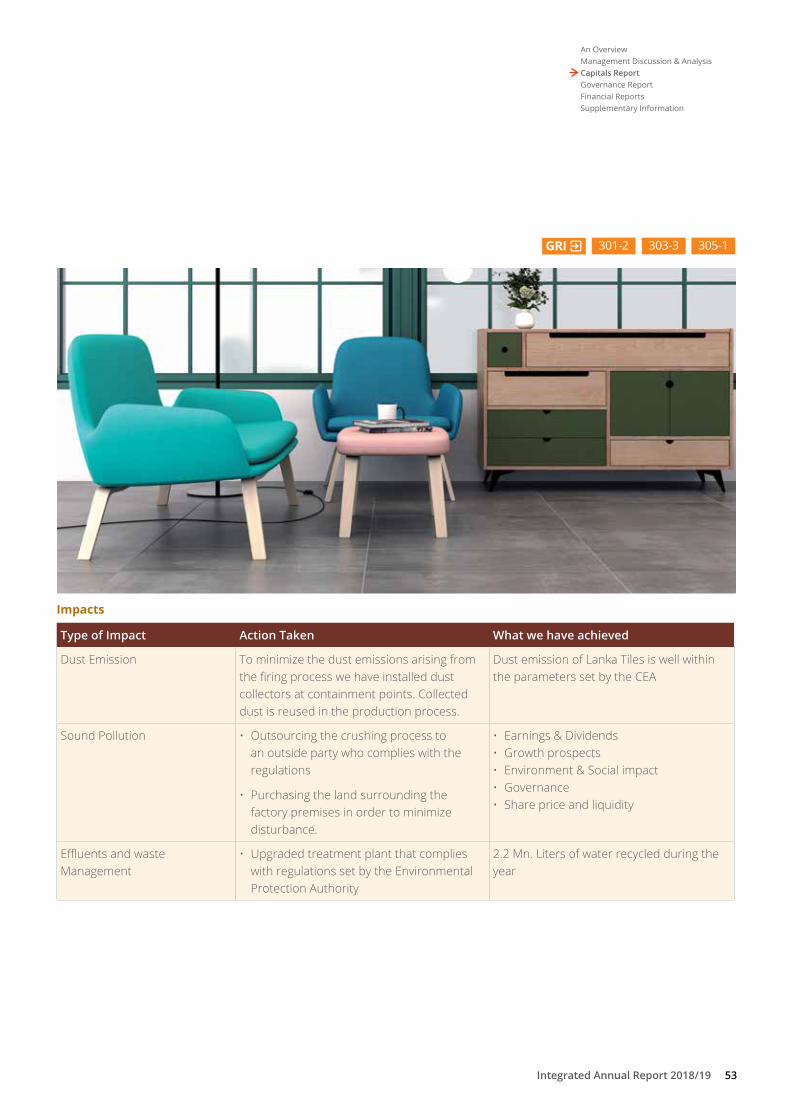
53Integrated Annual Report 2018/19
Impacts
Type of Impact Action Taken What we have achieved
Dust Emission To minimize the dust emissions arising from the firing process we have installed dust collectors at containment points. Collected dust is reused in the production process.
Dust emission of Lanka Tiles is well within the parameters set by the CEA
Sound Pollution • Outsourcing the crushing process to an outside party who complies with the regulations
• Purchasing the land surrounding the factory premises in order to minimize disturbance.
• Earnings & Dividends• Growth prospects• Environment & Social impact• Governance • Share price and liquidity
Effluents and waste Management
• Upgraded treatment plant that complies with regulations set by the Environmental Protection Authority
2.2 Mn. Liters of water recycled during the year
An OverviewManagement Discussion & AnalysisCapitals ReportGovernance ReportFinancial ReportsSupplementary Information
GRI 303-3 305-1301-2

54 Lanka Tiles PLC
Intellectual capital is part of non-monetized capital which supports us in creating value. Our competencies, innovation and tries and tested recipes are the used to create a product that meets the needs of the modern day customer.
Brand Image The brand “LANKATILES” has managed established itself as a home grown brand that is unparalleled to international branding terms of quality and design. We have been consistent in our unmatched quality and trendy design while delivering optimum value for money
Recipes Our proven recipes are tried and tested over the last 30 years. We manufacture tiles which vary in size, design, color and texture to suit both local and foreign markets.
Innovative Product Designs Our skilled team of designers are committed to in building a product portfolio which meets the needs of a diverse set of customers. During the year we have introduced 318 new designs and 01 new size.
Certification Description
SLS ISO 14001:2015 Certificate of the Environmental Management System by the Sri Lanka Standards Institution
SLS ISO 9001 :2015 Quality Managements system certification from Sri Lanka Standards Institution
CE Mark Certificate Certificate for Ceramic Tiles by QSA International , UK
SLS ISO 18001:2007 Occupational Health and Safety Management System certification from SLSI
SLS 1181 Product Certification Mark (SLS Mark)
Our intellectual capital
Certifications
Brand equity in books Rs. 24 Mn.
Recipes for tile manufacturing developed
over 30 years.
Unique product designs by renowned designers.
C A P I T A L S R E P O R T
Intellectual Capital
Membership of Associations
• Ceylon Chamber of Commerce
• Colombo Stock Exchange
• Sri Lanka Ceramic and Glass Council
• National Chamber of Commerce
• Exporters Association of Sri Lanka
• Employer Federation of Ceylon
• Ceylon National Chamber of Industries
• Italy Business Council
GRI 308-2 302-13308-1

55Integrated Annual Report 2018/19
G O V E R N A N C E R E P O R T
Board of Director’s 56
Senior Management 59
Corporate Governance Report 63
Annual Report of the Board of DirectorsontheaffairsoftheCompany 70
Statements of Directors Responsibility 75
CEO & CFO Responsibility Statement 76
Related Party Transactions Review Committee Report 77
Remuneration Committee Report 78
Audit Committee Report 79
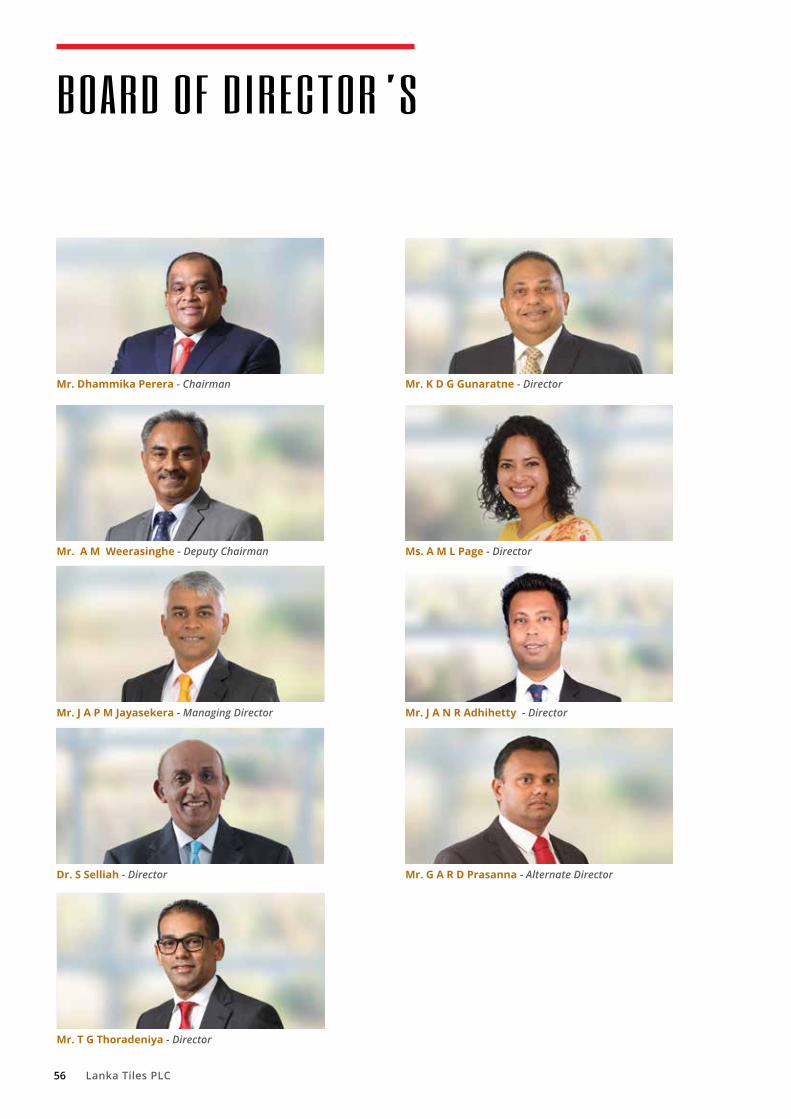
56 Lanka Tiles PLC
BOARD OF DIRECTOR’S
Mr. Dhammika Perera - Chairman
Mr. A M Weerasinghe - Deputy Chairman
Mr. J A P M Jayasekera - Managing Director
Dr. S Selliah - Director
Mr. T G Thoradeniya - Director
Mr. K D G Gunaratne - Director
Ms. A M L Page - Director
Mr. J A N R Adhihetty - Director
Mr. G A R D Prasanna - Alternate Director

57Integrated Annual Report 2018/19
Mr. Dhammika PereraChairman
Mr. Dhammika Perera is the quintessential strategist and business specialist with interests in a variety of key industries including manufacturing, banking & finance, leisure, aluminium extrusion, packaging, plantations, lifestyle, consumer and hydro power generation. He has over thirty years of experience in building formidable business through unmatched strategic foresight.
Mr. Perera is the Chairman of Vallibel One PLC, Royal Ceramics Lanka PLC, Lanka Tiles PLC, Lanka Walltiles PLC, The Fortress Resort PLC, Vallibel Power Erathna PLC, Greener Water Ltd, Uni Dil Packaging Ltd, Delmege Ltd, and LB Microfinance Myanmar Company Ltd. He is the Co- Chairman of Hayleys PLC, The Kingsbury PLC and Singer (Sri Lanka) PLC. Executive Deputy Chairman of LB Finance PLC, Deputy Chairman of Horana Plantations PLC. He is also an Executive Director of Vallibel Finance PLC and serves on the Boards of Amaya Leisure PLC, Haycarb PLC, Hayleys Fabric PLC & Dipped Products PLC.
Mr. A M Weerasinghe Deputy Chairman
Founder of Royal Ceramics Lanka PLC in 1990. A Gem Merchant by profession. Mr. Weerasinghe has been in the business field for more than 35 years involved in Real Estate, Construction, Transportation & Hospital Industry and a Landed Proprietor. In addition to the above, he is also the Chairman of Lanka Ceramic PLC, Singhe Hospitals PLC, and Weerasinghe Property Development (Pvt) Ltd.
Mr. J A P M JayasekeraManaging Director
Mr. Mahendra Jayasekera is the Managing Director of Lanka Walltiles PLC, Lanka Tiles PLC, Swisstek (Ceylon) PLC, Lanka Ceramic PLC and Swisstek Aluminium Limited. He is also a Director of HNB Assurance PLC, Uni Dil Packaging Limited and Uni Dil Packaging Solutions Limited.
Mr. Jayasekera holds a BSc Special (Hons) degree in Business Administration from the University of Sri Jayawardenapura and is a Fellow Member of the Institute of Chartered Accountants of Sri Lanka.
Dr. S SelliahDirector
Dr. Selliah holds an MBBS degree and a Master’s Degree (M.Phil). He has over two decades of diverse experience in varied fields.
Currently he is the Deputy Chairman of Asiri Hospitals Holdings PLC and the Deputy Chairman of Asiri Surgical Hospital PLC. He is a Director of HNB Assurance PLC, Lanka Tiles PLC, Softlogic Holdings PLC , ODEL PLC, Lanka Walltiles PLC, ACL Cables PLC, Lanka Ceramic PLC, Swisstek (Ceylon) PLC and Swisstek Aluminium Pvt Ltd. He is also the Deputy Chairman of Central Hospital (Pvt) Ltd.
Dr. Selliah is also the Chairman of JAT Holdings Pvt Ltd, Cleanco Lanka (Pvt) Ltd, Greensands (Pvt) Ltd and Vydexa (Lanka) Power Corporation (Pvt) Ltd.
He also serves on the following board sub committees of some of the companies listed above as a member or Chairman: Human Resource and Remuneration committee, Related party Transaction committee, Audit committee, Investment committee and Strategic Planning committee
Mr. T G ThoradeniyaDirector
Mr. Tharana Thoradeniya has over two decades of senior management experience in multi-industry scenarios. He sits on the Boards of several public quoted and privately held companies in Sri Lanka, including Pan Asia Banking Corporation PLC, Lanka Walltiles PLC, Lanka Ceramic PLC, Hayleys Fibre PLC, Delmege Ltd, Unidil Packaging Ltd, Vallibel Plantation Management Ltd, Dipped Products (Thailand) Ltd., and several others. He is a Group Director of Royal Ceramics Lanka PLC and CEO/Director of Rocell Bathware Ltd. Mr. Tharana has been credited as a proven business innovator across industries.
A marketer by profession, Tharana was in the pioneering batch of Chartered Marketers of the Chartered Institute of Marketing (UK).
An OverviewManagement Discussion & AnalysisCapitals ReportGovernance ReportFinancial ReportsSupplementary Information

58 Lanka Tiles PLC
Mr. K D G GunaratneDirector
Mr. Gunaratne studied at St. Thomas’ College Mt. Lavinia and was a member of the Western Province Council during the period 1989 to 2009. He currently holds the position of Chairman Lanka Hotels & Residences (Pvt) Ltd and Urban Investments & Development Company (Pvt) Ltd.
He also serves as a Director of Lanka Tiles PLC, Lanka Walltiles PLC, Lanka Ceramic PLC, Dipped Products PLC, Swisstek (Ceylon) PLC, Singer Industries Ceylon PLC and Regnis Lanka PLC and as an Alternate Director at Horana Plantations PLC.
Ms. A M L PageDirector
Ms. Anjalie Page holds a BSc (Hons) Psychology (First Class) from the University of Nottingham, United Kingdom and a MSc in Economics, Finance and Management (Distinction) from the University of Bristol, United Kingdom.
Ms. Page has been employed at several institutions in Sri Lanka and overseas.
Mr. J A N R Adhihetty Director
Mr. Amrith Adhihetty has full membership of CPA, Australia and holds a B Com degree from University of Macquarie, Sydney, Australia.
After completing his studies has worked as a Financial Analyst at Hitachi Data Systems Australia Pty Ltd prior to returning to Sri Lanka.
Mr. Adhihetty has a wide range of experience in business development, financial reporting, business restructuring and marketing with a demonstrated ability to synthesize technical analysis into business insights.
Presently he is attached to Delmege Forsyth & Co. Ltd as Head of Group Strategic Business Development & Planning.
Mr. G A R D PrasannaAlternate Director
Mr. Dimuth Prasanna was appointed as an Alternate Director to the Lanka Tiles Board on 10th October 2014. He is the Chairman of Pan Asia Banking Corporation PLC, Managing Director of Wise Property Solutions Pvt Ltd and also serves as Director on the Boards of
Delmege Limited, Grand Mark Pvt Ltd and Royal Ceramics Lanka PLC.
B O A R D O F D I R E C T O R ’ S

59Integrated Annual Report 2018/19
Mahendra JayasekeraManaging Director
Prabhath PupulewattaFactory Manager
Tyrell RocheGeneral Manager (Finance)
Sajeewani AmarasingheGroup Finance Manager
Nandajith Somaratne Group General Manager Manufacturing
Upul WeerasingheGroup Engineering Manager
Patrick PiyasenaAssistant General Manager (Plant and Technical)
Anura RatnayakeGroup Business Development Manager
Shirley MahendraGeneral Manager (Marketing)
Prasad KeerthiratnaHead of IT
B. A. M. Thilakasiri Group Stores Manager
Kaushalya SudasingheGroup Manager - Sales Administration
SENIOR MANAGEMENTAn OverviewManagement Discussion & AnalysisCapitals ReportGovernance ReportFinancial ReportsSupplementary Information

60 Lanka Tiles PLC
The Board responsible for guiding strategy, providing leadership, managing risk and setting in place a sound governance framework. Such a framework must take in to account the need to carefully balance stakeholder interests to deliver sustainable value to shareholders in the long term. The governance framework set in place facilitates compliance with regulatory requirements and voluntary codes such as the Code of Best Practice on Corporate Governance jointly issued by the Institute of Chartered Accountants of Sri Lanka and the Securities & Exchange Commission.
An Effective Board
As illustrated The Board of Lanka Tiles PLC comprises of 8 members. Board Committees assist the Board in discharging its duties by exercising oversight on matters assigned to the Board through committee charters. Non-Executive Directors submit an annual Declaration of their independence or non- independence as required under the Listing Rules of the Colombo Stock Exchange.
Dr. S Selliah, Mr. K D G Gunaratne and Ms. A M L Page are Directors of Lanka Walltiles PLC, However, given that they are not actively involved in the management of Lanka Walltiles PLC and since they do not directly hold a significant shareholding of Lanka Tiles PLC, the Board is of the view that their independence is not compromised. Accordingly, the Board has determined that Dr. S Selliah, Mr. K D G Gunaratne and Ms. A M L Page are Independent Directors as per the criteria set out in the listing rules of the Colombo Stock Exchange.
CORPORATE GOVERNANCE
Shareholders
Lanka TilesPLC
Board of Directors
Audit Committee
Risk Management
Remuneration Committee
The Chief Executive and Management team
Protect rights
Provides value
Delegates day to day
management
Ensures good risk
management
Ensures Remuneration is
appropriate
Reviews Integrity of financial statements
Electthe
Board
Provides Transparent information
Risk Management Framework
External RegulationsFramework
Independent Audit
Framework
ExternalStakeholdersFramework
Board Composition
Executive Directors
Non-Executive Non-Independent Directors
Independent Non-Executive Directors

61Integrated Annual Report 2018/19
Appointment & Re-election
The appointment of the Board in undertaken by the Board itself, after considering the required Board composition and the strategic input required. All appointments are informed to the SEC as per regulations.
One third of the Directors for the time being shall retire from the office and shall offer themselves for re-election each year by the shareholders.
Board Committees
The Board has delegated some of its functions to Board sub committees,
• Audit Committee • Related Party Transaction Review Committee
• Remunerations Committee
Audit Committee, Remunerations Committee and Related Party Transaction Review Committee are constituted under our parent Lanka Walltiles.
Board Committee & Composition Mandate Further information
Audit Committee
Comprises three non-executive Directors of LWPLC who is the parent company of LTPLC
Mr. J D N Kekulawala (Chairman)Dr. S SelliahMr. T G Thoradeniya
Monitor and supervise management’s financial reporting process in ensuring:1. The integrity of financial statements in accordance with
Sri Lanka Financial Reporting Standards.2. The compliance with legal and regulatory requirements
of Companies Act and other relevant financial reporting related regulations and requirements.
3. The External Auditor’s independence and performance. 4. Review of the adequacy and effectiveness of the
company’s Internal Control and Risk Management systems, over the financial reporting process.
Refer page 79 for Audit Committee Report
Remuneration Committee
Comprises three non-executive Directors of LWPLC
Mr. A M Weerasinghe (Chairman)Mr. K D G GunaratneDr. S Selliah
The Committee focuses on and is responsible for ensuring that the total package is competitive to attract the best talent for the benefit of the Company.
Refer page 78 for Remuneration Committee Report
Related Party Transaction Review Committee
Comprises three non-executive Directors of LWPLC
Dr. S Selliah (Chairman)Mr. J D N KekulawalaMr. T G Thoradeniya
Committee conducts an independent review of all related party transactions to ensure that the Company complies with the rules set out in the Code of Best Practice issued by the SEC.
Refer page 77 for Related Party Transaction Review Committee Report
An OverviewManagement Discussion & AnalysisCapitals ReportGovernance ReportFinancial ReportsSupplementary Information

62 Lanka Tiles PLC
C O R P O R A T E G O V E R N A N C E
Meetings & Attendance
Meetings and attendance at the Board are given below.
Attendance
Board Meetings Audit Committee
Related Party Transactions
Review Committee
Remuneration Committee
Dhammika Perera 5/11 - - -
A M Weerasinghe 11/11 - - 1/1
J A P M Jayasekera 11/11 - - -
Dr. S. Selliah 11/11 5/5 5/5 1/1
T G Thoradeniya 10/11 3/5 3/5 -
K D G Gunaratne 10/11 - - 1/1
A M L Page 7/11 - - -
J A N R Adhihetty 5/11 - - -
G A R D Prasanna (Alternate Director) 11/11 - - -
J D N Kekulawala (Parent Company Board Member) - 5/5 5/5 -
Chairman & Managing Director
The roles of Chairman and Managing Director are separated and the Managing Director is appointed by the Board. He is responsible for implementing strategic plans of the Group and driving performance within a defined framework and is a member of the Board. The Board receives quarterly statements from the Managing Directors confirming compliance with regulatory requirements.
Shareholders
Directors are appointed by shareholders and are accountable to them for performance in line with the Companies Act. The Board recommends suitable candidates for appointment as directors to shareholders. Appointment of auditors is also facilitated by the Board together with the Audit Committee who evaluate the competence, independence and objectivity of the auditors. The Chairman of the Audit Committee, Remuneration Committee and the Related Party Transactions Review Committee and the Auditors attend the Annual General Meetings to respond to queries that may be raised by the shareholders.
Shareholders are informed about the performance of the company through press releases, quarterly financial statements and notices to the Colombo Stock Exchange in accordance with the continued listing rules.

63Integrated Annual Report 2018/19
Compliance with the Code of Best Practice on Corporate Governance issued by the Institute of Chartered Accountants of Sri Lanka in 2017
Code Ref.
Requirement Reference Compliance Status
A Directors
A.1 An effective Board should direct, lead and control the company
A.1.1 Regular meetings, structure and process of submitting information
Refer Meetings and Attendance in Page 62
A.1.2 Role & Responsibilities of the Board
Refer Mandate of the Board in Annual Report of the Board of Directors on the Affairs of the Company- Page 70
A.1.3 Act in Accordance with laws- Independent professional
advice
During the year under review company complied with all the applicable laws, rules and regulations
A.1.4 Access to advise and services of Company Secretary
The services and advice of the Company Secretary M/s. PW Corporate Secretarial (Pvt.) Ltd. is made available to Directors as necessary.
A.1.5 Independent judgement Board comprises mainly of independent professionals who in turn exercise independent judgement in discharging their duties
A.1.6 Dedicate adequate time and effort to matters of the Board and the Company
Regular Board meetings and Sub-Committee meetings are scheduled well in advance and Board papers are circulated a week prior to the meeting giving adequate time to review
A.1.7 Calls for resolutions Resolutions are passed for all board approvals and recorded in minute book
A.1.8 Board induction and Training
All Directors have considerable experience in managing companies and the ceramic industry. Relevant local and foreign training opportunities are made available to all Directors.
A.2 Chairman & Chief Executive Officer
Refer Chairman and Managing Director report in page 16 to 23
A.3. Prepare good corporate governance and facilitate effective discharge of Board functions
During the year, the Chairman conducted 11 Board meetings to maintain close contact with the directors. In addition, informal meetings were with non- executive directors whenever necessary.
A.4 Availability of financial acumen
As page no 57 directors including the Managing Director are experienced finance professionals, the Board is deemed to have a sufficiency of financial acumen.
A.5.1 Majority of Non-Executive Directors
Board composition exceeds the requirement of the Code as seven out of eight Directors are Non-Executives
A.5.2 If only 3 NEDs, they should be independent
The Board comprises of one executive and seven non- executives Directors.
A.5.3 Independence of Directors Independent Directors are independent of management and free of business dealings that may be perceived to materially interfere with the exercise of their unfettered and independent judgement
An OverviewManagement Discussion & AnalysisCapitals ReportGovernance ReportFinancial ReportsSupplementary Information

64 Lanka Tiles PLC
C O R P O R A T E G O V E R N A N C E
Code Ref.
Requirement Reference Compliance Status
A.5.4 Annual declaration by directors
All directors have been made and signed with the company secretary
A.5.5 Annual determination of independence
Board have determined and signed the independence/non independence of all directors.
A.5.6 Alternate Directors Mr. G A R D Prasanna is appointed as the alternate Director to Mr. Dhammika Perera and meets the criteria for and Independent Director
A.5.7 & A.5.8
Senior Independent Directors
There is one senior independent director to advice the board in important matter.
A.5.9 Annual meeting with non Executive Directors
All non executive directors have met and recorded minute.
A.5.10 Recording of dissent in minutes
All dissent of decision are nominated
A.6. Supply of Information
A.6.1 Quality, timely information; Directors should inquire for further information; Chairman ensures board is adequately briefed
The Board papers are circulated a week prior to the Board meetings with an adequate briefing on relevant information
A.6.2 Timelines-Board pack-Board meeting minutes
Relevant board paper pack sent to director with minutes prior to meeting to have adequate information.
A.7 Appointments to the Board & Re-election
Refer appointment and re-election in page 142
A.7.1 Nomination Committee - appointment, terms of reference, members, disclosure,
All new appointments are informed to the CSE as per existing regulations. Appointments are undertaken by the Board of directors.
A.7.2 Annual assessment of Board’s skill and knowledge composition in meeting Bank’s strategic demands
The board skill and knowledge is assessed by the parent company board annually and informed to the directors.
A.7.3 Disclosure of Appointments to the Board
All board appointments are disclosed to CSE
A.8 Directors to submit themselves for re-election
As per the Articles of Association one third of the Directors for the time being shall retire from the office and shall offer themselves for re-election each year by the shareholdersA.8.1 Re-election in accordance
with Companies Act.
A.8.2 Re-election by shareholders
A.8.3 Resignation Board resignations are minuted and disclosed to CSE

65Integrated Annual Report 2018/19
Code Ref.
Requirement Reference Compliance Status
A.9 Appraisal of Board & Committee performance
A.9.1 Formal annual assessment
The Board regularly self-evaluates its performance based on achievement of corporate objectives, implementation of strategy, risk management, internal controls, compliance with laws and stakeholder requirements. In addition, the Remuneration Committee also evaluates the performance of the Board and makes necessary recommendations.
A.9.2 Self-evaluation. Nomination Committee to assess improvements
A.9.3 Review participation, engagement and contribution of each director at Re-election
A.9.4 Disclose evaluation procedure in Annual report
A.10 Annual Report to disclose specified information regarding Directors
Profiles of Directors – Page 57
A.11 Annual appraisal of the CEO
The CEO is evaluated each year by the Board against the yearly targets that has been agreed with the annual budget and corporate requirements.A.11.1 Predefined targets
A.11.2 Year end appraisal
B. Directors’ Remuneration
B.1 Establish process for developing policy on executive and director remuneration.
B.1.1 Set up a Remuneration Committee
Refer Remunerations Committee Report in Page 78. Directors emoluments in note 22 in page 123
Key management personal compensation in note 29 Page 128
Professional advice for Audit/Technical and legal obtained
B.1.2 Composition of Remuneration Committee
B.1.3 Disclosure of members of Remuneration Committee
B.1.4 Remuneration of Non Executive Directors
B.1.5 Access to Professional advice
B.2 Level & Make Up of Remuneration
B.2.1&B.2.2
Executive Remuneration sufficient to attract, retain and motivate and Promote long term success The Company
Remuneration levels have been designed to attract, retain and motivate Directors and Senior Management needed to run the Company successfully., while remaining within the industry standards and Annual performance approved B.2.3 Market rates
B.2.4 Group Remuneration
B.2.5 Remuneration performance related
B.2.6 ESOP Company does not have a ESOP
An OverviewManagement Discussion & AnalysisCapitals ReportGovernance ReportFinancial ReportsSupplementary Information
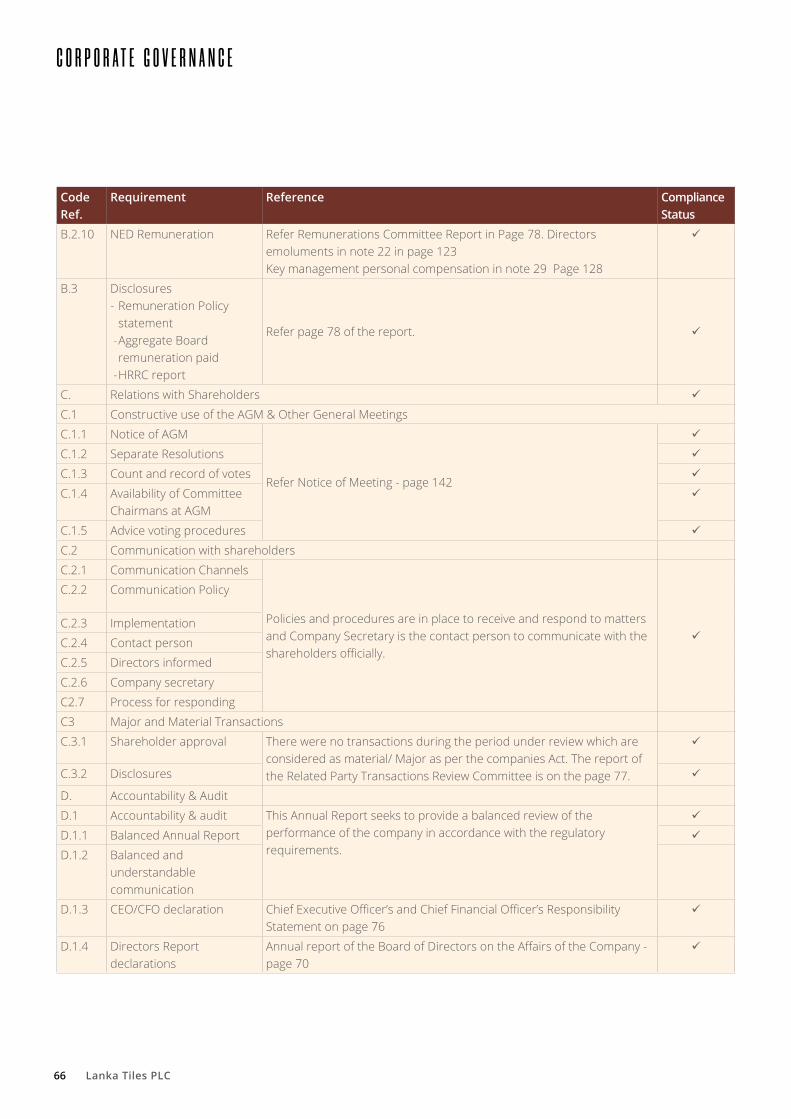
66 Lanka Tiles PLC
C O R P O R A T E G O V E R N A N C E
Code Ref.
Requirement Reference Compliance Status
B.2.10 NED Remuneration Refer Remunerations Committee Report in Page 78. Directors emoluments in note 22 in page 123 Key management personal compensation in note 29 Page 128
B.3 Disclosures- Remuneration Policy
statement - Aggregate Board
remuneration paid - HRRC report
Refer page 78 of the report.
C. Relations with Shareholders
C.1 Constructive use of the AGM & Other General Meetings
C.1.1 Notice of AGM
Refer Notice of Meeting - page 142
C.1.2 Separate Resolutions
C.1.3 Count and record of votes
C.1.4 Availability of Committee Chairmans at AGM
C.1.5 Advice voting procedures
C.2 Communication with shareholders
C.2.1 Communication Channels
Policies and procedures are in place to receive and respond to matters and Company Secretary is the contact person to communicate with the shareholders officially.
C.2.2 Communication Policy
C.2.3 Implementation
C.2.4 Contact person
C.2.5 Directors informed
C.2.6 Company secretary
C2.7 Process for responding
C3 Major and Material Transactions
C.3.1 Shareholder approval There were no transactions during the period under review which are considered as material/ Major as per the companies Act. The report of the Related Party Transactions Review Committee is on the page 77.C.3.2 Disclosures
D. Accountability & Audit
D.1 Accountability & audit This Annual Report seeks to provide a balanced review of the performance of the company in accordance with the regulatory requirements.
D.1.1 Balanced Annual Report
D.1.2 Balanced and understandable communication
D.1.3 CEO/CFO declaration Chief Executive Officer’s and Chief Financial Officer’s Responsibility Statement on page 76
D.1.4 Directors Report declarations
Annual report of the Board of Directors on the Affairs of the Company - page 70

67Integrated Annual Report 2018/19
Code Ref.
Requirement Reference Compliance Status
D.1.5 Financial reporting -statement on board responsibilities,
Statement on internal control
Directors’ Responsibility for Financial Reporting on page 75
Directors’ Statement on Internal Control on page 32
D.1.6 Management Discussion & Analysis –
Capital reports/ business line reports - pages 40 to 54
D.1.7 Net Assets < 50% In the unlikely event of the net assets of the company falling below 50% of Shareholders Funds the Board will summon an Extraordinary General Meeting (EGM)to notify the shareholders of the position and to explain the remedial action being taken
D.1.8 Related Party Transactions Refer Report on page 77
D.2 Risk Management & Internal Control
Principal Risks in Page 31
D.2.1 Monitor, review and report risk and internal control systems
Report of the Audit Committee in page 79
D.2.2 Confirm assessment and risks identified and mitigated
Refer page 31
D.2.3 Internal audit function Refer Audit Committee report on page 79
D.2.4 Board responsibilities for disclosure
Refer Annual Report of the Board of Directors – page 70
D.2.5 Directors responsibility internal control system
D.3 Audit Committee Refer Audit Committee Report on Page 79
D.4 Related Party Transactions Review Committee
Refer Related Party Transaction Review Committee on page 77
D.5 Code of Business Conduct and Ethics
The Board of Directors have adopted the The Code of Best Practice issued by the Institute of Chartered Accountants of Sri Lanka and the Securities Exchange Commission
D.5.1 Board declaration for compliance with Code
Refer page 69
D.5.2 Price sensitive information Disclose to CSE
D.5.3 Monitor Share purchase by Directors/ KMPs
Disclose to CSE
D.5.4 Chairman’s statement Chairman’s message in Page 17
An OverviewManagement Discussion & AnalysisCapitals ReportGovernance ReportFinancial ReportsSupplementary Information

68 Lanka Tiles PLC
C O R P O R A T E G O V E R N A N C E
Code Ref.
Requirement Reference Compliance Status
D.6 Corporate Governance Disclosures
Refer,Annual Report of the Board of Directors on the Affairs of the Company - Page 70Corporate Governance Report Page 57 and Annexes on pages 63 to 69
E Institutional and other Investors
Shareholders are encouraged to participate at the AGM and vote on matters set before themE.1 Shareholder voting
E.1.1 Institutional investors
E.2 Evaluation of Governance Disclosures
The Annual Report describes the corporate governance process.
F. Other investors The Annual Report contains sufficient information to make an informed decision. The report is hosted in Colombo Stock Exchange website with the quarterly reports to facilitate investors and shareholders to make informed decisions.
F.1 Investing /divesting decision
Shareholder are encouraged to carry out analysis prior to investing or divesting. A dedicated Investor Relations website, timely announcements to the CSE and quarterly and annual financial reporting support investor analysis.
G. Internet of Things & Cybersecurity
The Company has implemented a cybersecurity policy and have robust cybersecurity risk management process and has a designated Chief Information Security Officer in place
G.1 Identify connectivity and related cyber risks
G.2 Appoint a CISO and allocate budget to implement a cybersecurity policy
G.3 Include cyber security in Board agenda
G.4 Obtain periodic assurance to review effectiveness of cybersecurity risk management
G.5 Disclosures in Annual Report
H. Environment, Society & Governance Refer value creation report from pages 24 to 54.
H.1 ESG Reporting
Principle 1 - Reporting of Economic Sustainability
Refer Financial Capital in page 42
Principle 2 - Reporting on the Environment (Impact on Environment)
Refer Natural Capital in page 52

69Integrated Annual Report 2018/19
Code Ref.
Requirement Reference Compliance Status
Principle 3 - Reporting on Labour Practices (Human Capital)
Refer Human Capital Report in page 45
Principle 4 - Reporting on Society (Social Impact)
Refer Social capital Report in page
Principle 5 - Reporting on Product Responsibility (Social and Network Capital)
Refer Social and relationship Capital on page 48
Principle 6 - Reporting on Stakeholder identification, engagement and effective communication (Stakeholder Engagement)
Refer corporate Governance report page 26
Principle 7 - Sustainable reporting to be formalised as part of the reporting process and to take place regularly (About this Report)
Refer GRI Index in page 81 to 84
STATEMENT OF COMPLIANCE
From the above mentioned details it can be concluded that the Company is fully compliant with the requirements of the Code of Best Practice on Corporate Governance issued jointly by the Institute of Chartered Accountants of Sri Lanka and the Securities and Exchange Commission of Sri Lanka in 2017 and the Corporate Governance Rules of Colombo Stock Exchange.
Further, the Board confirms that all statutory payments due to the Government, other regulatory institutions and to employees, have been made on time.
Therefore the Board concludes and declares that the Company is fully compliant to with the Corporate Governance Codes of Institute of Chartered Accountants of Sri Lanka, Securities and Exchange Commission and Corporate Governance Rules of Colombo Stock Exchange has in place a robust Corporate Governance Framework to govern the business.
Dhammika Perera J A P M Jayasekera Chairman Managing Director
An OverviewManagement Discussion & AnalysisCapitals ReportGovernance ReportFinancial ReportsSupplementary Information
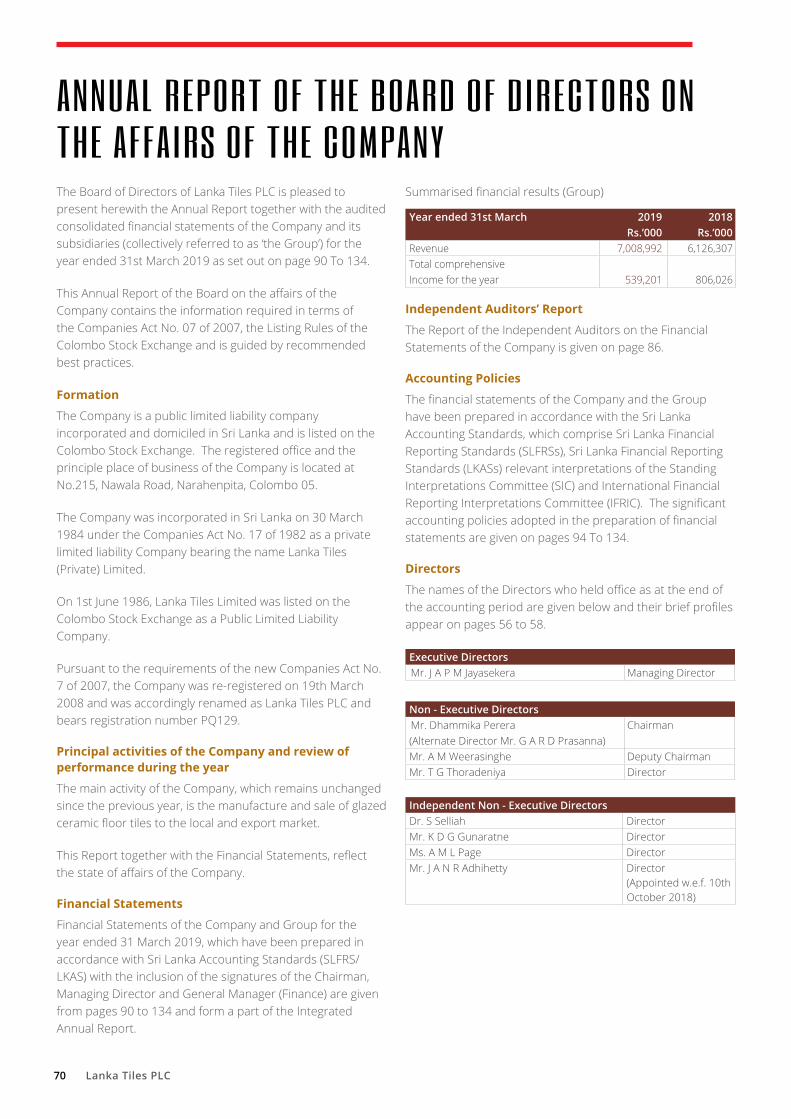
70 Lanka Tiles PLC
The Board of Directors of Lanka Tiles PLC is pleased to present herewith the Annual Report together with the audited consolidated financial statements of the Company and its subsidiaries (collectively referred to as ‘the Group’) for the year ended 31st March 2019 as set out on page 90 To 134.
This Annual Report of the Board on the affairs of the Company contains the information required in terms of the Companies Act No. 07 of 2007, the Listing Rules of the Colombo Stock Exchange and is guided by recommended best practices.
Formation
The Company is a public limited liability company incorporated and domiciled in Sri Lanka and is listed on the Colombo Stock Exchange. The registered office and the principle place of business of the Company is located at No.215, Nawala Road, Narahenpita, Colombo 05.
The Company was incorporated in Sri Lanka on 30 March 1984 under the Companies Act No. 17 of 1982 as a private limited liability Company bearing the name Lanka Tiles (Private) Limited.
On 1st June 1986, Lanka Tiles Limited was listed on the Colombo Stock Exchange as a Public Limited Liability Company.
Pursuant to the requirements of the new Companies Act No. 7 of 2007, the Company was re-registered on 19th March 2008 and was accordingly renamed as Lanka Tiles PLC and bears registration number PQ129.
Principal activities of the Company and review of performance during the year
The main activity of the Company, which remains unchanged since the previous year, is the manufacture and sale of glazed ceramic floor tiles to the local and export market.
This Report together with the Financial Statements, reflect the state of affairs of the Company.
Financial Statements
Financial Statements of the Company and Group for the year ended 31 March 2019, which have been prepared in accordance with Sri Lanka Accounting Standards (SLFRS/LKAS) with the inclusion of the signatures of the Chairman, Managing Director and General Manager (Finance) are given from pages 90 to 134 and form a part of the Integrated Annual Report.
ANNUAL REPORT OF THE BOARD OF DIRECTORS ON THE AFFAIRS OF THE COMPANY
Summarised financial results (Group)
Year ended 31st March 2019 2018Rs.’000 Rs.’000
Revenue 7,008,992 6,126,307Total comprehensiveIncome for the year 539,201 806,026
Independent Auditors’ Report
The Report of the Independent Auditors on the Financial Statements of the Company is given on page 86.
Accounting Policies
The financial statements of the Company and the Group have been prepared in accordance with the Sri Lanka Accounting Standards, which comprise Sri Lanka Financial Reporting Standards (SLFRSs), Sri Lanka Financial Reporting Standards (LKASs) relevant interpretations of the Standing Interpretations Committee (SIC) and International Financial Reporting Interpretations Committee (IFRIC). The significant accounting policies adopted in the preparation of financial statements are given on pages 94 To 134.
Directors
The names of the Directors who held office as at the end of the accounting period are given below and their brief profiles appear on pages 56 to 58.
Executive DirectorsMr. J A P M Jayasekera Managing Director
Non - Executive DirectorsMr. Dhammika Perera Chairman(Alternate Director Mr. G A R D Prasanna)Mr. A M Weerasinghe Deputy ChairmanMr. T G Thoradeniya Director
Independent Non - Executive DirectorsDr. S Selliah DirectorMr. K D G Gunaratne DirectorMs. A M L Page DirectorMr. J A N R Adhihetty Director
(Appointed w.e.f. 10th October 2018)

71Integrated Annual Report 2018/19
Mr. Dhammika Perera and Mr. K D G Gunaratne retire by rotation at the conclusion of the Annual General Meeting in terms of Articles 103 and 104 of the Articles of Association and being eligible are recommended by the Directors for re-election.
Mr. J A N R Adhihetty who was appointed to the Board on 10th October 2018, retires under Article 110 of the Articles of Association, and being eligible, has offered himself for re-election as recommended by the Board of Directors.
Directors of the subsidiary Company
Beyond Paradise Collection LtdMr. M H JamaldeenMr. K D H PereraMr. J A P M Jayasekera
Lankatiles Private LimitedMr. A.M WeerasingheMr. J A P M JayasekeraMr. Fatheraj SinghviMr. Praveen Kumar Singhvi
LTL Development (Pvt) LtdMr. K.D.A PereraMr. J.A.P.M Jayasekara
Interests Register
The Company maintains an Interests Register in terms of the Companies Act, No. 7 of 2007, which is deemed to form part and parcel of this Annual Report and available for inspection upon request.
All related party transactions which encompasses the transactions of Directors who were directly or indirectly interested in a contract or a related party transaction with the Company during the accounting period are recorded in the Interests Register in due compliance with the applicable rules and regulations of the relevant Regulatory Authorities.
The Directors declare that the Company is in compliance with Section 9 of the Listing Rules of the Colombo Stock Exchange pertaining to Related Party Transactions during the financial year ended 31st March 2019.include the sec 9.3 c part 2
The relevant interests of Directors in the shares of the Company as at 31st March 2019 as recorded in the Interests Register are given in this Report under Directors’ shareholding.
Directors’ Remuneration
The Directors’ remuneration is disclosed under key management personnel compensation in Note 29 to the Financial Statements on page 128.
Directors’ Interests in Contracts
The Directors have no direct or indirect interest in any other contract or proposed contract with the Company. The Company carried out transactions during the year in the ordinary course of its business at commercial rates with the related entities.
Directors’ responsibility for Financial Reporting
The Directors are responsible for the preparation of Financial Statements of the Company to reflect a true and fair view of the state of its affairs. The Directors are of the view that these financial statements have been prepared in conformity with the requirements of the Sri Lanka Accounting Standards, the Companies Act No.7 of 2007 and the Listing Rules of the Colombo Stock Exchange.
Independent Auditors
Messrs PricewaterhouseCoopers, Chartered Accountants served as the Auditors during the year under review and also provided non audit/ consultancy services. They do not have any interest in the Company other than that of Auditor and provider of tax related services.
A total amount of Rs. 1,779,000 (2018 – Rs.1,658,000/-) is payable by the Company to the Auditors for the year under review comprising Rs. 886,000 (2018 – Rs.805,000/-) as audit fees and Rs. 893,000 (2018 – Rs.853,000/-) for non audit services.
The Auditors have expressed their willingness to continue in office. The Audit Committee at a meeting held on 23rd May 2019 recommended that they be re-appointed as Auditors. A resolution to re-appoint the Auditors and to authorise the Directors to determine their remuneration will be proposed at the Annual General Meeting.
Stated Capital
The Stated Capital of the Company is Rs.900,967,696/- (2018 - Rs.900,967,696/-)
The number of shares issued by the Company stood at 53,050,410 fully paid ordinary shares as at 31st March 2019 (which was the same as at 31st March 2018).
An OverviewManagement Discussion & AnalysisCapitals ReportGovernance ReportFinancial ReportsSupplementary Information
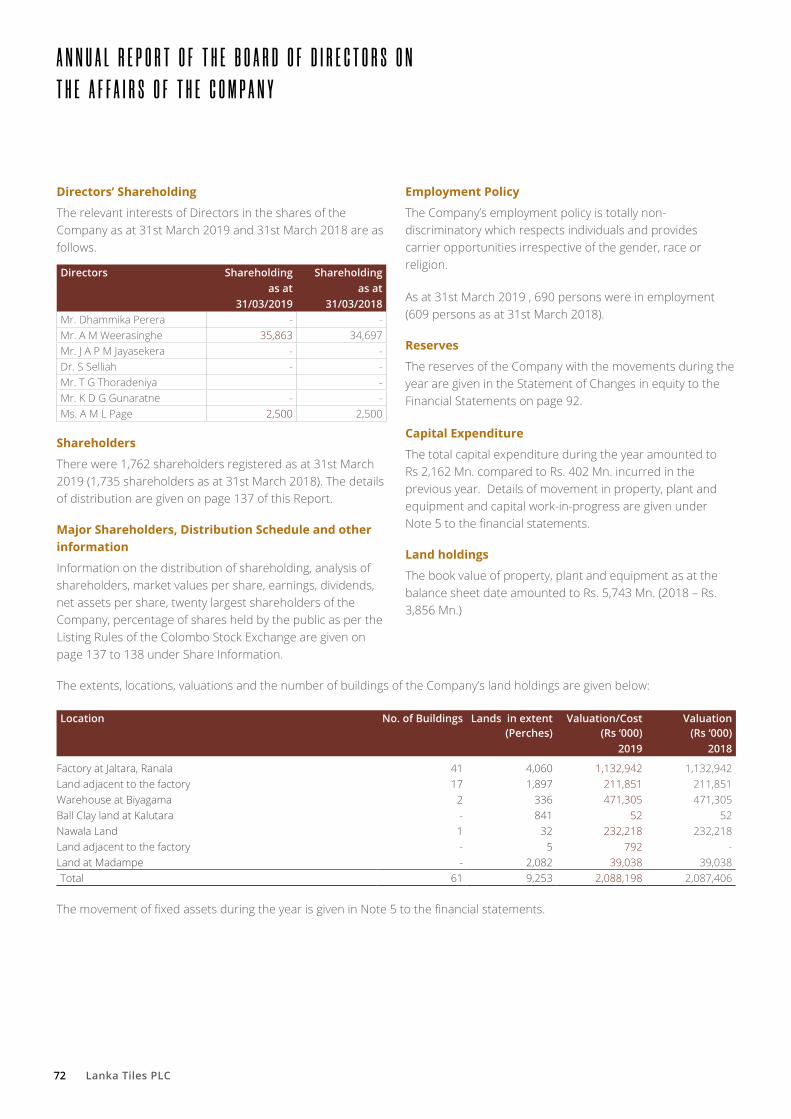
72 Lanka Tiles PLC
A N N U A L R E P O R T O F T H E B O A R D O F D I R E C T O R S O N T H E A F F A I R S O F T H E C O M P A N Y
Directors’ Shareholding
The relevant interests of Directors in the shares of the Company as at 31st March 2019 and 31st March 2018 are as follows.
Directors Shareholding Shareholdingas at as at
31/03/2019 31/03/2018Mr. Dhammika Perera - -Mr. A M Weerasinghe 35,863 34,697Mr. J A P M Jayasekera - -Dr. S Selliah - -Mr. T G Thoradeniya -Mr. K D G Gunaratne - -Ms. A M L Page 2,500 2,500
Shareholders
There were 1,762 shareholders registered as at 31st March 2019 (1,735 shareholders as at 31st March 2018). The details of distribution are given on page 137 of this Report.
Major Shareholders, Distribution Schedule and other information
Information on the distribution of shareholding, analysis of shareholders, market values per share, earnings, dividends, net assets per share, twenty largest shareholders of the Company, percentage of shares held by the public as per the Listing Rules of the Colombo Stock Exchange are given on page 137 to 138 under Share Information.
Employment Policy
The Company’s employment policy is totally non-discriminatory which respects individuals and provides carrier opportunities irrespective of the gender, race or religion.
As at 31st March 2019 , 690 persons were in employment (609 persons as at 31st March 2018).
Reserves
The reserves of the Company with the movements during the year are given in the Statement of Changes in equity to the Financial Statements on page 92.
Capital Expenditure
The total capital expenditure during the year amounted to Rs 2,162 Mn. compared to Rs. 402 Mn. incurred in the previous year. Details of movement in property, plant and equipment and capital work-in-progress are given under Note 5 to the financial statements.
Land holdings
The book value of property, plant and equipment as at the balance sheet date amounted to Rs. 5,743 Mn. (2018 – Rs. 3,856 Mn.)
The extents, locations, valuations and the number of buildings of the Company’s land holdings are given below:
Location No. of Buildings Lands in extent (Perches)
Valuation/Cost (Rs ‘000)
Valuation (Rs ‘000)
2019 2018
Factory at Jaltara, Ranala 41 4,060 1,132,942 1,132,942Land adjacent to the factory 17 1,897 211,851 211,851Warehouse at Biyagama 2 336 471,305 471,305Ball Clay land at Kalutara - 841 52 52Nawala Land 1 32 232,218 232,218Land adjacent to the factory - 5 792 -Land at Madampe - 2,082 39,038 39,038Total 61 9,253 2,088,198 2,087,406
The movement of fixed assets during the year is given in Note 5 to the financial statements.

73Integrated Annual Report 2018/19
Dividends
An interim dividend of Rs. 3/15 per share for the year ended 31st March 2019 was paid on 12th April 2019.
Substantial Shareholdings
The Company is controlled by Lanka Walltiles PLC which holds 68.2% of the issued share capital of the Company. Lanka Walltiles PLC itself is a subsidiary of Royal Ceramics PLC of which the ultimate parent Company is Vallibel One PLC.
Investments
Details of the Company’s quoted and unquoted investments as at 31st March 2019 are given in Notes 07 and 08 to the Financial Statements on pages 110 to 111
Public Holding
28.275% (2018 – 28.27) of the issued shares of the Company are widely held by the public
Donations
The company made donations amounting to Rs. 1,722,729 (2018 - Rs. 977,763) in total, during the year under review.
Risk Management
An ongoing process is in place to identify and manage the risks that are associated with the business and operations of the Company. The Directors review this process through the Audit Committee.
Specific steps taken by the Company in managing the risks are detailed in the section on Risk Management on pages 31and 32.
Statutory Payments
The Directors confirm that to the best of their knowledge, all taxes, duties and levies payable by the Company, all contributions, levies and taxes payable on behalf of, and in respect of employees of the Company and all other known statutory dues as were due and payable by the Company as at the Balance Sheet date have been paid or, where relevant provided for, except for certain assessments where appeals have been lodged.
Contingent Liabilities
Except as disclosed in Note 30 to the Financial Statements on page 130, there were no material Contingent Liabilities as at the Balance Sheet date.
Events after the Reporting Period
As disclosed in Note 33 to the financial statements there are no material events as at the date of the auditor’s report which require adjustment to or disclosure in the financial statements.
Corporate Governance
The Board of Directors confirm that the Company is compliant with section 7.10 of the Listing Rules of the CSE.
The Audit Committee, Remuneration Committee and a Related Party Transaction Review Committee of Lanka Walltile function as Board sub committees, with Directors who possess the requisite qualifications and experience. The composition of the said committees is as follows.
Audit Committee
Mr. J D N Kekulawala - Chairman
Dr. S Selliah
Mr. T G Thoradeniya
Remuneration Committee
Mr. A M Weerasinghe - Chairman
Mr. K D G Gunaratne
Dr. S Selliah
Related Party Transaction Review Committee
Dr. S Selliah - Chairman
Mr. J D N Kekulawala
Mr. T G Thoradeniya
The Corporate Governance of the Company is reflected in its strong belief in protecting and enhancing stakeholder value in a sustainable manner, supported by a sound system of policies and practices. Prudent internal controls ensure professionalism, integrity and commitment of the Board of Directors, Management and employees.
The Corporate Governance Statement on pages 61 to 69 explains the measures adopted by the Company during the year.
Corporate Social Responsibility
The Company continued its Corporate Social Responsibility Programme, details of which are set out on pages 15 and 49 of this Report.
An OverviewManagement Discussion & AnalysisCapitals ReportGovernance ReportFinancial ReportsSupplementary Information

74 Lanka Tiles PLC
A N N U A L R E P O R T O F T H E B O A R D O F D I R E C T O R S O N T H E A F F A I R S O F T H E C O M P A N Y
Environmental Protection
After making adequate enquiries from the management, the Directors are satisfied that the Company operates in a manner that minimizes the detrimental effects on the environment and provides products and services that have a beneficial effect on the customers and the communities within which the Company operates.
Going Concern
The financial statements are prepared on a going concern principles. After making adequate enquires from the management, the Directors are satisfied that the Company has adequate resources to continue its operations in the foreseeable future.
Annual General Meeting
The Notice of the Thirty Fifth (35th) Annual General Meeting appears on page 142.
This Annual Report is signed for and on behalf of the Board of Directors by
Dhammika Perera J A P M Jayasekera
Chairman Managing Director
P W Corporate Secretarial (Pvt) LtdSecretaries
06th June 2019

75Integrated Annual Report 2018/19
STATEMENT OF DIRECTORS’ RESPONSIBILITYThe Directors are required by the Companies Act, No. 7 of 2007 to prepare financial statements for each financial year, which give a true and fair view of the statement of affairs of the Company as at the end of the financial year and the income and expenditure of the Company for the financial year.
The Directors are also responsible to ensure that the financial statements comply with any regulations made under the Companies Act which specifies the form and content of financial statements and any other requirements which apply to the Company’s financial statements under any other law.
The Directors consider that the financial statements presented in this Annual Report have been prepared using appropriate accounting policies, consistently applied and supported by reasonable and prudent judgments and estimates and is in compliance with the Sri Lanka Accounting Standards, Companies Act, No. 7 of 2007, Sri Lanka Accounting and Auditing Standards Act No. 15 of 1995.
The Directors are responsible for ensuring that the Company keeps sufficient accounting records, which disclose the financial position of the Company with reasonable accuracy and enable them to ensure that the financial statements have been prepared and presented as aforesaid. They are also responsible for taking measures to safeguard the assets of the Company and in that context to have proper regard to the establishment of appropriate systems of internal control with a view to prevention and detection of fraud and other irregularities.
The Directors continue to adopt the going concern basis in preparing the financial statements. The Directors, after making inquiries and review of the Company’s Business Plan for the financial year 2018/2019, including cash flows and borrowing facilities, consider that the Company has adequate resources to continue in operation.
By Order of the BoardLANKA TILES PLC
P W Corporate Secretarial (Pvt) Ltd
Secretaries
06th June 2019
An OverviewManagement Discussion & AnalysisCapitals ReportGovernance ReportFinancial ReportsSupplementary Information

76 Lanka Tiles PLC
C H I E F E X E C U T I V E O F F I C E R ’ S A N D C H I E F F I N A N C I A L O F F I C E R ’ S R E S P O N S I B I L I T Y S T A T E M E N TThe financial statements are prepared in compliance with the Sri Lanka Accounting Standards issued by the Institute of Chartered Accountants of Sri Lanka and the requirements of the Companies Act No. 7 of 2007 and any other applicable statues to the extent applicable to the Company. There are no departures from the prescribed accounting standards in their adoption. The accounting policies used in the preparation of the financial statements are appropriate and are consistently applied, except where otherwise stated in the notes accompanying the financial statements.
The Board of Directors and the management of your Company accept responsibility for the integrity and objectivity of these financial statements. The estimates and judgments relating to the financial statements were made on a prudent and reasonable basis, in order that the financial statements reflect in a true and fair manner, the form and substance of transactions, and reasonably presents the Company’s state of affairs. To ensure this, the Company has taken proper and sufficient care in installing a system of internal control and accounting records, for safeguarding assets, and for preventing and detecting frauds as well as other irregularities, which is reviewed, evaluated and updated on an ongoing basis.
Our internal auditors have conducted periodic audits to provide reasonable assurance that the established policies and procedures of the Company were consistently followed. However, there are inherent limitations that should be recognised in weighing the assurance provided by any system of internal controls and accounting.
The financial statements were audited by M/s. PricewaterhouseCoopers, Chartered Accountants, the independent auditors. The independency of the external auditor has been assessed by the audit committee and the Board and have been determined as independent.
The Audit Committee of your Company meets periodically with the internal auditors and the external auditors to review the manner in which these auditors are performing their responsibilities, and to discuss auditing, internal control and financial reporting issues. To ensure complete independence, the external auditors and the internal auditors have full and free access to the members of the Audit Committee to discuss any matter of substance.
It is also declared and confirmed that the Company has complied with and ensured compliance by the auditors with the guidelines for the audit of Listed Companies.
It is also confirmed that the Company is compliant with the Code of Best Practice in Corporate Governance issued by the Institute of Chartered Accountants of Sri Lanka and the Code of Best Practice on Related Party Transactions issued by the Securities and Exchange Commission of Sri Lanka.
B T T Roche General Manager - Finance
J A P M Jayasekera Managing Director
06th June 2019

77Integrated Annual Report 2018/19
R E L A T E D P A R T Y T R A N S A C T I O N S R E V I E W C O M M I T T E E R E P O R T
An OverviewManagement Discussion & AnalysisCapitals ReportGovernance ReportFinancial ReportsSupplementary Information
The Related Party Transactions Review Committee (RPTRC) of the Company was formed by the Board in January 2016 in accordance with Section 9 of the Listing Rules of the Colombo Stock Exchange to ensure compliance with those Rules facilitating independent review, approval and oversight of Related Party Transactions of the Company.
PURPOSE OF THE COMMITTEEThe purpose of the RPTRC of the Company is to conduct an independent review approval and oversight of all related party transactions of Lanka Tiles PLC and to ensure that the Company complies with the rules set out in the Listing Rules. The primary objectives of the said rules are to ensure that the interests of the shareholders as a whole are taken into account when entering into related party transactions, and to prevent Directors, key management personnel or substantial shareholders from taking advantage of their positions. To exercise this purpose the Committee has adopted the related party transaction Policy which contains the company’s Policy governing the review, approval and oversight of related party transactions.
RESPONSIBILITIES OF THE RELATED PARTY TRANSACTIONS REVIEW COMMITTEEThe following are key responsibilities have been set out in the Charter for RPTRC;
a) Ensure that the Company complies with the rules set out in the Listing Rules
b) Subject to the exceptions given in the Listing Rules, review, in advance all proposed related party transactions
c) Perform other activities related to the Charter as requested by the Board
d) Have meetings every fiscal quarter and report to the Board on the Committee’s activities
e) Share information with the Audit Committee as necessary and appropriate, to permit the Audit Committee to carry out its statutory, regulatory and other responsibilities with regard to related party transactions.
f) Review the Charter and Policy at least annually and recommend amendments to the Charter and Policy to the Board as and when determined to be appropriate by the Committee.
COMPOSITION OF THE COMMITTEEThe Related Party Transactions Review Committee comprises of the following three non-executive Directors of Lanka Walltiles PLC who is the parent company of LTPLC.
1. Dr. S Selliah – Chairman2. Mr. J D N Kekulawala3. Mr. T G Thoradeniya
The Managing Director and the General Manager - Finance attend meetings by invitation and the Company Secretary functions as the Secretary to the Committee.
The Committee members possess vast experience in business management and financial expertise to perform the duty of the Committee successfully.
MEETINGSThe Committee held five meetings during the year.
The attendance of the members at the meeting is as follows.
Mr. J D N Kekulawala - 5/5Dr. S Selliah - 5/5Mr. T G Thoradeniya - 3/5
The minutes of the Committee meeting were tabled at Board meeting, for the review of the Board.
PROCEDURES FOR REPORTING RPT’SThe Managing Director (MD) is responsible for reporting to the Committee, for its review and approval the information set out under Rule 30 of the Code at the minimum, in respect of each related party transaction proposed to be entered into other than the exceptions given in Rule 27 of the code. Moreover, on a quarterly basis, the MD is required to report to the Committee on the approved related party transactions actually entered into by the Company.
The Committee has approved the Related Party Transactions Declaration Form required to be filled by the Directors and key management personnel of the Company. The Company uses this form to capture the related party transactions at the end of every quarter.
REVIEW OF RELATED PARTY TRANSACTIONSThe Committee reviewed all related party transactions of the Company for the financial year 2018/19 has communicated the comments and observation to the Board of Directors. In terms of Rule 9.3.2 of the Listing Rules of the Colombo Stock Exchange on related party transactions, there were no one-recurrent related party transactions entered into during the course of the financial year aggregative value of which exceeded the lower of 10% of the equity or 5% of the assets. There were no recurrent related party transactions carried out during the financial year ended 31st March 2019, the aggregate value of which exceeded 10% of the revenue.
In the opinion of the Committee, the terms of these transactions were not more favourable to the related parties than those generally available to the public. The details of related party transactions entered into during the year are given in Note 29 to the Financial Statements, on pages 125 to 129 of this Annual Report.
DECLARATIONA declaration by the Board of Directors on compliance with the rules pertaining to Related Party Transactions appears on the report of the Board of Directors on pages 70 of this Annual Report.
Dr. S SelliahChairman - Related Party Transactions Review Committee
06th June 2019

78 Lanka Tiles PLC
R E M U N E R A T I O N C O M M I T T E E R E P O R T
Role of the Remuneration Committee
The Remuneration Committee is a sub - committee of the main Board, to which it is accountable. The Committee evaluates the performance of the Board, the Chief Executive Officer, Key Management Personal and executive staff against the set objectives and goals, and determines the remuneration policy of the Company for all levels of employees. The Committee supports and advises the Board on remuneration and remuneration related matters and makes decisions under delegated authority with a view to aligning the interests of employees and shareholders.
Composition of the Remuneration Committee
The Remuneration Committee comprises of the following three non-executive Directors of Lanka Walltiles PLC who is the parent company of LTPLC.
Mr. A M WeerasingheChairman of the Remuneration Committee
Mr. K D G GunaratneCommittee Member
Dr. S SelliahCommittee Member
The Managing Director attends the Committee meeting by invitation. The Company secretary is the secretary of the Remuneration Committee.
The above Committee members possess vast experience in the fields of Business Management, Human Resources Management, Labour Relations and Labour Law. Hence the Committee has adequate expertise in remuneration policy and business management to deliberate and propose necessary changes and improvements to meet the roles and responsibility of the Committee.
Meetings
The Remuneration Committee met once for the year where all members participated.
Functions performed by the Remuneration Committee
a. Evaluating and recommending the remuneration payable to the Board, Managing Director and the Key Management Personal of the Company to the Board to make the final determination. Based on that, the aggregate remuneration paid to Executive and Non Executive Directors for last financial year is given on Page 128 of the Annual Report under key management remuneration.
b. Ensuring that the Board complies with the Companies Act in relation to Directors remunerations, especially the requirements of section 216. And it also ensures that employees are adequately compensated based on their performance and contribution for the period under review and future potential.
c. Constructing a specific remuneration policy and remuneration framework that enables the Company to attract and retain a high quality and representative staff in its operations and do this inter alia with reference to appropriate market rates where these are relevant, and benchmarking specific categories where required.
d. Ensuring internal equity and fairness in and between the various pay categories and building incentives in the cost of employment structure to encourage and reward excellent performance, on objectively defined criteria.
e. Ensuring that staff costs are within the budget set by the Board, and are sustainable over time.
Conclusion
The Committee is satisfied that it has performed the responsibilities that were delegated to it by the Board for the year under review and the necessary objectives were achieved for the year under review.
A M WeerasingheChairman of the Remuneration Committee
06th June 2019

79Integrated Annual Report 2018/19
A U D I T C O M M I T T E E R E P O R T
Role of the Audit Committee
The Audit Committee is a Sub Committee of the main Board to which it is accountable. The function of the Audit Committee is defined in the Audit Committee Charter. Primarily it is to assist the Board in its oversight of the integrity of the Financial Statements of the Company, to assess the adequacy of the risk management framework of the Company, assess the independence and the performance of the Company’s external audit function and internal audit functions, and review compliance of the Company with legal and regulatory requirements.
Composition of the Audit Committee
The Audit Committee comprised of the following three Directors of Lanka Walltiles PLC who is the parent company of Lanka Tiles PLC.
Mr. J D N KekulawalaChairman - Independent Non-Executive Director
Dr. S SelliahCommittee Member - Independent Non-Executive Director
Mr. T G ThoradeniyaCommittee Member - Non-Executive Director
The Managing Director and the General Manager - Finance attend the meetings at the invitation of the Audit Committee.
The Company Secretary functions as the Secretary to the Audit Committee. Representatives of the Company, external auditors and internal auditors also attend Audit Committee meetings by invitation.
The Audit Committee has the required expertise in finance, law and business management to deliberate Audit Committee matters and recommend necessary action to be taken.
Meetings
The Audit Committee met 05 times during the year. The attendance of the members at the meeting is as follows.
Mr. J D N Kekulawala - 5/5Dr. S Selliah - 5/5Mr. T G Thoradeniya - 3/5
Functions performed by the Audit Committee
a. The Committee reviewed the provisional financial statements that were published for financial year 2018/19 and the Annual Report of 2018/19. It reviewed the preparation, presentation and adequacy of disclosures in the financial statements of the Company, in accordance with Sri Lanka Accounting Standards and SLFRS. It also reviewed the Company’s compliance with financial reporting requirements, information requirements of the Companies Act and other relevant financial reporting related regulations and requirements.
b. The Committee reviewed internal audit reports. The internal audit function is carried out by M/s. KPMG. The Internal audits are done on a process based audit framework to improve process performance and control.
c. The Committee reviewed the external auditors’ report and management letter for the last year. All recommendations proposed by the external auditors were discussed with the senior partner and recommendations proposed were duly carried out by the management. In addition the Audit Committee reviewed external auditors and the engagement partner’s relationships with the Company, and assessed that the external auditors are independent.
d. The Audit Committee in conjunction with the Managing Director of the Company reviewed the Company’s disclosure controls and procedures and internal control over financial reporting.
An OverviewManagement Discussion & AnalysisCapitals ReportGovernance ReportFinancial ReportsSupplementary Information
80 Lanka Tiles PLC
e. The Audit Committee reviewed the Company’s framework and practices with respect to risk assessment and risk management, including discussing with management the Company’s major financial risk exposures and the steps that have been taken to monitor and control such exposures.
f. The Audit Committee reviewed the company’s arrangement for the confidential receipt, retention and treatment of complaints alleging fraud, received from any sources and pertaining to accounting, internal controls or other such matters and assured the confidentiality to whistle-blowing employees. It also reviewed the company’s procedures for detecting and preventing fraud and bribery and receiving reports on non-compliance and reviewed the procedure for receiving and dealing with “Non-Compliance with Laws and Regulations (NOCLAR) referred by Professional Accountants.
g. Performed other activities relate to this charter as requested by the Board of Directors
Oversee special investigations as needed. Reviewed and assessed the adequacy of the committee charter annually, requesting board approval for proposed changes, and ensure appropriate disclosure as may be required by law or regulation.
Conclusion
The Audit Committee is satisfied that the Company’s accounting policies, independence of the auditors and risk management policies are adequate for its operations. The Audit Committee has also accomplished responsibilities and functions that are delegated to it by the Board and outlined in the Charter.
J D N KekulawalaChairman – Audit Committee
06th June 2019
A U D I T C O M M I T T E E R E P O R T

81Integrated Annual Report 2018/19
General disclosure: Core option
Organizationalprofile
GRI 102 General Disclosures 102-1 Name of the organization 6
GRI 102 General Disclosures 102-2 Activities, brands, products, and services 8
GRI 102 General Disclosures 102-3 Location of headquarters 141
GRI 102 General Disclosures 102-4 Location of operations 50
GRI 102 General Disclosures 102-5 Ownership and legal form 7
GRI 102 General Disclosures 102-6 Markets served 12
GRI 102 General Disclosures 102-7 Scale of the organization 13
GRI 102 General Disclosures 102-8 Information on employees and other workers 45
GRI 102 General Disclosures 102-9 Supply chain 36
GRI 102 General Disclosures 102-10 Significant changes to the organization and its supply chain 36
GRI 102 General Disclosures 102-12 External initiatives 47
GRI 102 General Disclosures 102-13 Membership of associations 54
Strategy
GRI 102 General Disclosures 102-14 Statement from senior decision-maker 20
Governance
GRI 102 General Disclosures 102-18 Governance structure 7
Stakeholder engagement
GRI 102 General Disclosures 102-40 List of stakeholder groups 26
GRI 102 General Disclosures 102-41 Collective bargaining agreements 26
GRI 102 General Disclosures 102-42 Identifying and selecting stakeholders 26
GRI 102 General Disclosures 102-43 Approach to stakeholder engagement 26
GRI 102 General Disclosures 102-44 Key topics and concerns raised 26
G R I I N D E XAn OverviewManagement Discussion & AnalysisCapitals ReportGovernance ReportFinancial ReportsSupplementary Information
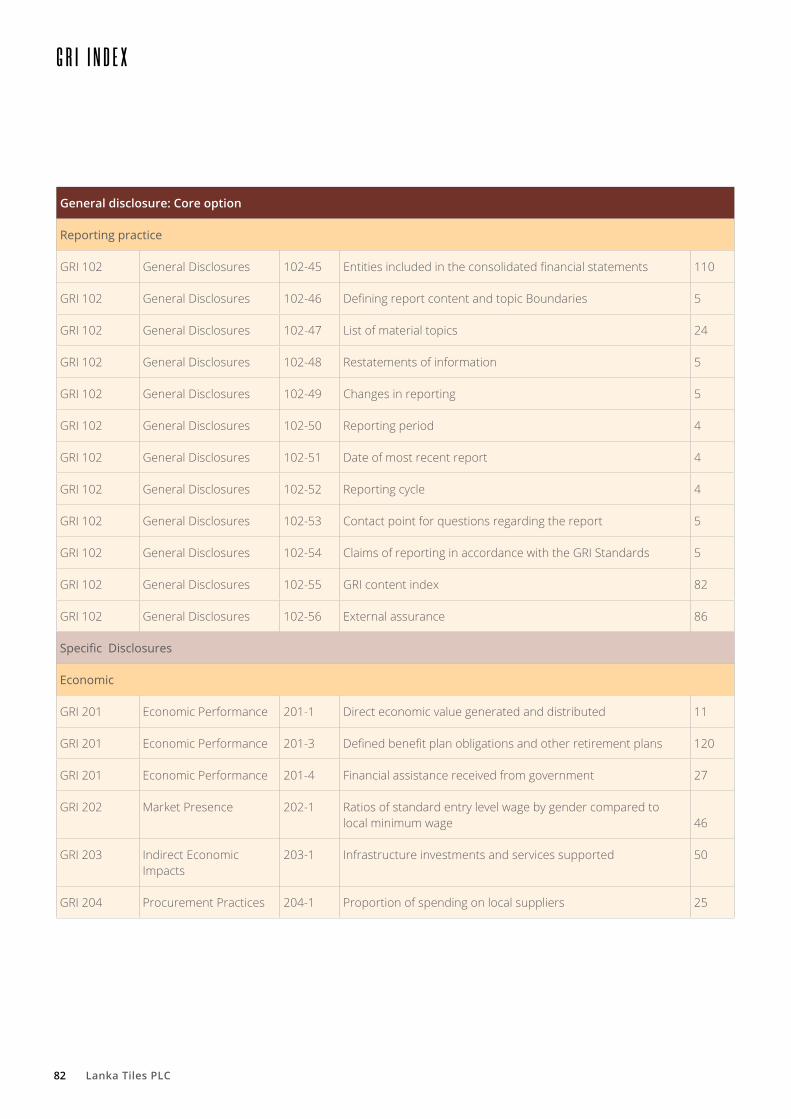
82 Lanka Tiles PLC
General disclosure: Core option
Reporting practice
GRI 102 General Disclosures 102-45 Entities included in the consolidated financial statements 110
GRI 102 General Disclosures 102-46 Defining report content and topic Boundaries 5
GRI 102 General Disclosures 102-47 List of material topics 24
GRI 102 General Disclosures 102-48 Restatements of information 5
GRI 102 General Disclosures 102-49 Changes in reporting 5
GRI 102 General Disclosures 102-50 Reporting period 4
GRI 102 General Disclosures 102-51 Date of most recent report 4
GRI 102 General Disclosures 102-52 Reporting cycle 4
GRI 102 General Disclosures 102-53 Contact point for questions regarding the report 5
GRI 102 General Disclosures 102-54 Claims of reporting in accordance with the GRI Standards 5
GRI 102 General Disclosures 102-55 GRI content index 82
GRI 102 General Disclosures 102-56 External assurance 86
SpecificDisclosures
Economic
GRI 201 Economic Performance 201-1 Direct economic value generated and distributed 11
GRI 201 Economic Performance 201-3 Defined benefit plan obligations and other retirement plans 120
GRI 201 Economic Performance 201-4 Financial assistance received from government 27
GRI 202 Market Presence 202-1 Ratios of standard entry level wage by gender compared to local minimum wage 46
GRI 203 Indirect Economic Impacts
203-1 Infrastructure investments and services supported 50
GRI 204 Procurement Practices 204-1 Proportion of spending on local suppliers 25
G R I I N D E X

83Integrated Annual Report 2018/19
General disclosure: Core option
Environmental
GRI 301 Materials 301-1 Materials used by weight or volume 52
GRI 301 Materials 301-2 Recycled input materials used 53
GRI 302 Energy 302-1 Energy consumption within the organization 52
GRI 302 Energy 302-2 Energy consumption outside of the organization 52
GRI 302 Energy 302-3 Energy intensity 52
GRI 302 Energy 302-4 Reduction of energy consumption 52
GRI 302 Energy 302-5 Reductions in energy requirements of products and services 52
GRI 303 Water 303-1 Water withdrawal by source 35
GRI 303 Water 303-3 Water recycled and reused 53
GRI 305 Emissions 305-1 Direct (Scope 1) GHG emissions 53
GRI 306 Effluents and Waste 306-2 Waste by type and disposal method 35
GRI 308 Supplier Environmental Assessment
308-1 New suppliers that were screened using environmental criteria 52
GRI 308 Supplier Environmental Assessment
308-2 Negative environmental impacts in the supply chain and actions taken
52
An OverviewManagement Discussion & AnalysisCapitals ReportGovernance ReportFinancial ReportsSupplementary Information

84 Lanka Tiles PLC
G R I I N D E X
General disclosure: Core option
Social
GRI 401 Employment 401-1 New employee hires and employee turnover 46
GRI 401 Employment 401-2 Benefits provided to full-time employees that are not provided to temporary or part-time employees 46
GRI 401 Employment 401-3 Parental leave 46
GRI 403 Occupational Health and Safety
403-1 Workers representation in formal joint management–worker health and safety committees
47
GRI 403 Occupational Health and Safety
403-2 Types of injury and rates of injury, occupational diseases, lost days, and absenteeism, and number of work-related fatalities
47
GRI 403 Occupational Health and Safety
403-3 Workers with high incidence or high risk of diseases related to their occupation
47
GRI 403 Occupational Health and Safety
403-4 Health and safety topics covered in formal agreements with trade unions
47
GRI 404 Training and Education 404-1 Average hours of training per year per employee 47
GRI 404 Training and Education 404-2 Programs for upgrading employee skills and transition assistance programs
47
GRI 404 Training and Education 404-3 Percentage of employees receiving regular performance and career development reviews
47
GRI 405 Diversity and Equal Opportunity
405-1 Diversity of governance bodies and employees 47
GRI 407 Freedom of Association and collective bargaining
407-1 Operations and suppliers in which the right to freedom of association and collective bargaining may be at risk
46
GRI 413 Local Communities 413-1 Operations with local community engagement, impact assessments, and development programs
48

85Integrated Annual Report 2018/19
F I N A N C I A L R E P O R T S
Independent Auditor’s report 86
Statement of Financial Position 90
Statement of Comprehensive Income 91
Statement of Changes in Equity 92
StatementofCashflows 93
NotestothefinancialStatements 94
Financial Calendar
Interim Report – 1st Quarter 10 August 2018
Interim Report – 2nd Quarter 12 November 2018
Interim Report – 3rd Quarter 07 February 2019
Interim Report – 4th Quarter 28 May 2019

86 Lanka Tiles PLC
I N D E P E N D E N T A U D I T O R ’ S R E P O R T
To the Shareholders of Lanka Tiles PLC
Report on the audit of the financial statements Our opinion
In our opinion, the financial statements of Lanka Tiles PLC (“the Company”) and the consolidated financial statements of the Company and its subsidiaries (“the Group”) give a true and fair view of the financial position of the Company and the Group as at 31 March 2019, and of their financial performance and cash flows for the year then ended in accordance with Sri Lanka Accounting Standards.
What we have audited
The financial statements of the Company and the consolidated financial statements of the Group, which comprise:
• the statement of financial position as at 31 March 2019;
• the statement of comprehensive income for the year then ended;
• the statement of changes in equity for the year then ended;
• the statement of cash flows for the year then ended; and
• the notes to the financial statements, which include a summary of significant accounting policies.
Basis for opinion
We conducted our audit in accordance with Sri Lanka Auditing Standards (SLAuSs). Our responsibilities under those standards are further described in the Auditor’s Responsibilities for the Audit of the Financial Statements section of our report.
We believe that the audit evidence we have obtained is sufficient and appropriate to provide a basis for our opinion.
Independence
We are independent of the Group in accordance with the Code of Ethics issued by CA Sri Lanka (Code of Ethics), and we have fulfilled our other ethical responsibilities in accordance with the Code of Ethics.
Key audit matters
Key audit matters are those matters that, in our professional judgment, were of most significance in our audit of the financial statements of the current period. These matters were addressed in the context of our audit of the financial statements as a whole, and in forming our opinion thereon, and we do not provide a separate opinion on these matters.
The Company and Group:
Key audit matter How our audit addressed the Key audit matterExistence of finished goods inventory held at distribution network channels(Refer note 11 in the financial statements)
Finished goods held at the Company’s distribution network channels (consignment agents, franchise dealers and consignment distributors) amounted to LKR 689 Mn. which represents 52% of total value of finished goods inventory of the Company as at 31 March 2019.
The existence of finished goods inventory held at the Company’s distribution network channels is a key audit matter due to the significance of the amount of finished goods held at these third party stores/ locations across Sri Lanka.
Our audit approach mainly included; test of details that covered the following:
We selected a sample of distribution network channels locations and attended finished goods inventory counts. For locations attended, we performed following procedures:
- checked the systems and processes used to accurately record inventory movements;
- observed the inventory count procedures to assess compliance with the instructions issued by management for inventory counting;
- selected a sample of inventory items and performed independent test counts. Agreed the quantities that we counted to the quantities recorded; and
- made inquiries regarding obsolete inventory items and inspected the physical condition of items counted.
Further, we performed independent third party confirmation procedures on finished goods inventory in the custody of distribution network channels whilst maintaining control over the confirmation process.
From the procedures performed, there were no material differences identified with regard to the existence of finished goods inventory held at distribution network channels and the stock records at head office.

87Integrated Annual Report 2018/19
Key audit matter How our audit addressed the Key audit matterThe Group: Valuation of the investment property(Refer note 6 in the financial statements)
The investment property of the Group solely comprised a land situated in Divulupitiya area and carries the fair value of LKR 394.8 Mn. as at 31 March 2019. The Group has leased out this land under a cancellable operating lease arrangements to its affiliated company – LWL Development (Private) Limited. The property is classified as an investment property and accounted for at fair value.
The Group engaged an external valuer to measure the value of its investment property and the resulting valuation has indicated an increase in fair value by LKR 171 Mn. compared to last financial year.
Our audit approach mainly included; test of details that covered the following:
We evaluated the competency, capability and objectivity of the external valuer engaged by the Group to perform the investment property valuation by assessing the professional qualifications, experience and independence.
We also obtained the external valuation report and performed the following:
- verified the completeness and accuracy of the information provided to the external valuer;
- evaluated the appropriateness of the methodology used to value the respective property by comparing with the methods and practices generally used in the industry;
- assessed the reasonableness of valuer’s market prices and related assumptions used in the valuation, by comparing the market prices of lands in the vicinity using publicly available independent property market information.
Based on our work performed, we found that the fair value of investment
property as at 31 March 2019 to be appropriate.The valuation of land is an area that involves judgments and assumptions over market prices of comparable land, adjusting for differences in key attributes such as extent of land, site improvements and access to public roads.
Other information
Management is responsible for the other information. The other information comprises the information presented in the annual report but does not include the financial statements and our auditor’s report thereon.
Our opinion on the financial statements does not cover the other information and we do not and will not express any form of assurance conclusion thereon.
In connection with our audit of the financial statements, our responsibility is to read the other information identified above and, in doing so, consider whether the other information is materially inconsistent with the financial statements or our knowledge obtained in the audit, or otherwise appears to be materially misstated.
If, based on the work we have performed on the other information that we obtained prior to the date of this auditor’s report, we conclude that there is a material misstatement of this other information, we are required to report that fact. We have nothing to report in this regard.
An OverviewManagement Discussion & AnalysisCapitals ReportGovernance ReportFinancial ReportsSupplementary Information

88 Lanka Tiles PLC
I N D E P E N D E N T A U D I T O R ’ S R E P O R T
Responsibilities of management and those charged with governance for the financial statements
Management is responsible for the preparation of financial statements that give a true and fair view in accordance with Sri Lanka Accounting Standards and for such internal control as management determines is necessary to enable the preparation of financial statements that are free from material misstatement, whether due to fraud or error.
In preparing the separate/ consolidated financial statements, management is responsible for assessing the Company’s/ Group’s ability to continue as a going concern, disclosing, as applicable, matters related to going concern and using the going concern basis of accounting unless management either intends to liquidate the Company/ Group or to cease operations, or has no realistic alternative but to do so.
Those charged with governance are responsible for overseeing the Company’s and the Group’s financial reporting process.
Auditor’s responsibilities for the audit of the financial statements
Our objectives are to obtain reasonable assurance about whether the financial statements as a whole are free from material misstatement, whether due to fraud or error, and to issue an auditor’s report that includes our opinion. Reasonable assurance is a high level of assurance, but is not a guarantee that an audit conducted in accordance with SLAuSs will always detect a material misstatement when it exists. Misstatements can arise from fraud or error and are considered material if, individually or in the aggregate, they could reasonably be expected to influence the economic decisions of users taken on the basis of these financial statements.
As part of an audit in accordance with SLAuSs, we exercise professional judgment and maintain professional scepticism throughout the audit. We also:
• Identify and assess the risks of material misstatement of the financial statements, whether due to fraud or error, design and perform audit procedures responsive to those risks, and obtain audit evidence that is sufficient and appropriate to provide a basis for our opinion. The risk of not detecting a material misstatement resulting from fraud is higher than for one resulting from error, as
fraud may involve collusion, forgery, intentional omissions, misrepresentations, or the override of internal control.
• Obtain an understanding of internal control relevant to the audit in order to design audit procedures that are appropriate in the circumstances, but not for the purpose of expressing an opinion on the effectiveness of the Company’s and the Group’s internal control.
• Evaluate the appropriateness of accounting policies used and the reasonableness of accounting estimates and related disclosures made by management.
• Conclude on the appropriateness of management’s use of the going concern basis of accounting and, based on the audit evidence obtained, whether a material uncertainty exists related to events or conditions that may cast significant doubt on the Company’s/ Group’s ability to continue as a going concern. If we conclude that a material uncertainty exists, we are required to draw attention in our auditor’s report to the related disclosures in the separate/ consolidated financial statements or, if such disclosures are inadequate, to modify our opinion. Our conclusions are based on the audit evidence obtained up to the date of our auditor’s report. However, future events or conditions may cause the Company/ Group to cease to continue as a going concern.
• Evaluate the overall presentation, structure and content of the financial statements, including the disclosures, and whether the financial statements represent the underlying transactions and events in a manner that achieves fair presentation.
• Obtain sufficient appropriate audit evidence regarding the financial information of the entities or business activities within the Group to express an opinion on the consolidated financial statements. We are responsible for the direction, supervision and performance of the group audit. We remain solely responsible for our audit opinion.
We communicate with those charged with governance regarding, among other matters, the planned scope and timing of the audit and significant audit findings, including any significant deficiencies in internal control that we identify during our audit.

89Integrated Annual Report 2018/19
We also provide those charged with governance with a statement that we have complied with ethical requirements in accordance with the Code of Ethics regarding independence, and to communicate with them all relationships and other matters that may reasonably be thought to bear on our independence, and where applicable, related safeguards.
From the matters communicated with those charged with governance, we determine those matters that were of most significance in the audit of the financial statements of the current period and are therefore the key audit matters. We describe these matters in our auditor’s report unless law or regulation precludes public disclosure about the matter or when, in extremely rare circumstances, we determine that a matter should not be communicated in our report because the adverse consequences of doing so would reasonably be expected to outweigh the public interest benefits of such communication.
Report on other legal and regulatory requirements
As required by section 163 (2) of the Companies Act, No. 07 of 2007, we have obtained all the information and explanations that were required for the audit and, as far as appears from our examination, proper accounting records have been kept by the Company.
CHARTERED ACCOUNTANTSCA Sri Lanka membership number [1581] COLOMBO 06th June 2019
An OverviewManagement Discussion & AnalysisCapitals ReportGovernance ReportFinancial ReportsSupplementary Information

90 Lanka Tiles PLC
Group31 March
Company31 March
Notes 2019 2018 2019 2018Rs. ‘000 Rs. ‘000 Rs. ‘000 Rs. ‘000
ASSETSNon-current assetsProperty, plant and equipment 5 5,743,130 3,855,576 5,743,130 3,855,576 Investment property 6 394,819 223,800 - - Investment in subsidiaries 7 - - 6,242 6,242 Investment in associate 8 923,924 933,633 923,924 933,633 Loans given to related companies 12 - 10,898 - 10,898
7,061,873 5,023,907 6,673,296 4,806,349
Current assetsInventories 11 3,019,769 1,945,726 3,019,769 1,945,726 Trade and other receivables 12 1,629,226 1,341,661 1,801,542 1,514,996 Current tax assets 51,570 - 51,570 - Cash and cash equivalents 13 144,509 444,998 132,717 433,975
4,845,074 3,732,385 5,005,598 3,894,697 Total assets 11,906,947 8,756,292 11,678,894 8,701,046
EQUITYCapital and reservesEquity attributable to equity holders of the parentStated capital 18 900,968 900,968 900,968 900,968 Amalgamation reserve 460,151 460,151 460,151 460,151 Revaluation reserve 730,515 730,515 730,515 730,515 Exchange translation reserve 226 (132) - - Retained earnings 5,199,620 4,828,272 5,025,691 4,778,698 Shareholders’ Funds 7,291,480 6,919,774 7,117,325 6,870,332
Non controlling interest 5,760 5,373 - - Total equity 7,297,240 6,925,147 7,117,325 6,870,332
LIABILITIESNon-current liabilities Borrowings 15 1,351,169 7,374 1,351,169 7,374 Deferred tax liabilities 16 763,292 634,246 715,407 634,246 Employee benefit obligations 17 172,514 166,370 172,514 166,370
2,286,975 807,990 2,239,090 807,990
Current liabilitiesTrade and other payables 14 1,571,843 782,195 1,571,590 781,972 Current tax liabilities - 46,932 - 46,724 Borrowings 15 750,889 194,028 750,889 194,028
2,322,732 1,023,155 2,322,479 1,022,724 Total liabilities 4,609,707 1,831,145 4,561,569 1,830,714 Total equity and liabilities 11,906,947 8,756,292 11,678,894 8,701,046
The notes on pages 94 to 134 form an integral part of these financial statements.
I certify that these financial statements have been prepared in compliance with the requirements of the Companies Act No. 07 of 2007.
B T T Roche General Manager (Finance)
The Board of Directors is responsible for the preparation and presentation of these financial statements. Approved and signed for and on behalf the Board of Directors.
Dhammika Perera J A P M Jayasekera Chairman Managing Director
06th June 2019
CONSOLIDATED STATEMENT OF FINANCIAL POSITION

91Integrated Annual Report 2018/19
GroupYear ended 31 March
CompanyYear ended 31 March
Notes 2019 2018 2019 2018Rs. ‘000 Rs. ‘000 Rs. ‘000 Rs. ‘000
Revenue from contract with customers 19 7,008,992 6,126,307 7,008,992 6,126,307 Cost of sales of goods (5,002,702) (3,747,180) (5,002,702) (3,747,180)Gross profit 2,006,290 2,379,127 2,006,290 2,379,127 Distribution costs (1,037,762) (890,109) (1,037,762) (890,109)Net impairment losses financial assets 12(c) (4,000) (5,238) (4,000) (5,238)Administrative expenses (404,155) (405,816) (403,520) (404,447)Other income 20 27,011 20,866 25,328 19,447 Other gains / (losses) - net 21 164,495 4 (6,524) 4 Operating profit 751,879 1,098,834 579,812 1,098,784 Finance income 7,916 110,344 7,916 110,344 Finance costs (22,077) (21,768) (22,077) (21,768)Finance income - net 24 (14,161) 88,576 (14,161) 88,576 Share of net profit of associate accounted for using the equity method 8 7,888 165,383 7,888 165,383Profit before income tax 745,606 1,352,792 573,539 1,352,743Income tax expense 25 (217,594) (348,795) (169,925) (348,721)Profit for the year 528,012 1,003,997 403,614 1,004,022
Other comprehensive income :Items that will not be reclassified to profit or lossGains on revaluation of land and buildings 5 - 83,293 - 83,293 "Deferred tax component - gains on revaluation of land and buildings"
16 - (191,634) - (191,634)
Remeasurements of post employment benefit obligations - gratuity 17 7,746 (28,361) 7,746 (28,361)Deferred tax component - remeasurement of retirement benefit obligations - gratuity
16 (2,169) 7,941 (2,169) 7,941
Exchange gain / (loss) arising on translation of foreign operations 701 (259) - -
Items that may be subsequently reclassified to profit or loss"Share of other comprehensive income of associate investment accounted for using the equity method"
8 4,911 (68,951) 4,911 (68,951)
Total other comprehensive income for the year, net of tax 11,189 (197,971) 10,488 (197,712)
Total comprehensive income for the year 539,201 806,026 414,102 806,310
Profit attributable to :Equity holders of the parent 527,968 1,004,494 403,614 1,004,022 Non controlling interest 44 (497) - - Profit for the year 528,012 1,003,997 403,614 1,004,022
Total comprehensive income attributable to :Equity holders of the parent 538,814 806,650 414,102 806,310 Non controlling interest 387 (624) - - Total comprehensive income for the year 539,201 806,026 414,102 806,310
Basic earnings per share (Rs) 26 9.95 18.93 7.61 18.93
The notes on pages 94 to 134 form an integral part of these financial statements.
CONSOLIDATED STATEMENT OF COMPREHENSIVE INCOMEAn OverviewManagement Discussion & AnalysisCapitals ReportGovernance ReportFinancial ReportsSupplementary Information

92 Lanka Tiles PLC
Attributable to equity owners of the parentStated capital
Retained earnings
Revaluationreserve
Amalgamation reserve*
Exchangetranslation
reserve
Noncontrolling
interest
Total
Rs. ‘000 Rs. ‘000 Rs. ‘000 Rs. ‘000 Rs. ‘000 Rs. ‘000 Rs. ‘000
a) GroupBalance as at 1 April 2017 900,968 4,443,653 838,856 460,151 - - 6,643,628 Profit for the year - 1,004,494 - - - (497) 1,003,997 Other comprehensive income for the year - (89,371) (108,341) - (132) (127) (197,971)Total comprehensive income for the year - 915,123 (108,341) - (132) (624) 806,026 Shares issued to minority shareholders - - - - - 5,997 5,997 Dividends for year 2017/2018 (interim 1) - (212,202) - - - - (212,202)Dividends for year 2017/2018 (interim 2) - (318,302) - - - - (318,302)Balance as at 31 March 2018 900,968 4,828,272 730,515 460,151 (132) 5,373 6,925,147 Balance as at 1 April 2018 900,968 4,828,272 730,515 460,151 (132) 5,373 6,925,147 Profit for the year - 527,968 - - - 44 528,012Other comprehensive income for the year - 10,488 - - 358 343 11,189 Total comprehensive income for the year - 538,456 - - 358 387 539,201Dividends for year 2018/2019 (interim) - (167,109) - - - - (167,109)Balance as at 31 March 2019 900,968 5,199,620 730,515 460,151 226 5,760 7,297,240
Attributable to equity owners of the CompanyStated capital
Retained earnings
Revaluationreserve
Amalgamation reserve*
Total
Rs. ‘000 Rs. ‘000 Rs. ‘000 Rs. ‘000 Rs. ‘000
b) CompanyBalance as at 1 April 2017 900,968 4,394,551 838,856 460,151 6,594,526Profit for the year - 1,004,022 - - 1,004,022 Other comprehensive income for the year - (89,371) (108,341) - (197,712)Total comprehensive income for the year - 914,651 (108,341) - 806,310 Dividends for year 2017/2018 (interim 1) - (212,202) - - (212,202)Dividends for year 2017/2018 (interim 2) - (318,302) - - (318,302)Balance as at 31 March 2018 900,968 4,778,698 730,515 460,151 6,870,332Balance as at 1 April 2018 900,968 4,778,698 730,515 460,151 6,870,332Profit for the year - 403,614 - - 403,614Other comprehensive income for the year - 10,488 - - 10,488 Total comprehensive income for the year - 414,102 - - 414,102Dividends for year 2018/2019 (interim) - (167,109) - - (167,109)Balance as at 31 March 2019 900,968 5,025,691 730,515 460,151 7,117,325
* Amalgamation reserve resulted from amalgamation of two fully owned subsidiaries Lanka Tiles Trading (Private) Limited and Ceradec (Private) Limited on 19 December 2011 in terms of Section 242(1) of the Companies Act No 07 of 2007.
The notes on pages 94 to 134 form an integral part of these financial statements.
STATEMENT OF CHANGES IN EQUITY

93Integrated Annual Report 2018/19
CONSOLIDATED STATEMENT OF CASH FLOWS
GroupYear ended 31 March
CompanyYear ended 31 March
Note 2019 2018 2019 2018Rs. ‘000 Rs. ‘000 Rs. ‘000 Rs. ‘000
Cash flows from operating activitiesCash generated from operations 28 155,141 703,781 155,080 704,739 Interest paid (22,077) (21,768) (22,077) (21,768)Interest received 7,916 110,344 7,916 110,344 Gratuity paid 17 (13,773) (12,385) (13,773) (12,385)Tax paid (189,220) (363,788) (189,227) (363,789)Net cash generated from operating activities (62,013) 416,184 (62,081) 417,141
Cash flows from investing activitiesPurchase of property, plant and equipment 5 (1,690,119) (64,465) (1,690,119) (64,465)Proceeds from sale of property, plant and equipment 785 2,449 785 2,449 Expenditure incurred on capital work in progress 5 (472,296) (337,709) (472,296) (337,709)Investment in subsidiary 7 - - - (6,242)Dividend received - 43,851 - 43,851 Repayments by (loans to) related companies 21,797 25,709 21,797 25,709 Net cash used in investing activities (2,139,833) (330,165) (2,139,833) (336,407)
Cash flows from financing activitiesDividends paid - (530,504) - (530,504)Proceeds on issue of shares to minority shareholders - 5,997 - - Proceeds from borrowings 2,458,909 100,000 2,458,909 100,000 Repayments of borrowings (853,457) (161,416) (853,457) (161,416)Net cash used in financing activities 1,605,452 (585,923) 1,605,452 (591,920)
Net (decrease) / increase in cash and cash equivalents (596,394) (499,904) (596,462) (511,186)
Movement in cash and cash equivalentsCash and cash equivalents at beginning of year 349,819 849,982 338,796 849,982 Net (decrease) / increase in cash and cash equivalents (596,394) (499,904) (596,462) (511,186)Net foreign exchange difference arising on translation of foreign operations
701 (259) - -
Cash and cash equivalents at end of year 13 (245,874) 349,819 (257,666) 338,796
The notes on pages 94 to 134 form an integral part of these financial statements.
An OverviewManagement Discussion & AnalysisCapitals ReportGovernance ReportFinancial ReportsSupplementary Information

94 Lanka Tiles PLC
NOTES TO THE FINANCIAL STATEMENTS
1 GENERAL INFORMATION
General
Lanka Tiles PLC (“the Company”) is a public limited liability company incorporated and domiciled in Sri Lanka and listed on the Colombo Stock Exchange. The registered office and the principal place of business of the Company is located at No. 215, Nawala Road, Narahenpita, Colombo 05.
Beyond Paradise Collection (Private) Limited, a wholly owned subsidiary of the Company is a limited liability company domiciled in Sri Lanka and incorporated on 12 May 2011 under the Companies Act No. 07 of 2007. The registered office of the Company is located at No. 215, Nawala Road, Narahenpita, Colombo 05.
Lanka Tiles Private Limited, 51% owned subsidiary of the Company is a limited liability company domiciled in India and incorporated on 2 May 2017 under the Companies Act, 2013 (18 of 2013) of India. The registered office of the Company is located at No.196 A1, Anekal Taluk, Bommasandra Industrial Area, Attibele, Bengaluru, India.
LTL Development (Private) Limited, a wholly owned subsidiary of the Company is a limited liability company domiciled in Sri Lanka and incorporated on 18 February 2018 under the Companies Act No. 07 of 2017. The registered office of the Company is located at No. 215, Nawala Road, Narahenpita, Colombo 05.
Principal activities and nature of operations
“Lanka Tiles PLC manufactures and sells glazed ceramic and porcelain floor tiles through a network of dealers and distributors. The Company has its manufacturing plant located at St James Estate, Jaltara, Ranala. Beyond Paradise Collection (Private) Limited is the property holding and developing company.”
Lanka Tiles Private Limited distributes the tiles in India.
LTL Development (Private) Limited is the property holding and developing company.
Parent company and ultimate parent company
The Company’s immediate parent entity is Lanka Walltiles PLC. The Company’s ultimate parent undertaking and controlling party at the financial reporting date was Vallibel One PLC, which is incorporated and domiciled in Sri Lanka.
Date of authorization for issue
The financial statements were authorized for issue in accordance with a resolution of the board of directors on 06 June 2019.
2 SUMMARY OF SIGNIFICANT ACCOUNTING POLICIES
The principal accounting policies adopted in the preparation of the financial statements are set out below: These policies have been consistently applied to all years presented, unless otherwise stated.
2.1 Basis of preparation
The consolidated financial statements have been prepared under the historical cost convention as modified by the revaluation of land and buildings and financial assets and liabilities which are measured at fair value through profit or loss.
The financial statements of the Company and the Group are prepared in accordance with Sri Lanka Accounting Standards issued by the Institute of Chartered Accountants of Sri Lanka, which comprise Sri Lanka Financial Reporting Standards (SLFRSs), Sri Lanka Accounting Standards (LKASs), relevant interpretations of the Standing Interpretations Committee (SIC) and International Financial Reporting Interpretations Committee (IFRIC).
The preparation of financial statements in conformity with Sri Lanka Accounting Standards requires the use of certain critical accounting estimates. It also requires management to exercise its judgment in the process of applying the Company’s and the Group’s accounting policies. The areas involving a higher degree of judgment or complexity, or areas where assumptions and estimates are significant to the Company’s and the Group’s financial statements are disclosed in Note 3.
2.2 Changes in accounting policies and disclosures
a) New accounting standards, amendments and interpretations adopted during the financial year.
The following amendment of standards and interpretations apply for the financial reporting periods commencing on or after 1 April 2018,
(i) SLFRS 9 ‘Financial Instruments’, replaces the multiple classification and measurement models in LKAS 39 Financial instruments: Recognition and measurement with a single model that has initially only two classification categories: amortised cost and fair value. Classification of debt assets will be driven by the entity’s business model for managing the

95Integrated Annual Report 2018/19
financial assets and the contractual cash flow characteristics of the financial assets. A debt instrument is measured at amortised cost if: a) the objective of the business model is to hold the financial asset for the collection of the contractual cash flows, and b) the contractual cash flows under the instrument solely represent payments of principal and interest.
All other debt and equity instruments, including investments in complex debt instruments and equity investments, must be recognised at fair value. All fair value movements on financial assets are taken through the statement of profit or loss, except for equity investments that are not held for trading, which may be recorded in the statement of profit or loss or in reserves (without subsequent recycling to profit or loss). For financial liabilities that are measured under the fair value option entities will need to recognise the part of the fair value change that is due to changes in the their own credit risk in other comprehensive income rather than profit or loss.
The new hedge accounting rules align hedge accounting more closely with common risk management practices. As a general rule, it will be easier to apply hedge accounting going forward. The new standard also introduces expanded disclosure requirements and changes in presentation.
“Further changes introduced to the classification and measurement rules and also introduced a new impairment model to SLFRS 9. The changes introduce:
• a third measurement category (FVOCI) for certain financial assets that are debt instruments.
• a new expected credit loss (ECL) model which involves a three-stage approach whereby financial assets move through the three stages as their credit quality changes. The stage dictates how an entity measures impairment losses and applies the effective interest rate method. A simplified approach is permitted for financial assets that do not have a significant financing component (e.g. trade receivables). On initial recognition, entities will record a day-1 loss equal to the 12 month ECL (or lifetime ECL for trade receivables), unless the assets are considered credit impaired. “
The standard is effective for the annual periods beginning on or after 1 January 2018.
“Amendments to SLFRS 9 Financial Instruments - Prepayment Features with Negative Compensation This amendment confirm that when a financial liability
measured at amortised cost is modified without this resulting in de-recognition, a gain or loss should be recognised immediately in profit or loss. The gain or loss is calculated as the difference between the original contractual cash flows and the modified cash flows discounted at the original effective interest rate. This means that the difference cannot be spread over the remaining life of the instrument which may be a change in practice from LKAS 39.”
The amendment is effective for annual periods beginning on or after 1 January 2019.
(ii) “SLFRS 15 ‘Revenue from contracts with customers’ replaces LKAS 18 ‘Revenue’ and LKAS 11 ‘Construction contracts’ and related interpretations. The core principle in SLFRS 15 is that an entity recognises revenue to depict the transfer of promised goods or services to the customer in an amount that reflects the consideration to which the entity expects to be entitled in exchange for those goods or services.
Revenue is recognised when a customer obtains control of goods or services, i.e. when the customer has the ability to direct the use of and obtain the benefits from the goods or services. A new five-step process is applied before revenue can be recognised:
- Identify contracts with customers
- Identify the separate performance obligations
- Determine the transaction price of the contract;
- Allocate the transaction price to each of the separate performance obligations; and
- Recognise the revenue as each performance obligation is satisfied.”
Key provisions of the new standard are as follows:
- Any bundled goods or services that are distinct must be separately recognised, and any discounts or rebates on the contract price must generally be allocated to the separate elements.
- If the consideration varies (such as for incentives, rebates, performance fees, royalties, success of an outcome etc), minimum amounts of revenue must be recognised if they are not at significant risk of reversal.
- The point at which revenue is able to be recognised may shift: some revenue which is currently recognised at a point in time at the end of a contract may have to be recognised over the contract term and vice versa.
An OverviewManagement Discussion & AnalysisCapitals ReportGovernance ReportFinancial ReportsSupplementary Information

96 Lanka Tiles PLC
N O T E S T O T H E F I N A N C I A L S T A T E M E N T S
- There are new specific rules on licenses, warranties, non-refundable upfront fees, and consignment arrangements, to name a few.
- As with any new standard, there are also increased disclosures.”
The standard is effective for accounting periods beginning on or after 1 January 2018.
There are no other standards, IFRIC interpretations or amendments which are effective for the financial year beginning on 1 April 2018 that would be expected to have a material impact on the Company.
b) New accounting standards, amendments and interpretations issued but not yet adopted.
(i) “SLFRS 16, ‘Leases’ SLFRS 16 will affect primarily the accounting by lessees and will result in the recognition of almost all leases on balance sheet. The standard removes the current distinction between operating and financing leases and requires recognition of an asset (the right to use the leased item) and a financial liability to pay rentals for virtually all lease contracts. An optional exemption exists for short-term and low-value leases. The income statement will also be affected because the total expense is typically higher in the earlier years of a lease and lower in later years. Additionally, operating expense will be replaced with interest and depreciation, so key metrics like EBITDA will change. Operating cash flows will be higher as cash payments for the principal portion of the lease liability are classified within financing activities. Only the part of the payments that reflects interest can continue to be presented as operating cash flows. The accounting by lessors will not significantly change. Some differences may arise as a result of the new guidance on the definition of a lease. Under SLFRS 16, a contract is, or contains, a lease if the contract conveys the right to control the use of an identified asset for a period of time in exchange for consideration. The standard is effective for annual periods beginning on or after 1 January 2019 with earlier application permitted if SLFRS 15, ‘Revenue from Contracts with Customers’, is also applied.
There are no other standards or IFRIC interpretations that are not yet effective that would be expected to have a material impact to the Company.
2.3 Comparative information
Previous period figures and notes have been changed and reclassified wherever necessary to conform to the current year’s presentation.
2.4 Consolidation
(a) Subsidiaries
Subsidiaries are all entities (including structured entities) over which the Group has control. The Group controls an entity when the Group is exposed to, or has rights to, variable returns from its involvement with the entity and has the ability to affect those returns through its power to direct the activities of the entity. Subsidiaries are fully consolidated from the date on which control is transferred to the Group.
The acquisition method of accounting is used to account for business combination by the group. Inter-company transactions,balances and unrealised gains on transactions between group companies are eliminated. Unrealised losses are also eliminated unless the transaction provides evidence of an impairment of the transferred asset. Accounting policies of subsidiaries have been changed where necessary to ensure consistency with the policies adopted by the group.
Non-controlling interests in the results and equity of subsidiaries are shown separately in the consolidated statement of profit or loss, statement of comprehensive income, statement of changes in equity and balance sheet respectively.
(b) Associates
Associates are all entities over which the Group has significant influence but not control or joint control. This is generally the case where the groups holds between 20% and 50% of the voting rights. Investments in associates are accounted for using the equity method of accounting, after initially being recognised at cost.
Equity method
Under the equity method of accounting, the investments are initially recognised at cost and adjusted thereafter to recognise the group’s share of the post-acquisition profits or losses of the investee in profit or loss, and the group’s share of movements in other comprehensive income of the investee in other comprehensive income. Dividends received or receivable from associates and joint ventures are recognised as a reduction in the carrying amount of the investment.
When the group’s share of losses in an equity-accounted investment equals or exceeds its interest in the entity, including any other unsecured long-term receivables, the

97Integrated Annual Report 2018/19
group does not recognise further losses, unless it has incurred obligations or made payments on behalf of the other entity.
Unrealised gains on transactions between the group and its associates and joint ventures are eliminated to the extent of the group’s interest in these entities. Unrealised losses are also eliminated unless the transaction provides evidence of an impairment of the asset transferred. Accounting policies of equity accounted investees have been changed where necessary to ensure consistency with the policies adopted by the group.
The carrying amount of equity accounted investments is tested for impairment in accordance with the policy described in note 2.16
ii. Changes in ownership interests
The group treats transactions with non-controlling interests that do not result in a loss of control as transactions with equity owners of the group. A change in ownership interest results in an adjustment between the carrying amounts of the controlling and non-controlling interests to reflect their relative interests in the subsidiary. Any difference between the amount of the adjustment to non-controlling interests and any consideration paid or received is recognised in a separate reserve within equity attributable to owners of Lanka Tiles PLC.
When the group ceases to consolidate or equity account for an investment because of a loss of control,joint control or significant influence, any retained interest in the entity is remeasured to its fair value with the change in carrying amount recognised in profit or loss. This fair value becomes the initial carrying amount for the purposes of subsequently accounting for the retained interest as an associate, joint venture or financial asset. In addition, any amounts previously recognised in other comprehensive income in respect of that entity are accounted for as if the group had directly disposed of the related assets or liabilities. This may mean that amounts previously recognised in other comprehensive income are reclassified to profit or loss.
If the ownership interest in a joint venture or an associate is reduced but joint control or significant influence is retained, only a proportionate share of the amounts previously recognised in other comprehensive income are reclassified to profit or loss where appropriate.
2.5 Foreign currency translation
(a) Functional and presentation currency
Items included in the financial statements of each of the Group’s entities are measured using the currency of the
primary economic environment in which the entity operates (‘the functional currency’). The financial statements are presented in ‘Sri Lanka Rupees’ (LKR), which is the Company’s and the Group’s functional and presentation currency since the entities use LKR in majority of their transactions and reflect the economic substance of the underlying events and circumstances relevant to the Group.
(b) Transactions and balances
“Foreign currency transactions are translated into the functional currency using the exchange rates prevailing at the dates of the transactions. Foreign exchange gains and losses resulting from the settlement of such transactions and from the translation of monetary assets and liabilities denominated in foreign currencies at year end exchange rates are generally recognised in the profit or loss. Foreign exchange gains and losses that relate to borrowings are presented in the statement of profit or loss on a net basis within ‘Finance income or cost’. Non-monetary items that are measured at fair value in a foreign currency are translated using the exchange rates at the date when the fair value was determined. Translation differences on assets and liabilities carried at fair value are reported as part of the fair value gain or loss. For example, translation differences on non-monetary assets and liabilities such as equities held at fair value through profit or loss are recognised in profit or loss as part of the fair value gain or loss and translation differences on non-monetary assets such as equities classified at fair value through other comprehensive income are recognised in other comprehensive income.”
2.6 Current and deferred income tax
The tax expense for the period comprises current and deferred income tax. Tax is recognised in the profit or loss, except to the extent that it relates to items recognised in other comprehensive income or directly in equity. In this case, the tax is also recognised in other comprehensive income or directly in equity respectively. The current income tax charge is calculated on the basis of the tax laws enacted or substantively enacted at the end of the reporting period. Management periodically evaluates positions taken in tax returns with respect to situations in which applicable tax regulations are subject to interpretation. Management establishes provisions where appropriate on the basis of amounts expected to be paid to the tax authorities.
An OverviewManagement Discussion & AnalysisCapitals ReportGovernance ReportFinancial ReportsSupplementary Information

98 Lanka Tiles PLC
Deferred income tax is recognised using the liability method, on temporary differences arising between the tax bases of assets and liabilities and their carrying amounts in the financial statements. However, deferred income tax liabilities are not recognised if they arise from the initial recognition of goodwill. Deferred income tax is also not accounted for if it arises from the initial recognition of an asset or liability in a transaction other than a business combination that at the time of the transaction affects neither accounting nor taxable profit or loss. Deferred income tax is determined using tax rates (and laws) that have been enacted or substantially enacted by the end of the reporting period and are expected to apply when the related deferred income tax asset is realised or the deferred income tax liability is settled.
Deferred income tax is provided on temporary differences arising on investments in subsidiaries and associates, except where the timing of the reversal of the temporary difference is controlled by the Group and it is probable that the temporary difference will not reverse in the foreseeable future.
Deferred income tax assets are recognised only to the extent that it is probable that future taxable profit will be available against which the temporary differences can be utilised.
Deferred income tax assets and liabilities are offset when there is a legally enforceable right to offset current tax assets against current tax liabilities and when the deferred income taxes assets and liabilities relate to income taxes levied by the same taxation authority on either the same taxable entity or different taxable entities where there is an intention to settle the balances on a net basis.
2.7 Borrowing costs
General and specific borrowing costs that are directly attributable to the acquisition, construction or production of a qualifying asset are capitalised during the period of time that is required to complete and prepare the asset for its intended use or sale. Qualifying assets are assets that necessarily take a substantial period of time to get ready for their intended use or sale.
Investment income earned on the temporary investment of specific borrowings pending their expenditure on qualifying assets is deducted from the borrowing costs eligible for capitalisation.
Other borrowing costs are expensed in the period in which they are incurred.
2.8 Inventories
Inventories are valued at the lower of cost and net realisable value, after making due allowances for obsolete and slow moving items. Net realisable value is the price at which inventories can be sold in the ordinary course of business less the estimated cost of completion and the estimated cost necessary to make the sale. Cost of the trading stock is determined using the first-in, first-out (FIFO) method. Cost of the finished goods and work in progress is determined using the weighted average cost method. The cost of finished goods and work in progress comprises raw materials, direct labour, other direct costs and related production overheads (based on normal operating capacity). It excludes borrowing costs.
2.9 Financial assets
2.9.1 Classification
The Company and the Group classify its financial assets in the following measurement categories.
- those to be measured at amortised cost,
- those to be measured at fair value through other comprehensive income (OCI) or through profit or loss
The classification depends on the Company’s and the Group’s business model for managing the financial assets and the contractual terms of the cash flows.
For assets measured at fair value, gains and losses will either be recorded in comprehensive income or OCI. For investments in equity instruments that are not held for trading, this will depend on whether the Company and the Group have made an irrevocable election at the time of initial recognition to account for the equity investment at fair value through other comprehensive income (FVOCI).
The Company and the Group reclassify debt investments when and only when its business model for managing those assets changes.
2.9.2 Recognition and initial measurement
Regular way purchases and sales of financial assets are recognised on the trade-date, the date on which the Company and the Group commit to purchase or sell the asset.
At initial recognition, the Company and the Group measure a financial asset at its fair value plus, in the case of a financial asset not at fair value through profit or loss (FVTPL), transaction costs that are directly attributable to the acquisition of the financial asset. Transaction costs of financial assets carried at FVTPL are expensed in comprehensive income.
N O T E S T O T H E F I N A N C I A L S T A T E M E N T S
99Integrated Annual Report 2018/19
2.9.3 Subsequent measurement
(i) Debt instruments
Subsequent measurement of debt instruments depends on the group’s business model for managing the asset and the cash flow characteristics of the asset.
There are three measurement categories into which debt instruments are classified:
Amortised cost: Assets that are held for collection of contractual cash flows where those cash flows represent solely payments of principal and interest are measured at amortised cost. Interest income from these financial assets is included in finance income using the effective interest rate method. Any gain or loss arising on derecognition is recognised directly in comprehensive income and presented in other income/(losses) together with foreign exchange gains and losses.
FVOCI: Assets that are held for collection of contractual cash flows and for selling the financial assets, where the assets’ cash flows represent solely payments of principal and interest, are measured at FVOCI. Movements in the carrying amount are taken through OCI, except for the recognition of impairment gains or losses, interest income and foreign exchange gains and losses which are recognised in comprehensive income. When the financial asset is derecognised, the cumulative gain or loss previously recognised in OCI is reclassified from equity to comprehensive income and recognised in other income/(losses). Interest income from these financial assets is included in finance income using the effective interest rate method. Foreign exchange gains and losses are presented in other gains/(losses) and impairment expenses are presented as separate line item in comprehensive income.
FVTPL: Assets that do not meet the criteria for amortised cost or FVOCI are measured at FVTPL. A gain or loss on a debt investment that is subsequently measured at FVTPL is recognised in comprehensive income and presented net within other gains/(losses) in the period in which it arises.
(ii) Equity instruments
The Company and the Group subsequently measure all equity investments at fair value. Where the Group’s management has elected to present fair value gains and losses on equity investments in OCI, there is no subsequent reclassification of fair value gains and losses to comprehensive income following the derecognition of the investment. Dividends from such investments continue to be recognised in comprehensive income as other income when the group’s right to receive payments is established
Changes in the fair value of financial assets at FVTPL are recognised in other gains/(losses) in the statement of comprehensive income as applicable. Impairment losses (and reversal of impairment losses) on equity investments measured at FVOCI are not reported separately from other changes in fair value.
2.9.4 Impairment
From 01 January 2018 The Company and Group assesses on a forward looking basis the expected credit loss associated with its debt instruments carried at amortised cost and FVOCI. The impairment methodology applied depends on whether there has been a significant increase in credit risk.
For trade receivables, the Company and the Group apply the simplified approach permitted by SLFRS 9, ‘Financial Instruments’, which requires expected lifetime losses to be recognised from initial recognition of the receivables. To measure the expected credit losses, trade receivables have been grouped based on shared credit risk characteristics and the days past due. The expected loss rates are based on the payment profiles of customers and the corresponding historical credit losses experienced. The historical loss rates are adjusted to reflect current and forward-looking information on macroeconomic factors affecting the ability of the customers to settle the receivables.
2.9.5 Derecognition
Financial assets are derecognised when the rights to receive cash flows from the investments have expired or have been transferred and the Company and the Group have transferred substantially all risks and rewards of ownership.
2.9.6 Offsetting financial instruments
Financial assets and liabilities are offset and the net amount presented in the statement of financial position when there is a legally enforceable right to offset the recognised amounts and there is an intention to settle on a net basis, or realise the asset and settle the liability simultaneously. The legally enforceable right must not be contingent on future events and must be enforceable in the normal course of business and in the event of default, insolvency or bankruptcy of the Company or the counterparty.
2.9.7 Derivatives and hedging activities
Derivatives are initially recognised at fair value on the date a derivative contract is entered into and are subsequently remeasured to their fair value at the end of each reporting period.
An OverviewManagement Discussion & AnalysisCapitals ReportGovernance ReportFinancial ReportsSupplementary Information

100 Lanka Tiles PLC
The accounting for subsequent changes in fair value depends on whether the derivative is designated as a hedging instrument, and if so, the nature of the item being hedged. The Company and the Group designate certain derivatives as either:
i) Hedges of the fair value of recognised assets or liabilities or a firm commitment (fair value hedges),
ii) Hedges of a particular risk associated with the cash flows of recognised assets and liabilities and highly probable forecast transactions (cash flow hedges), or
iii) Hedges of a net investment in a foreign operation (net investment hedges).
2.10 Cash and cash equivalents
For the purpose of presentation in the statement of cash flows, cash and cash equivalents includes cash in hand, deposits held at call with financial institutions, other short-term highly liquid investments with original maturities of three (3) months or less that are readily convertible to known amounts of cash and which are subject to an insignificant risk of changes in value, and bank overdrafts.
In the Consolidated balance sheet, bank overdrafts are shown within borrowings in current liabilities.
2.11 Trade receivables
Trade receivables are amounts due from customers for merchandise sold or services performed in the ordinary course of business. If collection is expected in one year or less (or in the normal operating cycle of the business if longer), they are classified as current assets. If not, they are presented as non-current assets.
Trade receivables are recognised initially at fair value and subsequently measured at amortised cost using the effective interest method, less loss allowance.
2.12 Trade payables
Trade payables are obligations to pay for goods or services that have been acquired in the ordinary course of business from suppliers. Trade payable are classified as current liabilities if payment is due within one year or less (or in the normal operating cycle of the business if longer). If not, they are presented as non-current liabilities.
Trade payables are recognised initially at fair value and subsequently measured at amortised cost using the effective interest method.
2.13 Borrowings
“Borrowings are recognised initially at fair value, net of transaction costs incurred. Borrowings are subsequently carried at amortised cost; any difference between the proceeds (net of transaction costs) and the redemption value is recognised in the income statement over the period of the borrowings using the effective interest method.
“Fees paid on the establishment of loan facilities are recognised as transaction costs of the loan to the extent that it is probable that some or all of the facility will be drawn down. In this case, the fee is deferred until the draw-down occurs. To the extent there is no evidence that it is probable that some or all of the facility will be drawn down, the fee is capitalised as a pre-payment for liquidity services and amortised over the period of the facility to which it relates.
Borrowings are classified as current liabilities unless the Company and the Group have an unconditional right to defer settlement of the liability for at least twelve months after the end of the reporting period.
2.14 Property, plant and equipment
Property, plant and equipment other than land and buildings is stated at historical cost less accumulated depreciation. Historical cost includes expenditure that is directly attributable to the acquisition of the items and also includes the initial estimate of the costs of dismantling and removing the item and restoring the site on which it is located, the obligation for which an entity incurs either when the item is acquired or as a consequence of having used the item during a particular period for purposes other than to produce inventories during that period.
Land and buildings are shown at fair value based on a valuation performed by an external independent professional valuer. Where an item of property, plant and equipment is revalued, the entire class of such asset is revalued. Revaluations are made with sufficient regularity (every three or five years) to ensure that their carrying value do not differ materially from their fair value at the reporting date.
Increases in the carrying amount arising on revaluation of land and building is credited to other comprehensive income and shown as revaluation reserve in shareholders’ equity. Decreases that offset previous increases of the same asset are charged in other comprehensive income and debited against revaluation reserve directly in equity; all other decreases are charged to the statement of comprehensive income.
N O T E S T O T H E F I N A N C I A L S T A T E M E N T S
101Integrated Annual Report 2018/19
Subsequent costs are included in the asset’s carrying amount or recognised as a separate asset, as appropriate, only when it is probable that future economic benefits associated with the item will flow to the Company and the Group and the cost of the item can be measured reliably. The carrying amount of the replaced part is derecognised. All other repairs and maintenance are charged to the statement of comprehensive income during the financial period in which they are incurred.
Depreciation is calculated using the straight-line method to allocate their cost to their residual values over their estimated useful lives, as follows;
Land is not depreciated except for lands used for extracting mineral resources. Depreciation on other assets is calculated using the straight line method to allocate costs to their residual values over the estimated useful lives, as follows:
Roadway 50 years
Buildings 50 years
Plant and machinery 12- 20 years
Furniture, fittings and office equipment 5 years
Mobile equipment 3 years
Software packages 5 years
Tools and implements 2 years
Electricity distribution and water supply 10 years schemes
Motor vehicles 5 years
The assets’ residual values and useful lives are reviewed, and adjusted if appropriate, at end of each reporting period.
Where the carrying amount of an asset is greater than its estimated recoverable amount, it is written down immediately to its recoverable amount.
Gains and losses on disposals are determined by comparing the proceeds with the carrying amount and are recognised within ‘Other gains / (losses) – net’ in the statement of comprehensive income.
2.15 Investment property
Property that is held for long-term rental yields or for capital appreciation or both, is classified as investment property. Investment property also includes property that is being constructed or developed for future use as investment property. Land held under operating leases is classified and accounted for by the Group and Company as investment property when the definition of investment property would otherwise be met. The operating lease is accounted for as if it were a finance lease.
Investment property is measured initially at its cost, including related transaction costs and (where applicable) borrowing costs.
After initial recognition, investment property is accounted for under the fair value model. Subsequent expenditure is capitalised to the asset’s carrying amount only when it is probable that future economic benefits associated with the expenditure will flow to the Group and Company the cost of the item can be measured reliably. All other repairs and maintenance costs are expensed when incurred. When part of an investment property is replaced, the carrying amount of the replaced part is derecognised.
If an investment property becomes owner-occupied, it is reclassified as property, plant and equipment.
2.16 Impairmentofnonfinancialassets
Non financial assets are reviewed for impairment whenever events or changes in circumstances indicate that the carrying amount may not be recoverable. An impairment loss is recognised for the amount by which the asset’s carrying amount exceeds its recoverable amount. The recoverable amount is the higher of an asset’s fair value less costs to sell and value in use. For the purposes of assessing impairment, assets are grouped at the lowest levels for which there are separately identifiable cash flows (cash-generating units). Non-financial assets that suffered impairment are reviewed for possible reversal of the impairment at each reporting date.
2.17 Provisions
Provisions are recognised when the Company and the Group have a present legal or constructive obligation as a result of past events, when it is more probable that an outflow of resources will be required to settle the obligation and when a reliable estimate of the amount can be made. Provisions are not recognised for future operating losses.
Where there are a number of similar obligations, the likelihood that an outflow will be required in settlement is determined by considering the class of obligations as a whole. A provision is recognised even if the likelihood of an outflow with respect to any one item included in the same class of obligations may be small.
Provisions are measured at the present value of management’s best estimate of the expenditures required to settle the present obligation at the end of the reporting period. The discount rate used to determine the present value is a pre-tax rate that reflects current market assessments of the time value of money and the risks specific to the liability. The increase in the provision due to passage of time is recognised as finance cost.
An OverviewManagement Discussion & AnalysisCapitals ReportGovernance ReportFinancial ReportsSupplementary Information

102 Lanka Tiles PLC
2.18 Employeebenefits
(a) Defined benefit plans - gratuity
Defined benefit plan defines an amount of benefit that an employee will receive on retirement, usually dependent on one or more factors such as years of service and compensation. The defined benefit plan comprises the gratuity provided under the Act No 12 of 1983.
The liability recognised in the statement of financial position in respect of defined benefit plan is the present value of the defined benefit obligation at the end of the reporting period. The defined benefit obligation is calculated annually by independent actuaries using the projected unit credit method. The present value of the defined benefit obligation is determined by discounting the estimated future cash outflows using the yield rate of the long term government bonds that have terms to maturity approximating to the terms of the related defined benefit obligation.
“The net interest cost is calculated by applying the discount rate to the net balance of the defined benefit obligation and included in employee benefit expense in the profit or loss. Remeasurement gains and losses arising from experience adjustments and changes in actuarial assumptions are charged or credited to equity in other comprehensive income in the period in which they arise and will not be reclassified to the profit or loss. They are included in retained earnings in the statement of changes in equity and in the balance sheet.”
Past service costs are recognised immediately in the profit or loss.
The assumptions based on which the results of the actuarial valuation was determined, are included in note 17 to the financial statements.
(b) Defined contribution plans
For defined contribution plans, such as the Employees’ Provident Fund and Employees’ Trust Fund, the Company and the Group contributes 12% and 3% respectively, of the employees’ basic or consolidated wage or salary. The Company and the Group have no further payment obligations once the contributions have been paid. The Company and the employees are members of these defined contribution plans.
(c) Short term employee benefits
Wages, salaries, bonuses and non-monetary benefits are accrued in the period in which the associated services are rendered by employees of the Company and the Group.
2.19 Stated capital
“Ordinary shares are classified as equity. Incremental costs directly attributable to the issue of new ordinary shares or options are shown in equity as a deduction, net of tax, from the proceeds.
Where any group company purchases the Company’s equity share capital (treasury shares), the consideration paid, including any directly attributable incremental costs (net of income taxes) is deducted from equity attributable to the Company’s equity holders until the shares are cancelled or reissued. Where such ordinary shares are subsequently reissued, any consideration received, net of any directly attributable incremental transaction costs and the related income tax effects, is included in equity attributable to the Company’s equity holders.
2.20 Dividend distribution
Dividend distribution to the Company’s shareholders is recognised as a liability in the Company’s financial statements in the period in which the dividends are approved by the Company’s shareholders.
2.21 Revenue recognition
a) Revenue from contracts with customers
Goods and services deliverable under contracts with customers are identified as separate performance obligations (‘obligations’) to the extent that the customer can benefit from the goods or services on their own or together with other resources that are readily available to the customer and that the separate goods and services are considered distinct from other goods and services in the agreement. Where individual goods and services do not meet the criteria to be identified as separate obligations they are aggregated with other goods and/or services in the agreement until a separate obligation is identified.“The group manufactures and sells glazed ceramic and porcelain floor tiles through network of dealers and distributors. Sales are recognised when control of the products has transferred, being when the products are delivered to the customers.
The Company and the Group determines the transaction price to which it expects to be entitled to in return for providing the promised obligations to the customer based on the committed contractual amounts, net of sales taxes and discounts. The transaction price is allocated between the identified obligations according to the relative standalone selling prices of the obligations. The standalone selling price of each obligation deliverable in the contract is determined
N O T E S T O T H E F I N A N C I A L S T A T E M E N T S

103Integrated Annual Report 2018/19
according to the prices that the Company and the Group would achieve by selling the same goods and/or services included in the obligation to a similar customer on a standalone basis. Where the Group does not sell equivalent goods or services in similar circumstances on a standalone basis it is necessary to estimate the standalone price. When estimating the standalone price, the Group maximises the use of external input; observing the standalone prices for similar goods and services when sold by third parties or using a cost-plus reasonable margin approach.
Revenue is recognised when the respective obligations in the contract are delivered to the customer and payment remains probable. The revenue is recognised as follows:
(a) Sale of goods
The group manufactures and sells glazed ceramic and porcelain floor tiles through a network of dealers and distributors. Sales are recognised when control of the products has transferred, being when the products are delivered to the customer. Revenue from the sales is recognised based on the price specified in the contract and revenue is only recognised to the extent that it is highly probable that a significant reversal will not occur.
(b) Interest income
Interest income is recognised using the effective interest method. When a loan granted or a receivable is impaired, the Company and the Group reduce the carrying amount to its recoverable amount, being the estimated future cash flow discounted at the original effective interest rate of the instrument, and continue unwinding the discount as interest income. Interest income on impaired loan and receivables are recognised using the original effective interest rate. Interest income on bank balances and bank deposits are recognised on accrual basis.
(c) Dividend income
Dividend income is recognised when the right to receive payment is established.
(d) Rental income
Rental income is recognised on an accrual basis.
2.22 Leases
Leases in which a significant portion of the risks and rewards of ownership are retained by the lessor are classified as operating leases. Payments made under operating leases (net of any incentives received from the lessor) are charged to the statement of comprehensive income on a straight-line basis over the period of the lease.
The Company and the Group lease certain property, plant and equipment. Leases of property, plant and equipment
where the Company and the Group have substantially all the risks and rewards of ownership are classified as finance leases. Finance leases are capitalised at the lease’s commencement at the lower of the fair value of the leased property and the present value of the minimum lease payments.
Each lease payment is allocated between the liability and finance charges. The corresponding rental obligations, net of finance charges, are included in other long-term payables. The interest element of the finance cost is charged to the statement of comprehensive income over the lease period so as to produce a constant periodic rate of interest on the remaining balance of the liability for each period. The property, plant and equipment acquired under finance leases is depreciated over the shorter of the useful life of the asset and the lease term.
2.23 Segment reporting
The Company and the Group do not identify any segments for reporting purposes.
3 CRITICAL ACCOUNTING ESTIMATES AND JUDGMENTS
3.1 Critical accounting estimates and assumptions
The Company and the Group make estimates and assumptions concerning the future. The resulting accounting estimates will, by definition, rarely equal the related actual results. The estimates and assumptions that have a significant risk of causing a material adjustment to the carrying amounts of assets and liabilities within the next financial year are outlined below:
(a) Defined benefit plans - gratuity
The present value of the defined benefit plan depends on a number of factors that are determined on an actuarial basis using a number of assumptions. The assumptions used in determining the net cost (income) for defined benefit plan include the discount rate, future salary increases etc. Any changes in these assumptions will impact the carrying amount of defined benefit plan.
(b) Estimated useful lives of PPE
Management reviews annually the useful lives and carrying values of assets. This require estimates and judgment.
The useful lives of the assets are estimated by the Company and the Group as detailed in Note 2.14.
(c) Impairment of non financial assets
The Company and the Group annually test the indicators to ascertain whether non-current assets (including intangibles) have suffered any impairment. These calculations require the use of estimates.
An OverviewManagement Discussion & AnalysisCapitals ReportGovernance ReportFinancial ReportsSupplementary Information

104 Lanka Tiles PLC
3.2 Critical judgments in applying the Company’s accounting policies
In the process of applying the accounting policies, management has made the following judgments, apart from those involving estimations, which has the most significant effect on the amounts recognised in the financial statements.
(a) Taxation
(i) Income Taxes
Judgement is involved in determining the company’s and the Group’s provision for income taxes. There are certain transactions and computations for which the income taxes. There are certain transactions and computations for which the ultimate tax determination is certain during the ordinary course of business. The Company and the Group recognise liabilities for tax matters based on estimates of whether additional taxes will be due. If the final outcome of these tax matters results in a difference in the amounts initially recognised, such differences will impact the income tax and low deferred income tax provisions in the period which such determination is made.
(ii) Deferred tax asset
Deferred income tax assets are recognised to the extent that it is probable that future taxable profit will be available against which temporary differences can be utilised. This involves judgment regarding future financial performance of a particular entity in which the deferred income tax asset has been recognised.
(b) Impairment of trade receivables The Company and the Group review all receivables at the date of statement of financial position to assess whether an allowance should be recorded in the statement of compre-hensive income. Management uses judgment in estimating such amounts in the light of the duration of outstanding and any other factors management are aware of that indicates uncertainty in recovery.
(c) Fair value of investment property.
Fair value is estimated by using valuation techniques, with changes in fair value reflected the statement of comprehen-sive income. Fair values are estimated by reference in part to published price quotations and in part by using valuation techniques.
4 FINANCIAL RISK MANAGEMENT
The Company’s and the Group’s activities are exposed to variety of financial risks: market risk (including currency risk, fair value interest rate risk, cash flow interest rate risk and price risk), credit risk and liquidity risk.
The Company’s and the Group’s overall financial risk management programme focus on the unpredictability of financial markets and seek to minimise potential adverse effects on the financial performance of the Company and the Group. Financial risk management is carried out through risk reviews, internal control systems, insurance programmes and adherence to the Company’s and the Group’s financial risk management policies. The board of directors regularly reviews these risks and approves the risk management policies, which covers the management of these risks.
Market risk consists of:
(i) Foreign exchange risk – risk that the value of recognised assets and liabilities, future commercial transactions will fluctuate due to changes in foreign exchange rates.
(ii) Fair value interest rate risk – risk that the value of a financial instrument will fluctuate due to changes in market interest rates.
(iii) Cash flow interest rate risk – risk that future cash flows associated with a financial instrument will fluctuate.
(iv) Price risk – risk that the value of a financial instrument will fluctuate as a result of changes in market prices, whether those changes are caused by factors specific to the individual instrument or its issuer or factors affecting all instrument traded in the market.
Credit risk – risk that one party to a financial instrument will fail to discharge an obligation and cause the other party to incur a financial loss (refer note 9).
Liquidity risk (Funding risk) – risk that an entity will encounter difficulty in raising funds to meet commitments associated with operational and financial obligations.
Foreign exchange risk
The Company and the Group operate internationally and are exposed to foreign exchange risk arising from various currency exposures, primarily with respect to the USD and EURO. Foreign exchange risk arises when future commercial transactions or recognised assets or liabilities are denominated in a currency that is not the entity’s functional currency.
As at end of the reporting period, if the functional currency (LKR) had weakened/strengthened by 5% against the US dollar with all other variables held constant, post-tax profit for the year would have been Rs 7,539,218 (2018: Rs 9,525,005 ) lower/higher, mainly as a result of foreign exchange gains/losses on translation of US dollar-denominated loans granted, trade receivables and trade creditors.
N O T E S T O T H E F I N A N C I A L S T A T E M E N T S

105Integrated Annual Report 2018/19
As at end of the reporting period, if the functional currency (LKR) had weakened/strengthened by 5% against the EURO with all other variables held constant, post-tax profit for the year would have been Rs 2,976,306 (2018: Rs 6,042,938) lower/higher, mainly as a result of foreign exchange gains/losses on translation of EURO-denominated trade creditors.
Cashflowandfairvalueinterestraterisk
The Company’s and the Group’s interest rate risk arise from long-term borrowings issued at variable rates. The Company and the Group manage their interest rate risk by actively monitoring the yield curve trend and interest rate movement with reference to AWPLR and SLIBOR for the various financial instruments.
The Company’s and the Group’s borrowings comprise borrowings from financial institutions. The Company’s and the Group’s interest rate risk objective is to manage an acceptable level of rate fluctuation on the interest expense. In order to achieve this objective, the Company and the Group target floating borrowings based on assessment of its existing exposure and desirable interest rate profile. The Company and the Group analyse their interest rate exposure on a dynamic basis.
At 31 March 2019, if interest rates on Sri Lankan rupee-denominated borrowings at that date had been 0.5% higher/lower with all other variables held constant, pre-tax profit for the year would have been Rs. 8,558,380 (2018 - Rs. 1,051,815) lower/higher, mainly as a result of higher/lower interest expense on floating rate borrowings.
Credit risk
Credit risk arises from cash and cash equivalents, deposits with banks, as well as credit exposures to customers, including outstanding receivables. Trade receivables are mainly secured with bank guarantees given by customers in favour of the Company and the Group. Individual credit limits are set based on the amount of the bank guarantee. The utilisation of credit limits is regularly monitored.
The Company and the Group place their cash and cash equivalents with a number of creditworthy financial institutions. The Company’s and the Group’s policy limits the concentration of financial exposure to any single financial institution. The maximum credit risk exposure of the financial assets of the Company and the Group is approximately their carrying amounts as at balance sheet date, except for trade receivables which are secured by bank guarantees.
Liquidity risk
Prudent liquidity risk management implies maintaining sufficient liquid funds to meet its financial obligations.
In the management of liquidity risk, the Company and the Group monitor and maintain a level of cash and cash equivalents deemed adequate by management to finance the Company’s and the Group’s operations and to mitigate the effects of fluctuations in cash flows. Due to the dynamic nature of the underlying business, the Company and the Group aim at maintaining flexibility in funding by keeping both committed and uncommitted credit lines available. The Company and the Group use both short term bank facilities (overdrafts) together with cash in hands and in banks in managing the liquidity position.
The table below analyses the Company’s and the Group’s non-derivative financial liabilities into relevant maturity groupings based on the remaining period at the balance sheet date to the contractual maturity date. The amounts disclosed in the table are the contractual undiscounted cash flows.
At 31 March 2019 Less than 3 months
Between 3 months and 1 year
Between year 1 and year 2
Between year 2 and year 5
Over 5 years
Borrowings 646,723 104,166 250,000 1,101,169 - Trade and other payables 881,185 - - - -
At 31 March 2018 Less than 3 months
Between 3 months and 1 year
Between year 1 and year 2
Between year 2 and year 5
Over 5 years
Borrowings 163,016 31,012 7,374 - - Trade and other payables 269,433 - - - -
An OverviewManagement Discussion & AnalysisCapitals ReportGovernance ReportFinancial ReportsSupplementary Information
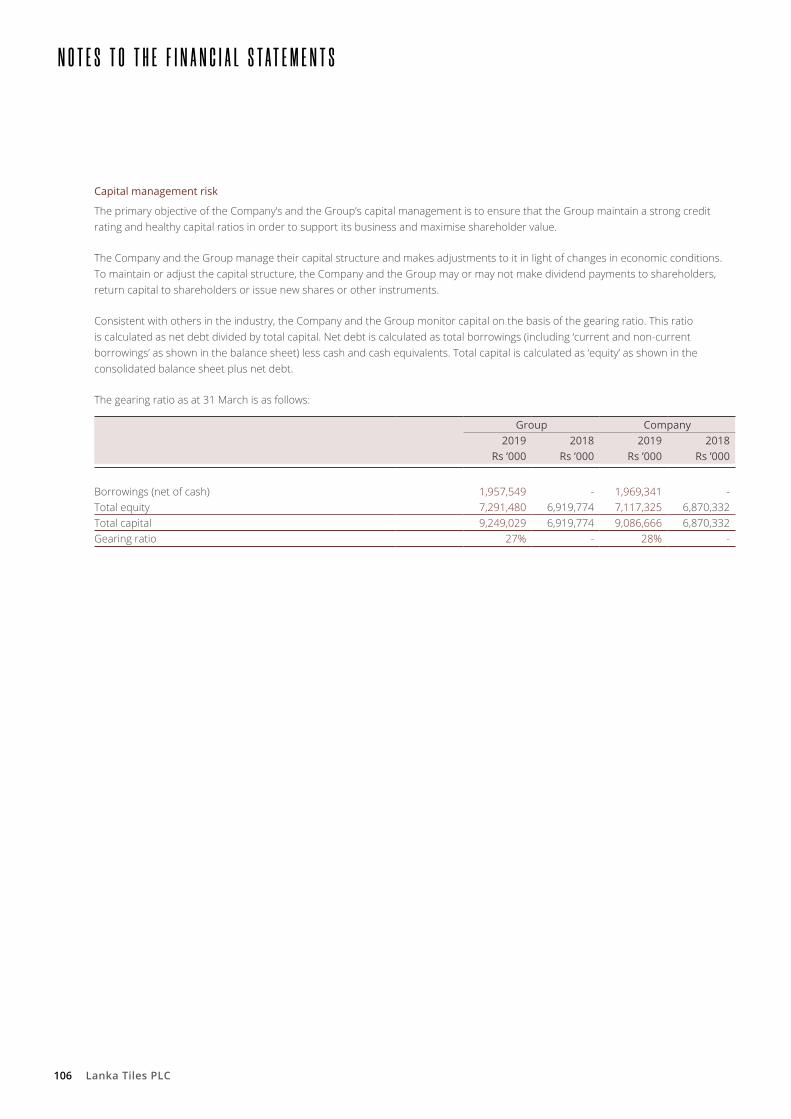
106 Lanka Tiles PLC
Capital management risk
The primary objective of the Company’s and the Group’s capital management is to ensure that the Group maintain a strong credit rating and healthy capital ratios in order to support its business and maximise shareholder value.
The Company and the Group manage their capital structure and makes adjustments to it in light of changes in economic conditions. To maintain or adjust the capital structure, the Company and the Group may or may not make dividend payments to shareholders, return capital to shareholders or issue new shares or other instruments.
Consistent with others in the industry, the Company and the Group monitor capital on the basis of the gearing ratio. This ratio is calculated as net debt divided by total capital. Net debt is calculated as total borrowings (including ‘current and non-current borrowings’ as shown in the balance sheet) less cash and cash equivalents. Total capital is calculated as ‘equity’ as shown in the consolidated balance sheet plus net debt.
The gearing ratio as at 31 March is as follows:
Group Company2019 2018 2019 2018
Rs ’000 Rs ’000 Rs ’000 Rs ’000
Borrowings (net of cash) 1,957,549 - 1,969,341 - Total equity 7,291,480 6,919,774 7,117,325 6,870,332 Total capital 9,249,029 6,919,774 9,086,666 6,870,332 Gearing ratio 27% - 28% -
N O T E S T O T H E F I N A N C I A L S T A T E M E N T S

107Integrated Annual Report 2018/19
5
PRO
PERT
Y, P
LAN
T AN
D E
QU
IPM
ENT
(a) G
roup
Fre
ehol
d an
d cl
ay
min
ing
land
Free
hold
bu
ildin
g Pl
ant &
m
achi
nery
Fu
rnitu
re,
fittingsand
el
ectr
ical
ap
plia
nces
Too
ls &
im
plem
ents
Wat
er
supp
ly
sche
me
Ele
ctri
cal
dist
ribu
tion
sche
me
Mot
or
vehi
cles
R
oadw
ay
Capi
tal
wor
k in
pr
ogre
ss
(CW
IP)
Tot
al
Rs. ‘
000
Rs. ‘
000
Rs. ‘
000
Rs. ‘
000
Rs. ‘
000
Rs. ‘
000
Rs. ‘
000
Rs. ‘
000
Rs. ‘
000
Rs. ‘
000
Rs. ‘
000
Year
end
ed 3
1 M
arch
201
8Co
st /
valu
atio
n 1
,128
,234
9
28,0
84
2,8
83,0
01
247
,893
1
1,08
9 2
9,93
3 2
30,7
36
98,
932
23,
116
30,
909
5,6
11,9
27
Accu
mul
ated
dep
reci
atio
n -
(2
6,42
8)(1
,527
,690
) (1
81,7
07)
(9,4
14)
(21,
009)
(159
,703
) (7
2,84
2) (4
,344
) -
(2
,003
,137
)N
et b
ook
valu
e 1
,128
,234
9
01,6
56
1,3
55,3
11
66,
186
1,6
75
8,9
24
71,
033
26,
090
18,
772
30,
909
3,6
08,7
90
Year
end
ed 3
1 M
arch
201
7Ba
lanc
e as
at 1
Apr
il 20
17 1
,128
,234
9
01,6
56
1,3
55,3
11
66,
186
1,6
75
8,9
24
71,
033
26,
090
18,
772
30,
909
3,6
08,7
90
Addi
tions
3
90
-
36,
766
24,
561
1,3
23
26
-
1,4
00
-
337
,709
4
02,1
75
Land
tran
sfer
red
to in
vest
men
t pro
pert
y46
,080
3
7,21
3 -
-
-
-
-
-
-
-
8
3,29
3 Ad
ditio
ns tr
ansf
erre
d fr
om C
WIP
-
386
1
8,10
0 7
89
-
-
828
-
9
98
(21,
101)
-
Dep
reci
atio
n ch
arge
for t
he y
ear
-
(26,
554)
(149
,455
) (3
1,25
2) (1
,312
) (1
,788
) (1
4,11
6) (1
1,28
4) (4
75)
-
(236
,236
)D
ispo
sals
-
-
(3,5
32)
(1,0
71)
-
-
-
(9,9
48)
-
-
(14,
551)
Dep
reci
atio
n on
dis
posa
ls -
-
1
,320
8
49
-
-
-
9,9
36
-
-
12,
105
Net
boo
k va
lue
1,1
74,7
04
912
,701
1
,258
,510
6
0,06
2 1
,686
7
,162
5
7,74
5 1
6,19
4 1
9,29
5 3
47,5
17
3,8
55,5
76
Year
end
ed 3
1 M
arch
201
8Co
st /
valu
atio
n 1
,174
,704
9
12,7
01
2,9
34,3
35
272
,172
1
2,41
2 2
9,95
9 2
31,5
64
90,
384
24,
114
347
,517
6
,029
,862
Ac
cum
ulat
ed d
epre
ciat
ion
-
-
(1,6
75,8
25)
(212
,110
) (1
0,72
6) (2
2,79
7) (1
73,8
19)
(74,
190)
(4,8
19)
-
(2,1
74,2
86)
Net
boo
k va
lue
1,1
74,7
04
912
,701
1
,258
,510
6
0,06
2 1
,686
7
,162
5
7,74
5 1
6,19
4 1
9,29
5 3
47,5
17
3,8
55,5
76
Year
end
ed 3
1 M
arch
201
9Ba
lanc
e as
at 1
Apr
il 20
18 1
,174
,704
9
12,7
01
1,2
58,5
10
60,
062
1,6
86
7,1
62
57,
745
16,
194
19,
295
347
,517
3
,855
,576
Ad
ditio
ns
792
-
1
,592
,696
3
7,31
2 3
,508
2
,715
3
9,23
2 1
3,86
4 -
4
72,2
96
2,1
62,4
15
Reva
luat
ion
surp
lus
-
-
-
-
-
-
-
-
-
. -
Ad
ditio
ns tr
ansf
erre
d fr
om C
WIP
-
7,1
40
403
,744
8
,275
-
8
06
18,
711
-
12,
387
(451
,063
) -
D
epre
ciat
ion
char
ge fo
r the
yea
r -
(2
8,80
0) (1
84,4
39)
(26,
385)
(1,5
52)
(1,9
43)
(13,
758)
(10,
120)
(555
) -
(2
67,5
52)
Dis
posa
ls -
(5
36)
(18,
009)
(471
) -
-
-
(8
9) -
-
(1
9,10
5)D
epre
ciat
ion
on d
ispo
sals
-
102
1
1,22
1 3
84
-
-
-
89
-
-
11,
796
Net
boo
k va
lue
1,1
75,4
96
890
,607
3
,063
,723
7
9,17
7 3
,642
8
,740
1
01,9
30
19,
938
31,
127
368
,750
5
,743
,130
Year
end
ed 3
1 M
arch
201
9Co
st /
valu
atio
n 1
,175
,496
9
19,3
05
4,9
12,7
66
317
,288
1
5,92
0 3
3,48
0 2
89,5
07
104
,159
3
6,50
1 3
68,7
50
8,1
73,1
72
Accu
mul
ated
dep
reci
atio
n -
(2
8,69
8)
(1,8
49,0
43)
(238
,111
) (1
2,27
8) (2
4,74
0) (1
87,5
77)
(84,
221)
(5,3
74)
-
(2,4
30,0
42)
Net
boo
k va
lue
1,1
75,4
96
890
,607
3
,063
,723
7
9,17
7 3
,642
8
,740
1
01,9
30
19,
938
31,
127
368
,750
5
,743
,130
An OverviewManagement Discussion & AnalysisCapitals ReportGovernance ReportFinancial ReportsSupplementary Information

108 Lanka Tiles PLC
N O T E S T O T H E F I N A N C I A L S T A T E M E N T S 5
PR
OPE
RTY,
PLA
NT
AND
EQ
UIP
MEN
T
(b) C
ompa
ny F
reeh
old
and
clay
m
inin
g la
nd
Free
hold
bu
ildin
g Pl
ant &
m
achi
nery
Fu
rnitu
re,
fittingsand
el
ectr
ical
ap
plia
nces
Too
ls &
im
plem
ents
Wat
er
supp
ly
sche
me
Ele
ctri
cal
dist
ribu
tion
sche
me
Mot
or
vehi
cles
R
oadw
ay
Capi
tal
wor
k in
pr
ogre
ss
(CW
IP)
Tot
al
Rs. ‘
000
Rs. ‘
000
Rs. ‘
000
Rs. ‘
000
Rs. ‘
000
Rs. ‘
000
Rs. ‘
000
Rs. ‘
000
Rs. ‘
000
Rs. ‘
000
Rs. ‘
000
Year
end
ed 3
1 M
arch
201
7Co
st /
valu
atio
n 1
,128
,234
9
28,0
84
2,8
83,0
01
247
,893
1
1,08
9 2
9,93
3 2
30,7
36
98,
932
23,
116
30,
909
5,6
11,9
27
Accu
mul
ated
dep
reci
atio
n -
(2
6,42
8)(1
,527
,690
) (1
81,7
07)
(9,4
14)
(21,
009)
(159
,703
) (7
2,84
2) (4
,344
) -
(2
,003
,137
)N
et b
ook
valu
e 1
,128
,234
9
01,6
56
1,3
55,3
11
66,
186
1,6
75
8,9
24
71,
033
26,
090
18,
772
30,
909
3,6
08,7
90
Year
end
ed 3
1 M
arch
201
8Ba
lanc
e as
at 1
Apr
il 20
17 1
,128
,234
9
01,6
56
1,3
55,3
11
66,
186
1,6
75
8,9
24
71,
033
26,
090
18,
772
30,
909
3,6
08,7
90
Addi
tions
3
90
-
36,
766
24,
561
1,3
23
26
-
1,4
00
-
337
,709
4
02,1
75
Land
tran
sfer
red
to in
vest
men
t pro
pert
y46
,080
3
7,21
3 -
-
-
-
-
-
-
-
8
3,29
3 Ad
ditio
ns tr
ansf
erre
d fr
om C
WIP
-
386
1
8,10
0 7
89
-
-
828
-
9
98
(21,
101)
-
Dep
reci
atio
n ch
arge
for t
he y
ear
-
(26,
554)
(149
,455
) (3
1,25
2) (1
,312
) (1
,788
) (1
4,11
6) (1
1,28
4) (4
75)
-
(236
,236
)D
ispo
sals
-
-
(3,5
32)
(1,0
71)
-
-
-
(9,9
48)
-
-
(14,
551)
Dep
reci
atio
n on
dis
posa
ls -
-
1
,320
8
49
-
-
-
9,9
36
-
-
12,
105
Net
boo
k va
lue
1,1
74,7
04
912
,701
1
,258
,510
6
0,06
2 1
,686
7
,162
5
7,74
5 1
6,19
4 1
9,29
5 3
47,5
17
3,8
55,5
76
Year
end
ed 3
1 M
arch
201
8Co
st /
valu
atio
n 1
,174
,704
9
12,7
01
2,9
34,3
35
272
,172
1
2,41
2 2
9,95
9 2
31,5
64
90,
384
24,
114
347
,517
6
,029
,862
Ac
cum
ulat
ed d
epre
ciat
ion
-
-
(1,6
75,8
25)
(212
,110
) (1
0,72
6) (2
2,79
7) (1
73,8
19)
(74,
190)
(4,8
19)
-
(2,1
74,2
86)
Net
boo
k va
lue
1,1
74,7
04
912
,701
1
,258
,510
6
0,06
2 1
,686
7
,162
5
7,74
5 1
6,19
4 1
9,29
5 3
47,5
17
3,8
55,5
76
Year
end
ed 3
1 M
arch
201
9Ba
lanc
e as
at 1
Apr
il 20
18 1
,174
,704
9
12,7
01
1,2
58,5
10
60,
062
1,6
86
7,1
62
57,
745
16,
194
19,
295
347
,517
3
,855
,576
Ad
ditio
ns
792
-
1
,592
,696
3
7,31
2 3
,508
2
,715
3
9,23
2 1
3,86
4 -
4
72,2
96
2,1
62,4
15
Reva
luat
ion
surp
lus
-
-
-
-
-
-
-
-
-
. -
Ad
ditio
ns tr
ansf
erre
d fr
om C
WIP
-
7,1
40
403
,744
8
,275
-
8
06
18,
711
-
12,
387
(451
,063
) -
D
epre
ciat
ion
char
ge fo
r the
yea
r -
(2
8,80
0) (1
84,4
39)
(26,
385)
(1,5
52)
(1,9
43)
(13,
758)
(10,
120)
(555
) -
(2
67,5
52)
Dis
posa
ls -
(5
36)
(18,
009)
(471
) -
-
-
(8
9) -
-
(1
9,10
5)D
epre
ciat
ion
on d
ispo
sals
-
102
1
1,22
1 3
84
-
-
-
89
-
-
11,
796
Net
boo
k va
lue
1,1
75,4
96
890
,607
3
,063
,723
7
9,17
7 3
,642
8
,740
1
01,9
30
19,
938
31,
127
368
,750
5
,743
,130
Year
end
ed 3
1 M
arch
201
9Co
st /
valu
atio
n 1
,175
,496
9
19,3
05
4,9
12,7
66
317
,288
1
5,92
0 3
3,48
0 2
89,5
07
104
,159
3
6,50
1 3
68,7
50
8,1
73,1
72Ac
cum
ulat
ed d
epre
ciat
ion
-
(28,
698)
(1
,849
,043
) (2
38,1
11)
(12,
278)
(24,
740)
(187
,577
) (8
4,22
1) (5
,374
) -
(2
,430
,042
)N
et b
ook
valu
e 1
,175
,496
8
90,6
07
3,0
63,7
23
79,
177
3,6
42
8,7
40
101
,930
1
9,93
8 3
1,12
7 3
68,7
50
5,7
43,1
30

109Integrated Annual Report 2018/19
5 PROPERTY, PLANT AND EQUIPMENT (CONTD)
(a) Property, plant and equipment of the Group / Company include fully depreciated assets in use at 31 March 2019, the cost of which amounted to the Group / Company Rs. 816,336,747 (2018 - Rs. 621,328,751).
(b) The bank borrowings are secured on freehold land, freehold building and plant and machinery. The values of assets secured is given in Note 15 to the financial statements.
(c) Valuation of the Company’s land and buildings was performed by the independent valuer Mr. R. J. Samarakone on 31 March 2018. The revaluation surplus net of applicable deferred income taxes was credited to other comprehensive income and is shown in revaluation reserve in shareholders equity. Different levels of fair valuation methods have been defined as follows:
- Quoted prices (unadjusted) in active market for identical assets or liabilities (Level 1);
- Inputs other than quoted prices with in level 1 that are observable for the asset or liability, either directly (that is, as prices) or indirectly (that is, derived from prices) (Level 2);
- Input for the assets or liability that are not based on observable market data (that is, unobservable inputs) (Level 3).
The fair values of land and buildings have been derived by level 2 valuation method using the sales comparison approach. Sales prices of comparable properties in close proximity were adjusted for differences in key attributes such as property size, site improvements and access to public roads. The most significant input into this valuation approach was market price per perch of land and square feet of buildings.
The land and buildings were stated at the historical cost basis, the amounts would be as follows:
Cost Accumulateddepreciation
Carrying value
(Rs ’000) (Rs ’000) (Rs ’000)
Land 1,175,496 - 1,175,496 Buildings 919,305 (28,698) 890,607
2,094,801 (28,698) 2,066,103
6 INVESTMENT PROPERTY
Group Company2019 2018 2019 2018
Rs ’000 Rs ’000 Rs ’000 Rs ’000
Opening balance 223,800 223,800 - - Transfer from property plant and equipment - - - - Disposal - - - - Net gain/(Loss) from fair value adjustment 171,019 - - - Closing balance 394,819 223,800 - -
An OverviewManagement Discussion & AnalysisCapitals ReportGovernance ReportFinancial ReportsSupplementary Information

110 Lanka Tiles PLC
The group has leased out its land under cancellable operating lease arrangements to its affiliated company - LWL Development (Private) Limited. This property has been classified as investment property in accordance with LKAS 40 Investment Property (“LKAS 40”). The Group has initially accounted for the investment property at cost, and subsequently accounted for it under the fair value model.
Amounts recognised in profit or loss in relation to investment properties
Group Company2019 2018 2019 2018
Rs ’000 Rs ’000 Rs ’000 Rs ’000
Rental income 1,200 1,200 - - 1,200 1,200 - -
Details of the valuation of the investment property (freehold land) carried out by the independent valuer Mr. R. J. Samarakone are as follows:
Total extent of land 48 acre - 3 rood - 17.9 perches Total valuation for land 394,819,000 Location Agalagedara Village, Divulapitiya, Gampaha Date of valuation 31 March 2019
Details of entities in which the Company had control as at 31 March 2019 are set out below.
- Quoted prices (unadjusted) in active market for identical assets or liabilities (Level 1);
- Inputs other than quoted prices with in level 1 that are observable for the asset or liability, either directly (that is, as prices) or indirectly (that is, derived from prices) (Level 2);
- Input for the assets or liability that are not based on observable market data (that is, unobservable inputs) (Level 3).
The fair values of Investment Property have been derived by level 2 valuation method using the sales comparison approach. Sales prices of comparable properties in close proximity were adjusted for differences in key attributes such as property size, site improvements and access to public roads. The most significant input into this valuation approach was market price per perch of land.
7 INVESTMENT IN SUBSIDIARIES
Details of entities in which the Company had control as at 31 March 2019 are set out below,
Number ofshares
2019 2018Name of the subsidiary % Holding Rs Rs
Beyond Paradise Collection (Private) Limited (a) 1 100 10 10 Lankatiles Private Limited (b) 255,000 51 6,241,727 6,241,727 LTL Development (Private) Limited (c') 1 100 10 10
a) The Company invested in one share of Beyond Paradise Collection (Private) Limited amounting to Rs.10/-. The principal business of the subsidiary is holding and developing the property of the Company.
b) The Company invested in two hundred fifty five thousand shares of Lankatiles Private Limited amounting to Rs.24.47/- (IND Rs. 10/-). The principal business of the subsidiary is distribution of Tiles in India.
c) The Company invested in one share of LTL Development (Private) Limited amounting to Rs.10/-. The principal business of the subsidiary is holding and developing the property of the Company.
N O T E S T O T H E F I N A N C I A L S T A T E M E N T S

111Integrated Annual Report 2018/19
8 INVESTMENT IN ASSOCIATE
Number of shares
Group Company2019 2018 2019 2018
Rs ’000 Rs ’000 Rs ’000 Rs ’000
Opening net book amount 933,633 881,052 933,633 881,052 Share of results of associate for the year 12,798 96,432 12,798 96,432 Dividend received (22,507) (43,851) (22,507) (43,851)At the end of year 13,085,180 923,924 933,633 923,924 933,633
(a) The Company holds 47.8% (2018 - 47.8%) ownership interest in Swisstek (Ceylon) PLC. The principal activities of Swisstek (Ceylon) PLC are manufacturing and selling of Tile Grout and Tile Mortar. Its subsidiary Swisstek Aluminium Limited manufacture and sells aluminium extrusions.
(b) The market value of quoted associate investment as at date of consolidated balance sheet is Rs. 455,364,264 (2018 - Rs. 775,951,174).
(c) The Company’s share of the results of the associate and its summarised financial information are as follows:
2019 2018Rs ’000 Rs ’000
Current AssetsCash and Cash equivalents 130,085 65,632 Other current assets 3,557,013 2,777,972 Total current assets 3,687,098 2,843,604 Non current assets 2,825,803 2,586,802
Current liabilities 3,450,685 2,366,007 Non current liabilities 960,904 920,784 Net Assets 2,101,312 2,143,615
Summarised Statement of comprehensive income
Revenue 4,294,028 4,077,367 Gross profit 821,942 1,188,604 Profit attributable to owners of the Company for the year 16,501 345,989 Total comprehensive income attributable to owners of the Company 10,274 (144,249)
% interest held 47.8 47.8
Share of profit 7,888 165,383 Share of other comprehensive income 4,911 (68,951)
An OverviewManagement Discussion & AnalysisCapitals ReportGovernance ReportFinancial ReportsSupplementary Information

112 Lanka Tiles PLC
9 FINANCIAL INSTRUMENTS BY CATEGORY
31 March 2019 Amortised costGroup Company
Rs ’000 Rs ’000
Assets as per the consolidated Statement of Financial positionTrade and other receivables (excluding pre-payments) (Note 12) 1,398,558 1,570,874 Cash and cash equivalents (Note 13) 144,509 132,717 Total 1,543,067 1,703,591
31 March 2019 OtherfinancialliabilitiesGroup Company
Rs ’000 Rs ’000
Liabilities as per the consolidated Statement of Financial positionBorrowings (excluding finance lease liabilities) (Note 15) 2,102,058 2,102,058 Trade and other payables excluding non-financial liabilities (Note 14) 1,571,843 1,571,590 Total 3,673,901 3,673,648
31 March 2018 Amortised costGroup Company
Rs ’000 Rs ’000
Assets as per the consolidated Statement of Financial positionLoans given to related companies (Note 12) 21,797 21,797 Trade and other receivables (excluding pre-payments) (Note 12) 1,180,228 1,353,576 Cash and cash equivalents (Note 13) 444,998 433,975 Total 1,647,023 1,809,348
31 March 2018 OtherfinancialliabilitiesGroup Company
Rs ’000 Rs ’000
Liabilities as per the consolidated Statement of Financial position Borrowings (excluding finance lease liabilities) (Note 15) 201,402 201,402 Trade and other payables excluding non-financial liabilities (Note 14) 782,195 781,972 Total 983,597 983,374
N O T E S T O T H E F I N A N C I A L S T A T E M E N T S

113Integrated Annual Report 2018/19
10 CREDIT QUALITY OF FINANCIAL ASSETS
The credit quality of financial assets that are neither past due nor impaired can be assessed by reference to external credit ratings (if available) or to extent of collaterals provided by counter parties:
Group Company2019 2018 2019 2018
Rs ’000 Rs ’000 Rs ’000 Rs ’000
Trade receivablesCounterparties without external credit ratingsGroup 1 204,330 204,501 204,330 204,501 Group 2 48,666 56,793 48,666 56,793 Group 3 198,199 249,761 198,199 249,761 Total trade receivables 451,195 511,055 451,195 511,055
Group Company2019 2018 2019 2018
Rs ’000 Rs ’000 Rs ’000 Rs ’000
Cash at bank and short-term bank deposits AA + 1,812 48,839 1,812 46,397 AA 80,816 162,451 80,816 162,451 A 517 1,070 517 1,070 A + - 532 - 532 AA - 21,220 224,696 9,428 216,115 BB + 320 - 320 - Counterparties without external credit rating 38,322 6,309 38,322 6,309 Total 143,007 443,897 131,215 432,874
Group 1 – Customers whose due amounts are secured with bank guarantees.
Group 2 – Customers whose due amounts are secured with documentary credits.
Group 3 – Customers whose due amounts are not secured with any collaterals.
11 INVENTORIES
Group Company2019 2018 2019 2018
Rs ’000 Rs ’000 Rs ’000 Rs ’000
Raw materials 988,884 749,435 988,884 749,435 Work in progress 50,572 35,766 50,572 35,766 Finished goods 1,315,892 822,089 1,315,892 822,089 Trading stock 711,912 420,331 711,912 420,331Less: Provision for slow moving inventories (83,306) (81,895) (83,306) (81,895)
2,983,954 1,945,726 2,983,954 1,945,726 Goods in transit 35,815 - 35,815 -
3,019,769 1,945,726 3,019,769 1,945,726
The cost of inventories recognised as an expense and included in cost of goods sold amounted to Rs. 5,002,701,663 (2018 - Rs. 3,747,179,792).
An OverviewManagement Discussion & AnalysisCapitals ReportGovernance ReportFinancial ReportsSupplementary Information
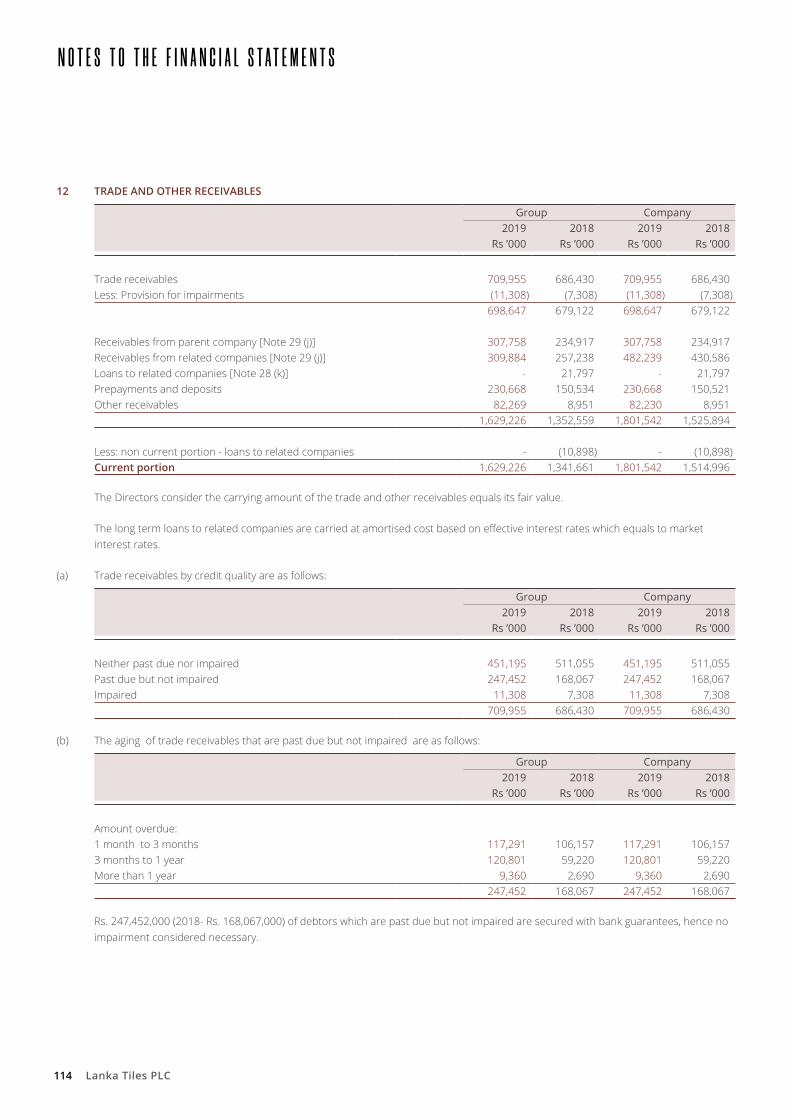
114 Lanka Tiles PLC
12 TRADE AND OTHER RECEIVABLES
Group Company2019 2018 2019 2018
Rs ’000 Rs ’000 Rs ’000 Rs ’000
Trade receivables 709,955 686,430 709,955 686,430 Less: Provision for impairments (11,308) (7,308) (11,308) (7,308)
698,647 679,122 698,647 679,122
Receivables from parent company [Note 29 (j)] 307,758 234,917 307,758 234,917Receivables from related companies [Note 29 (j)] 309,884 257,238 482,239 430,586 Loans to related companies [Note 28 (k)] - 21,797 - 21,797 Prepayments and deposits 230,668 150,534 230,668 150,521 Other receivables 82,269 8,951 82,230 8,951
1,629,226 1,352,559 1,801,542 1,525,894
Less: non current portion - loans to related companies - (10,898) - (10,898)Current portion 1,629,226 1,341,661 1,801,542 1,514,996
The Directors consider the carrying amount of the trade and other receivables equals its fair value.
The long term loans to related companies are carried at amortised cost based on effective interest rates which equals to market interest rates.
(a) Trade receivables by credit quality are as follows:
Group Company2019 2018 2019 2018
Rs ’000 Rs ’000 Rs ’000 Rs ’000
Neither past due nor impaired 451,195 511,055 451,195 511,055 Past due but not impaired 247,452 168,067 247,452 168,067 Impaired 11,308 7,308 11,308 7,308
709,955 686,430 709,955 686,430
(b) The aging of trade receivables that are past due but not impaired are as follows:
Group Company2019 2018 2019 2018
Rs ’000 Rs ’000 Rs ’000 Rs ’000
Amount overdue:1 month to 3 months 117,291 106,157 117,291 106,157 3 months to 1 year 120,801 59,220 120,801 59,220 More than 1 year 9,360 2,690 9,360 2,690
247,452 168,067 247,452 168,067
Rs. 247,452,000 (2018- Rs. 168,067,000) of debtors which are past due but not impaired are secured with bank guarantees, hence no impairment considered necessary.
N O T E S T O T H E F I N A N C I A L S T A T E M E N T S

115Integrated Annual Report 2018/19
(c) Movements on the provision for impairment of trade receivables are as follows:
Group Company2019 2018 2019 2018
Rs ’000 Rs ’000 Rs ’000 Rs ’000
At 1 April 7,308 3,217 7,308 3,217 Provision for impairment 4,000 5,238 4,000 5,238 Reversal of impairment provision - (1,147) - (1,147)Receivables written off during the year as uncollectible - - - - At 31 March 11,308 7,308 11,308 7,308
(d) The carrying amounts of trade and other receivables are denominated in following currencies
Group Company2019 2018 2019 2018
Rs ’000 Rs ’000 Rs ’000 Rs ’000
United States dollars 17,726 26,343 17,726 26,343 Australian dollars 30,940 33,874 30,940 33,874 Sri Lankan rupees 1,580,560 1,281,444 1,752,876 1,454,779
1,629,226 1,341,661 1,801,542 1,514,996
The maximum exposure to credit risk at the reporting date is the carrying value of each class of receivables mentioned above, except for trade receivables which are secured by bank guarantees and documentary credits.
(e) The effective interest rates of non current receivables are based on market interest rates.
13 CASH AND CASH EQUIVALENTS
Group Company2019 2018 2019 2018
Rs ’000 Rs ’000 Rs ’000 Rs ’000
Cash at bank and cash in hand 133,138 228,036 132,549 225,594 Short term deposits 11,371 216,962 168 208,381 Cash and cash equivalents (excluding bank overdraft) 144,509 444,998 132,717 433,975
For the purpose of the cash flow statement, the year end cash and cash equivalents comprise the following:
Group Company2019 2018 2019 2018
Rs ’000 Rs ’000 Rs ’000 Rs ’000
Cash and cash equivalents 144,509 444,998 132,717 433,975 Bank overdrafts (Note 15) (390,383) (95,179) (390,383) (95,179)Total cash and cash equivalents (245,874) 349,819 (257,666) 338,796
An OverviewManagement Discussion & AnalysisCapitals ReportGovernance ReportFinancial ReportsSupplementary Information

116 Lanka Tiles PLC
The cash and cash equivalents are denominated in following currencies;
Group Company2019 2018 2019 2018
Rs ’000 Rs ’000 Rs ’000 Rs ’000
Sri Lankan rupees 94,201 417,354 94,201 417,354 Indian rupees 11,792 11,023 - - United States dollars 192 10,108 192 10,108 Australian dollars 38,195 6,165 38,195 6,165 Euro 129 348 129 348
144,509 444,998 132,717 433,975
14 TRADE AND OTHER PAYABLES
Group Company2019 2018 2019 2018
Rs ’000 Rs ’000 Rs ’000 Rs ’000
Trade payables 881,185 269,433 881,185 269,433 Amount due to related parties { Note 29 (j) } 210,006 79,256 209,950 79,199 Accrued expenses 201,972 187,887 201,972 187,887 Other payables 278,680 245,619 278,483 245,453
1,571,843 782,195 1,571,590 781,972
Other payables of the Company mainly include Dividend payable amounting to Rs 147,450 895/- and Nations Building Tax payable amounting to Rs. 8,476,863 (2018 - Rs 3,979,826).
The carrying amounts of trade and other payable are denominated in following currencies;
Group Company2019 2018 2019 2018
Rs ’000 Rs ’000 Rs ’000 Rs ’000
Sri Lankan rupees 848,979 626,516 848,726 626,293 United States dollars 460,319 95,250 460,319 95,250 Euro 262,545 60,429 262,545 60,429
1,571,843 782,195 1,571,590 781,972
15 BORROWINGS
Group Company2019 2018 2019 2018
Rs ’000 Rs ’000 Rs ’000 Rs ’000
Current Bank borrowings 360,506 98,849 360,506 98,849 Bank overdrafts (Note 13) 390,383 95,179 390,383 95,179
750,889 194,028 750,889 194,028
Non-currentBank borrowings 1,351,169 7,374 1,351,169 7,374 Total borrowings 2,102,058 201,402 2,102,058 201,402
N O T E S T O T H E F I N A N C I A L S T A T E M E N T S

117Integrated Annual Report 2018/19
Loan Securityoffered Interest rate per annum (%)
DFCC LKR 165 Mn A primary mortgage over land, buildings and plant and machinery located at Ranala amounting to Rs.300 Mn
4 WEEK AWPLR + 0.5%
DFCC LKR 1500 Mn A primary mortgage over land, buildings and plant and machinery located at Ranala amounting to Rs.1500 Mn
4 WEEK AWPLR + 0.75%
DFCC LKR 80 Mn A primary mortgage over land, buildings and plant and machinery located at Ranala amounting to Rs.300 Mn
4 WEEK AWPLR + 0.5%
(c) Weighted average effective interest rates:
Group Company2019 2018 2019 2018
Bank overdrafts 12.73% 12.32% 12.73% 12.32%Bank borrowings 12.98% 12.25% 12.98% 12.25%
(d) Maturity of non - current bank borrowings is as follows;
Group Company2019 2018 2019 2018
Rs ’000 Rs ’000 Rs ’000 Rs ’000
Between one and two years 250,000 7,374 250,000 7,374 Between two and five years 1,101,169 - 1,101,169 -
1,351,169 7,374 1,351,169 7,374
(e) The carrying amounts of the Company’s and the Group’s borrowing are denominated in following currencies;
Group Company2019 2018 2019 2018
Rs ’000 Rs ’000 Rs ’000 Rs ’000
Sri Lankan rupees 2,102,058 201,402 2,102,058 201,402 United States dollars - - - -
2,102,058 201,402 2,102,058 201,402
(f) The exposure of the Company’s and the Group’s borrowings to interest rate changes and the contractual re-pricing dates at the end of the reporting period varies between 1 month to 3 months period.
(a) Bank overdrafts are secured primarily on inventories.
(b) The security offered and the interest rate applicable to each bank borrowings are set out below:
An OverviewManagement Discussion & AnalysisCapitals ReportGovernance ReportFinancial ReportsSupplementary Information

118 Lanka Tiles PLC
16 DEFERRED TAX LIABILITIES
(a) Deferred income taxes are calculated on all temporary differences under the liability method.
The gross movement on the deferred income tax account is as follows:
Group Company2019 2018 2019 2018
Rs ’000 Rs ’000 Rs ’000 Rs ’000
At beginning of year 634,246 443,787 634,246 443,787 Income statement charge (Note 25) 126,877 6,766 78,992 6,766 Deferred tax release on the components of other comprehensive income 2,169 183,693 2,169 183,693 At end of year 763,292 634,246 715,407 634,246
(b) The analysis of the deferred tax assets and liabilities is as follows:
Group Company2019 2018 2019 2018
Rs ’000 Rs ’000 Rs ’000 Rs ’000
Deferred tax assets (72,750) (69,515) (72,750) (69,515)Deferred tax liabilities 836,042 703,761 788,157 703,761 Deferred tax liabilities (net) 763,292 634,246 715,407 634,246
(c) The movement in deferred tax assets and liabilities during the year, without taking into consideration the offsetting of balances within the same tax jurisdiction is as follows:
GroupRevaluation
reserveAccelerated
tax depreciation
Total
Rs ’000 Rs ’000 Rs ’000
Deferred tax liabilitiesAt 1 April 2017 - 507,538 507,538 Charged to income statement - 4,589 4,589 Charged to other comprehensive income 191,634 - 191,634 At 31 March 2018 191,634 512,127 703,761
Charged to income statement 47,885 84,396 132,281 Charged to other comprehensive income - - - At 31 March 2019 239,519 596,523 836,042
N O T E S T O T H E F I N A N C I A L S T A T E M E N T S

119Integrated Annual Report 2018/19
Group Retirement
benefitobligations
Impairment Provision
InventoryProvision
Total
Rs ’000 Rs ’000 Rs ’000 Rs ’000
Deferred tax assetsAt 1 April 2017 (34,122) - (29,629) (63,751)Charged / (credited) to income statement (4,521) - 6,698 2,177 Credited to other comprehensive income (7,941) - - (7,941)At 31 March 2018 (46,584) - (22,931) (69,515)
Credited to income statement (3,889) (1,120) (395) (5,404)Credited to other comprehensive income 2,169 - - 2,169 At 31 March 2019 (48,304) (1,120) (23,326) (72,750)
(c) The movement in deferred tax assets and liabilities during the year, without taking into consideration the offsetting of balances within the same tax jurisdiction is as follows:
CompanyRevaluation
reserveAccelerated
tax depreciation
Total
Rs ’000 Rs ’000 Rs ’000
Deferred tax liabilitiesAt 1 April 2017 - 507,538 507,538 Charged to income statement - 4,589 4,589 Charged to other comprehensive income 191,634 - 191,634 At 31 March 2018 191,634 512,127 703,761
Charged to income statement - 84,396 84,396 Charged to other comprehensive income - - - At 31 March 2019 191,634 596,523 788,157
Company Retirement
benefitobligations
Impairment Provision
InventoryProvision
Total
Rs ’000 Rs ’000 Rs ’000 Rs ’000
Deferred tax assetsAt 1 April 2017 (34,122) - (29,629) (63,751)Charged / (credited) to income statement (4,521) - 6,698 2,177 Credited to other comprehensive income (7,941) - - (7,941)At 31 March 2018 (46,584) - (22,931) (69,515)
Credited to income statement (3,889) (1,120) (395) (5,404)Credited to other comprehensive income 2,169 - - 2,169 At 31 March 2019 (48,304) (1,120) (23,326) (72,750)
An OverviewManagement Discussion & AnalysisCapitals ReportGovernance ReportFinancial ReportsSupplementary Information

120 Lanka Tiles PLC
17 EMPLOYEE BENEFIT OBLIGATIONS - GRATUITY
Group Company2019 2018 2019 2018
Rs ’000 Rs ’000 Rs ’000 Rs ’000
Balance sheet obligations for:Defined benefits - gratuity 172,514 166,370 172,514 166,370 Income statement charge included in operating profit for:Defined benefits - gratuity 27,663 26,000 27,663 26,000 Remeasurements for:Defined benefits - gratuity (7,746) 28,361 (7,746) 28,361
The movement in the defined benefit obligations is as follows
Group Company2019 2018 2019 2018
Rs ’000 Rs ’000 Rs ’000 Rs ’000
At 1 April 166,370 124,394 166,370 124,394 Current service cost 11,026 11,073 11,026 11,073 Interest expense 16,637 14,927 16,637 14,927 Benefits paid (13,773) (12,385) (13,773) (12,385)Remeasurements:Losses from change in financial assumptions (8,142) 17,569 (8,142) 17,569 (Gains) from change in demographic assumptions (1,484) (720) (1,484) (720)Experience losses 1,880 11,512 1,880 11,512 At 31 March 172,514 166,370 172,514 166,370
The amount recognised in the income statement are as follows:
Group Company2019 2018 2019 2018
Rs ’000 Rs ’000 Rs ’000 Rs ’000
Current service cost 11,026 11,073 11,026 11,073 Interest cost 16,637 14,927 16,637 14,927 Total, included in staff costs (Note 23) 27,663 26,000 27,663 26,000
The obligation is not externally funded.
N O T E S T O T H E F I N A N C I A L S T A T E M E N T S

121Integrated Annual Report 2018/19
The gratuity liability of the Company / the Group is based on the actuarial valuation carried out by the independent actuary Messrs Actuarial and Management Consultants (Private) Limited, as at 31 March 2019. The principal actuarial valuation assumptions used were as follows:
Group Company2019 2018 2019 2018
Rs ’000 Rs ’000 Rs ’000 Rs ’000
Discount rate 11.00% 10.00% 11.00% 10.00%Future salary increase rate
- Executive staff 12.50% 12.50% 12.50% 12.50%- Others 10.00% 10.00% 10.00% 10.00%
In additions to above, demographic assumptions such as mortality and withdrawal disability were considered for the actuarial valuation. A 1967/70 mortality table issued by the Institute of Actuaries, London was taken as the base for the valuation.
The weighted average duration of the defined benefit obligations is 5.13 years.
Expected maturity analysis of undiscounted defined benefits - gratuity;
Less than a year
Between 1-2 years
Between 3- 5 years
Between 6- 10 years
Over year 10
Total
Rs ’000 Rs ’000 Rs ’000 Rs ’000 Rs ’000 Rs ’000
Defined benefits - gratuity; 23,647 74,993 26,020 24,461 23,393 172,514 As at 31 March 2019 23,647 74,993 26,020 24,461 23,393 172,514
The sensitivity of the defined benefit obligation to changes in the weighted principal assumptions is :
Discount Rate as at 31 March 2019 11.00%One percentage point increase in discount rate 165,897 One percentage point decrease in discount rate 182,186
Salary escalation rate as at 31 March 2019 12.50%One percentage point increase in salary escalation rate 182,588 One percentage point decrease in salary escalation rate 165,395
The above sensitivity analyses are based on a change in an assumption while holding all other assumptions constant. In practice, this is unlikely to occur, and changes in some of the assumptions may be correlated. When calculating the sensitivity of the defined retirement benefit obligations to significant actuarial assumptions, the same method (present value of the defined retirement benefit obligations calculated with the projected unit credit method at the end of the reporting period) has been applied as when calculating the defined benefit liability recognised within the Statement of Financial Position.
An OverviewManagement Discussion & AnalysisCapitals ReportGovernance ReportFinancial ReportsSupplementary Information

122 Lanka Tiles PLC
18 STATED CAPITAL
Group Company Number of
shares Stated capital
Number of shares
Stated capital
Rs. ‘000 Rs. ‘000
At 31 March 2018 53,050,410 900,968 53,050,410 900,968 At 31 March 2019 53,050,410 900,968 53,050,410 900,968
All issued shares are fully paid.
19 REVENUE FROM CONTRACTS WITH CUSTOMERS
The Company’s and the Group’s revenue are primarily derived from ;
Group Company2019 2018 2019 2018
Rs. ‘000 Rs. ‘000 Rs. ‘000 Rs. ‘000
(i) Revenue from local sales 6,790,844 5,861,016 6,790,844 5,861,016 (ii) Revenue from export sales 218,148 265,291 218,148 265,291 Revenue from external customers 7,008,992 6,126,307 7,008,992 6,126,307
Timing of revenue recognition at a point in time 7,008,992 6,126,307 7,008,992 6,126,307
20 OTHER INCOME
Group Company2019 2018 2019 2018
Rs. ‘000 Rs. ‘000 Rs. ‘000 Rs. ‘000
Sundry income 27,011 20,866 25,328 19,447 27,011 20,866 25,328 19,447
Sundry income mainly include the rental income Rs 12,876,432 (2018 - Rs 12,876,432) and scrap sales of Rs.1,735,762 (2018-Rs.333,839).
21 OTHER GAINS / (LOSSES) - NET
Group Company2019 2018 2019 2018
Rs. ‘000 Rs. ‘000 Rs. ‘000 Rs. ‘000
Net gain / (loss) on disposal of property, plant and equipment (6,524) 4 (6,524) 4 Fair value adjustment to investment property (Note 06) 171,019 - - -
164,495 4 (6,524) 4
N O T E S T O T H E F I N A N C I A L S T A T E M E N T S

123Integrated Annual Report 2018/19
22 BREAKDOWN OF EXPENSES BY NATURE
The following items have been charged / (credited) in arriving at operating profit:
Group Company2019 2018 2019 2018
Rs. ‘000 Rs. ‘000 Rs. ‘000 Rs. ‘000
Directors’ emoluments -As Directors' fees 12,338 10,458 12,338 10,458-For managerial services 34,485 37,485 34,485 37,485
Auditors’ remuneration-Audit 1,086 885 886 805-Non-Audit services 324 324 324 324-Reimbursable expenses 569 529 529 529
Depreciation on property, plant and equipment (Note 5) 267,552 236,236 267,552 236,236Changes in inventories of finished goods, trading items and work in progress
800,190 393,994 800,190 393,994
Raw materials and consumables used 3,148,471 2,804,022 3,148,471 2,802,748Technical fee 90,017 95,020 90,017 95,020Advertising expenses 31,691 41,953 31,691 41,953Promotional expenses and sales commission 484,771 546,575 484,771 546,575Repair and maintenance expenditure 254,701 228,644 254,701 228,644(Reversal) / provision for slow moving inventories 1,410 (18,916) 1,410 (18,916)Staff costs (Note 24) 589,689 622,553 589,689 622,553Other expenses 731,325 48,582 730,930 48,566Total cost of sales, distribution costs and administrative expenses
6,448,619 5,048,344 6,447,984 5,046,974
23 STAFF COSTS
Group Company2019 2018 2019 2018
Rs. ‘000 Rs. ‘000 Rs. ‘000 Rs. ‘000
- Wages, salaries and bonus 518,410 557,127 518,410 557,127 - Defined contribution plans 43,616 39,426 43,616 39,426 - Defined benefit plan - gratuity (Note 17) 27,663 26,000 27,663 26,000
589,689 622,553 589,689 622,553
Average no of persons employed as at 31 March - full time 690 609 690 609
24 NET FINANCE INCOME
Group Company2019 2018 2019 2018
Rs. ‘000 Rs. ‘000 Rs. ‘000 Rs. ‘000
Interest income 4,879 90,459 4,879 90,459 Interest Income from Related Companies 3,037 19,885 3,037 19,885 Finance income 7,916 110,344 7,916 110,344
Interest expenses (40,740) (23,492) (40,740) (23,492)Net foreign exchange losses on transactions / translations 18,663 1,724 18,663 1,724 Finance costs (22,077) (21,768) (22,077) (21,768)Net finance income (14,161) 88,576 (14,161) 88,576
An OverviewManagement Discussion & AnalysisCapitals ReportGovernance ReportFinancial ReportsSupplementary Information

124 Lanka Tiles PLC
25 INCOME TAX
Group Company2019 2018 2019 2018
Rs. ‘000 Rs. ‘000 Rs. ‘000 Rs. ‘000
(a) Current tax : - Current tax on profit for the year 90,717 342,029 90,933 341,955 Total current tax 90,717 342,029 90,933 341,955
(b) Deferred tax (Note 16)- Increase in of temporary differences 126,877 6,766 78,992 6,766 Total income tax expense 217,594 348,795 169,925 348,721
The tax on the Company’s and the Group’s profit before tax differ from the theoretical amount that would arise using the statutory tax rate applicable to profits of the Company and the Group as follows :
Group Company2019 2018 2019 2018
Rs. ‘000 Rs. ‘000 Rs. ‘000 Rs. ‘000
Profit before tax 745,606 1,352,792 573,539 1,352,743
Tax calculated at average rate 28% (2018 : 28%) 208,770 382,000 160,591 381,680 Tax on share of results of associate (2,209) (46,297) (2,209) (46,297)Income not subject to tax (309,695) (81,694) (309,401) (81,582)Expenses not deductible for tax purposes 316,831 94,920 316,831 94,920 Under/(over) provision in respect of previous year 3,897 (134) 4,113 -
217,594 348,795 169,925 348,721
The weighted average applicable tax rate was 28% (2018 : 28%).
26 EARNINGS PER SHARE
Basic earnings per share is calculated by dividing the net profit attributable to shareholders by the weighted average number of shares in issue during the year.
Group Company2019 2018 2019 2018
Rs. ‘000 Rs. ‘000 Rs. ‘000 Rs. ‘000
Profit attributable to equity holders 527,968 1,004,495 403,614 1,004,022Weighted average number of ordinary shares (thousands) 53,050 53,050 53,050 53,050 Basic earnings per share (Rs) 9.95 18.93 7.61 18.93
27 DIVIDENDS
A interim dividend of Rs. 167,108,792/- (2018 - Rs. 212,201,640 and 318,302,460) at Rs 3.15 (2018 - Rs 4.00 and 6.00) per share for the year ended 31 March 2019 was paid on 12th April 2019.
N O T E S T O T H E F I N A N C I A L S T A T E M E N T S

125Integrated Annual Report 2018/19
28 CASH GENERATED FROM OPERATIONS
Reconciliation of profit before tax to cash generated from operations:
Group Company2019 2018 2019 2018
Rs. ‘000 Rs. ‘000 Rs. ‘000 Rs. ‘000
Profit before tax 745,606 1,352,792 573,539 1,352,743
Adjustments for:Depreciation (Note 5) 267,552 236,236 267,552 236,236 Provision for retirement benefit obligations (Note 17) 27,663 26,000 27,663 26,000 Net fair value gain recognised in profit or loss (Note 21) (171,019) - - - Losses / (gains) on disposal of assets (Note 21) 6,524 (4) 6,524 (4)Interest expenses (Note 24) 22,077 21,768 22,077 21,768 Interest income (Note 24) (7,916) (110,344) (7,916) (110,344)Unrealised (profits) / losses on inventory purchased from associate
6,154 211 6,154 211
Profit share of results of associate (7,888) (165,383) (7,888) (165,383)Provision for slow moving inventories (Note 11) 1,411 (18,917) 1,411 (18,917)
Changes in working capital- (Increase) /Decrease in inventories (1,081,608) (492,608) (1,081,608) (492,608)- Decrease / (increase) in trade and other receivables (275,957) (344,338) (274,938) (343,394)- Increase / (decrease) in trade and other payables 622,542 198,368 622,510 198,431 Cash generated from operations 155,141 703,781 155,080 704,739
29 RELATED PARTY TRANSACTIONS
The Company is controlled by Lanka Walltiles PLC which owns 68.22% (2018 - 68.22%) of the Company’s issued share capital. The remaining 31.78% of the shares are widely held. The ultimate parent of the Company is Vallibel One PLC.
The related parties with whom Lanka Tiles PLC carried out transactions in the ordinary course of business are set out below:
An OverviewManagement Discussion & AnalysisCapitals ReportGovernance ReportFinancial ReportsSupplementary Information

126 Lanka Tiles PLC
Group Company2019 2018 2019 2018
(a) Sale of goods to: Relationship Rs. ‘000 Rs. ‘000 Rs. ‘000 Rs. ‘000
Lanka Walltiles PLC Parent Raw materials 9,804 3,477 9,804 3,477
Royal Porcelain (Private) Affiliate Raw materials 2,684 3,972 2,684 3,972 Limited Spares 35 213 35 213
Consumables - 199 - 199 Royal Ceramics Lanka PLC Affiliate Raw materials 105 947 105 947
Spares 785 29 785 29 Packing 24 - 24 -
M N Properties (Private) Limited Affiliate Finished goods - 180 - 180 13,437 9,017 13,437 9,017
Group Company2019 2018 2019 2018
(b) Purchase of goods/services Relationship Rs. ‘000 Rs. ‘000 Rs. ‘000 Rs. ‘000
Swisstek (Ceylon) PLC Associate Trading items 340,363 252,868 340,363 252,868 Sales commission
54,565 45,693 54,565 45,693
Reimbursement of operational expense
4,775 4,361 4,775 4,361
Swisstek Aluminium Limited Affiliate Trading items 38,665 - 38,665 - Lanka Ceramic PLC Affiliate Raw materials 125,992 123,960 125,992 123,960 Lanka Walltiles PLC Parent Raw materials 1,527 726 1,527 726
Consumables 5,085 1,516 5,085 1,516 Services 1,331 - 1,331 -
Royal Porcelain (Private) Affiliate Raw materials 11 6,222 11 6,222 Limited Spares 329 101 329 101
Consumables - 553 - 553 Royal Ceramics Lanka PLC Affiliate Spares - 141 - 141Uni-Dil Packaging Limited Affiliate Raw materials 89,756 70,099 89,756 70,099 Hayleys Travels & Tours (Private) limited Affiliate Services 10,126 10,274 10,126 10,274 Hayleys AgricultureHolding Limited Affiliate Services 544 206 544 206 Hayleys Electronic Lighting (Private) Limited Affiliate Services 27 258 27 258 Hayleys Industrial Solutions (Private) Limited Affiliate Services 24,247 9,506 24,247 9,506 Delmege Freight Services (Private) Limited Affiliate Services 8,585 1,434 8,585 1,434
705,928 527,918 705,928 527,918
N O T E S T O T H E F I N A N C I A L S T A T E M E N T S

127Integrated Annual Report 2018/19
Group Company2019 2018 2019 2018
(c) Receipt of funds from: Relationship Rs. ‘000 Rs. ‘000 Rs. ‘000 Rs. ‘000
Lanka Walltiles PLC Parent Expenses Reimbursement
80,343 - 80,343 -
Raw materials 6,165 - 6,165 - Swisstek (Ceylon) PLC Associate Interest
received 1,904 4,865 1,904 4,865
Loan settlement
21,798 30,834 21,798 30,834
110,210 35,699 110,210 35,699
Group Company2019 2018 2019 2018
(d) Transfer of funds to: Relationship Rs. ‘000 Rs. ‘000 Rs. ‘000 Rs. ‘000
Lanka Walltiles PLC Parent Expenses Reimbursement Settlement
133,206 108,133 133,206 108,133
Services- Settlement
1,331 - 1,331 -
Raw Material Sale- Settlement
6,350 1,784 6,350 1,784
Swisstek (Ceylon) PLC Associate 277,437 242,698 277,437 242,698 LWL Development (Private) Limited Affiliate 49,015 22,475 49,015 22,475
467,339 375,090 467,339 375,090
An OverviewManagement Discussion & AnalysisCapitals ReportGovernance ReportFinancial ReportsSupplementary Information

128 Lanka Tiles PLC
(e) Expenses incurred and transferred to/(from)
Group Company2019 2018 2019 2018
Relationship Rs. ‘000 Rs. ‘000 Rs. ‘000 Rs. ‘000
Lanka Walltiles PLC-Administration expenses Parent 40,177 42,651 40,177 42,651 -Distribution expenses 93,536 100,056 93,536 100,056
Swisstek (Ceylon) PLC-Administration expenses Affiliate 3,315 9,892 3,315 9,892
Swisstek Aluminium Limited-Administration expenses 1,849 1,238 1,849 1,238
Royal Ceramics Lanka PLC-Technical fees Affiliate 9,002 73,445 9,002 73,445
Vallibel One PLC-Technical fees Ultimate Parent 81,015 36,328 81,015 36,328
Beyond Paradise Collection Limited-Administration expenses Subsidiary - - 205 189
LTL Development (Private) Limited-Administration expenses Subsidiary - - 2 79
LWL Development (Private) Limited-Administration expenses Affiliate 1,326 7 1,326 -
230,220 263,617 230,427 263,878
(f) Key management compensation
Key management personnel include members of the Board of Directors and Senior management of Lanka Tiles PLC.
Group Company2019 2018 2019 2018
Rs. ‘000 Rs. ‘000 Rs. ‘000 Rs. ‘000
Salaries and short-term employee benefits 46,823 47,943 46,823 47,943 Salaries and long-term employee benefits 24,557 19,995 24,557 19,995
71,380 67,938 71,380 67,938
The Directors have disclosed the nature of their interests in contracts at meetings of Directors.
(g) Rental expense
The Company has paid a rental of Rs. 9,945,153 (2018 - Rs. 7,830,641) to Swisstek (Ceylon) PLC for the use of warehouse space at Balummahara during the financial year ended and Rs 28,602,672 (2018 - Rs 28,602,672) to Lanka Walltiles PLC for the use of office space at Nawala, during the financial year ended 31 March 2019.
(h) Rental Income
The Company has received a rental income of Rs.12,532,653 (2018 - Rs.12,532,653) from Lanka Walltiles PLC for Biyagama warehouse during the financial year ended 31 March 2019.
The Group has received a rental income of Rs1,200,000 (2018 - Rs.1,200,000) from LWL Development (Private) Limited for Divulapitiya land during the financial year ended 31 March 2019.
N O T E S T O T H E F I N A N C I A L S T A T E M E N T S

129Integrated Annual Report 2018/19
(i) The property owned by Swisstek (Ceylon) PLC at Balummahara, has been mortgaged to Lanka Tiles PLC as security to the value of Rs. 78 Mn against the outstanding balance due to Lanka Tiles PLC by Swisstek (Ceylon) PLC. Lanka Tiles PLC charges interest at AWPLR + 1% per annum on the loans given to Swisstek (Ceylon) PLC
(j) Outstanding balances arising from sale/purchase of goods/services
Group Company2019 2018 2019 2018
Rs. ‘000 Rs. ‘000 Rs. ‘000 Rs. ‘000
Receivables from related Companies:Lanka Walltiles PLC 307,758 234,917 307,758 234,917 Swisstek Aluminium Limited 881 499 881 499 Royal Porcelain (Private) Limited 1,578 855 1,578 855 Beyond Paradise Collection (Private) Limited - - 175,273 175,068 LWL Development (Private) Limited 307,425 255,884 304,425 254,085 LTL Development (Private) Limited - - 82 79
617,642 492,155 789,997 665,503
Payables to related parties:Lanka Ceramic PLC 18,708 17,059 18,708 17,059 Royal Ceramics Lanka PLC 5,499 5,150 5,499 5,150 Swisstek (Ceylon) PLC 136,784 43,959 136,784 43,959 Uni-Dil Packaging Limited 10,715 7,119 10,715 7,119 Swisstek Aluminium Limited 28,207 - 28,207 - Vallibel One PLC 10,037 5,912 10,037 5,912 LWL Development (Private) Limited 56 57 - -
210,006 79,256 209,950 79,199
(k) Loans given to related parties
Group Company2019 2018 2019 2018
Rs. ‘000 Rs. ‘000 Rs. ‘000 Rs. ‘000
Swisstek (Ceylon) PLC [See Note 29 (i) above] - 21,797 - 21,797 - 21,797 - 21,797
Terms and Conditions with related parties
The ‘Sales to’ and ‘purchases from’ related parties are made on commercial terms agreed with respective Parties.
Outstanding balances as at the year end are unsecured, interest free and settlement occur in cash.
Technical fees paid to Royal Ceramic Lanka PLC and Vallibel One PLC are for services rendered in providing technical advises to improve manufacturing process of Lanka Tiles PLC.
An OverviewManagement Discussion & AnalysisCapitals ReportGovernance ReportFinancial ReportsSupplementary Information
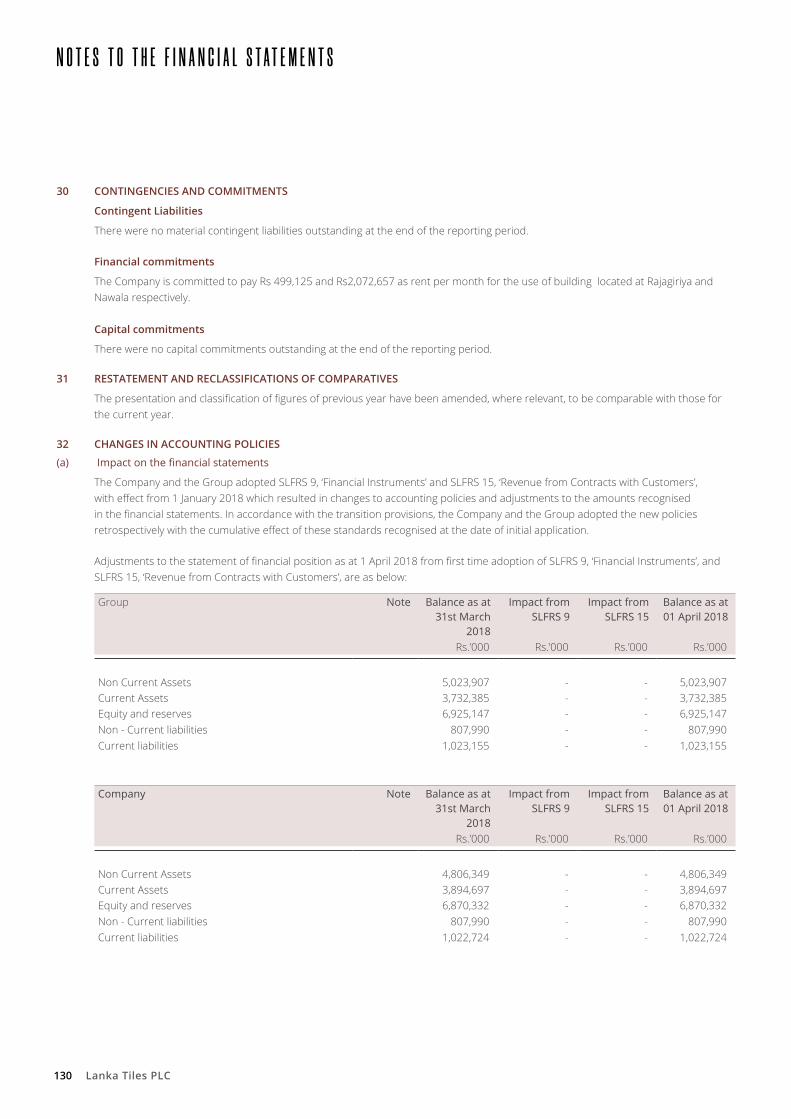
130 Lanka Tiles PLC
30 CONTINGENCIES AND COMMITMENTS
Contingent Liabilities
There were no material contingent liabilities outstanding at the end of the reporting period.
Financial commitments
The Company is committed to pay Rs 499,125 and Rs2,072,657 as rent per month for the use of building located at Rajagiriya and Nawala respectively. Capital commitments
There were no capital commitments outstanding at the end of the reporting period.
31 RESTATEMENT AND RECLASSIFICATIONS OF COMPARATIVES
The presentation and classification of figures of previous year have been amended, where relevant, to be comparable with those for the current year.
32 CHANGES IN ACCOUNTING POLICIES
(a) Impactonthefinancialstatements
The Company and the Group adopted SLFRS 9, ‘Financial Instruments’ and SLFRS 15, ‘Revenue from Contracts with Customers’, with effect from 1 January 2018 which resulted in changes to accounting policies and adjustments to the amounts recognised in the financial statements. In accordance with the transition provisions, the Company and the Group adopted the new policies retrospectively with the cumulative effect of these standards recognised at the date of initial application.
Adjustments to the statement of financial position as at 1 April 2018 from first time adoption of SLFRS 9, ‘Financial Instruments’, and SLFRS 15, ‘Revenue from Contracts with Customers’, are as below:
Group Note Balance as at 31st March
2018
Impact from SLFRS 9
Impact from SLFRS 15
Balance as at 01 April 2018
Rs.’000 Rs.’000 Rs.’000 Rs.’000
Non Current Assets 5,023,907 - - 5,023,907 Current Assets 3,732,385 - - 3,732,385 Equity and reserves 6,925,147 - - 6,925,147 Non - Current liabilities 807,990 - - 807,990 Current liabilities 1,023,155 - - 1,023,155
Company Note Balance as at 31st March
2018
Impact from SLFRS 9
Impact from SLFRS 15
Balance as at 01 April 2018
Rs.’000 Rs.’000 Rs.’000 Rs.’000
Non Current Assets 4,806,349 - - 4,806,349 Current Assets 3,894,697 - - 3,894,697 Equity and reserves 6,870,332 - - 6,870,332 Non - Current liabilities 807,990 - - 807,990 Current liabilities 1,022,724 - - 1,022,724
N O T E S T O T H E F I N A N C I A L S T A T E M E N T S

131Integrated Annual Report 2018/19
The following tables show the adjustments recognised for each individual line item affected with the adoption of above standards during the reporting.
Group Note Before SLFRS 9 and
SLFRS 15 adjustments
Impact from SLFRS 9
Impact from SLFRS 15
For the year ended 31
March 2019 (reported)
Rs.’000 Rs.’000 Rs.’000 Rs.’000
Non Current Assets 7,061,873 - - 7,061,873 Current Assets 4,849,074 (4,000) - 4,845,074 Equity and reserves 7,301,240 (4,000) - 7,297,240 Non - Current liabilities 2,286,975 - - 2,286,975 Current liabilities 2,322,732 - - 2,322,732
Company Note Before SLFRS 9 and
SLFRS 15 adjustments
Impact from SLFRS 9
Impact from SLFRS 15
For the year ended 31
March 2019 (reported)
Rs.’000 Rs.’000 Rs.’000 Rs.’000
Non Current Assets 6,673,296 - - 6,673,296 Current Assets 5,009,598 (4,000) - 5,005,598 Equity and reserves 7,121,325 (4,000) - 7,117,325 Non - Current liabilities 2,239,090 - - 2,239,090 Current liabilities 2,322,479 - - 2,322,479
Statement of comprehensive income
Group Note Before SLFRS 9 and SLFRS 15 adjustments
Impact from SLFRS 9
Impact from SLFRS 15
For the year ended 31
March 2019 (reported)
Rs.’000 Rs.’000 Rs.’000 Rs.’000
Revenue 7,008,992 - - 7,008,992 Cost of sales (5,002,702) - - (5,002,702)Operating expenses (1,441,917) (4,000) - (1,445,917)Profit before tax 749,606 (4,000) - 745,606 Profit for the year 532,012 (4,000) - 528,012
Company Note Before SLFRS 9 and
SLFRS 15 adjustments
Impact from SLFRS 9
Impact from SLFRS 15
For the year ended 31
March 2019 (reported)
Rs.’000 Rs.’000 Rs.’000 Rs.’000
Revenue 7,008,992 - - 7,008,992 Cost of sales (5,002,702) - - (5,002,702)Operating expenses (1,441,280) (4,000) - (1,445,280)Profit before tax 577,539 (4,000) - 573,539 Profit for the year 407,614 (4,000) - 403,614
An OverviewManagement Discussion & AnalysisCapitals ReportGovernance ReportFinancial ReportsSupplementary Information

132 Lanka Tiles PLC
32 (b) SLFRS 9 Financial instruments
SLFRS 9 replaces the provisions of LKAS 39 that relate to the recognition, classification and measurement of financial assets and financial liabilities, derecognition of financial instruments, impairment of financial assets and hedge accounting.
The adoption of SLFRS 9 Financial Instruments from 01 April 2018 resulted in changes in accounting policies and adjustments to the amounts recognised in the financial statements. The new accounting policies are set out in note 2.9 and 2.2 above. In accordance with the transitional provisions in SLFRS 9 (7.2.15) and (7.2.26), comparative figures have not been restated.
The total impact on the group’s retained earnings as at 1 April 2018 and 1 April 2017 is as follows:
Group Notes 2018 2017Rs.’000 Rs.’000
Closing retained earnings 31 March – LKAS 39/LKAS 18 4,443,653 4,443,653 Reclassify investments from available-for-sale to FVPL - - Increase in provision for trade receivables - - Increase in provision for debt investments at FVOCI - - Increase in deferred tax assets relating to impairment provisions - - Adjustment to retained earnings from adoption of SLFRS 9 on 01 April 2018 - - Opening retained earnings 1 April - SLFRS 9 4,443,653 4,443,653
i) Classificationandmeasurement
On 01 April 2018 (the date of initial application of SLFRS 9), the group’s management has assessed which business models apply to the financial assets held by the group and has classified its financial instruments into the appropriate SLFRS 9 categories. The main effects resulting from this reclassification are as follows:
Group Loans and Receivables
FVOCI (Available for
sale)
Held to Maturity
Amortised cost
Financial Assets - 1 April 2018 Rs.’000 Rs.’000 Rs.’000 Rs.’000
Closing balance as at 31 March 2018 as per LKAS 39 1,647,023 - - - Reclassify loans and receivables to Amortised cost (1,647,023) - - 1,647,023 Closing balance as at 01 April as per SLFRS 9 - - - 1,647,023
According to the provisions of SLFRS 9, ‘Financial Instruments’, the Group recognises impairment provisions based on expected credit losses. Impairment provisions were previously based on incurred credit losses.
The impact of these changes on the group’s retained earnings is as follows:
The following is a summary of transition adjustments to the Company’s and the Group’s retained earnings from the initial application of SLFRS 9, ‘Financial Instruments as at 01 April 2018.
Group CompanyRs.’000 Rs.’000
Retained earnings as at 31 March 2018 4,828,273 4,778,698 Increase in impairment provision (4,000) (4,000)Adjustments to retained earnings from changes in accounting policies - - Retained earnings as at 01 April 2018 4,824,273 4,774,698
N O T E S T O T H E F I N A N C I A L S T A T E M E N T S

133Integrated Annual Report 2018/19
ReclassificationsoffinancialinstrumentsonadoptionofSLFRS9
GroupFinancial Assets - 1 April 2018 Notes FVPL Carrying Amount
Original (IAS 39) New (SLFRS 9) Original NEW DifferenceRs.’000 Rs.’000 Rs.’000
Loans given to related companies (Note 12)
Loans and Receivables Amortised cost 21,797 21,797 -
Trade and other receivables (excluding pre-payments) (Note 12)
Loans and Receivables Amortised cost 1,180,228 1,180,228 -
Cash and cash equivalents (Note 13) Loans and Receivables Amortised cost 444,998 444,998 - Borrowings (Note 15) Other financial liabilities
at amortised costOther financial liabilities 201,402 201,402 -
Trade and other payables excluding non-financial liabilities (Note 14)
Other financial liabilities at amortised cost
Other financial liabilities 782,195 782,195 -
CompanyFinancial Assets - 1 April 2018 Notes FVPL Carrying Amount
Original (IAS 39) New (SLFRS 9) Original NEW DifferenceRs.’000 Rs.’000 Rs.’000
Loans given to related companies (Note 12)
Loans and Receivables Amortised cost 21,797 21,797 -
Trade and other receivables (excluding pre-payments) (Note 12)
Loans and Receivables Amortised cost 1,353,576 1,353,576 -
Cash and cash equivalents (Note 13) Loans and Receivables Amortised cost 433,975 433,975 - Borrowings (Note 15) Other financial liabilities
at amortised costOther financial liabilities 201,402 201,402 -
Trade and other payables excluding non-financial liabilities (Note 14)
Other financial liabilities at amortised cost
Other financial liabilities 781,972 781,972 -
ii) Impairmentoffinancialassets
The group has three types of financial assets that are subject to the expected credit loss model: • trade receivables for sales of inventory; • debt investments carried at amortised cost; and • debt investments carried at FVOCI
While cash and cash equivalents are also subject to the impairment requirements of IFRS 9, the identified impairment loss was immaterial.
The Group applies the IFRS 9 simplified approach to measuring expected credit losses which uses a lifetime expected loss allowance for all trade receivables.
To measure the expected credit losses, trade receivables has been grouped based on shared credit risk characteristics and the days past due. The group has therefore concluded that the expected loss rates for trade receivables are a reasonable.
The expected loss rates are based on the payment profiles of sales over a period of 24 month before 31 March 2019 and the corresponding historical credit losses experienced within this period. The historical loss rates are adjusted to reflect current and forward-looking information on macroeconomic factors affecting the ability of the customers to settle the receivables. The Group has identified the GDP and the unemployment rate of the countries in which it sells its goods and services to be the most relevant factors, and accordingly adjusts the historical loss rates based on expected changes in these factors.
An OverviewManagement Discussion & AnalysisCapitals ReportGovernance ReportFinancial ReportsSupplementary Information

134 Lanka Tiles PLC
N O T E S T O T H E F I N A N C I A L S T A T E M E N T S
On that basis, the loss allowance as at 31 March 2019 (on adoption of IFRS 9) was determined as follows for trade receivables:
31 March 2019 Current More than 30 days past due
More than 60 days past due
More than 120 days past due
Total
Expected loss rate 0.65% 1.98% 2.73% 7.94% 1.59%Gross carrying amount – trade receivables
553,446,767 55,118,903 27,822,051 73,566,910 709,954,630
Loss allowance 3,612,230 1,090,529 760,701 5,844,790 11,308,250
The closing loss allowances for trade receivables as at 31 March 2019 reconcile to the opening loss allowances as follows:
Trade Receivables
31 March 2018 – calculated under IAS 39 7,308,250 Amounts restated through opening retained earnings - Opening loss allowance as at 1 April 2018 – calculated under IFRS 9 7,308,250 Increase in loan loss allowance recognised in profit or loss during the year 4,000,000 Receivables written off during the year as uncollectible - Unused amount reversed - At 31 March 2019 11,308,250
33 EVENTS AFTER THE REPORTING PERIOD
No circumstances have arisen since the balance sheet date which require adjustments to, or disclosure in the financial statements.

135Integrated Annual Report 2018/19
GROUPYear ended 31st March 2015 2016 2017 2018 2019
Rs '000 Rs '000 Rs '000 Rs '000 Rs '000
Revenue 5,349,670 5,541,368 5,176,372 6,126,307 7,008,992 Operating profit 980,738 1,396,581 1,300,253 1,098,833 751,879 Finance income/(costs) (25,250) 45,610 118,971 88,576 (14,161)Share of results of associate-Net of Tax 110,736 139,411 185,284 165,383 7,888 Profit before income tax 1,066,224 1,581,602 1,604,508 1,352,792 745,606 Income tax expense (225,949) (399,448) (359,170) (348,795) (217,594)
Profit for the year 840,275 1,182,154 1,245,338 1,003,997 528,012
Profit attributable to the equity ownersof the Parent 840,275 1,182,154 1,245,338 1,004,495 527,968 Dividends (344,828) (371,353) (397,878) (530,504) (167,109)
Retained profit for the year 495,447 810,801 847,460 473,991 360,859
Earnings per share - basic (Rs) 15.84 22.28 23.47 18.93 9.95
COMPANYYear ended 31st March 2015 2016 2017 2018 2019
Rs '000 Rs '000 Rs '000 Rs '000 Rs '000
Revenue 5,349,670 5,541,368 5,176,372 6,126,307 7,008,992 Operating profit 980,738 1,396,581 1,247,570 1,098,784 579,812 Finance income/(costs) (25,250) 45,610 118,971 88,576 (14,161)Share of results of associate-Net of Tax 110,736 139,411 185,284 165,383 7,888 Profit before income tax 1,066,224 1,581,602 1,551,825 1,352,743 573,539 Income tax expense (225,949) (399,448) (359,002) (348,721) (169,925)
Profit for the year 840,275 1,182,154 1,192,823 1,004,022 403,614
Profit attributable to the equity ownersof the Company 840,275 1,182,154 1,192,823 1,004,022 403,614 Dividends (344,828) (371,353) (397,878) (530,504) (167,109)
Retained profit for the year 495,447 810,801 794,945 473,518 236,505
Earnings per share - basic (Rs) 15.84 22.28 22.48 18.93 7.61
An OverviewManagement Discussion & AnalysisCapitals ReportGovernance ReportFinancial ReportsSupplementary Information

136 Lanka Tiles PLC
Year ended 31st March 2015 2016 2017 2018 2019Rs '000 Rs '000 Rs '000 Rs '000 Rs '000
ASSETSNon-current assetsProperty, plant and equipment 2,556,753 3,398,848 3,608,790 3,855,576 5,743,130 Investment in subsidiary - - - 6,242 6,242 Investments in associates 493,136 725,543 881,052 933,633 923,924 Loan given to related companies 79,885 49,050 20,422 10,898 - Finance lease debtors - - -
3,129,774 4,173,441 4,510,264 4,806,349 6,673,296
Current assetsInventories 1,137,108 932,256 1,434,412 1,945,726 3,019,769 Trade and other receivables 898,820 987,986 1,187,787 1,514,996 1,801,542 Income tax assets - - - - 51,570 Cash and cash equivalents 846,794 1,586,065 1,227,119 433,975 132,717
2,882,722 3,506,307 3,849,318 3,894,697 5,005,598 Total assets 6,012,496 7,679,748 8,359,582 8,701,046 11,678,894
EQUITY Capital and reservesStated capital 900,968 900,968 900,968 900,968 900,968 Retained earnings 2,745,049 3,584,487 4,394,551 4,778,698 5,025,691 Revaluation reserve - 838,856 838,856 730,515 730,515 Amalgamation reserve 460,151 460,151 460,151 460,151 460,151
4,106,168 5,784,462 6,594,526 6,870,332 7,117,325
LIABILITIES Non-current liabilitiesBorrowings 383,974 260,824 56,224 7,374 1,351,169 Deferred income tax liabilities 375,486 453,542 443,787 634,246 715,407 Defined benefit obligations 110,577 129,073 124,394 166,370 172,514
870,037 843,439 624,405 807,990 2,239,090
Current liabilitiesTrade and other payables 536,171 580,766 583,540 781,972 1,571,590 Current income tax liabilities 139,565 276,660 68,558 46,724 - Borrowings 360,555 194,421 488,553 194,028 750,889
1,036,291 1,051,847 1,140,651 1,022,724 2,322,479 Total liabilities 1,906,328 1,895,286 1,765,056 1,830,714 4,561,569 Total equity and liabilities 6,012,496 7,679,748 8,359,582 8,701,046 11,678,894
FIVE YEAR SUMMARY STATEMENT OF FINANCIAL POSITION

137Integrated Annual Report 2018/19
SHAREHOLDER INFORMATION
Year ended 31st March 2015 2016 2017 2018 2019
Authorised share capital (Rs.Mn) 500.0 500.0 500.0 500.0 500.0Stated capital (Rs.Mn) 900.0 900.0 900.0 900.0 900.0Shares in issue (Mn) 53.5 53.5 53.5 53.5 53.5(as at end of year)
Shareholders- Institutions (Number) 141 144 143 140 137- Individuals (Number) 1579 1619 1644 1595 1625Total 1,720 1,763 1,787 1,735 1,762
Shares held by- Institutions (%) 91.85 91.49 92.13 93.15 93.26- Individuals (%) 8.15 8.51 7.87 6.86 6.74Total 100.0 100.0 100.0 100.0 100.0
Transactions (Number) 1,352 1,605 978 610 611 Shares traded (Mn) 315.00 224.00 1,173.00 115.00 28.73 Dividends (%) 41.4 31.4 33.4 53 41.4 Dividends per share (Rs.) 4.50 7.00 7.50 10.00 3.15
Market price per share- Highest during the year (Rs.) 117.90 128.00 123.90 121.40 106.50- Lowest during the year (Rs.) 75.10 97.00 95.00 99.50 63.00- As at end of the year (Rs.) 106.00 100.60 102.00 99.70 70.00
Market Capitalization (Rs.Mn) 5,623.30 5,336.83 5,411.10 5,289.09 3,713.50 (as at end of year)Earnings per share (Rs.) 15.84 22.28 22.48 18.93 7.61Price/Earnings ratio (Times) 6.69 4.51 4.54 5.27 9.20Net assets per share (Rs.) 77.40 109.04 124.31 129.51 134.16
DISTRIBUTION OF SHAREHOLDINGS AS AT 31ST MARCH 2019
Size of shareholdings Number
Shareholders Number
Shares Number
Holdings %
1 - 1,000 1,340 272,527 0.51 1,001 - 10,000 345 1,139,389 2.15 10,001 - 100,000 64 1,581,367 2.98 100,001 - 1,000,000 8 2,540,219 4.79 Over - 1,000,000 5 47,516,908 89.57
1,762 53,050,410 100.00
CATEGORIES OF SHAREHOLDERS No of Holders No of Shares %
Local Individuals 1,576 2,955,710 5.57%Local Institutions 127 44,400,841 83.70%Foreign Individuals 49 623,860 1.17%Foreign Institutions 10 5,069,999 9.56%
1,762 53,050,410 100%
The Float adjusted Market Capitalization as at 31st March 2019 is Rs. 1,049,989,500.00
The Float adjusted Market Capitalization of the company falls under option 5 Rule 7.13.1 (a) Listing Rules of the Colombo Stock Exchange and the Company has complied with the minimum public holding requirement applicable under the said option.
An OverviewManagement Discussion & AnalysisCapitals ReportGovernance ReportFinancial ReportsSupplementary Information

138 Lanka Tiles PLC
20 MAJOR SHAREHOLDERS
DIRECTORS’ AND CEO’S SHAREHOLDING AS AT 31ST MARCH 2019
Name of Director No of Shares %
Mr. Dhammika Perera - - Mr. A M Weerasinghe 35,863 0.068Mr. J A P M Jayasekera - - Dr. S Selliah - - Mr T G Thoradeniya - - Mr. K D G Gunaratne - - Ms. A M L Page 2,500 0.0047Mr R D P Godawatta Arachchige (Alternative Director to Mr. Dhammika Perera) - - Mr J A N R Adhihetty - -
The fractional shares of 582 arising from the capitalization of revenue reserves issue were issued jointly in the names of Mr. J A P M Jayasekera and Mr. A A Page
SHARE PRICE FOR THE YEAR
Market price per share
Highest during the year Rs. 106.50 (02-05-2018)Lowest during the year Rs. 63.00 (27-03-2019)As at end of the year Rs. 70.00Number of Transactions during the year 611Number of Shares traded during the year 306,882Value of shares traded during the year (Rs.) 28,733,732.10
PUBLIC HOLDING
The Percentage of shares held by the Public 28.275%No of shareholders representing the above percentage 1,756
Name No of Shares 31.03.2019
% No of Shares 31.03.2018
%
1 Lanka Walltiles PLC 36,189,195 68.217 36,189,195 68.217 2 Employees Provident Fund 4,968,313 9.365 4,968,313 9.365 3 BNYM RE-Frontaura Global Frontier fund LLC 3,505,980 6.609 3,505,980 6.609 4 Caceis Bank S/A Barca Globel Master fund LP Luxemburg 1,464,939 2.761 1,353,338 2.551 5 Royal Ceramics Lanka PLC 1,388,481 2.617 1,388,481 2.617 6 Bank of Ceylon No. 1 Account 973,200 1.834 973,200 1.834 7 Mr. K R Kamon 537,628 1.013 537,628 1.013 8 Mr. A A Page 433,939 0.818 433,939 0.818 9 Aruna Enterprises (Pvt) Limited 128,500 0.242 128,500 0.242 10 Mr S.M Fernando 126,446 0.238 126,446 0.238 11 Mr M . M Udeshi Mrs A A Merchant 125,000 0.236 - - 12 Dr A C Visvalingam and Mrss Y I Visvalingam 108,143 0.204 - - 13 Seylan Bank PLC / W D N H Perera 107,363 0.202 - - 14 Pinnacle Trust (Pvt) Limited 92,038 0.173 92,038 0.173 15 Sampath Bank PLC /Dr T Senthilverl 90,600 0.171 90,600 0.171 16 Mr M S Fernando 78,496 0.148 49,105 0.093 17 Seylan Bank PLC/ Channa Nalin Rajahmoney 72,104 0.136 72,104 0.136 18 Mrs B C Sansoni 62,495 0.118 62,495 0.118 19 Mr. S A C Keerthisinghe & Mrs D M J S Dissanayaka 45,500 0.086 34,450 0.065 20 Saboor Chatoor (Pvt) Ltd 42,200 0.080 42,200 0.080
Sub Total 50,540,560 95.269 50,048,012 94.340 Others 1,742 Shareholders 2,509,850 4.731 3,002,398 5.660 Grand Total 53,050,410 100.00 53,050,410 100.00

139Integrated Annual Report 2018/19
STATEMENT OF VALUE ADDED
For The Year ended 31st March 2015 2016 2017 2018 2019Rs. ‘000 % Rs. ‘000 % Rs. ‘000 % Rs. ‘000 % Rs. ‘000 %
Sales 5,941,148 6,123,730 5,805,556 6,126,307 7,008,992 Duty rebate - - - - - Other income 25,939 37,328 26,154 19,447 25,328 Less:Cost of materials & services bought in (3,535,313) (3,179,762) (2,899,677) (3,096,393) (4,447,365)
Value added 2,431,774 2,981,296 2,932,033 3,049,361 2,586,955
Distribution of Value Added
Employees as remuneration & welfare 526,439 21.65 597,336 20.04 571,757 19.50 630,588 20.68 588,870 22.76 Government as taxes 877,775 36.10 1,096,099 36.77 1,140,843 38.91 1,320,290 43.30 1,214,934 46.96 Lenders of capital as interest 49,242 2.02 26,518 0.89 30,789 1.05 23,492 0.77 40,740 1.57 Shareholders as dividends 238,727 9.82 371,353 12.46 397,878 13.57 530,504 17.40 167,109 6.46 Retained in the business as - - - - - - Depreciation/deferred tax 248,779 10.23 218,600 7.33 181,106 6.18 236,352 7.75 346,685 13.40 - Profits 490,812 20.18 671,390 22.52 609,660 20.79 308,135 10.10 228,617 8.84
Total 2,431,774 100.0 2,981,296 100.0 2,932,033 100.0 3,049,361 100.0 2,586,955 100
An OverviewManagement Discussion & AnalysisCapitals ReportGovernance ReportFinancial ReportsSupplementary Information

140 Lanka Tiles PLC
NOTES

141Integrated Annual Report 2018/19
NAME OF THE COMPANY
Lanka Tiles PLC
LEGAL FORM
Public Limited Liability Company listed on the Colombo Stock Exchange. (Incorporated as a Private Limited Liability Company on 30th March 1984 under the Companies Act No. 17 of 1982 and converted to a Public Limited Liability Company on 07th August 1984.) The Company was re-registered under the New Companies Act No. 07 of 2007 on 19th March 2008. (Registration No. PQ 129)
DIRECTORS
Mr. Dhammika Perera (Chairman)
Mr. A M Weerasinghe (Deputy Chairman)
Mr. J A P M Jayasekera (Managing Director)
Dr. S Selliah
Mr. T G Thoradeniya
Mr. K D G Gunaratne
Ms. A M L Page
Mr J A N R Adhihetty
Mr. G A R D Prasanna (Alternate Director to Mr. Dhammika Perera)
SECRETARIES
P W Corporate Secretarial (Pvt) Ltd
No. 3/17, Kynsey Road
Colombo 08
Telephone : + 94 -11 - 4640360-3
Facsimile : + 94 -11 - 4740588
E-mail : [email protected]
REGISTERED OFFICE
215, Nawala Road, Narahenpita, Colombo 05
Telephone : + 94 -11 - 2808050 / 2808001-3
Facsimile : + 94 -11 - 2806232
E-mail : [email protected]
Website : www.lankatiles.com
FACTORY
St. James Estate, Jaltara, Ranala
Telephone : + 94 - 11 - 2141055, 2141057, 2141819 Facsimile : + 94 - 11 - 2141045
E-mail : [email protected]
BANKERS
Commercial Bank of Ceylon PLC
DFCC Bank
Bank of Ceylon
Hongkong & Shanghai Banking Corp. Limited
Hatton National Bank PLC Sampath Bank PLC
AUDITORS
PricewaterhouseCoopers
Chartered Accountants
100, Braybrooke Place, Colombo 2.
Telephone : + 94 - 11 - 4719838 Facsimile : + 94 - 11 - 2303197
Designed & produced by
Printed by Printage (Pvt) Ltd
CORPORATE INFORMATIONAn OverviewManagement Discussion & AnalysisCapitals ReportGovernance ReportFinancial ReportsSupplementary Information

142 Lanka Tiles PLC
NOTICE OF MEETING
NOTICE IS HEREBY GIVEN that the Thirty Fifth (35th) Annual General Meeting of Lanka Tiles PLC will be held at the Winchester Hall, The Kingsbury Hotel, No. 48, Janadhipathi Mawatha, Colombo 01 on the 05th July 2019 at 11.20 a.m for the following purposes:
1. To receive and consider the Annual Report of the Board of Directors on the affairs of the Company and the Statement of Accounts for the year ended 31st March 2019 and the Report of the Auditors thereon.
2. To re-elect Mr. Dhammika Perera, who retires by rotation in terms of Articles 103 and 104 of the Articles of Association, as a Director of the Company
3. To re-elect Mr. K D G Gunaratne, who retires by rotation in terms of Articles 103 and 104 of the Articles of Association, as a Director of the Company.
4. To elect Mr. J A N R Adhihetty, who retires in terms of Articles 110 of the Articles of Association, as a Director of the Company.
5. To re-appoint Messrs PricewaterhouseCoopers, Chartered Accountants, the retiring Auditors and to authorize the Directors to determine their remuneration.
6. To authorize the Directors to determine Donations for the ensuing year.
By Order of the BoardLANKA TILES PLC
P W Corporate Secretarial (Pvt) LtdDirector / Secretaries
At Colombo
06th June 2019
Notes:
1) A shareholder entitled to attend or attend and vote at the Meeting is entitled to appoint a Proxy who need not be a shareholder, to attend and vote instead of him/her. A Proxy need not be a member of the Company. A Form of Proxy is enclosed for this purpose.
2) A Form of Proxy is enclosed in this Report.
3) The completed Form of Proxy should be deposited at the Registered Office of the Company, No. 215, Nawala Road, Narahenpita, Colombo 05, not less than forty-eight (48) hours before the time fixed for the commencement of the Meeting.

143Integrated Annual Report 2018/19
PROXY FORM
I/We the undersigned ……………………………………………………………………………………………………………………………. NIC No ……………………………………………………… of
……………………………………………………………………………………………….......………………………………………… being a member/s* of Lanka Tiles PLC hereby appoint:
……………………………………………………………………………………………………………………………………………………………………………………………………………………………………………
of ……………………………………………………………………………………………………………………………………………………………………………………………………………………………………….
Mr. Dhammika Perera of Colombo or failing him*
Mr. Amarakone Mudiyanselage Weerasinghe of Colombo or failing him*
Mr. Jayasekera Arachchige Panduka Mahendra Jayasekera of Colombo or failing him*
Dr. Sivakumar Selliah of Colombo or failing him*
Mr. Tharana Gangul Thoradeniya of Colombo or failing him*
Mr. Kalupathiranalage Don Gamini Gunaratne of Colombo or failing him*
Ms. Anjalie Maryanne Letitia Page of Colombo or failing him*
Mr. John Amrith Nishan Ratnatunga Adhihetty of Colombo or failing him*
my/our * Proxy to vote and speak as indicated hereunder for me/us* and on my/our* behalf at the Thirty Fifth Annual General Meeting of the Company to be held on 5th July 2019 and at every poll which may be taken in consequence of the aforesaid Meeting and at any adjournment thereof:
For Against
Resolution 1
To re-elect Mr. Dhammika Perera who retires in terms of Article No.103 and 104 of the Articles of Association, as a Director.
Resolution 2
To re-elect Mr. K D G Gunaratne who retires in terms of Article No.103 and 104 of the Articles of Association, as a Director.
Resolution 3
To elect Mr. J A N R Adhihetty who retires in terms of Article No.110 of the Articles of Association, as a Director.
Resolution 4
To re-appoint Messrs. Pricewaterhouse coopers Accountants as Auditors of the Company and authorize the Directors to determine their remuneration.
Resolution 5
To authorize the Directors to determine donations for the ensuing year.
In witness my/our* hands this ................................ day of ........................................................... Two Thousand and Nineteen.
..............................................................Signature of Shareholder/s
* Please delete the inappropriate words.Instructions as to completion appear on the reverse.

144 Lanka Tiles PLC
P R O X Y F O R M
INSTRUCTIONS FOR COMPLETION OF FORM OF PROXY
1. This Form of Proxy must be deposited at No. 215, Nawala Road, Narahenpita, Colombo 5 not less than forty eight (48) hours before the time fixed for the Meeting.
2. In perfecting the Form of Proxy please ensure that all details are legible.
3. If you wish to appoint a person other than a Director of the Company as your proxy, please insert the relevant details in the space provided.
4. Please indicate with an ‘X’ in the space provided, how your proxy is to vote on the resolution. If no indication is given, the proxy in his discretion will vote as he thinks fit.
5. In the case of a Company/Corporation, the proxy must be under its Common Seal, which should be affixed and attested in the manner prescribed by its Articles of Association.
6. In the case of a Proxy signed by an Attorney, the Power of Attorney must be deposited at The Secretaries’ Office (i.e. P W Corporate Secretarial (Pvt) Ltd, 3/17, Kynsey Road, Colombo 8) for registration.

