taking it analytics to the next level
TRANSCRIPT
Taking IT Analytics to the Next Level
Jeff Henry
Mainframe
CA Technologies
VP Product Management
MFX09S
Seth Miller
AIG
Director, Mainframe Resource Planning, Automation and Performance Testing

2 © 2015 CA. ALL RIGHTS RESERVED.@CAWORLD #CAWORLD
Abstract
Join us for a closer look at new IT analytics solutions from CA that will help you
reduce costs and optimize the customer experience by increasing resource
utilization, reducing system outages and allowing for better capacity planning of
mainframe resources. See how you can perform root cause analysis in addition to
correlating and analyzing data from multiple IT sources to provide better
management understanding and real-time prediction of system performance
conflicts while lowering MTTR and enabling more efficient mainframe operations.
Take part in this highly interactive session, learn how customer-driven agile
development capabilities are being prioritized and be a part of shaping the future
of new IT analytics innovations at CA.
Jeff Henry
CA Technologies
VP, Product Management
Seth Miller
AIG
Director, Mainframe Resource Planning

3 © 2015 CA. ALL RIGHTS RESERVED.@CAWORLD #CAWORLD
DEVELOPMENT
Impact on Stakeholders
SECURITY IT OPERATIONS
DELIVER QUALITY APPS FASTERLeverage detailed analytics to improve
apps quality and performance.
BETTER INSIGHTBreadth and depth of visibility into app
performance, crashes and end-user behavior. Anticipate and
respond to resource needs.
ANTICIPATE SECURITY RISKSProactive detection of security risks.
Remediate breaches before damage to enterprise resources and brand occurs.
LINE OF BUSINESS Need to make timely data-driven decisions regarding opportunities and risks for the business.
4 © 2015 CA. ALL RIGHTS RESERVED.@CAWORLD #CAWORLD
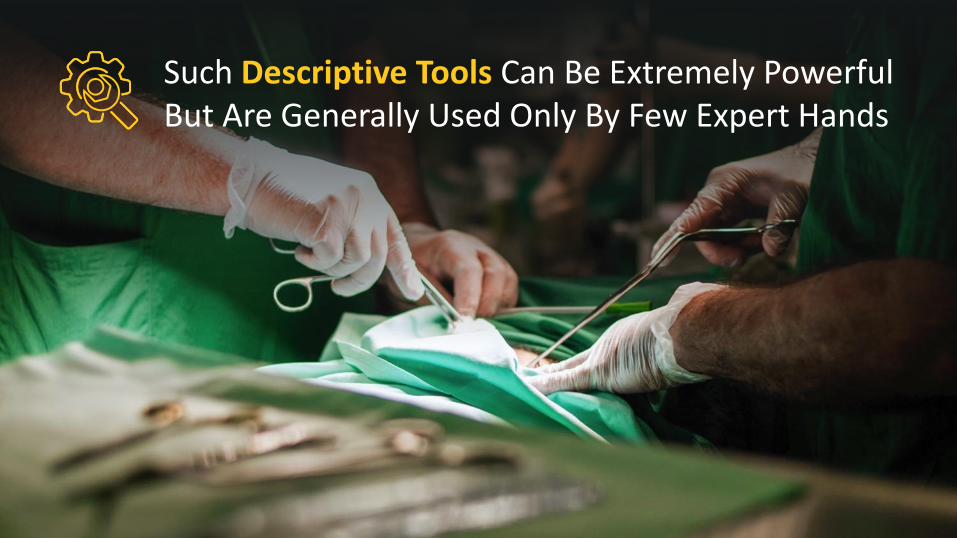
Such Descriptive Tools Can Be Extremely Powerful But Are Generally Used Only By Few Expert Hands

5 © 2015 CA. ALL RIGHTS RESERVED.@CAWORLD #CAWORLD
Surgeons on Ambulances?
Sending a “Surgical Expert” to Every Call for Help Just Doesn’t Scale

6 © 2015 CA. ALL RIGHTS RESERVED.@CAWORLD #CAWORLD
THE APPLICATION ECONOMY
Where Tools are Made Easy
to Use for Everyone
Blood pressure is HIGH.
INCREASE ACTIVITY!

7 © 2015 CA. ALL RIGHTS RESERVED.@CAWORLD #CAWORLD
How do I deliver a flawless experience every time an application touches the mainframe?
In the application economy it’s all about your customers.You need to think about your mainframe reframed.
Connect mobile-to-mainframe applications
Create mainframe infrastructure flexibility
for the future
Unleash the power of data on the mainframe
8 © 2015 CA. ALL RIGHTS RESERVED.@CAWORLD #CAWORLD
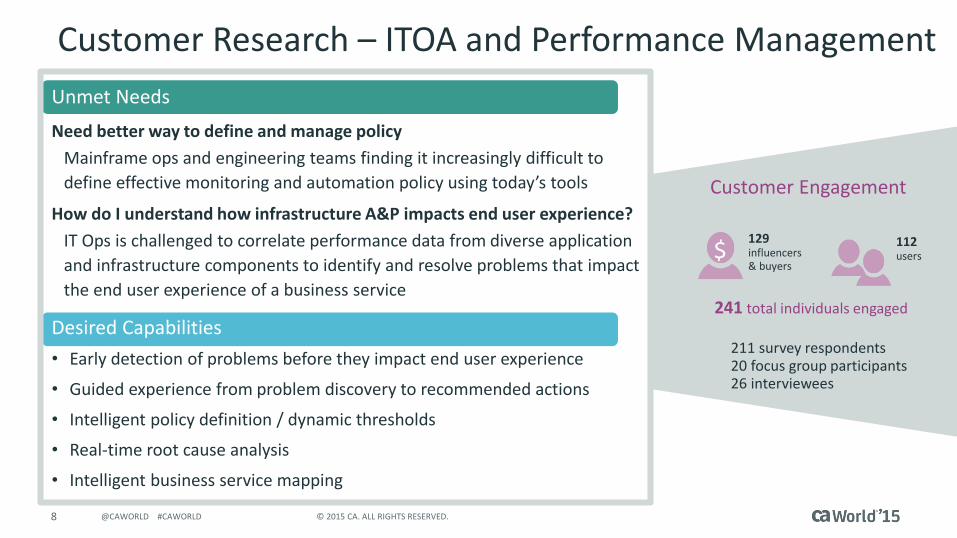
211 survey respondents20 focus group participants26 interviewees
112users
241 total individuals engaged
129influencers& buyers
Customer Engagement
$
Need better way to define and manage policy
Mainframe ops and engineering teams finding it increasingly difficult to
define effective monitoring and automation policy using today’s tools
How do I understand how infrastructure A&P impacts end user experience?
IT Ops is challenged to correlate performance data from diverse application
and infrastructure components to identify and resolve problems that impact
the end user experience of a business service
Unmet Needs
• Early detection of problems before they impact end user experience
• Guided experience from problem discovery to recommended actions
• Intelligent policy definition / dynamic thresholds
• Real-time root cause analysis
• Intelligent business service mapping
Desired Capabilities
Customer Research – ITOA and Performance Management

9 © 2015 CA. ALL RIGHTS RESERVED.@CAWORLD #CAWORLD
We’re One AIG
The world’s leading
insurance organization,
with more than 90 million
customers around the
globe.

10 © 2015 CA. ALL RIGHTS RESERVED.@CAWORLD #CAWORLD
Actionable Insight for AIG
Easier and more effective access to historic data allows
us to compare current performance, and “out of
bounds” conditions
We’ve spent way too long having to dig into data to find “what
happened” and “what changed”
DATAAnalytics enable us to more accurately monitor system
component performance by time-of-day • day-of-week •
seasonal various
THRESHOLDSTHE SYSTEM HAS TO
“TALK TO US”

11 © 2015 CA. ALL RIGHTS RESERVED.@CAWORLD #CAWORLD
Evolution of IT Operational Experience
Historically customers have demanded vendors provide flexible ‘toolkits’ for experts to customize and use
Shifts in the desired experience
Increasingly customers want ‘adaptive expert systems’ that learn their environment and support non-experts in making the right decisions

12 © 2015 CA. ALL RIGHTS RESERVED.@CAWORLD #CAWORLD
Performance Management – EXAMPLES ONLYDelight your end user, protect your experts
DIFFERENTIAL ANALYSISTIMELINE VIEWS
Quickly ID what changed and where without any logs
Isolate performance culprits Connect Dev and Ops
PERSPECTIVES
Visual data mining by geo, app, BU or team role
See only what matters True cross-team collaboration
Faster Resolutiondrives
Improved Uptime
Shared Expertisemeans
Continual Optimization
Analytics prioritize alerts on multiple weighted criteria
Reduce false positives Focus on real issues, not noise
Higher Efficiencyreduces
Ownership Costs

13 © 2015 CA. ALL RIGHTS RESERVED.@CAWORLD #CAWORLD
Scenario: Problem Detection
A large application change is brought into production. CPU utilization (along with many other performance metrics) is being actively monitored with alerts being generated based on static thresholds.

14 © 2015 CA. ALL RIGHTS RESERVED.@CAWORLD #CAWORLD
Scenario: Problem Detection
Among the changes is a bug that was not caught in test. CPU utilization begins to rise but without other serious work on the system the problem goes unnoticed through the weekend.

15 © 2015 CA. ALL RIGHTS RESERVED.@CAWORLD #CAWORLD
Scenario: Problem Detection
During peak load Monday morning Steve receives a CPU alert and, realizing the potential impact, quickly escalate the issue with the hope of resolving it before any line of business is impacted.

16 © 2015 CA. ALL RIGHTS RESERVED.@CAWORLD #CAWORLD
Scenario: Early Detection
Jess Sam Kyle
…
Ana John Steve
A war room situation develops where Steve and others from several teams come together and use many different tools to try and understand the problem and determine root cause.
Team 1
Team n

17 © 2015 CA. ALL RIGHTS RESERVED.@CAWORLD #CAWORLD
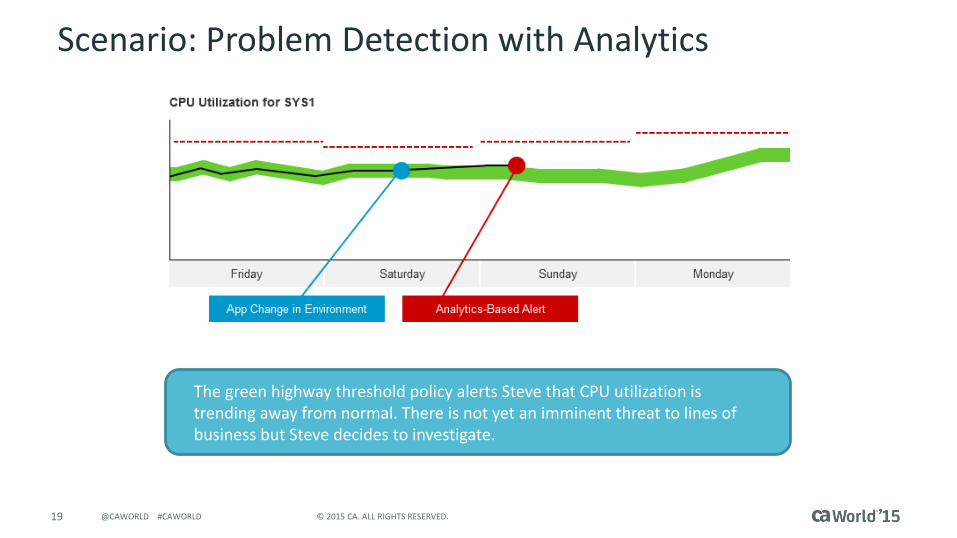
Scenario: Problem Detection with Analytics
A large application change is brought into production.

18 © 2015 CA. ALL RIGHTS RESERVED.@CAWORLD #CAWORLD
Scenario: Problem Detection with Analytics
Steve uses analytics to construct a green highway or statistical range that defined normal around this metric.
19 © 2015 CA. ALL RIGHTS RESERVED.@CAWORLD #CAWORLD
Scenario: Problem Detection with Analytics
The green highway threshold policy alerts Steve that CPU utilization is trending away from normal. There is not yet an imminent threat to lines of business but Steve decides to investigate.

20 © 2015 CA. ALL RIGHTS RESERVED.@CAWORLD #CAWORLD
Scenario: Problem Detection with Analytics
Ana SteveBen
Steve works with a small team to understand and resolve the problem.

21 © 2015 CA. ALL RIGHTS RESERVED.@CAWORLD #CAWORLD
Scenario: Problem Detection with Analytics
The problem is resolved before it impacts the business and the cost of the problem is minimized.

22 © 2015 CA. ALL RIGHTS RESERVED.@CAWORLD #CAWORLD
Prototype - Differential AnalysisAssisted Triage & Dynamic Thresholds based on historic data derived “normal” baseline

23 © 2015 CA. ALL RIGHTS RESERVED.@CAWORLD #CAWORLD
Noise
B A
S E
L I
N E
S
Maintaining alerts is time consuming, even with automated baselines
Difficult to visually determine where to focus resources
Reactive not proactive
How red is red?
What issue should I work on first?
Should I escalate?
Why is every issue a fire drill?
How long has this been an issue?
INCIDENT PANEL
24CRIT
40OTHER
308OK
CRIT CPU CHK (member) Server Microsoft Windows 0h 48min
CRIT CPU CHK (member) Server Linux 3h 34min
CRIT CPU CHK (member) Server Linux 2h 13min
CRIT Disk Cap CHK Server Microsoft Windows 0h 48min
CRIT Disk Cap CHK Server Microsoft Windows 3h 34min
WARN CPU CHK (member) Server Linux 2h 13min
WARN Disk Cap CHK Server Linux 0h 48min
CRIT Disk Cap CHK Server Microsoft Windows 3h 34min
WARN CPU CHK (member) Server Linux 2h 13min
WARN Disk Cap CHK Server Linux 0h 48min
24 © 2015 CA. ALL RIGHTS RESERVED.@CAWORLD #CAWORLD
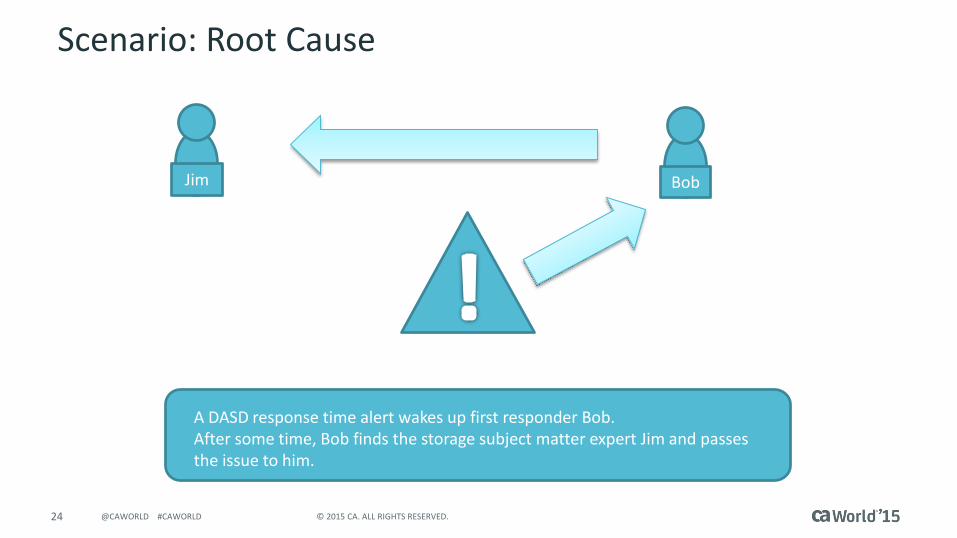
Scenario: Root Cause
Jim
A DASD response time alert wakes up first responder Bob.After some time, Bob finds the storage subject matter expert Jim and passes the issue to him.
Bob
25 © 2015 CA. ALL RIGHTS RESERVED.@CAWORLD #CAWORLD
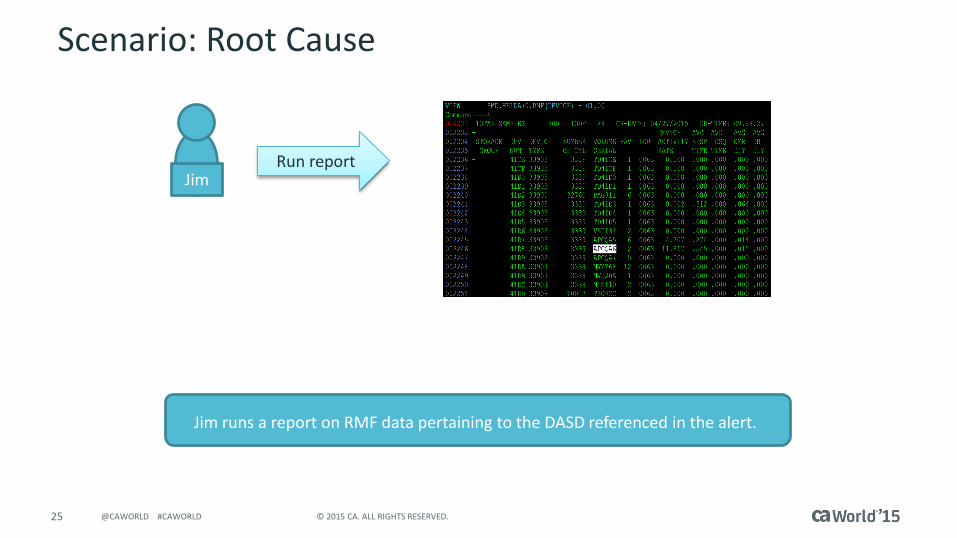
Scenario: Root Cause
JimRun report
Jim runs a report on RMF data pertaining to the DASD referenced in the alert.

26 © 2015 CA. ALL RIGHTS RESERVED.@CAWORLD #CAWORLD
Scenario: Root Cause
This leads Jim to run a second report based on the Logical Control Unit (LCU) used by that DASD.
JimRun report

27 © 2015 CA. ALL RIGHTS RESERVED.@CAWORLD #CAWORLD
This leads Jim to run a third report based on the CHIPID (CHAN) behind that LCU.
JimRun report
Scenario: Root Cause
28 © 2015 CA. ALL RIGHTS RESERVED.@CAWORLD #CAWORLD
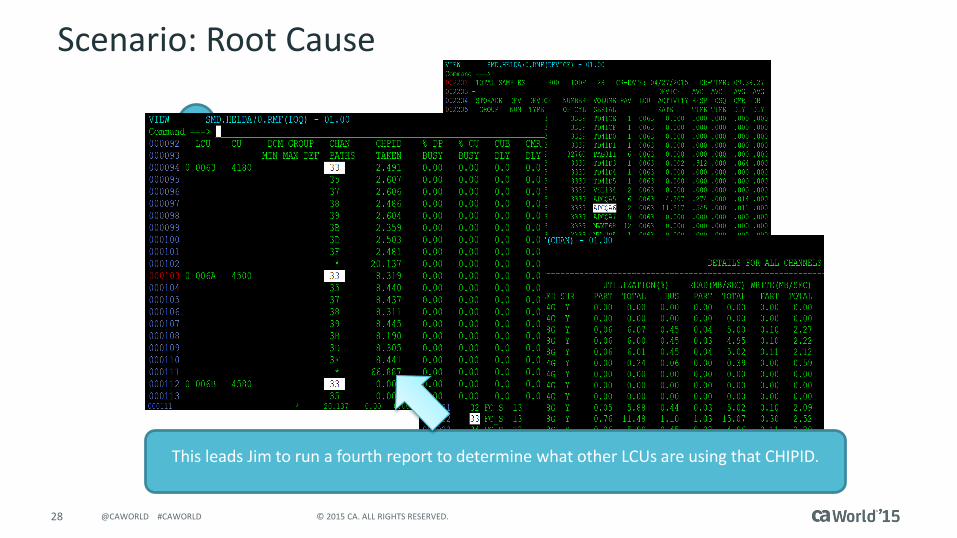
JimRun report
This leads Jim to run a fourth report to determine what other LCUs are using that CHIPID.
Scenario: Root Cause

29 © 2015 CA. ALL RIGHTS RESERVED.@CAWORLD #CAWORLD
SME
Run report
After a fifth RMF report, Jim notices a DASD volume with a lot of activity and very low response time, using the same CHIPID. By moving the volume the problem is solved.
Scenario: Root Cause

30 © 2015 CA. ALL RIGHTS RESERVED.@CAWORLD #CAWORLD
SME
Run report
Finding the root cause required a subject matter expert to run numerous reports, skim through them and locate the non-normal values.
Scenario: Root Cause

31 © 2015 CA. ALL RIGHTS RESERVED.@CAWORLD #CAWORLD
Scenario: Root Cause with Analytics
Bob
A DASD response time alert wakes up first responder Bob..

32 © 2015 CA. ALL RIGHTS RESERVED.@CAWORLD #CAWORLD
Scenario: Root Cause with Analytics
Bob
Analytics dynamically maps the relationships between metrics and provides green highways to define normal, helping Bob know where to start and where to go next.

33 © 2015 CA. ALL RIGHTS RESERVED.@CAWORLD #CAWORLD
Scenario: Root Cause with Analytics
Bob
Using the power of analytics, Bob is able to follow the same path as Jim and quickly come to the same conclusion; that another volume being used by a different application is the root cause of the alert.

34 © 2015 CA. ALL RIGHTS RESERVED.@CAWORLD #CAWORLD
Prototype – Unified Performance ManagementAcross the enterprise – dynamic logical topologies

35 © 2015 CA. ALL RIGHTS RESERVED.@CAWORLD #CAWORLD
Prototype Timeline ViewQuickly see changes in the context of performance problems
BEFORE CHANGE AFTER CHANGE
App flow change
Then performance degrades
Two new services were added
It began here!

36 © 2015 CA. ALL RIGHTS RESERVED.@CAWORLD #CAWORLD
CA Performance AnalyticsEarly detection of system performance issues before they disrupt end user experience
Proactively monitor
and triage
mainframe
performance issues
as they begin to
unfold
Decrease helpdesk call volume
Rapid assisted
triage will decrease
MTTR and reduce
downtime
Accelerates
learning for the
more junior
workforce
Avoid problems
before they
impact SLAs

37 © 2015 CA. ALL RIGHTS RESERVED.@CAWORLD #CAWORLD
CA Performance Management Portfolio VisionUnified performance management for z Systems Planned
Available
Distributed/Mainframe Operations Analysts
MF Systems/Network
Analysts
Distributed Application Analysts
Network Analysts
CA NetMaster®
Databases
Network
CICS & MQ
z/VM, KVM & Linux on z
CA UIMCA UIM for z Systems
CA Cross Enterprise APM
Unified Performance Management Console
CA APM
System Analysts
CA SYSVIEW®
Storage
Capacity Planner
CA MICS®
Storage Administrator
CA Vantage™
ANALYTICS INFUSED
• Assisted Triage
• Differential Analysis
• Leveraging Common Western Electric Rules

38 © 2015 CA. ALL RIGHTS RESERVED.@CAWORLD #CAWORLD
Application Performance Diagnostics
Embedding usable MAT diagnostic measurements in the triage and problem resolution process
Dynamic
Thresholds
Calculated thresholds based on analysis of historic and near-time system data
Policy Effectiveness Ratings
Monitor the effectiveness of manually created policies to drain false positives from operational experience
Performance Management Analytics
Integrated Enterprise
Monitoring Experience
Metric, policy and interaction consistency between APM, UIM and MF Performance experience

39 © 2015 CA. ALL RIGHTS RESERVED.@CAWORLD #CAWORLD
CA Database Management Portfolio VisionManaging growth and complexity to address evolving data management needs Planned
Available
IMS DB2
CA Administration Suite
CA Performance Suite
CA Utilities Suite
CA Recovery Suite
Experienced DBA
Web App Server
Mobile Developer
Big Data Analyst
CA
Ap
p S
ervi
ces
Orc
hes
trat
or
CA vStormConnect
End User
CA Analytics for DB2
CA Performance Monitor for DB2
CA Administration for DB2
Next GenDBA
SaaS
ANALYTICS INFUSED
• Initial offering focusing on CA Detector Install base
• Delivered through a SaaS deployment model with flexible pricing tiers
40 © 2015 CA. ALL RIGHTS RESERVED.@CAWORLD #CAWORLD
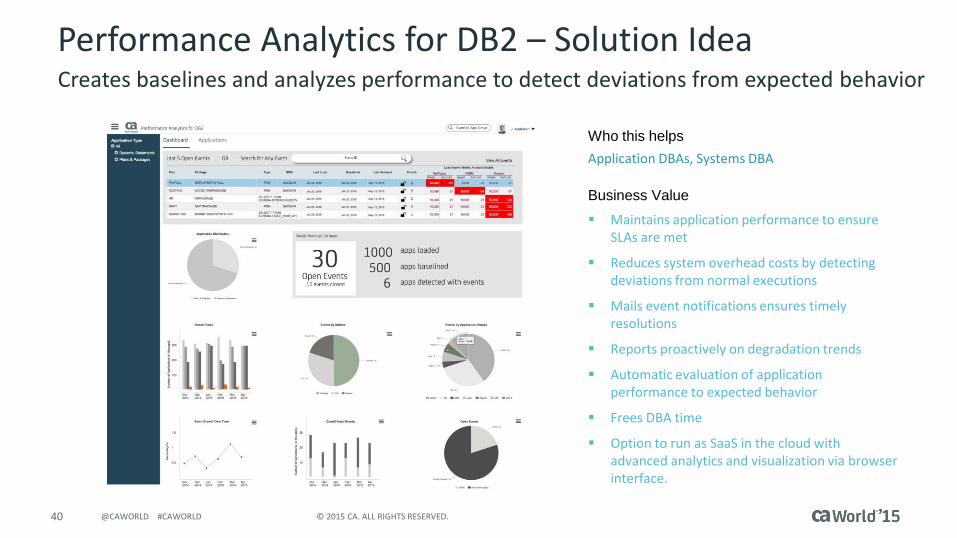
Performance Analytics for DB2 – Solution IdeaCreates baselines and analyzes performance to detect deviations from expected behavior
Maintains application performance to ensure SLAs are met
Reduces system overhead costs by detecting deviations from normal executions
Mails event notifications ensures timely resolutions
Reports proactively on degradation trends
Automatic evaluation of application performance to expected behavior
Frees DBA time
Option to run as SaaS in the cloud with advanced analytics and visualization via browser interface.
Business Value
Application DBAs, Systems DBA
Who this helps

41 © 2015 CA. ALL RIGHTS RESERVED.@CAWORLD #CAWORLD
Distributed/Mainframe Operations Analysts
CA Disk™
Storage Administrator
CA Tape™
Tape & Disk Devices
CA View/Deliver™
CA UIM and CA UIM for z Systems Storage
CA Cloud Storage for z Systems™
Planned
Available
CA VTape™
CA Vantage™
Po
licy
Engi
ne
CA 1™
CA TLMS™
CA Disk™
Storage Administrator
CA Tape™
Tape & Disk Devices CA VTape™
CA Vantage™
CA 1™
CA TLMS™
End Users
CA Spool™
OperationsMF System
ProgrammerApplication Developer
Po
licy
Engi
ne
TransformSearch Archive
Administer
Business Continuity Solution
CA Web Viewer™
E-mailPrint
Reports
CA Storage and Enterprise Content Management VisionOptimizing Management of Storage for a Highly Available Mainframe
ANALYTICS INFUSED
• Dynamic thresholds
• Early detection of issues
• Optimization simulation / modeling

42 © 2015 CA. ALL RIGHTS RESERVED.@CAWORLD #CAWORLD
Optimization of Storage Infrastructure
Monitor the environment, forecast and simulate / model changes, apply policies and remediate for storage optimization
Dynamic
Thresholds
Calculated thresholds based on analysis of historic and near-time system data
Policy Effectiveness Ratings
Monitor the effectiveness of manually created policies to drain false positives from operational experience
Storage Management Analytics
Integrated Enterprise
Monitoring Experience
Metric, policy and interaction consistency between MF Performance and storage management

43 © 2015 CA. ALL RIGHTS RESERVED.@CAWORLD #CAWORLD
Security and ComplianceManaging security, data access and compliance
CA Data Protection
3rd party DLP Solution
3rd party DLP Solution
Big Data AnalyticsSolutions
CA Compliance Event Manager
IBM RACF
CA Top Secret
CA ACF2
CA Cleanup
In Ideation: Mainframe Advanced
Authentication
CA Data Content
Discovery
CA Auditor
Secure mainframe assetsCapture events affecting compliance and policyDiscover sensitive data
Extend compliance event data to analytics solutionsEnable secure data in motion across the enterprise
Security Administrator
Big Data AnalystAuditor
Planned
Available
Non-CA Product
ANALYTICS INFUSED
• Network Connection Patterns
• Intrusion Detection

44 © 2015 CA. ALL RIGHTS RESERVED.@CAWORLD #CAWORLD
Network Security Analytics Analytics-based discovery of network connection patterns
Maintains application performance to ensure Early notification of network patterns compatible with malicious intrusion.
Leverage analytics to perform analysis of disparate patterns of data.
Complement and fill gaps that Intrusion Detection System doesn’t fill today.
Ability to monitor and analyze rouge port scans from remote addresses.
Correlation of event traffic patterns.
Business Value
Network Analysts, Security Analysts, IT Operations
Who this helpsInternet
Analytics
Intranet
IDS
Network
Management
Internal attacks External Attacks
TCP/IP Stacks
DMZ
Analyst
45 © 2015 CA. ALL RIGHTS RESERVED.@CAWORLD #CAWORLD
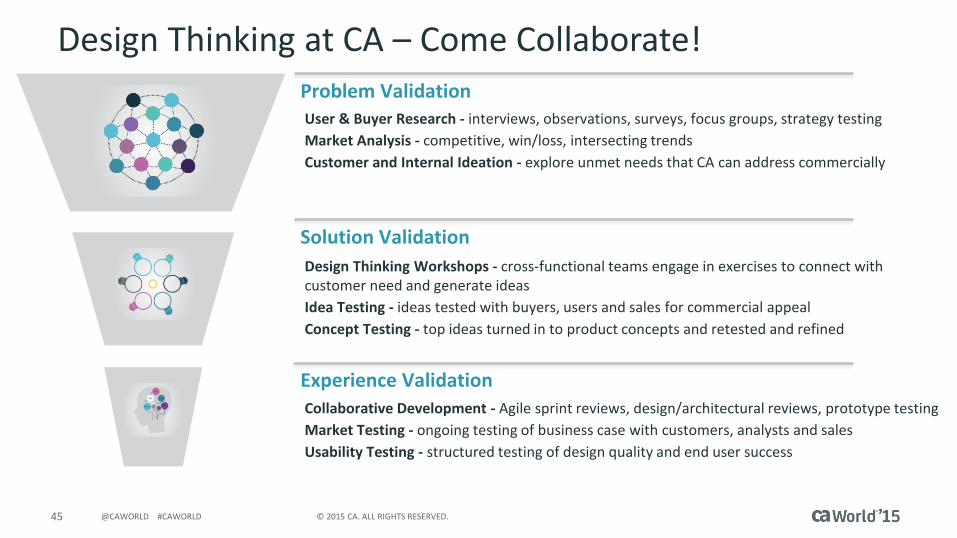
Design Thinking at CA – Come Collaborate!
User & Buyer Research - interviews, observations, surveys, focus groups, strategy testing
Market Analysis - competitive, win/loss, intersecting trends
Customer and Internal Ideation - explore unmet needs that CA can address commercially
Design Thinking Workshops - cross-functional teams engage in exercises to connect with customer need and generate ideas
Idea Testing - ideas tested with buyers, users and sales for commercial appeal
Concept Testing - top ideas turned in to product concepts and retested and refined
Collaborative Development - Agile sprint reviews, design/architectural reviews, prototype testing
Market Testing - ongoing testing of business case with customers, analysts and sales
Usability Testing - structured testing of design quality and end user success
Problem Validation
Solution Validation
Experience Validation

46 © 2015 CA. ALL RIGHTS RESERVED.@CAWORLD #CAWORLD
Recommended Sessions
SESSION # TITLE DATE/TIME
MFT15TNew Mainframe IT Analytics: Actionable Insight into Root
Cause Analysis of Performance IssuesWED 11/18 at 3:45 pm
MFT08SAnalyst Expert View: Mainframe in the Application Economy - Gary Barnett Chief Analyst Ovum
THUR 11/19 at 10:30 am

47 © 2015 CA. ALL RIGHTS RESERVED.@CAWORLD #CAWORLD
Follow Conversations At…
Product X
Theater # location
What’s Next: MainframeIT Analytics

48 © 2015 CA. ALL RIGHTS RESERVED.@CAWORLD #CAWORLD
For Informational Purposes Only
Terms of this Presentation
© 2015 CA. All rights reserved. All trademarks referenced herein belong to their respective companies. The presentation provided at CA
World 2015 is intended for information purposes only and does not form any type of warranty. Some of the specific slides with customer
references relate to customer's specific use and experience of CA products and solutions so actual results may vary.
Certain information in this presentation may outline CA’s general product direction. This presentation shall not serve to (i) affect the rights
and/or obligations of CA or its licensees under any existing or future license agreement or services agreement relating to any CA software
product; or (ii) amend any product documentation or specifications for any CA software product. This presentation is based on current
information and resource allocations as of November 18, 2015, and is subject to change or withdrawal by CA at any time without notice. The
development, release and timing of any features or functionality described in this presentation remain at CA’s sole discretion.
Notwithstanding anything in this presentation to the contrary, upon the general availability of any future CA product release referenced in
this presentation, CA may make such release available to new licensees in the form of a regularly scheduled major product release. Such
release may be made available to licensees of the product who are active subscribers to CA maintenance and support, on a when and if-
available basis. The information in this presentation is not deemed to be incorporated into any contract.

49 © 2015 CA. ALL RIGHTS RESERVED.@CAWORLD #CAWORLD
Q & A

50 © 2015 CA. ALL RIGHTS RESERVED.@CAWORLD #CAWORLD
Because those who build the apps will own the future ...
And those apps continue to rely on the MAINFRAME

51 © 2015 CA. ALL RIGHTS RESERVED.@CAWORLD #CAWORLD
For More Information
To learn more, please visit:
http://cainc.to/Nv2VOe
CA World ’15