take your tv plans to the movies adding cinema to your media mix increases reach and engagement...
TRANSCRIPT

Take Your TV Plans to the Movies
Adding Cinema to Your Media Mix Increases Reach and
Engagement
Presented by:

2
Some ad agencies plan Cinema in the Digital Out-of-Home Group
Others place Cinema in the TV Broadcast group
And still others see Cinema in neither group
No matter where Cinema may be placed, marketers see the power of the media as Cinema Advertising has grown 28% in the past 3 years
Where Does Cinema Fit in the Media Milieu?
Source: CAC Marketplace Report, Audited by Miller, Kaplan, Arase & Co

3
How Do You Plan Cinema?

4
Think Of Cinema As A TV Network
July 2009 Prime Monthly Reach for A18-49 (000)
Source: Nielsen Audience Watch 6/26-7/31/09. 10/30-11/26/09. M-Sa 8p-11p/Su 7p-11p, Live + Same Day Ratings; 30 min cum qualifier; Nielsen Cinema Audience Report July and November 2009 respectively
Rank Network
P18-49 Reach (000)
1 Fox 54,013
2 NBC 52,178
3 ABC 50,451
4 CBS 49,008
5 Cinema 44,409
6 TBS 35,614
7 USA Network 35,532
8 TNT 34,224
9 FX 32,604
10 ABC Family 28,078
November 2009 Prime Monthly Reach for A18-49 (000)
Rank Network
P18-49 Reach (000)
1 Fox 72,232
2 ABC 70,625
3 NBC 67,099
4 CBS 64,197
5 ESPN 34,764
6 TBS 32,488
7 USA Network 30,329
8 Cinema 26,738
9 FX 26,717
10 Turner Network Television (TNT) 26,123

5
Fusion Has Helped Cinema Define its Media Mojo
By integrating Cinema and TV’s respondent level data, along with product usage files from MRI, the media landscape suddenly spotlights a “newcomer” as viable as television
Now Advertisers can find not just another media alternative to the cluttered Sight, Sound and Motion on television…but a new environment of Sight, Sound and Emotion when targeting their audience

6
Fused database:Evaluate overlap between TV and
Cinema Audience
Demonstrate how Cinema’s audience uniquely enhances
targeted reach
What is Fusion? Fusion integrates information from two
separate data sets into one.
How is it done? Fusion pairs up respondent level data
by matching on similar characteristics from the two sources.
Why do it? For improved cross-platform media
evaluation against an advertiser’s campaign target.
Nielsen TV Ratings
Nielsen Cinema
Audience Report
Fusion Process: Linking common
data characteristics or data “hooks”
More About Fusion…
7
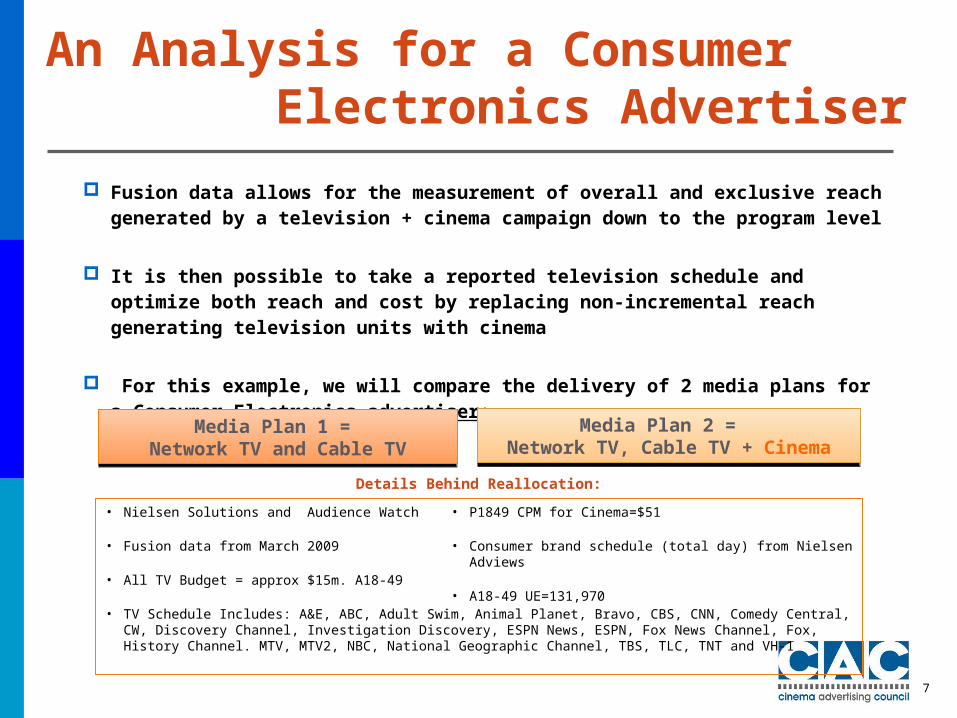
Fusion data allows for the measurement of overall and exclusive reach generated by a television + cinema campaign down to the program level
It is then possible to take a reported television schedule and optimize both reach and cost by replacing non-incremental reach generating television units with cinema
For this example, we will compare the delivery of 2 media plans for a Consumer Electronics advertiser:
An Analysis for a Consumer Electronics Advertiser
Media Plan 1 = Network TV and Cable TV
Media Plan 1 = Network TV and Cable TV
Media Plan 2 = Network TV, Cable TV + Cinema
Media Plan 2 = Network TV, Cable TV + Cinema
Details Behind Reallocation:
• Nielsen Solutions and Audience Watch
• Fusion data from March 2009
• All TV Budget = approx $15m. A18-49
• TV Schedule Includes: A&E, ABC, Adult Swim, Animal Planet, Bravo, CBS, CNN, Comedy Central, CW, Discovery Channel, Investigation Discovery, ESPN News, ESPN, Fox News Channel, Fox, History Channel. MTV, MTV2, NBC, National Geographic Channel, TBS, TLC, TNT and VH-1
• P1849 CPM for Cinema=$51
• Consumer brand schedule (total day) from Nielsen Adviews
• A18-49 UE=131,970

8
A18-49 Reach For Consumer Electronics TV Schedule
$$$ (000) P18-49 GRPsExclusive P18-49
Reach (000)Total P1849 Reach (000)
Network Cable Total Network Cable Total Network Cable
Original Schedule $13,064 $1,492 $14,557 193.0 107.8 300.8 41,467 23,906 88,773
P18-49 Reach (%)
Source: Nielsen Solutions and Audience Watch. Fusion data from March 2009. Totally TV budget=approx $15m. A18-49 CPM for Cinema=$51. Consumer brand schedule (total day) from Nielsen Adviews. A18-49 UE=131,970

9
$$$ (000) P18-49 GRPs
Exclusive P18-49 Reach (000) Total P18-
49 Reach (000)
Network Cable Cinema Total Network Cable Cinema Total Network Cable Cinema
Original Schedule $13,064 $1,492 $0 $14,557 193.0 107.8 0.0 300.8 41,467 23,906 0 88,77310% Reallocation $11,546 $1,492 $1,456 $14,494 185.4 107.8 21.8 314.9 36,173 21,427 5,507 93,78515% Reallocation $10,923 $1,492 $2,184 $14,599 178.2 107.8 32.6 318.6 33,933 19,963 8,225 96,632
P18-49 Reach (%)
A18-49 Reach For Consumer Electronics Grows +9% When
Cinema is Added
Source: Nielsen Solutions and Audience Watch. Fusion data from March 2009. Totally TV budget=approx $15m. A18-49 CPM for Cinema=$51. Consumer brand schedule (total day) from Nielsen Adviews. A18-49 UE=131,970

10
73.6%
85% TV/15% Cinema
$$$ (000) P18-49 GRPs
Exclusive P18-49 Reach (000) Total P18-
49 Reach (000)
Network Cable Cinema Total Network Cable Cinema Total Network Cable Cinema
Original Schedule $13,064 $1,492 $0 $14,557 193.0 107.8 0.0 300.8 41,467 23,906 0 88,773
10% Reallocation $11,546 $1,492 $1,456 $14,494 185.4 107.8 21.8 314.9 36,173 21,427 5,507 93,785
15% Reallocation $10,923 $1,492 $2,184 $14,599 178.2 107.8 32.6 318.6 33,933 19,963 96,632
Source: Nielsen Solutions and Audience Watch. Fusion data from March 2009. Totally TV budget=approx $15m. A18-49 CPM for Cinema=$51. Consumer brand schedule (total day) from Nielsen Adviews. A18-49 UE=131,970
Additionally, the 15% reallocation example demonstrates how this advertiser would have
realized a 8.2m gain in new A18-49 consumers not previously exposed to the original all TV buy
8,225
Cinema Will Furthermore Garner Exclusive Reach
P18-49 Reach (%)

11
Cinema not just sight, sound and motion…
…it’s Sight, Sound and Emotion

12
Measuring Emotional Attachment via NewMediaMetrics
NewMediaMetrics (NMM) 360° Cross Platform Study is a syndicated study that helps marketers identify consumers who are emotionally attached (EA) to consumer brands and media properties
Rooted in psychological and academic principles, NMM uses EA to help predict consumer purchase and media viewing behavior
Here is the EA scale A score of “0” means: This brand/medium does not resonate for you, and you are not
engaged in this brand/medium. You could give up the brand/medium
A score of “10” means: The brand/medium resonates for you, and you are engaged in this
brand/medium. You do not want to give up the brand/medium
9 or 10=EA to brand and/or medium
NMM specializes in linking a brand’s most loyal consumers with the media they most intently consume so marketers can maximize future media investments—Think of it as a type of planning tool
13
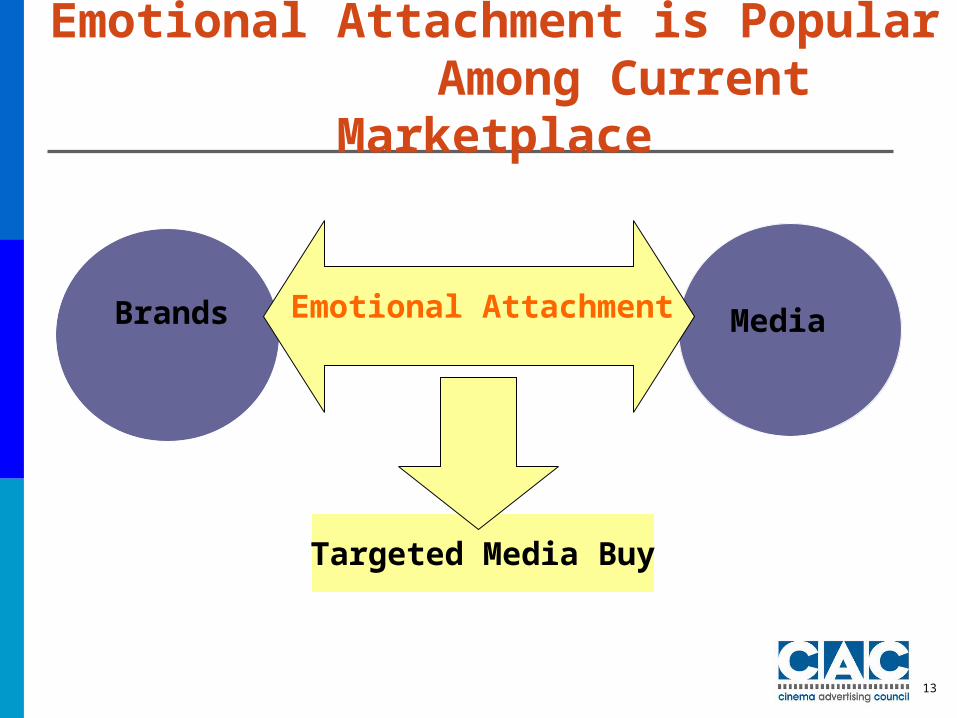
Emotional Attachment is Popular Among Current
Marketplace
Targeted Media Buy
Brands Media Emotional Attachment

14
Consumer Electronics Brand Loyalists are Emotionally Attached to the
Movies
25%34%
54%
Print TV Cinema
+59%
vs. TV
To Be Read: A18-49 who are emotionally attached to a Consumer Electronics brand are 59% more likely to be EA to Cinema than to TV (54% vs. 34%)
Source: NewMediaMetrics 2010. Base=Persons 18-49 (n=2,516). Print=magazine/print combined Emotional Attached = rated 9/10 on 10-point scale; Consumer brand Loyalists=EA to specific consumer electronic brand; Cinema= Watching a movie in a movie theatre.
+116% vs. Print
A18-49 Consumer Electronics EA to Media

15
Cinema Outperforms Top Media Properties
20% 21%
45% 46%
54%
Nat'l Geo Magazine People NBC ABC Cinema
Source: NewMediaMetrics 2010. Base= P18-49 (n=2,516). Emotional Attached = rated 9/10 on 10-point scale; Consumer electronics brand loyalists=EA to specific consumer electronics brand; Cinema = Watching a movie in a movie theatre. Highest ranking TV and magazine outlets respectively
To Be Read: A18-49 who are emotionally attached to Consumer Electronics brand are 17% more likely to be EA to Cinema than to ABC (54% vs. 46%)
Consumer Electronics can better plan in the future and reach their target at the movies
A18-49 Consumer Electronics EA to Specific Media Properties
Cinema EA Index compared to:
ABC: 117
NBC: 120
People: 257
Nat’l Geo: 270

16
Summary
Cinema is a Nielsen measured sight, sound and motion medium that delivers mass reach on par with the nation’s largest TV networks.
Nielsen Cinema data is easily ported into such software platforms as Nielsen’s IMS or Telmar’s All Media Planner to plan cinema in conjunction with television and other media.
The addition of cinema to a television schedule allows advertisers to add incremental reach to a media plan that would otherwise be untenable via TV alone.
The immersive experience provided by the cinema environment elicits an emotional response from the viewer that is unmatched by other media.
Via new research products such as Nielsen Fusion data and NewMediaMetrics 360° Cross Platform, advertisers can quantify the significant impact of adding cinema to their existing television campaigns.
In preparation for this presentation, similar analyses were successfully conducted across multiple product categories (i.e. QSR and CPG). Inquiries for this additional data can be made through the CAC.