tad-ca-apm-wp 2010 29-eng final pour olis - oecd
TRANSCRIPT

Unclassified TAD/CA/APM/WP(2010)29/FINAL Organisation de Coopération et de Développement Économiques Organisation for Economic Co-operation and Development 20-Jan-2011 ___________________________________________________________________________________________
English - Or. English TRADE AND AGRICULTURE DIRECTORATE COMMITTEE FOR AGRICULTURE
Working Party on Agricultural Policies and Markets
THEMATIC REVIEW ON RISK MANAGEMENT: CANADA
Contact person: Jesús Antón (Email: [email protected])
JT03295382
Document complet disponible sur OLIS dans son format d'origine Complete document available on OLIS in its original format
TA
D/C
A/A
PM/W
P(2010)29/FINA
L
Unclassified
English - O
r. English

TAD/CA/APM/WP(2010)29/FINAL
2
NOTE BY THE SECRETARIAT
The project “Optimal Risk Management Policy in Agriculture” [Output Area 3 of the 2009-10 PWB] develops the analysis published in Risk Management in Agriculture: a Holistic Approach (OECD, 2009). The project is outlined in [TAD/CA/APM/WP(2010)3] and includes three components:
1. Thematic review of risk management.
2. Farm level analysis of risk management strategies and policies.
3. Aggregate model analysis of exogenous risk and price volatility.
This report on Canada is one of the contributions to the first component of the project, together with reports on Australia [TAD/CA/APM/WP(2010)15/FINAL], New Zealand [TAD/CA/APM/WP(2010)16/FINAL], Spain [TAD/CA/APM/WP(2010)17/FINAL] and The Netherlands [TAD/CA/APM/WP(2010)30/FINAL].
All country reports are based on the same methodology and follow the same process of preparation. The key inputs to these reports are: responses by governments to a detailed questionnaire prepared by the Secretariat; a background report drafted by a national expert; a Secretariat visit to the country with participation of national and international experts; a report on the country visit by an international expert.
The Secretariat would like to kindly acknowledge financial, information and organisational assistance of Agriculture and Agri-Food Canada (AAFC). There has been active interaction with the Secretariat at all stages of preparation of the country report on Canada and AAFC has also organised an intensive programme for the country visit on 14-18 June 2010 (see Annex 1 for details).
The expert preparing the background report for this study was David Sparling, Professor at the University of Guelph.
This document was declassified by the APM on the 19 January 2011 under the written procedure.

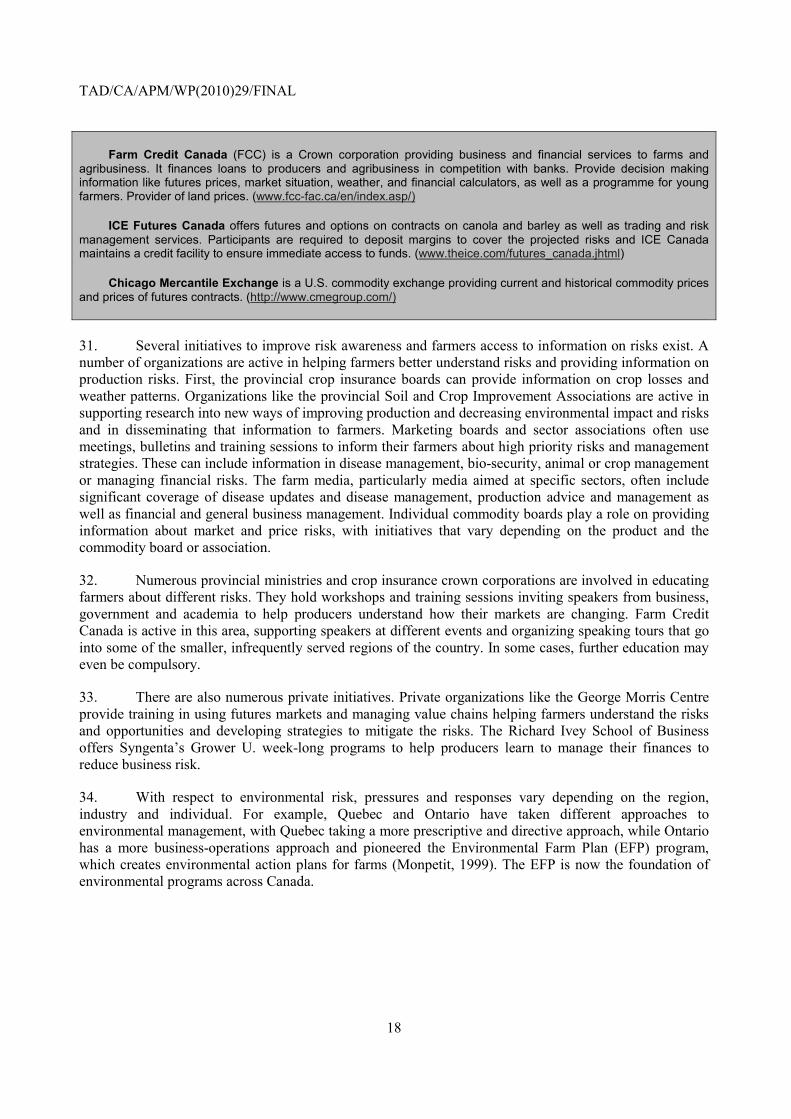
TAD/CA/APM/WP(2010)29/FINAL
3
TABLE OF CONTENTS
Glossary ....................................................................................................................................................... 6
PART I. RISKS, STRATEGIES AND POLICIES ....................................................................................... 7
1. Assessment of agricultural risks in Canada ............................................................................................. 7 1.1. Climate conditions ............................................................................................................................ 7 1.2. Key risks in agriculture ..................................................................................................................... 9 1.3 Risk perceptions .............................................................................................................................. 13 1.4. Quantitative assessment of agricultural risk ................................................................................... 15 1.5. Information and communication ..................................................................................................... 16
2. Risk Management strategies and government policies ...................................................................... 19 2.1. Agricultural Policy making in Canada ........................................................................................... 19 2.2. Farm level strategies to deal with normal risk ................................................................................ 24 2.3. Government measures dealing with normal risk ............................................................................ 28 2.4. Specific commodity arrangements led by government policies or agencies .................................. 34 2.5. Public crop insurance ...................................................................................................................... 36 2.6. Market instruments ......................................................................................................................... 41 2.7. Catastrophic risk management ........................................................................................................ 43 2.8. An overview of government risk management measures ............................................................... 48
PART II. MAIN POLICY ISSUES ............................................................................................................. 52
3. Risk Layering in Canada’s policies ....................................................................................................... 52 3.1. How do agricultural policies define different risk layers? .............................................................. 52 3.2. Are risk management programs targeted to individual farmers´ low income situations? .............. 55 3.3. Do government programmes crowd out other strategies? .............................................................. 57
4. Information and program targeting ....................................................................................................... 60 4.1. Why is information a key element of risk management policies? .................................................. 60 4.2. Targeting reductions in income: limits imposed by information .................................................... 62 4.3. Policy trade-offs on targeting and alternative approaches .............................................................. 64
PART III. POLICY IMPLICATIONS ......................................................................................................... 66
5. Policy recommendations and concluding remarks ............................................................................. 66 5.1. Policy recommendations for Canada ........................................................................................ 66 5.2 Policy lessons beyond Canada .................................................................................................. 69
ANNEX 1. TECHNICAL BACKGROUND NOTE ON THE POLICY SIMULATION IN CANADA ... 70
Characteristics of the representative farm ............................................................................................. 70 Monte-Carlo simulation ......................................................................................................................... 71 Stochastic simulation model .................................................................................................................. 71 Calibration of risk management strategies............................................................................................. 72 Calibration of Business Risk Management programs in Canada .......................................................... 73
ANNEX 2. The OECD team visit for the review of Canada ....................................................................... 75
REFERENCES ............................................................................................................................................. 76
TAD/CA/APM/WP(2010)29/FINAL
4
Tables
Table 1. Average key financial ratios for Canadian farms by gross revenue class ................................... 12 Table 2. Farm Bankruptcies across Canada 1994-2008 ............................................................................ 13 Table 3. Perceived risk and impact of selected risks for Canadian farms ................................................. 14 Table 4. Proportion of farm facing negative price-yield correlation ......................................................... 15 Table 5. Variability of revenue: monoculture and diversification ...................................................... 16 Table 6. Risk management strategies having special importance in Canada ............................................ 19 Table 7. A summary of major income stabilisation programs since 1958 ................................................ 23 Table 8. Risk management strategies in Canada ....................................................................................... 24 Table 9. Farm Breakdown by numbers and total revenue, 2007 ............................................................... 26 Table 10. Roles for contract farming in Canada ....................................................................................... 42 Table 11. Role for cooperatives in reducing agricultural risk in Canada .................................................. 42 Table 12. Recent ........................................................................................................................................ 46 Table 13. Possible responses to different categories of catastrophes in Canada ....................................... 47 Table 14. Annual average direct payments to producers in Canada for different time periods ................ 49 Table 15. Government measures related to farm risk management in Canada ......................................... 50 Table 16. Canadian risk management programs: features of different layers ........................................... 53 Table 17. Observed effects of CAIS and other programs ......................................................................... 55 Table 18. Correlation between current margin, and insurance indemnity and payments ......................... 56 Table 19. Correlation between CAIS payment and others ........................................................................ 57 Table 20. Simulated impacts of AgriStability program............................................................................. 57 Table 21. Impact of Business Risk Management Programs ...................................................................... 59 Table 22. Impact of different tiers of AgriStability Program .................................................................... 60 Table 23. Ranking of risk management policies according to different income targeting criteria ........... 65 Table A.1. Initial allocation of land .................................................................................................... 70 Table A.2. Parameters of the distribution of price, yield revenue and costs ....................................... 71 Table A.3. Observed correlation of prices, yields revenue and costs in Canada: Average across sample 71 Table A.4. Characteristics of random shock ....................................................................................... 74
Figures
Figure 1. Agricultural production zones in Canada .................................................................................... 8 Figure 2. Share of production from export sales ......................................................................................... 8 Figure 3. NAFTA Live Cattle and Processed Beef Trade Flows before and after BSE ........................... 11 Figure 4. Variability of wheat yield and price ........................................................................................... 15 Figure 5. Correlation of wheat yield and price across farms ..................................................................... 16 Figure 6. Major budgetary income policies since 1958 ............................................................................ 21 Figure 7. Annual payments under core stabilisation programs, 1979-2010 .............................................. 22 Figure 8. Canadian net farm income before government payments .......................................................... 26 Figure 9. Layering and cost sharing of AgriStability ................................................................................ 31 Figure 10. ASRA Fund deficit .................................................................................................................. 33 Figure 11. Quota Value in Manitoba, 2004-2010 ..................................................................................... 35 Figure 12. Crop Insurance Indemnities, 1979-2009 .................................................................................. 37 Figure 13. Cost-sharing arrangements for crop insurance ......................................................................... 38 Figure 14. Alberta AgriInsurance revenue and expenses .......................................................................... 40 Figure 15. Direct Payments to Canadian Producers .................................................................................. 48 Figure 16. Canadian Risk Management programmes: frequency and type of events covered.................. 54

TAD/CA/APM/WP(2010)29/FINAL
5
Boxes
Box 1. Sources of information about agricultural risk in Canada ............................................................. 17 Box 2. Main margins stabilization programs since the Farm Income Protection Act (1991) ................... 31

TAD/CA/APM/WP(2010)29/FINAL
6
Glossary
Acronym Website
AAFC Agriculture and Agri-Food Canada www.agr.ca/
APF Agricultural Policy Framework
BRM Business Risk Management
CAPI Canadian agri-food policy institute www.capi-icpa.ca/
CBOT Chicago Board of Trade
CDC Canada Dairy Commission www.cdc-ccl.gc.ca
CFIA Canadian Food Inspection Agency www.inspection.gc.ca/
CGC Canada Grain Council www.grainscanada.gc.ca
CMSMC Canadian Milk Supply Management Committee
CWB Canadian Wheat Board www.cwb.ca/
FCC Farm Credit Canada www.fcc-fac.ca/en/index.asp/
FIPA Farm Income Protection Act http://laws.justice.gc.ca/en/F-3.3/index.html
FPCC Farm Product Council of Canada http://fpcc-cpac.gc.ca/
ICE International Commodity Exchange
NAFTS National Agriculture and Food Traceability System www.ats-sea.agr.gc.ca/trac/sys-eng.htm
NAIS National Agroclimate Information Service www.agr.gc.ca/pfra/drought/index_e.htm
WGSA Western Grain Stabilisation Act

TAD/CA/APM/WP(2010)29/FINAL
7
PART I.
RISKS, STRATEGIES AND POLICIES
1. Assessment of agricultural risks in Canada
1. Risk management is central to policy objectives in Canada, a focus that has been in place for the past several decades and which now forms the main motivation underlying support. Today, farmers receive government support to manage risks both large and small, and these government policies in many cases may have crowded out other ways to manage risks. What are the risks faced by farmers in Canada? Are these risks larger than those faced by farmers in other countries, and what is behind the focus on risk management in government policy? This first section of this document will describe the types of risks faced by Canadian farmers, putting into context the discussion of risk strategies and policies to come in section two. The third section of the document will draw from the first two to evaluate the current situation in Canada with respect to risk and risk management and make some recommendations.
1.1. Climate conditions
2. Canada is a large country, being almost 10 million square kilometres and stretching from the Pacific to the Atlantic Ocean, a distance of about 5 000 km. The country is sufficiently large that it is difficult to talk about the risks facing Canadian farmers as a whole—different regions farm under very different conditions, and high transportation costs limit their interactions such that local or provincial markets can be important for many agricultural products.
3. The result is that there are two main agricultural zones in Canada, and several smaller ones (Figure 1). The western prairies are home to the largest of these, and the type of agriculture practiced in the arid zone of the west is the one that comes most easily to mind when thinking about traditional agriculture in Canada. Farms are large, producing field crops such as wheat, canola, and increasingly pulses. Beef and pork production has become an important feature of western farming, taking advantage of plentiful feed crops and access to the US market. Summers are warm and dry, with the level of moisture and the length of the growing season the two main factors determining production. Irrigation is rare, and droughts occur more frequently in the south and western parts of the Prairies. Some areas, particularly the Eastern and Northern Prairies are also often prone to excess moisture during seeding and harvest. While there are small areas of irrigated field crops, the ability to profitably use irrigation is limited by the short growing season. Prairie grain and livestock producers are highly export-dependent, producing many times more than domestic consumption.
4. Agriculture in the east, by contrast, is much less moisture constrained, and with a longer growing season can produce crops like fruit, vegetables, and corn that are rare in the prairies. Not only are weather risks less severe, this side of the country is much less export-dependent. The domestic market is larger because of the population concentration in eastern cities, and production focuses to a much greater extent on products where policies limit trade—dairy, poultry, and eggs.

TAD/CA/APM/WP(2010)29/FINAL
8
Figure 1. Agricultural production zones in Canada
Source: AAFC
5. Exports of primary agricultural products have doubled in the last 15 years, after the introduction of the North American Free Trade Agreement. Canada produces large surpluses of most agricultural commodities, and about 40% of Canadian agricultural production is exported, with the United States as the main market (Figure 2). Considering distance to markets, in many cases, north-south trade with the United States is more practical than east-west trade between regions of Canada.
Figure 2. Share of value of production from export sales
Source: Statistics Canada and AAFC calculations.

TAD/CA/APM/WP(2010)29/FINAL
9
1.2. Key risks in agriculture
6. Risks faced by farmers can be divided into two main categories: risks to production and market risks. Production risks are due to things that happen on the farm—the effects of weather and disease, and any other factor that affects the farmer’s ability to plant and harvest crops and to raise livestock, having an impact on the quantity or quality of production. Market risks are about the farmer’s ability to market its production and make a profit. These include anything that affects the price farmers receive and their ability to know and predict that price in advance, the timing of sales and anything that could prevent sales from taking place.
Crop risks
7. For crops, risks to production yield and quality are predominantly weather related. In Western Canada, the main risks are drought, cold weather and favourable conditions for planting and harvest. Late planting can threaten yield because of the shortened growing season, while delayed harvest risks quality through damaging frost or disease. In 2001 and 2002, droughts reduced yield and resulted in crop insurance payouts in Alberta and Saskatchewan beginning in 2001 and peaking to over CAD 1 billion in 2002 and CAD 1.4 billion in 2003. In 2010, uncommon heavy rain and flooding in the prairie region has caused significant prevented planting in some areas, hurt yield and quality, and delayed harvest. In eastern Canada, weather related risks include cold weather, snow or frosts in the spring or fall, drought or too much rain, and lack of heat. Risks tend to be more localized than in the west. Crop farmers, particularly in Western Canada, face long-term risks associated with global warming changing weather patterns and insect and disease ranges pushing north.
8. Diseases can be localised or widespread. Wet weather promotes mould and fungal diseases that can affect yield and quality. Insect outbreaks can damage growing plants or directly consume or damage the crop. New disease strains and evolving resistance to control measures are a longstanding concern. Crop diseases and pests can also affect the international marketability of products due to SPS constraints and product acceptability to the consumer.
9. The main sources of market risk for Canadian crops are related to price and exchange rates. These risks are costly to manage and can drive revenue variability. Advances in technology have allowed Canadian producers to improve the consistency and quality of yields in the face of adverse conditions, but producers can do little to manage prices determined in global commodity markets. The export-dependence of the sector means farmers cannot avoid exposure to risk from long distance transportation, world commodity prices and exchange rates.
10. Farmers also face input cost risks from variability in fuel or fertilizer costs for grain farmers or feed costs for livestock producers. These are global commodities and so the risks are shared by competitors around the world to a certain degree. While there has always been volatility in fuel prices, the Canadian fertilizer market had been relatively stable but has become more connected to global price movements, in particular for natural gas. To the extent that most agricultural inputs other than labour are tradable, the reduction in input prices could mitigate much of the adverse impacts of a sustained appreciation in the Canadian dollar; however input prices typically are slower to respond.
11. Cash flow is a challenge for farmers who must incur a large share of their total costs during spring planting but receive payment only after crops are sold. Farmers with insufficient working capital must market their crops at harvest in order to make payments on their loans and input costs. The same is true for farmers without adequate storage options. Greater freedom in choosing when to market their product would allow farmers to respond to price variation by withholding their product during unfavourable periods (DePape and Serecon, 2006).

TAD/CA/APM/WP(2010)29/FINAL
10
12. Farmers lie at the start of a long food marketing chain. Changes in consumer demand and reaction to food safety or quality events such as salmonella outbreaks can disrupt the ability to market products. Public resistance to genetically modified foods in some markets bring risks associated with contamination of non-GM varieties destined for those markets. As the recent Triffid flax1 case illustrates, this can have immediate impacts in dealing with contaminated product rejected by a market, but also longer term impacts as the market may be closed to future shipments.
Livestock Risks
13. Although livestock producers experience production risks related to weather, mainly through impacts on forage and pasture production, overall, they are not as exposed to weather related risks as grain farmers. The major categories of risk most relevant to livestock producers are market related, feed production and animal health risks.
14. The livestock sector in western Canada grew strongly in response to the elimination of export subsidies for feed crops and trade liberalisation in North America. A low Canadian dollar during that period provided Canada with a competitive advantage in live cattle, processed beef, live hogs and pork. The dramatic increase in production in Canada has resulted in a sector that is strongly export-dependent, in particular with respect to trade with the United States, where Canadian producers send mostly live animals into the American slaughter and marketing system.
15. An export oriented sector faces multiple risks that influence the final price received by the producer. Besides the domestic price, there is the difference in price between the Canadian and US market (termed the basis) and the currency exchange rate as returns from animals marketed in the United States are converted back to Canadian dollars.
16. An export-oriented sector is vulnerable to trade restrictions. When the sector faces animal health risks, like BSE, foot and mouth disease and avian influenza, loss of trade is often the most serious issue. Relatively few animals were culled due to the BSE cases in 2003, but it resulted in closed borders to all Canadian beef for limited time and greatly reduced market access for years. The impact on prices to Canadian producers and processors was large and prolonged (Figure 3). Cost estimates for this outbreak for the industry reach as high as CAD 7 billion although Klein and Le Roy (2010) estimated the actual losses at CAD 4.2 billion. The domestic market doesn’t have the capacity to absorb the number of animals produced, so there are few options available to the rancher when export markets are unavailable.
1. In 2009, flax destined for the E.U. market was found to be contaminated with trace amounts of a GM
variety that was not supposedly in production at that point. As result E.U. embargoed Canadian flax imports until a rigorous product testing protocol was put in place. The EU recently began accepting imports of Canadian flax.

TAD/CA/APM/WP(2010)29/FINAL
11
Figure 3. NAFTA Live Cattle and Processed Beef Trade Flows before and after BSE
Source: Sparling and Caswell (2006).
17. The closing of the US border due to BSE in 2003 highlighted regulatory risk coming from other countries for a sector that is heavily dependent on exports, and when market integration exists without regulatory integration. The introduction of country of origin labelling in 2009 in the United States is an another example of export market risk from regulatory differences. Livestock producers and marketers, livestock processors, wholesaler and retailer all must incur extra segregation, recordkeeping and marketing cost to handle livestock and meat within the US marketing system. Given the dependence on trade this policy and policies like it create additional risks for the export based sector. These risks could be mitigated with more coordination of animal health and regulatory systems.
Policy Risks
18. Crop and livestock producers both face policy risks. Government policies are only imperfectly controllable or predictable by farmers, and can strongly influence the costs or returns from a farm operation. Supply management introduces quota as a cost and investing in quota is an investment whose return is contingent on the continuation of the program. Farmers may face more strict environmental regulations requiring investments or changes in business practices. While many programs are in place to reduce risk, once they are established their continuation or modification is another type of uncertainty that the farmer must account for in his decision-making.
Assessment about main risks and challenges
19. To summarize, according to Sparling (2010), price risk is the major risk that farmers face. In particular, as a significant net exporter, exchange rate and trade policy risks are an important part of price

TAD/CA/APM/WP(2010)29/FINAL
12
risk2. Weather risk tends to be less significant than price risk, but one can cause the other, like weather events affecting production quality rather than quantity. However, the Canadian farmers experience catastrophic weather events occasionally (such as droughts). Other risks such as interest rates, policy risks, animal health and bio-security or input costs can be less frequent but also impact farm returns, and many of them can manifest themselves as forms of price risk.
20. Risk goes beyond the simple variance in farm returns each year. Farmers with sufficient working capital can tolerate varying annual returns, and no farmer expects to earn the same amount from their farm operation each year. The risk of bankruptcy is perhaps more important in the minds of producers. This depends on the overall financial health of the farm operation and its ability to tolerate a number of negative shocks, perhaps in consecutive years.
21. The trend in Canada is towards larger farms with larger asset bases. Levels of farm debt continue to rise as farmers invest in land and equipment to take advantage of economies of scale. Farmers also use debt as a risk coping strategy. In tough times farmers may use the equity in their farms to support additional long term debt. This has been evident in the latest downturn in the hog markets. Although the debt to equity ratio has increased, it remains at manageable levels even for farms in the largest revenue classes (Table 1).
Table 1. Average key financial ratios for Canadian farms by gross revenue class
22. Total Canadian farm debt grew by 60.3% between 1998 and 2007, but instances of bankruptcy among farms have decreased (Table 2), although rates vary across provinces. Low bankruptcy rates may be explained in part by the ratio of assets to revenue. Many farms with unsustainable operations on an operating basis have sufficient assets to avoid bankruptcy and will ultimately be sold to other operators.
2. This does not apply to supply management commodities (dairy, poultry and eggs).

TAD/CA/APM/WP(2010)29/FINAL
13
Table 2. Farm Bankruptcies across Canada 1994-2008
1.3 Risk perceptions
23. When asked about the risks that have had a major financial impact on their farm, farmers report the following top four risks were identified: input costs, market prices, weather and currency (Table 3). Changes in government policies were not at the top of this ranking but were also reported as an important source of risk in AAFC (1998). Risk attitudes naturally vary with risk exposure and experience. For instance, prairie farmers are more likely to perceive weather and exchange rates as high risks; the first because they experience more losses due to drought and cold and the second because they are more heavily reliant on exports. The timing of the study in Table 3, in March of 2010, is one reason why input costs were at the top of the list as farmers have been through a two year period of high input costs. Canadian farmers tend to focus more on production than marketing and their approach and perception of risk reflects that tendency (Sparling 2010).

TAD/CA/APM/WP(2010)29/FINAL
14
Table 3. Perceived risk and impact of selected risks for Canadian farms
Source: The Strategic Council, Business Risk Management Survey For Performance Indicators, page 22.
24. Canadian farmers also have a very strong expectation that the government should bear at least part of the cost of agricultural risk. For instance AAFC (1998) reports that only 46% of farmers agree that risk management is its own responsibility. While most farmers use crop insurance, they expect the government to pay a significant portion of the premiums. Farmers are also likely to have a expectation that when things go seriously wrong the government will step in with assistance. Problems can range from prolonged market downturns, serious animal or plant health issues, rapid increases in input costs or decreases in market price or a significant shift in the market. The expectation of government assistance over the long term would be based in their past experience.
25. Anecdotal evidence shows that Canadian farmers have a very strong preference for crop insurance over other income support programs (Sparling 2010). They understand crop insurance programs and the risks covered, and can see direct relationships between their cropping experience and insurance payouts and premiums. Crop insurance also pays out quickly after harvest is complete. Most farmers don’t view margin-based programs like AgriStability as contributing to their risk management strategy.
Q7. In the last two years, which of the following risks has had a major financial impact on your farm operation? Base: All respondents (n=2100)
Risks and Impact on Farm Operations
8
43
51
79
84
85
95
93
%
557
Sask
Region
BCAlbManOntQueAtl
154474220355215125
%%%%%%
20
35
42
55
53
64
80
89
11
30
48
61
71
74
82
86
2
37
50
53
43
79
70
88
12
43
52
72
81
80
94
89
12
37
51
71
77
90
90
90
9Other
26Disease or pests
39Changing government policies and programs
58International competition
57Exchange rates or fluctuations
in the value of the Canadian dollar
64Weather
76Market prices of products sold
84Input costs 89
86
80
71
67
49
37
10
0% 20% 40% 60% 80% 100%
% Major financial impact on farm operation

TAD/CA/APM/WP(2010)29/FINAL
15
1.4. Quantitative assessment of agricultural risk
26. This section summarizes results about the different sources of variability affecting a sample of crop farms in Saskatchewan for the period 2003-083. The variability is measured at the individual farm level, but the sample and the results on “Canada” presented in this section need not to be representative of all farms in the province or in the country. Comparisons with other countries are made according to OECD (2010). Although wheat yield risk as measured by the coefficient of variation (CV) is one of the highest among the countries, price risk with CV of 0.5 on average dominates yield risk with CV of 0.34 (Figure 4). The Canadian sample of farmers faces higher price risk than in other countries.
Figure 4. Variability of wheat yield and price
(1) Average coefficient of variation of Yield (2) Average coefficient of variation of Price
0.00 0.10 0.20 0.30 0.40 0.50 0.60
United Kingdom
The Netherlands
Italy
Germany
Estonia
Australia
Canada
Spain
Farm level Aggregate
0.00 0.10 0.20 0.30 0.40 0.50 0.60 0.70
United Kingdom
The Netherlands
Italy
Germany
Estonia
Australia
Canada
Spain
Farm level Aggregate
27. In Canada most of the farms in the sample face negative correlation between price and yield for wheat, barley and oilseeds and, therefore, they benefit from natural hedging between prices and yields (Table 4). The average price-yield correlation for those farms is -0.38 for wheat, -0.57 for barley and -0.35 for canola.
Table 4. Proportion of farm facing negative price-yield correlation
Australia UK Italy Estonia Canada SpainWheat 72 75 45 32 55 36Barley 67 79 36 36 60 25Oilseed 60 65 n.a. n.a. 51 n.a.Oat 68 n.a. 42 33 n.a. n.a.
Negative price-yield correlation
28. Price risk is observed to be highly systemic; for wheat, the correlation across farms is above 90% (Figure 7). This effect may be accentuated by the fact that all the farms in the sample come from the same small area within a province, but the effect of price pooling under the CWB is significant. Yield risk is also relatively systemic with correlation across the farms in the sample that are higher than in the United Kingdom, Italy or Estonia, but lower than in the case of Spain and Australia.
3. Longitudinal CAS/AgriStability data for “Where Canada Delivers” was used in this analysis. The farms are
located in four Census Agricultural Regions in Saskatchewan with codes 3AN, 3AS, 3BN and 3BS. The analytical results should be interpreted with care because the sample data is extracted from a small region in Canada, whereas the samples in other countries are usually selected country wide.

TAD/CA/APM/WP(2010)29/FINAL
16
Figure 5. Correlation of wheat yield and price across farms
0 0.1 0.2 0.3 0.4 0.5 0.6 0.7 0.8 0.9 1
UK
Italy
Estonia
Australia
Canada
Spain
Yield Price
29. The relatively weak correlation of returns across crops makes diversification a viable strategy for reducing the variability of returns. The potential to reduce variability of returns through diversification is greater in Canada’s sample than in most other countries under analysis. Despite this, the net variability of revenue including diversification remains high (Table 5)4.
Table 5. Variability of revenue: monoculture and diversification
Coefficient of variation
Germany UK Estonia The Netherlands Australia Canada SpainWheat 0.20 0.31 0.42 0.64 0.47 0.69 0.48Barley 0.31 0.33 0.41 0.54 0.45 0.47
Return Oilseeds 0.31 0.33 0.46 0.47Rye 0.29 0.50Sugarbeet 0.16 0.27Oat 0.45 0.69
0.12 0.29 0.29 0.35 0.33 0.37 0.42With diversification
1.5. Information and communication
30. The federal, provincial and territorial governments share jurisdiction on agriculture. Individual provinces or territories undertake specific programmes and collect and disseminate information regarding their agricultural sectors. The Federal government undertakes a broad range of policies targeting the agriculture sector including significant data collection, research and information dissemination regarding weather, production, biotechnology, innovation, markets, prices, exports and other factors relevant to the sector. This is carried out through federal departments, provincial governments and subsidiary research organisations, crown corporations, and in partnership with private actors (Box 1).
4. Diversification takes often the form of crop rotation that is driven and constrained by agronomic
conditions. The variability indexes in this section and the model simulations in section 3 are not able to capture the specificities of these rotations.
TAD/CA/APM/WP(2010)29/FINAL
17
Box 1. Sources of information about agricultural risk in Canada
Statistics Canada (STATCAN) is the national data collection agency. Providing statistics is a federal responsibility. It produces census data, production data, industry sales data, summaries of farm financial results as well as significant general economic data and specific industry data beyond agriculture and food. CanSim databases are very detailed but charge user fees for access to the data unlike their USDA counterpart. (http://www.statcan.gc.ca/start-debut-eng.html)
Agriculture and Agri-Food Canada (AAFC) is the National agricultural ministry. It provides detailed market price and slaughter or sales data on a weekly basis for major commodities as well as input costs and some production ratios. Detailed animal contamination reports are produced. Reports on processing, value chain and farms exist but you must email to request them. Various branches cover various risk issues. Research Branch is prominent in assessing risk (detection and mitigation of threats to food production and distribution systems) and in providing qualitative scientific information on their websites on risks and R&D initiatives to mitigate some of them. (http://www.agr.gc.ca/index_e.php)
Provincial ministries, provincial agri-food ministries provide annual production data by crop, often to the county level. Many have weekly provincial sales and price data as well as management advice and programs. (http://www.agric.gov.ab.ca/app21/rtw/index.jsp, http://www.agriculture.gov.sk.ca/, http://www.omafra.gov.on.ca/)
Provincial crop insurance corporations provide crop and income insurance products to farmers. Premium rates, insurance coverage for key crops as well as current and historical crop planting and harvest information can be found. They gather little about actual risk experience but more about programs and payouts including ad hoc programs. (http://www.saskcropinsurance.com/, www.agricorp.com)
National and provincial commodity organizations: There are a multitude of farm organizations across the country. Some like the federations of agriculture are general while others are commodity specific. Vary depending on the board but they can provide pricing information, like the Ontario federation of agriculture (http://www.ofa.on.ca/) or the commodity organizations for grains and oilseeds (http://www.canola-council.org/ , http://www.cigi.ca/; etc)
Canadian Grains Commission is a federal agency that helps manage Canada’s grains and oilseed industry; it provides significant production, sales and export information, monthly quality data and information on testing technologies and industry issues. (http://www.grainscanada.gc.ca/index-eng.htm)
National Agroclimate Information Service (NAIS) provides maps, climate profiles, drought management information, provincial links and farm stress information through a number of indicators like precipitation averages, models to monitor and forecast drought and drought impacts. Services are fed in by a network of hydrometric stations, remote sensing tools, microwave imagery, NDVI imagery services and users. The outcomes are seasonal forecasts tailored to farming communities and technical indices (soil moisture, average precipitations and deviations, temperature abnormality, etc). They maintain a rather relevant "Drought watch" web site. (www.agr.gc.ca/pfra/drought/index_e.htm; www.climate.weatheroffice.gc.ca)
Environment Canada provides weather forecasts weather warnings, and radar imagery. These services help producers help producers plan and allocate their time more effectively. Storm warnings and frost can allow farmers to take action that will reduce the damage to machinery and livestock.. (http://www.ec.gc.ca/)
The Canadian Food Inspection Agency (CFIA) discloses the results of its investigation of food processing plants and corrective measures taken, develops and delivers programs and services designed to protect Canadians from preventable food safety hazards, to ensure that food safety emergencies are effectively managed, and that the public is aware of--and contributes to--food safety. Manages all aspects of food safety, disease outbreaks, management, recalls, disease payout programs. (www.inspection.gc.ca/)
The National Agriculture and Food Traceability System (NAFTS) is an industry led process to generate livestock and poultry identification and database to provide, in partnership with the government, timely, accurate and relevant information to enhance emergency management, market access, industry competitiveness and consumer confidence. It comprises cattle origin, birth date, breed, methods of production, movements and slaughter. (www.ats-sea.agr.gc.ca/trac/sys-eng.htm )
continued
TAD/CA/APM/WP(2010)29/FINAL
18
Farm Credit Canada (FCC) is a Crown corporation providing business and financial services to farms and agribusiness. It finances loans to producers and agribusiness in competition with banks. Provide decision making information like futures prices, market situation, weather, and financial calculators, as well as a programme for young farmers. Provider of land prices. (www.fcc-fac.ca/en/index.asp/)
ICE Futures Canada offers futures and options on contracts on canola and barley as well as trading and risk management services. Participants are required to deposit margins to cover the projected risks and ICE Canada maintains a credit facility to ensure immediate access to funds. (www.theice.com/futures_canada.jhtml)
Chicago Mercantile Exchange is a U.S. commodity exchange providing current and historical commodity prices and prices of futures contracts. (http://www.cmegroup.com/)
31. Several initiatives to improve risk awareness and farmers access to information on risks exist. A number of organizations are active in helping farmers better understand risks and providing information on production risks. First, the provincial crop insurance boards can provide information on crop losses and weather patterns. Organizations like the provincial Soil and Crop Improvement Associations are active in supporting research into new ways of improving production and decreasing environmental impact and risks and in disseminating that information to farmers. Marketing boards and sector associations often use meetings, bulletins and training sessions to inform their farmers about high priority risks and management strategies. These can include information in disease management, bio-security, animal or crop management or managing financial risks. The farm media, particularly media aimed at specific sectors, often include significant coverage of disease updates and disease management, production advice and management as well as financial and general business management. Individual commodity boards play a role on providing information about market and price risks, with initiatives that vary depending on the product and the commodity board or association.
32. Numerous provincial ministries and crop insurance crown corporations are involved in educating farmers about different risks. They hold workshops and training sessions inviting speakers from business, government and academia to help producers understand how their markets are changing. Farm Credit Canada is active in this area, supporting speakers at different events and organizing speaking tours that go into some of the smaller, infrequently served regions of the country. In some cases, further education may even be compulsory.
33. There are also numerous private initiatives. Private organizations like the George Morris Centre provide training in using futures markets and managing value chains helping farmers understand the risks and opportunities and developing strategies to mitigate the risks. The Richard Ivey School of Business offers Syngenta’s Grower U. week-long programs to help producers learn to manage their finances to reduce business risk.
34. With respect to environmental risk, pressures and responses vary depending on the region, industry and individual. For example, Quebec and Ontario have taken different approaches to environmental management, with Quebec taking a more prescriptive and directive approach, while Ontario has a more business-operations approach and pioneered the Environmental Farm Plan (EFP) program, which creates environmental action plans for farms (Monpetit, 1999). The EFP is now the foundation of environmental programs across Canada.

TAD/CA/APM/WP(2010)29/FINAL
19
2. Risk Management strategies and government policies
35. Although farmers are very active in managing risks through adopting specific production practices and financial management, the extensive coverage of risk by government programs reduces the space of normal risks that farmers manage on the farm (Table 6). Crop insurance is provided as a part of government program and private insurance options beyond hail insurance is limited. This chapter will analyze the strategies used by farmers and the government programs in place to manage risk. In fact, risk management is at the core of policy making in agriculture in Canada, so the scope of this analysis encompasses virtually all major government programs since the post-war period.
Table 6. Risk management strategies having special importance in Canada
Farm household and community
Market Government
Risk reduction
• Production practices?
• Prevention of diseases
• Price support in supply management commodities (dairy, poultry and eggs)
Risk mitigation
• Off-farm income?
• Financial management
• Sales through cooperatives, CWB, etc.
• Futures, mainly used downstream
• Control and compensation of contagious disease
• Countercyclical payments (AgriStability, ASRA)
Risk coping
• Saving and borrowing from banks
• Disaster aid (AgriRecovery)
• Ad hoc assistance
2.1. Agricultural Policy making in Canada
“The policy priority for Business Risk Management (BRM) programs is to help stabilize farm income. It is the view that agriculture faces many sources of risk (production, price, financial/business, market etc.) and that all of these sources of risk translate or manifest into farm income risk. Therefore, the goal of the suite of BRM programs is to help producers manage farm income risk”.—Questionnaire responses from AAFC.
36. Canadian governments have been actively involved in the agriculture sector since its earliest days as a country. Early agricultural policy was targeted at attracting farmers to the Prairies and helping them compete in international markets. Some of the earliest support policies provided subsidies for transporting grain from Prairie farms to ports and regulated grain transportation costs, which remained relatively fixed at 1897 prices until 1983. The Board of Grain Commissioners for Canada (currently Canadian Grain Commission or CGC) was established in 1912 to address the concerns over the extent of competition in the grain market. The Canadian Wheat Board was established to market the entire 1919 wheat crop in response to European control of grain markets following the World War I. During the Great Depression the Prairies Farm Assistance Act created a temporary farm insurance program for western farmers and a voluntary Canadian Wheat Board was created. World War II made production of food for Britain to support the war
• Public Insurance with subsidies (AgrInsurance)
• Subsidized saving accounts (AgrInvest / NISA)

TAD/CA/APM/WP(2010)29/FINAL
20
effort a primary goal. The CWB became compulsory as a wartime measure, partly to cap prices, and the transport of grain to central and eastern Canada was subsidized to increase livestock production. After the war, the Agricultural Products Board was created to manage and purchase agricultural surpluses.
37. Canada moved more into a state assistance policy paradigm in the 1950’s and 1960’s (Skogstad, 2008). Low prices for most commodities resulted in the first farm income support program, the Agricultural Stabilization Act of 1958, which guaranteed farmers 80% of the three year average price (later changed to five years) for grains and livestock commodities. The influence of the objectives and principles of this 50 years old policy can be seen in its successors set out nowadays. The dairy and poultry industries have always focused on national or regional markets in Canada, and by the 1960s the government was spending significant amounts supporting dairy farmers, particularly in Quebec and Ontario focused on support to resolve low farm incomes and price volatility. Pressure from farm groups resulted in the creation of provincial supply management boards for fluid milk first, and then extended at national level to industrial milk under the Canadian Dairy Commission (CDC), and to poultry and eggs, with the authority to control production and pricing. These industries were protected from world prices with import controls.
38. During the 1970’s and 1980’s the focus of policies in most OECD countries was on support for specific commodities and industries and an agricultural trade war was in full swing. The conclusion of the Uruguay Round Agreement on agriculture brought down the level of support from historic peaks. Whole farm programs which supported farm income and had lower influence in production decisions (more decoupled) have been the preferred approach in Canada since the WTO agreement in the early 1990’s. This rationale has led to a near-abandonment of commodity-based policies, with the exception of supply-managed commodities.
39. In the Canadian constitution, agriculture is a shared responsibility between the federal and provincial governments, and decisions concerning agricultural policy necessarily involve both levels of government. Intra-provincial marketing of agricultural products is a provincial responsibility, while inter-provincial marketing of the same goods is a federal responsibility. Negotiation under national frameworks ensures all parties cooperate, preventing criticism between federal and provincial governments and competition between provinces on policy. Sharing of costs among levels of government serves to increase the affordability of policies and further commits all parties to an agreed approach. Business-risk management has been the preferred policy approach in Canada because of its appeal both to producers and policy makers: it offers help only when there are “problems”.
40. In recent agricultural frameworks, emphasis is placed on the fact that this is business risk management — the income of the farm household is not part of the program design. This keeps the focus on assisting the farm enterprise to manage risk. Earlier programs had policy objectives articulated around the idea of income stabilisation, with issues of social equity between farmers and non-farmers having a more explicit role in policy formulation.
Business Risk Management focus in Canadian agricultural policy
41. Canada has had policies directed to farm income stabilization since the introduction of the Agriculture Stabilization Act (ASA) in 1958. That program marks the beginning of the modern area of farm policy, and since the inception of the ASA, there has always been at least one budgetary program of significant size and national scale directed at stabilizing the returns to farming in some way (Figure 6).

TAD/CA/APM/WP(2010)29/FINAL
21
Figure 6. Major budgetary income policies since 1958
1958 ASA
1960
1962
1964
1966
1968
1970
1972
1974
1976 WGSA
1978
1980
1982
1984
1986 NTSP
1988
1990GRIP NISA
1992
1994
1996
1998
2000
2002APF CAIS
2004
2006Growing Forward
2008
2009
2010
AIDA/ CFIP
AgriStability AgriInvestTiers 2
( "st abil izat io n" ) 3 ( "d isast er" )
& 4
42. The existence of this unitary path of program evolution does not mean that there were no other income stabilization programs over this period. Supply management, a system of price and production controls for milk, poultry and eggs has been in place since the 1960s, and supply managed commodities are usually limited from receiving benefits from other programs. Crop insurance has existed as a government program over this entire period, and has become a more integral part of the overall policy approach over time. A number of additional payment programs have been put in place on an ad-hoc basis, each usually lasting one or two years and addressing a particular concern of the day5. Several provincial programs have come and gone over this period as well. In terms of spending, a counter-cyclical pattern can be observed in the annual data, with years of poor harvest or prices bringing higher payment levels (Figure 7). The overall level of support is increasing over time, at least in nominal terms.
5. For example, in 1985 at the initiative of the Saskatchewan government, a CAD 1 billion additional payout
over two years was made to prairie grain farmers under the Special Canadian Grains Program.

TAD/CA/APM/WP(2010)29/FINAL
22
Figure 7. Annual payments under core stabilisation programs, 1979-2010
CAD millions
0 500 1 000 1 500 2 000
1979
1981
1983
1985
1987
1989
1991
1993
1995
1997
1999
2001
2003
2005
2007
2009
WGSA
NTSP
GRIP
NISA
CAIS
AIDA/CFIP
AgriStability
Source: OECD PSE/CSE Database, 2010.
43. It was the existence of provincial programs in competition with federal ones that led to the reform of the ASA, which became the Western Grain Stabilisation Act WGSA (Table 7). This was replaced by the National Tripartite Stabilisation Program (NTSP), which established federal-provincial cost-sharing of programs as an enduring precedent. Joint delivery of programs eliminated much of the program competition, inter-governmental criticism, and other disputes arising from having multiple governments delivering similar programs to the same clients. All the major income stabilisation programs after the NTSP have been cost-shared between the federal and provincial governments, and starting with the Net Income Stabilisation Account (NISA), a 60-40 federal-provincial cost sharing ratio has been used.
44. The Farm Income Protection Act (FIPA) of 1991 replaced WGSP, ASA and the Crop Insurance Act, and is the legal basis for the programmes that have been implemented since. The emphasis of FIPA on income stabilization institutionalizes this approach to agricultural policies in Canada. It also includes the concept of providing both economic and social support for Canadian farm families. The political process to develop new policies or policy frameworks takes the form of negotiations between the ministers of the federal government and the provinces, negotiations that are authorized and framed by Farm Income Protection Act. The Act allows for agreements on any of the following types of programs: (a) net income stabilization account; (b) a gross revenue insurance program; (c) a revenue insurance program; and (d) a crop insurance program. The first set of programs implemented under the FIPA included three of these types: (a) a savings account to support small income fluctuations called Net Income Stabilization Account (NISA); (b) a stabilization component for major revenue fluctuations, the Gross Revenue Insurance Program (GRIP); and (d) a crop insurance component (CI).

TAD/CA/APM/WP(2010)29/FINAL
23
Table 7. A summary of major income stabilisation programs since 1958
Program Years Coverage Funding source Payment based on Notes
ASA 1958-1975 crops and livestock Federal and Producers Price floor floor price equals 80% of average price in past 10 years
WGSA 1976-1991 crops and livestock Federal and Producers Price floorfloor price equals 90% of average price in past 5 years--adjustable for cost
NTSP 1986-1993 crops and livestock Fed/Prov/Producers guaranteed marginsupport price equals cost estimate times 95% of average margin in past five years
GRIP 1991-1995 crops Fed/Prov/Producers gross revenueTarget revenue per acre is based on historical yields, average price in last 5 years, and level of insurance coverage chosen
NISA 1994-2003 whole farm Fed/Prov/Producers revenue percentage of revenue paid into savings account
AIDA/CFIP 1998-2002 whole farm Federal and Provincial gross marginpayment triggerred when gross margin falls below 70% of olympic average
CAIS 2003-2006 whole farm Federal and Provincial net marginpayments depend on current vs. reference margin equal to 5-year olympic average
AgriStability 2007-present whole farm Federal and Provincial net marginpayments depend on current vs. reference margin equal to 5-year olympic average
ASRA 1986-present crops and livestock Provincial (QC) cost of productionpayment based on difference between market price and estimated cost of production
MRI 1996-2002 crops and livestock Provincial (ON) floor pricefloor price equals 85% of average price in past 15 years. One third of payment deducted as premium
45. A driving factor of the evolution of income support policies has been the need for WTO compliance and avoidance of trade countervail problems with the United States. This motivation drove the move away from commodity programs to the current “whole farm” approach, now well established as a policy principle in its own right. The AIDA program was the first to conform to the criteria for income safety net programmes in the WTO Agreement on Agriculture and the criteria inform the design of all subsequent policies.
46. The most recent policy frames took the form of five year agreements. The Agricultural Policy Framework (APF) was an attempt by the federal government and provinces to create a more integrated approach to agricultural policy after a time of growing number of programs at all levels of government. The programs went beyond simple funding to integrated and coordinated decisions on managing agricultural risk, food safety, innovation and the environment. The CAIS program formed the central risk management program and was based for the first time on net margins. But it was apparent as the APF was implemented that the program would be revised under the next policy framework. The most recent Growing Forward Agricultural Policy Framework has eliminated the provincial “companion” programs institutionalised when NISA was established and allowing provinces to supplement federal-provincial initiatives if desired. However several provinces continue to deliver programs with an income stabilisation objective on the top of the co-financed programs Agri-invest (a), Agri-stability (c) and Agri-insurance (d).
47. Another motivation for the series of policy reforms and new policies over this period has been the attempts on the part of the federal government to develop a core income stabilisation policy that would eliminate the need for the ad-hoc programs that have frequently been a part of the agricultural policy set in Canada. This led to the introduction of a “disaster” component in polices beginning with the Agricultural Income Disaster Assistance (AIDA) program in 1998, later integrated into the design of the Canadian Farm Income Program (CFIP), the Canadian Agricultural Income Stability (CAIS) program and the latest iterations called AgriStability and AgriRecovery.
48. The common thread that runs through all these programs is the stabilisation of some element with respect to some average. The ASA and WGSA were based on guaranteeing an average price, the Gross Revenue Insurance Program (GRIP) was based on average revenue per acre, and all programs after that have been based on some definition of production margin — an estimation of the difference between the cost of production and revenue earned from sales. An exception is the NISA program, which was a program of subsidised savings accounts intended to be drawn upon in years of low income. A consequence

TAD/CA/APM/WP(2010)29/FINAL
24
of the adoption of a whole-farm approach based on net margin is a significant increase in the technical complexity of calculating program payments. This complexity is felt both by the producer, who faces greater reporting requirements, but also by program delivery agencies, which now can require up to two years to calculate and deliver a payment. This loss of timeliness of program payments is a source of criticism on the part of program participants and works against the objectives of the program.
2.2. Farm level strategies to deal with normal risk
49. According to the results of a 1998 survey only 46% of the farmers strongly agreed with risk management being his own responsibility while 12% strongly disagree (Table 8). The percentage of disagreement is more than 20% for traditional and small operators. The questionnaire did not ask who else would be responsible, but given presumably government programs and payments are seen as playing a significant role.
Table 8. Risk management strategies in Canada
This table reports the percentage of respondents strongly agreeing / disagreeing with the statement
Source: AAFC, 1998. Paper based on a survey of farmers.
Role of diversification
50. In that same 1998 survey, 51% of farmers strongly agreed that producing different commodities that are marketed at different times of the year (diversification) is used to reduce and manage the risk in the farm. Diversification has proven to be an effective risk management strategy in Canada. Although data on diversified farm performance is not easily accessible, the current set of business risk management programs can be expected to crowd out diversification as a risk management strategy. As more diversified farms maintain more stable margins, they can expect a smaller amount of program payments. If specialisation provides higher average revenue with higher variance, current programs create incentives for this choice, by reducing the negative consequences of greater variability in returns.

TAD/CA/APM/WP(2010)29/FINAL
25
51. For many producers, this is seen as a question of fairness. Why should a farmer’s high returns in canola subsidise another farmers’ poor wheat production? Alternatively, why should a farmer’s neighbour who specialised in wheat receive a large payment in a bad year while another farmer who diversified responsibly receives nothing? In any case, the agricultural sector in Canada is taking advantage of economies of scale and specialisation to maintain profitability. Farmers who are well capitalised with good access to credit markets can specialise and use their capital as a buffer in bad years (while waiting for their AgriStability payment). While BRM programs likely support this trend to some degree, farmers’ ability to use on-farm risk coping tools also makes it likely that specialisation would be a growing feature of Canadian agriculture even absent BRM policy.
Investment and Innovation
52. Government-sponsored and private research and development related to crop varieties and production methods have reduced the sensitivity of yields to weather variation and disease, and have allowed producers to do field operations faster and under less favourable conditions. All of this leads to production that is less sensitive to events out of the control of the farmer and therefore subject to lower overall risk. But innovation is not a one-way pipeline from the researcher to the producer; ideally innovations occur in a situation where demands for improved means and methods are met with a supply of new ideas. This feedback between farmer and innovator leads to research that is more targeted to the needs of the farmer and that gain practical application and uptake as a result.
53. Farmers in Canada frequently experiment with new crops and methods of production in order to maximise the profitability of their farm enterprise and manage their risk. However, large-scale investments in new crop varieties, equipment, or chemicals are typically beyond their individual capacity. Government can enhance the industry’s investment in innovation through research and development efforts that can provide farmers better choices to manage risk at its root. Application of new technology that reduces the inherent variability of returns from agricultural production may be more cost effective than ex-post policy responses to risk.
Off-farm income
54. Many small-scale farming operations remain in Canada (Table 9). For the majority of Canadian farms, off-farm income is not a risk management strategy but a career choice. The following analysis uses Statistics Canada data from the Farm Financial Survey. Farms are divided first into gross revenue classes and then each revenue class is sub-divided into quartiles according to their net income. Even ignoring farms which sell less than CAD 10 000 per year, 50% of Canadian farms have revenue of less than CAD 100 000 per year. Half of those farms lost money in 2007 and the rest received very little in net income or in government payments (Figure 8). Those farms are sustained primarily by their off-farm income. Off farm income plays a role in larger farms as well, providing additional family income and helping to offset losses. Government payments are a significant factor for offsetting the losses of the bottom net income quartile but they are also significant contributors to the incomes of profitable farms.

TAD/CA/APM/WP(2010)29/FINAL
26
Table 9. Farm Breakdown by numbers and total revenue, 2007
Revenue class Number of farms
Percentage of farms
Percentage of farm revenue
CAD 10 000 to CAD 99 999 81 675 50.1% 7.7% CAD 100 000 to CAD 249 999 36 560 22.4% 13.5% CAD 250 000 to CAD 499 999 25 050 15.4% 20.2% CAD 500 000 to CAD 999 999 12 460 7.6% 19.4% CAD 1 000 000 to CAD 2 499 999 5 655 3.5% 19.0% CAD 2 500 000 and over 1 640 1.0% 20.2% Total 163 040 Source: Statistics Canada (2007), Farm Financial Survey 2007.
Figure 8. Canadian net farm income before government payments, payments and off-farm income
By revenue class and net income - 2007
Average Government payments

TAD/CA/APM/WP(2010)29/FINAL
27
Source : Statistics Canada (2007), Farm Financial Survey.
55. Jetté-Nantel et al. (2010) investigates the potential role of off-farm employment as a risk management tool among farm operators. A two-part model is applied to a longitudinal farm level data for about 20 000 Canadian farms from 2001 to 2006 in order to estimate the impact of farm income risk on the decision to participate in the off-farm labour market and the level of off-farm employment income. The variability of farm market revenue is found to be positively related with the likelihood of off-farm work and the level of off-farm employment income, in particular for operators of larger commercial farms. Hence, farmers' production decisions and their well-being appear to be conditioned on an income portfolio including a substantial amount of off-farm income. These authors criticize the policy focus on risk management and plead for rural policies that increase off-farm opportunities that could be used by farm operators and families to manage income risk6.
The role of banking and farm capital
56. Farmers make significant use of debt, first as a means of funding their operations, but also as part of their risk management strategy. Most farms maintain low debt/equity ratios and so have considerable unused debt capacity which they use during periods when low returns lead to cash-flow problems. The importance of access to debt financing during tough times is evidenced by the periodic use of loan guarantees by the government to support producer access to capital during difficult periods. An Advance Payments Program exists providing cash advances to producers of up to CAD 400 000 repayable over 18 months to help with seasonal liquidity issues. Farmers’ generally good access to debt for working capital helps farmers cover the period between a year of low returns and the eventual AgriStability payment it triggers.
57. Although Canadian banks are relatively cautious with risk they have provided significant financial support to the industry, in part because of the generally secure nature of Canadian farms and because of the security provided by agricultural land. Banks and other institutions provide both capital financing and working capital finance through lines of credit. Commercial banks are the most common source for working capital for Canadian farms with 60% of lenders’ share, followed by federal and provincial corporations with 30% (Agricultural Economic Statistics, 2008). Concerned about the difficulty in accessing capital for farmer, the federal government created a crown corporation with the sole purpose of funding farm mortgages in Canada through the Farm Credit Act.
58. During the 1980s, the crown corporation Farm Credit Corporation (FCC) was a stable lender in the agriculture market, particularly during a time when high interest rates and high land prices eventually drove down land values. In many cases, FCC took over land and leased it back to producers until they 6. Farmers in Canada are often involved in leasing, rental and custom work. These activities can be a source
of income and a way to manage risk.
Average Off-farm income

TAD/CA/APM/WP(2010)29/FINAL
28
could buy it back. FCC ran into financial difficulty and in the early 1990s the government refinanced the corporation and expanded its mandate to include financing businesses one step before and one step after farmers, supplying capital to suppliers of farm inputs and those using farm products. Today FCC is an integral part of Canadian farm finances: farmers represent 87% of its customer base, and FCC also services suppliers and processors, who represent 13% of its customers.. It has developed a strong service and education component to its relationship with farmers. FCC currently holds 27% of all farm debt and 43.5% of farm mortgages. FCC provides a valuable financing option for farmers since agriculture is FCC’s only business. They cannot spread their own risk between sectors and so must focus on successful agricultural lending. The arrears rate on their portfolio is approximately 0.22%, providing an indication of the stability of the sector.
2.3. Government measures dealing with normal risk
Taxes and social security
59. There are several provisions in the Canadian tax code that is particular to agriculture, some which can help farmers smooth their incomes and manage risk, even if not integrated into BRM policy. Most exist due to longstanding approaches to reconcile variability of farm business income with the progressive tax system and to make allowances for farmers who may have poor accounting skills. All payments are taxable in the year in which they are made. Tax files are the main basis on which agri-stability payments are made. There are several tax provisions that apply to agriculture.
60. The main provision is the cash based accounting. Canadian farmers and fisherman have the option to operate on either a cash or an accrual based accounting system; other businesses must use accrual techniques. Most farm businesses choose a cash-based system because it allows them to manage their cash flow in a way that minimizes their tax obligations in a system with progressive tax rates. For example, in a high revenue year a farmer may purchase inventory or pre-pay expenses, thereby reducing income on a cash basis. The farmer may carry that extra inventory to a lower revenue year before drawing it down. Although cash based accounting can reduce risk if managed properly, it can also increase risk if it is used aggressively as a tax avoidance strategy. It can lead to unnecessary purchases of equipment or high inventory levels with associated carrying costs.
61. Farmers benefit from the possibility of Tax offsetting. That is, negative income in one year may be used to offset tax obligations in the prior three years or up to twenty years in the future. Additionally, livestock producers can defer some tax obligations: to prevent tax obligations from having an impact on farm cash flow, tax from income from sales of livestock does not need to be paid until the herd is replenished.
62. The Registered Retirement Savings Plans (RRSP) are available to the self employed. Farmers who are self employed lack a pension plan beyond the basic Canada Pension Plan. As a result they are allowed to contribute up to 20% of their income into an RRSP. Contributions are tax deductible and minimize tax liabilities during good years. Withdrawals from an RRSP are counted as taxable income in the year of the withdrawal. Although intended as a means of saving for retirement, RRSP’s can also be used as a risk coping mechanism and Statistics Canada estimated in 2000 that 34% of Canadian farmers used RRSP’s. Finally, the Tax Free Savings Accounts (TFSA) is a recent general tax innovation to encourage savings that may also be used as a risk management tool.
Government supported savings accounts for farmers: from NISA to AgriInvest
63. In 1990 NISA established special savings accounts where producers may make deposits and receive a matching contribution from the government. Producer deposits were also paid a three percent

TAD/CA/APM/WP(2010)29/FINAL
29
interest premium over prevailing market rates. Initially, producers were allowed to contribute 2% of eligible net sales (gross sales minus purchases of seed, feed, livestock etc.), up to a maximum of CAD 250 000 in net sales7. The total balance of the NISA account could not exceed 150% of the average eligible net sales of the past five years, and withdrawals were obligatory once the balance reached 100% of eligible net sales8. Initially, the accounts were held in the Canadian Consolidated Revenue Fund, but later were allowed to be in a commercial bank or credit union. The contribution cap was eventually raised to 3%, and many provinces put in place companion programs called NISA enhancements that provided for contributions of an additional one or two percent of eligible net sales. In Ontario, for example, multiple top-ups allowed horticulture producers to contribute 7% of sales to their NISA account and receive a matching contribution from government. Companion programs were also cost-shared under the terms of the federal-provincial agreement establishing NISA. Producers could make withdrawals from their NISA account under two conditions, called triggers. The first trigger was if farm income fell below 70% of the previous five-year average. Under this trigger, farmers would be allowed to withdraw from their NISA account enough to increase their income to 70% of the five-year average amount. The second trigger was if the farmer’s net farm income fell below CAD 10 000, or CAD 20 000 for farmers with dependants (this was later increased to CAD 20 000 and CAD 35 000 respectively). While NISA was originally conceived to work with GRIP, it eventually came to be seen as the main income stabilisation program for the sector.
64. NISA was subject to criticism on a number of fronts. Farmers did not like having so much of their capital tied up in the program, as this could cause problems for working capital and cash flow. From the government perspective, the large balances held in NISA accounts (around CAD 4 Billion at the peak of the program) demonstrated that farmers were not using the accounts to stabilise income and eroded the policy rationale for continuing support for the sector as farmers were in possession of large amounts of liquid capital. These factors led to NISA being replaced and embedded — with some changes — in the Canadian Agricultural Income Stabilisation (CAIS) program. The main difference with NISA was the matching government contribution to the account under CAIS was not made at the time of deposit, but when funds were withdrawn. This was intended to address the accumulation of large account balances as was the case for NISA.
65. Despite the operational problems with the program, the idea of a producer-directed savings program remained attractive to policy makers and in the Growing Forward framework the AgriInvest, a program very similar to NISA, was established. AgriInvest replaces the “top tier” of support under CAIS for small income losses with a NISA-style savings account but with higher withdrawal flexibility. It is intended to be used for fluctuations between 85% and 100% of reference margin and to support on-farm investment. Producers may contribute 1.5% of their eligible net sales to their AgriInvest account and have their contribution matched by the government. Unlike NISA, there are no triggers required for producers to access their funds. It is hoped that this additional flexibility will prevent the accounts from continually growing as they did under NISA.
Government payments countercyclical with whole farm margins: AIDA / CAIS / Agri-Stability
66. GRIP was intended to complement NISA by protecting against the negative effects of yield or price shortfalls. But these commodity-specific payments were eliminated after the WTO agreements, leaving NISA as the main support program in Canada. However, NISA was seen as inadequate by itself in covering more extreme events where income losses are large or take place over multiple years. In this case,
7. Farmers could contribute an additional 20% of sales, but this would not be matched by government
contributions. It would however receive the 3% interest bonus. This right if not exercised could be carried forward for up to five years.
8. Once the balance reached 100% of sales, farmers could decline a withdrawal only once every five years.

TAD/CA/APM/WP(2010)29/FINAL
30
the amounts available in NISA may be insufficient to cover the loss and, in any case farmers resisted using NISA accounts for stabilisation, preferring to receive government payments instead.
67. In 1998, the federal government introduced the Agricultural Income Disaster Assistance (AIDA) program as a response to low grain and livestock producer incomes. The program was intended to be temporary and designed around WTO rules regarding disaster assistance (Box 2). The program was criticised because producers found participation onerous and confusing, payments would decline when producers had several bad years in their reference margin and the fact that diversified farms received much lower payouts. All of these criticisms have been directed at the current program, AgriStability. AIDA was replaced by a very similar program CFIP in 2001.
68. In 2003, the Canadian Agricultural Income Stabilisation (CAIS) program replaced both NISA and CFIP. In its initial design, CAIS preserved the major elements of NISA and CFIP, while trying to respond to criticisms. Producers were required to chose a level of margin coverage and make a deposit equal to one-third of 22% of the margin covered into a savings account. CAIS made payments essentially according to the AIDA/CFIP formula, but included higher “tiers” of coverage where producers could make withdrawals from their accounts and receive matching contributions from the government. About 60% of farmers participated in CAIS, covering 70% of farm revenue. The savings account model came under pressure immediately as farmer organisations protested the idea that they would have to deposit their own money into what was seen as a support program. The deposit requirement was replaced the following year with a participation fee. Another important change made in 2003 was the inclusion of “negative margins” for which coverage was previously for the amount between the reference margin and zero, truncating payments once farms made losses.
69. The Growing Forward framework is an evolution from the Agricultural Policy Framework, and AgriStability, the successor of CAIS remains the centre of risk management strategy. The AgriInvest program has taken over the role of protecting against smaller margin declines, leaving AgriStability to compensate for more serious declines below 85% of the producer reference margin. The participation fee is now CAD 3.80/CAD 1 000 of reference margin. Schaufele et al. (2010) estimate that a cow calf producer would get on average CAD 12 for each dollar spent in the participation fee. There are different “layers” (called “tiers” in CAIS) having a different proportion of coverage between the producer and the government, with the producer share essentially acting as a deductable (Figure 9). The program has two main components: a “stabilization” tier 2 for declines in margins between 15% and 30%, and a “disaster” tier 3 for declines beyond 30%, with special provisions for negative margins. The different producer shares in each layer are designed with WTO rules in mind — total government contributions cannot exceed 70% of the reference margin.
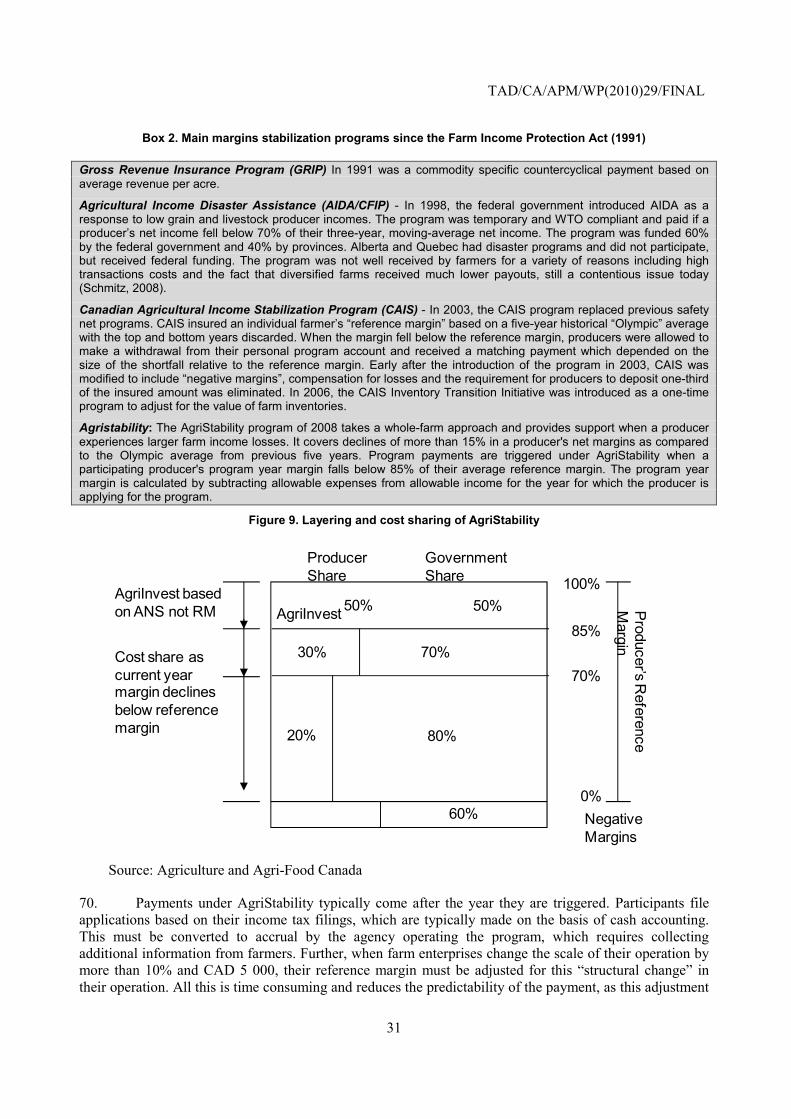
TAD/CA/APM/WP(2010)29/FINAL
31
Box 2. Main margins stabilization programs since the Farm Income Protection Act (1991)
Gross Revenue Insurance Program (GRIP) In 1991 was a commodity specific countercyclical payment based on average revenue per acre.
Agricultural Income Disaster Assistance (AIDA/CFIP) - In 1998, the federal government introduced AIDA as a response to low grain and livestock producer incomes. The program was temporary and WTO compliant and paid if a producer’s net income fell below 70% of their three-year, moving-average net income. The program was funded 60% by the federal government and 40% by provinces. Alberta and Quebec had disaster programs and did not participate, but received federal funding. The program was not well received by farmers for a variety of reasons including high transactions costs and the fact that diversified farms received much lower payouts, still a contentious issue today (Schmitz, 2008).
Canadian Agricultural Income Stabilization Program (CAIS) - In 2003, the CAIS program replaced previous safety net programs. CAIS insured an individual farmer’s “reference margin” based on a five-year historical “Olympic” average with the top and bottom years discarded. When the margin fell below the reference margin, producers were allowed to make a withdrawal from their personal program account and received a matching payment which depended on the size of the shortfall relative to the reference margin. Early after the introduction of the program in 2003, CAIS was modified to include “negative margins”, compensation for losses and the requirement for producers to deposit one-third of the insured amount was eliminated. In 2006, the CAIS Inventory Transition Initiative was introduced as a one-time program to adjust for the value of farm inventories.
Agristability: The AgriStability program of 2008 takes a whole-farm approach and provides support when a producer experiences larger farm income losses. It covers declines of more than 15% in a producer's net margins as compared to the Olympic average from previous five years. Program payments are triggered under AgriStability when a participating producer's program year margin falls below 85% of their average reference margin. The program year margin is calculated by subtracting allowable expenses from allowable income for the year for which the producer is applying for the program.
Figure 9. Layering and cost sharing of AgriStability
Cost share as current year margin declines below reference margin
ProducerShare
GovernmentShare 100%
85%
70%
0%
AgriInvest
30% 70%
20% 80%
Producer’s R
eference M
argin
60% Negative Margins
50% 50%AgriInvest based on ANS not RM
Source: Agriculture and Agri-Food Canada
70. Payments under AgriStability typically come after the year they are triggered. Participants file applications based on their income tax filings, which are typically made on the basis of cash accounting. This must be converted to accrual by the agency operating the program, which requires collecting additional information from farmers. Further, when farm enterprises change the scale of their operation by more than 10% and CAD 5 000, their reference margin must be adjusted for this “structural change” in their operation. All this is time consuming and reduces the predictability of the payment, as this adjustment

TAD/CA/APM/WP(2010)29/FINAL
32
is done internally by the government agency. All of these factors can delay a payment by two years or more. A lengthy delay in payments is not a helpful characteristic for a program that intends to stabilise farm returns, in particular in the case of significant crises or “disasters”. Delayed payments are not able to help with cash-flow issues that may arise from a bad year, and may arrive when income is in an upswing, thereby being in effect procyclical in their impact while countercyclical in calculation. Delays in and uncertainty of payments have been cited as a weak spot in review of AIDA, CFIP, CAIS, and now AgriStability, in particular in the report from the Auditor General of Canada (2007).
71. The delay and uncertainty connected to AgriStability payments is what makes AgriInsurance (crop insurance) an important part of the overall policy framework. As a risk-management program, AgriStability is better targeted than is AgriInsurance to the whole-farm margin — the net outcome for the enterprise — and not simply yields, which are only a part of the overall risk problem. Since AgriStablility payments would take into account the effects of yield on margin, AgriInsurance is in principle redundant to it, at least for the crops covered by the latter. In practice, however, it serves to provide a timely and predictable payment to producers facing a negative shock on production. That payment counts as revenue in the calculation of the enterprise’s margin, and so is essentially deducted from the eventual AgriStability payment.
Advance Payments Program (APP), Interim Payments and Targeted Advance Payments (TAP)
72. The Advance Payments Program (APP) is a financial loan guarantee program that gives producers easier access to credit through cash advances. It aims to facilitate the orderly marketing of crops and livestock by improving the marketing opportunities available to eligible producers by guaranteeing the repayment of cash advances made to producer as a means of improving cash flow. It allows producers to spread out the marketing of their production throughout the year when market conditions and prices may be more favourable. The cash advance cannot exceed 50% of the average market price estimated by AAFC and has a limit of CAD 400 000, with the first 100 000 being interest free. Loans have to be repaid in 18 months. The Interim Payments program makes available an early AgriStability program payment for producers in severe economic hardship. Eligible participants may request an Interim of their anticipated program payment. Interim shall not be greater than 75% of the total estimated AgriStability payment. The Targeted Advance Payments (TAP) program allows delivery agents to proactively offer advances to producers negatively affected by events in a region. Estimated payments are based on farmer´s production and industry average losses.
Quebec’s ASRA
73. In 1968 Quebec undertook a study that found that net rural incomes were roughly 40% of urban incomes. In 1976, they created the Assurance Stabilisation des Revenus Agricoles (ASRA) program to address the income gap by ensuring farmers receive a return on labour equivalent to the wage of a specialized urban worker. This remains the guiding principle of the program. Payments for each commodity under ASRA are based on the cost of production for a specialized farm type, as estimated by the government agency every five years using a representative sample. For each covered commodity the difference between the market price and the estimated cost, including the equivalent wage rate, is provided to participants as a payment. The program is intended to operate as insurance, requiring a premium for coverage of which the farmer pays one third and the provincial government the rest. Once the farmer is enrolled in the program, it works as a countercyclical payment for each of the enrolled commodities; the payment is triggered by market prices being below a “cost-reference” price and it is paid per hectare times a reference yield or per insured unit.
74. ASRA is a provincial program with its own trigger mechanisms that are based on individual commodity prices, in contrast to those of AgriStability. As a way to avoid double payment for revenue

TAD/CA/APM/WP(2010)29/FINAL
33
declines, AgriStability payments are deducted from ASRA payments. ASRA thus operates something like an advance payment for AgriStability but the more generous ASRA payment formula makes AgriStability payments inframarginal. Because of ASRA payments for ASRA commodities, AgriStability is in many cases inoperative in Quebec except as a subsidy to the ASRA program. The provincial government bears the additional program cost, which can be considerable. In the past, deficits in the insurance fund were tolerated and a deficit of nearly CAD 900 million had been accumulated to 2009 (Figure 10). This was due to a great extent to recent large multi-year losses that occurred in the hog sector. The provincial government was obliged to refinance the program to cover this deficit, and now requires that the premium should be determined on an actuarially-fair basis such that government pays for the premium subsidy only (at a cost of approximately CAD 600 million per year). The ongoing cost of the program in addition to the cost of covering the fund deficit has led to some reforms of the program to try to control costs. For example, cost of production will be more weighted towards efficient farms and not simply of specialized farm type. Larger operations will bear a higher share of the premium costs, and individual caps on program payments will be put in place.
75. The potential for deficits, however, in a program like ASRA is a structural problem. While AgriStability payments will adjust downward as long term margin declines become reflected in the reference margin, ASRA ensures that incomes of farmers in Quebec will remain stable, regardless of the size or length of the market downturn9. This places considerable cost risk on the program obligations and a payment cap has been introduced to control the total cost of the program. Actuarial principles seem difficult to apply to calculate a “fair premium” under these circumstances.
Figure 10. ASRA Fund deficit
-1000,000
-900,000
-800,000
-700,000
-600,000
-500,000
-400,000
-300,000
-200,000
-100,000
,0
CAD
mill
ion
Source: La Financière Agricole du Québec.
9. It can also conflict with the objectives of other programs. For example, the objective of the recent Cull Hog
Program was to decrease the Canadian hog herd. As farmers in other parts of Canada reduced their herds, the percentage reduction in Quebec was lower.

TAD/CA/APM/WP(2010)29/FINAL
34
Ontario’s Risk Management Program
76. This program could be considered as a follow-on to the Market Revenue Insurance (MRI) program that was an Ontario companion program originally connected with GRIP. Current policy framework agreements did away with companion programming (where provinces had a cost-shared envelope to establish provincial programs related to major federal-provincial programs), so this program was put in place on a pilot basis in 2007 as a provincial-only program. The original MRI program provided support based on a target price of 85% of the 15-year average, but the current program is based on a cost of production approach similar to ASRA in Quebec. It shares the same rationale as ASRA—to avoid the reduced support following long-term price declines that is a central element of AgriStability. The cost of production formula used in the Risk Management Program is based on an estimated cost of production for the top 70% of producers and includes an imputed labour cost for the farmer. It is designed as a price insurance program with different coverage levels and premiums paid 40% by farmers and 60% by the province. In the initial three years of the program, producers paid more in premiums than they received in benefits, due to the recovery of world grain prices. The program has been extended for 2010, but the future of the program is uncertain without a federal-provincial cost-sharing agreement.
2.4. Specific commodity arrangements led by government policies or agencies
Supply management commodities
77. The dairy, egg, chicken and turkey industries in Canada operate under national supply management systems. These systems are controlled by national bodies and by provincial commodity marketing boards that have been given statutory powers by federal and provincial governments. The national systems are similar in many ways. The amount of each commodity that is marketed by producers is controlled through a quota system. The volume of the commodities imported into Canada is limited by tariff rate quotas, with very high tariffs imports above a specific quota level. Quota and import restrictions control supply, but the policy target is the domestic price. The domestic price for these commodities is set according to a cost-of-production formula intended to guarantee a return to producers of these commodities. The quota is set to ensure that supply equals demand at that price, and is frequently adjusted to ensure domestic market balance. Producers of these commodities are obliged to participate in the supply management system and their production is subject to individual quota limits and can only be sold into the marketing system.
78. The dairy system is divided into a nationally-managed system for industrial milk (used to make dairy products such as cheese, butter, etc.), and provincial-level systems for the marketing of fresh milk. The Canadian Milk Supply Management Committee (CMSMC) oversees the national system for industrial milk. It is chaired by the Canadian Dairy Commission (CDC), a federal Crown Agency that provides a framework for federal-provincial participation. CMSMC determines the national domestic supply of industrial milk and allocates this volume among provinces. Other commodities have national production levels set by national agencies who distribute this quota among provinces.
79. Since quotas are tradable within provinces (but not between provinces), the market price of the quota will reflect the value of the program, that is, the excess of price above costs or economic rents derived from the price-setting and production quota system. The price is determined according to a cost of production formula, but this appears to be only imperfectly capturing productivity increases in the sector, as the value of a quota allocation has increased nearly continuously since the inception of the program, including in recent years (Figure 11). The estimated cost of production (and therefore the domestic price) of supply managed commodities has trended gradually upward over time reflecting inflation in input costs. It is likely however that technological advances have led to productivity gains that reduce the unit cost of

TAD/CA/APM/WP(2010)29/FINAL
35
production over time. Any productivity gains not reflected in the cost of production estimate will ultimately be capitalised in the value of the quota.
Figure 11. Quota Value in Manitoba, 2004-2010
15 000
17 000
19 000
21 000
23 000
25 000
27 000
29 000
31 000
33 000
Jan-
04
May
-04
Sep-
04
Jan-
05
May
-05
Sep-
05
Jan-
06
May
-06
Sep-
06
Jan-
07
May
-07
Sep-
07
Jan-
08
May
-08
Sep-
08
Jan-
09
May
-09
Sep-
09
Jan-
10
May
-10
Manitoba- MSQ value $/kgbf/day
Source: Canadian Dairy Information Center.
80. The poultry (chicken and turkey) and eggs sectors in Canada are subject to supply management regulations and policies. The Farm Product Council of Canada (FPCC) (http://fpcc-cpac.gc.ca/) oversees the national supply management agencies for poultry and eggs to ensure an efficient system that works in the balanced interest of stakeholders, from producers to consumers. The FPCC was created in 1972 by the adoption of the Farm Products Marketing Agencies Act. This legislation also provided the legal foundation for the following national marketing agencies: Canadian Hatching Egg Producers (CHEP), Egg Farmers of Canada (EFC), Turkey Farmers of Canada (TFC), Chicken Farmers of Canada (CFC). These national marketing agencies are run by their respective boards mostly composed of representatives from provincial commodity boards with few representatives from processors and consumer associations. On a regular basis, the provincial commodity boards consult with their stakeholders to determine their poultry and eggs needs. Then they set a Canadian production level and the agencies implement the quota order upon the FPCC’s approval. Then the provincial boards allot the quota to registered producers. Provincial commodity boards negotiate their selling price with the processors. National marketing agencies pay their own way through levies paid by registered chicken producers. For eggs, a levy is imposed on table egg retail sales to finance the breaker eggs which are sold at a competitive price on the North American market.
81. Supply management systems were put in place in response to high levels of price volatility that have their root in the inelastic supply and demand of certain agricultural commodities. Particularly volatile were dairy markets, milk being perishable and costly to transport as well as having seasonal production swings. The supply management system was very effective at reducing price risk, yielding stable prices for these commodities since the system’s inception in the late 1960s. However, using a cost-of-production formula as the basis of the program has made it more important as an income-support system than as a risk-management system (this is arguably true for ASRA as well). This leads to certain negative consequences stemming from the lack of market-orientation of these sectors. Moreover, the value of the program becomes capitalised in the quota value, so it is quota holders who benefit more than producers. For example, a new entrant must pay the net present value of the program in advance when they buy quota, giving the economic rents from his operation to the seller of the quota. This increases the capital requirements for producers in these sectors.

TAD/CA/APM/WP(2010)29/FINAL
36
82. Supply managed commodities are covered under AgriStability only when the farm’s income decline falls into Tier 3. If farm production includes supply managed commodities, and farm income decline falls into Tier 2 only, payment will be adjusted to ensure the program is not providing income stabilization for the portion of the farm that is supply managed. This adjustment will not be applied if Program Year Margin declines into Tier 3. For farms producing only supply managed commodities in the Program Year, if Program Year margin declines into Tier 2 only, your AgriStability payment will be reduced by the percentage of your allowable income historically derived from supply-managed commodities in the reference years and subject to structural change adjustments.
Crops under the Canadian Wheat Board
83. Grain farmers in the western provinces (Alberta, Saskatchewan, Manitoba) who produce wheat or barley for export or human consumption must market their product through the Canadian Wheat Board (CWB). The CWB provides a number of ways for producers to reduce their price risk. Most producers (currently around 85%) choose the price pooling option. Farmers receive a partial initial payment shortly after they deliver grain to the elevator and ultimately receive the average price that the product was marketed through the year once the marketing year is over. Farmers have the option of selling all or part of their crop at a fixed price, locking in a non-pooled price or they can lock in the futures component and the basis (at different times if they wish). The CWB acts as the intermediary for locking in basis or futures prices making this option accessible to all producers. Normally about 15% of farmers choose this option, although the percentage moved up when grain prices peaked in 2008 and more farmers elected to lock in higher prices.
84. Commodities under the CWB are also under the Canadian Grain Commission (CGC) that regulates all aspects of grain handling in Canada through a grain quality and quantity assurance program. Although not common, a number of boards in grape and processing vegetables set prices for an entire season or longer, reducing variability of returns to a great extent.
2.5. Public crop insurance
Agri-Insurance and precedents
85. Traditionally, insurance is a provincial responsibility. As a result, crop insurance is delivered through provincial government agencies who act as the insurer. The Farm Income Protection Act provides the authority for AgriInsurance, which is a national BRM program. The Government of Canada approves provincial programs proposals, develops national standards (f.i. on maximum coverage or insurance methodologies), contributes to premiums subsidies and provides a deficit financial mechanism (reinsurance) in which only five of the provinces have decided to participate (Alberta, Saskatchewan, Manitoba, New Brunswick and Nova Scotia). Provincial governments pay the rest of the premium subsidy, design and promote insurance plans, underwritten AgrInsurance policies, determine the premium rates, collect the farmers’ contribution to premiums, adjust and verify crop losses and bear the responsibility of deficits. These agencies are either branches of the provincial departments of agriculture (British Columbia), crown corporations that provide several government programs and services (Alberta, Manitoba, Ontario and Québec) or crown corporations specialized in agricultural insurance (Saskatchewan).
86. For hail insurance and area or index based insurance (f.i. Corn Heat Unit Insurance) farmers pay the full premium and federal and provincial governments pay the administration costs. However out of those insurance lines, only hail insurance is quantitatively significant. For crop insurance, the Federal government provides a share of the premiums and administrative costs and negotiates national standards with provinces as part of the federal-provincial agreements that underpin this cost-sharing arrangement.

TAD/CA/APM/WP(2010)29/FINAL
37
Within those national standards, provinces have flexibility to determine how crop insurance programs operate and how premiums and payments are determined.
87. Crop insurance programs have been a part of agricultural policy since it was established under the Canadian Crop Insurance Act in 1957. Crop insurance in Canada has always been a government program with no involvement of specialized private insurers and it is managed like a program of payments to farmers rather than as an insurance business, even if farmers have to contribute with part of the premium. Governments and their agencies have continually refined policies to increase commodity coverage, better tailor premiums to individual producers, and increase the share of the premia paid by the government. These actions have led to increasing producer participation. In particular, program expenditures since 2000 have been high relative to historical levels (Figure 12). Premiums are calculated on actuarial basis, typically calculated for specific risk areas inside each province and adjusted to individual loss history with surcharges or discounts up to 38% of the premiums.
88. Provincial agencies have now a valuable dataset of farmers with their individual history of risks and indemnities. There is no provision or arrangement to share these databases with other province agencies or private companies. Under these conditions, public crop insurance may displace any potential private insurance, as the subsidised premiums make private options uncompetitive where public analogues could exist. No private insurers or other institutions are currently involved in the delivery of multi-peril production insurance in Canada. However, there are a number of private companies in Canada that offer spot-loss hail and fire insurance for crops, protection for greenhouse crops, and, to a lesser extent, livestock mortality insurance. Private insurance companies provide some reinsurance protection to provincial AgriInsurance administrations.
Figure 12. Crop Insurance Indemnities, 1979-2009
CAD millions
0
200
400
600
800
1 000
1 200
1 400 Wheat Rapeseed All Crops
Source : OECD PSE/CSE Database, 2010.
89. Crop insurance covers yield reductions due to specific perils such as drought, flood, hail, frost, excessive moisture, and diseases. This protection can include commodity specific and basket of crops losses, livestock production losses, compensation at market or replacement values, quality losses, unseeded acreage, reseeding and plant (asset) loss and wildlife compensation. Participants select a commodity and coverage level (usually 70-90% of projected yield) and must insure all their production of that commodity. That is, they may not insure specific fields while excluding others from insurance. The premium is set based on the commodity, the location of the farm, and a bonus/malus adjustment based on the farmer’s history of claims. Payments are based on average yield of the commodity for that farm, not on a plot-by-plot basis. The insured price is based on a projected or historical average of prices, costs of production or replacement values. To calculate the payment amount (indemnity) the basic formula is:
• Indemnity = (Projected Yield x Coverage Level x Acres Insured – Actual production) x Insured Price

TAD/CA/APM/WP(2010)29/FINAL
38
90. The rate of participation has always been an important consideration in the design of crop insurance programs. Payments (insurance indemnities) are provided very quickly after a loss is realised, while AgriStabiltiy payments can take up to two years to arrive after a loss is realised. It then thought that high levels of crop insurance participation can reduce pressure for ad hoc disaster programs. AgriInsurance covers most commercially grown crops. Close to 90% of the value of all crops grown in Canada are insurable. Approximately 70% of crop acres are insured and about 55% of Canadian farmers are insured. But participation rates vary by province, with the greatest participation by producers in the prairie provinces, particularly Saskatchewan. During 2009-10, over 81 000 producers across Canada insured about 64 million acres of crops, purchasing approximately CAD 11.9 billion of insurance protection. For a three-year period, from 2006-07 to 2008-09, provincial indemnity payments to producers totalled CAD 1.7 billion while premiums collected from all parties during this same period totalled CAD 3 billion.
91. The main vehicle by which the government can control participation rates is the extent to which the premium is subsidised. Under the program, producers pay about 40% of total premiums while the federal and provincial governments contribute the remaining premium and pay 100% of the administrative cost-shared on a 60/40 basis, respectively (Figure 13)10. Premiums are established in accordance with actuarial principles to cover long term program payments to producers.
Figure 13. Cost-sharing arrangements for crop insurance
Per cent
Basic multi-peril
Catastrophic production
high-cost production
Administrative costs
FederalProvincialProducer
FederalProvincial
FederalProducer
Provincial
Provincial
Federal
40% 60%
60%40%
Source : AAFC.
92. Crop insurance has a catastrophic loss coverage that could be subscribed for certain crops that follow specified rules, extending indemnities to those agricultural products that experience very infrequent losses with a higher subsidy rate. The recurrence of that risk should be at the 93 percentile to be categorized as catastrophic. To limit the maximum eligible amount for catastrophic loss, the total premium
10. Catastrophic loss coverage is fully subsidized on the same 60/40 basis, with no portion of the premium
being paid by the farmer.

TAD/CA/APM/WP(2010)29/FINAL
39
for catastrophic loss cannot exceed 1% of the provincial previous year‘s liability. Provinces determined the commodities for which they wish to implement the catastrophic insurance plan. According to the Growing Forward Agreement the coverage and costs should be based on an actuarial assessment.
93. AgriInsurance is linked to other BRM programs to ensure that the suite works together. AgriInsurance protects against production losses that may lead to margin declines covered by AgriStability; producers are encouraged to participate in both programs that need to be closely linked. A Premium Adjustment has been developed to ensure that producers are not disadvantaged in AgriStability by participating in AgriInsurance. If a producer's AgriStability payment is lower because of their participation in AgriInsurance, he or she may receive a Premium Adjustment cheque implying a higher compensation of the loss. AgriStability negative margin payments may be reduced for losses that could have been covered under AgriInsurance and farmers have not covered. AgriInsurance payments are included as allowable income in your reference margin calculations for AgriStability, but AgriStability payments are not included as allowable income. Unlike AgriStability, AgriInsurance losses are determined on a crop specific basis. For advances made in spring, producers must participate in a business risk management program such as AgriInsurance in order to qualify for a cash advance under the Advance Payments Program. For advances made in the fall, participation in a BRM program is not required for crop producers as the commodity is held as collateral.
94. In terms of reinsurance, each province insurance corporation makes its own reinsurance plan. Because of the provincial size of the insurance government agencies, there is scope for pooling risks across provinces. However, this is only partially done through a federal reinsurance program that provincial governments can join. Under this program a portion of the part of the premiums paid by farmers is sent to the federal reinsurance fund, while reinsurance deficits should be paid by future premium contributions. For instance, Alberta’s Agricultural Financial Services Corporation in 2010 has the following reinsurance plan: risk up to 130% of premiums is retained; risks between 130% and 220% are partially (30% to 40) reinsured privately according to different layers; risks beyond 220% are partially covered by federal reinsurance or retained by the provincial government. There is, therefore some public involvement in reinsurance for crop insurance, while for hail insurance there is typically no public involvement on reinsurance.
95. AgriInsurance has historically been a pure government program managed by provincial Ministries of agriculture. In recent times provincial crown specialized corporations have been created under the authority of the provincial governments in some provinces to provide services to farmers. These corporations typically manage other government agricultural programs or services and they are directly financed by Ministries. They present their accounts in terms of the overall performance of the corporation often mixing the results of different programs, including actuarially based AgriInsurance and pure payments such as AgriStability. After many years of negative financial results, the corporation from Quebec, La Financière Agricole, was bailed out by the provincial government. This means that for many years the premiums of the programs were underestimated, being below payments in the long run. The fact the provincial governments are behind these corporations, including for part of the reinsurance, does not provide incentives for competitive insurance business practices. Loss ratios for agricultural insurance in Canada are not readily available for all provinces. Figure 14 represents the structure of revenue and expenses of the crop insurance program in Alberta. In the period 2007-10, farmers receive in indemnities about 67% of the revenue obtained from the premium they pay, the subsidies from the provincial and federal government and other income. Due to differences in accounting, particularly in terms of reinsurance, it is hard to make international comparisons with other systems in other countries.

TAD/CA/APM/WP(2010)29/FINAL
40
Figure 14. AgriInsurance Program in Alberta: revenue and expenses
Premiums from insured persons
32%
Indemnities 67%
Contribution fromProvince of
Alberta34%
Contribution from Governement of
Canada28%
Interest 0.2%
Administration 6%
Investment & other income 6%
Reinsurance & Farm loan
incentives 4%
Surplus (or deficit) 23%
0
50 000
100 000
150 000
200 000
250 000
300 000
350 000
400 000
450 000
500 000
revenue expense
thousand CAD Production insurance: AgriInsurance 2007-10
Source: AFSC (Agriculture Financial Services Corporation) Annual report 2008-2009 (and other years) Canada, Statement of operations, year ending 31 March.
Public/private partnerships
96. The design of AgriInsurance as purely public program of payments does not allow any participation of the private sector. AAFC runs the Private Sector Risk Management Partnership (PSRMP), but funding expired in March 2010 and was not renewed. The program attempted to enhance the ability of the agricultural sector to manage risks not specifically covered by government programs, increasing the participation of the private sector financial services industry in providing risk management solutions. The actions of this program have taken the form of financial and technical assistance to projects led by producer or industry organizations. Projects were generally focused either on animal / plant diseases, development of financial instruments or assessment of risks. They typically included the information gathering and an analysis for comprehensive or interim business solution to a risk management concern not covered by existing insurance or market tools. One of the projects financed by PSRMP was the starting up of the Cattle price Insurance Program (CPIP) led by Alberta Beef Producers.
Alberta’s cattle price insurance
97. A relatively new experiment in risk management tools for cattle farmers is the Cattle Price Insurance program (CPIP) operated by the province of Alberta. Designed under the presumption that farmers would like more direct control over their risk management choices, and that barriers to entry limit farmers ability to do this, the program provides a simple, integrated means for farmers to carry out price hedging. Price risk for cattle sales has several components. These are: price risk, exchange rate risk, and basis risk. Basis is the difference between prices in the United States and Canada. This reflects the fact that a significant part of cattle sales are to the United States and Canada prices are determined by prices in this market, and exchange rate and basis are significant risks.
98. Prior to this program, there was no single market where one could hedge these risks, and each must be hedged in separate transactions. The CPIP provides a single instrument that effectively allows the producer to buy a future’s contract that hedges the provincial price. It also minimizes brokerage fees and

TAD/CA/APM/WP(2010)29/FINAL
41
other expenses that may prevent a business case for farmers undertaking these operations in the private markets. Online delivery allows producers to rapidly select and purchase price coverage, and payouts are quick. The program is supposed to be run on an actuarially fair basis, with the province paying administrative costs and assuming some risk, which is partially attenuated with reinsurance. Unlike other risk management program in Canada, there is no subsidy element that provides implicit support. However the provincial reinsurance is an implicit subsidy which amount is very uncertain.
2.6. Market instruments
Futures
99. Futures and options for risk management are used by less than 25% farmers in Canada11. These instruments can be costly and difficult for farmers without the resources to devote to product marketing. Many more farmers sell forward their production based on futures prices. Large scale operations that can afford to dedicate a certain amount of staff time will use financial markets to manage risk while smaller farms will use more traditional marketing channels. This may be explained in part by farm operators being relatively focussed on the production side of their operation rather than the marketing side, in particular in sectors where marketing services like the CWB exist to relieve them of marketing decisions. Effective use of market instruments requires a certain level of investment in expertise and a broad view of maximising profits from the farm enterprise. A national Cattle Options Pilot Program (COPP) existed from 1995 to 1997 offering put options in Canadian dollars. This type of programs can help reduce the barriers to entry for these marketing tools, but COPP did not last due to low uptake. Programs like the CPIP in Alberta, try to improve previous experiences by including basis risk.
100. There are few domestic markets providing options instruments in Canada. The major one is the ICE futures International Commodity Exchange located in Winnipeg, Manitoba. It trades canola and feed barley futures and is widely used by processors, grain companies and terminals, although estimates are that less than 10% of canola farmers directly trade either futures or options. Although farmers do not purchase futures and options they do use the price information to help guide their marketing decisions. The majority of Canadian farmers who trade future contracts for commodities use the Chicago Board of Trade (CBOT). CBOT pricing is also often used as a basis for pricing many private contracts, so producers face both price and currency risks. As with ICE, although relatively few farmers actually trade on the exchange, many more lock in prices with suppliers and customers based on CBOT prices.
Contracting and cooperatives
101. Contract farming is used extensively in hogs and less in grains and oilseeds. It is also used for grapes and many vegetables destined for processing. The roles for and pricing of contracts varies by sector (Table 10). It is difficult to obtain data on the extent to which contract farming is employed in Canada. Supply management represents a different type of contract farming, one controlled by production quotas and pricing powers. Dairy, chickens, turkeys, eggs and hatching eggs are all organized as marketing boards with production levels managed to meet market needs while maintaining control over pricing at the farm gate. Each of these sectors is managed by a farmer-controlled marketing board which sets both production levels and prices.
11. The estimates are different according to different sources. For instance Unterschultz (2001) estimates 42%
of farmers using futures in Alberta.

TAD/CA/APM/WP(2010)29/FINAL
42
Table 10. Roles for contract farming in Canada
Sector Use of contract farming % farmers1
Pricing
Hogs High - Increased dramatically in recent years with production loops and specialization becoming the industry norm
18 Market based with premiums in some cases
Cattle Higher for feedlots than for cow-calf. 2 Market based
Dairy All product flows directly to the milk marketing board with production levels set by quota
10 Set by the marketing board
Eggs All product flows controlled by the egg marketing board with production levels set by quota
16
Set by the marketing board
Poultry All product flows controlled by the poultry marketing boards with production levels set by quota
Set by the marketing board
Grains and oilseeds
Contracting frequently used for specialty products but use varies among commodity crops.
32 Specialty crops based on a level above current market prices while commodity pricing is based on international commodity prices
Vegetables Contracting for some processed products but much sold at current pricing direct to retail or through food terminals and markets
12 Prices often based on spot market but long term pricing in some products like grapes.
1Share of farmers using marketing contracts according to Farm Financial Survey (2008) Source: Sparling (2010).
102. In 2002, agriculture co-operatives reported combined revenues of CAD 14 billion. Marketing co-ops accounted for 80% of revenues, particularly dairy, and grains and oilseeds. Farm supply co-ops reported revenues of CAD 4.3 billion, up 12.1% from 2000. Total membership in agricultural co-ops was 389 677 with 67% of that reported by farm supply ones. Collectively their volume of business in 2003 was CAD 9.6 billion. They market 22% of all western grains and oilseeds, about 39% of milk products, and 57% of all poultry and eggs produced in Canada. Co-operatives are a popular vehicle in Canada for managing several categories of activities related to business risk (Table 11).
Table 11. Role of cooperatives in reducing agricultural risk in Canada
Risk mitigated Rationale Production knowledge risks Some cooperatives actively share information on best management practices
and risk management strategies Human resource risk Cooperatives can combine the capabilities of many members. Due to their
collective size they also have the ability to hire specialized skills. Market access - Scale Cooperatives allow farmers to collectively meet the volume and product scope
needs of customers. They can also provide market power for producers. Market access – Quality Cooperatives frequently develop and implement quality standards and systems
on members to meet customer needs. Meeting customer quality and volume requirements helps farmers maintain their market access.
Input costs Cooperatives provide members with the purchasing power to obtain much lower input costs – in line with those of major competitors
Investment risk Cooperative investment in new ventures shares financial cost across many members. Cooperatives are used in vegetable packing and distribution, in processing and for marketing a variety of sectors.
Source/ http://www.coopscanada.coop/assets/firefly/files/files/pdfs/ProvAndSectoralProfiles/agriculture_coops_apr07.pdf.
TAD/CA/APM/WP(2010)29/FINAL
43
103. Agricultural marketing co-operatives are, for the most part, modern enterprises that use the latest technology to process and add value to farm products. A few large co-operatives account for the largest part of total revenues, including Agropur and Gay Lea Foods in dairy, La Coop fédérée in meat and poultry processing and Exceldor in poultry slaughtering and processing. In 2005, the 151 marketing co-operatives reporting represent a major economic force with a combined business volume of more than CAD 8.2 billion. The market share of agricultural marketing co-operatives is particularly high in the following areas: poultry and eggs (38%); dairy (40%); honey and maple (25%); and grains and oilseeds (8%) and livestock (18%).
104. Farm supply co-operatives provide member co-operatives and producers with a broad range of farm inputs including fertilizers and chemicals, animal feed, seed, building materials and petroleum products. The 216 supply co-operatives reported total revenues of CAD 4.8 billion, up 9.5% from 2004. In farm supply market share, the strongest areas are farm petroleum (52%), fertilizers and chemicals (13%), and animal feed (14%).
105. Cooperatives are increasingly under pressure as the agri-food industry becomes more industrialized, larger scale and global. To serve their owners and customers, cooperatives need to continue to grow. The cooperative structure of shared ownership with one owner/one vote and no ability to access capital on the public stock markets or even from banks in some cases has created serious challenges in raising capital (Doyon, 2002). For that reason, one of the preferred growth strategies for cooperatives has been mergers with other cooperatives. This has been part of the strategy of two the largest agricultural cooperatives from Quebec, Agropur and Coopérative fédérée. Others have changed their ownership model, in some cases forming limited partnerships. In other cases, like the western wheat pools, cooperatives were re-organized, merged and transformed into public companies like the Saskatchewan Wheat Pool. Cooperatives have also been moving beyond the farm gate, in some instances with reasonable success. But challenges in raising capital and management issues have caused some cooperatives to fail or restructure (Fulton, 2009).
2.7. Catastrophic risk management
106. Under the crop insurance program (agrinsurance) there is a definition of catastrophic risks as those that go beyond the 93 percentile, that is that have a 7% probability of occurring each year, or a reoccurrence every 15 years. However this definition is only applied to define a small part of the insurance program that is almost fully subsidized by the government/s. On the top of this catastrophic and other risk management programs Canada takes a broad perspective in the definition of catastrophic risk that deserve additional ad hoc public assistance. There is no specific criterion to define what “catastrophic” risk in this sense is and decisions have historically been taken in a discretionary basis. In addition to weather related and animal health catastrophes, Canadian governments also consider that “large” market events may warrant a policy response from the government and, therefore, are considered as catastrophic in the sense of this study. Responses to catastrophic risk tend to occur on three levels: individual, industry and government.
107. Individual responses can include private insurance in a limited number of situations but more often involve relying on other parts of the farming operation, off-farm income and increased debt financing to survive the catastrophe and resume operations quickly. Industry level responses tend to focus on securing government assistance in the form of ad hoc payments. Strategies used include lobbying and pressuring governments through public awareness and media attention campaigns. In Canada, lobbying and protests have been shown to be effective in gaining public support for agriculture through ad hoc programs and payments.

TAD/CA/APM/WP(2010)29/FINAL
44
108. The major response to catastrophe comes from governments, who respond through their agencies or through ad hoc programs designed to provide income or other support to help farmers. Since weather related catastrophes tend to be relatively short term and the impact obvious, responses also tend to be short term ad hoc payments. For example, this flooding in Alberta, Saskatchewan and Manitoba in spring 2010 caused many farmers to miss planting. A federal-provincial co-financed CAD 450 M program was announced to help Prairie farmers recover from the flooding. A payment of CAD 30/acre will be made in addition to any payments from other programs. These AgriRecovery payments are made in addition to other program payments, but AgriStability participant will have this later payment reduced accordingly. In the case of prolonged market downturns, such as grain prices in the early 2000’s, the hog downturn over the last three years caused in part by a high Canadian dollar and higher grain prices, or the apparent winding up of the tobacco industry in Canada, the distress felt by the industry builds over a longer period of time.
Animal diseases
109. Animal disease risks are managed through the Canadian Food Inspection Agency (CFIA). Its mission is to: protect Canadians from preventable health risks; protect consumers through a fair and effective food, animal and plant regulatory regime that supports competitive domestic and international markets; sustain the plant and animal resource base; contribute to the security of Canada's food supply and agricultural resource base; and provide sound agency management. The CFIA has responsibilities flowing from 13 federal statutes and 42 sets of regulations and is responsible for delivering all federally mandated programs in these areas. The CFIA has regulatory capacities (such as in biotechnology), verifies industry compliance with regulations (providing also certifying services for exports and imports) and operates emergency responses. It is involved in overall protection of animal and plant resources and deals with disease outbreaks (plant and animal) which have implications at the farm level for the farms implicated in the outbreak. The CFIA gathers information about disease status (in animals and plants) through surveillance, testing and cooperation with provincial bodies and producer groups.
110. The CFIA leads the National Animal Health Strategy, is responsible for the implementation of the Health Animals Act (HAA) and it has the authority to communicate to the government the appropriate measures to be taken in each case. If these measures include the need to slaughter animals in the case an outbreak, it will involve federal government compensation through special funds. The CFIA's programs are also focused on providing oversight for production inputs, such as feed, to verify that controls are in place to prevent the spread of animal diseases.
Ad hoc measures
111. Table 12 summarizes some of the recent major “catastrophes” faced by Canadian agriculture and the government responses. Information about past catastrophes in Canada is available but somewhat difficult to pull together in a cohesive fashion. The table reveals that while weather disasters are a factor, the most serious losses to which governments have reacted have been market related. In several cases, the disaster was simply a long term decline in a particular market due to global oversupply, reduced demand or reduced competiveness due to a higher Canadian dollar, or some combination of both.
112. Producer organisations and other have been criticising the main agricultural support programs since their inception for being insufficient in the face of catastrophic events. This has led to a number of temporary programs, termed ad-hoc, that are designed to address particular issues in certain years. Some of these ad hoc programs are the Transition Industry Support Program (TISP), the Farm Income Payment (FIP), the Cost of Production Payment... Provinces also provide ad-hoc programs, for example the Alberta Farm Income Assistance Program, the Ontario Grain Stabilisation Payment and the Farm Income Support Program in Nova Scotia. Ad hoc programs have been provided absent catastrophic events, responding to

TAD/CA/APM/WP(2010)29/FINAL
45
producer demands for additional support and to smooth policy reforms. Examples are the APF Transition Funding, the CAIS Inventory Transition Initiative (CITI) and the Canada-Saskatchewan and Canada-Manitoba Adjustment Programs12.
113. In Canada, governments have been the primary actors in dealing with both natural and market “catastrophic” events. Their responses have been generally managed on an ad hoc “demand driven” basis due to the absence of predefined criteria to determine a catastrophe deserving ad hoc assistance. In most cases, both the federal and provincial governments have been involved, either together or with their own programs and responses. Grains and oilseeds programs, for example, are often funded by federal and provincial governments but delivered through provincial crown corporations. In some cases, like the hog buyout, partnerships were implemented with industry organizations to deliver the program.
114. Responses to major catastrophic events are typically initiated and coordinated in a combined federal/provincial partnership, usually involving agricultural ministries but, in the case of animal diseases, involving the Canadian Food Inspection Agency. The recovery programs are jointly funded by the federal and provincial governments under the 60/40 cost sharing formula but are frequently delivered by provincial insurance agencies or affiliates or by commodity organizations. In instances like the Avian Influenza outbreak in BC or BSE in Alberta, a combination of local and national authorities was involved in the recovery program. The Canadian Food Inspection Agency was a central player in coordinating the response but provincial and local animal health organization and agricultural ministries were also involved. After the initial health concern was under control federal and provincial agencies responded with a variety of programs to assist the beef industry and worked with trading partners to reopen. The usual response to a disaster in Canada is direct aid in the form of payments to producers. The responses vary depending on the nature of the catastrophe as illustrated in
12. The Canada-Manitoba Adjustment Program, Canada-Saskatchewan Adjustment Program and Alberta Farm
Income Assistance Program were put in place in 2000. These programs were designed as one-time initiatives to help farmers “complete their adjustment to the elimination of transportation subsidies during a period of low prices”. They were renewed in 2001 and terminated in 2002.

TAD/CA/APM/WP(2010)29/FINAL
46
Table 12. Recent “catastrophic” events in Canadian agriculture
Catastrophe Brief description – cause and impact
Government response and payments – how much and from whom
Drought 2001-02 (source for all information
The droughts of 2001 and 2002 were unusual in that they affected areas which were less accustomed to dealing with droughts (Eastern Canada and the northern prairies). However, the droughts were concentrated in the West, with Saskatchewan and Alberta the hardest hit.
Several government responses and safety net programs partially impacted by the drought including crop insurance, Crop insurance payments were very high in 2001 and 2002. Payments exceeded CAD 2 billion, or more than 500 percent above the 10-year average in Canada.
BSE, 2003 It was announced on 20 May 2003 that a single cow in northern Alberta was positive for BSE. This led to more than 40 countries imposing import restrictions on live ruminants, meat products and animal by-products from Canada. The total economic impact from BSE is estimated at CAD 6.3-billion and access to all export markets has not fully been restored.
Federal payments: CAD 1.6-billion Provincial ad hoc programs: CAD 582-million
Avian influenza, 2004 In spring 2004, an outbreak of avian influenza occurred in the Fraser Valley of British Columbia. The active outbreak lasted more than 90 days; a total of 410 commercial poultry farms were emptied.
Federal government compensation through CFIA Health of Animal act: CAD 50-60-million (Report on the Canadian poultry industry forum December 2004)
Grain prices in the early 2000’s, 2006
In the first quarter of 2006 crop producers continued to contend with low commodity prices as their revenue tumbled. Abundant world grain supplies and a strong Canadian dollar continued to depress prices.
Grains and Oilseed Payment Program (GOPP) was a CAD 755-million program announced in November 2005 (introduced in February 2006) which provided emergency assistance to Canadian producers of grains and oilseeds to help address severe economic hardships.
Tobacco buy-out, 2008
Falling market demand and prices as well as an unfavourable investment environment ultimately led to the closing or departure of Canadian cigarette manufacturers. Demand and prices for producers fell significantly leading to demands for government action to help producers transition into other business ventures. The lucrative nature of tobacco production on small land base made transition a challenge.
The Tobacco Transition Program is part of a CAD 301 million initiative announced on 31 July 2008 by the Federal Government, with CAD 286 million dollars available for farmers who wish to transition out of the industry. The Tobacco Transition Program will provide federal funding of CAD 1.05 per pound of Basic Production Quota (BPQ) to participating producers.
Hog buy-out, 2007/08
Through 2007 and early into 2008 hog farmers were faced with increased input costs and a strong Canadian dollar which resulted in ongoing losses in the hog sector. In western Canada, shrinking slaughter capacity also had a significant impact on operations. The implementation of Country of Origin labelling requirements in the United States further eroded producers' profits with reduced U.S. demand as well as value paid for Canadian live swine shipped into the U.S.
The CAD 50-million Cull Breeding Swine Program was funded at AAFC with the Canadian Pork Council delivering the program. Also in the fall of 2009, the Government of Canada announced the Hog Industry Loan Loss Reserve Program intended to assist viable hog farms in accessing financing from their banking institutions by injecting cash into hog operations via government guaranteed loans. The CAD 75 million Hog Farm Transition Program is funded by Agriculture and Agri-Food Canada and administered by the Canadian Pork Council.

TAD/CA/APM/WP(2010)29/FINAL
47
Table 13. Possible responses to different categories of catastrophes in Canada
Type of disaster
Weather affecting crop or plant disease
Animal health or food safety
Market downturn
Initial response Initial crop insurance payments from provincial crop insurance agencies to help producers mitigate losses, possibly by replanting a less valuable crop
Animal health - CFIA in control working with local agencies – response is often a herd or flock eradication. Initial compensation on a per animal basis. Food safety event – CFIA manages the response working with provincial agencies, companies and industry associations.
There is usually no single trigger, simply a gradual building of pressure to help producers suffering prolonged market impacts. Producers will have been accessing income related support through AgriInvest and AgriStability (or their predecessors (NISA and CAIS)
Secondary response
Crop insurance after harvest to compensate for actual loss based on insurance level purchased. Income support through AgriInvest and AgriStability (or their predecessors (NISA and CAIS)
Income support through AgriInvest and AgriStability (or their predecessors (NISA and CAIS)
Prolonged margin deterioration means that producers are no longer receiving AgriStability (or CAIS) support. Pressure from the farm lobby increases on governments and may include protests.
Disaster assistance
In the past the response has been through ad hoc programs initiated at the provincial or federal level to provide additional support for farmers. Currently, the government first relies on the AgriRecovery Program to respond to agricultural production or market disaster situations. AgriRecovery is designed to be layered upon crop insurance and AgriStability and so producer payments are adjusted downward to reflect the payments which could have been made under the other programs, regardless of whether producers actually enrolled or not.
Longer term responses
Not applicable as most weather related events are shorter term.
If the market impacts continue over a prolonged period the governments may initiate additional or multi-year programs.
Source (for Tables 12 and 13): Sparling, D. (2010) based on Wheaton et al (2005), Mitura (2006), Bowes (2008) and AAFC.
Agri-recovery
115. The challenges of responding to catastrophes are significant: the extent of the loss is difficult to quantify timely and farmers are often very active in lobbying for help. This was part of the motivation for adding the Agri-Recovery Program in Growing Forward: creating a system to deal promptly and systematically with disaster situations. The AgriRecovery Program is a new approach to institutionalize and systematize disaster assistance, giving AAFC the ability to create new disaster assistance programs delivered under the same 60/40, federal/provincial cost sharing approach as other risk management programs, eliminating the need to negotiate cost sharing agreements on a case by case basis. This represents a long term commitment by governments to support farm incomes not only against normal business fluctuations but also to respond rapidly to unusual “disaster” circumstances. The rationale provided for adding the additional level of support in the Growing Forward Framework was pragmatic.
116. The process is as follows. Upon being aware of a disastrous event, the federal and provincial or territorial ministers of agriculture will convene a FPT team with four tasks. First evaluating if the event can be defined as a disaster. Second, determining the assistance already available through other programs and remaining gaps. Third, consulting with industry representatives and disaster agencies (CFIA and DFA) on whether further government response is needed. Fourth, recommending coverage options to ministers based on identified gaps and AgriRecovery principles and guidelines.

TAD/CA/APM/WP(2010)29/FINAL
48
117. Programs initiated under AgriRecovery can be broad-based or targeted to a small group of farms suffering a local crisis, but they have to be triggered by natural or disease events. “Catastrophes” that are triggered by market developments are not contemplated by AgriRecovery measures. More than a dozen programs making payments to producers have been initiated under the AgriRecovery program to date. The latest of these is a payment of CAD 30 per acre to farmers affected by excess moisture in 2010. The program is to “help producers protect and restore damaged cropland” but the program is responsive to demands from producers for compensation for losses related, in this case, to flooding. In some provinces, crop insurance includes an unseeded area benefit when weather prohibits planting that is equal to or greater than the payment under this AgriRecovery program. However, this is not provided in all provinces and participation rates vary. Further, crops such as tame hay are seldom well covered by crop insurance. The latest ad-hoc program from AgriRecovery makes up for the gaps in crop insurance coverage, and may have been avoided with more universal crop insurance coverage. At the same time, such programs are a disincentive to participate in crop insurance by providing a payment with no associated premium.
2.8. An overview of government risk management measures
118. Figure 15 displays direct payments to Canadian producers in the last two decades. They are presented in five groups: saving accounts payments, stabilization programs with different provisions (from WGSA to AgriStability), provincial stabilization programs (like and mainly Quebec’s ASRA), crop insurance, and a residual of other payments that include some of the ad hoc payments. All these programs have a strong risk management or risk response component. The five components co-exist in Canada since 1991, when the savings account program NISA began. The revenue / income stabilization payments programs have become the largest group in terms of total payments since CAIS began in 2004. Crop insurance net indemnities are highly variable with maximum payments in 2001-03.
Figure 15. Direct Payments to Canadian Producers
0
500
1 000
1 500
2 000
2 500
3 000
3 500
4 000
4 500
1986 1988 1990 1992 1994 1996 1998 2000 2002 2004 2006 2008
'000
CA
D
Residual - other programmes
Crop insurance
Provincial stabilization programs (ASRA)
Savings accounts (total)
Revenue/income stability programmes (total)
Source: Statistics Canada, Direct Payments to Agriculture Producers, Agriculture Economic Statistics, May 2010.
119. There have been along the years several provincial stabilization programs, but in recent years Quebec’s ASRA and Ontario’s RMP (extended for 2010/11) are active. The residual of payments includes many programs that are paid only during one or, at maximum two years, because they are ad hoc responses to specific situations. This is the case of BSE recovery payments in 2003 (CAD 0.5 million), Transitional Income Support TISP in 2004 (CAD 0.8 million), Farm Income Payment FIP in 2005 (CAD 0.9 million),

TAD/CA/APM/WP(2010)29/FINAL
49
Grains and Oilseeds payments GOPP in 2006 (CAD 0.7 million) and the Cost of Production payments COP in 2007 (CAD 0.3 million).
120. Table 14 provides annual average payments through the same five groups of programs for four different time periods. The period 1999-2003 shows a peak of insurance net indemnities and other payments (including ad hoc), which seem to reflect the fact that drought in 2001/03 triggered both insurance and ad hoc payments. In the period 2004/09 income stabilization programs (CAIS and AgriStability) represent half of all the payments and other programs (including ad hoc) seem in a downwards trend.
Table 14. Annual average direct payments to producers in Canada for different time periods
1986-1990 1991-1998 1999-2003 2004-2009
Main stabilization program WGSA / NTSP
GRIP AIDA / CFIP
CAIS/ AgriStability
Million CAD Savings accounts (total) 147 603 427 Revenue/income stability programmes (total) 647 411 329 1 527 Crop insurance 352 122 632 241 Provincial stabilization programmes (ASRA…) 183 221 395 432 Other programs (includes ad hoc) 1 147 393 1 123 774 Total 2 329 1 294 3 081 3 402 Source: Statistics Canada, Direct Payments to Agriculture Producers, Agriculture Economic Statistics, May 2010.
Normal risk
121. Canadian Business Risk management (BRM) policies are the core of Canadian agricultural policies. They cover a large set of measures for risk reduction, mitigation and coping, some of them are ex ante measures and other are payments that are triggered or decided ex post (Table 15). None of these measures attempt to enhance the development of market instruments to manage risk. They are focused on government policies that smooth the income from farming. Most of them are triggered quite often and can then be considered as dealing with normal risk. AgriStability payments are triggered by reductions of margins or income below 85% of historical income, which can occur rather frequently, once every two years for the median crop farmer in the Saskatchewan sample. AgrInsurance policies allow deductibles of only 10%, which mean triggering indemnities when yields is reduced below 90% of historical averages, which happens once every three years for the median farmer in the same sample. These frequencies can only be considered as “normal” risk, and the corresponding programs AgriInvest, AgriStability and AgrInsurance are then covering at least part of normal risks. On the top of that, supply management policies radically reduce any normal price variations for the specific commodities involved.

TAD/CA/APM/WP(2010)29/FINAL
50
Table 15. Government measures related to farm risk management in Canada
Market creation Modifying market incentives
Risk reduction and mitigation (income
smoothing)
Coping with risk(consumption
smoothing)
Ex ante • Stable macro and
business environment
• Price support in supply management commodities (dairy, poultry and eggs)
• Prevention/alert of animal diseases (domestic and border)
• R&D
• Public Insurance with
subsidies (AgrInsurance)
• Subsidized saving accounts (AgrInvest / NISA)
Ex post - triggered ex-post
• Countercyclical payments (AgriStability, ASRA)
• Disaster Aid (Agrirecovery)
• Tax system
- decided ex-post
• Ad hoc compensation and support measures
• Border measures and compensation in case of diseases
Note: The line delimiting “efficiency” and “equity” in this table indicates the most likely underlying motivation for the policies listed: to tackle market failure (efficiency) or redistribution in favour of specific groups of individuals (equity).
122. In this context the Canadian set of policies does not leave a clear layer of “normal” risk out of the government responsibility and, therefore, it reduces the responsibility of farmers for their management of normal farming risk. Even the financial management of loans and savings is supported by the government. The main message to farmers is not the need of a pro-active risk management strategy at the farm level, nor the need to assess the trade-offs between higher returns from some market opportunities and smaller business risks. Policies do not enhance the idea of farmers that develop their own risk management strategies, well adapted to their needs and consistent with their overall business strategies.
Marketable risks
123. Canada is not characterized by the development and use of dynamic market risk management tools. Insurance is a provincial government service with little similarities to private insurance instruments: there are no private companies involved but government offices and agencies making premium calculations and providing subsidies. Futures are used only by some farmers, particularly ICE for Canola. However, contracts with risk management provisions are relatively frequent with cooperatives, private companies and also public agencies such as the CWB. In general strong government involvement on normal risk management also reduces the space for private market risk management solutions.
Catastrophic risks
124. AgriRecovery is supposed to be the main catastrophic risk management instrument in Canada. By design it is likely to be triggered rather infrequently, but it lacks a clear definition of the disasters that
BRM POLICIES

TAD/CA/APM/WP(2010)29/FINAL
51
would be entitled to some aid. They are supposed to be only natural disasters. However the experience of many years has shown that market events have triggered ad hoc payments in Canada with relatively high frequency and large amounts of payments. AgriStability was supposed to avoid payments when market situations deteriorate for more than three years thanks to its Olympic average reference margins. However the system was again put under pressure after three bad market years in a row in the hog industry with some additional payments being triggered in an ad hoc basis with the purpose of facilitating adjustment. In this context market related trends are also seen as catastrophic in the sense of deserving public assistance, at least in some cases.

TAD/CA/APM/WP(2010)29/FINAL
52
PART II.
MAIN POLICY ISSUES
3. Risk Layering in Canada’s policies
3.1. How do agricultural policies define different risk layers?
125. Agricultural policies in Canada address a broad range of risks. The FIPA already describes four types of programs. First, a stabilization account, presumably to facilitate farmers small normal risk management through savings. Second, a gross or net revenue insurance program, for the larger risks. The different versions of these programs in Canada (NTPS, GRIP, AIDA/CFIP, CAIS and AgriStability) have never worked on the basis of actuarially calculated premiums and are not, properly speaking, insurance. Third, a crop insurance program for immediate production losses, a device that has existed in Canada for many decades, based on actuarial premiums but run by government policy corporations rather than insurance entities. There has always been a fourth set of risks covered by ad hoc ex post assistance that covered not only natural events but also market shocks.
126. The Growing Forward framework defines the current set of policies in Canada and attempts to define different layers of public response to risk in agriculture: AgriInvest, AgriStability, AgriInsurance and AgriRecovery (Table 16). Three different parameters serve to trigger these programs, and they determine to a large extent the scope and boundaries of the different layers. First, the so called “program margins” that measure net operating margins using tax-file information. This is compared with a reference level (individual Olympic average of past margins) to determine payments under AgriStability. Second, individual yields are compared with a reference yield. Third, the frequency of occurrence of events affecting yields, measured in terms of percentiles. The last two are used together to define indemnities and subsidies under AgriInsurance. AgriInvest has no triggering mechanism, and AgriRecovery and ad hoc payments are decided by provincial and federal governments subject to non-defined specific criteria.
127. These programs are not defined in terms of the specific types of risk they are designed to address—frequent versus rare events, originating by nature, markets or other sources. As a result, they tend to overlap in terms of coverage and response (Figure 16). The overlapping between different programs should not be interpreted as double compensation for risk since both AgriStability and AgriRecovery have provisions to take payments from other programs into account in determining program benefits.

TAD/CA/APM/WP(2010)29/FINAL
53
Table 16. Canadian risk management programmes: features of different layers
Program/ layer Risk definition Support Source
of risk Triggering parameter
Frequency of payment
Correla-tion with
income
Rapi-dity
Tier 1: AgriInvest (former NISA)
reductions of “program margins” of less than 15%
Allows farmers to save up to 1.5% of ANS matched by government
All None Always None High
Tier 2: “stabilization” component of AgriStability 15/30
Reductions in program margins (as compared to reference margins) between 15% and 30%
Loss covered by a government payment at 70%
All Program margins / reference level
High High Very low
Tier 3: “disaster” component of AgriStability 30/100
Reductions in program margins between 30% and 100%
Loss covered by government payments at 80%
All Program margins / reference level
Medium High Very low
Tier 4: AgriStability Negative margin
Negative program margins
Loss covered by a government payment at 60%
All Program margins / reference level
Rare High Very low
AgriInsurance, standard layer
Reductions of yields beyond 10% to 50% (depending of deductibles)
Government pays 60% of the premiums
Nature (specific risks)
Yields/ reference level
Medium Medium
High
AgriInsurance, Catastrophic Loss Layer
For rare events with occurrence beyond the 93 percentile
Losses subsidized at 90 to 100%, reflected in premiums
Nature (specific risks)
Yields/ percentile
Very rare Medium
High
AgriRecovery, Disaster layer for natural events
Disasters vaguely defined as events beyond existing programs and capacity of individual producers
Decided within a consultation process
Nature Undefined Rare? ? Very High
Ad hoc Disaster layer: market events
There is no definition or frame and ad hoc decisions are applied
Decided ad hoc Market Undefined Rare? ? High?

TAD/CA/APM/WP(2010)29/FINAL
54
Figure 16. Canadian Risk Management programmes: frequency and type of events covered
AgriStability (Layer 2)
AgriStability (Layer 3)
AgriStability (Layer 4)
AgriInvest (Layer 1)
AgriInsurance(standard Layer )
AgriInsurance(catastrophic layer ) Agri-
Recovery
Ad-hoc for Market
events
Rare
and
la
rge
even
tsFr
eque
nt
smal
l eve
nts
Frequency of occurrence
Source of risk
Nature Markets Other
128. Both AgriStability and AgriInvest are very comprehensive in term of the risks and sources they cover. They cover risks that are “normal” but are also available when risk becomes more catastrophic. AgriInvest is not targeted to low income situations and has no triggering mechanisms, but it is quick: producers receive a matching deposit of up to 1.5% of allowable net sales (ANS) every year that farmers save money in a special account. These funds can be used when needed any year after. On the other hand, AgriStability is targeted to low margins, gathering individual information from tax files and complementing it with additional information from farmers. Payments are triggered by net margins being below 85% of an individual reference margin. However, this calculation requires a lot of information and time for processing. This can create delays of one year or more and uncertainty about the timing and amount of the payment. This raises doubts about whether AgriStability payments are matched to the “true” income situation of the farm at the time when the payment is actually made. The comparison between AgriStability and AgriInvest provides a good example of the trade-off between a well targeted sophisticated programs and an untargeted simple program when there are significant information asymmetries.
129. AgriInsurance and AgriRecovery cover a narrower set of risks, but they make quick payment to farmers once triggered. They both refer to natural events that affect production. Indemnities from insurance respond to specific rules established in contracts and are typically triggered by low yields compared to a reference, while AgriRecovery is a formal protocol of action and cost sharing with specific measures being decided in an ad hoc basis. AgriInsurance is targeted only to yield risk which, in a country with high price risk as Canada, may mean only medium degree of correlation with income. There is no way of assessing the degree of targeting of AgriRecovery to individual low farm income.
130. Uncertainties about the frequency and targeting of the ad hoc measures related with market events are even larger. All decisions are made on an ad hoc basis and often linked to structural adjustment due to market changes. It is questionable to classify these measures as risk management measures since

TAD/CA/APM/WP(2010)29/FINAL
55
they are hard to distinguish from support measures that are triggered by industry lobbying under specific circumstances.
131. Agricultural risk management policies in Canada are so comprehensive in terms of the risk layers they cover, limiting the incentives for using on-farm strategies and market risk-management tools. Even if they never pay 100% of losses, AgriInvest and AgriStability provide coverage for almost all normal risks and marketable risks, and part of what could be considered as catastrophic. AgriInsurance does not leave any room for private multi-peril yield insurance to develop and covers some normal, marketable and catastrophic risks. AgriRecovery and ad hoc payments are thought as residual programs to tackle catastrophic risks that have not been covered by other programs, despite their comprehensiveness.
3.2. Are risk management programs targeted to individual farmers´ low income situations?
132. What is the evidence regarding the effectiveness of each measure at targeting income declines? There are two approaches to answering this question: an empirical analysis of the available data, and a conceptual analysis of costs and incentives. This section looks at the evidence available in the micro data, while the economic incentives are discussed in section 4.
133. The effectiveness of the CAIS and AgriStability programs is investigated using longitudinal data of 457 crop farms in Saskatchewan for 1998-2008. This sample is not designed to be representative of Canada and results have to be interpreted with caution. The data includes information about margins, payments received from CAIS (the precedent of AgriStability), indemnities received from crop insurance and a residual of other payments which includes ad hoc payments and likely also environmental or other types of payments13. Table 19 presents some correlations among these categories.
134. The reduction of variability is measured in terms of the percentage reduction of the variance in comparison with the variance in the absence of correlation between margin and payments (CAIS, insurance indemnities and other payments). According to this sample data, all payments reduce the variability of the majority of farms (Table 17). Insurance indemnities reduce the variance of 77% of farmers, while CAIS reduces variance for 80%. The mean percentage reduction in variance is 20% for insurance and 26% for CAIS. When insurance indemnities are combined with CAIS payments, reduction of variability is 43% on average and risks are reduced for 87% of farmers. Other payments reduce average variability to a lesser degree.
Table 17. Observed effects of CAIS and other programs
Expected receipt per farm (CAD)
Mean percentage reduction change of variance
Percentage of farms with lower variance than baseline
Gross margin of agricultural production 21815+ Indemnity from insurance 27808 -20.4 76.8+ CAIS payment 28170 -26.4 79.6+ Ad hoc and other payments 24195 -7.1 69.8+ Insurance indemnities + CAIS payment 34163 -43.0 87.1+ Insurance Indemnities + all program payment 36543 -44.3 87.7
13. CAIS payments in the data is the amount of payments received during a specific calendar year, which is
paid based on the margins of multiple program years in the past.

TAD/CA/APM/WP(2010)29/FINAL
56
135. The correlation between margins and payments provides more insight into these results. A distinction is made in the original database between cash based margins declared for income tax purposes and program margins that include the adjustments made by the government. In terms of the cash based margins, despite the known delay in the CAIS payments, 80% of the farms have negative correlation between cashed based margin and the payments with an average of -0.30 (Table 18). The correlation remains negative when calculated with one or two-year lags (cashed based margin in year t and CAIS payment in year t+1 or t+2), but it is much weaker, showing little evidence of delay in these payments. Insurance indemnities and other payments are also negatively correlated with cash based margin on average.
136. The high level of current-year correlation of margins and payments is unexpected given that there is wide agreement that CAIS and AgriStability payments take some time to deliver. The explanation for this comes from the sources of the data: cash-based margins are collected from tax files, which are influenced by tax incentives. Farmers pay taxes on their margin plus any payments received. Since taxes are progressive, there is an incentive to smooth their taxable income (including current CAIS payments). Within the limits of the tax regulations, they can do so by reducing declared cash margins in years when payments are received, making the payments look more counter-cyclical than they are.
Table 18. Correlation between current margin, and insurance indemnity and payments in the same year (lag=0), and one or two years later (lag={1, 2})
Lag=0 Lag=1 Lag=2 Lag=0 Lag=1 Lag=2
Insurance indemnity -0.25 0.05 0.09 75.2 42.2 36.8CAIS payment -0.30 -0.12 -0.02 79.6 61.9 50.3Other payment -0.18 -0.08 -0.05 69.8 58.6 54.5Insurance indemnity -0.05 0.00 0.01 58.6 53.2 52.4CAIS payment -0.05 -0.37 -0.09 58.3 81.9 56.1Other payment -0.18 -0.25 0.03 70.3 76.7 48.5
Average coeffient of correlation
Percentage of farms with negative correlation
Cash based margin and…
Program margin and…
Correlation between
137. While tax obligations are calculated on the basis of cash margins (which can be somewhat controlled by producers), the CAIS payment is not. Both program margins and reference margins are adjusted to an accrual basis to reduce the possibility of strategic accounting affecting payments. These calculated program margins have a strong negative coefficient of correlation (-0.37) on average with CAIS payment only when measured with one year lag. The data also shows that the correlation is negative for more than 80% of farms. However, the program margin has no significant correlation with insurance indemnities with or without lags.
138. In fact, CAIS payments have, as expected, negative correlations with cash-based market revenues for 61% of the farms, even if this correlation is on average rather weak (-0.11). They have positive correlation with cash-based costs for 64% of farmers (Table 19). However, approximately 70% of farms have negative correlation between CAIS payments and insurance indemnities. This result is unexpected since normally years where low yield triggers insurance indemnities should also see CAIS payments based on reduced income. This supports the idea that CAIS payments are delayed with respect to the triggering year and that insurance indemnities are generally paid in the year of the loss. These results provide evidence that cash or program margins poorly estimate income. The fact that producers have incentive and capability to manage their accounting in order to minimize their tax obligations introduces a degree of uncertainty to the capacity to evaluate the effectiveness of the AgriStability program.

TAD/CA/APM/WP(2010)29/FINAL
57
Table 19. Correlation between CAIS payment and others
Market revenue Variable costs Insurance indemnity Other payments
Average coeffient of correlation -0.11 0.15 -0.06 0.30
Percentage of farms with negative correlation
61.3 35.7 69.3 21.9
Correlation between CAIS payment and….
The impacts of delays in the payment of CAIS / AgriStability
139. When the payment is delayed, the real impact of CAIS/AgriStability on farm income risk cannot be fully assessed. Using Montecarlo simulations, AgriStability payments were calculated for all 457 farms according to the stipulated formula.14 As expected, the simulation results imply a large reduction in variance when payments are made without lag (44%), more than 95% of the farmers reduce their variance, and minimum income increases for more than 90% of farms (Table 20). Much weaker reductions in variability are seen when different assumptions about payment lags are introduced (one-year lag, two-year lag, or equal payments after one and two years). In some cases, variability can increase, with the majority of farmers not seeing the variance in their income reduced. Moreover, the minimum income does not increase for the majority of farms if the payment is delayed for one or two years. The simulation exercise implies that, under these circumstances, AgriStability payments are unlikely to reduce the variability of income for most farmers.
Table 20. Simulated impacts of AgriStability program
Expected receipt per farm (CAD)
Mean percentage reduction of variance
Percentage of farms with reduced variance
Percentage of farms with higher minimum income
Gross margin of agricultural production 22220 - - -+ Indemnity from insurance 27310 -12.89 69.8 64.1+ AgriStability payment without lag 26474 -44.14 96.3 90.2+ AgriStability payment with one year lag 26471 0.32 45.7 42.0+ AgriStability payment with two years lag 26468 0.95 43.5 40.0+ AgriStability payment with two checks 26472 0.67 41.8 63.7
140. The impacts on variability of the current CAIS payments recorded in Table 17 are much weaker than the reductions obtained with simulated AgriStability non-lagged payments in Table 20. The actual impact of AgriStability payments on farm income risk seems to be somewhere in-between the impacts of simulated payments under the two assumptions of no lag and one or more year lag.
3.3. Do government programmes crowd out other strategies?
141. The same micro data from the province of Saskatchewan are used to calibrate a micro simulation model with endogenous farmers’ decisions in terms of production and risk management strategies. The model follows the same specifications as those developed in OECD (2010) and it is used to investigate four
14. Based on the farm-level data, empirical joint distributions of gross margins and insurance indemnities are
generated for all 457 farms on gross margin and insurance indemnity. Monte-Carlo simulation drew 100 combinations of gross margin and insurance indemnities. AgriStability payments are calculated for all farms based on the specified formula of the program, setting the individual reference margin as the Olympic average of the last 5 Monte Carlo draws.
TAD/CA/APM/WP(2010)29/FINAL
58
programs (AgriInsurance, AgriInvest, AgriStability and AgriRecovery). Annex 1 describes the technical details of these policy simulations. This framework allows analyzing the links between different policies and strategies and estimates the potential for crowding out effects, particularly with respect to diversification. Prairie agriculture in Canada largely depends on exports, which exposes farmers to exchange rate and trade risk. In the model these risks are embedded in the variability of prices received by farmers. The model focuses on the four included BRM policies and does not capture other factors such as the potential for government action to improve diversification of export markets and development of domestic market infrastructure and alternative marketing tools that could enhance farmers’ diversification strategies.
142. Although the programs in total reduce the coefficient of variation of income by 7.7 %, almost the entire welfare gain for the representative farm is due to the increase in the level of expected income due to the support, rather than to the reduction in the variability of income (Table 21)15. The farmer represented in the simulation benefits more from the income support component of the programs rather than the risk reduction they provide16. Moreover, the results show that programs may crowd out production diversification which declined by 30%. That is, the resulting specialization of production increased the variability of market revenue by 30% in terms of the coefficient of variation.
143. Each component of Business Risk Management programs has a different impact (Table 21). The simulation first added AgriInsurance, followed by the AgriInvest, AgriStability and AgriRecovery programs. In the absence of AgriInsurance, the farmer does not purchase crop yield insurance due to high cost of insurance. With a subsidy to the insurance premium, the farmer insures one-third of land. The income coefficient of variation is reduced slightly and the minimum income increased substantially, but the risk-reducing effect of crop insurance is partially offset by the crowding out of crop diversification strategies. The farmer responds by using crop yield insurance and producing more of the crop that that tends to generate higher returns with more variability.
144. AgriStability and AgriInvest programs cover four different tiers: from the most frequent and “normal” risks, to the most catastrophic risks implying negative margins. The AgriInvest program is designed to manage normal fluctuation of income by providing incentives to save. AgriInvest (Tier 1) is modelled as a fixed payment of 1.5% of sales (ANS). The simulation results show that this program has a minimum risk effect and purely increases the level of income without crowding out other risk management strategies such as crop diversification and the use of crop yield insurance. The income coefficient of variation declined slightly, but this is due to the increase in the level of income.
15. The representative farm is calibrated as an average farm in the sample data. This results in a farm with 820
hectares of land. The simulation results are subject to the modelling assumptions specified in Annex 1 (e.g. the degree of constant relative risk aversion of 2).
16. Schaufele et.al (2010) also argue that AgriStability behaves more like an income support program by calculating an implicit subsidy based on the difference between the participation cost and the actuarially fair premium.

TAD/CA/APM/WP(2010)29/FINAL
59
Table 21. Impact of Business Risk Management Programmes
Change in mean
Change in variability
Total impacts 5296.5 5250.1 46.3 -7.7 -30.0 12914.1 16.3 contribution of….
AgriInsurance 10.8 -4.2 15.0 -0.5 -3.9 5424.2 33.1AgriInvest 484.4 483.9 0.5 -0.7 0.0 479.6 0.0AgriStability 3769.2 3634.2 135.1 -9.0 -17.8 12388.6 -16.6AgriRecovery 1032.1 1136.3 -104.2 2.5 -8.3 -5378.4 -0.2in case ofAgriStability with lag 3317.4 3285.4 32.0 -4.9 -17.8 11551.4 -16.2
Certainty equivalent income (change in CAD) CV of income
(Change in percentage)
Change in Diversification index (Initial=100)
Minimum income (change in CAD)
Change in the share of land insured (change in percentage points)
Overall change
Contributing factors
145. Given its size, AgriStability has by far the largest welfare impacts among the four programs. The composition of the welfare impact shows that the farmer in the simulation values the program almost entirely as an income support rather than a risk reducing program. The coefficient of variation of income is reduced, but AgriStability has a strong crowding out effect of other risk management strategies, dominating the total effect of all four programs. AgriStability provides support when the producer experiences a margin decline of more than 15%. Such comprehensive risk coverage creates an incentive for farmers to specialize in riskier crops that generate higher return. Moreover, AgriStability reduces the incentive to use crop insurance by half, as it already provides coverage for both the catastrophic and market layers of income risk. In reality, this disincentive has not implied a reduction in the participation rate to the crop insurance program, which has increased overtime even in the presence of CAIS/AgriStability. This could be explained by the increasing commodity coverage and the high share of premiums paid by the government.
146. In order to estimate the effect of the delays in the payment of AgriStability, a random element associated with the AgriStability payment was introduced (see Annex 1 for technical details). The random element is generated on the basis of the information in Table 18. The result is a weaker correlation between the margin and the AgriStability payment, making the program less effective in reducing risk, leading to smaller welfare gains (Table 21). The crowding out effects of the program on diversification strategies is unchanged, while crowding out of crop yield insurance is slightly reduced. This is because random delays in payments make AgriStability less effective in covering catastrophic and market risks, leaving a bit more room for crop yield insurance. Delays in the AgriStability payment further creates a role for crop yield insurance that makes rapid payments—crop insurance essentially acts as an advance payment system for AgriStability. The presence of the AgriInsurance makes delays in AgriStability more tolerable to producers who participate in both programs.
147. Lastly, the AgriRecovery program is an ad hoc program that is paid in response to the catastrophic natural disasters, including farm-scale events, excluding market events. The program is modelled in a reduced form as paying a fixed amount when the farmer experiences a “disaster” such that the yields of all crops fall below the 30th percentile of the distribution. The simulation results show that AgriRecovery can have a very strong effect on crop specialization. When systemic yield risks are covered by the AgriRecovery program this, combined with the AgriStability program, provides greater incentive for the farmer to specialize in high-return crops. This leads to higher variability of income and lower minimum income before program payments. AgriRecovery increases income, offsetting the higher income variability. These simulation results suggest that the AgriRecovery program is not effective in mitigating catastrophic income risk beyond the amount already provided by AgriStability (keeping in mind the stylised representation of AgriRecovery in the simulation).

TAD/CA/APM/WP(2010)29/FINAL
60
AgriStability analyzed by tiers
148. The simulation results in Table 21 indicate that AgriStability as a whole reduces income risk but it may also have a strong crowding out effect of other risk management strategies. However, AgriStability is composed of 3 tiers that cover different layers of risk with different levels of support: “stabilization” Tier 2 for margin declines between 15-30%, “disaster” Tier 3 for 30-100% declines) and Tier 4 for negative margins. The results show that payments under Tier 2 -- “normal” reductions in income between 15% and 30%--do not reduce the overall variability of income, as the payment leads to strong reductions in diversification (Table 22). This effect also results in a lower minimum income. In the simulation, Tier 2 of AgriStability is having very strong negative effects on farmers’ active risk management strategies and potentially increasing overall income risk. These results lend support to the proposition that normal risk should be left in the hands of farmers, with assistance provided through a more stable payment such as AgriInvest, which has a smaller crowding out effect.
149. Payments under tier 3 are triggered for reductions in margin between 30% and 100% compared with the reference margin. This tier provides the largest payment to the farmers and is the most effective in reducing the variability of income. Payments under this tier also discourage crop diversification, but to a lesser extent than other tiers. In fact, in the simulations, the reduction of income risk by AgriStability is entirely due to this tier 3 of the program. Nevertheless, the welfare gain remains almost entirely due to the increase in the level of income rather than reductions of income risk. Moreover, this simulation does not take into account the effect of payment delays, which may jeopardize the program’s effectiveness. Tier 3 of the program covers a wide range of “market” and “catastrophic” risks and so reduces the use of crop yield insurance which covers the same risk layers.
150. Tier 4 is triggered in the case the farmer experiences negative margins. This tier most effectively increases minimum income, but is not as effective in reducing income variability as Tier 3 as it promotes increased crop specialisation. Despite this effect, the variability of income remains almost unchanged because the farmer increases the use of crop yield insurance. This may be explained by some complementarities between the risks covered by Tier 4 of the program and crop yield insurance.
Table 22. Impact of different tiers of AgriStability Program
Change in mean
Change in variability
Total impacts 3769.5 3728.9 40.6 -5.9 -31.9 8224.2 -5.4 contribution of the coverage of…
between 70-85% of reference margin (Tier 2)
335.4 418.5 -83.2 2.6 -6.8 -4887.7 -1.1
up to 70% of reference margin (Tier 3)
2488.1 2336.7 151.4 -8.6 -6.6 -2804.7 -21.3
of negative margin (Tier 4) 946.0 973.6 -27.7 0.1 -18.6 15916.6 17.0
Change in the share of land insured (change in percentage points)
Certainty equivalent income (change in CAD) CV of
income (Change in percentage)
Change in Diversification index (Initial=100)
Minimum income (change in CAD)
Overall change
Contributing factors
4. Information and program targeting
4.1. Why is information a key element of risk management policies?
151. Risk management is a very information intensive activity. The management of risk requires effective use of available knowledge about different sources of risk on a specific farm, the available alternatives for risk management for the specific business, and the effect of policies on the risks faced by that farm. This includes complex information about damages and probabilities that depends to a great extent on the specific management decisions of the farmer. Business management and risk management are

TAD/CA/APM/WP(2010)29/FINAL
61
simultaneous and part of a single management activity. Therefore the information needed for risk management is in the hands of the business manager, not in the hands of the government.
152. This fact is a central challenge for Canadian policy makers who have developed over recent decades a comprehensive set of programs focused on business risk management in agriculture. New programs have tried to improve the targeting of policies to precise income losses of farmers. This has increased the complexity of the programs and the information required to run them. Gaining access to this information and the development of appropriate databases is a long run policy investment essential to measuring the monetary value of the protection that is provided (the premium). However, gathering this information is not only a question of applying sufficient resources to the task: the incentives of program participants create intrinsic difficulties in obtaining the best information. Policy design must take into account not only the administrative costs of different alternatives, but also the potential bias or “error” embedded in the process due to information being systematically incorrect or untimely. This is particularly important for risk management because programs based on incorrect or untimely information can translate into additional risk for farmers.
Stable versus countercyclical support
153. Risk Management programs in Canada have followed two different approaches, each one with its advantages and disadvantages:
• Stable support. Providing support to farmers with few conditions, and broadly proportional to the revenue of the farm, with some caps. This has been provided through contributions to savings accounts (NISA / AgriInvest). The farmers receive support, but it is their responsibility to manage their risks in the most efficient way giving the sources of these risks and the tools at the farmer’s disposal. These payments are not targeted or tailored to a specific income reduction or damage suffered by the farmer. They do not attempt to alter the risk environment, but rather improve the capacity to manage risks. Government provides the support, farmers do the risk and business management. The farmer knows the value of each risk management instrument and he decides whether it is worth the cost.
• Countercyclical support. Providing support that is increasingly targeted to realised income of the farm, trying to provide support in a way that discriminates between farmers and calibrates payments according to the damage or farm income reduction suffered by each farm. These include crop insurance (AgriInsurance), payments that are countercyclical with income or revenue (including CAIS and AgriStability) and payments decided ex-post (ad hoc payments and AgriRecovery). These payments attempt to mitigate the shocks and alter the risk environment of farming. Government provides directly the risk management, that is, support when it is “needed”, and farmers do the business management, including the management of the remaining risk in a risk environment that has been significantly modified by the payments. The government decides that a given risk mitigation program is worth paying and provides it to farmers at some fraction of the actual cost.
154. The relevance of this issue goes beyond Canada. With different details and to varying degree, the three North American countries all use both types of measures. The United States provides Direct Payments that are stable and countercyclical payments (including ACRE and MLA) and insurance subsidies. Mexico provides stable payments through PROCAMPO and countercyclical through the “ingreso objetivo”. On the other hand, the EU mainly relies on a stable payment, the SFP. Among the countercyclical support programs used in the OECD AgriStability is probably the most ambitious in terms of targeting the payments to precise reductions in individual farm income. Other countercyclical payments do not typically use individual triggers. For instance, deficiency payments are targeted to reduction in

TAD/CA/APM/WP(2010)29/FINAL
62
average prices and ACRE payments in the US are targeted to reductions in revenue at county/state level. Crop insurance programs are targeted to yield reductions.
155. While stable support is relatively untargeted, it has the advantage that no strong information asymmetry needs to be overcome by the government. Risk management decisions are taken by the farmer, who has the right information. Countercyclical payments are more targeted but need to overcome very strong information asymmetries between the government and the farmers: the government attempts to manage a risk without timely information. This section argues that this trade-off between targeting and avoiding or managing major information asymmetries is at the core of the design of any risk management policy. A well targeted risk management policy needs also to create the opportunity and incentives for participants to provide the appropriate information. This is a challenging objective and it is not always possible to achieve.
156. Why is better targeting to farmers with reduced farm income important? The first reason is technical--it is well known that the better the program is targeted to low income, the more valuable is the risk reduction to the participant. The second reason is political: support provided to farmers to help when their income is reduced is more justifiable. However the micro simulations in section 3 imply that farmers may value countercyclical programs mainly because of the net income support they provide and not their risk mitigation properties. If risk reduction is not especially valuable to the participant, the second reason is likely to be behind the longstanding focus on risk management for support policies.
4.2. Targeting reductions in income: limits imposed by information
157. Information is a flow, not a stock. It is most valuable when it is accurate and gets to the agent making a decision at the time the decision is made. Unfortunately, this is rarely the case. Is it possible to design a policy that generates an appropriate flow of information? There are at least four difficulties to overcome.
First difficulty: Collecting information for income objectives
158. AgriStability is a program that provides payments to farmers when their income is reduced. Therefore, it is very demanding in terms of income information about individual farmers. Farm income information is already collected each year through the income tax system, so it makes sense to use this tax information in AgriStability to reduce the administrative burden for farmers.
159. However Canadian farmers have the right to declare taxable farm income on the basis of cash accounting which provides flexibility to farmers to manage their tax obligations and they typically do so. This is good for farmers who can compensate for negative profits this year by reducing future tax obligations by timing their sales and purchases.
160. For the purposes of the AgriStability program, the flexibility cash-based accounting provides for farmers to control declared income would make the program unworkable. Therefore, two adjustments are made to the information submitted in tax files. These are a conversion into accrual income, and an adjustment of the reference margin when the operation changes its scale by more than ten percent. The conversion to accrual accounting requires additional information, in particular inventory data provided through an additional form to be completed by the farmers. The adjustment of the size of the reference margin is a more complex calculation that is not entirely dependent on data provided by the farmer. This means the farmer cannot completely predict the amount of the payment on the basis of the information they provide in their application. This additional uncertainty regarding the payment is not a desirable characteristic of a risk management tool and reduces its value.

TAD/CA/APM/WP(2010)29/FINAL
63
161. Canada has probably the most detailed and complete dataset on farm risk management in the world. It completes the program information files with an additional dataset: the Farm Financial Survey (FFS). The program administration database is based on income tax files. In addition, AAFC has developed a project to combine this information with the FFS to use the resulting database for policy analysis and expenditure forecasting. This is a unique and impressive exercise that should help to analyze income and risk management policies and it proves that it is possible to develop good information tools.
Second difficulty: Timing
162. In Canada, for any calendar year, tax forms have to be filed in April / June of the following year. Additional program information is collected after the tax declaration by the end of September, and by the end of December at the latest, which is a full year after the end of the year on which the payment is based. For this reason, payments are typically made with a significant delay with respect to any event that has affected income. For events occurring in January payments are typically received two years later. This type of late compensation is useful to manage normal risks, but it can never be appropriate for catastrophic events that typically require quick action to avoid short term shocks and liquidity constraints. Furthermore,, the payment may ultimately come during a period of high income for the farmer, making its capacity to reduce income variability questionable.
163. This delay in the payment does not mean that the administration of the program is inefficient, but is due to the structural limitation on collecting the information. Income can only be assessed objectively and known outside the farm after the accounting has been closed for the year. Income tax procedures are already the most efficient method to gather income information about many individuals, and the fact that AgriStability requires additional information beyond that creates an additional delay.
Third difficulty: moral hazard and business incentives
164. The analysis presented in section 3 demonstrates that risk management polices and strategies are strongly interrelated. Typically a government program dealing with some risks will crowd out other risk management strategies at the farm level, because the program allows the farmer to take on more risks that can yield higher returns. In other words, AgriStability provides higher payments to farmers who take on larger risks. This is a typical moral hazard problem that can only be solved by ensuring that farmers continue to have an incentive to manage risk, such as through participation costs that are dependent on behaviour. This is technically difficult for any kind of insurance, and almost impossible for a program like AgriStability in which the farmer pays a fee that is only a small fraction of the actuarially fair premium (Schaufele et.al. 2010).
165. There is an observational problem here: policies that support farmers when there are reductions of income alter all management decisions on the farm. The underlying risk and the income reduction at farm level cannot be observed without changing it--once the programme is in place, farming risk has changed even before the first payment is made. In general, a stable support program affects this environment only marginally and does not create moral hazard. But a countercyclical payment will crowd out other risk management strategies and, therefore, the observed variability of income ex post will be in general larger than if the program was not in place.
Fourth difficulty: Adverse selection and Information incentives
166. Once events have occurred and the information collection system is in place, the available information has to allow the government to select farmers that deserve support according to the program parameters. The question is how well information can be collected, particularly through the tax and additional program information forms. There is no way to check all the information. There can be

TAD/CA/APM/WP(2010)29/FINAL
64
consistency tests applied, and penalties in the tax inspection system promote honest reporting. While all these reduce the flexibility of the farmer in providing the information, the farmer will use the space provided by the rules to show the information that betters serves his own interests.
167. Tax information is collected with clear incentives in place: paying less tax. The cash accountancy system gives room to farmers to try to smooth their income and pay less tax, given that income tax has a progressive rate in Canada. The information collected through the tax files has this inevitable “bias” in the measurement of income to reduce tax obligations. At the end of the day it provides an additional tool for farmers that can be used to manage their own risk and maximise income.
168. The additional information demanded by AgriStability is provided with the only objective of converting taxable income into an accrual basis, and to adjust the reference margin. Those are the only determinants of the amount of payments received by the farmer. The information incentives for farmers when completing this additional form are to maximize the stream of payments, which roughly speaking means increasing declared income variability.
169. These set of incentives are potentially inconsistent with each other, and the net impact on the information received is unknown. The negative correlations observed in the micro data from Saskatchewan between income and AgriStability payments (which are lagged) seem to signal that farmers try to smooth their income tax (that includes the lagged AgriStability payments). For this purpose they may increase the declared variability of their income (excluding the payment) by declaring more income when no payments are received, and less income when payments are received. This increases observed variability and therefore the expected stream of payments, but the net effect of these incentives on information biases is very uncertain.
4.3. Policy trade-offs on targeting and alternative approaches
170. Canada has a long experience in developing risk management programs and corresponding databases. Its main focus has been improving targeting to a well defined farm income reduction. The Canadian Government has been very effective and has proved that it is possible to create a sophisticated database for agricultural income risk management policies. However, this has not been done without cost of increased the uncertainty in the amount of the payment and increasing the delays for its calculation. Additionally there is no evidence that moral hazard and adverse selection problems have been resolved.
171. Sophisticated payments based on calculations of income inevitably require time and lags for extracting and processing information; they also inevitably create incentives on business management and information with moral hazard and adverse selection problems that are difficult to overcome. This seems to be an intrinsic feature of government efforts to improve income targeting. But, in fact, these effects reduce the degree of targeting in practice because they imply inaccurate and delayed measurement of the theoretically well-defined target.
172. Table 23 provides some ranking of different risk management measures according to different income targeting criteria. Income stabilization payments like AgriStability have the best score in the definition of the target, but they are not paid in a timely manner and they are subject to strong information asymmetries. Ad hoc payments are rapid, but suffer from a lack of definition of the target and from very strong asymmetric information. Fixed payments like AgriInvest are not targeted to reduced income but can be relatively quick and have few information problems. AgriInsurance has a target definition in term of yields which only imperfectly represents income, but can be paid relatively quickly and some of the adverse selection and moral hazard problems can be partially overcome through the policies and premiums.

TAD/CA/APM/WP(2010)29/FINAL
65
173. Table 23 includes also two other hypothetical types of programs: A tax credit that is triggered to stabilize farm income and a payment based on a “rule of thumb”. The tax credit program would be very similar to AgriStability, but it would not try to go as far in the good definition of the targeted income. It would just use the tax file information to calculate an approximate income, renouncing to any of the two adjustments made by the government. It could be applied in a context of eliminating the option of declaring income on a cash basis. The main advantage of this type of program would be an improvement in the timing and the adverse selection problems and in the transparency and predictability of the payment formula, while reducing the additional information needs.
Table 23. Ranking of risk management policies according to different income targeting criteria
Target definition
Rapidity Asymmetric information
Total Targeting Ranking
Ad hoc ex post payments / AgriRecovery
? 1 6? ?
Income Stabilization payment (AgriStability)
1 6 5 ?
Farm income stabilization Tax credit 2 5 4 ? Payments based on a rule of thumb (Commodity revenue or price)
3 4 2 ?
Crop Insurance AgriInsurance 3 3 3 ? Fixed Payment AgriInvest 5 2 1 ? Administration costs are not analyzed in this table but should be part of the analysis of optimal policies.
174. Finally a general hypothetical program of countercyclical payments based on a “rule of thumb” is proposed. The triggering mechanism and the amount of the payment would be based on prices or yields that may be local, but are not individual. Of course the definition of the target is much weaker and does not represent what really happens with individual farm income. But the payment may be made more quickly and with reduced information requirements compared with a program based on income. The effectiveness of this type of program depends on the correlation between the parameter(s) used as indices and the income on the farm. The higher this correlation, the better targeted this program will be.
175. Targeting to income is not a linear path in which with more effort and resources governments can achieve better targeting. Attempts to perfectly target income lead to increased payment delays and information asymmetries. In this sense, sometimes “more” targeting may not imply “better” targeting due to information constrains. An appropriate level of targeting is found in a balance between the precision in the definition of the income target and the imprecision of measurement and lags. For catastrophic risk, speed should be the priority, while for normal risk this needs not to be the case.
Redefinition of targets
176. The discussion in this section has raised the question of what is the most appropriate target for an income risk management policy. The focus was on business profits (income or margins) rather than on farm household income, following the policy approach in Canada in the last decades. However any fresh look at an appropriate income target would have to take into consideration off-farm income as part of farm risk management strategy. There is a large body of evidence that suggests that off-farm income is part of these strategies at the farm level. A broader definition of farm income is compatible with linking the program more narrowly to the tax files, but would be inconsistent with the idea of countercyclical payments based on a rule of thumb. This is because total farm household income is often un-correlated with agricultural price or production indicators.

TAD/CA/APM/WP(2010)29/FINAL
66
PART III.
POLICY IMPLICATIONS
5. Policy recommendations and concluding remarks
177. Reducing risks faced by producers has been a central objective of Canadian agricultural policy for decades. This longstanding focus through a series of policy reforms has led to a sophisticated and multilayered system that makes unparallel use of information to target risks of all sizes and types using a number of programs whose joint effect is to provide relief for most of the risks faced by producers.
178. Business Risk Management programs in Canada cover all layers of risks; in some cases programs overlap and target the same risk layer. The coverage of the set of programs is so comprehensive that it crowds out farmers’ proactive risk management strategies, even if they are designed to never provide full compensation of losses. Moreover, the individual margin based payment under AgriStability, which is the main component of the BRM programs, faces a major challenge to accurately collect farm income information in a timely manner. AgriStability is designed to provide income support to farmers experiencing low income in a precise way, but the delay of the payment reduces the counter-cyclical benefit of the program. As a result, farmers are more likely to value AgriStability as an income support program than as a risk management tool.
179. The major policy challenge in Canada is to maintain farmers’ incentives to pro-actively develop risk management strategies and improve the targeting policies to income risk. In most cases, this means that the government should do less rather than more, and do it more simply. True targeting of income risk is difficult by the very nature of the problem, and Canada has taken policy design in this area as far as it can go. More information and detail lead to more delay, and more complexity leads to producer uncertainty about the benefits of the program. These problems cannot be resolved by simply doing the current approach better. Canadian governments are already well aware of these limitations and have been doing efforts to overcome them.
5.1. Policy recommendations for Canada
1. Improve the definition of boundaries between programs and layers of risk. AgriStability and AgriInvest cover normal risk. AgriInsurance is designed to equip the farmers to manage middle range to catastrophic risk layers, but AgriStability is also covering the same layers of risks. In addition, AgriRecovery and AgriStability are both covering a catastrophic risk layer. The system is overcrowded and unable to signal risk layers on which farmers should take their own responsibility of management.
a. Keep AgriInvest and allow it to take over part of “Tier 2” coverage. This program does not greatly interfere with farmer decision-making and can help farmers to develop risk management strategies through its incentives to save for the future. The fact that the program is not used in practice for business income stabilization should not be interpreted as a signal that the program does not work as a risk management tool.

TAD/CA/APM/WP(2010)29/FINAL
67
b. Refocus AgriStability on the medium range of risks (non-catastrophic and non-normal risk). “Stabilization” tier 2 coverage of small “normal” risks was seen to be ineffective at reducing risk while at the same time causing the most interference with private risk management strategies. Additionally, AgriStability seems unable to provide a viable response to catastrophic events due to the delay between the income loss and the payment. Tier 4 is therefore not an effective response to large income declines. The main focus of AgriStability could be Tier 3 coverage, which could be reshaped to avoid overlapping with other policies.
c. Address the overlap between AgriStability and AgriInsurance by requiring farmers to choose between them. AgriStability is partly covering the “market” layers of risk and competing with other market strategies including crop yield insurance. The system could be improved by allowing farmers to choose between two alternative programs, AgriStability and AgriInsurance, depending on the risk environment they are exposed to. Producers will reveal their risk preferences enabling better targeting of program benefits and give valuable feedback for program design. The participation fee in AgriStability could be increased appropriately to compete with crop insurance and converted to a premium that can be adapted to the risk of each farm so that the scope for moral hazard is reduced.
d. Clarify the role and purpose of AgriRecovery. Catastrophic assistance under AgriRecovery should be framed within more strict protocols and disciplines that should apply also to all ad hoc payments to farmers. A single ex-ante definition of catastrophic risk for the program should be put in place. The link between AgriRecovery and other programs should be strengthened with a clear definition of the (limited number of) risks that would be covered by AgriRecovery.
2. Empower farmers to take ownership of their own business risk management. Coverage of multiple layers of risk by multiple government programs is expensive, complex, and counter-productive in some cases. More cost-effective options that better serve the needs of producers are unable to develop in the presence of such a large and generous system. Reducing the role of the government in risk management is a first step in allowing pro-active approaches to risk management to emerge. Other things the government could do are:
a. Help establish market instruments. Market mechanisms like options, futures and other hedging mechanisms are effective private risk-management tools. Government can play a role in establishing and supporting the trading of such instruments through addressing missing markets and providing information. Programs such as the Cattle Price Insurance Program in Alberta can help reduce barriers to entry by simplifying access to hedging instruments and reducing transaction costs while keeping farmers´ responsibility to pay the premium.
b. Support diversification strategies. The export-dependence of the sector is a particular problem for prairie agriculture, exposing farmers and ranchers to exchange rate and trade risks. Helping to develop and diversify export markets can help reduce exposure to these risks and contribute to the overall diversification at the farm level. Developing domestic market infrastructure and alternative marketing tools can help producers diversify their operations.
c. Support innovation in the sector. The ability of the Canadian farmer to produce a consistent crop in the face of difficult conditions has improved greatly in the past century,

TAD/CA/APM/WP(2010)29/FINAL
68
thanks to innovations in technologies and practices that reduce the impact of weather variability and the damaging effects of pests and disease. The government will always have a role to play in promoting innovations in the sector, and should redirect resources away from traditional BRM programming towards this area.
3. Improve the delivery mechanism of AgriStability and reconsider its targeting. AgriStability is paid based on the reductions of individual margins, which requires the estimation of individual margin losses. The program attempts to be so precisely targeted to an individual margin loss for the whole farm that it makes sophisticated adjustments into the income tax files requiring additional information provided by the farmer. This adjustment reduces the transparency and effectiveness of the program by causing delays and unpredictability of the payment. The system also provides contradictory incentives for the farmer to reveal the information on their own income loss.
a. Simplify the delivery mechanism of AgriStability and improve the timeliness of payments. AgriStability is targeted to the reductions of individual producer margins, which requires the estimation of individual margin losses with sophisticated adjustments to income tax data using additional information collected from farmers. This complexity reduces the transparency and effectiveness of the program by causing delays, makes the payment unpredictable and creates several incentives to adjust the information provided by the farmer. The trade-off between timeliness and precision must be considered carefully. Linking the tax declaration directly to the AgriStability payment can potentially improve the predictability of the payment. The payment would become a kind of tax credit so the farmer can better infer the amount of the payment and receive it immediately when taxes are paid. Some precision in targeting would be lost, but the performance of the program as an income risk management tool would likely be improved. By requiring participating producers to declare taxes on an accrual basis, the consistency of the business management and information delivery incentives provided by the income tax and the agricultural programs as a whole would be improved.
b. Evaluate the effectiveness and targeting of current policies. The analysis carried out in this paper raises some questions about the counter-cyclical benefit of AgriStabilty, and the wisdom of the overlapping approach to risk taken in the Growing Forward framework. A broad-based and open analysis of the effectiveness of these policies at reducing income variation, drawing upon researchers outside AAFC, could help provoke and support a discussion about current program objectives and the capacity to meet them. There is scope to exploit and analyze the richness of available databases to learn about most appropriate targets for risk management policies, including the links with off-farm income, and to evaluate the existence of asymmetry in income information and the extent to which data collection devices can create incentive to reveal accurate information.
4. Allow more competition in the market for agricultural commodity insurance. AgriInsurance provides an instrument that responds to some catastrophic natural events. However the insurance system is managed by provincial public agencies or ministerial departments. The movement towards specialized insurance agencies in some provinces is a step in the right direction. However the system still suffers from effectively excluding private professional insurers, lacking any competition which reduces incentives for efficient delivery, limited risk pooling across provinces, and limited capacity to evaluate long run sustainability due to government involvement in the management and financing of insurance corporations. Canada should explore possibilities to involve private specialized businesses on crop insurance, including private/public partnerships and information sharing arrangements.

TAD/CA/APM/WP(2010)29/FINAL
69
5.2 Policy lessons beyond Canada
1. Canada’s approach based on historical Olympic average income has proved to be useful to avoid policy impacts on structural adjustment. However this need to be complemented with appropriate disciplines in ad hoc and disaster payments. Another advantage of the Canadian programs is the whole farm approach; this is in line with the holistic approach that account for correlations among risks. However and paradoxically its effectiveness on targeting income risk creates incentives to specialization, which may improve farming returns at the cost of incurring in more risks.
2. A differentiated policy approach is needed to each layer of risks. Characteristics of risk are different in different layers of risks, requiring a differentiated approach to each layer of risk, particularly in terms of the scope of government responsibility. It is inappropriate to cover all risk layers through a single policy framework. The system should send a clear signal that it is the farmer, not the government, who is responsible for managing the normal business risk. However, if the government still wants to support farmers to manage normal risk, it would better provide a stable income support because it has a smaller impact on crowding out of farmer’s own risk management strategies. For catastrophic risks, payments would better be targeted to reduced income (“counter-cyclical” support), while attempting to avoid that the farmers with proactive risk management strategies are penalized.
3. Precise definitions of policy targets may not function as it is designed due to information constraints. The precise policy targeting to income risk requires the government to capture the correct individual income information and timely deliver the payment. However, the experience in Canada shows that this is difficult in practice and subject to trade-offs that cannot be ignored in policy design. The comparison between AgriStability and AgriInvest provides a good example of tradeoffs between a well targeted sophisticated programs and a non-targeted simple program when there are significant information asymmetries.
4. Programs targeted to income are better linked to tax files. Linking the payments to an existing tax file system could allow the government to deliver the payment more quickly and predictably. It may be more incentive compatible so that the farmer may report the farm income information more precisely. Payments based on indexes out of the control of the farm such as commodity revenue or price aggregated at some geographical level (national, regional and local) are not well targeted to individual income risk, but they may have advantages in its quick delivery and avoiding some of the information asymmetries.

TAD/CA/APM/WP(2010)29/FINAL
70
ANNEX 1.
TECHNICAL BACKGROUND NOTE ON THE POLICY SIMULATION IN CANADA
180. The stochastic simulation model in Chapter 3 introduces a set of risk management strategies that are relevant in Canada; namely production diversification and crop yield insurance. In addition, a set of Business Risk Management policies are analyzed for illustrative purposes: AgriInvest, AgriStability and AgriRecovery. The model also analyzes empirically the producer’s participation in the risk market and its impacts on farm welfare. Interactions between different policies and the use of risk market instruments are also investigated. The basis of the model is Expected Utility Theory, but the model are tailored to the risk exposure and strategic environment revealed by the micro data of 457 crop farm in the State of Saskatchewan in Canada.
181. The model analyses a representative farm producing three major crops (wheat, barley and canola) under price, yield uncertainty in addition to the uncertainty in other crop revenue and cost17. The income depends both on the agricultural revenue, and the payments from the government and other risk management strategy. The simulation scenarios determine a set of optimal decisions in the farm; the land allocation and the coverage of crop yield insurance. Since the first order conditions to maximize the expected utility lead to analytical expressions that are difficult to quantify, the analysis depends on Monte-Carlo simulation with an empirically calibrated model. The first step of calibration generates the multivariate empirical distribution of uncertain prices, yields and cost for crop production as well as the revenue from livestock production. The second step introduces a set of risk management strategies that are relevant in each country.
Characteristics of the representative farm
182. The representative farm in Canada is assumed to allocate land among three crops (wheat, barley and canola) and other residual crops. The initial wealth that is necessary to compute the farm welfare is computed as the average net worth of grain and oilseed farms in Saskatchewan in 2008. Table A.1 presents the initial allocation of land and the initial wealth in Canada. The representative crop farm is assumed to be risk averse and the coefficient of constant relative risk aversion of 2 is applied to all of our simulations.
Table A.1. Initial allocation of land
Wheat 52.0Barley 7.3Canola 2.1Other crops 38.6
1467
Initi
al
allo
catio
n of
land
(%)
Initial wealth per hectare (CAD)
17. A “representative” farm means representative in the sample of 457 farms, which is not necessarily
representative of the Canadian crop farms as a whole.

TAD/CA/APM/WP(2010)29/FINAL
71
Monte-Carlo simulation
183. In order to model a farm producing multiple crops under price, yield, revenue and cost uncertainty, the joint distribution of prices and yields of three major crops, revenue of other crops, and variable costs was constructed based on the observed distributional information in the farm level data. This distribution is used for Monte Carlo analysis because the number of observations in the price and yield data series is too small. The simulation in Canada assumed a truncated normal distribution. The mean and standard deviation of these variables are selected as an average among the sample in Canada (Table A.2). The distributions are truncated so that it does not generate the values that are higher or lower than the value observed at the sample data. The truncated points are selected as maximum and minimum value of the sample data.
Table A.2. Parameters of the distribution of price, yield revenue and costs
Wheat Barley Canola Wheat Barley CanolaMean 134.3 99.1 296.5 0.7 0.8 0.5 96.5 144.1StDev 77.0 20.2 43.6 0.2 0.1 0.1 60.2 56.9CV 57.3 20.4 14.7 29.1 18.1 24.2 62.4 39.5Min 20.0 20.0 117.0 0.0 0.0 0.0 5.0 20.0Max 380.0 215.0 445.0 2.0 2.0 1.7 750.0 800.0
Yield (tonne per hectare) Variable costs
Revenue from other crops
Price (CAD per tonne)
184. In addition, the joint distribution of all the uncertain variables is calibrated, using the average mean correlation across farms (Table A.3). Based on the joint distribution, the Monte-Carlo simulation draws 1 000 combinations of price, yield, revenue and variable cost.
Table A.3. Observed correlation of prices, yields revenue and costs in Canada: Average across sample farms
Wheat Barley Canola Wheat Barley CanolaPrice Wheat 1 0.59 0.66 -0.06 0.10 -0.05 0.24 0.33
Barley 1 0.34 -0.07 -0.16 -0.08 0.15 0.39Canola 1 0.01 -0.10 0.03 0.24 0.08
Yield Wheat 1 0.42 0.11 -0.08 -0.04Barley 1 0.13 0.09 0.05Canola 1 -0.07 0.03
1 0.33
Variable costs 1
Price Yield Revenue from other crops
Variable costs
Revenue from other crops
Stochastic simulation model
185. The model adopts the power utility function which assumes constant relative risk aversion (CRRA). The advantage of the model is that it treats farmers’ risk management strategies as endogenous, allowing the interaction between policies and farmer’s decision to be analysed.
(1)
TAD/CA/APM/WP(2010)29/FINAL
72
where the utility (U) depends on the uncertain farm profit and initial wealth; stands for the degree of constant relative risk aversion (CRRA).
186. The uncertain margin ( is defined as the crop revenue less variable cost for crop production plus net transfer or benefit from a given risk management strategy. Since the crop specific cost data is not available in the data, the uncertain variable cost (c~ ) is not crop specific. However, the crop specific production cost adjustment factor ( ic ) is calibrated for each crop so that the initial land allocation becomes the optimum.18 The model assumes that total land input is fixed and is allocated between wheat, barley, canola and other crops. Given the Monte-Carlo draw of 1 000 price, yield, revenue and variable cost combinations, the model maximizes the expected utility with respect to area of land allocated to each crop and the level of insurance coverage.
(2) ),~,~(~)(*]*)~*~[(~ 3
1
λπ iiii
iiii qpgcLLORLcqp +−−+−= ∑∑=
where:
ip~ uncertain output price of crop i uncertain yield of crop i c~ uncertain variable cost
ic cost adjustment factor of crop i
iL area of land allocated to crop i and OR revenue from other crops g transfer from government or benefit from risk market instruments λ level of insurance coverage decided by farmer
187. Given the expected utility calculated in the optimization model, certainty equivalent farm income is used to compute the farmer’s welfare for a given level of risk aversion.
(3) ωωπρ ρ −+−= − )1/(1)]~()1[( EUCE
ω initial wealth of the farmer
Calibration of risk management strategies
Crop diversification
188. Since the specification of crop production is neutral to the farm size in this model, the representative farm is assumed to cultivate fixed area of farmland and allocate land between available crop and livestock in each country. Although farmer tends to rotate crop due to the biological reason, the model assumes no limit on the scope of the crop diversification. The degree of crop diversification is represented by the coefficient of variation of market revenue per hectare. A higher coefficient of variation of crop revenue is used as indicator of less use of crop diversification strategies and built on a lower diversification index. If the farmer uses less diversification strategy and specializes in a specific crop, the diversification index declines because the farmer allocates more land to crops that generate a higher return with higher
18. Initial state is calibrated in case all the Business Risk Management programs are available for the farmer.
Per hectare cost adjustment factors of wheat, barley, canola and other crops are CAD -6.42, -25.14, 36.0 and 4.01, respectively.

TAD/CA/APM/WP(2010)29/FINAL
73
variability. The initial value of diversification index is set as 100 and the change of the diversification index is expressed as -1 times the percentage change in the coefficient of variation of market return.
Calibration of Business Risk Management programs in Canada
AgriInsurance program
189. The benefit from crop yield insurance strategy 1g is the net of an indemnity receipt and insurance premium payment. The indemnity is paid in case the crop yield turns out to be below the insured level of yield ( hiq q*β ) and the payment is determined by the area of land that the farmer insures ( IiL ).To avoid moral hazard and adverse selection effects (e.g. increase the historical yield to receive indemnities in the future), the model assumes the perfect insurance market so that risk neutral insurance companies offer crop insurance contact at the price equal to the expected value (fair insurance premium) without administrative cost and government subsidy. The insured level of yield is set as 95% of historical average yield for all the commodities in line with OECD (2005). It is also assumed that producers cannot insure more area than the one they plant. The forward price applied to calculate the insurance premium is set at 5% lower than the expected price.
190. In this framework, the level of subsidy is embedded in the percentage administration cost (γ ).The model assumes that the administration cost of crop yield insurance is 30% of the fair insurance premium in the absence of subsidy and the actual net of administration cost and subsidy to insurance premium is 1.5% of the fair insurance premium. If γ takes negative value, the farmer by definition insures all the land in the model. The model does not allow positive transfer of income through subsidy to insurance premium. However, farmer faces other types of costs associated with the use of crop yield insurance and may not insure crop yield risk fully even though the administrative costs are fully covered by the government. The modelling of AgriInsurance program in Canada is rather generic and does not necessarily reflect the policy parameters of the actual program. The simulation results on AgriInsurance program remains to be illustrative.
)~
,0([****)1()~
,0(*** 111hi
iqiihif
hi
iqiihfi q
qMaxELqp
MaxLqpg −+−−= ∑ βγβ
Indemnity receipt Insurance premium payment
fip forward price of commodity i
IiL area of land for commodity i which farmer insures its yield
hiq historical average yield of commodity i
qiβ proportion of yield insured for commodity i γ net of administration cost of insurance and subsidy to insurance premium
AgriStability program
191. AgriStability is a margin based program in which the government covers some at a fixed part of margin loss below the reference level. The margin is calculated as the revenue from all crop production less variable costs. The reference margin is set at the expected level of margin in the Monte Carlo simulation. Since the hypothetical farmer has a positive reference margin, the program also covers 60% of the negative margin. The model is designed to estimate the impact of marginal change and not suitable to
TAD/CA/APM/WP(2010)29/FINAL
74
estimate the full impact of AgriStability program. Therefore, the amount of payment is reduced to a quarter of the calculated payment to avoid the corner solution. The simulation result should be interpreted with care in the sense that it illustrates the direction of the impacts.
192. Since the stochastic simulation model is a static model, the farmer receives the payment from the AgriStability program simultaneously. This is the case that the payment is delivered without delay. However, the payment is likely to be delayed for one to two years. Although the modelling structure does not allow the simulation of payment delay, a random noise to the payment is introduced to estimate the impact of uncertainty in payment. The random noise is calculated based on the simulation conducted to estimate the impact of payment delay (Table 20). More specifically, the random noise is calibrated for the representative farm based on the empirical distribution of the difference between the case that the payment is made without delay and one year delay in the simulation in Table A.4.
Table A.4. Characteristics of random shock
Mean Standard Dev. Max Min
0 14.49 35.22 -31.97
AgriInvest program
193. AgriInvest program is modelled as a lump sum transfer of 1.35% of crop revenue. In line with AgriStability and AgriRecovery program, the amount of AgriInvest payment is set as a quarter of the calculated payment (CAD 0.59 per hectare) in order to be comparable with the impacts of AgriStability program.
AgriRecovery program
194. AgriRecovery program is triggered by the catastrophic natural disaster. The model assumes that the farmer receives AgriRecovery payment if wheat, barley and canola crop yields are all below 30 percentile thresholds (0.566 tonne for wheat, 0.692 tonne for barley and 0.40 tonne for canola).Since there is no empirical data of ad-hoc program payments in the sample data, it is assumed that the ad-hoc program payment consists of a half of non-CAIS payments in the dataset. The level of the payment is set as a quarter of the estimated level of AgriRecovery program (CAD 20 per hectare) in line with the AgriStability and AgriInvest programs. The simulated probability of receiving the AgriRecovery payment is 5.6% and the expected payment is CAD 1.12 per hectare.
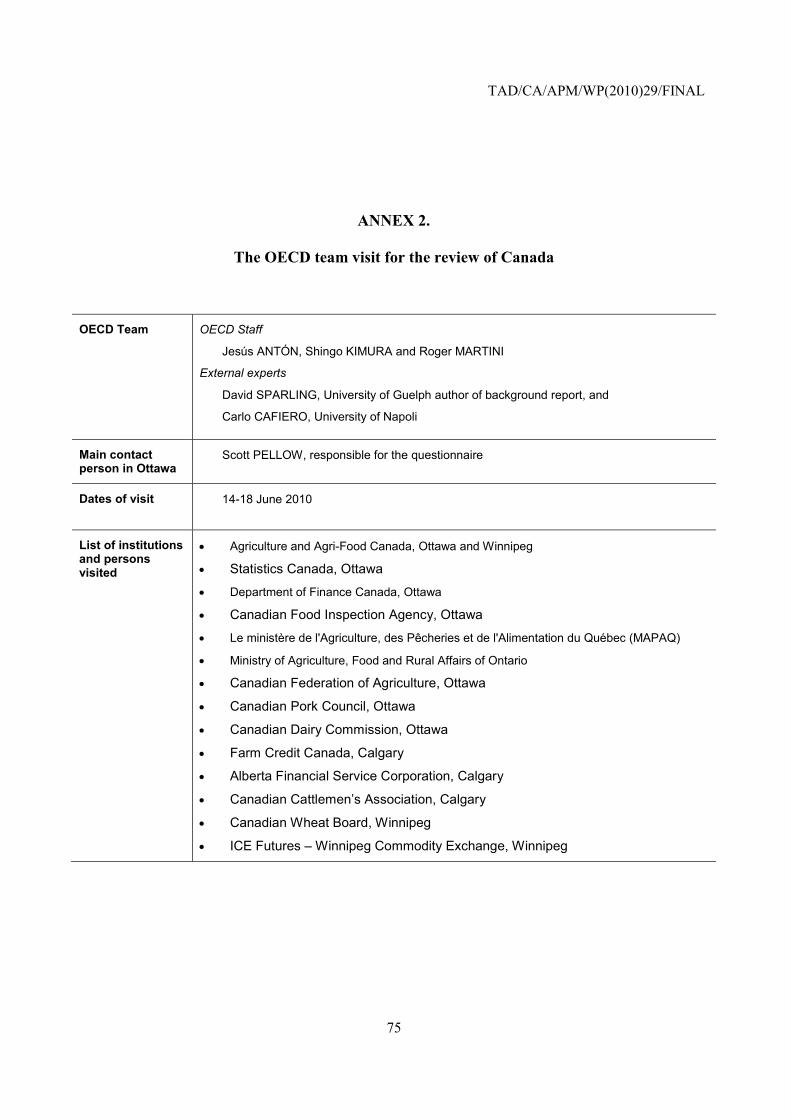
TAD/CA/APM/WP(2010)29/FINAL
75
ANNEX 2.
The OECD team visit for the review of Canada
OECD Team OECD Staff
Jesús ANTÓN, Shingo KIMURA and Roger MARTINI
External experts
David SPARLING, University of Guelph author of background report, and
Carlo CAFIERO, University of Napoli
Main contact person in Ottawa
Scott PELLOW, responsible for the questionnaire
Dates of visit 14-18 June 2010
List of institutions and persons visited
• Agriculture and Agri-Food Canada, Ottawa and Winnipeg
• Statistics Canada, Ottawa
• Department of Finance Canada, Ottawa
• Canadian Food Inspection Agency, Ottawa
• Le ministère de l'Agriculture, des Pêcheries et de l'Alimentation du Québec (MAPAQ)
• Ministry of Agriculture, Food and Rural Affairs of Ontario
• Canadian Federation of Agriculture, Ottawa
• Canadian Pork Council, Ottawa
• Canadian Dairy Commission, Ottawa
• Farm Credit Canada, Calgary
• Alberta Financial Service Corporation, Calgary
• Canadian Cattlemen’s Association, Calgary
• Canadian Wheat Board, Winnipeg
• ICE Futures – Winnipeg Commodity Exchange, Winnipeg

TAD/CA/APM/WP(2010)29/FINAL
76
REFERENCES
AAFC (1998): “Adapting to change and managing risk: A profile of Canadian Farmer Attitudes and Behavior”. Report prepared by Agnus Reid Group for Agriculture and Agri-Food Canada.
Agriculture and Agri-Food Canada (2006): Next Generation of Agriculture and Agri-Food Policy. Economic Backgrounder: Canadian business risk management programs. December 2006
Agriculture and Agri-Food Canada, An Overview of the Canadian Agriculture and Agri-food System, 2007.
Agriculture and Agri-Food Canada, Financial situation and performance of Canadian farms, Farm data analysis unit, May 2009. http://ageconsearch.umn.edu/bitstream/53769/2/situation_e.pdf
Agriculture and Agri-Food Canada, Profile of Production Trends and Environmental Issues in Canada's Agriculture and Agri-food Sector, 2009 http://www4.agr.gc.ca/resources/prod/doc/policy/environment/pdfs/sds/profil_e.pdf
Angus Reid Group, Adapting to Change and Managing Risk: A Profile of Canadian Farmer Attitudes and Behaviour, Report prepared for Agriculture and Agri-food Canada, July 1998.
Auditor General of Canada (2007) Chapter 4 of the 2007 Report of the Auditor General – Review of the Canadian Agricultural Income Stabilization—Agriculture and Agri-Food Canada downloaded from http://www.oag-bvg.gc.ca/internet/English/osh_20080401_e_30310.html June 2010.
Bakhshi S. and R. Gray (2010) Is There Supply Distortion in Decoupled Payments? Evidence from the Canadian Prairies. Presentation at the AAEA-CAES-WAEA Joint Annual Meeting, Denver, July 26.
Barichello, Rick and Kurt Klein (2005) Capitalization in Canadian Agriculture: Understanding the Issues and the Evidence, report to the Canadian Agricultural Policy Institute downloaded from http://www.capi-icpa.ca/archives/pdfs/PapID13_%20RBarichello.pdf May 2010.
Boland, Mike. Mike Boland (2010) Fertilizer price volatility and it impact on producers. Agricultural Marketing Resource Center, Kansas State University. Downloaded from http://www.agmrc.org/renewable_energy/biofuelsbiorefining_general/fertilizer_price_volatility_and_its_impact_on_producers.cfm May 2010.
Bowes, V.A., After the Outbreak: How the British Columbia Commercial Poultry Industry Recovered After H7N3 HPAI. Avian Diseases: Vol. 51, No. s1, pp. 313–316
Cameron, D. L. and J. Spriggs (1991). International effects of Canada’s western grain stabilization program. Western Journal of Agricultural Economics 16 (2): 435–45.
Canada disaster statistics, Prevention Web, http://www.preventionweb.net/english/countries/statistics/?cid=31
Canada info online. http://www.craigmarlatt.com/canada/index.html#home; http://canadaonline.about.com/od/statistics/a/statsagr.htm
Canada Year book, 2009
Canadian Grains Commission. May 2010. Soybean weather and production review – from http://www.grainscanada.gc.ca/soybeans-soja/harvest-recolte/2009/hqso09-qrso09-3-eng.htm
Co-operatives in Canada (Situation - 2005) http://www.coop.gc.ca/COOP/display-afficher.do?id=1260822374366&lang=eng)

TAD/CA/APM/WP(2010)29/FINAL
77
DePape, John and Serecon Management Consulting Inc. (2006) Phase 1 Summary Report – Improving the Fundamentals of Canola Price Risk Management in Western Canada. Downloaded from http://www.canolagrowers.ca/LinkClick.aspx?fileticket=JkGKHQORiw0%3d&tabid=63, May 2010
Doan (2005) North American Market Integration. Downloaded from http://naamic.tamu.edu/cancun/north_american_agrifood_market_integration.pdf April 2010.
Doyon, M. (2002) An Overview of the Evolution of Agricultural Cooperatives in Québec. Canadian Journal of Agricultural Economics 50 (2002) 497–509
Export report - from http://www.grainscanada.gc.ca/statistics-statistiques/cge-ecg/annual/exports-08-09-eng.pdf
Farm Credit Corporation. (2010) Spring 2010 Farmland Values Report. Downloaded from http://www.fcc-fac.ca/en/products/property/flv/spring2010/index.asp#nationaltrend May 2010.
Fox, Q. D. Bilodeau, D. Guennette and T. Gracie (2009) Networks iin Agricultural Co-operative Networks in Canada. Downloaded from http://www.coopscanada.coop/public_html/assets/firefly/files/files/pdfs/Research/Microsoft_Word_-_Ag_Coop_Networks_fmt_final.pdf
Fulton, M. and B. Heuth. (2009) Cooperative Conversions, Failures and Restructurings:An Overview. Journal of Co-operatives, Volume 23, 2009 Pages i-xi.
Gray, K. (2010) I think that’s a good price – Marketing canola from a farmer’s perspective. Presentation to the 2010 Canadian Agricultural Economics Association Workshop on Risk Management, Vancouver, May 2010 and personal communication.
http://oee.nrcan.gc.ca/residentiel/entreprises/energystar/achats/images/climate-zones-map.jpg
http://www4.agr.gc.ca/AAFC-AAC/display-afficher.do?id=1234381202793&lang=eng
http://www4.agr.gc.ca/resources/prod/doc/pol/pub/sys/pdf/sys_2007_e.pdf
ICE Futures Canada (2010) Futures and Options Historical Reports. Downloaded from https://www.theice.com/marketdata/reports/ReportCenter.shtml?reportId=6&productId=1092&hubId=1051 May 2010.
Jetté-Nantel, Simon, David Freshwater, Martin Beaulieu and Ani Katchova (2010): “Farm Income Variability and Off-Farm Diversification among Canadian Farm Operators”.
Klein, K. and D. Le Roy (2010) BSE in Canada: Were the economic losses to the beef industry covered by government compensation? Canadian Public Policy, Volume 36, Number 2, June 2010, pp. 227-240.
Meyer, Stephen.(2008) Market Preview: Canada Launches Culling Program. The Pigsite Market Preview, March Downloaded from http://www.thepigsite.com/swinenews/17213/market-preview-canada-launches-culling-program May 2010.
Miranda, M. J., F. Novak and M. Lerohl (1994). Acreage response under Canada’s western grains stabilization program. American Journal of Agricultural Economics 76 (2): 270–76.
Mitura, V. & Trant, M, Canadian agriculture: a tough year in review, in Vista on the agri-food industry and the farm community, catalogue nb. 21-004-XIE, June 2006. http://www.statcan.gc.ca/pub/21-004-x/21-004-x2006002-eng.pdf
Mitura, V., Di Pietro, L. Canada’s beef cattle sector and impact of BSE on farm family income 2000-2003. Statistics Canada – Agriculture Division. Catalogue no. 21-601-MIE
Montpetit, É. and W. Coleman (1999) Policy Communities and Policy Divergence in Canada: Agro-Environmental Policy Development in Quebec and Ontario. Canadian Journal of Political Science, Vol. 32, No. 4 (Dec., 1999), pp. 691-714.
National agro-climate information service, Power point presentation www.drought.gov/imageserver/NIDIS/workshops/.../Hadwen_NAIS.ppt
Natural Resources Canada, Climate Change Impacts and Adaptation: A Canadian Perspective report, Climate Change Impacts and Adaptation Division, http://adaptation.nrcan.gc.ca/perspective/agri_3_e.php

TAD/CA/APM/WP(2010)29/FINAL
78
Natural Resources Canada, Office of Energy Efficiency, Climate zones.
OECD (2009): “Managing Risk in Agriculture: A Holistic Approach”. www.oecd.org/agriculture/policies/risk.
OECD (2010): “Farm level analysis of risk and risk management strategies and policies”. OECD Food, Agriculture and Fisheries Working Papers No. 26.
Robson, W. and C. Busby (2010) Freeing Up Food: The Ongoing Cost, and Potential Reform, of Supply Management CD Howe Institute report downloaded from http://papers.ssrn.com/sol3/papers.cfm?abstract_id=1590437 May 2010.
Royer, Annie. (2008) The Emergence of Agricultural Marketing Boards Revisited: A Case Study in Canada. Canadian Journal of Agricultural Economics 56 509–522.
Schaufele, B., Z. Komirenko, J. R. Unterschultz. (2009) Cow-Calf Producers Need to Blame Exchange Rates, Not Bovine Spongiform Encephalopathy, for Lost Wealth. Journal of Toxicology and Environmental Health, Part A, 72: 1086–1091, 2009.
Schaufele, B., J. R. Unterschultz and T. Nilsson (2010): “AgriStability with Catastrophic Price Risk for Cow-Calf Producers”. Canadian Journal of Agricultural Economics 58 (2010) 361-380.
Schmitz A., H. Furtan, and T. G. Schmitz. 2009. Agricultural Policy: High Commodity and Input Prices downloaded from http://ageconsearch.umn.edu/bitstream/49862/2/schmitz%20-%20april%202009.pdf June 2010.
Schmitz, A. (2008) Canadian Agricultural Programs and Policy in Transition. Canadian Journal of Agricultural Economics. 56, 4: 371-391.
Skogstad, G. (2008), Canadian Agricultural Programs and Paradigms: The Influence of International Trade Agreements and Domestic Factors. Canadian Journal of Agricultural Economics 56 (2008) 493-507.
Smit, Barry and Mark Skinner (2002) Adaptation Options In Agriculture To Climate Change: A Typology. Mitigation and Adaptation Strategies for Global Change 7: 85–114, 2002.
Sparling, D. (2010): “Background report on risk management in Canadian agriculture”. OECD Thematic Review on Risk Management in Agriculture. Unpublished internal report.
Sparling, D. and J. Caswell (2005), Risking Market Integration without Regulatory Integration: The Case of NAFTA and BSE. Review of Agricultural Economics—Volume 28, Number 2—Pages 212–228.
Sparling, D. and J. Caswell (2006) A NAFTA Approach to Animal Health and Biosecurity: Pipedream or Possibility. in North American Agrifood Integration: Situation and Perspectives.
Sparling, D., P. Laughland, B. Shaufele and L. Li (2010) An Analysis of Canadian Farm Incomes. Richard Ivey School of Business working paper.
Stanbury, W.T. (2002) The Politics of Milk in Canada. Fraser Institute report downloaded from http://www.fraserinstitute.org/Commerce.Web/product_files/Milk.pdf May 2010
Statistics Canada (2009) Direct Payments to Agriculture Producers. November 2009. Catalogue no. 21-015-X.
Statistics Canada (2009) Farm Income, Financial Conditions and Government Assistance Data Book, April 2009 Update.
Statistics Canada, Census of agriculture 2006.( http://www.statcan.gc.ca/ca-ra2006/index-eng.htm)
Statistics Canada, Human activity and the environment: annual statistics, 2009. (http://www.statcan.gc.ca/pub/16-201-x/16-201-x2009000-eng.pdf)
Statistics Canada, Selected Historical Data from the Census of Agriculture, 2007.
The Strategic Council (2010) Business Risk Management Survey For Performance Indicators, page 22.
Thibodeau, D. and Clark J.S. (2009) Government support, transfer efficiency, and moral hazard within heterogeneous regions in Canadian Agriculture downloaded from http://www.prairieswine.com/database/pdf/39397.pdf June 2010.

TAD/CA/APM/WP(2010)29/FINAL
79
Turvey, C. (2010) Whole Farm Income Insurance in a Canadian Context. Paper presented at the Agricultural & Applied Economics Association’s 2010 AAEA, CAES & WAEA Joint Annual Meeting, Denver, Colorado, July 25-27, 2010.
Turvey, C., K. Meilke, A. Weersink, S. Clark, K. Klein and R. Sarker (Research Associate) (1995) Measuring The Capitalization Of Income Transfer Programs Into Agricultural Asset Values downloaded from http://www4.agr.gc.ca/resources/prod/doc/pol/pdf/capitalization_e.pdf May 2010.
Unterschultz, J. (2001) Managing Market Risk in Western Canadian Agriculture. Canadian Journal of Agricultural Economics. 48:527-537
Weerahewa, J., K. Meilke, R.. Vyn and Z. Haq (2008) The Determinants Of Farmland Values In Canada. Catprn Working Paper 2008-03 downloaded from http://ageconsearch.umn.edu/bitstream/43461/2/CATPRN%20Working%20Paper%202008-3%20Weerahewa.pdf May 2010.
Wheaton, E., V. Wittrock, S. Kulshreshtha, G. Koshida, C. Grant, A. Chipanshi, B. Bonsal (2005): “Lessons Learned from the Canadian Drought Years of 2001 and 2002: Synthesis Report For Agriculture and Agri-Food Canada with the rest of the Canadian Drought Study Steering Committee,P. Adkins, G. Bell, G. Brown, A. Howard, R. MacGregor SRC Publication No. 11602-46E03January, 2005
Wikipedia Canada, weather zones. http://wiki.answers.com/Q/What_are_the_climate_zones_in_CanadaStatistics Canada (2009): “Human activity and the environment”
Wipf, K. (2007) The Prairie Divide: Contemporary Agricultural Policy-Making in Western Canada downloaded from http://www.cpsa-acsp.ca/papers-2007/Wipf.pdf June 2010.
Wipf, K. (2008) Contemporary Farm Income Support Policy in Canada: The Case of Prairie Agriculture since 1996. Canadian Journal of Agricultural Economics, Volume 56, Issue 4 (p 473-491).
Wipf, Kevin (2009) Path Dependence and Policy Feedback: Understanding Reform in the Western Canadian Grains Sector, Canadian Political Science Association Annual Meeting, Ottawa Ontario, May 27, 2009. downloaded from http://www.cpsa-acsp.ca/papers-2009/Wipf.pdf June 2010.