tackling uncertainty for the development of efficient
TRANSCRIPT

HAL Id: hal-02166833https://hal-enac.archives-ouvertes.fr/hal-02166833
Submitted on 24 Oct 2019
HAL is a multi-disciplinary open accessarchive for the deposit and dissemination of sci-entific research documents, whether they are pub-lished or not. The documents may come fromteaching and research institutions in France orabroad, or from public or private research centers.
L’archive ouverte pluridisciplinaire HAL, estdestinée au dépôt et à la diffusion de documentsscientifiques de niveau recherche, publiés ou non,émanant des établissements d’enseignement et derecherche français ou étrangers, des laboratoirespublics ou privés.
Tackling Uncertainty for the Development of EfficientDecision Support System in Air Traffic ManagementPaolo Maria Scala, Miguel Antonio Mujica Mota, Ji Ma, Daniel Delahaye
To cite this version:Paolo Maria Scala, Miguel Antonio Mujica Mota, Ji Ma, Daniel Delahaye. Tackling Uncertainty for theDevelopment of Efficient Decision Support System in Air Traffic Management. IEEE Transactions onIntelligent Transportation Systems, IEEE, 2020, 21 (8), pp. 3233-3246. �10.1109/TITS.2019.2924981�.�hal-02166833�

> REPLACE THIS LINE WITH YOUR PAPER IDENTIFICATION NUMBER (DOUBLE-CLICK HERE TO EDIT) <
1
Abstract— Airport capacity has become a constraint in
the air transportation networks, due to the growth of air traffic demand and the lack of resources able to accommodate this demand. This paper presents the algorithmic implementations of a decision support system for making a more efficient use of the airspace and ground capacity. The system would be able to provide support for air traffic controllers in handling large amount of flights while reducing to a minimum the potential conflicts. In this framework, airspace together with ground airport operations are considered. Conflicts are defined as separation minima violation between aircraft for what concerns airspace and runways, and as capacity overloads for taxiway network and terminals. The methodology proposed in this work consists of an iterative approach that couples optimization and simulation to find solutions that are resilient to perturbations due to the uncertainty present in different phases of the arrival and departure process. An optimization model was employed to find a (sub)optimal solution while a discrete event-based simulation model evaluated the objective function. By coupling simulation with optimization, we generate more robust solutions resilient to variability in the operations, this is supported by a case study of Paris Charles de Gaulle Airport.
Index Terms—Airport, Airspace, Optimization, Simulation, Uncertainty.
I. INTRODUCTION ANY airports nowadays are on the edge of their capacity. The main reason can be found in the constant growth of
the air traffic and the many constraints that hinder airport expansion. Environmental restrictions and land use limitations
February 2018. P. Scala is with the Aviation Academy of the Amsterdam University of
Applied Sciences, 1097DZ Weesperzijde 190, Amsterdam, The Netherlands (e-mail: [email protected]).
M. Mujica is with the Aviation Academy of the Amsterdam University of Applied Sciences, 1097DZ Weesperzijde 190, Amsterdam, The Netherlands (e-mail: [email protected]).
J. Ma is with the Ecole Nationale de l’Aviation Civile, 7 Avenue E. Belin, 35100 Toulouse Cedex, France (email: [email protected]).
D. Delahaye is with the Ecole Nationale de l’Aviation Civile, 7 Avenue E. Belin, 35100 Toulouse Cedex, France (email: [email protected]).
are the main constraints for airport expansion. Air traffic growth rate for the next 20 years is forecasted as 4.4% [1], this calls out for extra capacity in airports to accommodate the future traffic. Moreover, this growth requires solutions in the short-term horizon rather than the long-term one. Short-term solutions focus normally in improving airport operational efficiency. This improvement will result in an increase of the airport throughput and will reduce delays which is one of the most common indicator of inefficiencies.
The focus of this study is on air traffic management operations in the vicinity of airports, where airside and airspace operations are tackled in an integrated fashion. Airside operations are defined as operations carried out by aircraft that involve ground components like runways, taxiways and gates. Airspace operations are defined as those carried out by aircraft in the terminal manoeuvring area (TMA), a portion of the airspace which surrounds airports. In the literature regarding this research area, it is possible to find several studies about the improvement of these operations. In some cases researchers focused on individual operations [2], [3], while other focused on the integration of them [4]. In this context, many analytical models have been developed and applied to real case studies.
The problem studied in this work aims at providing an efficient decision support system (DSS) for managing the traffic and capacity of an airport. The objective is to avoid any type of conflict (e.g. separation minima violations, runway, taxiway, terminal capacity violations), and harmonize the sequence of arrivals and departures. Such a problem is defined by the authors as extended conflict detection and resolution (ECD&R), which is an extension of the air traffic conflict detection and resolution (CD&R) problem [5] considering also ground operations such as runways, taxiway and terminals operations. The main issue of most of the models about airport operations present in literature is that they do not consider the variability of real the system. Therefore, when solutions are applied to real conditions, they are very rigid and can become unfeasible due to disturbances of the real system. With the objective of making the solutions more resilient and applicable, the uncertainty coming from real-world conditions is considered in this approach. To this end, simulation techniques have been incorporated in the optimization algorithm to include the inherent variability of the real traffic. The purpose of the problem is to generate solutions which are
Tackling Uncertainty for the Development of Efficient Decision Support System in Air Traffic
Management Paolo Scala, Miguel Mujica, Ji Ma, and Daniel Delahaye
M

> REPLACE THIS LINE WITH YOUR PAPER IDENTIFICATION NUMBER (DOUBLE-CLICK HERE TO EDIT) <
2
more resilient to perturbations due to uncertainty. The remaining of the paper is organized as follows: in
section Ⅱ a literature review about optimization and simulation techniques applied to aviation-related problems is given, in section Ⅲ the problem tackled by this study is described. Section Ⅳ describes the methodology proposed in this study explaining the architecture of optimization and simulation and how it is applied for the specific problem. In section Ⅴ the implementation of the methodology on a real case study is presented. Conclusions and future work are presented in section Ⅵ.
II. LITERATURE REVIEW This section presents a literature review about various
techniques that include the use of optimization, simulation and a combination of the two, for problems that involve air traffic management operations at airports.
A. Optimization techniques In the literature, one can find approaches that integrate
arrival, departure and surface management as presented in [6]. In this work, it was implemented an optimization algorithm for solving in a sequential way the aircraft ground routing, arrival and departure sequencing, and conflict resolution problems. The ground aircraft routing problem was solved applying a shortest route algorithm, the arrival and departure schedule were solved with a time indexed formulation and the conflict resolution with a linear program model. The algorithm was tested with a real case study, achieving general improvements in surface performance indicators such as taxi times and punctuality. In [7], near-terminal airspace and airside operations were unified in a two phase approach where, at the beginning, runway configuration selection and runway sequence problems were solved, and then, gate holding and ground routing decisions were made for airside operations. A binary optimization model was developed and results showed reductions in delays, fuel use and emissions. In [8], airspace aircraft sequencing operations were integrated with airport ground operations at a macroscopic level. In this work, taxiways and terminals were modelled in low detail, considering them as nodes of a network characterized only by their capacity. The problem was solved by a heuristic employing a sliding window approach. The model was tested with a real case study and results showed the capability of reaching a conflict-free scenario for the sequencing of aircraft while mitigating ground congestion. In [4] departure process management integrated with ground routing problem was proposed, with the aim of increasing runway efficiency and reducing taxi times. A mixed integer problem was formulated for both runway sequencing problem and ground routing problem. A sequential heuristic to solve both problems was employed. The methodology was able to provide high quality results in terms of completion times and taxi time while achieving short computational time. In all the work mentioned in this section, the solutions generated were based on optimization models using deterministic values, this represents a drawback since they will not be able to perform well in a
real world scenario. In this work this drawback has been overcome by coupling simulation techniques to an optimization model. Furthermore, a limitation found in [7], is linked to the fact that the operations were modeled in a deterministic way, by not addressing the uncertainty related to these kinds of operations. In this work, in order to overcome this limitation, we included different sources of uncertainty by coupling optimization techniques with simulation techniques. In the present work the optimization part is based on [8], while and the simulation is based on discrete event simulation (DES) model where stochasticity is included to represent uncertainty from the real world.
B. Simulation techniques Simulation is a technique widely used for many different
types of problems in different fields. Its use is supported by the fact that it allows to include the variability and causality of real processes replicating with high detail the evolution of real systems. Simulation has been traditionally used for what-if analysis and the modeling of facilities during their planning phase or for infrastructures that are difficult or too expensive to experiment with in real life, like manufacturing plants, sea ports, airports or supply chain systems. In recent years, due to its capabilities for including variability and different abstraction levels, scientific community has done extensive research in techniques that couple simulation techniques with optimization ones with good results [9]. Within the air transportation framework, simulation has been widely used for many different types of operations involving airspace, airport airside and terminals. In [10] an extensive survey on the existing airport simulators at the time is presented. Although it is quite outdated, the main software that are described still exist, and they are still utilized to date. In this survey, it was made a classification between the airport models in macroscopic, mesoscopic and microscopic based on the level of detail and their purpose (strategical, tactical and operational). The most relevant airport software presented in the survey are SIMMOD [11] and RAMS [12], developed by the FAA and EUROCONTROL, respectively. SIMMOD is able to simulate airspace and airfield operations at airports, it also considers disruptive events, human activities as well as advanced operating concepts among other features. RAMS is a fast-time simulation software that focuses on airspace operations with the objective to quantify performance benefit for air traffic management (ATM) decision support. The majority of these programs are based on discrete event simulation paradigm [13], in which the state of the system changes based on specific event that are not time dependent. In [14] was made an evaluation of SIMMOD simulation software for developing a model of the ground operations at Boston Logan Airport. The purpose of their study was to develop a model to be employed as a support decision tool for short term planning, where short-term planning considers operations that needs to be planned after alterations made by gate management or small disruptions. In [15], SIMMOD was used as a tool to make an analysis of a closely spaced parallel runway, several scenarios were built based on the runway

> REPLACE THIS LINE WITH YOUR PAPER IDENTIFICATION NUMBER (DOUBLE-CLICK HERE TO EDIT) <
3
configurations assessing the overall performance according to delay and runway departure queue values. Beside simulation software used for specific purposes like SIMMOD and RAMS, there are also other types of simulation programs that for general purpose, that can be used for different application in different fields. These simulation software allow analysts to be more flexible when building the logic of the system, contrary to specific simulation software, where analysts are restricted to use the predefined objects and logic. In [16] a DES model for the evaluation of the integrated operations of both airspace and airside was proposed, by combining four different modules, each of them representing a specific operation (airspace aircraft sequencing, turn around, taxiway routing, runway movements). In this way an analysis of the airport performance from a holistic view was realized, identifying potential problems that might affect the capacity of the airport. This approach allows to run each module as a stand-alone model for conducting a more specific analysis, narrowing the area of interest to a specific area of the airport. This simulation model was developed with a general purpose simulation software called SIMIO [17]. SIMIO, like other general purpose simulation software present on the market, provides an extendable library of objects useful for modeling a wide range of dynamic systems. This program is used in the current study of the paper. In this work, a simulation model was developed, similarly as [16], however, in [16], the conflict detection and resolution (ECD&R) was not implemented, as it represents an innovative feature implemented in this work. An additional feature in which this work goes beyond the state of the art, is the inclusion of uncertainty in order to represent the variability of the operations both in the airspace and on the ground.
C. Simulation combined with optimization Simulation together with optimization has proven to be a
good combination of techniques for tackling problems were uncertainty plays a crucial role. Simulation on the one hand, allows representing the uncertainty that affects the system under study, which is not possible to model by using analytical models. On the other hand, optimization gives an optimal or near-optimal solution even for complex systems. By coupling the two techniques, a solution that is more feasible for implementation in real life can be found. In [18] examples of applications of simulation and optimization techniques for problems that include aeronautical, logistics and industrial cases study are presented. Within airport operations, uncertainty is a crucial factor and therefore it should always be considered when making an analysis. Reference [19] highlights the importance of considering uncertainty in airport and air traffic control operations and the importance of including probabilistic aspects. It also mentions the use of computer models as a tool for the evaluation of such systems. In the literature we can find many applications that employ optimization combined with simulation techniques to solve specific airport operations: for instance [20] deals with the problem of reducing the cost of delay in air traffic; [21] focuses on stochastic aircraft recovery problem; [22] considers
airport surface traffic; and [23] copes with the check-in allocation at airport terminals. Regarding similar problems as the one faced in this work, in [24] a DES model integrating TMA and airside operations has been developed. Furthermore, they integrated the optimization tool OptQuest [25] in order to find the best combination for the number of ground vehicles with the objective of minimizing the turnaround time. To the best of our knowledge there are no studies that tackled the aforementioned ECD&R problem employing simulation together with optimization, therefore the purpose of this work is to fill this gap in the literature. In most of the previous references, simulation is used in order to include uncertainty and evaluating the objective function of an optimization model, our work differs from them in the sense that a better solution is found by applying an iterative process where some input parameter of the optimization are tuned after the optimized solution has been evaluated by using simulation. The paper presents a novel methodology which introduces for the first time simulation and optimization in a coordinated fashion. We present throughout the paper all the details on how to tackle real problems using this approach and we finally support it by presenting a case study based on real data from Paris Charles da Gaulle Airport.
III. PROBLEM DESCRIPTION: INTEGRATING AIRSPACE AND AIRSIDE OPERATIONS
The problem tackled in this work, consists in the integration of airspace and airside operations. Airspace operations involve landing sequencing while airside operations involve runway, taxiway and terminal operations. The objective, regarding the landing sequencing, is to resolve airspace conflicts and have a smooth arrival flow of aircraft. Regarding airside operations, the objective is to regulate the departure rate aiming at mitigating the congestion at the airport surface. The overall objective is to produce a solution that balances both systems in terms of conflicts. In Fig. 1, a schematic representation of the main components modeled is given, showing how these components are linked to each other. In this section the airspace and airside operations which have been modeled are explained, giving the necessary details to the reader for understanding the level of abstraction that has been applied. For further details about the problem definition please refer to [8].
Figure 1: Schematic representation of the airport components modeled, airspace and airside.

> REPLACE THIS LINE WITH YOUR PAPER IDENTIFICATION NUMBER (DOUBLE-CLICK HERE TO EDIT) <
4
A. Airspace operations The airspace operations considered in this work concern the
sequencing of landing aircraft inside the TMA airport airspace. The TMA is a portion of airspace that surrounds airports, its size is usually between 30 and 40 nautical miles radius, and its center is located at the airport location as it is represented in Fig. 2. According to [26], airports are classified by the number of departing seats transported per year. Especially for the ones that transport more than 30 million of seats, classified as mega airports, TMA can be a very congested zone due to the converging traffic flow from and to different origin/destination airports. For that reason, the management of the aircraft flow in the TMA, ensured by the work of the air traffic controllers (ATCOs), can be very demanding.
Fig. 2. TMA representation
In literature, there are many studies aiming at supporting ATCOs work by the development of optimal arrival schedules [2], [27], [28], [29], [30], [31].
In this work, the optimal scheduling of the aircraft during their landing phase is ensured by making decisions regarding: entry time in the TMA, initial speed in the TMA and runway choice. The objective is to avoid conflicts derived from the violation of separation minima between aircraft. 1) Airspace conflicts detection
Aircraft incur conflicts every time a loss of separation minima between two consecutive aircraft is detected. ICAO [32] provides values regarding separation minima based on the aircraft wake turbulence category. The wake turbulence category is an indicator related to the aircraft maximum certificated take-off mass, and it classifies aircraft in three categories: light, medium, and heavy. In Table Ⅰ the values about separation minima are shown. Formalizing: let be A a given set of landing aircraft, i and j consecutive pair of aircraft, 𝑆𝑆𝑖𝑖𝑖𝑖 the separation minima between the leading aircraft type i and the trailing aircraft type j and 𝐷𝐷𝑖𝑖𝑖𝑖 the distance between aircraft type i and aircraft type j. In this way conflicts are detected and calculated as:
𝐴𝐴𝐴𝐴𝐴𝐴𝐴𝐴𝐴𝐴𝐴𝐴𝐴𝐴𝐴𝐴 𝐴𝐴𝑐𝑐𝑐𝑐𝑐𝑐𝑐𝑐𝐴𝐴𝐴𝐴𝑐𝑐 = �1,𝐷𝐷𝑖𝑖𝑖𝑖 < 𝑆𝑆𝑖𝑖𝑖𝑖 ,∀𝐴𝐴, 𝑗𝑗 ∈ 𝐴𝐴
0, 𝑐𝑐𝑐𝑐ℎ𝐴𝐴𝐴𝐴𝑒𝑒𝐴𝐴𝐴𝐴𝐴𝐴 (1)
Another type of conflict is detected for aircraft that do not respect the order of the sequence along the landing route.
In this context, this type of conflict is detected by checking at the entry and exit of each link which belong to a route, that the order of the entry sequence is equal to the order of the exit sequence. Formalizing: let be 𝑐𝑐(𝑢𝑢, 𝑣𝑣), 𝑐𝑐 = 1, . . ,𝑐𝑐, a given set of links 𝑐𝑐𝐴𝐴𝑜𝑜𝐴𝐴𝐴𝐴𝑓𝑓𝑓𝑓𝑙𝑙 𝐴𝐴𝑐𝑐𝑜𝑜 𝑐𝑐𝐴𝐴𝑜𝑜𝐴𝐴𝐴𝐴𝑓𝑓𝑓𝑓𝑙𝑙 the positions of the aircraft 𝐴𝐴 on the link entry 𝑢𝑢 and on the link exit 𝑣𝑣, respectively. The order of sequence conflicts are calculated as:
𝑂𝑂𝐴𝐴𝑜𝑜𝐴𝐴𝐴𝐴 𝑐𝑐𝑐𝑐 𝑐𝑐ℎ𝐴𝐴 𝐴𝐴𝐴𝐴𝑠𝑠𝑢𝑢𝐴𝐴𝑐𝑐𝐴𝐴𝐴𝐴 𝐴𝐴𝑐𝑐𝑐𝑐𝑐𝑐𝑐𝑐𝐴𝐴𝐴𝐴𝑐𝑐 = ∑ (∑ 𝑐𝑐𝐴𝐴𝑜𝑜𝐴𝐴𝐴𝐴𝑖𝑖𝑓𝑓𝑙𝑙 − 𝑐𝑐𝐴𝐴𝑜𝑜𝐴𝐴𝐴𝐴𝑖𝑖𝑓𝑓𝑙𝑙𝑖𝑖∈𝐴𝐴 )𝑛𝑛
𝑙𝑙=1 (2)
B. Airside operations According to [8] decisions about landing operations can be
made in a time frame of two hours in advance, while keeping the system with a certain level of detail and preserving the system from any loss of feasibility. In such a time frame, due to the uncertainty present in the airspace it is not relevant to give instructions for airside operations such as taxiway routing logics, and that is why, in this study, airside operations were modeled following a so-called macroscopic approach. In this context, a macroscopic approach for airside operations is achieved by modeling airside components in a high level, which means, by identifying the main airside components such as taxiways and terminals and considering them as nodes of a network characterized by their own capacity. In this study a capacity for the taxiway network is defined as the maximum number of aircraft that can simultaneously cross it without incurring surface congestion; capacity of the terminals is defined by the number of available parking gates.
TABLE I
ICAO [31] SEPARATION MINIMA 𝑆𝑆𝑖𝑖𝑖𝑖 IN NAUTICAL MILES (NM)
Leading Aircraft
Wake turbulence category Heavy Medium Light
Trailing Aircraft
Heavy 4 3 3 Medium 5 3 3
Light 6 5 3
A factor which is considered as a decisions variable for airside operations is the choice of the push back time, that is, the time when an aircraft receives clearance to leave from its gate. Following this approach, the objective for airside operations is to keep the level of congestion under a certain threshold, which is the taxiway and terminal declared capacity. 1) Airside conflicts detection
Airside conflicts are detected, for taxiway and terminal components, when their declared capacity are exceeded (capacity overload). Conflicts values are derived from the weighted sum of two factors: the maximum overload (max OL) and the average overload (avg OL). Formalizing: let be C the declared capacity, 𝑂𝑂𝑡𝑡 the aircraft occupancy for each discrete time increment 𝑐𝑐 ∈ 𝑇𝑇; and T the entire time frame considered, the max OL is given by:
𝑀𝑀𝐴𝐴𝑀𝑀 𝑂𝑂𝑂𝑂 = �𝑚𝑚𝐴𝐴𝑀𝑀𝑡𝑡∈𝑇𝑇(𝑂𝑂𝑣𝑣𝐴𝐴𝐴𝐴𝑐𝑐𝑐𝑐𝐴𝐴𝑜𝑜𝑡𝑡), 𝐴𝐴𝑐𝑐 𝑂𝑂𝑡𝑡 > 𝐶𝐶0, 𝑐𝑐𝑐𝑐ℎ𝐴𝐴𝐴𝐴𝑒𝑒𝐴𝐴𝐴𝐴𝐴𝐴 (3)
and avg OL is given by:

> REPLACE THIS LINE WITH YOUR PAPER IDENTIFICATION NUMBER (DOUBLE-CLICK HERE TO EDIT) <
5
𝐴𝐴𝑣𝑣𝐴𝐴 𝑂𝑂𝑂𝑂 = ∑ 𝑜𝑜𝑓𝑓𝑜𝑜𝑜𝑜𝑙𝑙𝑜𝑜𝑜𝑜𝑜𝑜𝑡𝑡𝑡𝑡∈𝑇𝑇𝑇𝑇
(4) where,
𝑐𝑐𝑣𝑣𝐴𝐴𝐴𝐴𝑐𝑐𝑐𝑐𝐴𝐴𝑜𝑜𝑡𝑡 = �𝑂𝑂𝑡𝑡 − 𝐶𝐶, 𝐴𝐴𝑐𝑐 𝑂𝑂𝑡𝑡 > 𝐶𝐶 ∀ 𝑐𝑐 ∈ 𝑇𝑇0, 𝑐𝑐𝑐𝑐ℎ𝐴𝐴𝐴𝐴𝑒𝑒𝐴𝐴𝐴𝐴𝐴𝐴 (5)
the total conflicts value for each airside component is: 𝐴𝐴𝐴𝐴𝐴𝐴𝐴𝐴𝐴𝐴𝑜𝑜𝐴𝐴 𝐴𝐴𝑐𝑐𝑚𝑚𝐴𝐴𝑐𝑐𝑐𝑐𝐴𝐴𝑐𝑐𝑐𝑐 𝐴𝐴𝑐𝑐𝑐𝑐𝑐𝑐𝑐𝑐𝐴𝐴𝐴𝐴𝑐𝑐𝐴𝐴 = 𝛼𝛼𝑀𝑀𝐴𝐴𝑀𝑀 𝑂𝑂𝑂𝑂 + 𝛽𝛽𝐴𝐴𝑣𝑣𝐴𝐴 𝑂𝑂𝑂𝑂(6) The weights 𝛼𝛼 and 𝛽𝛽 can guide the optimization minimization objective function towards different directions since they can prioritize the reduction of the max OL or of the avg OL. In this work these two weights have the same value, but in the future they can be exploited for further investigations.
C. Runway operations Runway operations act as the connections between airspace
and airside operations. The runway system is considered as the bottleneck of the airport system [33], so a crucial aspect to improve is the performance of the runway system in terms of rate (arrivals and departures). In this work, landing and departure operations at runway are considered, so an additional objective of this study is to find a balance in the rate of arrivals and departures. 1) Runway conflicts detection
Runway conflicts are defined in a similar way as conflicts for the airspace. The only difference is in the values of separation minima which depend on the type of operation on the runway and also on the aircraft type. In Table Ⅱ, values of separation minima for the different runway operations (A-arrivals, D-departures) are presented [34]. Formalizing: let be A a given set of aircraft, i and j a consecutive pair of aircraft, 𝑆𝑆𝑖𝑖𝑖𝑖 the separation minima between aircraft type i and aircraft type j and 𝐷𝐷𝑖𝑖𝑖𝑖 the detected time difference between aircraft type i and aircraft type j. In this way conflicts are formalized with the following function:
𝑅𝑅𝑢𝑢𝑐𝑐𝑒𝑒𝐴𝐴𝑅𝑅 𝐴𝐴𝑐𝑐𝑐𝑐𝑐𝑐𝑐𝑐𝐴𝐴𝐴𝐴𝑐𝑐 = �1, 𝐴𝐴𝑐𝑐 𝐷𝐷𝑖𝑖𝑖𝑖 < 𝑆𝑆𝑖𝑖𝑖𝑖 ,∀𝐴𝐴, 𝑗𝑗 ∈ 𝐴𝐴
0, 𝑐𝑐𝑐𝑐ℎ𝐴𝐴𝐴𝐴𝑒𝑒𝐴𝐴𝐴𝐴𝐴𝐴 (7)
D. Model network Airspace and airside operations are modeled by means of a
network of nodes and links. Landing routes in the airspace are identified by the connection of nodes called waypoints forming a trajectory, Fig. 3 shows an example of landing routes or standard instrument arrival routes (STARs) taken from the case study considered in this work. Aircraft fly with a constant deceleration from one of the STAR entry points, in order to slow down until they reach a waypoint called final approach fix (FAF), from there, they continue descending with a constant speed until they approach the runway. In this work, it was possible to modify the speed at the entry point of the STAR. The routes considered in this work are assumed to be vertically well spaced, therefore, there are no possibilities of conflicts due to vertical separation minima violation. Another assumption regards to the departure routes, which in this work are omitted, therefore, they do not interfere with the landing routes. Airspace conflicts are detected on the nodes and on the links [8], [29]. Airside components such as runway, taxiway and terminals are modeled as nodes inside the network. In the
case of the runway, conflicts are detected in the node using formula (7). For the airside components, each node is characterized by a capacity value, and conflicts are detected according to the maximum number of aircraft on the nodes.
TABLE II
RUNWAY SEPARATION MINIMA Sij [34] IN SECONDS (s)
Leading Aircraft
Operation-Category A-H A-
M A-L D-H D-M D-L
Trailing Aircraft
A-Heavy 96 157 207 60 60 60 A-Medium 60 69 123 60 60 60
A-Light 60 69 82 60 60 60 D-Heavy 60 60 60 96 111 120
D-Medium 60 60 60 60 60 60 D-Light 60 60 60 60 60 60
Fig. 3. Airspace network
E. Decision variables and objective function of the problem The decision variables considered for this problem, for each
flight 𝑐𝑐 ∈ 𝐹𝐹 are: • TMA entry time 𝑐𝑐𝑓𝑓 ∈ 𝑇𝑇𝑓𝑓 𝑒𝑒ℎ𝐴𝐴𝐴𝐴𝐴𝐴 𝑇𝑇𝑓𝑓 = �𝑇𝑇𝑓𝑓0 + 𝑗𝑗∆𝑇𝑇 � ∆𝑇𝑇𝑚𝑚𝑚𝑚𝑚𝑚
∆𝑇𝑇≤
𝑗𝑗 ≤ ∆𝑇𝑇𝑚𝑚𝑚𝑚𝑚𝑚∆𝑇𝑇
, 𝑗𝑗 ∈ ℤ }, ∆𝑇𝑇𝑚𝑚𝑖𝑖𝑛𝑛 and ∆𝑇𝑇𝑚𝑚𝑜𝑜𝑚𝑚 are the minimum and maximum values that can be assigned to 𝑐𝑐𝑓𝑓, and ∆𝑇𝑇 is a discretized time increment. In this case ∆𝑇𝑇𝑚𝑚𝑖𝑖𝑛𝑛 is -5 minutes, ∆𝑇𝑇𝑚𝑚𝑜𝑜𝑚𝑚 is +30 minutes and ∆𝑇𝑇 is 5 seconds.
• TMA entry speed 𝐴𝐴𝑓𝑓 ∈ 𝑆𝑆𝑓𝑓 𝑒𝑒ℎ𝐴𝐴𝐴𝐴𝐴𝐴 𝑆𝑆𝑓𝑓 = �𝑆𝑆𝑓𝑓0 + 𝑗𝑗∆𝑆𝑆 � |𝑗𝑗| ≤ (∆𝑆𝑆𝑚𝑚𝑜𝑜𝑚𝑚 − ∆𝑆𝑆𝑚𝑚𝑖𝑖𝑛𝑛)/∆𝑆𝑆, 𝑗𝑗 ∈ ℤ}, ∆𝑆𝑆𝑚𝑚𝑖𝑖𝑛𝑛 and ∆𝑆𝑆𝑚𝑚𝑜𝑜𝑚𝑚 are the minimum and maximum values that can be assigned to 𝐴𝐴𝑓𝑓 and ∆𝑆𝑆 is a discretized increment. In this case ∆𝑆𝑆𝑚𝑚𝑖𝑖𝑛𝑛 is 0.9𝑆𝑆𝑓𝑓0, ∆𝑆𝑆𝑚𝑚𝑜𝑜𝑚𝑚 is 1.1𝑆𝑆𝑓𝑓0 and ∆𝑆𝑆 is 0.01𝑆𝑆𝑓𝑓0.
• Landing runway choice 𝐴𝐴𝑓𝑓 ∈ 𝑅𝑅𝑓𝑓 𝑒𝑒ℎ𝐴𝐴𝐴𝐴𝐴𝐴 𝑅𝑅𝑓𝑓 is the set of available landing runways.
• Push back time 𝐴𝐴𝑝𝑝𝑓𝑓 ∈ 𝑃𝑃𝑃𝑃𝑓𝑓 𝑒𝑒ℎ𝐴𝐴𝐴𝐴𝐴𝐴 𝑃𝑃𝑃𝑃𝑓𝑓 = �𝑃𝑃𝑃𝑃𝑓𝑓0 +
𝑗𝑗∆𝑇𝑇 �0 ≤ 𝑗𝑗 ≤ ∆𝑃𝑃𝑃𝑃𝑚𝑚𝑚𝑚𝑚𝑚∆𝑇𝑇
, 𝑗𝑗 ∈ ℤ }, ∆𝑃𝑃𝑃𝑃𝑚𝑚𝑜𝑜𝑚𝑚 is the maximum value that can be assigned to 𝐴𝐴𝑝𝑝𝑖𝑖 , and ∆𝑇𝑇 is a discretized time increment. In this case ∆𝑃𝑃𝑃𝑃𝑚𝑚𝑜𝑜𝑚𝑚 is +15 minutes and ∆𝑇𝑇 is 5 seconds.
The first decision can assign a delay or an advance to the aircraft which is about to enter inside the TMA. The second decision modifies the entry speed of the aircraft that is about to enter one of the STARs in the TMA, in this case aircraft can enter with a lower or higher speed. The third decision chooses
> REPLACE THIS LINE WITH YOUR PAPER IDENTIFICATION NUMBER (DOUBLE-CLICK HERE TO EDIT) <
6
the landing runway. The last decision is the push back time, in this case it is possible only to assign a delay, establishing the time when the aircraft can leave the gate.
The objective function evaluated in this problem is composed by the weighted sum of two factors: airspace conflicts and airside conflicts. It is important to mention that runway conflicts are included in airside conflicts computation. 𝑂𝑂𝑝𝑝𝑗𝑗𝐴𝐴𝐴𝐴𝑐𝑐𝐴𝐴𝑣𝑣𝐴𝐴 𝑐𝑐𝑢𝑢𝑐𝑐𝐴𝐴𝑐𝑐𝐴𝐴𝑐𝑐𝑐𝑐 = 𝛾𝛾𝑜𝑜𝑖𝑖𝑜𝑜𝑎𝑎𝑎𝑎𝑜𝑜𝑎𝑎𝑜𝑜 ∗ (𝐴𝐴𝐴𝐴𝐴𝐴𝐴𝐴𝐴𝐴𝐴𝐴𝐴𝐴𝐴𝐴 𝐴𝐴𝑐𝑐𝑐𝑐𝑐𝑐𝑐𝑐𝐴𝐴𝐴𝐴𝑐𝑐𝐴𝐴 +𝑂𝑂𝐴𝐴𝑜𝑜𝐴𝐴𝐴𝐴 𝑐𝑐𝑐𝑐 𝑐𝑐ℎ𝐴𝐴 𝐴𝐴𝐴𝐴𝑠𝑠𝑢𝑢𝐴𝐴𝑐𝑐𝐴𝐴𝐴𝐴 𝐴𝐴𝑐𝑐𝑐𝑐𝑐𝑐𝑐𝑐𝐴𝐴𝐴𝐴𝑐𝑐𝐴𝐴) + 𝛾𝛾𝑜𝑜𝑖𝑖𝑜𝑜𝑎𝑎𝑖𝑖𝑜𝑜𝑜𝑜 ∗ (𝐴𝐴𝐴𝐴𝐴𝐴𝐴𝐴𝐴𝐴𝑜𝑜𝐴𝐴 𝐴𝐴𝑐𝑐𝑐𝑐𝑐𝑐𝑐𝑐𝐴𝐴𝐴𝐴𝑐𝑐𝐴𝐴 + 𝑅𝑅𝑢𝑢𝑐𝑐𝑒𝑒𝐴𝐴𝑅𝑅 𝐴𝐴𝑐𝑐𝑐𝑐𝑐𝑐𝑐𝑐𝐴𝐴𝐴𝐴𝑐𝑐𝐴𝐴) (8)
The weight coefficients 𝛾𝛾𝑜𝑜𝑖𝑖𝑜𝑜𝑎𝑎𝑎𝑎𝑜𝑜𝑜𝑜𝑎𝑎𝑜𝑜 and 𝛾𝛾𝑜𝑜𝑖𝑖𝑜𝑜𝑎𝑎𝑖𝑖𝑜𝑜𝑜𝑜 , are assigned to the airspace and airside conflicts, respectively. Depending on which component the optimization process should focus on, these weights can be adjusted accordingly. In this work, for both 𝛾𝛾𝑜𝑜𝑖𝑖𝑜𝑜𝑎𝑎𝑎𝑎𝑜𝑜𝑎𝑎𝑜𝑜 and 𝛾𝛾𝑜𝑜𝑖𝑖𝑜𝑜𝑎𝑎𝑖𝑖𝑜𝑜𝑜𝑜 , we assigned 1 as their values.
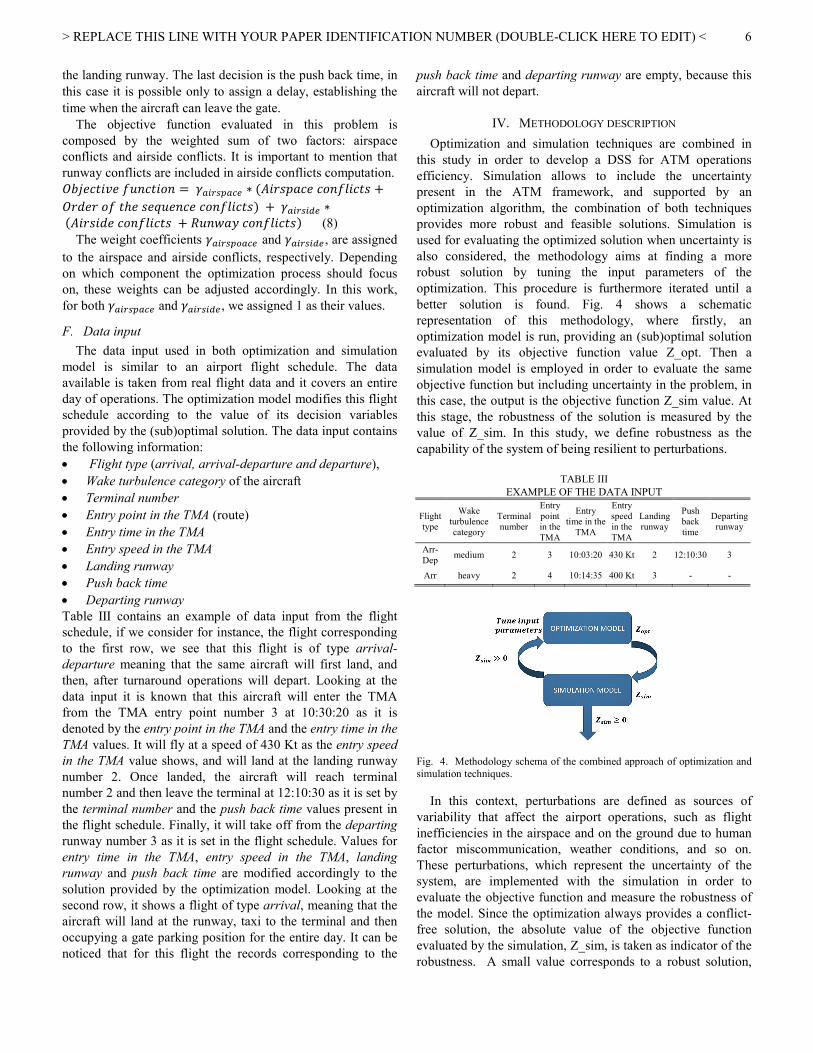
F. Data input The data input used in both optimization and simulation
model is similar to an airport flight schedule. The data available is taken from real flight data and it covers an entire day of operations. The optimization model modifies this flight schedule according to the value of its decision variables provided by the (sub)optimal solution. The data input contains the following information: • Flight type (arrival, arrival-departure and departure), • Wake turbulence category of the aircraft • Terminal number • Entry point in the TMA (route) • Entry time in the TMA • Entry speed in the TMA • Landing runway • Push back time • Departing runway Table Ⅲ contains an example of data input from the flight schedule, if we consider for instance, the flight corresponding to the first row, we see that this flight is of type arrival-departure meaning that the same aircraft will first land, and then, after turnaround operations will depart. Looking at the data input it is known that this aircraft will enter the TMA from the TMA entry point number 3 at 10:30:20 as it is denoted by the entry point in the TMA and the entry time in the TMA values. It will fly at a speed of 430 Kt as the entry speed in the TMA value shows, and will land at the landing runway number 2. Once landed, the aircraft will reach terminal number 2 and then leave the terminal at 12:10:30 as it is set by the terminal number and the push back time values present in the flight schedule. Finally, it will take off from the departing runway number 3 as it is set in the flight schedule. Values for entry time in the TMA, entry speed in the TMA, landing runway and push back time are modified accordingly to the solution provided by the optimization model. Looking at the second row, it shows a flight of type arrival, meaning that the aircraft will land at the runway, taxi to the terminal and then occupying a gate parking position for the entire day. It can be noticed that for this flight the records corresponding to the
push back time and departing runway are empty, because this aircraft will not depart.
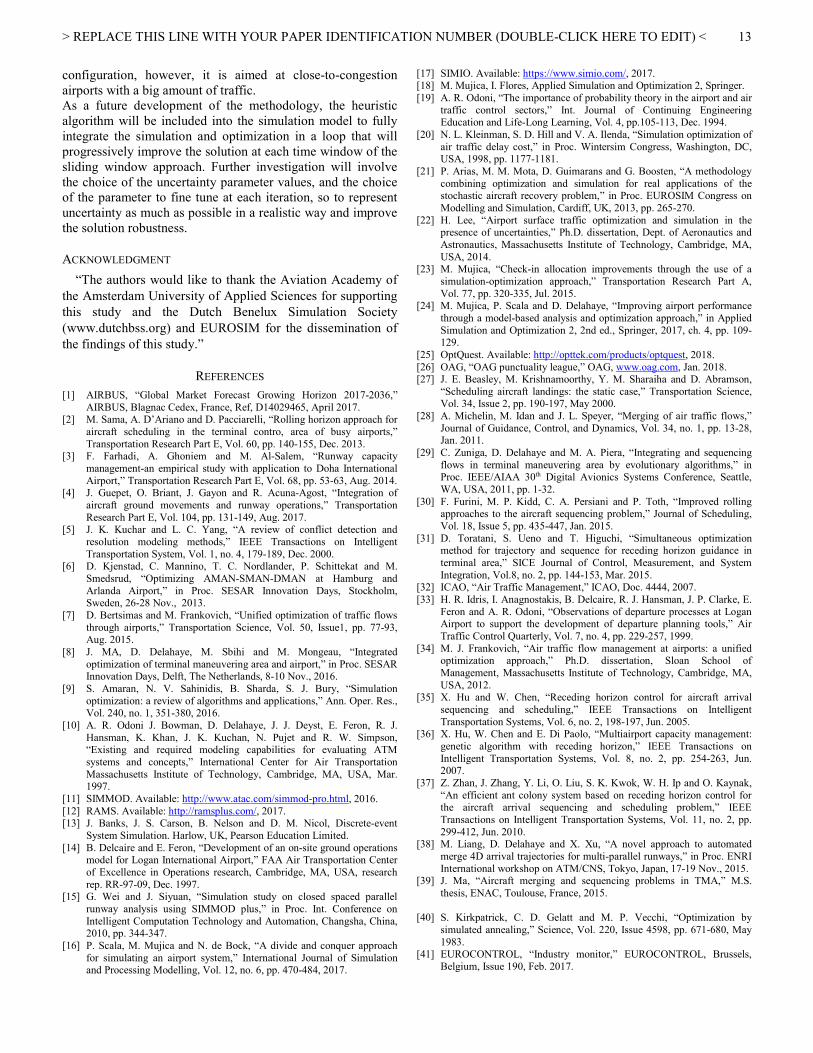
IV. METHODOLOGY DESCRIPTION Optimization and simulation techniques are combined in
this study in order to develop a DSS for ATM operations efficiency. Simulation allows to include the uncertainty present in the ATM framework, and supported by an optimization algorithm, the combination of both techniques provides more robust and feasible solutions. Simulation is used for evaluating the optimized solution when uncertainty is also considered, the methodology aims at finding a more robust solution by tuning the input parameters of the optimization. This procedure is furthermore iterated until a better solution is found. Fig. 4 shows a schematic representation of this methodology, where firstly, an optimization model is run, providing an (sub)optimal solution evaluated by its objective function value Z_opt. Then a simulation model is employed in order to evaluate the same objective function but including uncertainty in the problem, in this case, the output is the objective function Z_sim value. At this stage, the robustness of the solution is measured by the value of Z_sim. In this study, we define robustness as the capability of the system of being resilient to perturbations.
TABLE III
EXAMPLE OF THE DATA INPUT
Flight type
Wake turbulence category
Terminal number
Entry point in the TMA
Entry time in the
TMA
Entry speed in the TMA
Landing runway
Push back time
Departing runway
Arr-Dep medium 2 3 10:03:20 430 Kt 2 12:10:30 3
Arr heavy 2 4 10:14:35 400 Kt 3 - -
Fig. 4. Methodology schema of the combined approach of optimization and simulation techniques.
In this context, perturbations are defined as sources of variability that affect the airport operations, such as flight inefficiencies in the airspace and on the ground due to human factor miscommunication, weather conditions, and so on. These perturbations, which represent the uncertainty of the system, are implemented with the simulation in order to evaluate the objective function and measure the robustness of the model. Since the optimization always provides a conflict-free solution, the absolute value of the objective function evaluated by the simulation, Z_sim, is taken as indicator of the robustness. A small value corresponds to a robust solution,

> REPLACE THIS LINE WITH YOUR PAPER IDENTIFICATION NUMBER (DOUBLE-CLICK HERE TO EDIT) <
7
while a big value means that the solution is less robust since it is away from the optimal solution.
A. Optimization approach The optimization approach is based on the implementation
of the sliding window method. This method has been employed in other studies with good results [8], [30], [31], [35], [36], [37], [38]. The sliding window approach consists in considering time frame windows of small size and shifting them along the entire time horizon of the study. By using this approach, a small instance of the problem is solved considering only the elements within the time window. Fig. 4 illustrates the approach. The main parameters to set are the window length and the shift length. The main advantages coming from the use of this method are: less computational time required; the possibility of treating the problem in a dynamic way, by considering, as time passes, new information updates due to changes in the environment and to the interactions between entities with the surrounding environment. As highlighted by [39] it is crucial to choose the right values for the window and shift length, since big values of window length might lead to worsen the overall performance, as decisions that are too far ahead in time are made. Moreover, there will also be an increase in the computational time. On the other hand, small values of window length might lead not to consider enough information about aircraft, affecting the quality of the solution. In the same way, a big window shift will reduce the effect of the dynamic behavior of the method, since in this case less decisions will be updated from one window to another. Small window shift will increase the computational time performance. As it can be appreciated from the Fig. 5, depending on the relative time position of the aircraft entities with respect to the current active window, there can be different categories of decisions: fixed, updated, to make or to be made.
Fig. 5. Sliding window representation
• Fixed decisions are the ones that fall behind the window and it is not anymore possible to take decisions for them.
• Updated decisions are the ones that fall partly before and partly inside the window, these decisions were already made in the previous window and they will be updated in the current window.
• To make decisions are the ones that are fully inside the widows and these decisions will be made for them in the current window.
• To be made are the ones that are after the windows and these decisions are not yet made for them.
The capability of the method to update decisions ensures its dynamic behavior in solving the problem.
This type of problem is proven to be NP-hard according to [26], therefore a meta-heuristic has been applied to solve the problem and to find a (sub)optimal solution. The meta-heuristic employed is the simulated annealing [40]. The metaheuristic will solve any instance of the problem in the boundaries of each window. This approach has been successfully applied to similar problems like the one presented in [38]. For further details about the development of the optimization model mentioned in this work we refer the reader to [8].
B. Simulation approach The simulation model for the airspace and airside
operations has been developed with the use of DES. DES is a simulation paradigm which fits well for the modeling of systems in which the entities have already a specific set of processes to undergo. In DES the state of the system changes based on the occurrences of events and are not depending on time occurrences. In this specific problem, aircraft entities undergo a predefined set of processes in a concurrent fashion, for this reason, the DES paradigm was used to model the processes of arrival, landing, taxi and turnaround in an airport.
The main advantage of using simulation in this work, is that it includes sources of uncertainties in the system. Uncertainty can derive from different causes like external and internal factors such as the surrounding environment or the human factor. Often, the mere use of analytical models does not allow to represent these uncertainty, thus, to overcome this limit, simulation can be used as a tool for including uncertainty. In the specific problem tackled in this work, uncertainty refers to: • Entry time in the TMA, it can be affected by deviations
due to speed, environmental variations and human factors. • Taxiway time, it can vary based the speed of the aircraft
on the taxiway, that in turn, it can be affected by the taxiway network configuration and by the level of congestion on the taxiway.
• Pushback time for the aircraft, it can vary due to ground handler inefficiencies in performing the necessary maneuvers to the aircraft.
Despite the fact that turnaround operations can be very fluctuant in terms of time consumed, uncertainty was not considered for them, and this represents the main assumption of the simulation model. Turnaround times have been derived from a real schedule, which is why uncertainty was not considered. The following subsection describe the conceptual modeling of the elements in the system under study.
1) Modeling airspace network
The airspace in the simulation model has been modeled by a network of nodes and links. Each node represents some of the main waypoints that aircraft follow while flying the landing route. Since uncertainty plays a crucial role in the system, in the airspace network is important to detect conflicts as accurately as possible. In the simulation model, unlike the optimization model, airspace conflicts are detected only on the nodes of the network. In this

> REPLACE THIS LINE WITH YOUR PAPER IDENTIFICATION NUMBER (DOUBLE-CLICK HERE TO EDIT) <
8
context, the number of nodes used for building the routes of the airspace network plays an important role because there is the potential risk of missing some conflicts on the links. Fig. 6 shows an example that compares two different ways of modeling the airspace routes by using different number of nodes. As it can be seen the comparison between the route with less nodes, placed at the bottom in Fig. 6, and the other one with more nodes, placed in the upper part of Fig. 6, illustrates that some conflicts might not be detected when the route has few nodes. To overcome this problem, we divided each route in links of 5 NM, which according to [20] seems to be a good distance for achieving a good level of accuracy. An additional feature of the simulation model is that it is capable of evaluating the number of aircraft involved in the conflicts, which is an indicator that provides more insights about the level of congestion of the airspace.
Fig. 6. Example of the detection of an airspace conflicts in the airspace network of the simulation model.
V. IMPLEMENTATION As a proof of concept of the approach, we applied it to a
real case study. The case of study refers to one of the major airport with the biggest traffic in Europe, so to properly test the benefits of the methodology. The optimization and simulation models were run on a 2.5 GHz core i7 CPU, under Windows operating system PC. The optimization model was developed based on Java code, while the simulation model was developed by using a general purpose simulation software called SIMIO. The average computational time was similar for each of the different scenarios, and it was 20 minutes for the optimization model and 5 minutes for the simulation model. These computational times make the approach suitable for an ATC tactical decision making. Tactical decisions are the ones taken on the day of operations and include the update of daily plans and the continuous capacity optimization according to real traffic demand [42]. In the next sections the case of study is introduced and results for the different scenarios are presented.
A. Case study: Paris Charles de Gaulle Airport In this work, Paris Charles de Gaulle Airport (PCDG) was
taken as a case study. PCDG Airport is one of the major airports in Europe, for its size, passengers transported and air traffic movements. It is the hub of the French carrier Air France, and according to EUROCONTROL [41] in the 2016 it transported 66M of passengers and carried 473K air traffic movements. The data used in the experiments refers to a flight
schedule of an entire day of operations at the airport. In total there were 1116 movements. Table Ⅳ presents the type of traffic involved.
TABLE IV
NUMBER OF MOVEMENTS CLASSIFIED BASED ON THE TYPE OF MOVEMENTS
Type of movement Number of movements
Arrival 554
Departure 562
Total movements 1116
1) Airport characteristics
Airport TMA and runway system. PCDG Airport has 4 parallel runways. They operate as independent runways, in the sense that they can simultaneously accommodate air traffic movements. In real operations two of the runways are used only for landings (runway in) and other two only for departures (runway out). In the TMA four landing routes were identified, two coming from south and two coming from north. These routes were identified based on airspace surveillance records. Depending on which of the two landing runway is used, in any of the four available landing routes, it is possible to take two different route trajectories. These trajectories are spaced by a safe vertical distance, so to have in total 8 trajectories available. Airport airside. PCDG Airport is constituted by three terminals and a complex taxiway network. Following the macroscopic approach for modeling the airport airside, only capacity has been considered for terminals and taxiway network. One assumption was made for ground operations regarding taxiway routes potential aircraft conflicts due to physical position on the taxiway were not detected. Another assumption was also that aircraft could park at any gate of the terminal, regardless of the aircraft size. Tables Ⅴ and Ⅵ show the capacity of these components and the average times taxiway were used in the optimization model. In Fig. 7 it is possible to see a schematic representation of the model and the methodology applied to it.
TABLE V AIRSIDE COMPONENT CAPACITY
Ground component Capacity value
Terminal 1 11
Terminal 2 91
Terminal 3 57
Taxiway network 18
B. Analysis of the original and the first optimized schedule The conflict detection and resolution problem applied to airport operation such as landings and ground components has been solved by means of an optimization model.

> REPLACE THIS LINE WITH YOUR PAPER IDENTIFICATION NUMBER (DOUBLE-CLICK HERE TO EDIT) <
9
TABLE VI AVERAGE TAXI TIME IN SECONDS (S)
Runways
Landing runways (taxi in time)
Departing runways (taxi out time)
Terminals 26L 27R 26R 27L
Terminal 1 651 439 859 1197
Terminal 2 523 764 861 835
Terminal3 599 569 1240 1139
Fig. 7. Schematic representation of both model and methodology.
This model was based on a heuristic algorithm which provides a (sub)optimal solution. The objective of the model was to minimize an objective composed by the sum of the conflicts for the airspace and ground operations. Section Ⅲ gives a detailed description of the problem. Table Ⅶ shows the number of conflicts detected when the original flight schedule is run without implementing the heuristic algorithm, and the total value of objective function is 1972.76. Most of the conflicts were detected in the airspace, where we had 1114 conflicts on links and 461 conflicts on nodes. Runway was also affected, having 381 conflicts. Taxiway network had an overload peak of 8 and an average overload of 0.14, which shows that the system is always at the edge its capacity. Regarding the terminals, they had overload peaks of 2, 4 and 3 for terminal 1, 2 and 3, respectively. Average overload were 0.12, 0.3 and 0.2 for terminal 1, 2 and 3, respectively. From these results it can be seen that terminal 2 was the most congested in terms of both peak and average overload, although terminal 1 and 2 suffered from congestion as well. Overall, the results revealed that the airspace was more congested than the ground, meaning that the capacity of the ground was able to absorb the traffic better than the capacity of the airspace. Conflicts on the airspace routes (links and nodes) were transferred on the runway, which was also highly overloaded. Therefore, the optimization process needs to pay a lot of its effort in solving airspace conflicts, being a critical area to focus on. As first step in the methodology, the optimization model effectively finds a solution that reduces the conflict to zero, therefore it is considered as optimal. The solution obtained by the optimization model, is tested with the use of a simulation
model where uncertainty is considered with their values showed in Table Ⅷ.
TABLE VII VALUE OF THE OBJECTIVE FUNCTION BROKEN DOWN INTO THE
DIFFERENT COMPONENTS USING THE ORIGINAL SCHEDULE.
Objective function component
Objective function
subcomponent
Individual value
Aggregated value
Airspace conflicts Link conflicts 1114
1575 Node conflicts 461 Runway conflicts 381
Taxiway network conflicts
Max OL 8
8.14 Avg OL 0.14
Terminal conflicts
T1 Max OL 2
8.62
Avg OL 0.12
T2 Max OL 4 Avg OL 0.3
T3 Max OL 2 Avg OL 0.2
Total conflicts 1972.76
TABLE VIII
UNCERTAINTY FACTORS AND THEIR RESPECTIVE VALUES
Uncertainty factor Value
Entry time in the TMA deviation [-30s, +30s]
Taxiway time deviation [-10%, +10%]
Pushback time deviation [-60s, +60s]
Values have been chosen based on the experience of the authors, and they are continuous. Table Ⅸ shows the results obtained by the simulation model. The simulation model has been able to evaluate the conflicts for all the airspace and airside components, moreover, it has been able to evaluate further indicators like the number of aircraft involved in the airspace conflicts. Regarding the conflicts on the runway, it was possible to break them down in landing runway (runway in) and departing runway (runway out) conflicts. As can be seen from Table Ⅸ, when including uncertainty in the system, we detect some conflicts, especially for the airspace and the runway out components of the objective function. In Table Ⅸ are also shown minimum, average, maximum and standard deviation values since there were run 50 replications for each scenario. Looking at the average values, it can be noticed that terminals are not affected by uncertainty since they do not have any overload, while the taxiway network is slightly affected with max OL of 2.1 and an avg OL of 0.0057. This can be explained by the fact that the turnaround time, which ranges approximately between 30 minutes and 2 hours, absorbs the deviation of taxi times and pushback times, reducing at minimum the effect of the uncertainty. The component which is the most affected is the runway out with 90.44 conflicts, it is followed by the airspace with 19.18 conflicts and then runway in with 9.2 conflicts. These initial experiments pointed out that using optimization techniques

> REPLACE THIS LINE WITH YOUR PAPER IDENTIFICATION NUMBER (DOUBLE-CLICK HERE TO EDIT) <
10
alone to deal with such problems would not be enough for supporting decision makers in real operations. The deterministic nature of the optimization model represents a relevant limitation, as it was highlighted by the number of conflicts found after including uncertainty in the system by the simulation model.
TABLE IX VALUE OF THE OBJECTIVE FUNCTION BROKEN DOWN INTO THE
DIFFERENT COMPONENTS USING THE OPTIMIZED SCHEDULE Objective function
component
Objective function
subcomponent
Values
Min Avg Max St.dev. Aircraft
involved in airspace conflicts
4 8.64 15 2.3884
Airspace conflicts 5 19.18 44 7.5746
Runway conflicts
Runway in 3 9.2 15 2.5314 Runway out 72 90.44 108 6.9463
Taxiway network conflicts
Max OL 2 2.1 3 0.3149
Avg OL 0.0009 0.0057 0.0147 0.0035
Terminal conflicts
Max OL 0 0 0 0 Avg OL 0 0 0 0
C. Additional scenarios From the previous analysis simulation raises the impact of
uncertainty. With this in mind, the objective of the methodology is to improve the solution of the optimization and make it more resilient to uncertainty. One way of achieving this objective is by fine-tuning some of the optimization input parameters and obtaining a new solution that in turn can be tested with simulation for evaluating the performance. Following this line, a series of tests have been conducted based on the different values for the chosen input parameters to be tuned. The parameters chosen to be tuned are the separation minima between aircraft in the airspace and the one on the runways. By enlarging the separation minima in the optimization model we relax this constraint of the problem. With those new parameters, the optimization will achieve a more conservative solution, however, it might reduce the effect of the uncertainty on the number of conflicts because of the separation minima violation. Table Ⅹ shows the different value that have been tested for the input parameter.
TABLE X VALUES OF THE INPUT PARAMETER CHOSEN AS FINE TUNING
PARAMETER OF THE METHODOLOGY
Input parameter Value
Separation minima increase 10% 20% 30%
An indicator for measuring the goodness of a solution has
been defined as the magnitude of the conflict detected. In this analysis, indicators like the average conflict size violation (%) is measured. Moreover, also the number of conflicts falling within a certain interval of separation violation percentage is
measured and showed in a graph. With these two additional indicators, we conducted a more exhaustive analysis. In the next sections this analysis is presented individually for each objective function component: airspace, runway in, runway out, taxiway network and terminals conflicts. 1) Airspace conflict analysis
Fig. 8(a) shows the number of aircraft involved in conflict airspace, and looking at average values it can be clearly seen that it has been reduced from almost 9 to 4. In Fig. 8(b) the absolute number of airspace conflicts is shown. As it can be noticed, scenario with 20% and 30% separation minima increase, obtained both around 10 conflicts providing a lower amount of conflicts than the base scenario and 10% separation minima increase scenario that provided around 20 and 15 conflicts, respectively. Considering the amount of aircraft involved in the airspace conflicts it can be deducted that each aircraft has incurred in average around 2 conflicts.
(a)
(b)
Fig. 8. (a) Aircraft involved in airspace conflicts. (b) Number of airspace conflicts.
The charts depicted in Figs. 9(a) and 9(b), give information about the size of the conflicts. Fig. 9(a) in particular, shows the number of conflicts that fell in the different conflict size percentage intervals. Ideally a solution would be better if the conflicts size would be small, meaning to have high values on the left-hand side of the chart. In the chart it can be seen that the base case scenario is outperformed by all the other scenarios, and the best ones are the 20% and 30% separation minima increase scenarios. However, the new solutions obtained by the other scenarios produce more conflicts with high conflict size percentage than the base case scenario, and this is visible in Fig. 9(b) where the base scenario has a lower

> REPLACE THIS LINE WITH YOUR PAPER IDENTIFICATION NUMBER (DOUBLE-CLICK HERE TO EDIT) <
11
average conflict size percentage than the other scenarios. In real operations, aircraft with high conflict size percentage imply a re-sequence by the air traffic controllers, who can apply different procedure such as, trajectory change, altitude change, speed change, holding procedures [43].
(a)
(b)
Fig. 9. (a) Number of airspace conflicts that are in a specific conflict size interval. (b) Average airspace conflict size percentage.
2) Runway in conflict analysis Fig. 10, shows that scenarios with 20% and 30% of separation minima increase outperform the base case and 10% separation minima increase scenarios, obtaining in average a value of 2 conflicts while the base scenario and 10% scenario have 9 and 6 conflicts, respectively. Concerning the conflict size we clearly see in both Figs. 11(a) and 11(b) that scenarios with 20% and 30% outperform the other two scenarios. Looking at Fig. 11(a), it is possible to find some conflicts with a high conflict percentage such as 25-30%, 30-40% and 75-100%. These circumstances would imply that the air traffic controllers would apply the same procedures as they would do for the airspace conflicts, performing missed approaches in the cases when aircraft would be very close to approach the runway [42]. Fig. 11(b) shows an improvement of around 1.5% from the base and 10% separation minima increase scenarios, with average conflict size of around 9.25% for the 20% and 30% separation minima increase scenarios, against and average conflict size of around 10.75% for the base and 10% separation minima increase scenarios.
3) Runway out conflict analysis Fig. 12 shows the number of conflicts occurred at the departing runway (runway out). The graph shows that the
best scenarios that obtains less conflicts is the 30% separation minima increase scenario, improving the performance of the base case scenario and achieving a reduction of almost 10 conflicts.
Fig. 10. Runway in number of conflicts.
(a)
(b)
Fig. 11. (a) Number of runway in conflicts that are in a specific conflict size interval. (b) Average runway in conflict size percentage.
Fig. 12. Runway out number of conflicts.
Looking at Fig. 13(a) it can be noticed that most of the conflicts, regardless of the scenario simulated, are on the right-hand side of the chart, meaning to have high conflict size. The main reason can be found in the magnitude of the

> REPLACE THIS LINE WITH YOUR PAPER IDENTIFICATION NUMBER (DOUBLE-CLICK HERE TO EDIT) <
12
uncertainty that affects ground side, identified in the simulation model as deviation from off block time and taxi time out. The values of separation minima for the runway out range between 60 and 111 seconds, while values of deviation from off block time range between minus and plus 60 seconds. Considering also that the deviation in taxi out time ranges between minus and plus 10% of the average taxi out time, which in turn ranges between 835 and 1240 seconds, it can be clearly understood that this will affect severely the runway out conflicts performance. The consequence of these high number of conflicts and conflicts size for the runway out, are translated, in real operations, as number of aircraft queuing up and waiting times queuing at the departing runway entry. In Fig. 13(b) it can be seen that the average conflict size is quite high, between 51.7% and 52.5%, and also that the different scenarios obtain more or less similar values of conflict size. This results implies that the runway out is very sensitive to uncertainty and, on the contrary, it is not sensitive to the different scenarios, therefore the output does not change much between the different scenarios.
(a)
(b)
Fig. 13. (a) Number of runway out conflicts that are in a specific conflict size interval. (b) Average runway out conflict size percentage.
4) Taxiway network and terminal conflict analysis Simulation results for taxiway network and terminals are depicted in the two charts of Figs. 14(a) and 14(b). Concerning taxiway network conflicts, we found the same average values for all the different scenarios, which is around 2. The uncertainty included in the taxi times makes it to be overloaded in all the scenarios, however, to a small extent. Regarding the terminals, all scenarios except scenario 10% of separation minima increase, show no
conflicts. For these two components, uncertainty does not affect too much their performance. In real operations, having this overload would mean having aircraft waiting at the terminal apron area for a gate to be released, or aircraft waiting in some hot spot of the taxiway network. It can be also noticed that the avg OL for taxiway and terminals is almost zero, which means that the max OL has taken place for a small amount of time.
(a)
(b)
Fig. 14. (a) Number of taxiway network conflicts. (b) Number of terminals conflicts.
VI. CONCLUSION This paper presents a methodology that can be used for making a decision support system for ATM operations with the objective of making them more efficient. It proposes an innovative approach that couples optimization and simulation providing two main advantages; first it provides robust solutions for the addressed problem and second it provides more feasible solutions, which in turn will provide better support to ATC than the current technology. An analysis of the different components such as airspace, runways, taxiway network and terminals is conducted, pointing out that, some of the components are more sensitive to uncertainty like the departing runway, while other components are less sensitive to it like taxiway and terminals. In general, performance in terms of conflicts are considerably improved, confirming the benefits of the methodology. These results demonstrate that the methodology is able to improve the solution of the optimization when data input is tuned up. In this context, a crucial aspect of the methodology is the choice of the right input data to be tuned. The methodology presented is general enough and it can be adapted to any particular airport
> REPLACE THIS LINE WITH YOUR PAPER IDENTIFICATION NUMBER (DOUBLE-CLICK HERE TO EDIT) <
13
configuration, however, it is aimed at close-to-congestion airports with a big amount of traffic. As a future development of the methodology, the heuristic algorithm will be included into the simulation model to fully integrate the simulation and optimization in a loop that will progressively improve the solution at each time window of the sliding window approach. Further investigation will involve the choice of the uncertainty parameter values, and the choice of the parameter to fine tune at each iteration, so to represent uncertainty as much as possible in a realistic way and improve the solution robustness.
ACKNOWLEDGMENT “The authors would like to thank the Aviation Academy of
the Amsterdam University of Applied Sciences for supporting this study and the Dutch Benelux Simulation Society (www.dutchbss.org) and EUROSIM for the dissemination of the findings of this study.”
REFERENCES [1] AIRBUS, “Global Market Forecast Growing Horizon 2017-2036,”
AIRBUS, Blagnac Cedex, France, Ref, D14029465, April 2017. [2] M. Sama, A. D’Ariano and D. Pacciarelli, “Rolling horizon approach for
aircraft scheduling in the terminal contro, area of busy airports,” Transportation Research Part E, Vol. 60, pp. 140-155, Dec. 2013.
[3] F. Farhadi, A. Ghoniem and M. Al-Salem, “Runway capacity management-an empirical study with application to Doha International Airport,” Transportation Research Part E, Vol. 68, pp. 53-63, Aug. 2014.
[4] J. Guepet, O. Briant, J. Gayon and R. Acuna-Agost, “Integration of aircraft ground movements and runway operations,” Transportation Research Part E, Vol. 104, pp. 131-149, Aug. 2017.
[5] J. K. Kuchar and L. C. Yang, “A review of conflict detection and resolution modeling methods,” IEEE Transactions on Intelligent Transportation System, Vol. 1, no. 4, 179-189, Dec. 2000.
[6] D. Kjenstad, C. Mannino, T. C. Nordlander, P. Schittekat and M. Smedsrud, “Optimizing AMAN-SMAN-DMAN at Hamburg and Arlanda Airport,” in Proc. SESAR Innovation Days, Stockholm, Sweden, 26-28 Nov., 2013.
[7] D. Bertsimas and M. Frankovich, “Unified optimization of traffic flows through airports,” Transportation Science, Vol. 50, Issue1, pp. 77-93, Aug. 2015.
[8] J. MA, D. Delahaye, M. Sbihi and M. Mongeau, “Integrated optimization of terminal maneuvering area and airport,” in Proc. SESAR Innovation Days, Delft, The Netherlands, 8-10 Nov., 2016.
[9] S. Amaran, N. V. Sahinidis, B. Sharda, S. J. Bury, “Simulation optimization: a review of algorithms and applications,” Ann. Oper. Res., Vol. 240, no. 1, 351-380, 2016.
[10] A. R. Odoni J. Bowman, D. Delahaye, J. J. Deyst, E. Feron, R. J. Hansman, K. Khan, J. K. Kuchan, N. Pujet and R. W. Simpson, “Existing and required modeling capabilities for evaluating ATM systems and concepts,” International Center for Air Transportation Massachusetts Institute of Technology, Cambridge, MA, USA, Mar. 1997.
[11] SIMMOD. Available: http://www.atac.com/simmod-pro.html, 2016. [12] RAMS. Available: http://ramsplus.com/, 2017. [13] J. Banks, J. S. Carson, B. Nelson and D. M. Nicol, Discrete-event
System Simulation. Harlow, UK, Pearson Education Limited. [14] B. Delcaire and E. Feron, “Development of an on-site ground operations
model for Logan International Airport,” FAA Air Transportation Center of Excellence in Operations research, Cambridge, MA, USA, research rep. RR-97-09, Dec. 1997.
[15] G. Wei and J. Siyuan, “Simulation study on closed spaced parallel runway analysis using SIMMOD plus,” in Proc. Int. Conference on Intelligent Computation Technology and Automation, Changsha, China, 2010, pp. 344-347.
[16] P. Scala, M. Mujica and N. de Bock, “A divide and conquer approach for simulating an airport system,” International Journal of Simulation and Processing Modelling, Vol. 12, no. 6, pp. 470-484, 2017.
[17] SIMIO. Available: https://www.simio.com/, 2017. [18] M. Mujica, I. Flores, Applied Simulation and Optimization 2, Springer. [19] A. R. Odoni, “The importance of probability theory in the airport and air
traffic control sectors,” Int. Journal of Continuing Engineering Education and Life-Long Learning, Vol. 4, pp.105-113, Dec. 1994.
[20] N. L. Kleinman, S. D. Hill and V. A. Ilenda, “Simulation optimization of air traffic delay cost,” in Proc. Wintersim Congress, Washington, DC, USA, 1998, pp. 1177-1181.
[21] P. Arias, M. M. Mota, D. Guimarans and G. Boosten, “A methodology combining optimization and simulation for real applications of the stochastic aircraft recovery problem,” in Proc. EUROSIM Congress on Modelling and Simulation, Cardiff, UK, 2013, pp. 265-270.
[22] H. Lee, “Airport surface traffic optimization and simulation in the presence of uncertainties,” Ph.D. dissertation, Dept. of Aeronautics and Astronautics, Massachusetts Institute of Technology, Cambridge, MA, USA, 2014.
[23] M. Mujica, “Check-in allocation improvements through the use of a simulation-optimization approach,” Transportation Research Part A, Vol. 77, pp. 320-335, Jul. 2015.
[24] M. Mujica, P. Scala and D. Delahaye, “Improving airport performance through a model-based analysis and optimization approach,” in Applied Simulation and Optimization 2, 2nd ed., Springer, 2017, ch. 4, pp. 109-129.
[25] OptQuest. Available: http://opttek.com/products/optquest, 2018. [26] OAG, “OAG punctuality league,” OAG, www.oag.com, Jan. 2018. [27] J. E. Beasley, M. Krishnamoorthy, Y. M. Sharaiha and D. Abramson,
“Scheduling aircraft landings: the static case,” Transportation Science, Vol. 34, Issue 2, pp. 190-197, May 2000.
[28] A. Michelin, M. Idan and J. L. Speyer, “Merging of air traffic flows,” Journal of Guidance, Control, and Dynamics, Vol. 34, no. 1, pp. 13-28, Jan. 2011.
[29] C. Zuniga, D. Delahaye and M. A. Piera, “Integrating and sequencing flows in terminal maneuvering area by evolutionary algorithms,” in Proc. IEEE/AIAA 30th Digital Avionics Systems Conference, Seattle, WA, USA, 2011, pp. 1-32.
[30] F. Furini, M. P. Kidd, C. A. Persiani and P. Toth, “Improved rolling approaches to the aircraft sequencing problem,” Journal of Scheduling, Vol. 18, Issue 5, pp. 435-447, Jan. 2015.
[31] D. Toratani, S. Ueno and T. Higuchi, “Simultaneous optimization method for trajectory and sequence for receding horizon guidance in terminal area,” SICE Journal of Control, Measurement, and System Integration, Vol.8, no. 2, pp. 144-153, Mar. 2015.
[32] ICAO, “Air Traffic Management,” ICAO, Doc. 4444, 2007. [33] H. R. Idris, I. Anagnostakis, B. Delcaire, R. J. Hansman, J. P. Clarke, E.
Feron and A. R. Odoni, “Observations of departure processes at Logan Airport to support the development of departure planning tools,” Air Traffic Control Quarterly, Vol. 7, no. 4, pp. 229-257, 1999.
[34] M. J. Frankovich, “Air traffic flow management at airports: a unified optimization approach,” Ph.D. dissertation, Sloan School of Management, Massachusetts Institute of Technology, Cambridge, MA, USA, 2012.
[35] X. Hu and W. Chen, “Receding horizon control for aircraft arrival sequencing and scheduling,” IEEE Transactions on Intelligent Transportation Systems, Vol. 6, no. 2, 198-197, Jun. 2005.
[36] X. Hu, W. Chen and E. Di Paolo, “Multiairport capacity management: genetic algorithm with receding horizon,” IEEE Transactions on Intelligent Transportation Systems, Vol. 8, no. 2, pp. 254-263, Jun. 2007.
[37] Z. Zhan, J. Zhang, Y. Li, O. Liu, S. K. Kwok, W. H. Ip and O. Kaynak, “An efficient ant colony system based on receding horizon control for the aircraft arrival sequencing and scheduling problem,” IEEE Transactions on Intelligent Transportation Systems, Vol. 11, no. 2, pp. 299-412, Jun. 2010.
[38] M. Liang, D. Delahaye and X. Xu, “A novel approach to automated merge 4D arrival trajectories for multi-parallel runways,” in Proc. ENRI International workshop on ATM/CNS, Tokyo, Japan, 17-19 Nov., 2015.
[39] J. Ma, “Aircraft merging and sequencing problems in TMA,” M.S. thesis, ENAC, Toulouse, France, 2015.
[40] S. Kirkpatrick, C. D. Gelatt and M. P. Vecchi, “Optimization by simulated annealing,” Science, Vol. 220, Issue 4598, pp. 671-680, May 1983.
[41] EUROCONTROL, “Industry monitor,” EUROCONTROL, Brussels, Belgium, Issue 190, Feb. 2017.

> REPLACE THIS LINE WITH YOUR PAPER IDENTIFICATION NUMBER (DOUBLE-CLICK HERE TO EDIT) <
14
[42] EUROCONTROL, “Strategic, pre-tactical, tactical and post-ops air traffic flow and capacity management.” Available: http://www.eurocontrol.int/service/strategic-pre-tactical-tactical-and-post-ops-air-traffic-flow-and-capacity-management , 2018.
[43] ICAO, “Aircraft Operations,” ICAO, Vol. 1 Flight procedures Doc. 8168, 2006.
Paolo Scala received the B.Sc. and M.Sc. in industrial engineering at the University of Calabria, Rende, Italy in 2011 and 2014 respectively; He is currently a PhD candidate with the Ecole Nationale de l’Aviation Civile(ENAC)/Universite Paul Sabatier, Touluose, France in the subject of applied mathematics. He is a
Researcher and Lecturer at the Aviation Academy of the Amsterdam University of Applied Sciences, Amsterdam, The Netherlands. He has a publication in an International Journal, and a chapter in a book. He published and presented in many international conferences. His research interests lie in the use of simulation and optimization in air traffic management.
Miguel Mujica holds a Ph.D and M.Sc. in industrial informatics and Operation research from the AUB in Barcelona and Mexico respectively. He is an Associate Professor at the Aviation Academy of the Amsterdam University of Applied Sciences in the Netherlands. He was subdirector of aviation at the Autonomous University of Barcelona. He is chair of the
Dutch Benelux Simulation Society and executive board member of the EUROSIM federation of simulation societies of EUROPE. Dr. Mujica has given several courses in modelling, simulation and optimization in different countries for industrial and academic audiences. He is the co-author of four books and numerous scientific papers on simulation, operations research and aviation. His research interests lie in the use of simulation and heuristics for the optimization and performance analysis of aeronautical and logistic operations. Currently he studies diverse problems of the Aviation Network of Mexico City and the Multi-airport System of North-Holland among other activities. Recently he has been appointed as Researcher I in the National Council of Research of Mexico.
Ji Ma received the B.Sc. degree in Aeronautics from Civil Aviation University of China (CAUC), Tianjin, China, in 2013; and the Eng. degree in Air Traffic and Computer Science from École Nationale de l'Aviation Civile (ENAC), Toulouse, France, in 2015. She is currently working toward the Ph.D. degree at ENAC. Her research concerns
airport traffic optimization.
Daniel Delahaye received the B.Eng. degree from Ecole Nationale de l’Aviation Civile (ENAC), Toulouse, France; the M.Sc. degree in signal processing from National Polytechnic Institute of Toulouse, in 1991; and the Ph.D. degree in automatic control from Aeronautic and Space National School, Toulouse in 1995. In 1996 he was Postdoctoral Researcher
with the Department of Aeronautics and Astronautics, Massachusetts Institute of Technology, Cambridge, MA, USA. In 2012 he received his tenure in applied mathematics from the Universite Paul Sbatier, Toulouse, France. He is currently the Head of the Optimization Group with the Mathematiques Appliquees, Informatique et Automatique pour l’Arien (MAIAA) Laboratory, ENAC, where he is conducting research on stochastic optimization for airspace design and large-scale traffic assignment.