tackling financial exclusion: data disclosure and area ... · tackling financial exclusion: data...
TRANSCRIPT
Tackling Financial Exclusion Data Disclosure and Area-Based Lending Data
Final Report
November 2014
Henry N Sissons P Coombes M Ferreira J and Pollard J Contact NickHenrycoventryacuk
Sponsors Foreword
There is global acceptance that fair access to financial goods and services is critical to achieving
improvements in economic well-being and tackling financial inclusion especially amongst low income
communities
Big Society Capital Citi the Community Investment Coalition and Unity Trust Bank have come
together to commission this research from Coventry and Newcastle Universities to support such fair
access We are organisations committed to tackling financial exclusion and believe that transparency
and data disclosure have a critical role to play in achieving this We believe that this data has real
potential to improve the prospects for individuals communities businesses and social enterprises This
report helps to highlight the value of data disclosure while setting an ambitious agenda for a stronger
data disclosure framework that can really have impact in supporting increased competition in financial
service markets and tackling financial exclusion
The G20 has identified financial inclusion (for individual households as well as enterprises) as a key
driver of economic growth reduced economic vulnerability for individual households poverty alleviation
and improved quality of life for people around the world It recognises data and measurement as
essential to improving financial inclusion As the importance of financial inclusion has taken hold so has
interest in better data at both the global and national level
The United Kingdom Government has recognised the need for transparency and data disclosure within
the financial services market to improve access to financial services and products through increased
competition In 2013 the launch of the voluntary framework for disclosure of bank lending data was a
significant step forward in creating transparency about the provision of banking services at a geographic
level
The Financial Secretary to the Treasury speaking in the House of Commons in July 2014 reaffirmed the
Governmentrsquos commitment to data disclosure stating that
ldquohellipimproving competition in banking is a No 1 priority for many jurisdictions not least the UK The
publication of the (bank lending) data will therefore play a big role in improving competition by enabling
challenger banks smaller building societies credit unions and CDFIs to identify and move into areas
that are not currently served by the larger banks It will also mean that our economy is better served by
their offering finance to customers who are crying out for support to help their business grow I certainly
believe that the project (disclosure of bank lending data) is vital and that it will play a key role in
improving lending in areas where it is currently lackingrdquo
After the USA the UK is now a G20 and world leader in bank transparency and has a real opportunity to
set the standard for those countries looking to follow this path
As with the release of any new data set the opportunities and limitations of the data only become clear
when people start to use it This report is the first attempt to fully analyse the bank lending data and to
really understand how it can be used to further increased competition and tackle financial inclusion It
sets out some key recommendations for how the voluntary framework can be strengthened so that it
meets its original objectives and becomes a potentially replicable model for other countries to adopt
Contents
Executive Summary i Introduction data disclosure as a tool in overcoming financial exclusion i What does the BBA Personal Loans Lending Postcode Data tell us ii What does the BBA SME Lending Postcode Data tell us iv The BBA Postcode Lending Data the need to know more v Data disclosure and area-based information for other lending market providers vi Recommendations viii
1 Why this Report 1 11 The issue of financial exclusion 1 12 The contribution of data disclosure to tackling financial exclusion 1 13 The 2013 voluntary bank data disclosure scheme in Great Britain 2 14 Study objectives 2 15 Study methodology 3 16 The structure of this Report 3
2 The BBA Postcode Sector Lending Datasets 4 21 Introduction 4 22 Use of Postcode Sector for reporting 4 23 The BBA Personal Loans Lending Dataset 5 24 The BBA SME Lending Dataset 9 25 Bank data disclosure international developments 15 26 The BBA Postcode Sector Lending Datasets A Summary 16
3 The BBA Personal Lending Dataset An Analysis 19 31 Aggregate personal lending per Postcode Sector 19 32 Level of personal lending per capita 20 33 The bank personal lending data mapped 21 34 A comparison of personal lending data with area-based Census data 25 35 The BBA Personal Lending Dataset A Summary 27
4 The BBA SME Lending Dataset An Analysis 28 41 Aggregate SME lending per Postcode Sector 28 42 Business lending per SME 30 43 BBA Business Lending A Summary 32
5 Other Geographies of Lending 33 51 Introduction the lending jigsaw 33 52 Geographies of personal lending other finance providers 33 53 Geographies of SME lending other finance providers 37 54 Summary The jigsaw of lending provision 40
6 Conclusions and Recommendations 42 61 Building an understanding of the jigsaw of financial provision some conclusions 42 62 Recommendations 43
Annex 1 The BBA Postcode Lending Data Selected Maps 45
Acknowledgements
We would like to acknowledge the sponsors of this research and their commitment to data disclosure to support
financial access We acknowledge also the contributions of Assunta Muglia of Citi Community Development
Faisel Rahman OBE of Fair Finance and Stuart Gill of Coventry University for his cartographic expertise
Census data and Business Counts contained within this report were accessed through NOMIS The data used is
Crown Copyright and has been made available by the Office for National Statistics (ONS) through NOMIS It is
reproduced with permission Neither the ONS nor NOMIS bears any responsibility for the analysis and
interpretation of the data presented in this study
i
Executive Summary
Introduction data disclosure as a tool in overcoming financial exclusion
Today it is recognised that fair access to financial goods and services is a basic requirement for full
engagement in modern society1
The supply of financial goods and services is dominated by the actions of a small number of financial
institutions but substantial numbers of individuals businesses and communities remain underserved
and excluded from such market provision ndash or may pay a very high price to gain access to finance
In the UK around 14 million adults are without a basic bank account 7 million are accessing sources
of high cost credit substantial numbers of SMEs continue to struggle to access bank finance and a
new round of bank branch closures have just been announced In 2013 the unmet demand of
individuals and businesses excluded from mainstream finance (lsquothe finance gaprsquo) was estimated at
around pound6 billion per annum2
But who and where are these underserved and excluded businesses and communities ndash and how
can we intervene to support a diversity of providers to best meet their financial needs
Data disclosure can support the ability to target financial exclusion by providing the area-based
lending data and information necessary to identify local lending markets and finance providers and
crucially identify market gaps and the excluded
As has been shown in the USA - using evidence from transparent comprehensive and robust data
disclosure - exclusion can be targeted through the actions of banks themselves through new
competition and financial partnerships with alternative and community-based providers by the
activism of empowered communities and through more effective policy interventions
In December 2013 the British Bankers Association (BBA) and Council for Mortgage Lenders (CML)
voluntarily published net total lending data by Postcode Sector for Great Britain drawn from
participating lenders across three categories3
loans and overdrafts to SMEs
mortgages and
unsecured personal loans (excluding credit cards)
This process of voluntary disclosure of bank lending data by the BBA and CML puts the UK at the
forefront of international efforts for greater transparency to support financial inclusion
This study
assessed the first three quarterly releases of this major new development in data
disclosure and its contribution to mapping area-based patterns in personal and SME
lending markets in Great Britain (the study did not cover the mortgage lending data
release) The process included reviewing the construction and comprehensiveness of
the lending data sets as well as conducting an initial analysis of the data made available
reviewed the ability to undertake comprehensive area-based lending analysis across
providers other than banks in personal and SME markets To draw a comprehensive
picture of financial exclusion across the UK its implications and how it is being
addressed we need to understand the lending conducted by all major sources of
financial provider (bank and lsquoalternativersquo) across the UK
Overall the study illustrates the considerable limits of the currently available area-based lending data
released by the BBA and other stakeholders and recommends improvements to support the ability to
assess (gaps in) local lending markets
1 See httpwwwcommunityinvestmentorguk
2 Henry N and Craig P (2013) Mind the Finance Gap Evidencing demand for community finance CDFARBS
Group httpwwwcdfaorgukpolicypublicationsmindthefinancegap 3 See httpswwwbbaorguknewsstatisticspostcode-lendingbritish-lenders-set-out-levels-of-borrowing-across-
country-in-major-move-for-transparencyVBF9H2fQMaI
ii
What does the BBA Personal Loans Lending Postcode Data tell us
The data made available places substantial limits on the possibilities for analysis with a single
variable for net lending only released
Total net levels of personal lending vary significantly between Postcode Sector areas in Great Britain
In Quarter 4 2013 the range was from in excess of pound12 million to just over pound30000 (for those Postcode
Sectors with non-zero values)
Trend analysis (like-for-like comparisons over time) should be possible in time with greater numbers of
quarterly data releases although limited explanation of database construction and redaction activity
introduces some uncertainties around direct comparison of reported lending totals at Postcode Sector
level
Through a process of matching of bank lending data with UK Census data at Postcode Sector
lending per head of adult population can be calculated
Figure ES1 overleaf provides a mapping of lending per head for Postcode Sectors against Local
Authority boundaries It can be seen that data exists for all Local Authorities but that patterns in
lending are difficult to discern One apparent pattern is of on average lower levels of personal lending
in a large part of rural Great Britain (but rural Postcode Sectors tend to cover larger areas making their
patterns more visible than urban areas in this map)
Further maps of lending per head of adult population by Parliamentary Constituency and for Devolved
Administrations are provided in the Annex to the Main Report
Patterns of lending as we know are driven by much more than levels of adult population (lsquobeing an
adult who has the potential to borrowrsquo) and are related to a range of borrower characteristics (for
example income employment and credit history) Utilising UK Census data bank lending levels by
Postcode Sector were analysed against the lsquodeprivation characteristicsrsquo of area populations (see
Conclusion 1 Box below)
Overall the BBA dataset provides a measure of the lsquosupplyrsquo of lending to individual Postcode Sectors
The data can be adjusted for population size (a crude proxy for potential lsquoarea-based demand for
lendingrsquo) and assessed in relation to various population characteristics of the Postcode Sector
However in the absence of any released bank lending data on numbers of lending transactions or
borrower characteristics we have no knowledge of actual (types of) bank borrowers except that they
reside in a certain Postcode Sector
Conclusion 1 The BBA Personal Lending Dataset shows that
Median personal lending per head of the adult population across Postcode Sectors in Great
Britain in 2013 was pound602 Lending per adult in the lowest 10 per cent of Postcode Sectors was
around two-thirds of this figure or less whereas in the highest 10 per cent of Postcode Sectors
lending per adult was around a third or more above the median
Total personal lending tends to decline as the arearsquos deprivation level increases (once
adjusted for population size) The data confirms a previously identified lending pattern
Publication of the data at Postcode Sector level increases the technical requirements and
costs of meaningful data analysis Given the detailed postcode base of the underlying data there
is scope to make additional data available for other more useful and commonly used units of
analysis (such as Lower-layer Super Output AreasScottish Data Zones) through relatively
straightforward processes
Expanded data release on a range of indicators of lending activity is required to allow
substantial and robust analysis of areas underserved by mainstream banks ndash these are needed to
accurately assess how many and what types of borrowers in the local population are and are not
receiving personal bank lending
iii
Figure ES1 Average Bank Personal Lending per Head of Adult Population by Local Authority (GB)
iv
What does the BBA SME Lending Postcode Data tell us
Overall the SME data made available and the lack of fit with other sources of published data places
substantial limits on the possibilities for analysis
A simple ranking using the Quarter 4 2013 data demonstrates an enormous range in the scale of total
SME lending across Postcode Sectors from pound215 million down to less than pound40000 in a number of
localities (see Figure ES2 below)
Figure ES2 Total Bank SME lending by Postcode Sector (GB) Quarter 4 2013
Trend analysis (like-for-like comparisons over time) should be possible in time with greater numbers of
quarterly data release After three quarters of released data there is considerable volatility evident in
the SME lending data Limited explanation of database construction and redaction activity reduces the
ability to account for this volatility at Postcode Sector level including concluding if it is a true reflection
of overall lending activity
v
The BBA publishes a regional comparison of total SME lending figures against published data on
regional share of turnover4 In the most recent release all regions and Devolved Administrations
receive a share of lending within +- 2 per cent of their regional share of SME turnover the exceptions
are London which receives 8 per cent less lending given its turnover share and the South West which
receives a 4 per cent greater share of lending than its turnover share would suggest
An alternative estimation for business population is made in the report at the level of Postcode Area (a
more detailed geography than region but considerably less detailed than Postcode Sector) This
estimation involves the calculation of SME lending per business in each Postcode Area in Great
Britain (see Conclusion 2 Box below)
The analyses reported by BBA and ourselves seek to create plausible if crude proxies for potential
lsquoarea-based SME demand for lendingrsquo to be matched against the area-based SME lending figures
(lsquosupplyrsquo) in the BBA dataset to provide further insight on lending patterns It would be possible to
refine the estimates presented here (using secure access microdata) However in the absence of any
released bank lending data on numbers of lending transactions or borrower characteristics (for
example micro-business or medium-sized enterprise) the potential value for understanding
underserved markets and potential market gaps is considerably reduced
Conclusion 2 The BBA SME Lending Dataset shows that
Average (median) SME lending per business in Great Britain in 2013 was pound47072 Lending per
business in the lowest 10 per cent of Postcode Areas was below pound35000 and in the highest 10 per
cent of Postcode Areas lending per business was over pound68000
Expanded data release on a range of indicators of lending activity is required to allow
substantial and robust analysis of areas underserved by mainstream banks ndash these are needed to
accurately assess how many and what types of borrowers in the local business population are and
are not receiving SME bank lending
The BBA Postcode Lending Data the need to know more
At the time of this study the BBA had released data on total lending at the Postcode Sector level for
Quarters 2 3 and 4 of 2013 While this new data disclosure is very welcome the analytical power of
the released data is substantially constrained by the limited content of the data In addition there
are some ambiguities around the current process of database construction which place additional
limits on data analysis
Data content a number of issues have been identified
Market coverage the data released covers approximately 60 per cent of the total
national SME lending market and 30 per cent of the total national unsecured credit
market (excluding credit cards) including only 60 per cent of bank lending within the
unsecured credit market
Lending totals only provide a partial picture of lending patterns additional data desired to
allow substantial analysis would include
ndash number of transactions including number of declines
ndash individual loan amounts
ndash markers of cost of loan release and
ndash characteristics of the borrower (for example gender ethnicity) or business (for
example turnover employment legal form such as charity) and
The use of Postcode Sector the scale of geographical release does not support detailed
neighbourhood analysis of lending patterns it also introduces a lack of fit with the
geographical building blocks commonly used for major survey datasets on business and
population characteristics (and with which lending patterns need to be linked to enable
purposive analyses)
4 httpswwwbbaorguknewsstatisticspostcode-lendinglenders-set-out-levels-of-borrowing-from-across-the-
country-2VFe992c2bIU
vi
Database construction Some data is not published due to filtering processes There is limited
accompanying guidance provided with the dataset and the process of dataset construction and quality
assurance are not fully explained Within the dataset a minority of postcodes are affected by
significant levels of volatility across time Without further clarity on data construction processes it is
unclear if the volatility observed is due to genuine changes in lending patterns the use of filter
processes which are applied or some error in the data
It would be helpful if BBA published an additional technical report detailing these issues as well as
addressing expected and actually volatility in the data
Conclusion 3 The UK BBA postcode lending data scheme is a valuable step toward bank
data transparency and puts the UK at the forefront of international developments ndash but current
limitations substantially constrain analysis of area-based lending patterns
Data disclosure and area-based information for other lending market providers
The market coverage reported under the voluntary BBA scheme covers approximately 61 per cent of
both the personal and SME lending markets5 It does not include all bank lenders and in addition
there exist a further set of (lsquoalternativersquo) lenders in personal and SME markets
To draw a comprehensive picture of financial exclusion across the UK its implications and how it is
being addressed we need to understand the lending conducted by all major sources of financial
provider across the UK (bank and alternative) This is especially so given market developments such
as crowdfunding major regulatory developments such as is on-going in payday lending markets and
other policy initiatives such as the British Business Bank encouraging lsquochallenger banksrsquo and Big
Society Capital seeding social investment markets
Table ES1 overleaf provides a review of the current position on area-based lending data disclosure
across the landscape of UK personal and business lending providers
Conclusion 4 There exists a paucity of comprehensive lending data available that is reported
at an area-based level ndash and which could provide the basis for detailed analysis and understanding
of local lending patterns Nevertheless
The voluntary BBA Postcode Lending Data Scheme places the UK at the frontline of international developments in data disclosure ndash but as it currently stands the data has substantial limitations for those seeking to understand and respond to local lending patterns
Developments in the USA based on the Home Mortgage Disclosure Act and the Community Reinvestment Act continue to provide the leading international exemplar of the power of data transparency and disclosure in lending markets
The Walker Guidelines for Disclosure and Transparency in Private Equity provide an example of a widely embraced ndash and independently monitored - voluntary industry disclosure scheme
In virtually all personal and SME lending markets there exist processes of annual collection of lending data that provide the framework for area-based information disclosure Indeed crowdfunding platforms provide the potential model for (real-time) routine collection of granular financial data in a new era of lsquoopen datarsquo and
Individual UK pioneers committed to data disclosure ndash such as Fair Finance - are identifiable as lending institutions who have overcome issues of data availability data protection and cost to use area-based information to both support their business activities and provide accountability through transparency
5 See httpswwwbbaorguknewsstatisticspostcode-lendingbritish-lenders-set-out-levels-of-borrowing-across-
country-in-major-move-for-transparencyVFiUpmc2bIV Point 7
vii
Table ES1 Data Disclosure across the Lending Jigsaw
Lending Market
Provider Disclosure of Area-Based Lending Information
Personal
lsquoMainstream Banksrsquo
Recently introduced voluntary BBA Postcode Lending Data Scheme covers
approximately 60 per cent of personal loans lending undertaken but data limitations
substantially constrain usefulness for area-based analysis currently
lsquoHigh cost lendersrsquo
Currently no annual lending data on the sector is collected which could form the
basis for comprehensive disclosure including at an area-based level
There are examples of individual lenders actively working on data disclosure and
work by organisations such as the Competition Markets Authority has shown the
power of area-based data provision in supporting effective regulation and consumer
empowerment
Credit Unions
Annual lending returns are made by the sector to the financial regulator but no
recent comprehensive detailed analysis of the geography of lending by credit
unions exists or is regularly published
Community Development Finance Institutions
Recent developments in sector-wide annual reporting (Inside Community Finance)
offer the possibility of area-based reporting at postcode level
Individual lender Fair Finance has pioneered data disclosure of lending
Crowdfunding (peer-to-peer)
Granular financial lending data is collected routinely and published (almost in real-
time) by providers and increasingly in aggregate form as sector associations and
organisations have developed Area-based analysis is however lacking to date
SME
lsquoMainstream Banksrsquo
Recently introduced voluntary BBA Postcode Lending Data Scheme covers
approximately 60 per cent of bank lending to SMEs undertaken but data limitations
substantially constrain usefulness for area-based analysis currently
Community Development Finance Institutions
Recent developments in sector-wide annual reporting (Inside Community Finance)
offer the possibility of area-based reporting at postcode level
Individual lender Fair Finance has pioneered data disclosure of lending
Asset Based Lenders
The Asset Based Finance Association release annual data on the level and type of
asset based finance provided by its members but there is no area-based
exploration of the data provided
Crowdfunding (debt and equity)
Granular financial lending data is collected routinely and published (almost in real-
time) by providers and increasingly in aggregate form as sector associations and
organisations have developed Area-based analysis is however lacking to date
Business Angels
Recent report analysed lending at regional level UK Business Angels Association
currently undertaking major sector research project that offers the potential for
detailed area-based analysis
Venture Capital
Comprehensive data collection and publication is undertaken voluntarily under the
Walker Guidelines for Disclosure and Transparency for Private Equity ndash but area-
based analysis is not undertaken or reported routinely
viii
Recommendations
Recommendation 1 Support the BBA its members and other financial service providers to
further develop the power value and robustness of the voluntary postcode lending data
disclosure scheme through five factors (see Table ES2)
Table ES2 Recommended Developments of the BBA Postcode Lending Data
Issue Current Position Recommendation
Data lsquofiltersrsquo Filter rules are ambiguous at
margins
Introduce and report a common system
of cell lsquomarkersrsquo across reported
datasets to identify reason for blank or
missing data
Evidence of
unexplained data
volatility across
datasets
Opaque process of data
construction
Explanatory notes including
on quality assurance
processes provide little
insight
lsquoEarly dayslimited numberrsquo of
data releases
Expand accompanying notes to provide
detail of coverage and construction
process across all participating lenders
(and BBA) for each data release
Provide an additional technical report on
dataset construction and which
addresses issues of expected and
actual volatility
The detail should allow like-for-like
comparisons of data cells across
lenders and data releases as much as
possible
Use of Postcode
Sector for
reporting
Scale does not allow detailed
analysis or ease of
comparison with other key
data
Also to report at Lower-layer Super
Output AreasScottish Data Zones
(LSOA) or if not Middle-layer Super
Output Areas (MSOA)
Some trade-off between more detailed
geographies and data disclosure may
occur but at minimum this should be
tested
Limited lending
data
Total lending variable by
Postcode Sector only
Expand data release to include number
of transactions including declines
individual loan amounts markers of cost
of loan release and characteristics of
the borrower (eg gender ethnicity) or
business (eg turnover employment
legal form)
Market coverage Partial Seek common standard publication of
lending data by all BBA members and
related financial service providers
Recommendation 2 Build on the now almost complete annual data collection and reporting
exercises of most market providers to support area-based lending disclosure
Virtually all lsquosegmentsrsquo of the personal and SME markets are now undertaking annual reporting and
disclosure of lending activity to a greater or lesser extent This provides a set of reporting activity
which in unison has the potential to provide comprehensive data on area-based lending and local
lending markets ndash but only given understanding of the strategic power and operational requirements of
area-based information reporting The lsquoownersrsquo of these reporting frameworks principally trade and
sector associations should be actively engaged with and supported to develop area-based
information reporting including through highlighting existing examples
PO
WE
R O
F D
ISC
LO
SU
RE
ix
Recommendation 3 Look to build on the UK experience of developing data disclosure to
support international developments in area-based lending disclosure
There is growing international interest in transparency data disclosure and financial exclusion The
UK is learning from and now sits alongside the USA as an international example Within the UK there
now exists
Theoretical policy and practitioner understanding of the power costs and benefits of
data disclosure including working examples
A set of mainstream financial institutions engaged in voluntary data disclosure
Provision of lending information across personal and SME market segments and
provider categories and
Understanding of the key metrics and data points to support area-based lending
1
1 Why this Report
11 The issue of financial exclusion
Financial exclusion is a pervasive issue within UK economy and society made both
more transparent and intense in the aftermath of the global financial crisis Today it is
recognised that fair access to financial goods and services is a basic requirement for
full engagement in modern society6
The supply of financial goods and services is dominated by the actions of a small
number of financial institutions but substantial numbers of individuals businesses and
communities remain underserved and excluded from such market provision ndash or may
pay a very high price to gain access to finance In the UK around 14 million adults
are without a basic bank account 7 million are accessing sources of high cost credit
substantial numbers of SMEs continue to struggle to access bank finance and a new
round of bank branch closures have been announced In 2013 the unmet demand of
individuals and businesses excluded from mainstream finance (lsquothe finance gaprsquo) was
estimated at around pound6 billion per annum7
12 The contribution of data disclosure to tackling financial exclusion
In 2000 the UK Social Investment Task Force (2000) identified bank data disclosure
as an important tool in tackling financial exclusion8
In 2006 drawing on bank data disclosure experience in the USA the New Economics
Foundation (NEF) demonstrated the power of potential disclosure and how
transparent and public information can identify who and where the banks are
reaching - and who remains outside of the financial system9
Mapping localised patterns of lending supports understanding of why patterns of
financial exclusion occur and how these patterns may be targeted through the actions
of banks themselves in partnership with alternative and community-based alternative
providers and through policy interventions However in 2006 NEF concluded that
lsquothere is virtually no area-based disclosure by UK banksrsquo and in 2010 the Task Force
report Social Investment Ten Years On noted that the recommendation for voluntary
data disclosure had not proved successful10
In 2013 the Parliamentary Commission on Banking Standardsrsquo report lsquoChanging
Banking for Goodrsquo was able to welcome the forthcoming disclosure of lending data by
banks11
The Commission noted that
lsquoIncreased disclosure of lending decisions by the banks is crucial to enable
policy- makers more accurately to identify markets and geographical areas
poorly served by the mainstream banking sector The industry is currently
working towards the provision of such information We welcome this It will
be important to ensure that the level of disclosure is meaningful and
provides policy-makers with the information necessary accurately to identify
communities and geographical areas poorly served by the mainstream
banking sector The devil will be in the detail of the disclosure regime that is
put in placehellipThe Commission therefore supports the Governmentrsquos
proposal to legislate if a satisfactory regime is not put in place by voluntary
meansrsquo
6 See httpwwwcommunityinvestmentorguk
7 Henry N and Craig P (2013) Mind the Finance Gap Evidencing demand for community finance
CDFARBS Group httpwwwcdfaorgukpolicypublicationsmindthefinancegap 8 See httpwwwsocialinvestmenttaskforceorg
9 See NEFWoodstock Institute (2006) Full Disclosure Why bank transparency matters A comparison of
US and UK lending practices in disadvantaged communities 10
See httpwwwsocialinvestmenttaskforceorgdownloadsSITF_10_year_reviewpdf p12 11
See httpwwwparliamentukdocumentsbanking-commissionBanking-final-report-vol-iipdf p201
2
Furthermore given the recent evidence of and drive for greater diversity of providers
the call for lending data disclosure is now directed at all financial service providers
(including pay day lenders peer-to-peer community development finance institutions
and credit unions alongside banking institutions)12
13 The 2013 voluntary bank data disclosure scheme in Great Britain
On 17 December 2013 the British Bankers Association (BBA) and Council for
Mortgage Lenders (CML) voluntarily published total lending data by Postcode Sector
drawn from participating lenders across three categories13
loans and overdrafts to SMEs (small and medium-sized enterprises)
mortgages and
unsecured personal loans (excluding credit cards)
At the time of our analysis three data releases had taken place covering Quarters 2
3 and 4 in 2013
In terms of the market coverage of participating lenders
for loans and overdrafts to SMEs data released cover about 60 per cent of the
total national market of all SME lending by banks and building societies
for mortgages data released cover about 73 per cent of the total national
residential mortgage market and
for unsecured personal loans (excluding credit cards) data released represent 60
per cent of all personal loans but only 30 per cent of the total national unsecured
credit market
This process of voluntary disclosure of bank lending data by the BBA and CML has
put the UK at the forefront of international efforts for greater transparency to support
financial inclusion
14 Study objectives
This research study had three key objectives
To map current bank disclosure data and delineate patterns of lending in personal
and SME lending markets (and to identify any data limitations)
To compare patterns of lending against
ndash the geography of deprivation and
ndash the geography of SMEs
To provide an initial comparison of the findings with the current evidence base for
other lsquogeographies of financial provisionrsquo in similar markets - contributing to a more
comprehensive picture of the landscape of financial demand and provision
The provision of substantially greater amounts of comprehensive area-based lending
data provides a major opportunity to identify a further piece in the jigsaw puzzle of
localised patterns of financial provision in Great Britain
The ultimate aim is for the study findings to support the ability for new and innovative
financial partnerships to target underserved markets and the market failures that lie
behind and perpetuate issues of poor access to finance and financial exclusion
12
See httpwwwcommunityinvestmentorgukwp-contentuploads201307Disclosure-wrap-up-report-final-July-131pdf 13
See httpswwwbbaorguknewsstatisticspostcode-lendingbritish-lenders-set-out-levels-of-borrowing-across-country-in-major-move-for-transparencyVBF9H2fQMaI
3
It should be noted that the study only considered data on personal lending and SME
lending and not disclosed data on mortgage lending
15 Study methodology
The study methodology comprised
Testing the British Bankersrsquo Association (BBA) published personal and SME bank
postcode lending datasets14
Statistical description and mapping of the datasets
For personal lending analysis and mapping against Census characteristics
(lsquodeprivationrsquo)
For SME lending analysis and mapping against business demography
(lsquodemandrsquo)
Literature review of geographies of lending by other financial providers within
personal and SME lending markets and
Recommendations
16 The structure of this Report
Following this introduction the report is structured as follows
Section 2 reviews the construction comprehensiveness and robustness of the
released BBA lending datasets
Section 3 analyses and maps the personal lending dataset including against
measures of deprivation
Section 4 analyses and maps the SME lending dataset including against business
demography
Section 5 sets out existing knowledge of the area-based lending patterns of other
finance providers based on a literature review and
Section 6 draws Conclusions and provides Recommendations
14
The analysis which follows uses the data released for Quarter 4 2013 and was downloaded on 15th
July 2014 This dataset release also included columns providing data for Quarters 2 and 3 2013 which we have also used for change over time and averages There are some discrepancies between the previous quartersrsquo figures included in the Quarter 4 dataset and those released previously for Quarters 2 and 3 It is unclear what accounts for these differences and whether they are data revisions The supporting documentation does not mention or account for these discrepancies
4
2 The BBA Postcode Sector Lending Datasets
21 Introduction
At the time of this study the BBA had released three sets of quarterly postcode sector
lending data for Great Britain ndash on 17 December 2013 8 April 2014 and 11 July 2014
The data covers Quarters 2 3 and 4 2013
The datasets are accompanied by a brief analytical commentary and a set of
accompanying notes describing the coverage and content of the dataset including
filters which have been applied to ensure customer confidentiality15
On announcement of the postcode data release the BBA Chief Executive Anthony
Browne said16
ldquoThe banking industry is committed to transparency and is actively
supporting the government business and community groups in
understanding the borrowing landscape for individuals and SMEs across the
UK
This landmark voluntary agreement between the industry and government
makes the UK industry one of the most transparent in the world and builds
on our earlier commitments
The publication of thousands of post codes level figures will help promote
greater competition between finance providers and lead to better evidence-
based policy makingrdquo
The aims of this section are to describe the data released and assess the overall data
quality (including the accompanying explanatory documentation)
22 Use of Postcode Sector for reporting
The lending data are released at Postcode Sector level Postcodes in the UK have a
hierarchical structure (see Table 21)
Table 21 Hierarchy of Postcode geographic units
Example Geographic Unit Number in UK
PO Postcode Area 124
PO16 Postcode District 3108
PO16 7 Postcode Sector 12358
PO16 7DZ Unit Postcode 175 million approx (Live)
Source Table reproduced from the Office for National Statistics17
The most detailed level is the Unit Postcode which is the full postcode included in
postal addresses (there are approximately 175 million live postcodes) Above this is
the Postcode Sector which contains aggregations of Unit Postcodes These are
subject to some change over time as new (unit) postcodes are introduced and others
are terminated The BBA data contains cells for 10959 Postcode Sectors It should be
noted that not all of these Postcodes Sectors are both in use and cover residential
areas as is shown by Census 2011 population figures only being available for 8977
Postcode Sectors
15
See httpswwwbbaorguknewspress-releasesborrowing-levels-reported-by-british-lendersVBGilWfQMaI 16
httpswwwgovukgovernmentnewslending-data-for-10000-postcodes-to-be-published 17
httpwwwonsgovukonsguide-methodgeographybeginner-s-guidepostalindexhtml
5
There are a number of limitations to the use of Postcode Sector as the geographical
unit at which the data are released Postcodes are subject to change over time in both
their coverage and existence18
More substantively from the point of view of data
analysis is that Postcode Sector boundaries are not aligned to administrative
boundaries and the geographical scales at which other data is routinely released and
analysed For a few datasets (for example the Census) the Office for National
Statistics provides data estimations for Postcode Sector on a best-fit basis but for
other datasets researchers must try to lsquofitrsquo those figures to the postcode geography (a
relatively onerous and specialist task) It would be helpful if the lending data could
be released for more standard geographies in addition to Postcode Sectors
An important issue is whether the Postcode Sector level is detailed enough to allow for
meaningful analysis of the lending data from either a policy or delivery perspective
Patterns of wealth and deprivation change relatively quickly over space in urban areas
while Postcode Sectors contain on average more than 5000 adult residents It would
be most helpful to have data also at the Lower-layer Super Output
AreasScottish Data Zones (LSOAs) for which data from other sources is
available to compare lending patterns with area characteristics of interest
LSOAs are on average smaller in population size than Postcode Sectors and this
would allow better identification of different types of areas (for example deprived
areas) There would likely be some trade-off between more detailed geographical data
and the scale of data redaction in the lending data because of issues of confidentially
The extent of this trade-off is unclear but should be tested This would be an important
step in delivering more detailed geographical data
A next best solution would be to also release data at Middle-layer Super Output Areas
(MSOAs) MSOAs also have the same useful information from other sources as
LSOAs but are on average of a comparable size to Postcode Sectors This matching
process to other geographies could be undertaken at the data preparation stage to
enable full postcodes to be matched as accurately as possible using publically
available files which allow look-ups from full postcodes to administrative or Census
geographies
In conclusion publication at Postcode Sector level limits the ability for much meaningful
data analysis - especially given that different geographical units are used for most other
related datasets and administrative systems There is scope to make data available for
other units of analysis through relatively straightforward processes
There appears scope also to release some data at a more detailed geographical scale to
pick-up changes in area characteristics which can change quite quickly over space
(especially in urban areas) Examples would be Lower-layer Super Output AreasScottish
Data Zones While there may be some trade-off between more detailed geographies and
the level of redaction the extent of this cannot be estimated without testing the underlying
data
23 The BBA Personal Loans Lending Dataset
The personal lending data are released as a single variable of total lending amounts at
the Postcode Sector level for a particular quarter The totals are a sum of lending
figures for each Postcode Sector for each of the participating lenders (who also
publish their individual data)19
18
See httpwwwonsgovukonsguide-methodgeographybeginner-s-guidepostalindexhtml 19
The participating lenders are Barclays Lloyds Banking Group HSBC RBS Group Santander UK Clydesdale amp Yorkshire Banks and Nationwide Building Society
6
Collectively the data accounts for around 60 per cent of all unsecured personal loans
(excluding credit cards) but equates to only approximately 30 per cent of the total
national unsecured credit market
231 What the personal loans data covers
The definition of the total lending variable provided with the second data release (Q3
2013) describes the coverage as comprising
lsquodrawn-down amounts from agreed borrowing facilities They will comprise
borrowing agreements made in the past new borrowing agreements
repayments and borrowing written offrsquo20
The data covered some pound298 billion in personal lending in Q4 2013
2311 Data filters
Filters are applied to the personal lending dataset by the BBA and individual lenders
prior to release These filters are21
lsquoBorrowing stocks in a sector postcode is not disclosed where customer
confidentially would be compromised (ie where fewer than 10 borrowers exist in
the sector or where borrowing is highly concentrated in a small number of the
largest borrowers in the sector)rsquo and
lsquoIndividual lenders are not obliged to publish borrowing at sector level if they hold
less than 3 per cent of personal loans in a sectorrsquo
There is some ambiguity in the wording describing these filters It is not made clear
what the definition of lsquohighly concentratedrsquo that is applied is There is also no system of
markers within the dataset which show where postcodes are subject to redaction
These are issues which could be clarified through the publication of a separate
technical report of the data by the BBA
Overall the BBA reports that the impact of filters on the personal lending data release
is small - with the value of redactions of personal loans data estimated at around 1 per
cent of the total value of personal loans (of participating institutions)
The BBA report that for Quarter 4 366 Postcode Sectors are affected by redactions -
equating to pound04bn of lending This is around 4 per cent of Postcode Sectors covered
by the data
In conclusion the impact of filters on the data disclosed would appear to be small ndash
although the extent to which these different filters affect the specific geographical patterns
in the data release cannot be determined in detail Overall there is little or no information
provided about the process of data construction data quality and robustness checks Such
information which could be provided relatively easily could all be usefully added to
support confidence in and analysis of the data
232 Quarterly data consistency
Data quality across quarters can be checked initially by looking at the correlation
between data values of a Postcode Sector from one quarter to the next In other
words what is the level of value fluctuation
Of course we are unable to judge fully what extent of fluctuation might be expected
between quarters and which could be due to market forces (including customers for
example moving to providers not covered by data disclosure) Alternatively the
20
httpswwwbbaorguknewspress-releasesborrowing-levels-reported-by-british-lendersU9eS2Gfjjoo 21
Accompanying notes available at httpswwwbbaorguknewspress-releasesborrowing-levels-reported-by-british-lendersU9eS2Gfjjoo
7
filtering process (see Section 2211) might account for some levels of fluctuation as
might any error in the dataset
Figure 21 below provides a simple dot plot of the percentage change in lending
values across Postcode Sectors between Quarter 3 and Quarter 4 2013 The
percentage change across the vast majority of Postcode Sectors is relatively modest
and this is what would be expected
Figure 21 Percentage change in total Postcode Sector personal lending between Quarters 3 and 4 2013
The data release provides headline figures which show that total personal loan lending
values decreased by around pound310 million between Quarter 3 and Quarter 4 2013 this
equates to roughly 1 per cent of total lending A similar pattern is apparent at the
Postcode Sector level with a mean percentage change of -079 Change at the 10th
percentile of Postcode Sector is -103 while at the 90th percentile it is +7122
For some of the outlying observations however (as shown in Figure 21 above) the
change is very large Growth in excess of 100 per cent is observed in a small number
of Postcode Sectors at the other end of the scale declines of 50 per cent or more are
observed
In some of the high change sectors the absolute values of change are relatively small
however in others the values run into millions suggesting the changes cannot be the
result of changes to a small number of loans It is unclear whether these very large
changes reflect genuine change in lending patterns or if a small number of Postcode
Sectors were affected by filtering processes andor suffer from error in the dataset
22
A percentile is a measure used in statistics indicating the value below which a given percentage of observations in a group of observations fall For example the 20th percentile is the value (or score) below which 20 percent of the observations may be found Alternatively if a score is in the 86th percentile it is higher than 86 of the other scores
-100
0
100
200
300
c
han
ge
in le
nd
ing
0 1000 2000 3000 4000 5000Frequency
8
In conclusion whilst quarterly values for most Postcode Sectors seem consistent over the
first data releases there are a number of Postcode Sectors in which major fluctuations
occur ndash it is not clear if these fluctuations reflect genuine change in lending patterns were
affected by filtering processes andor if a small number of Postcode Sectors suffer from
error in the dataset Analysis would be helped by additional supporting documentation
accompanying the data which might reflect on and provide a narrative on such variations
and the reasons for them
233 Missing Postcode Sector data
The full BBA dataset includes a significant proportion of Postcode Sectors for which
there are no data recorded
Looking across the three sets of data release generally around 1900 of the 10839
Postcode Sectors have no lending values attached in any one set of data The vast
majority of missing Postcode Sectors are the same for each quarter of data (ie they
tend to be missing consistently across the three quarters of data)
A number of reasons for this missing data can be surmised ndash although only blank cells
are released
Some Postcode Sectors are no longer in use
Some Postcode Sectors have been filtered for confidentiality issues leading to
blank returns (in Q4 2013 release it was 366) and
Some of the remaining Postcode Sectors have had no lending that quarter ndash and
are a zero rather than a blank cell return
An analysis of Postcode Sectors with missing returns was run against Census data
(for population) structured by Postcode Sector to determine if there were any
unexpected or systematic levels of missing data across Postcode Sector Generally
data was jointly missing from the lending data and Census data and in only just over
1 of Postcode Sectors was data available from one data source but not the other
Those Postcode Sectors with Census data but not lending data tend to have small
populations
The issue of missing Postcode Sectors appears to relate mainly to postcodes no longer in
use and to areas of zero or very low population
The issue of blank cell returns relates to a mixture of both true zero returns and redacted
returns
Blank cells could be accompanied by an additional flag (marker) to distinguish true zeros
from cells which are lsquonot zero but not releasablersquo An additional flag could also identify
Postcode Sectors where any provider had withheld their data in accordance with the filter
described previously
These are straightforward changes which would aid with interpretation of the data
234 Redacted Postcode Sector data reported at higher geographical level
Some of the data which are redacted are released in the form of an aggregate of
Postcode Sectors which is referenced to the higher Postcode Area in which it falls
(see Table 21 above) This allows total lending levels to be reported at that
geographical scale
In the large majority of Postcode Areas this amount is less than 2 per cent of total
lending23
There are however some Postcode Areas where this proportion can be as
23
Analysis run on Q4 2013 personal lending dataset
9
much as 10 per cent or even over 40 per cent in the case of East Central London ndash
further limiting the value of the data for detailed geographical analysis
24 The BBA SME Lending Dataset
The SME business lending data are similarly released as a single variable of total
lending amounts at the Postcode Sector level for a particular quarter The totals are a
sum of lending figures for each Postcode Sector for each of the participating lenders
(who also publish their individual data)24
Collectively for loans and overdrafts to SMEs data cover about 60 per cent of the
total national market of all SME lending by banks and building societies
241 What the business loans data covers
The definition of the total lending variable provided with the second data release
describes the coverage as comprising
lsquodrawn-down amounts from agreed borrowing facilities They will comprise
borrowing agreements made in the past new borrowing agreements
repayments and borrowing written offrsquo25
The data covered some pound998 billion in SME lending in Q4 2013
Definitions of SMEs adopted in the UK and the EU may use metrics of number of
company employees turnover and balance sheet total or a combination of these to
determine SME status26
In statistical analysis employment can often be used as a
shorthand definition
The definition of SME used in the bank lending dataset is not stated in the guidance
notes to the postcode release It is therefore not entirely clear how banks are
assigning SME status to companies for coverage in the dataset and the level of
consistency in this across individual banks
The SME lending figures are published down to Postcode Sector level with lending
assigned to a postcode based on a businessesrsquo lsquoprimary trading locationrsquo (BBA 2014)
2411 Data filters
Filters are applied to the SME lending dataset by the BBA and individual lenders prior
to release These filters are27
lsquoBorrowing stocks in a sector postcode is not disclosed where customer
confidentially would be compromised (ie where fewer than 10 borrowers exist in
the sector or where borrowing is highly concentrated in a small number of the
largest borrowers in the sector)rsquo
lsquoIndividual lenders are not obliged to publish borrowing at sector level if they hold
less than 10 per cent of SME borrowinghellip in a sectorrsquo
As with the personal lending data it would be helpful if the filtering processes and any
geographical impact of this could be detailed through the publication of a technical
report of the data
24
The participating lenders are Barclays Lloyds Banking Group HSBC RBS Group Santander UK and
Clydesdale amp Yorkshire Banks Not all individual banks release their data in the same format as that used
by the BBA ndash and such release formats tend to be less useful for data analysis 25
httpswwwbbaorguknewspress-releasesborrowing-levels-reported-by-british-lendersU9eS2Gfjjoo 26
See httpwebarchivenationalarchivesgovuk+httpwwwbisgovukpoliciesenterprise-and-business-supportanalytical-unitstatistics httpeceuropaeuenterprisepoliciessmefacts-figures-analysissme-definitionindex_enhtm 27
Accompanying notes available at httpswwwbbaorguknewspress-releasesborrowing-levels-reported-by-british-lendersU9eS2Gfjjoo
10
For Quarter 4 2013 of the pound998bn of total lending pound868bn was published at
Postcode Sector level (87 per cent)28
after filtering processes Compared to personal
lending the number of Postcode Sectors for which data is published is smaller and the
number of Postcode Sectors with data redacted is higher A total of 1334 Postcode
Sectors are redacted representing around pound10 billion of lending (BBA 2014) A larger
number of data missing postcodes would be expected for SME lending because of
differences in the ways businesses are distributed vis-agrave-vis people
In conclusion the full extent of a common definition of SME used by individual lenders in
reporting lending data is not defined in the accompanying guidance Concerning the impact
of filters on the data disclosed this would appear to be relatively small (but larger than for
personal lending disclosure) ndash although the extent to which these different filters affect the
specific geographical patterns in the data release cannot be determined in detail Overall
there is little or no information provided about the process of data construction data quality
and robustness checks Such information could all be usefully added to support confidence
in and analysis of the data
242 Quarterly data consistency
As with the personal lending data data across quarters can be checked by looking at
the correlation between data values of a Postcode Sector from one quarter to the next
Again we are unable to judge fully what extent of fluctuation might be expected
between quarters and which could be due to market forces (including customers for
example moving to providers not covered by data disclosure) Alternatively the
filtering process (see Section 2211) might account for some levels of fluctuation as
might any error in the dataset
Figure 22 below provides a dot plot of the percentage change in aggregate SME
lending values across Postcode Sectors between Quarter 3 and Quarter 4 2013 Most
sectors move relatively little as would be expected however a significant minority
show very large increases indeed It is also worth noting that 20 extreme outliers
(those with values above 1000 per cent) have been trimmed from this graph to aid
presentation
Figure 22 Percentage change in total Postcode Sector SME lending between Quarters 3 and 4 2013
Note For presentational purposes the graph excludes 20 observations in excess of 1000 per cent
28
Quarter 4 release BBA guidance
0
500
1000
c
hang
e in
lend
ing
0 2000 4000 6000 8000Frequency
11
Overall between Quarters 3 and 4 (2013) total reported SME lending fell from
pound101bn to pound998bn a decline of 12 per cent As Figure 22 demonstrates however
underneath this modest aggregate decline there is a good deal of volatility in lending
figures in some Postcode Sectors Table 22 below presents the largest changes in
Postcode Sectors in absolute terms between Q3 and Q4 2013
At the extremes changes in value include an increase of more than pound125 million and a
fall of pound45 million from one quarter to the next It is difficult to judge given the
information provided whether these reflect genuine lending pattern shifts processes of
filtering or some issue in the underlying data However in many of these cases
changes between Q3 and Q4 are inconsistent with patterns of changes between Q2
and Q3 Such levels of volatility require explanation and it would be helpful if additional
technical information could be published by the BBA which addresses the issue of
expected and actual volatility in the data
Table 22 Largest increases and decreases in SME lending in Postcode Sectors
Rank Region Postcode Area (within which Postcode Sector sits)
Postcode sector
Total lending pound Q2 2013
Total lending pound Q3 2013
Total lending pound Q4 2013
Change in total lending Q3 - Q4
1 Scotland Edinburgh EH2 1 88956915 89221455 216041188 126819736
2 East of
England Chelmsford CM4 0 4612241 4798112 51946086 47147976
3 East
Midlands Nottingham NG1 5 10750428 9931073 56507658 46576584
4 London Harrow HA8 7 47233842 45713362 82494289 36780928
5 London Romford RM13 8 47744322 14555808 49099528 34543720
6 North
West Manchester M7 4 125900976 123062264 155278366 32216102
7 London
Kingston
upon
Thames
KT2 6 2444876 2472123 32992322 30520200
8 East
Midlands Derby DE13 7 2637023 2517411 26957579 24440168
9 South
East Dartford DA3 8 632076 584392 24901049 24316656
10 West
Midlands Coventry CV37 9 10609823 9876844 34059042 24182198
8247 South
West Gloucester GL9 1 20513450 21160227 101210 -21059016
8248 London East Central
London EC2V 7 44649295 48824585 25323337 -23501248
8249 London West London W1S 4 54519193 84467138 59294271 -25172868
8250 London East Central
London EC3R 5 87857473 79579754 54260489 -25319264
8251 West
Midlands
Stoke-on-
Trent ST15 8 48281874 48624183 21511422 -27112760
12
8252 London South West
London SW1W 9 7716368 34997459 7282561 -27714898
8253 London North West
London NW2 3 1231889 32844214 2948390 -29895824
8254 London West London W1U 3 104613218 95756920 63980574 -31776346
8255 Wales Swansea SA67 8 107711556 85402811 48447517 -36955296
8256 London Twickenham TW20 0 45674399 51017760 5975077 -45042684
A parallel test is to look at change as a proportion of total lending rather than focusing solely on
the absolute figures The patterns of change in the dataset at the Postcode Sector level record
median percentage change of a small fall in SME lending of 19 per cent (between Q3 and Q4
2013)29
Change at the 10th percentile is -123 per cent and at the 90th percentile is +118 per
cent30
There exist relatively long tails of observations that have fluctuations that are extremely large
Table 23 lists the top and bottom ten proportional increases in total lending between Quarter 3
and Quarter 4 The percentage changes observed in many of the areas are very large There is
no clear geographical pattern of the places involved although a common feature is that the total
lending (in Quarter 3 2013) tends be quite low compared to the dataset average
Table 23 Changes in quarterly total SME lending postcode sectors with the largest proportional increases
Postcode Sector Postcode Area (within which Postcode Sector sits)
Total lending (pound) Q2 2013
Total lending (pound) Q3 2013
Total lending (pound) Q4 2013
Change Q3 to Q4
change Q3 to Q4
EC1M 6 East Central
London NA 61652 18910530 18848878 30573
SW19 6 South West
London 69058 53422 6785387 6731965 12601
L17 8 Liverpool 37866 30615 3632733 3602118 11766
SK6 3 Stockport 56953 50185 3628961 3578776 7131
SY3 5 Shrewsbury 130141 130825 8359372 8228547 6290
CM7 5 Chelmsford NA 115252 7077798 6962546 6041
CO12 4 Colchester 319388 302892 17782688 17479796 5771
DA3 8 Dartford 632076 584392 24901049 24316656 4161
CO4 3 Colchester 345185 343502 10957899 10614397 3090
HD1 1 Huddersfield 221125 237029 4859592 4622563 1950
SO17 2 Southampton 12834686 13802731 584122 -13218609 -96
BL2 4 Bolton 5626452 5343547 186009 -5157538 -97
GU51 1 Guildford 1415977 1407948 46157 -1361791 -97
BD12 7 Bradford 64364 2024212 60840 -1963372 -97
LE5 2 Leicester 7539493 7262582 154084 -7108498 -98
29
All figures are based on Postcode Sectors which have observations at both time points 30
A percentile is a measure used in statistics indicating the value below which a given percentage of observations in a group of observations fall For example the 20th percentile is the value (or score) below which 20 per cent of the observations may be found Alternatively if a score is in the 86th percentile it is higher than 86 of the other scores
13
RM15 5 Romford 7479318 7129015 128114 -7000901 -98
EN6 5 Enfield 7388952 8203013 116275 -8086738 -99
PR1 8 Preston 84391 7075560 71882 -7003678 -99
GL9 1 Gloucester 20513450 21160227 101210 -21059016 -100
RG31 6 Reading 155690 19977370 86538 -19890832 -100
It is early days in trend and consistency analysis given only three rounds of data release
have taken place thus far with further rounds a clearer set of patterns of change would be
expected Whilst changes in SME lending patterns would be expected to be more
pronounced than for personal lending a number of value shifts in the SME data are very
large
Given the limited documentation released with the data it is difficult to be certain whether
such changes in lending patterns reflect genuine shifts in lending behaviour The BBA
should provide additional information in the form of a technical report which addresses
the issue of volatility in the dataset as well as dataset construction more broadly
243 Missing postcode data
The SME dataset includes a significant proportion of Postcode Sectors for which there
are no data recorded
Looking across the three sets of data release around 2400 ndash 2500 of the 10839
Postcode Sectors have no lending values attached in any one set of data31
The vast
majority of missing Postcode Sectors are the same for each quarter of data (ie they
tend to be missing consistently across the three quarters of data)
A number of reasons for this missing data can be surmised ndash although only blank cells
are released
Some Postcode Sectors are no longer in use
Not all Postcode Sectors contain business addresses
Some Postcode Sectors have been filtered for confidentiality issues leading to
blank returns (in Q4 2013 release it was reported as 1334 representing around
pound10bn of lending) and
Some of the remaining Postcode Sectors have had no lending that quarter ndash and
are a zero rather than a blank cell return
Analysis would be aided if a system of lsquomarkersrsquo were provided in the reported data which
identify i) Postcode Sectors which have no lending ii) those which have some lending but
where data is redacted and iii) those where data is published but where some individual
banks have not provided data (as per the filters)
244 Redacted Postcode Sector data reported at higher geographical level
Some of the data which are redacted are released in the form of an aggregate of
Postcode Sectors which is referenced to the higher Postcode Area in which it falls
(Table 21 above) This allows total lending levels to be reported at that geographical
scale
For personal lending this amounted to less than 2 per cent for most Postcode Areas
(although a handful of Postcode Areas were highlighted where proportions were much
higher) For SME lending however the proportions are relatively large
31
The equivalent figure for personal lending is around 1900 Postcode Sectors
14
Table 24 provides the proportion of SME lending data assigned to Postcode Area but
not individual Postcode Sectors at the regional level The proportions involved are
relatively large they average over ten per cent in all but two regions
Table 24 Proportion of SME lending assigned to Postcode Area but not Postcode Sector level ndash by region
Region Q2 2013 Q3 2013 Q4 2013
East Midlands 124 118 89
East of England 122 109 101
London 210 186 188
North East 83 98 103
North West 205 173 164
South East 128 111 112
South West 74 70 65
West Midlands 159 137 140
Yorkshire amp the Humber 161 141 134
Scotland 163 138 135
Wales 114 94 98
The ten Postcode Areas with the largest proportion of lending not assigned to
Postcode Sector are presented in Table 25 These all average over 20 per cent of
lending not being assigned to a Postcode Sector but only to Postcode Area ndash again
blunting the ability for detailed analysis
Table 25 Proportion of SME lending assigned to Postcode Area but not Postcode Sector level ndash individual districts
Region Name of Postcode Area Q2 2013 Q3 2013 Q4 2013
London EC East Central London 680 660 604
West Midlands TF Telford 557 505 501
North West L Liverpool 414 378 391
London WC Western Central London 431 395 319
London E East London 370 348 316
London SW South West London 243 184 266
London W West London 246 198 233
Yorkshire amp the
Humber S Sheffield 200 202 233
South East RG Reading 269 237 231
North West M Manchester 340 256 226
15
25 Bank data disclosure international developments
Bank Data Transparency Around the World
Why is bank data transparency important
It is widely recognised that fair and affordable access to financial goods and services is a basic
requirement for full engagement in modern society In contrast there is strong evidence of
differential patterns of access provision and lending leading to a range of individuals businesses
and communities in the UK experiencing forms of financial exclusion
Data from banks on their lending activities can be utilised to gain a greater understanding of those
groups not adequately served by mainstream banking institutions Identification of patterns of
lending provides the basis for investigating why underserved markets have developed ndash and in turn
the basis for solutions Greater levels of market information and transparency can support
new initiatives by existing lenders new market entrants or specialist provision such as through credit unions and community development finance institutions andor
policy responses and targeted interventions to overcome market failures andor
the combination of both in new forms of financial partnership including with communities
Where can we find examples of bank transparency
Bank data transparency in most countries around the world is very limited ndash although the global
financial crisis and its continued repercussions have seen a strengthening of oversight of the
financial system including concerted calls for greater transparency and disclosure by all lenders
The UK BBA scheme is a leading example of bank data transparency
UNITED KINGDOM
In July 2013 the UK government announced that some of the biggest lenders would through a
voluntary framework publish data on their lending activities at the local level This included
agreement of a set of parameters which lenders feel strikes a balance between the desire for
transparency and customer confidentiality
the first data set including SME lending mortgage lending and unsecured personal loans was released in December 2013 by the British Bankers Association and Council of Mortgage Lenders (see httpswwwbbaorguknewsstatisticspostcode-lending) and importantly published simultaneously on an individual basis by the participating banks and building societies Data will be published on a quarterly basis
the data is for the stock of lending for Great Britain only and is released at the geographical level of Postcode Sector Collectively the lenders releasing data account for around 72 of the mortgage lending market 60 of the bank lending market and 60 of unsecured personal lending (excluding credit cards) in Britain
no data is published on any socio-economic characteristics of lending patterns for example such as gender ethnicity or income band for personal lending or for business lending characteristics such as sector employment or turnover band
it is expected that more lenders including banks building societies and other organisations will also begin to publish their data
FRANCE
There is strong policy awareness and public sector activity in France concerning the issue of access
to finance and financial exclusion Pay day lenders for example are banned A meeting was held in
2010 between French banks NGOs and other stakeholders around the potential to develop
legislation similar to that in the USA to bring forward data disclosure Little collective progress has
been made subsequently but pressure remains (see for example httpwwwlelabo-
essorgIMGpdfPropositiondeloi_mars2013pdf)
UNITED STATES OF AMERICA
The USA is cited as probably the most advanced example of bank transparency This transparency
has been driven by two key legislative initiatives lsquoHome Mortgage Disclosure Actrsquo (HMDA) and the
16
lsquoThe Community Reinvestment Actrsquo (CRA)
The HMDA requires financial institutions to compile and disclose data about loan applications for (i)
home purchase and (ii) home improvement loans they originate or purchase during each calendar
year by 31 March of the following year The twenty-six fields of information that lending institutions
must report include
Data about each application (loan type amount date and action taken (loandenial and reason with date) and the location of the dwelling (by census tract) to which it relates
The race or national origin ethnicity sex and gross annual income of the applicant or borrower
In March 2012 over 7400 institutions reported over 18 million HMDA records (see httpwwwffiecgovhmda)
The CRA aims to encourage lsquodepository institutionsrsquo (lsquobanksrsquo) to meet the credit needs of the communities within which they operate especially low-and moderate-income communities consistent with safe and sound banking practices
The financial regulators conduct periodic examinations to evaluate how banks are fulfilling the objectives of the CRA and issue a report and rating of a bankrsquos CRA performance Performance is evaluated on lending investments and services provided in the community that help to meet credit needs including the use of reported HMDA data
Both the report and the rating are made public A CRA rating of less than a ldquosatisfactoryrdquo can prevent institutions from proceeding with a planned merger acquisition or expansion of operations (see httpwwwfederalreservegovcommunitydevcra_abouthtm)
There is widespread recognition that transparency - based on regulator quality assurance of bank
disclosure data - has promoted behavioural change by banks encouraged new competition and
supported policy initiatives community activity and financial partnerships (see for example the work
and forensic reports of the National Community Reinvestment Coalition
httpwwwncrcorgresourcesreports-and-research)
26 The BBA Postcode Sector Lending Datasets A Summary
The UK BBA postcode lending data scheme is a valuable step toward bank data transparency and
puts the UK at the forefront of international developments
Analysis of area-based lending patterns is however substantially constrained by data content and
levels of imprecision are introduced by the processes of data construction
261 Data Content
Market coverage the data released covers approximately 60 per cent of the total
national SME lending market and 30 per cent of the total national unsecured
credit market (excluding credit cards) including only 60 per cent of bank lending
within the unsecured credit market
Lending totals only provide a partial picture of lending patterns additional
data desired to allow substantial analysis would include
ndash number of transactions including number of declines
ndash individual loan amounts
ndash markers of cost of loan release and
ndash characteristics of the borrower (for example gender ethnicity) or business (for
example turnover employment legal form such as charity) and
17
The use of Postcode Sector the scale of geographical release does not support
detailed neighbourhood analysis of lending patterns it also introduces a lack of fit
with the geographical building blocks commonly used for major survey datasets on
business and population characteristics (and with which lending patterns need to
be linked to enable purposive analyses)
262 Dataset Construction
Analysis of the lending datasets shows significant levels of unexplained volatility in a
small number of Postcode Sectors Given the limited documentation released with the
data it is difficult to be certain whether such changes in lending patterns reflect
genuine shifts in lending behaviour
Issues with data construction include
Redaction (non-reporting) of data lsquofiltersrsquo are used and some data are not
published the cells affected by this are not marked
lsquoBlank cellsrsquo returns can be generated for a number of reasons including no
lending undertaken but which remain unexplained and
The accompanying notes provide limited explanation of the application quality
assurance and impact of database construction processes on quarterly release
figures
The studyrsquos assessment of the dataset construction and content is summarised in
Table 26 (overleaf)
18
Table 26 The BBA Postcode Lending Datasets An Assessment
Lending Data
Total Market Coverage (approx)
Content lsquoTotalrsquo lending value per quarter per Postcode Sector
Quarterly Value Volatility by Postcode Sector
Missing Postcode Sector Reported Lending Not Allocated to Postcode Sector
Personal 30
No data on
- No of transactions
including declines
- Individual loan
amounts
- Markers of cost of
loan release
- Borrower
characteristics
Generally consistent but a few
unexplained fluctuations and
outliers
Mainly relates to postcodes no
longer in use or of zerolow
population (around 1900 from
10839 sectors)
Includes unknown mix of
redacted (360 odd) and zero
returns
Generally around 2 per Postcode Area
but a few where the percentage of lending
not reported at the Postcode Sector level
is over 10 of the total figure
SME 60
No data on
- No of transactions
including declines
- Individual loan
amounts
- Markers of cost of
loan release
- Borrower
characteristics
Definition of SME used
in data not stated
A significant minority of
Postcode Sectors have very
high variation (eg over
1000) and outliers
Relates to postcodes no longer
in use or of zero business
(around 2450 out of 10839
sectors)
Includes unknown mix of
redacted (1330 odd) and zero
returns
Generally over 10 per Postcode Area
and a few where percentage of lending not
reported at the Postcode Sector level is
much higher
19
3 The BBA Personal Lending Dataset An Analysis
Section 2 provided an introduction to the personal lending dataset including coverage data
construction and quality Section 3 begins with an analysis of Postcode Sector lending
patterns for personal lending ndash and which must be read in light of the data limitations as set
out in Section 2 The Section then utilises Census data to map lending data against area
characteristics including measurements of deprivation
31 Aggregate personal lending per Postcode Sector
Total lending figures vary enormously across Postcode Sectors
A simple ranking using the Quarter 4 (2013) data is presented to demonstrate this in Table
31 At the extremes the level of lending ranges from almost thirteen million pounds to less
than fifty thousand pounds (for those Postcode Sectors with non-zero values)
Of course it is the case that Postcode Sectors are of very different population sizes (with the
adult population ranging from fewer than 500 people to in excess of 10000) ndash and clearly
population size is reflected in total lending
Table 31 Aggregate personal lending by Postcode Sector
Rank Aggregate lending (pound) Quarter 4 2013
Postcode Sector Postcode Area (within which Postcode Sector sits)
1 12797750 SE28 8 South East London
2 12450481 G75 8 Glasgow
3 12367186 EH54 6 Edinburgh
4 12031754 RG22 4 Reading
5 11834815 RG24 9 Reading
8976 51958 NE66 4 Newcastle upon
Tyne
8977 47700 G2 7 Glasgow
8978 45996 L37 5 Liverpool
8979 40776 PA26 8 Paisley
8980 30249 EH2 2 Edinburgh
20
32 Level of personal lending per capita
The level of personal lending per capita (the level of lending adjusted for Postcode Sector
population size) allows for more meaningful comparison
In Table 32 we use a measure of the total adult population of each Postcode Sector32
which
is derived from the 2011 Census33
The measure of personal lending total used is the
average from the three Quarters of data released34
Table 32 Percentile distribution of lending per adult
Postcode Sector Percentile 5 10 25 50 75 90 95
pound per adult lent 346 416 510 602 691 774 836
Lending per adult average using three Quarters of data (Q2-Q4 2013)
The median figure for lending per adult across Postcode Sectors is pound602
At the 10th percentile35
per head lending figures are pound416 ndash so in 10 per cent of Postcode
Sectors lending per adult is pound416 or less At the 90th percentile per head the lending figure is
pound774 or more
The individual Postcode Sectors with the largest and smallest per head values are provided
in Table 33 overleaf
At the very top of the range are two observations which seem implausibly large Lending per
head is pound13405 in Postcode Sector G2 1 and pound8937 in Postcode Sector EC1A 436 Both of
these Postcode Sectors refer to financial localities of city centres which have very small
population sizes (Glasgow and London) It may be that in these two observations loans data
are recorded to some address other than home addresses (for example work addresses)
At the other end of the scale the rate of lending per head is less than pound100 in Postcode
Sectors across a range of areas
32
Defined as the total population aged 18 or over 33
The Office for National Statistics via NOMIS has published estimates of population and many other Census variables at the Postcode Sector level These Postcode Sector estimates are best-fitted to Postcode Sector boundaries from Output Areas With Output Areas assigned to a single Postcode Sector For details on this best-fitting see httpsgeoportalstatisticsgovukgeoportalcatalogsearchresourcedetailspageuuid=7BA7562082-D57B-4ACE-BB37-D14036AAF8137D For Scotland data were downloaded separately from httpwwwscotlandscensusgovukcensus-results Where Postcode Sectors are split in cases where they cross council boundaries the Postcode Sector parts have been combined to give a whole Postcode Sector estimate (see httpwwwgro-scotlandgovukfiles2geography2011-census2011-census-geography-background-infopdf) 34
See also a similar analysis by BBA at httpswwwbbaorguknewsstatisticspostcode-lendingbritish-lenders-set-out-levels-of-borrowing-across-country-in-major-move-for-transparencyVBF9H2fQMaI 35
A percentile is a measure used in statistics indicating the value below which a given percentage of observations in a group of observations fall For example the 20th percentile is the value (or score) below which 20 percent of the observations may be found Alternatively if a score is in the 86th percentile it is higher than 86 per cent of the other scores 36
The total value of loans at these two Postcode Sectors is however well below the average
21
Table 33 Largest per adult head loan borrowing figures by Postcode Sector
Postcode Sector Postcode Area
(within which Postcode Sector sits)
Lending per head adult population (pound)
G2 1 Glasgow 13405
EC1A 4 East Central London 8937
G72 6 Glasgow 2182
PE7 0 Peterborough 2009
LS17 0 Leeds 1846
NE13 9 Newcastle upon Tyne 1805
MK42 6 Milton Keynes 1749
PR7 7 Preston 1725
SA7 0 Swansea 1719
EC1V 2 East Central London 1666
S3 7 Sheffield 84
LS6 1 Leeds 84
DD1 5 Dundee 84
LS2 9 Leeds 81
WV1 1 Wolverhampton 74
BS1 1 Bristol 72
L3 5 Liverpool 66
S1 4 Sheffield 64
DD1 1 Dundee 56
L7 7 Liverpool 33
33 The bank personal lending data mapped
331 By GB Local Authority
Figure 31 provides a map of lending per head of population to the finest detail possible
(Postcode Sector) for the published bank personal lending data overlain by Local Authority
area
It can be seen that data exists for all Local Authorities but that patterns in lending are difficult
to discern One apparent pattern is of on average lower levels of personal lending in a large
part of rural Great Britain (but rural Postcode Sectors tend to cover larger areas making their
patterns more visible than urban areas in this map)
Annex 1 contains the same map for each of England Scotland and Wales
Figure 32 repeats this mapping for Parliamentary Constituencies
22
Figure 31 Average Bank Personal Lending per Head of Adult Population by Local Authority (GB)
23
Figure 32 Average Bank Personal Lending per Head of Adult Population by Parliamentary Constituency (GB)
24
332 Newcastle and Gateshead Local Authorities
Lending data by Postcode Sector can also be overlain for individual Local Authorities as
exemplified for Newcastle and Gateshead (Figure 33) At this scale lending patterns for
different wards of a city can be delineated37
In this example
The area with no lending data (green) is Newcastle city centre
The adjacent areas with low lending values spread along the River Tyne where
deprivation levels tend to be high
Higher values characterise most of the outlying suburbs and
The highest (deep-red) area covers a new-build area of higher prestige housing
These lending patterns could be overlain with a ward-based mapping of deprivation (for
example the Index of Multiple Deprivation) but as described in this report the substantial
limitations of the data released mean using this data alone one cannot infer if lower lending
is due to lower demand lending practices or possibly the use of other providers
Figure 33 Average Bank Personal Lending per Head of Adult Population for Newcastle and Gateshead (GB)
37 See also the original work by Brown on Birmingham data available at httpcitysavecreditunionfileswordpresscom201401personal-loans-birminghampdf
25
34 A comparison of personal lending data with area-based Census data
Patterns of lending as we know are driven by much more than levels of adult population
(lsquobeing an adult who has the potential to borrowrsquo) and are related to a range of borrower
characteristics (for example income employment and credit history) The relationship of
lending patterns to lsquowho you are and where you liversquo is complex and dynamic but there has
been long held concern over access to financial goods and services experienced by
deprived areas and communities38
Using Census 2011 it is possible to carry out some basic preliminary comparisons of the
bank personal lending data with area level characteristics of populations in different
Postcode Sectors
It should be stressed that the following analysis is descriptive It does not test for possible
causality or any processes which underlie the patterns observed There are important and
significant limitations to the data for example we can tell nothing from the data about who
applies for loans the loan acceptance rate interest rates and how these differ by individual
or area characteristics In addition in the sets of measures presented personal lending and
Census variables are area-based and so lsquoaveragersquo across households and individuals
The limitations to the analysis which can be performed are a reflection of the level and detail
of the lending data which is currently released
341 Bank personal lending and deprivation
Area-based Census analysis is provided for the Postcode Sectors which have full
information (those that have Census data and bank lending data at each of the three
quarters for which it is released) This leaves 8864 Postcode Sectors with a further two
Postcode Sectors being omitted which are obvious outliers (G2 1 and EC1A 4)39
The Census variables presented describe dimensions of different characteristics of Postcode
Sectors These variables are
Proportion of households with one of more deprived characteristics40
Proportion of households which are owner-occupied
Unemployment rate (among the population aged 16-74)
Proportion of the population who are non-UK born and
Proportion of the population categorised as ethnic minority
Table 34 provides simple bivariate correlations between the variables listed and a Postcode
Sectorsrsquo personal lending per adult head of population41
38
See for example Kempson P and Whyley C (1999) Kept Out or Opted Out Understanding and combating financial exclusion Joseph Rowntree Foundation HM Treasury (1999) Enterprise and Social Exclusion 39
Section 224 above explains missing postcode data ndash and that in the main both the Census and lending data are similar in their exclusions due either to very low population (disclosure issues) andor postcodes no longer in use 40
The Census deprivation variable was first released to accompany the 2011 Census The four dimensions of household deprivation which it measures are lsquoEmployment - any member of a household not a full-time student is either unemployed or long-term sick Education - no person in the household has at least level 2 education and no person aged 16-18 is a full-time student Health and disability - any person in the household has general health lsquobad or very badrsquo or has a long term health problem and Housing - Households accommodation is ether overcrowded with an occupancy rating -1 or less or is in a shared dwelling or has no central heatingrsquo See httpwwwonsgovukonspublicationsre-reference-tableshtmledition=tcm3A77-286348 Table QS119EW
26
Table 34 Bivariate correlation of personal lending and Postcode Sector characteristics (Spearmanrsquos rho)
Lending per adult
Proportion of population non UK Born -02119
Proportion of population ethnic minority -01105
Unemployment rate -00706
Proportion of households deprived on at least one measure 01555
Proportion of households owner-occupied 02437
Number of observations 8862 Significant at 0001
In all cases these individual relationships are relatively weak although all are statistically
significant and move in the direction that might be expected The strongest single
relationship with personal lending is that of owner occupation rate To summarise the
relationship higher average personal lending per adult tends to be found in areas with
Fewer non UK born residents
Lower proportions of ethnic minority residents
Lower unemployment rate
Fewer residents who are deprived and
More owner-occupation
Figure 34 overleaf presents a scatterplot of one of these relationships ndash lending and
deprivation The graph shows that average lending tends to decline as deprivation
increases
41
The measure used is Spearmanrsquos Rank to allow for relationships to be non-linear For simplicity we only present the coefficients for the relationship with bank lending of course many of the variables are correlated with each other in some cases very strongly (for example unemployment and deprivation)
27
Figure 34 Bank personal lending per head by deprived household for Postcode Sectors
In general the data suggest that average levels of personal lending tend to decline as the
arearsquos deprivation level increases The association between deprivation and lending levels at
the Postcode Sector level is however relatively weak
35 The BBA Personal Lending Dataset A Summary
Taking account of the limitations of the released data as set out in Section 2 the BBA
Personal Lending Dataset suggests that
Median personal lending per head of the adult population across Postcode Sectors in
Great Britain in 2013 was pound602 Lending per adult in the lowest 10 per cent of Postcode
Sectors was around two-thirds of this figure or less whereas in the highest 10 per cent of
Postcode Sectors lending per adult was around a third or more above the median
Total personal lending tends to decline as the arearsquos deprivation level increases (once
adjusted for population size) The data confirms a previously identified lending pattern
Publication of the data at Postcode Sector level increases the technical requirements
and costs of meaningful data analysis Given the detailed postcode base of the
underlying data there is scope to make additional data available for other more useful
and commonly used units of analysis (such as Lower-layer Super Output AreasScottish
Data Zones) through relatively straightforward processes and
Expanded data release on a range of indicators of lending activity is required to allow
substantial and robust analysis of areas underserved by mainstream banks ndash these are
needed to accurately assess how many and what types of borrowers in the local
population are and are not receiving personal bank lending
0
500
100
01
50
02
00
0
Pe
rson
al le
ndin
g p
er
ad
ult
20 40 60 80 100Proportion of households with at least one deprivation indicator
Average lending per head Fitted values
28
4 The BBA SME Lending Dataset An Analysis
Section 2 provided an introduction to the SME lending dataset including coverage data
construction and quality While bearing in mind the limitations of the released data set out
previously this section begins with an analysis of Postcode Sector lending patterns for SME
lending The Section then utilises business demography data to map lending data against
business geographies
41 Aggregate SME lending per Postcode Sector
Total lending figures vary enormously across Postcode Sectors A simple ranking using the
Quarter 4 (2013) data is presented to demonstrate this in Table 41 At the extremes the
level of lending ranges from over 215 million pounds in EH2 1 (in Edinburgh) down to less
than forty thousand pounds in a number of localities
Table 41 Aggregate SME lending by Postcode Sector
Rank Aggregate lending (pound) Quarter 4 2013
Postcode Sector Postcode Area (within which Postcode Sector sits)
1 216041188 EH2 1 Edinburgh
2 174181370 N16 6 North London
3 155278366 M7 4 Manchester
4 130085283 N16 5 North London
5 120451209 NW11 9 North West London
8326 32221 L19 9 Liverpool
8327 31749 BS15 9 Bristol
8328 28285 NG11 8 Nottingham
8329 23145 M14 4 Manchester
8330 21689 CH46 2 Chester
The Postcode Sector SME lending figures can be mapped including against Local
Enterprise Partnership (LEP) area (see Figure 41) The mapping shows both the impact of
redacted data and the substantial range in SME lending levels across LEPs and localities
29
Figure 41 Total Bank SME Lending for Great Britain including Local Enterprise Partnership boundaries
30
42 Business lending per SME
Of course Postcode Sectors have very different SME population sizes (business
demography) ndash and clearly size of SME business base will be reflected in total lending The
level of lending per SME (the level of lending adjusted for business population size) allows
for more meaningful comparison42
Whilst this measure still does not truly capture lsquodemandrsquo it does provide a broad proxy SMEs
are of very different sizes ambition growth stage sector etc and appetite for external
lending and other such subtleties of demand are lost using just business population
421 SME lending by region
The BBA publishes a regional comparison of total SME lending figures against published
data on regional share of turnover43
In the most recent release most regions and Devolved Administrations receive a share of
lending within +- 2 per cent of their regional share of SME turnover the exceptions are
London which receives 8 per cent less lending given its turnover share and the South West
which receives a 4 per cent greater share of lending than its turnover share would suggest
422 Business lending per SME by Postcode Area
For the following mapping exercise we have to adopt an estimation method because data on
SMEs by Postcode Sector is not available in published form44
Instead the study uses the
published data on SMEs at the Middle Super Output Area (MSOA) level45
and lsquofitsrsquo this data
to Postcode Areas One mitigating advantage of having to analyse at this broad level is that
the substantial proportion of SME lending that is not published at the Postcode Sector can
be included
The mechanics of this process involve a simple best-fitting which assigns MSOAs to
Postcode Areas on a one-to-one basis (based on the Postcode Area in which the majority
share of an MSOA falls)46
This provides an estimate of SMEs by Postcode Area Lending
data for Postcode Areas is then merged with the SME population estimates47
We then
divide total lending in each Postcode Area by the estimated number of SMEs to give a per
capita (or per SME) estimate (for Q4 2013 data)
The average (median48)
per capita figure of SME lending by Postcode Area is pound47072 At
the tenth percentile49
the figure is pound34266 at the 90th percentile it is pound68707 This is a
relatively small distribution but this would be expected as the areas used are considerable in
size (larger than a county for example)
42
The BBA publication of the figures uses estimates of lending and turnover for SMEs at the regional level but no further geographical disaggregation of comparable figures is made 43
httpswwwbbaorguknewsstatisticspostcode-lendinglenders-set-out-levels-of-borrowing-from-across-the-country-2VFe992c2bIU 44
Estimates can be derived from use of secure microdata held by ONS but this requires a process of application and clearance for the proposed research Time and the scoping nature of this study precluded this path 45
MSOAs are a statistical area 46
Share data were downloaded from Geoconvert This method suffers from a degree of misallocation in the matching process as SMEs tend to be clustered in particular places while Geoconvert shares are based on a proxy for population This problem is limited by the relatively large Postcode Areas which we have aggregated up to of 8249 MSOAs 8015 are based on matches above 09 and 7369 are matches of 10 Inevitably however a degree of error is introduced by weaker matches The figures should therefore be considered as rough rather than detailed estimates 47
The definition of SME used for business population estimates is that used in the UK Business Counts ndash Enterprises dataset accessed via NOMIS and equates to all businesses with less than 250 employees 48
Median is the midpoint frequency of a set of observed values that is as many values fall above as below 49
A percentile is a measure used in statistics indicating the value below which a given percentage of observations in a group of observations fall For example the 20th percentile is the value (or score) below which 20 percent of the observations may be found Alternatively if a score is in the 86th percentile it is higher than 86 of the other scores
31
This data can be mapped also but only at the high level of Postcode Area (see Figure 42)
Figure 42 Bank SME Lending per head of business at Postcode Area level for Great Britain
The SME lending analyses reported by BBA and ourselves seek to create plausible if crude
proxies for potential lsquoarea-based SME demand for lendingrsquo to be matched against the area-
based SME lending figures (lsquosupplyrsquo) in the BBA dataset in order to provide further insight on
32
lending patterns It would be possible to refine the estimates presented here (using secure
access microdata) However in the absence of any released bank lending data on numbers
of lending transactions or borrower characteristics (for example micro-business or medium-
sized enterprise) the potential value for understanding underserved markets and potential
market gaps is considerably reduced As is stands estimation of SME demand would still be
mapped against only one published lending variable (total lending)
43 BBA Business Lending A Summary
Given the limitations of the released data as set out in Section 2 the BBA SME Lending
Dataset shows that
Average (median) SME lending per business in Great Britain in 2013 was pound47072
Lending per business in the lowest 10 of Postcode Areas stood at pound34266 and in the
highest 10 of Postcode Areas lending per business was pound68707
Expanded data release on a range of indicators of lending activity is required to allow
substantial and robust analysis of areas underserved by mainstream banks ndash these are
needed to accurately assess how many and what types of borrowers in the local
business population are and are not receiving SME bank lending
33
5 Other Geographies of Lending
51 Introduction the lending jigsaw
In the context of this report the drive for data disclosure by banks ndash more precisely area-
based information on a range of bank activities ndash is a drive to better understand financial
exclusion
The focus is on bank (and building society) lending patterns due to their dominance of
personal and business lending markets and their key role in the ability of all consumers and
citizens to access financial good and services Generally it is recognised that given particular
business models and target markets it is where the major banks choose not to invest (or
lsquounderinvestrsquo) that sets the market framework for other providers of financial services A
range of financial providers with differing objectives and business models ndash including state-
funded policy interventions ndash exist within these market segments and gaps in between and
alongside banks
In the context of a diversity of providers then if financial exclusion is to be fully understood it
requires knowledge of the lending patterns of all providers banks are merely one (if
invariably the largest) piece within the lending jigsaw This is why the call for lending data
disclosure is now directed at all financial service providers50
Data released under the voluntary BBA (and Council for Mortgage Lenders) disclosure
scheme has been reviewed above51
but what evidence and data exists for the lending
patterns of other personal and SME lenders
The following section provides an overview of what is currently known about the geography
of lending and relatedly data disclosure of other financial providers for personal lending and
SME lending markets
52 Geographies of personal lending other finance providers
In 2013 the CDFA commissioned a review of community finance markets which set out the
range of finance providers that seek to fill the gaps and opportunities left by mainstream
banks52
These included lsquohigh cost lendersrsquo credit unions community development finance
institutions and certain forms of crowdfunding amongst others
To date there is limited published information beyond the national scale for each of these
types of lenders although there have been some efforts to explore this in more detail
521 lsquoHigh cost lendersrsquo
The Office of Fair Trading has defined the high-cost credit market as including pawn
brokering payday and other short term small sum loans home credit and rent-to-buy credit
Providers operate lawfully within the terms of credit licenses from the Financial Conduct
Authority (FCA)53
and other regulation frameworks (such as the Competition and Markets
Authority CMA)
Lending products are typically small loans borrowed over short periods where high interest
rates or premium prices are charged This consumer market is intended to provide quick and
easily obtained short-term finance to individuals offering an alternative to overdrafts or credit
50
See httpwwwcommunityinvestmentorgukwp-contentuploads201307Disclosure-wrap-up-report-final-July-131pdf 51
See NEFWoodstock Institute (2006) Full Disclosure Why bank transparency matters A comparison of US and UK lending practices in disadvantaged communities for a review of early data disclosure initiatives in the UK 52
Short version is available at Henry N and Craig P (2013) Mind the Finance Gap Evidencing demand for community finance CDFARBS Group httpwwwcdfaorgukpolicypublicationsmindthefinancegap 53
See httpwwwfcaorgukyour-fcadocumentspolicy-statementsps14-03 httpwwwfcaorguknewsps14-3-final-rules-for-consumer-credit-firms and httpwwwfcaorguknewsfca-confirms-tough-new-rules-for-200bn-consumer-credit-market
34
cards provided by mainstream lenders ndash and which for many consumers in this market are
unobtainable54
Credit unions struggle also to respond to such a market given their
requirement to create a saving relationship with the individual before personal lending can be
undertaken and the issues of delivering a financially responsible and sustainable service55
It has been recognised that high cost lending can place a heavy burden on the low-income
consumers they serve but that they do provide a flexible and quick alternative when few
other choices or worse choices such as loan sharks and log loan books are available56
The Centre for Social Justice (2014) suggests that 2 million people in 2012 took out a high
cost loan because they werenrsquot able to access another form of credit57
In 2014 the CMA
(2014) analysed what they believed to be as over 90 per cent of the market representing 15
million loans worth pound39 billion over the period 2012 ndash 201358
The CMA estimates that in
2012 there were around 18 million payday loan customers in the UK taking out
approximately 102 million loans worth pound28 billion
Academics at the University of Nottingham have been building a GIS database that reveals
the changing geography of financial infrastructure including the details of branch locations of
new entrants to UK retail financial services such as payday lenders59
In 2013 there were
10348 bank or building societies in England Wales and Scotland combined60
and 1427
short term lender branches The data suggested one short term loan provider for every
seven bank or building society branches in UK high streets61
These short-term lending branches are disproportionately located in disadvantaged
communities62
and Competition Commission analysis of comprehensive lending data has
identified that 80 per cent of loans made in high-street branches were to individuals within
32 miles of high-street branches and 95 per cent to individuals within 9 miles of the store
This analysis is based on postcode data which highlights that the CMA holds a dataset that
could map the detailed geography of payday lending in the high cost loan market for 2013-
2014 including against deprivation indices
It should be noted however that the lsquohigh cost lender marketrsquo is undergoing substantial and
rapid change including in November 2014 the FCA confirming proposals to limit (lsquocaprsquo) the
level of interest charged and range of customer charges admissible in the market The
industryrsquos main trade association Consumer Finance Association has recognised the
proposals as sensible and proportionate although evidence is that lending levels have
54
ESRO (2014) Consumer Credit Research Payday Loans Logbook Loans and Debt Management Services for Financial Conduct Authority 55
See httpinclusioncentrecoukwordpress29wp-contentuploads201309Can-payday-loan-alternatives-be-affordable-and-viable-Final-Reportpdf for a pilot scheme to address the payday loan market 56
ESRO (2014) Consumer Credit Research Payday Loans Logbook Loans and Debt Management Services for Financial Conduct Authority 57
Centre for Social Justice (2014) Restoring the Balance Tackling problem debt httpcentreforsocialjusticeorgukUserStoragepdfPdf20reportsbalancepdf 58
See Competition Commission (2014) Payday Loans Customers and their loansmdashpresentation based on analysis of the transaction data ndash and the suite of detailed analyses of transactions data at httpswwwgovukcma-casespayday-lending-market-investigation 59
University of Nottingham (2013) Understanding and tackling financial exclusion the changing geographies of financial infrastructure and affordable credit httpwwwnottinghamacukgeographyresearchresearch-that-makes-a-differencefinancial-exclusionaspx 60
French S Leyshon A and Meek S (2013) The Changing Geography of British Bank and Building Society Branch Networks 2003-2012 httpwwwnottinghamacukbusinessbusinesscentrescrbfsdocumentscrbfs-reportscrbfs-paper3pdf
61 Bureau for Investigative Journalism (2014) UK One short-term lender for every seven banks on the high street
httpwwwthebureauinvestigatescom20130613revealed-the-1billion-high-cost-lending-industry Guardian
(2014) UK has a payday loan shop for every seven banks and building societies
httpwwwtheguardiancommoney2014mar12uk-payday-loan-shop-banks-building-societies 62
Bureau for Investigative Journalism (2014) UK One short-term lender for every seven banks on the high street httpwwwthebureauinvestigatescom20130613revealed-the-1billion-high-cost-lending-industry
35
dropped substantially in the last year and a number of providers have left or announced that
they are leaving the market63
522 Credit unions
Credit unions are member-owned not-for-profit financial institutions providing bill payment
facilities financial advice and education life insurance and other financial products They are
legally obliged to define a group of people who share a lsquocommon bondrsquo from whom they can
recruit their membership and to whom they can provide services This is often the workplace
andor the local community Credit unions vary in size and membership and in the services
they offer including savings ISAs banking and loans In being prepared to lend to people
who are (or are likely to be) rejected by commercial banks they address financial and social
exclusion
The Association of British Credit Unions suggested that in December 2013 there were 375
credit unions in across England Scotland and Wales with over 11 million people using the
sector with total estimated loans of pound676 million and pound1 billion of savings64
Civitas has
explored the size and distribution of credit unions between 1982 and 2012 revealing
substantial variation with the largest the Glasgow credit union with 30000 members and
the smallest having just a few hundred members65
This report also presented data at the regional level from the Financial Services Authority
highlighting the number of credit unions in the UK in 2011 with the highest proportion in the
North West (167) and West Midlands (86)66
Beyond the regional level there is little
published about the detailed geographical lending patterns of credit unions beyond the
assumption of local lending provision related to credit union location67
No comprehensive publication of the geography of lending of credit unions at
postcode level exists although annual returns on value and volume of loans are made
to the financial regulator by all credit unions
523 Community Development Finance Institutions (CDFIs)
Community Development Finance Institutions (CDFIs) are independent finance
organisations that provide financial services such as loans and investment to those people
and businesses who struggle to get finance from high street banks In 2013 CDFIrsquos provided
personal loans totalling pound19 million to 40600 households with the value of personal lending
increasing by over 70 since 201268
The distribution of these loans has been published at a
regional level and in 2013 two-thirds of customers were located in the 35 most deprived
areas (by Index of Multiple Deprivation) It should be noted also that in one or two local
instances CDFIs committed to data disclosure and transparency have sought to pilot
publication of their local lending data (see Fair Finance Box overleaf)
Overall no comprehensive publication of the geography of personal lending of CDFIs
at postcode level exists but as comprehensive annual returns on value and volume of
loans have been developed the trade association CDFA under its Inside Community
Finance reporting programme is now actively investigating the possibility of such
data disclosure
63
See httpwwwtheguardiancomcommentisfree2014nov12payday-loan-cap-consumers-credit-union-community-finance-alternative for one perspective on the market restructuring that might ensue from 2015 64
Association of British Credit Unions wwwabculorg World Council Credit Unions (2013) Statistics Report httpwwwwoccuorgdocuments2013_Statistical_Report 65
Wright J (2013) Credit Unions A Solution to Poor Bank Lending Civitas httpcivitasorgukpdfCreditUnionspdf 66
FSA (2012) Financial Returns httpwwwfsagovuksmallfirmsresourcesfactsheetspdfscreditunionstats-10pdf 67
But see for example fileCUsersab5841Downloadscommunity-finance-for-london-santander-pdf for some element of geographical analysis for London 68
CDFA (2014) Community Finance for Individuals
httpwwwcdfaorgukabout-cdfisicfcommunity-finance-for-individuals
36
Fair Finance ndash A UK Pioneer for Data Disclosure
London-based Fair Finance offers a range of financial products and services designed to
meet the needs of people who are financially excluded They aim to revolutionize personal
finance starting with the people whom the mainstream providers have left behind As they
put it lsquowhen we have helped to put the loan sharks and predatory lenders out of business
then we will know we have been successfulrsquo
Initially published as a physical report Fair Finance now provide an interactive map
accessible directly from their Home Page that details all their personal and business loans
since 2005 by volume and value at Ward level for the London Boroughs
(httpwwwfairfinanceorgukmap) Fair Finance strongly believes that through such data
disclosure they are being transparent and accountable to the public
Fair Finance report that their initial pilot work on data disclosure was limited in the main by
technical and presentational issues Data protection was resolved by delinking names and
addresses from loan details and an initial set-up cost of under pound8000 has facilitated an on-
line system requiring no more than data entry for a few hours a month
The newly mapped data was used to plan expansion and marketing strategies (for
example existing and new client locations and new branches) and supported securing
investment and finance
524 Crowdfunding (peer-to-peer personal lending)
Crowdfunding describes the collective cooperation of people who network and pool their
money and other resources together usually via the Internet to support efforts initiated by
other people or organisations to raise funds It enables an enterprise or individual to raise
external finance from a large number of people who make a small contribution In return
investors or donors receive a financial return social benefit in-kind reward or a combination
of these depending on their motivation to participate69
Crowdfunding is now recognised to
be a key lsquopillarrsquo in the collaborative economy70
The debt model of crowdfunding operates similarly to a bank loan but in this case the lender
is lsquothe crowdrsquo There are some variations within this model depending on the financial
motivations of the investors Where the lending motivations are purely financial this is
referred to as peer-to-peer lending Peer-to-peer lending platforms bring savers and
borrowers together and create investment packages offering both sides more attractive
interest rates than offered by mainstream lenders
Levels of regulation are not as high as in other lending markets and this is currently subject
to investigation and possible further regulatory proposals It should be noted also that as an
alternative source of personal lending it has been reported that individuals most likely to
access peer-to-peer lending are those with a good credit rating or those who are able to
provide additional security or guarantee Zopa represents one of the largest peer-to-peer
platforms lending around pound56 million since it was established in 2005 It is estimated that
there have been around 80000 borrowers to date with 52000 active lenders71
Almost intrinsically the nature of crowdfunding and crowdfunding platforms is the digital
collection and provision of substantial lending and market information to support distanciated
and (relatively) disintermediated investment behaviour ndash making the sector highly geared to
the potential for data disclosure on (the geography of) lending Funding Circle provides data
on all its loans since it began trading in 2010 including a wide range of information such as
the original credit band of the borrower purpose of the loan the loan term and loan amount
the interest rate and the next repayment date of the loan etc Such transparency in turn
69
NESTA (2012) The Venture Crowd Crowdfunding equity investment into business 70
NESTA (2014) Making Sense of the UK Collaborative Economy httpwwwnestaorguksitesdefaultfilesmaking_sense_of_the_uk_collaborative_economy_14pdf 71
Zopa httpwwwzopacomabout
37
allows sites such as httpwwwaltficomdata that provides interactive daily updates on the
growth of the UK peer-to-peer market
ODI (2013) Show Us the Money ndash Opening Up Bid Data in Finance
Utilising data from the largest peer-to-peer lenders (accounting for over 90 per cent of the
market) this report sets out to exemplify the power of lsquoopen datarsquo through mapping and
data visualisation of lending patterns at the regional and county level (see
httpsmtmlabstheodiorgODI-P2P-report-16jul13pdf) Simple findings include
Four regions invest more than they receive All four regions London South East South West and the East of England lie in the South of the UK
The range of lending per person ranges from pound14 to pound118 for UK regions whereas the range for recipients goes from pound39 to pound73 per person
As the report authors state
ldquoA broader message of this project is that this sort of granular financial data is collectable
in the age of terabyte warehouses and analytically tractable with the visualisation tools we
demonstrate here In sum this project is a step toward a more publicly transparent and
comprehensive mapping of the financial system Eventually we hope this map will become
updated in real-time with data feeds directly sourced from P2P platformsrdquo
53 Geographies of SME lending other finance providers
Information about the spatial distribution of SME lending in the UK is even more limited than
that available for personal lending There have been some efforts to begin to explore the
geography of the SME lending landscape
In 2013 the CDFA commissioned a review of community finance markets which set out the
range of finance providers that seek to fill the gaps and opportunities left by mainstream
banks72
These included community development finance institutions asset-based lending
crowdfunding (peer-to-peer) and equity based lending such as business angels and venture
capital
531 Community Development Finance Institutions (CDFIs)
Community Development Finance Institutions (CDFIs) are independent finance
organisations that provide financial services such as loans and investment to those people
and businesses who struggle to get finance from high street banks
In 2013 CDFIrsquos provided business loans totalling pound52 million to over 9 300 business
customers73
The distribution of these loans has been published at a regional level and in
2013 one-third of customers were located in the 35 most deprived areas (by Index of
Multiple Deprivation) It should be noted also that in one or two local instances CDFIs
committed to data disclosure and transparency have sought to pilot publication of their local
lending data (see earlier Fair Finance Box)
Overall no comprehensive publication of the geography of business lending of CDFIs
at postcode level exists but as comprehensive annual returns on value and volume of
loans have been developed the trade association CDFA under its Inside Community
Finance reporting programme is now actively investigating the possibility of such
data disclosure
72
Short version is available at Henry N and Craig P (2013) Mind the Finance Gap Evidencing demand for community finance CDFARBS Group httpwwwcdfaorgukpolicypublicationsmindthefinancegap 73
CDFA (2014) Community Finance for businesses
httpwwwcdfaorgukabout-cdfisicfcommunity-finance-for-businesses
38
532 Asset based short term lending
Asset based finance options represent a range of financial products that can provide funding
against a series of corporate assets including stock property machinery and equipment
and sometimes where appropriate even intellectual property The types of products that
could be gained through this channel include factoring invoice discounting and asset-based
lending Asset based lending has typically been made by large multinational corporations but
advances to SMErsquos have been growing strongly74
In 2014 asset-based lending in the UK
had a record quarter75
Asset based lending in the UK is dominated by the large clearing banks including Barclays
Lloyds Banking Group Royal Bank of Scotland and HSBC representing about 80 of the
market76
The Asset Based Finance Association release data on the level and type of asset
based finance provided by its members77
but there is no exploration to date of the
geographical distribution of where this finance is provided
533 Crowdfunding (debt and equity)
Crowdfunding describes the collective cooperation of people who network and pool their
money and other resources together usually via the Internet to support efforts initiated by
other people organizations or businesses to raise funds It enables an enterprise or
individual to raise external finance from a large number of people who make a small
contribution In return investors or donors receive a financial return social benefit in-kind
reward or a combination of these depending on their motivation to participate78
Crowdfunding is now recognised to be a key lsquopillarrsquo in the collaborative economy79
The nature of crowdfunding and crowdfunding platforms is the digital collection and provision
of substantial lending and market information to support distanciated and (relatively)
disintermediated investment behaviour ndash making the sector highly geared to the potential for
data disclosure on (the geography of) lending UK market leaders in debt-based business
peer-to-peer lending include Funding Circle and ThinCats and who both provide a range of
information on-line on loan activity Such transparency in turn allows sites such as
httpwwwaltficomdata or Crowd Data Centre
(httpthecrowdfundingcentrecompage=datacenter) to provide real time tracking of market
activity
A report from the Crowd Data Center in 2014 for example lists the UK as an area of high
growth with 608 projects fully funded during Q1 2014 representing a growth of 31780
In Q2
of 2014 the Crowd Data Center suggests that there were 3455 new projects in the UK of
which 1027 were funded81
The Crowd Funding Centre has also produced an interactive
global map crowdfunding map82
and a report which begins to explore the global distribution
of finance provided via crowdfunding83
The United Kingdom was listed 2nd
in the top 10 high
74
Henry N and Craig P (2013) Mind the Finance Gap Evidencing demand for community finance CDFARBS Group httpwwwcdfaorgukpolicypublicationsmindthefinancegap 75
httpwwwabfaorguknews2014AugustNews26082014asp 76
Financial Times (2014) httpwwwftcomcmss0f53e18dc-f8a3-11e3-befc-00144feabdc0htmlaxzz3DeryYgY5 77
ABFA (2013) Annual Report httpwwwabfaorgukmembersdocumentsabfa_annual_report_2012_Webpdf 78
NESTA (2012) The Venture Crowd Crowdfunding equity investment into business 79
NESTA (2014) Making Sense of the UK Collaborative Economy httpwwwnestaorguksitesdefaultfilesmaking_sense_of_the_uk_collaborative_economy_14pdf 80
The Crowd Data Center (2013) efunding amp The State of the Crowd Funding Nation Documenting the Global Rise of eFinance amp the eFunding Escalator wwwthecrowdfundingcentrecom 81
81
The Crowd Data Center (2014) Mapping the Crowdfunding Nation Where you Are Documenting the Rise of eFinance httpwwwcrowdfundinsidercom20140948400-mapping-crowdfunding-nation 82
The Crowd Data Center (2014) Create a Crowd Funding Map httpthecrowdfundingcentrecomindexphppage=reportdatacenter|pagemap 83
The Crowd Data Center (2014) Mapping the Crowdfunding Nation Where you Are Documenting the Rise of eFinance httpwwwcrowdfundinsidercom20140948400-mapping-crowdfunding-nation
39
performing countries based on the number of successful projects with the top 5 cities in the
UK listed as London Edinburgh Glasgow Brighton and Manchester London is positioned
4th in the top locations globally for crowd funded projects (behind Los Angeles New York
and Nashville) The potential exists for detailed lending geographies to be mapped
Nesta (2012) defined equity crowdfunding as lsquothe offering of securities by a privately held
business to the general public usually through the medium of an online platformrsquo
This is similar to a debt-based model of crowdfunding - as investors tend to be motivated by
more attractive financial returns than they can obtain from mainstream banks - but differs in
terms of risk and ownership structure The crowd becomes a shareholder in the business
and each investor holds a stake The rules of ownership and the financial motivations for
investors are similar to investors buying shares in a company quoted on the stock exchange
The businesses seeking investment from crowdfunding platforms tend to be much smaller
new business start-ups and there is a lot less reporting and financial rules required
Steady growth in equity lending platforms offering SME financing is taking place and the
same potential exists for mapping detailed geographies of lending through these
platforms
534 Equity finance Business Angels and Venture Capital
Approximately 1-2 of SMEs access lending via Business Angels (experienced
entrepreneurs or business people) or Venture Capital (often a fund run through general
partners) This type of finance is usually used as a catalyst to spark development or
commercialisation of emerging technology or products with potential for high growth
A report from the UK Business Angels Association examined 262 deals worth pound137 million
between 2012-13 including a regional level analysis of volume and value of deals84
For
example over half of angel investment was received by businesses in London and the South
East Currently a further study on the scale and impact of UK angel investing is underway85
Comprehensive and consistent data on the lending activity of British and European venture
capital funds are collected annually by the British Private Equity and Venture Capital
Association and the European Private Equity and Venture Capital Association86
Data
collection is undertaken in line with the (Walker) Guidelines for Disclosure and Transparency
in Private Equity introduced in 2007 in response to increased scrutiny of and negative
publicity around the equity industry (see Walker Guidelines Box below) Detailed
investment geographies are not published
84
DeloitteUK Business Angles Association (2013) Taking the Pulse of the Business Angels Market httpwwwdeloittecomassetsDcom-UnitedKingdomLocal20AssetsDocumentsMarket20insightsPrivateMarketsuk-business-angels-association-taking-the-pulsepdf 85
See httpwwwukbusinessangelsassociationorguknews12-new-emerging-angel-market-trends 86
httpwwwbvcacoukResearchPublicationsaspx httpwwwevcaeu
40
The Walker Guidelines for Disclosure and Transparency in Private Equity
Sir David Walkerrsquos Guidelines for Disclosure and Transparency in Private Equity
were developed and introduced in 2007 in response to the increased scrutiny and
negative publicity the private equity industry faced from the media trade unions and
politicians culminating in Treasury Select Committee hearings
The industry has embraced the Guidelines Over eighty companies are providing
additional disclosure voluntarily with a number of benefits identified including
The Guidelines provide a framework for the private equity industry to enhance stakeholdersrsquo understanding of activities and address concerns about a lack of transparency in the industry
The data published on the performance of portfolio companies supports the advocacy work the BVCA does on behalf of the private equity industry including credibility and evidence when discussing the industryrsquos contribution to the broader economy This in turn allows for more informed and proportionate decisions on policy and regulation by Government and regulators It also supports returns attribution analysis
By publishing annual reports on portfolio company websites and including further disclosure on private equity firmsrsquo websites the industry is able to demonstrate its commitment to transparency is real and here to stay
Enhanced reporting and disclosures demonstrates the industry as responsible owners and builders of businesses and has supported reputational benefits and reporting ahead of public market listings
The Guidelines are monitored by an independent body which further validates the
private equity industryrsquos transparency commitment
Source httpwwwbvcacoukResearchPublicationsWalkerGuidelinesaspx
54 Summary The jigsaw of lending provision
The findings from this snapshot review of the range of personal and business lending
providers are summarised in Table 51 overleaf The findings illustrate the current paucity of
comprehensive lending data available that is reported at an area-based level ndash and which
could provide the basis for detailed analysis and understanding of lending patterns
Nevertheless a number of developments and inferences can be noted including
The voluntary BBA Postcode Lending Data Scheme places the UK at the frontline of
international developments in data disclosure ndash but as it currently stands the data has
substantial limitations if seeking to understand and respond to local lending patterns
Developments in the USA based on the Home Mortgage Disclosure Act and the
Community Reinvestment Act continue to provide the international example (and
lessons) of the power of data transparency and disclosure in lending markets
The Walker Guidelines for Disclosure and Transparency in Private Equity provide an
example of a widely embraced ndash and independently monitored - voluntary industry
disclosure scheme
In virtually all personal and SME lending markets under review in this report there exist
processes of annual collection of lending data that could provide the platform for area-
based information disclosure Indeed crowdfunding platforms provide the potential
model for (real-time) routine collection of granular financial data in a new era of lsquoopen
datarsquo and
Individual UK pioneers committed to data disclosure ndash such as Fair Finance - are
identifiable as lending institutions who have overcome issues of data availability data
protection and cost to use area-based information to both support their business
activities and provide accountability through transparency
41
Table 51 Data Disclosure across the Lending Jigsaw
Lending Market
Provider Disclosure of Area-Based Lending Information
Personal
lsquoMainstream Banksrsquo
Recently introduced voluntary BBA Postcode Lending Data Scheme covers
approximately 60 per cent of personal loans lending undertaken but data limitations
substantially constrain usefulness for area-based analysis currently
lsquoHigh cost lendersrsquo
Currently no annual lending data on the sector is collected which could form the
basis for comprehensive disclosure including at an area-based level
There are examples of individual lenders actively working on data disclosure and
work by organisations such as the Competition Markets Authority has shown the
power of area-based data provision in supporting effective regulation and consumer
empowerment
Credit Unions
Annual lending returns are made by the sector to the financial regulator but no
recent comprehensive detailed analysis of the geography of lending by credit
unions exists or is regularly published
Community Development Finance Institutions
Recent developments in sector-wide annual reporting (Inside Community Finance)
offer the possibility of area-based reporting at postcode level
Individual lender Fair Finance has pioneered data disclosure of lending
Crowdfunding (peer-to-peer)
Granular financial lending data is collected routinely and published (almost in real-
time) by providers and increasingly in aggregate form as sector associations and
organisations have developed Area-based analysis is however lacking to date
SME
lsquoMainstream Banksrsquo
Recently introduced voluntary BBA Postcode Lending Data Scheme covers
approximately 60 per cent of bank lending to SMEs undertaken but data limitations
substantially constrain usefulness for area-based analysis currently
Community Development Finance Institutions
Recent developments in sector-wide annual reporting (Inside Community Finance)
offer the possibility of area-based reporting at postcode level
Individual lender Fair Finance has pioneered data disclosure of lending
Asset Based Lenders
The Asset Based Finance Association release annual data on the level and type of
asset based finance provided by its members but there is no area-based
exploration of the data provided
Crowdfunding (debt and equity)
Granular financial lending data is collected routinely and published (almost in real-
time) by providers and increasingly in aggregate form as sector associations and
organisations have developed Area-based analysis is however lacking to date
Business Angels
Recent report analysed lending at regional level UK Business Angels Association
currently undertaking major sector research project that offers the potential for
detailed area-based analysis
Venture Capital
Comprehensive data collection and publication is undertaken voluntarily under the
Walker Guidelines for Disclosure and Transparency for Private Equity ndash but area-
based analysis is not undertaken or reported routinely
42
6 Conclusions and Recommendations 61 Building an understanding of the jigsaw of financial provision some
conclusions
This study has set out to utilise the new development in data disclosure of the BBA Postcode Lending
Data to map area-based patterns in personal and SME lending markets Given that the call for lending
data disclosure is now directed at all financial service providers the study has further reviewed the ability
to undertake area-based analysis across those other providers that lend in personal and SME markets
Conclusion 1 The BBA Personal Lending Dataset shows that
Median personal lending per head of the adult population across Postcode Sectors in Great
Britain in 2013 was pound602 Lending per adult in the lowest 10 per cent of Postcode Sectors was
around two-thirds of this figure or less whereas in the highest 10 per cent of Postcode Sectors
lending per adult was around a third or more above the median
Total personal lending tends to decline as the arearsquos deprivation level increases (once
adjusted for population size) The data confirms a previously identified lending pattern
Publication of the data at Postcode Sector level increases the technical requirements and
costs of meaningful data analysis Given the detailed postcode base of the underlying data there
is scope to make additional data available for other more useful and commonly used units of
analysis (such as Lower-layer Super Output AreasScottish Data Zones) through relatively
straightforward processes
Expanded data release on a range of indicators of lending activity is required to allow
substantial and robust analysis of areas underserved by mainstream banks ndash these are needed to
accurately assess how many and what types of borrowers in the local population are and are not
receiving personal bank lending
Conclusion 2 The BBA SME Lending Dataset shows that
Average (median) SME lending per business in Great Britain in 2013 was pound47072 Lending per
business in the lowest 10 per cent of Postcode Areas was below pound35000 and in the highest 10 per
cent of Postcode Areas lending per business was over pound68000
Expanded data release on a range of indicators of lending activity is required to allow
substantial and robust analysis of areas underserved by mainstream banks ndash these are needed to
accurately assess how many and what types of borrowers in the local business population are and
are not receiving SME bank lending
Conclusion 3 The UK BBA postcode lending data scheme is a valuable step toward bank
data transparency and puts the UK at the forefront of international developments ndash but current
limitations substantially constrain analysis of area-based lending patterns
Conclusion 4 There exists a paucity of comprehensive lending data available that is reported
at an area-based level ndash and which could provide the basis for detailed analysis and understanding
of local lending patterns Nevertheless
The voluntary BBA Postcode Lending Data Scheme places the UK at the frontline of international developments in data disclosure ndash but as it currently stands the data has substantial limitations for those seeking to understand and respond to local lending patterns
Developments in the USA based on the Home Mortgage Disclosure Act and the Community Reinvestment Act continue to provide the leading international exemplar of the power of data transparency and disclosure in lending markets
The Walker Guidelines for Disclosure and Transparency in Private Equity provide an
43
example of a widely embraced ndash and independently monitored - voluntary industry disclosure scheme
In virtually all personal and SME lending markets there exist processes of annual collection of lending data that provide the framework for area-based information disclosure Indeed crowdfunding platforms provide the potential model for (real-time) routine collection of granular financial data in a new era of lsquoopen datarsquo and
Individual UK pioneers committed to data disclosure ndash such as Fair Finance - are identifiable as lending institutions who have overcome issues of data availability data protection and cost to use area-based information to both support their business activities and provide accountability through transparency
62 Recommendations
Recommendation 1 Support the BBA its members and other financial service
providers to further develop the power value and robustness of the voluntary
postcode lending data disclosure scheme through five factors (see Table 61)
Table 61 Recommended Developments of the BBA Postcode Lending Data
Issue Current Position Recommendation
Data lsquofiltersrsquo Filter rules are ambiguous at
margins
Introduce and report a common system
of cell lsquomarkersrsquo across reported
datasets to identify reason for blank or
missing data
Evidence of
unexplained data
volatility across
datasets
Opaque process of data
construction
Explanatory notes including
on quality assurance
processes provide little
insight
lsquoEarly dayslimited numberrsquo of
data releases
Expand accompanying notes to provide
detail of coverage and construction
process across all participating lenders
(and BBA) for each data release
Provide an additional technical report on
dataset construction and which
addresses issues of expected and
actual volatility
The detail should allow like-for-like
comparisons of data cells across
lenders and data releases as much as
possible
Use of Postcode
Sector for
reporting
Scale does not allow detailed
analysis or ease of
comparison with other key
data
Also to report at Lower-layer Super
Output AreasScottish Data Zones
(LSOA) or if not Middle-layer Super
Output Areas (MSOA)
Some trade-off between more detailed
geographies and data disclosure may
occur but at minimum this should be
tested
Limited lending
data
Total lending variable by
Postcode Sector only
Expand data release to include number
of transactions including declines
individual loan amounts markers of cost
of loan release and characteristics of
the borrower (eg gender ethnicity) or
business (eg turnover employment
legal form)
Market coverage Partial Seek common standard publication of
lending data by all BBA members and
related financial service providers
PO
WE
R O
F D
ISC
LO
SU
RE
44
Recommendation 2 Build on the now almost complete annual data collection and reporting
exercises of most market providers to support area-based lending disclosure
Virtually all lsquosegmentsrsquo of the personal and SME markets are now undertaking annual reporting and
disclosure of lending activity to a greater or lesser extent This provides a set of reporting activity
which in unison has the potential to provide comprehensive data on area-based lending and local
lending markets ndash but only given understanding of the strategic power and operational requirements of
area-based information reporting The lsquoownersrsquo of these reporting frameworks principally trade and
sector associations should be actively engaged with and supported to develop area-based
information reporting including through highlighting existing examples
Recommendation 3 Look to build on the UK experience of developing data disclosure to
support international developments in area-based lending disclosure
There is growing international interest in transparency data disclosure and financial exclusion The
UK is learning from and now sits alongside the USA as an international example Within the UK there
now exists
Theoretical policy and practitioner understanding of the power costs and benefits of
data disclosure including working examples
A set of mainstream financial institutions engaged in voluntary data disclosure
Provision of lending information across personal and SME market segments and
provider categories and
Understanding of the key metrics and data points to support area-based lending
45
Annex 1 The BBA Postcode Lending Data Selected Maps
A11 Average Bank Personal Lending per Adult by English Local Authority
46
A12 Average Bank Personal lending per Adult by English Parliamentary Constituency
47
A13 Average Bank Personal Lending per Adult by Scottish Council
48
A14 Average Bank Personal lending per Adult by Scottish Parliamentary Constituency
49
A15 Average Bank Personal Lending per Adult by Welsh Local Authority
50
A16 Average Bank Personal lending per Adult by Welsh Parliamentary Constituency
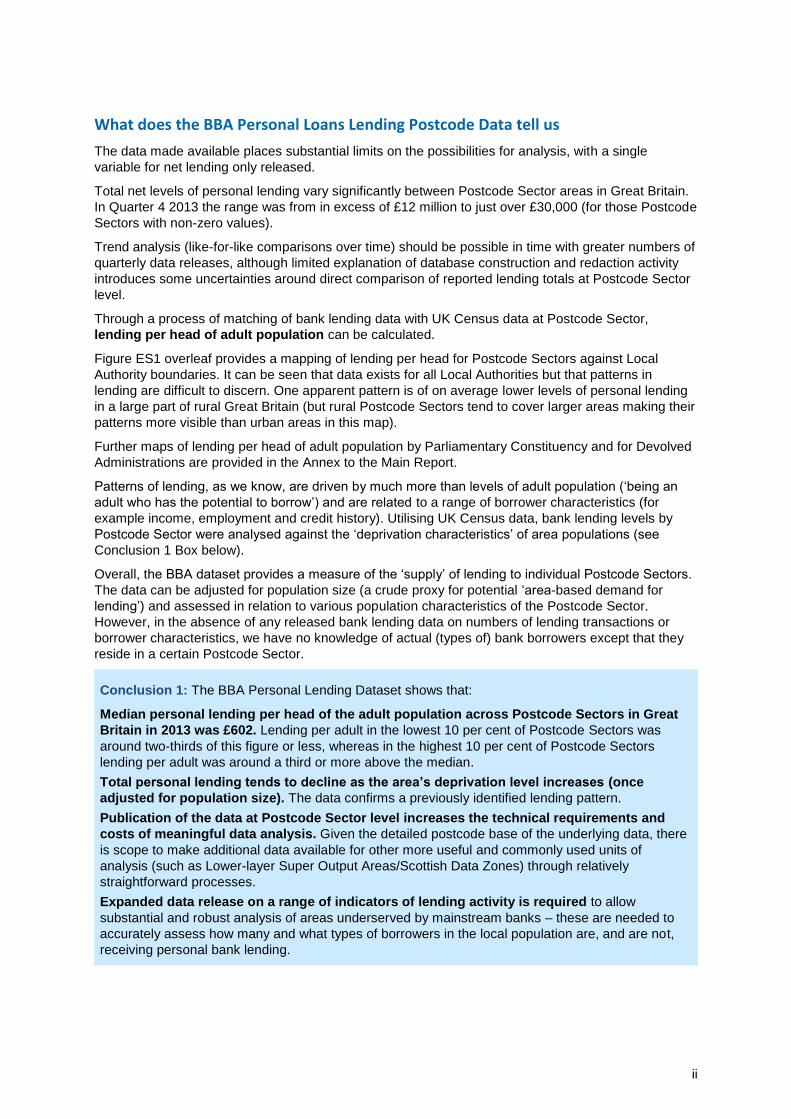
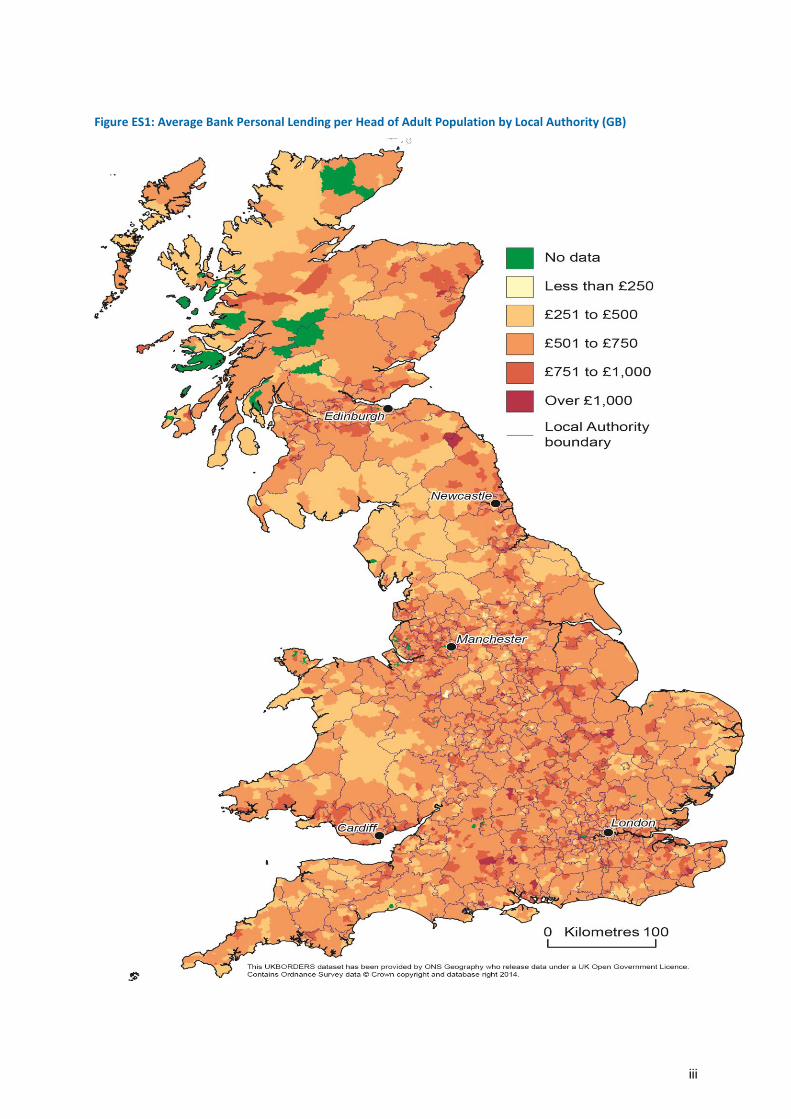
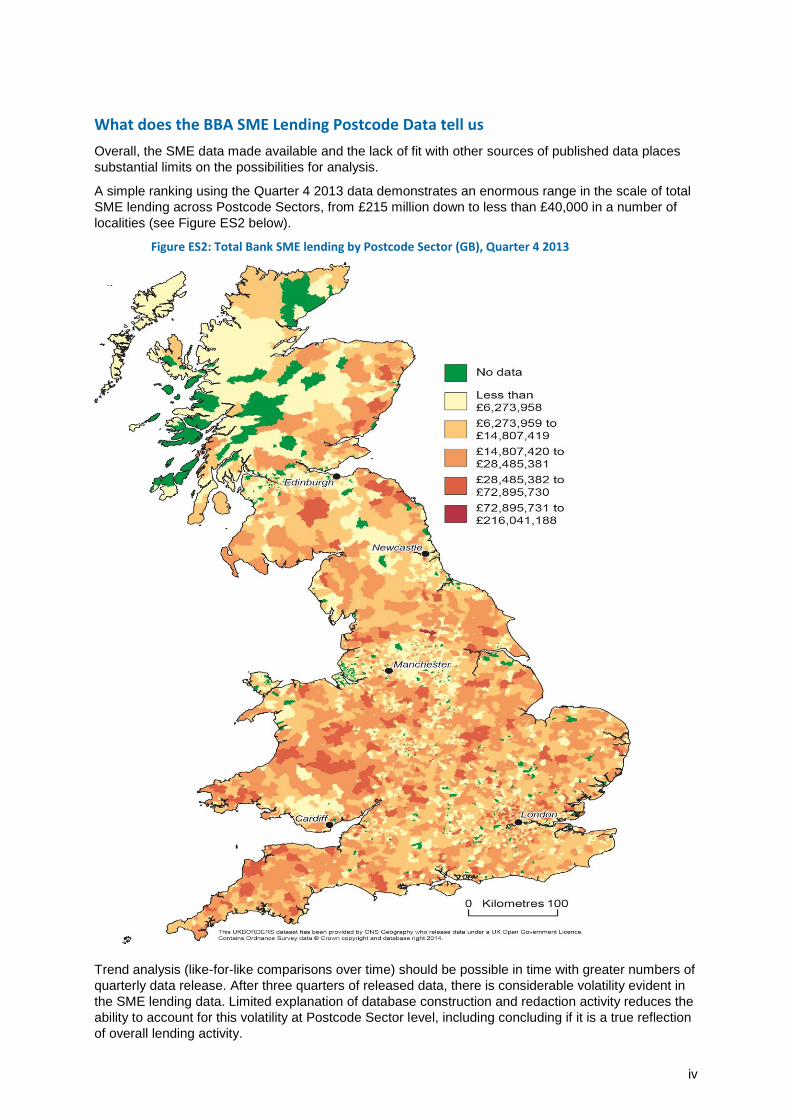
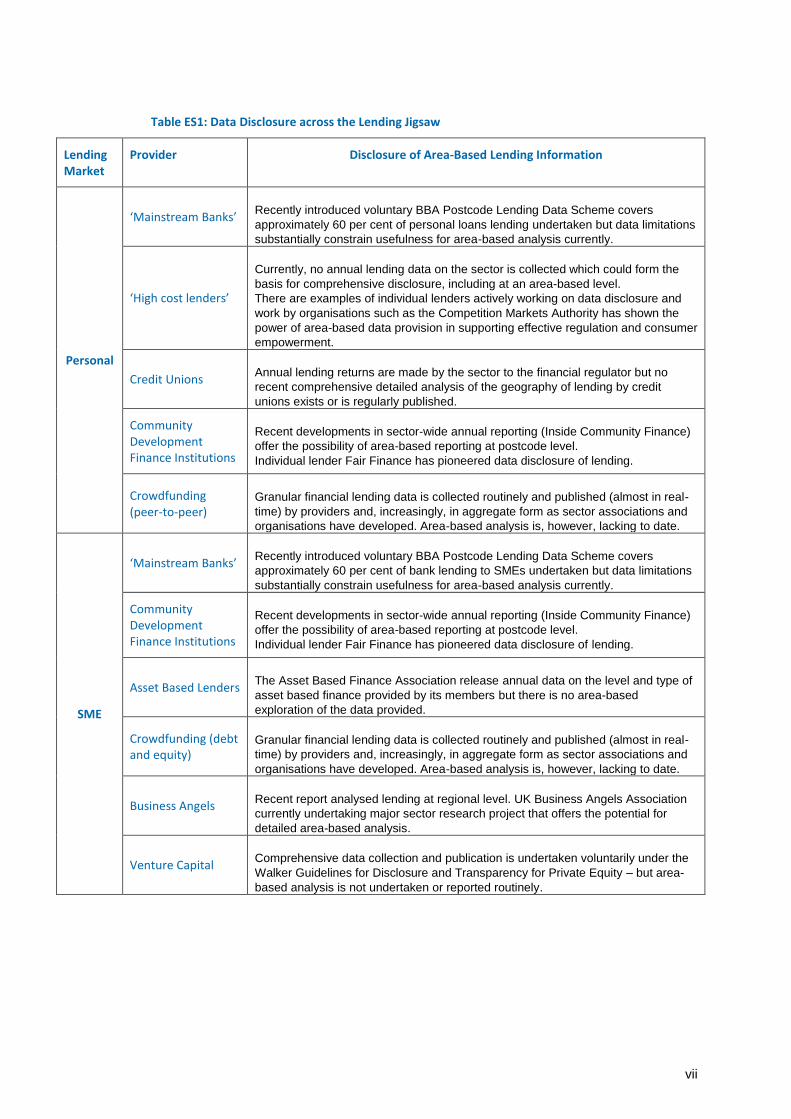
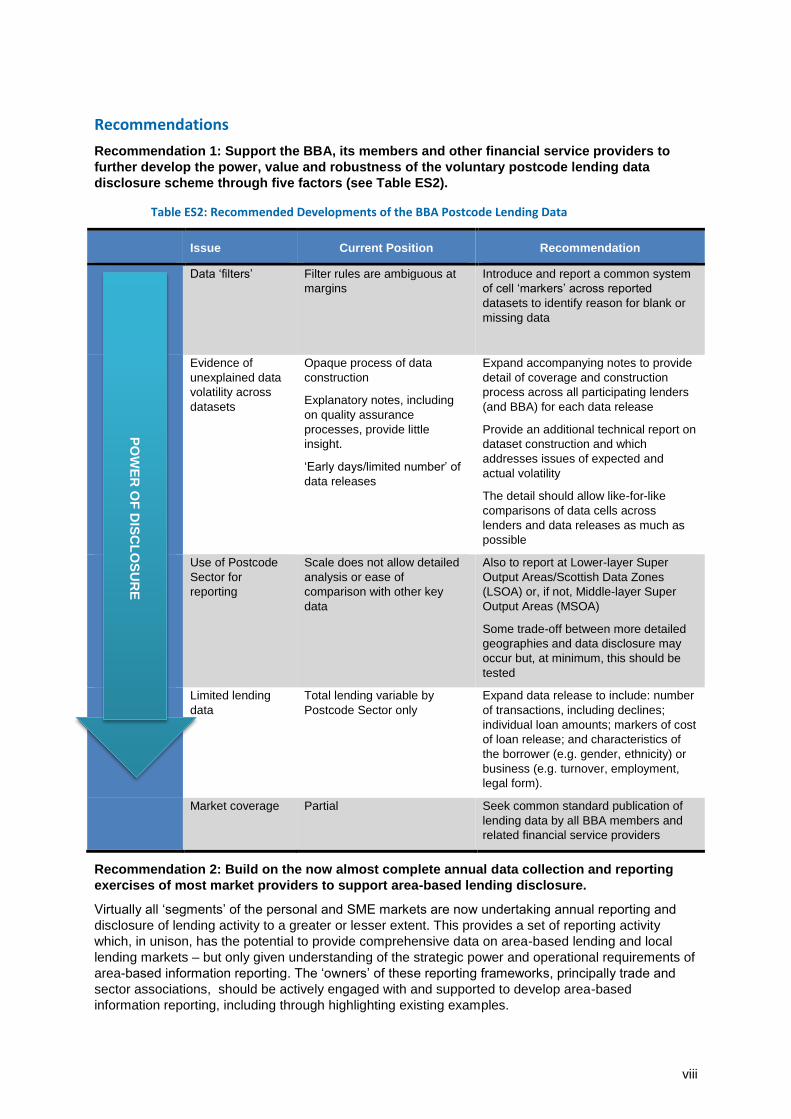
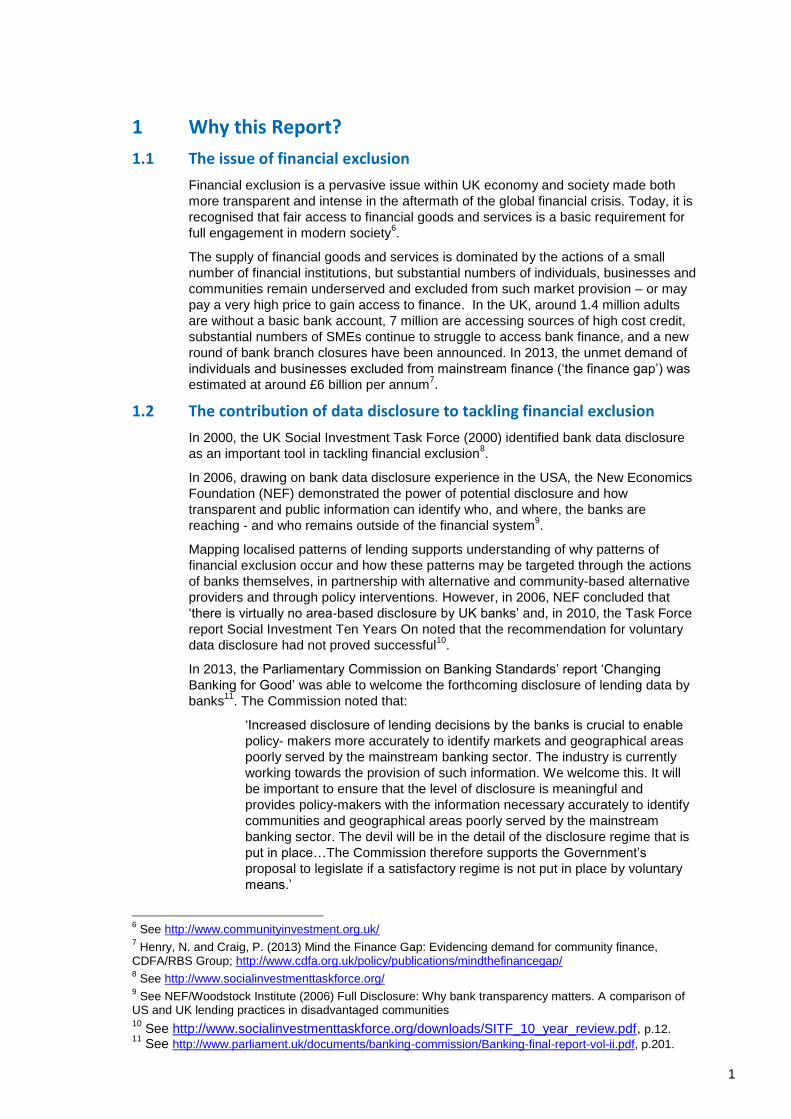
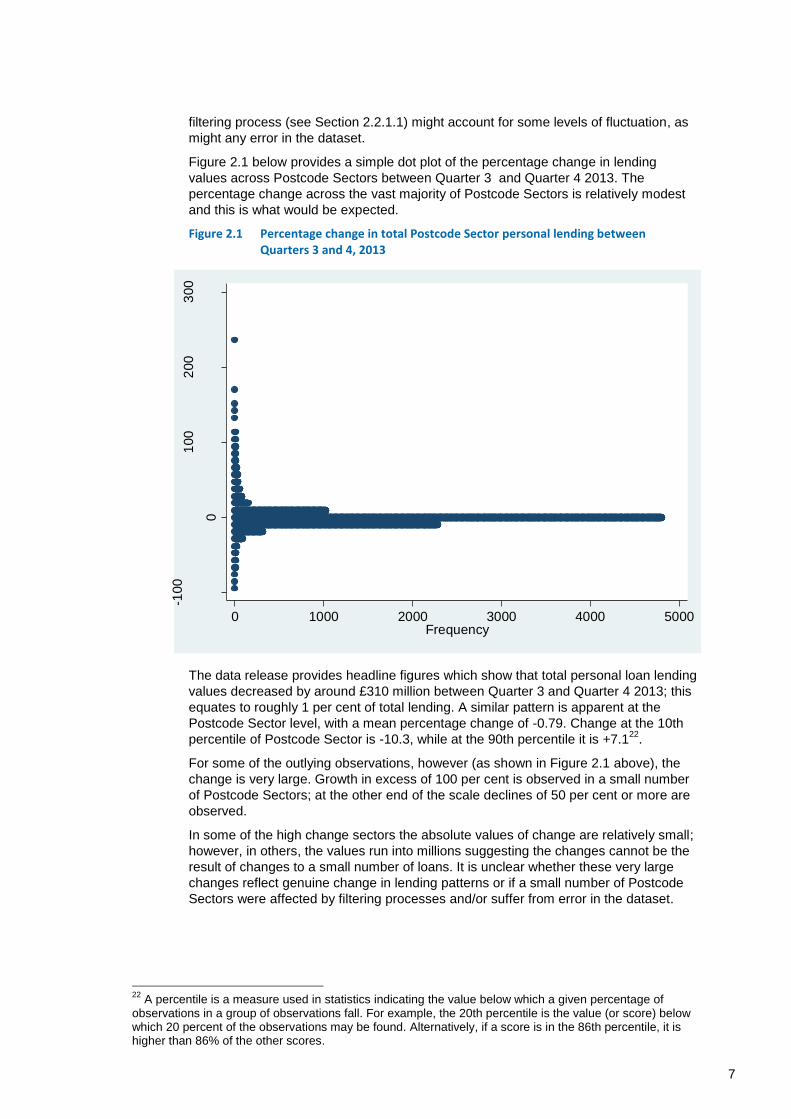
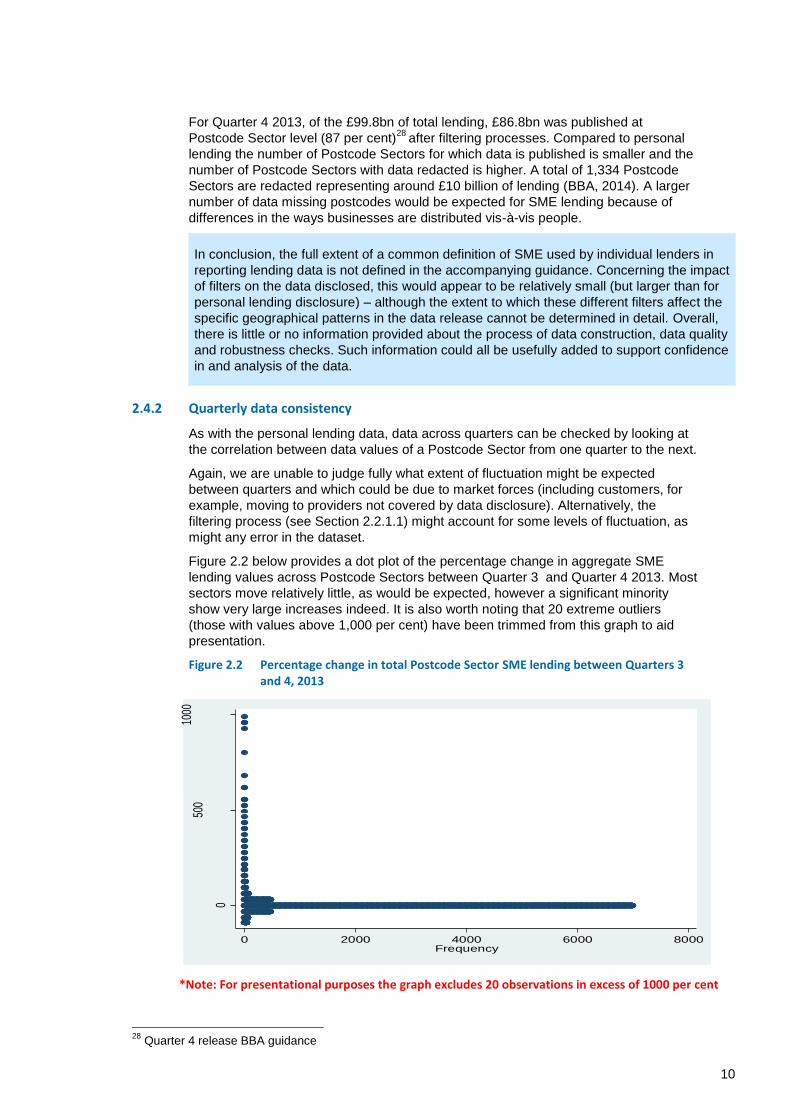
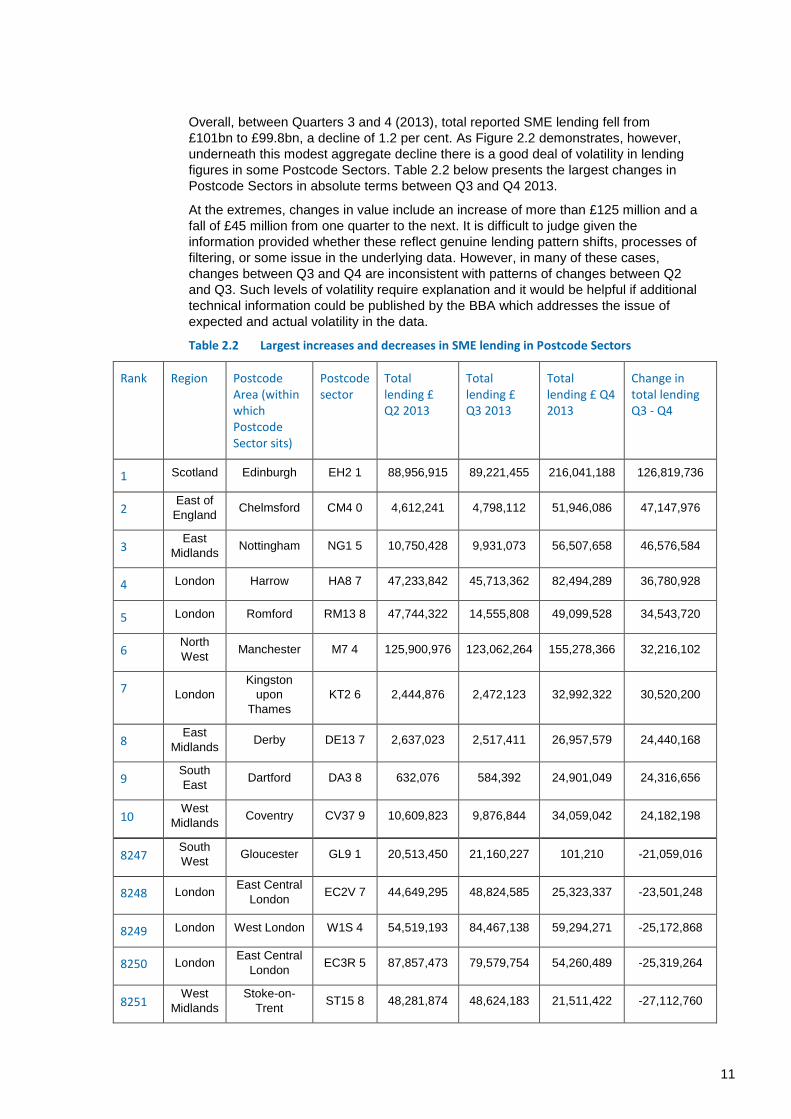
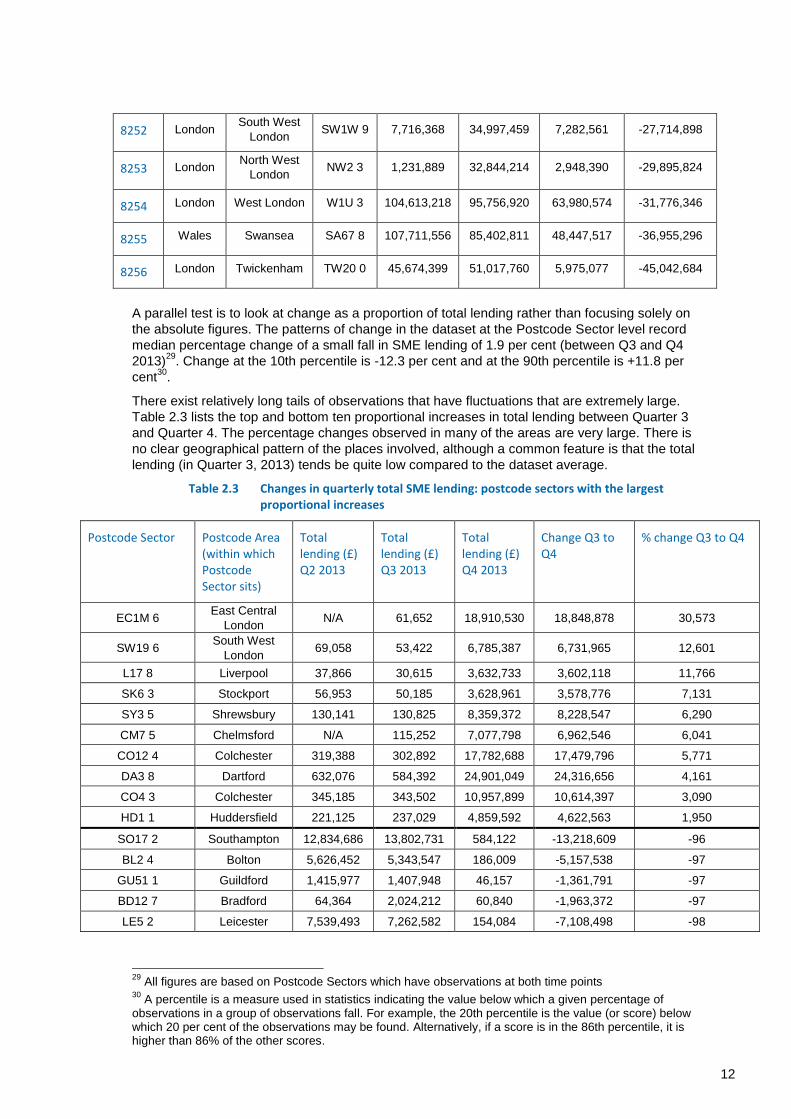
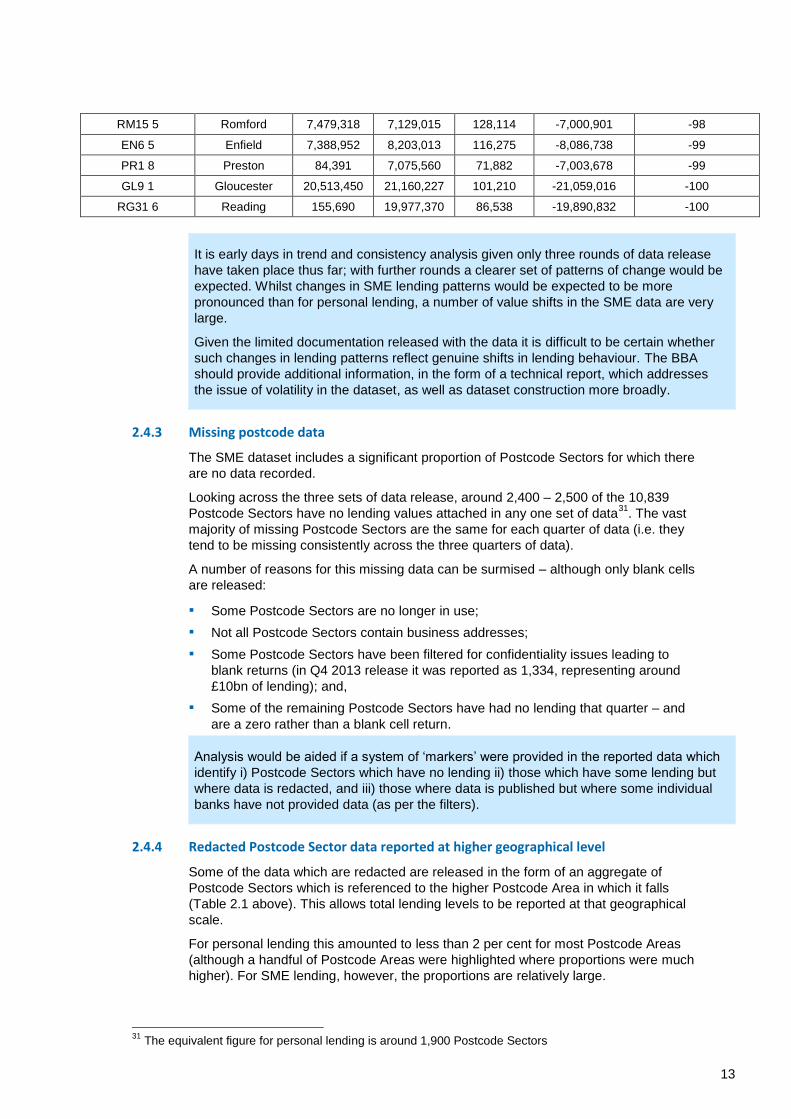
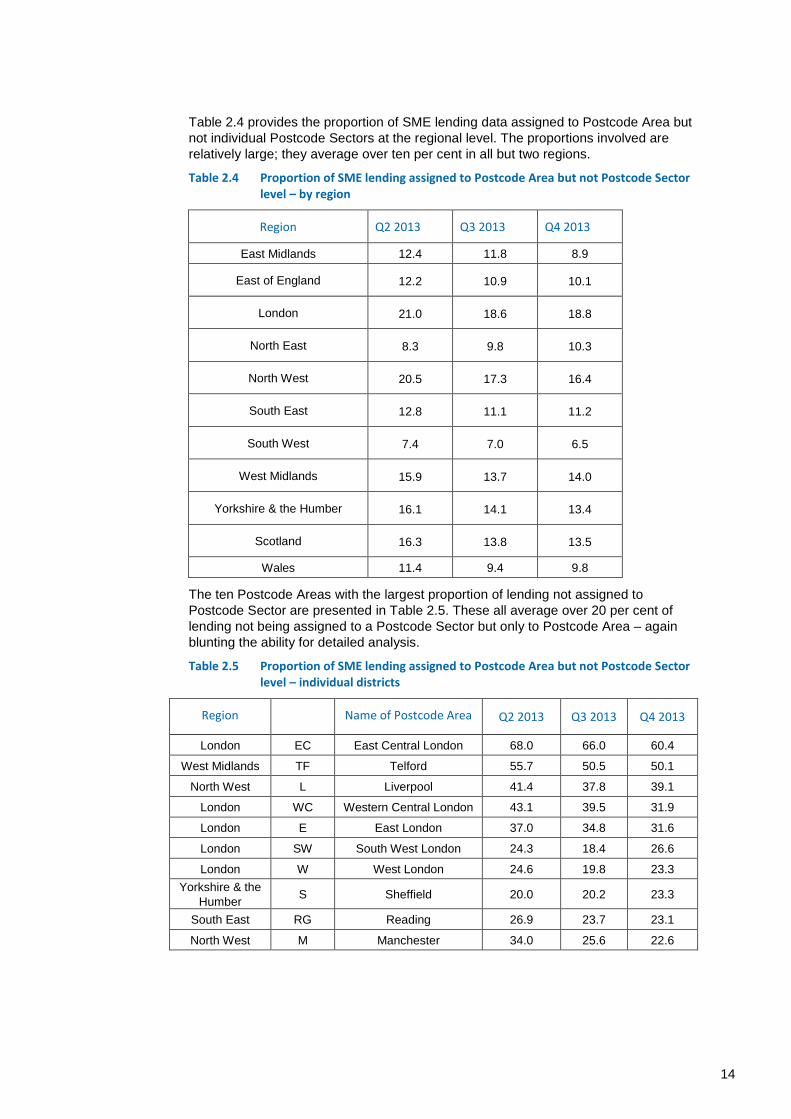
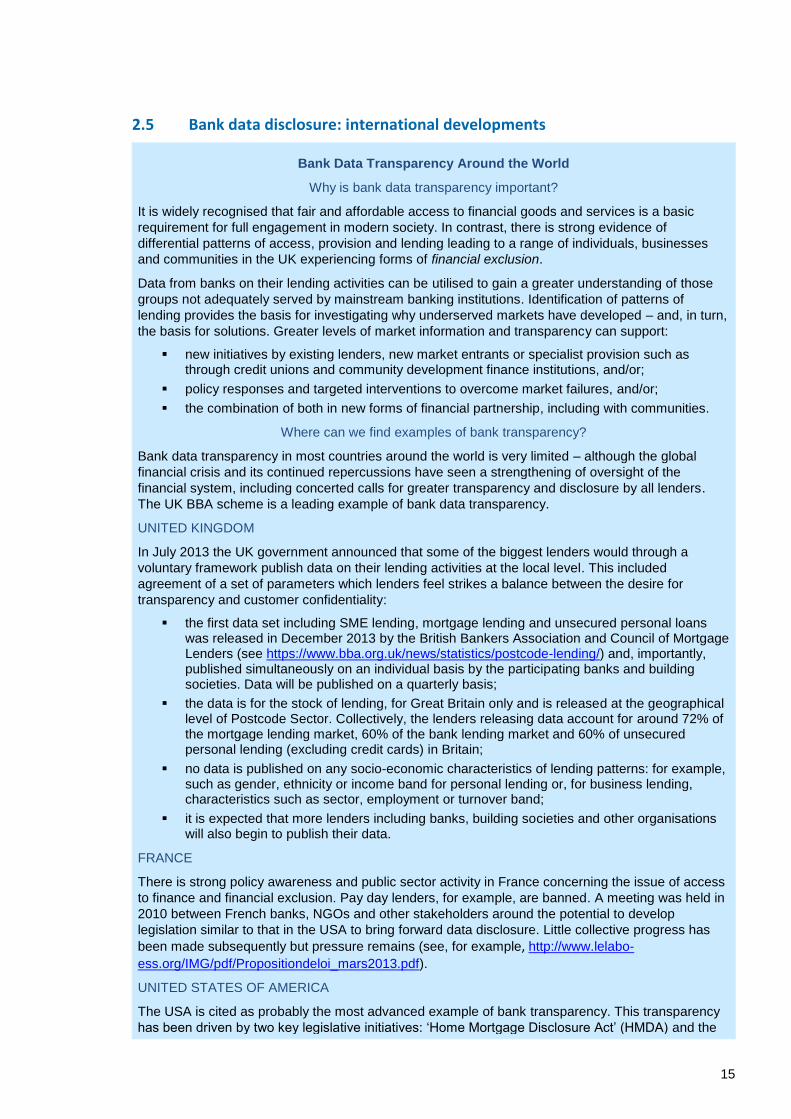
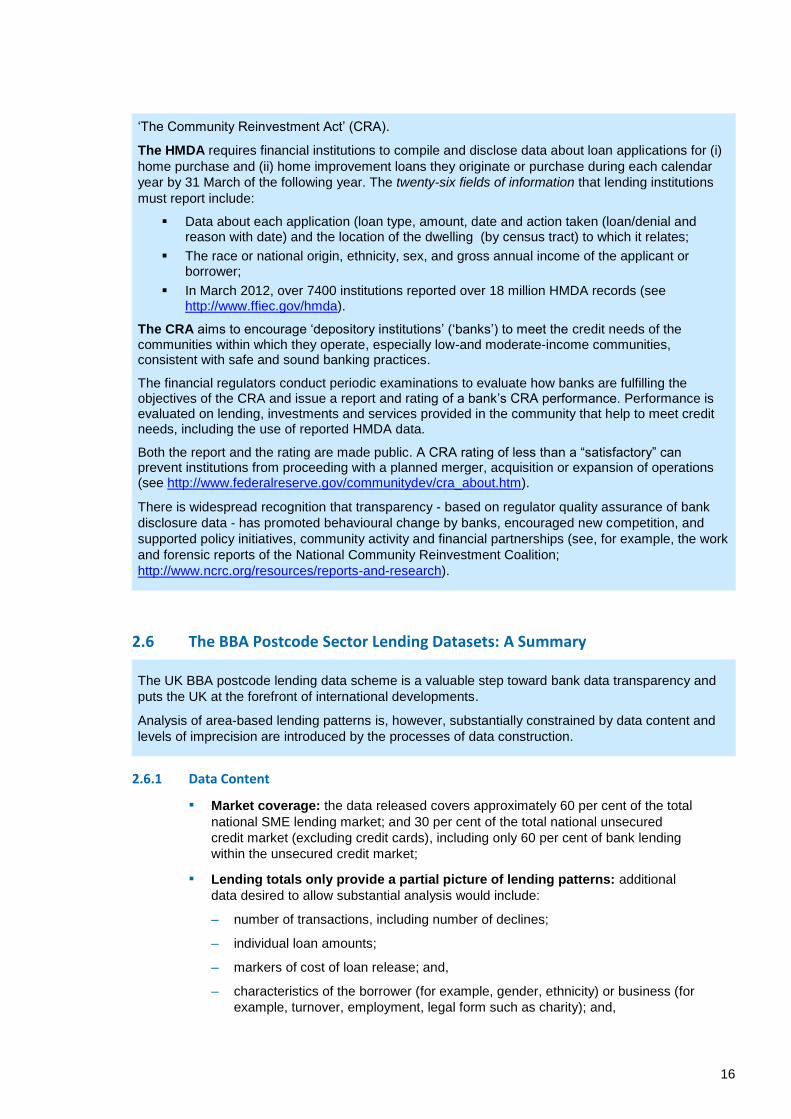
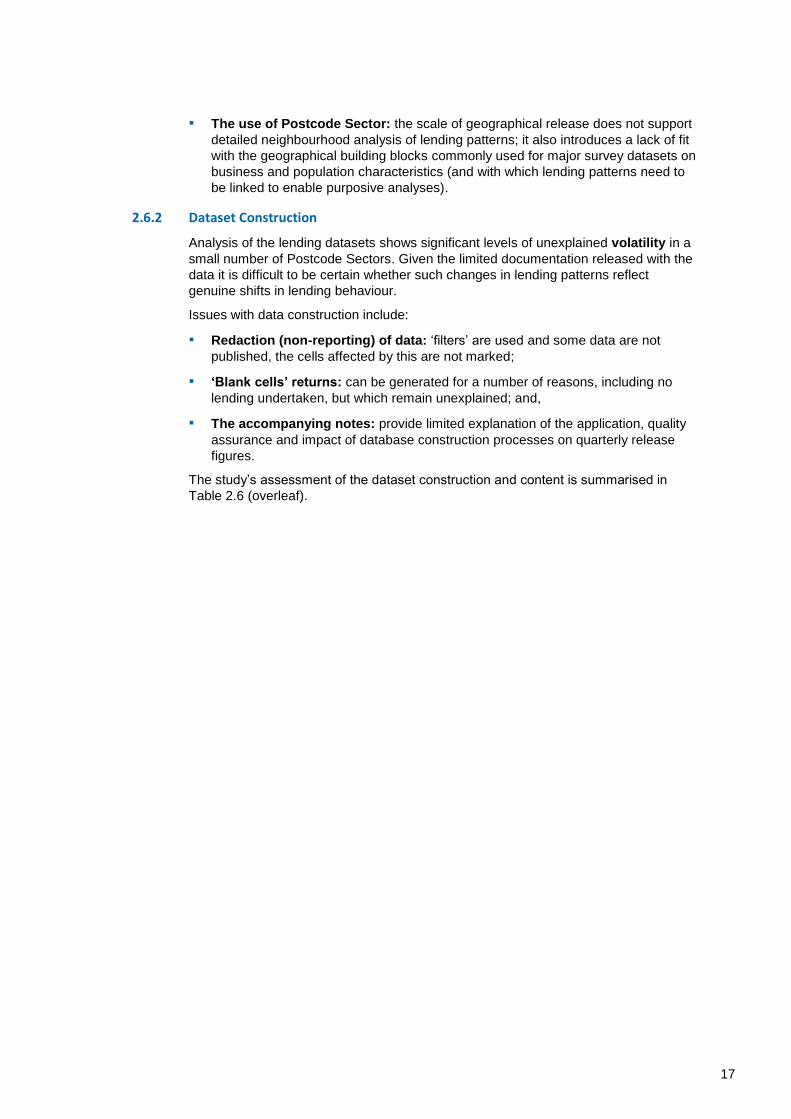
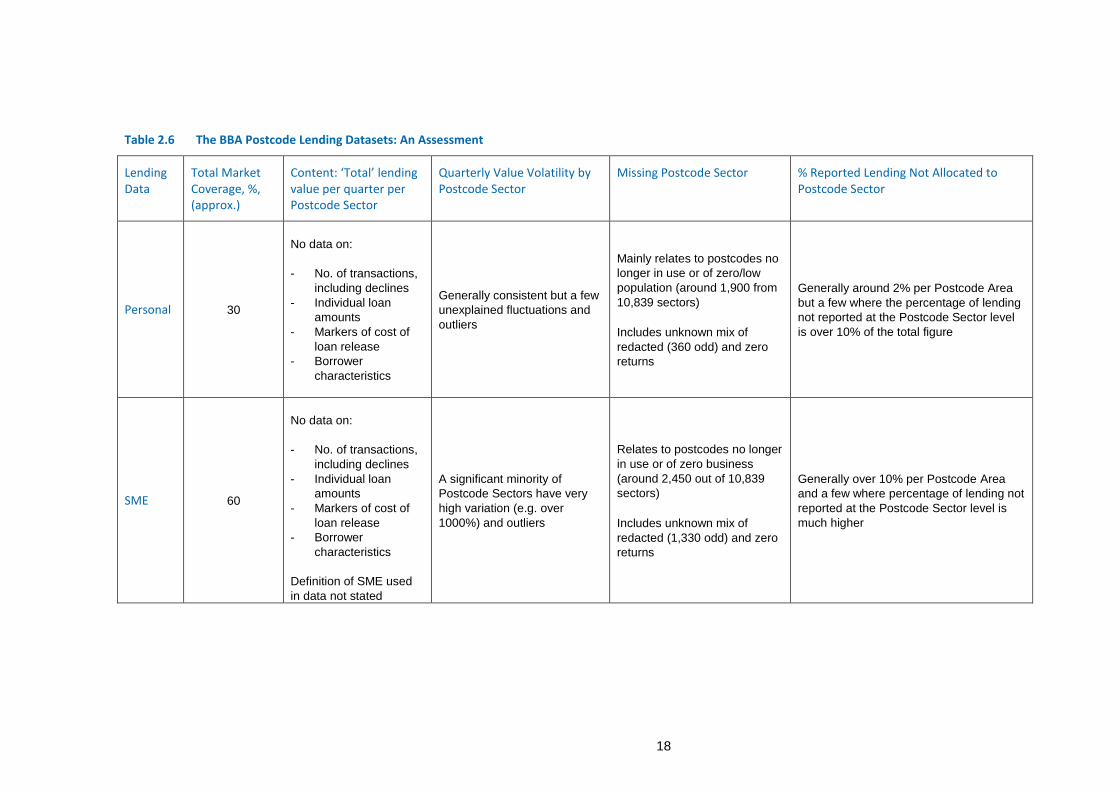
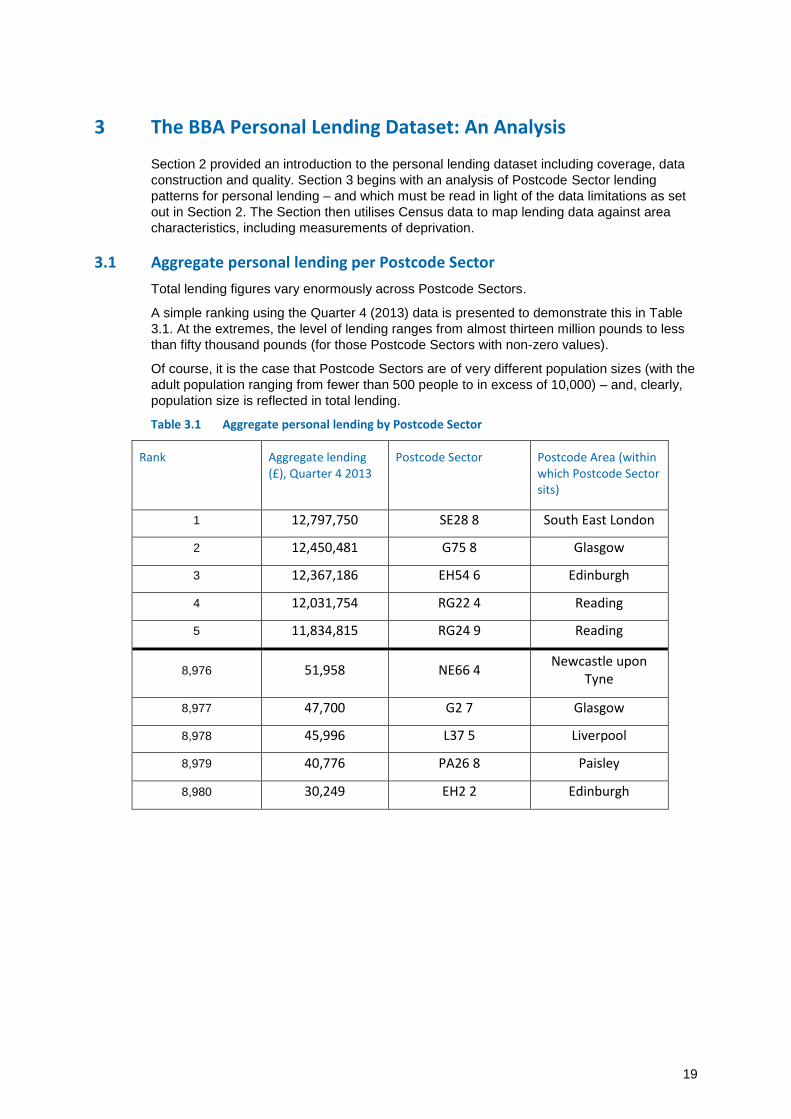
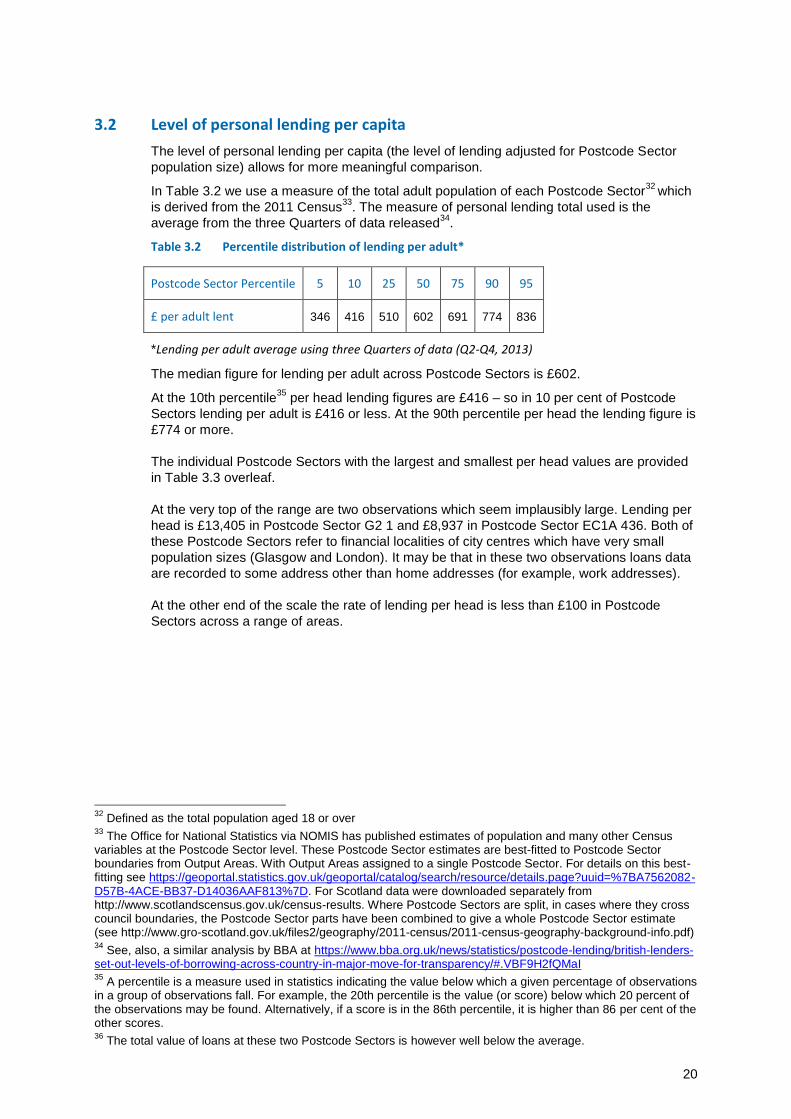
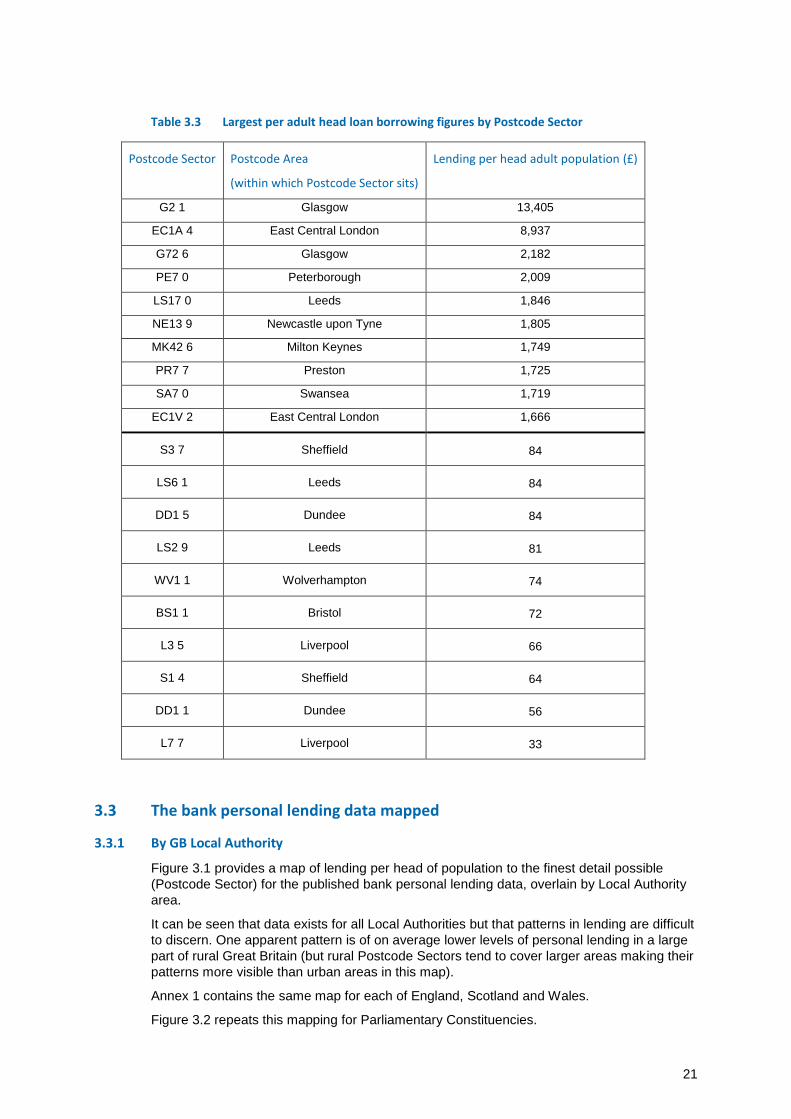
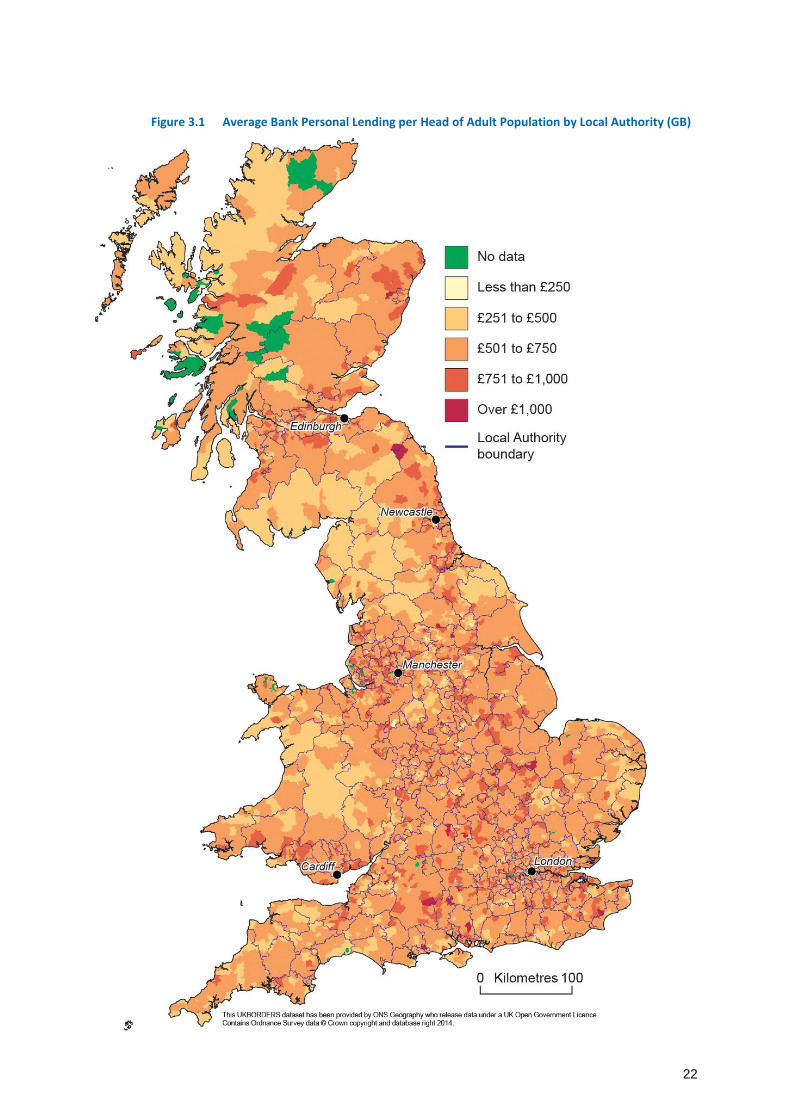
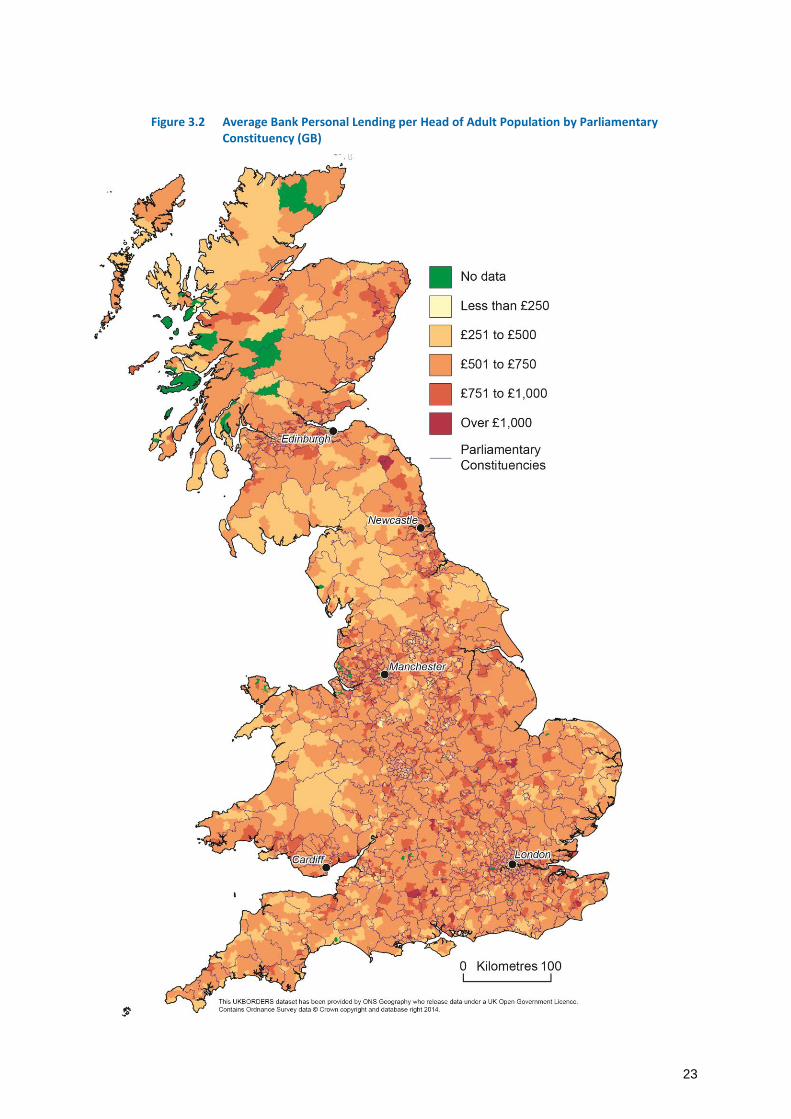
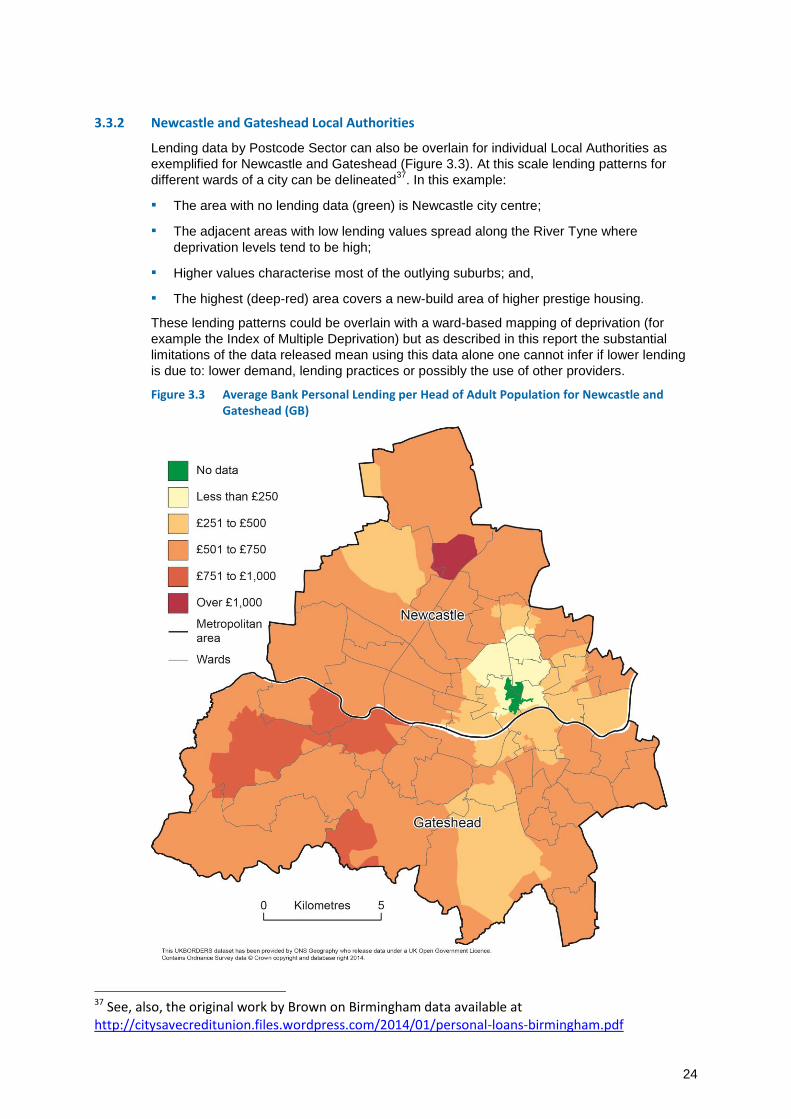
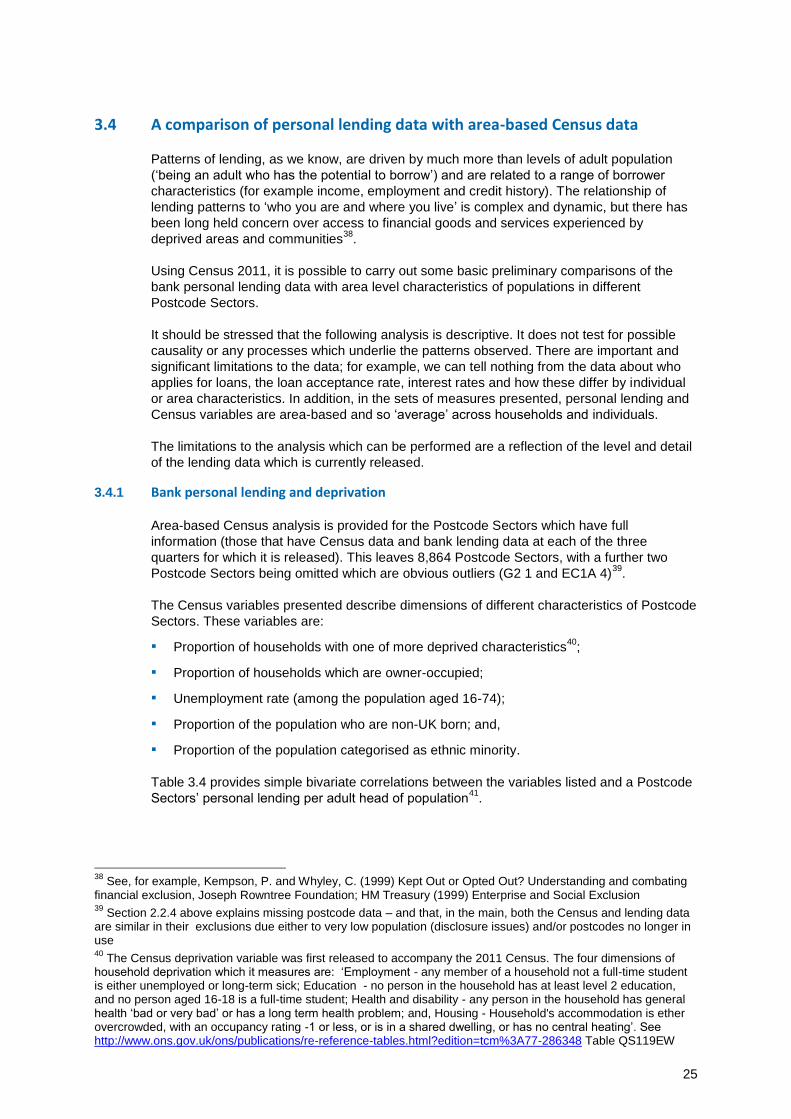
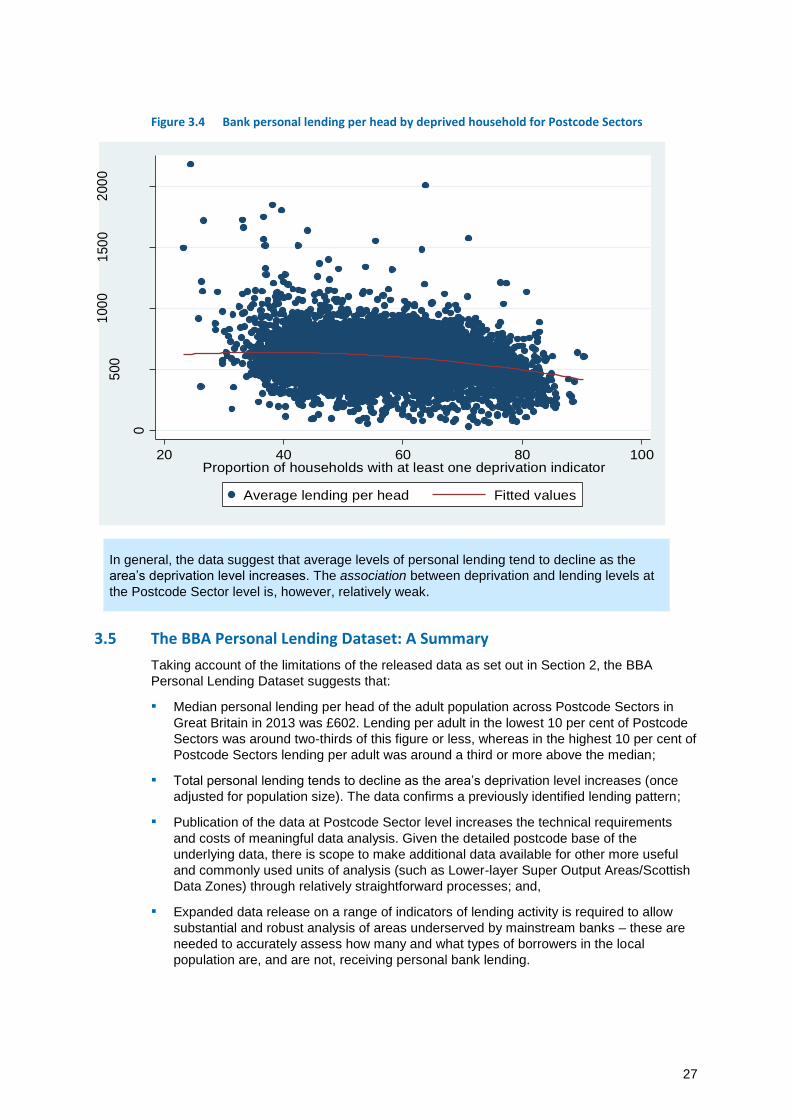
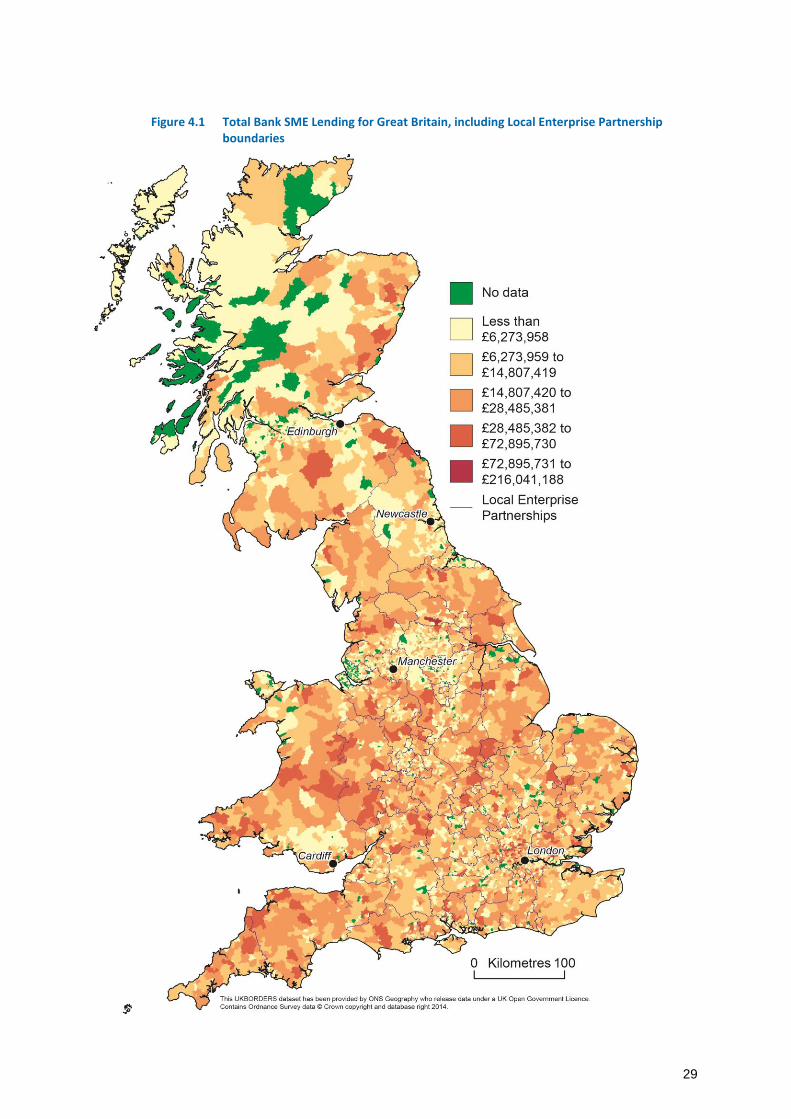
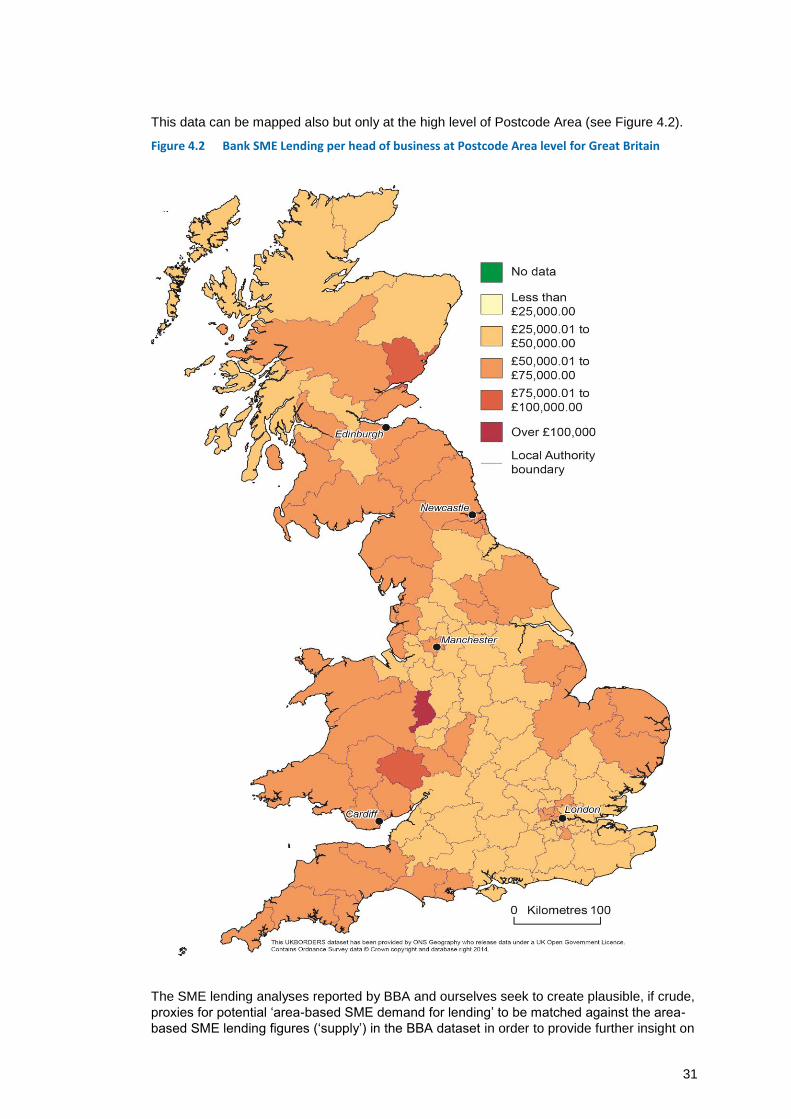
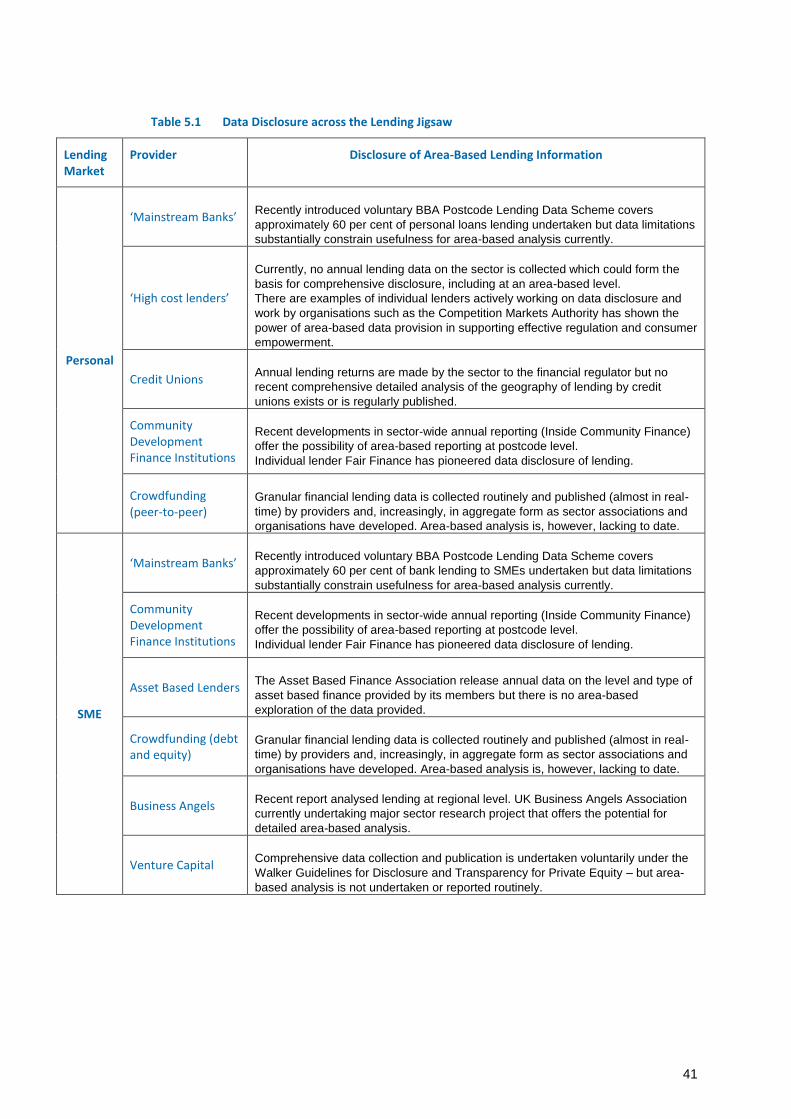
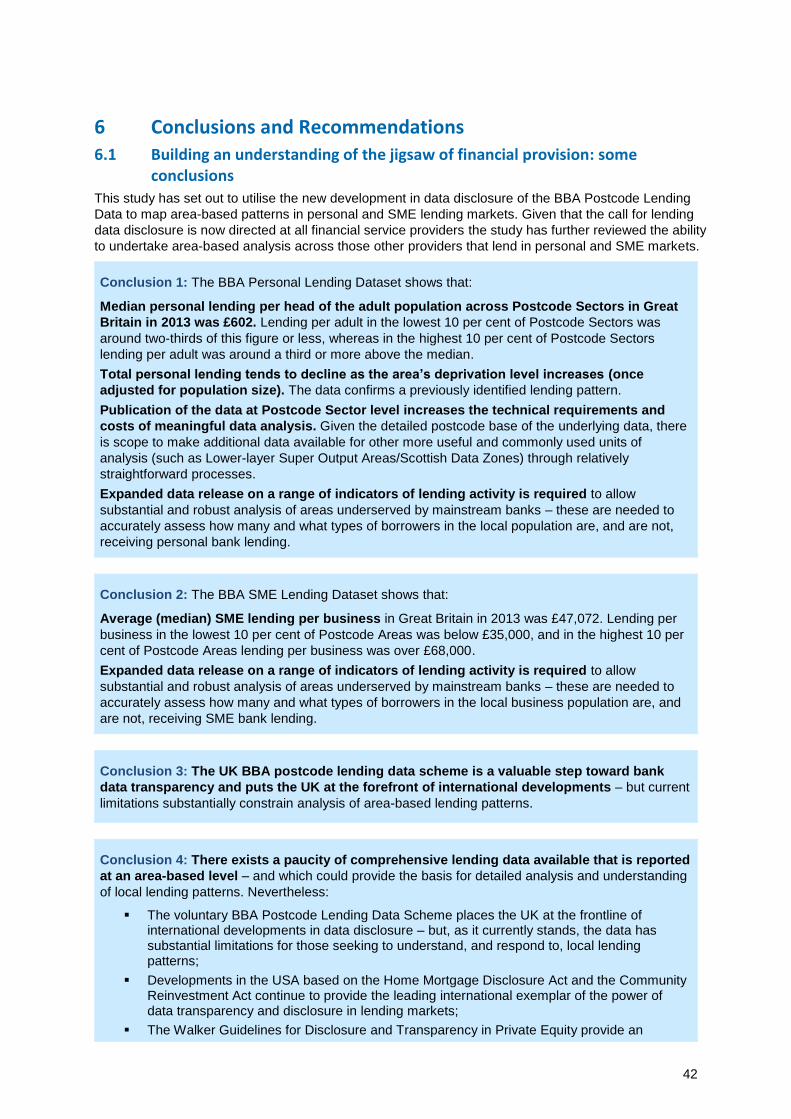
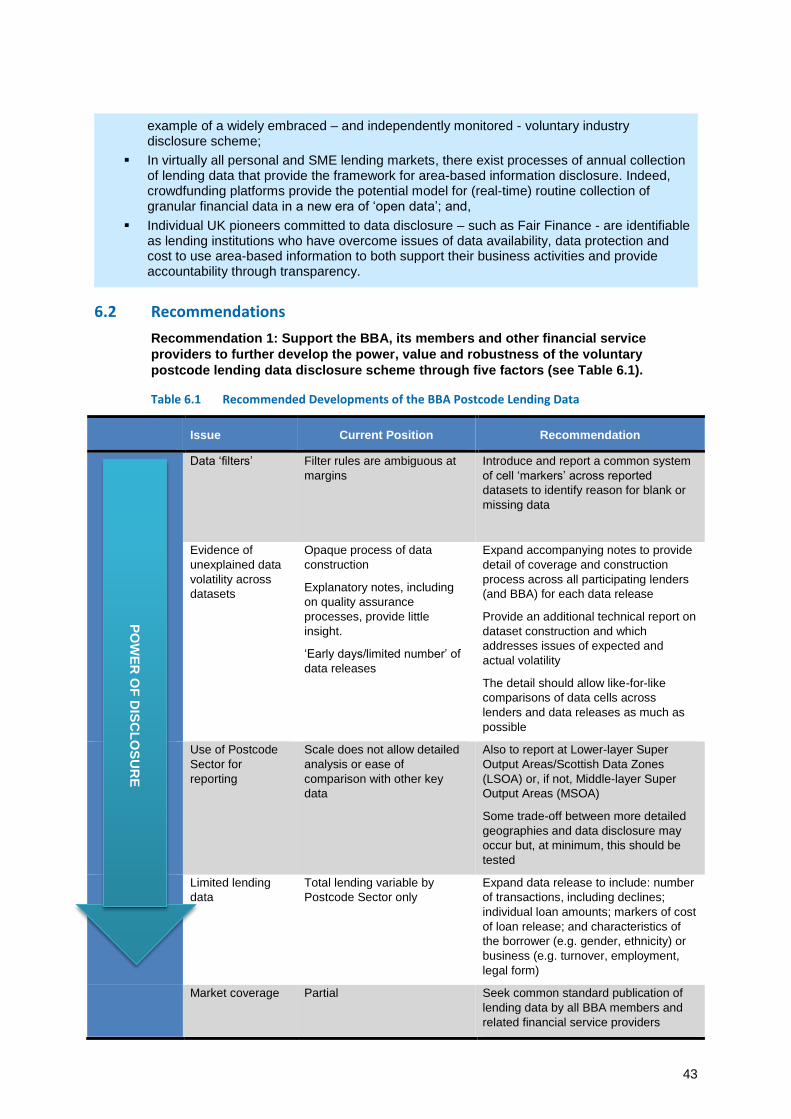
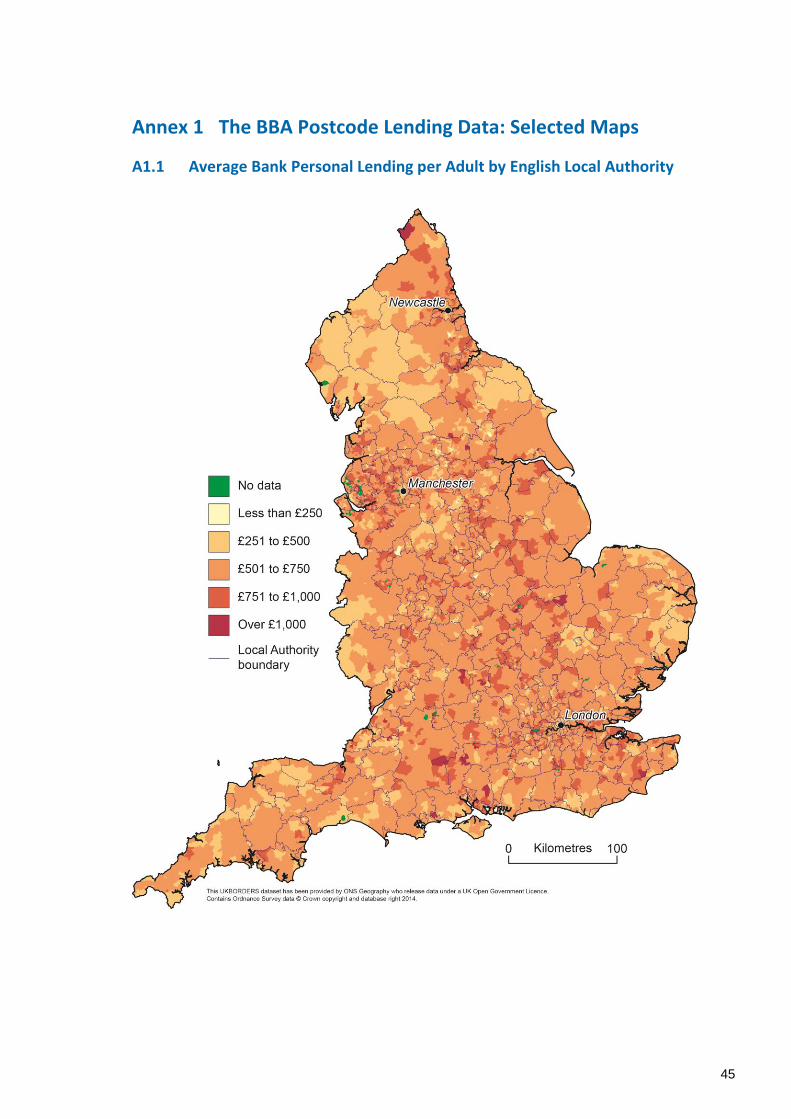
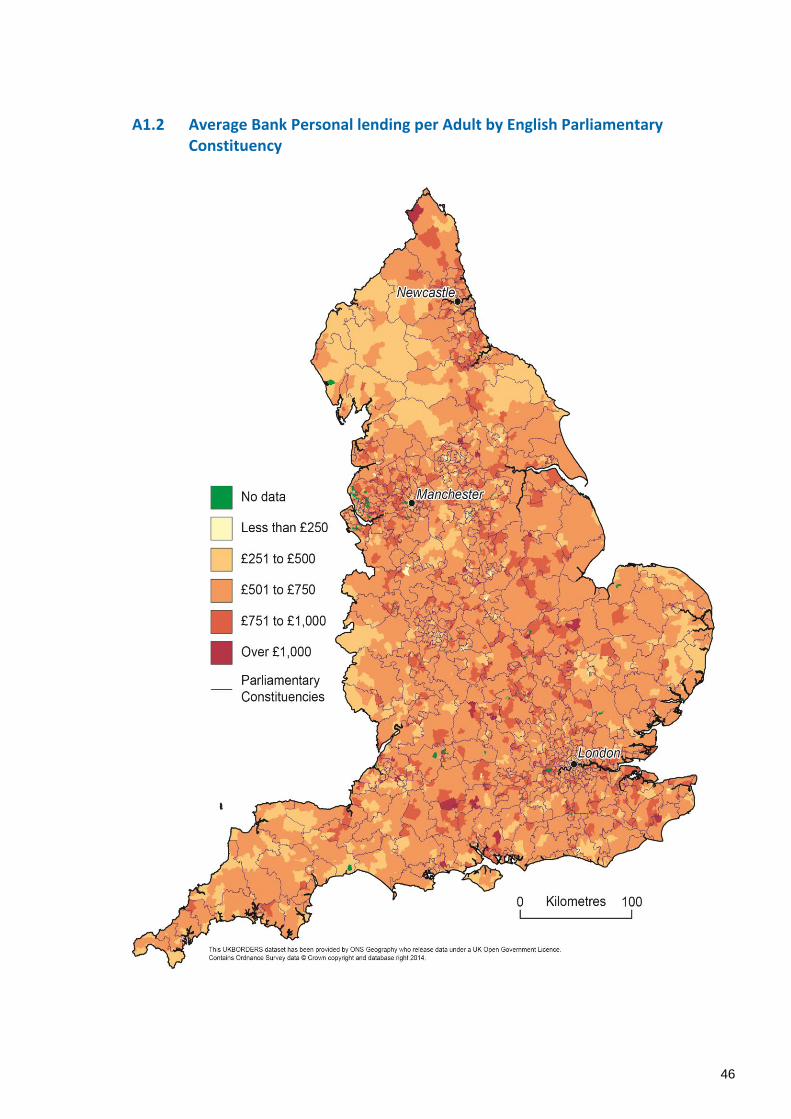
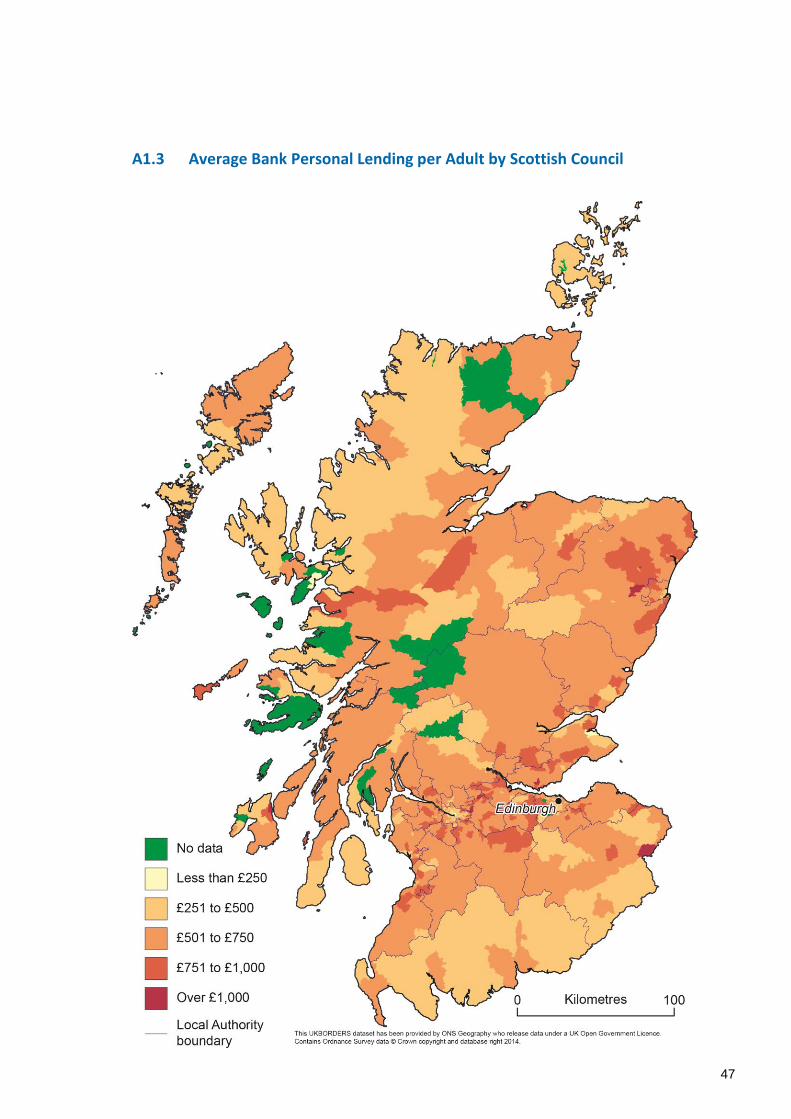
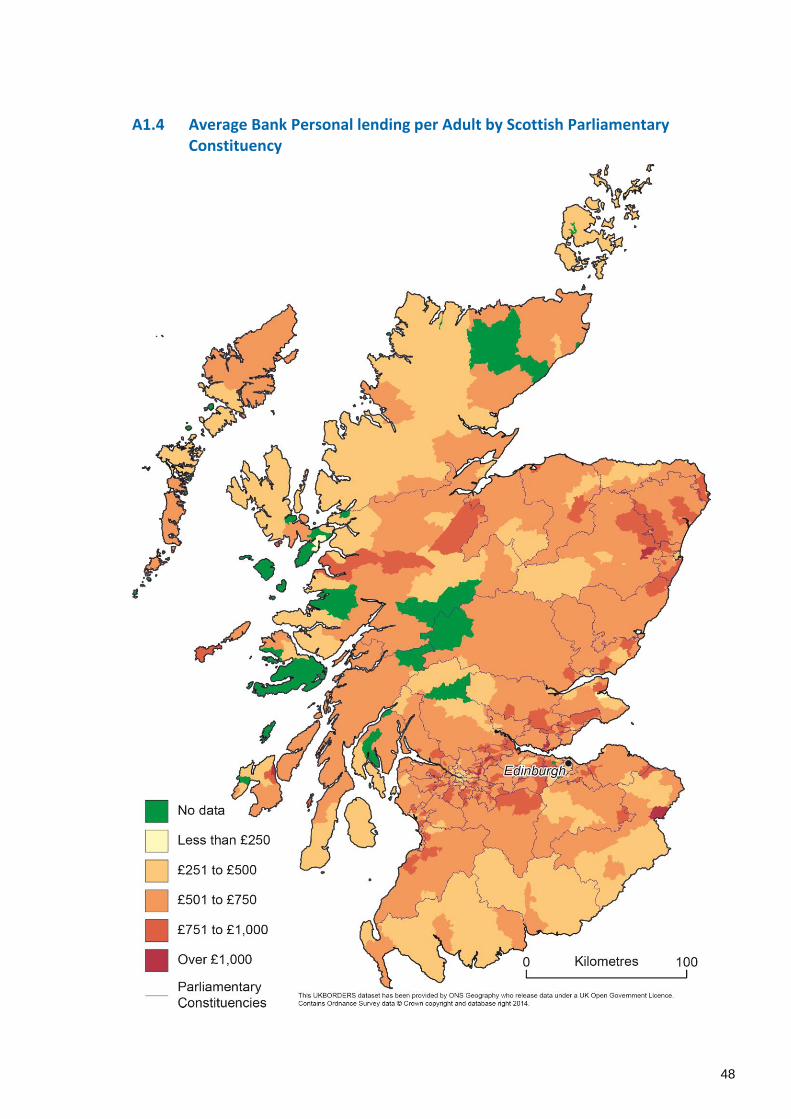
48
A14 Average Bank Personal lending per Adult by Scottish Parliamentary Constituency
49
A15 Average Bank Personal Lending per Adult by Welsh Local Authority
50
A16 Average Bank Personal lending per Adult by Welsh Parliamentary Constituency
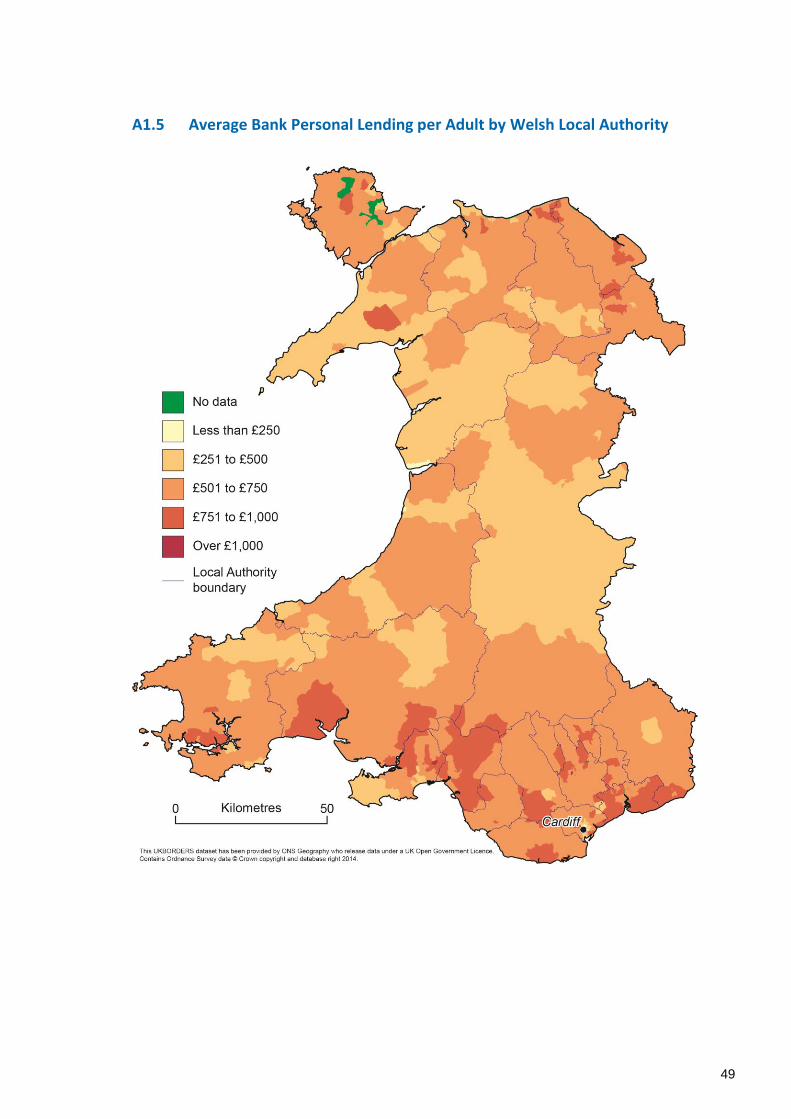
49
A15 Average Bank Personal Lending per Adult by Welsh Local Authority
50
A16 Average Bank Personal lending per Adult by Welsh Parliamentary Constituency
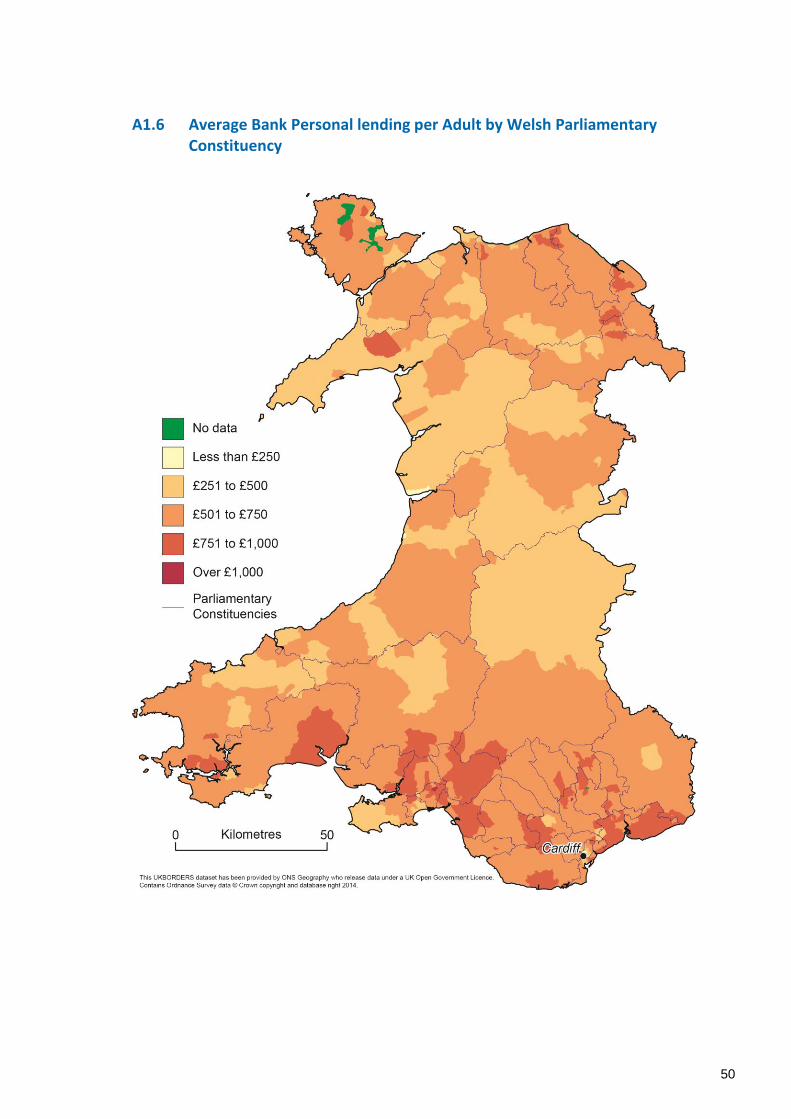
50
A16 Average Bank Personal lending per Adult by Welsh Parliamentary Constituency