tables of rate structures and computed bills · gu=gw under inf., p=purchase) notes and assumptions...
TRANSCRIPT

List of Participating Utilities and Rate Structures
Rate Structure Details Computed Monthly-Equivalent Bills
Residential Water Rate Table 1 Rate Table 2
Residential Sewer Rate Table 3 Rate Table 4
Residential Irrigation Rate Table 5 Rate Table 6
Commercial/Non-Residential Water Rate Table 7 Rate Table 8
Commercial/Non-Residential Sewer Rate Table 9 Rate Table 10
http://www.gefa.org/
http://www.efc.sog.unc.edu/project/georgia-water-and-wastewater-rates-and-rate-structures
Water and Sewer Rates and Rate Structures in Georgia
as of July 2017
TABLES OF RATE STRUCTURES AND COMPUTED BILLS
Please click on the following links to one of ten tables in this document.
These tables complement a report written at the conclusion of a survey of 2017 water and sewer rates and rate structures. Rates and
rate structures are analyzed for 470 local utilities throughout the state. To view additional resources including the comprehensive
report , the interactive Rates Dashboard designed to allow you to compare rates using multiple selection criteria, and the rate sheets of
individual utilities, please visit:
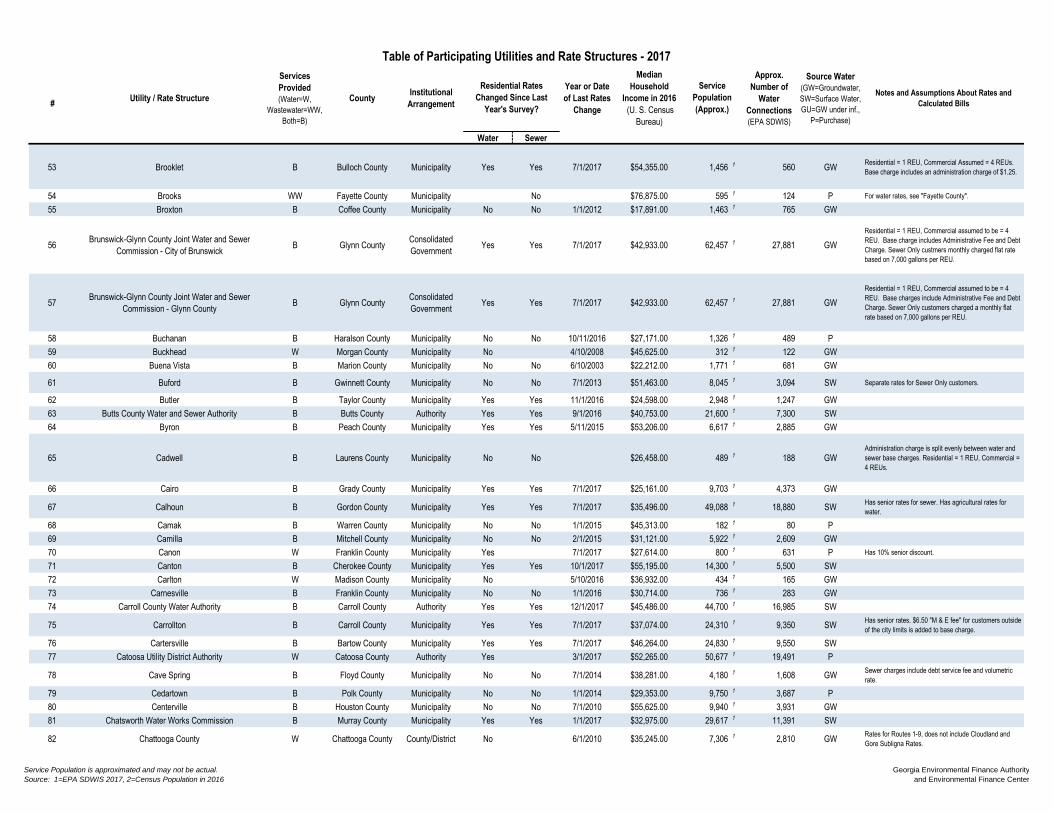
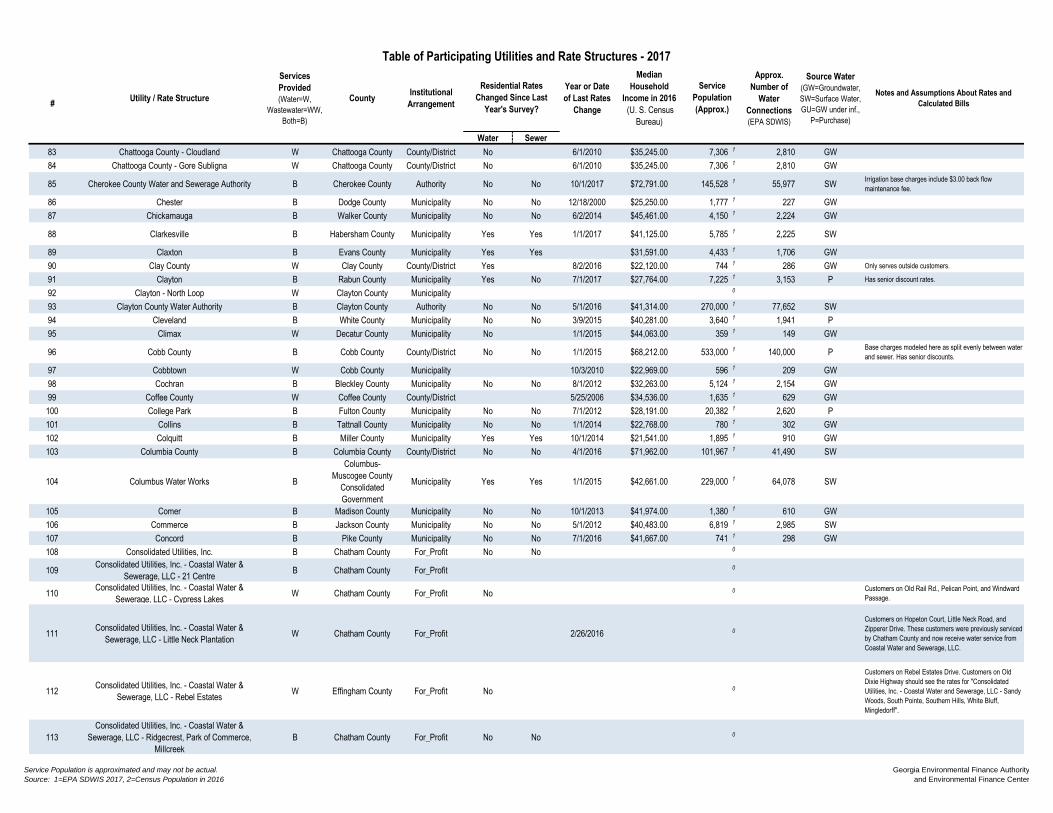
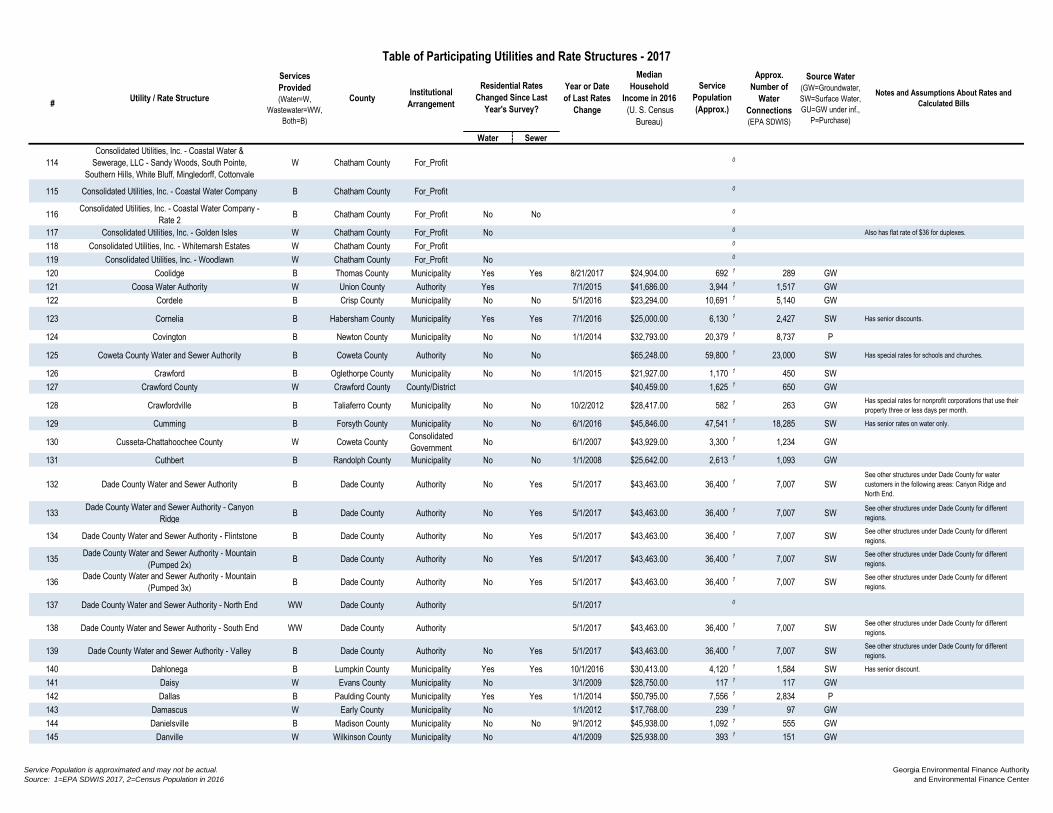
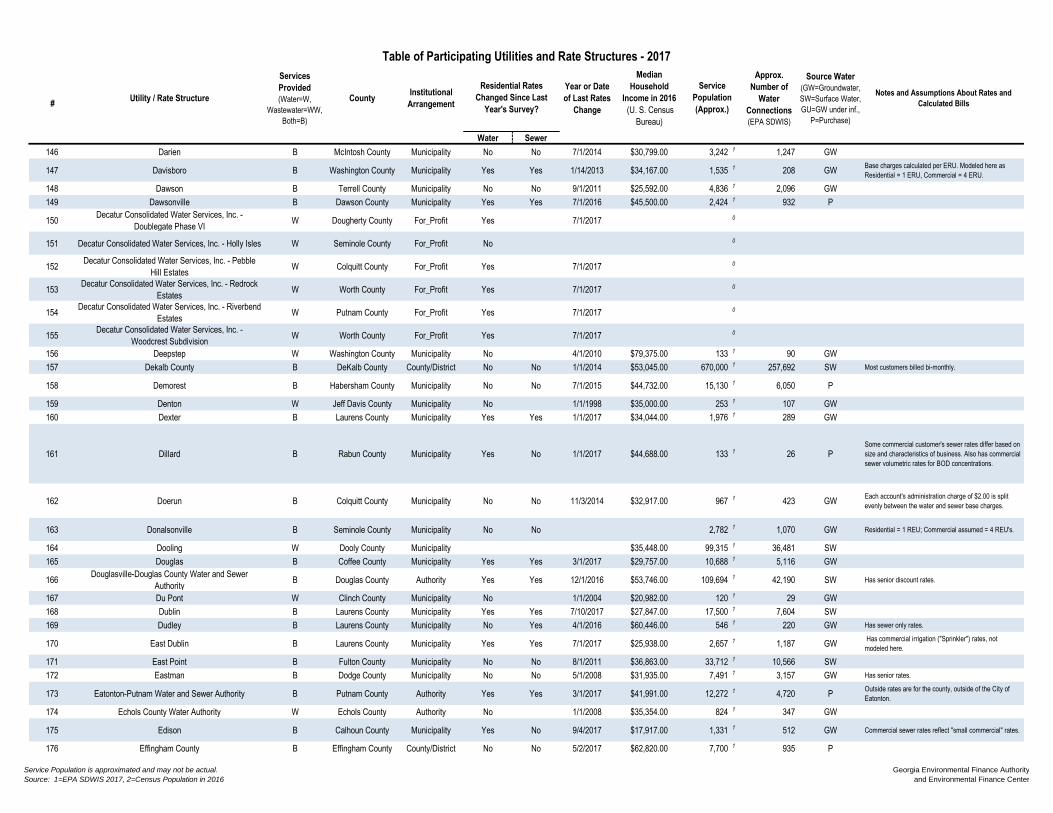
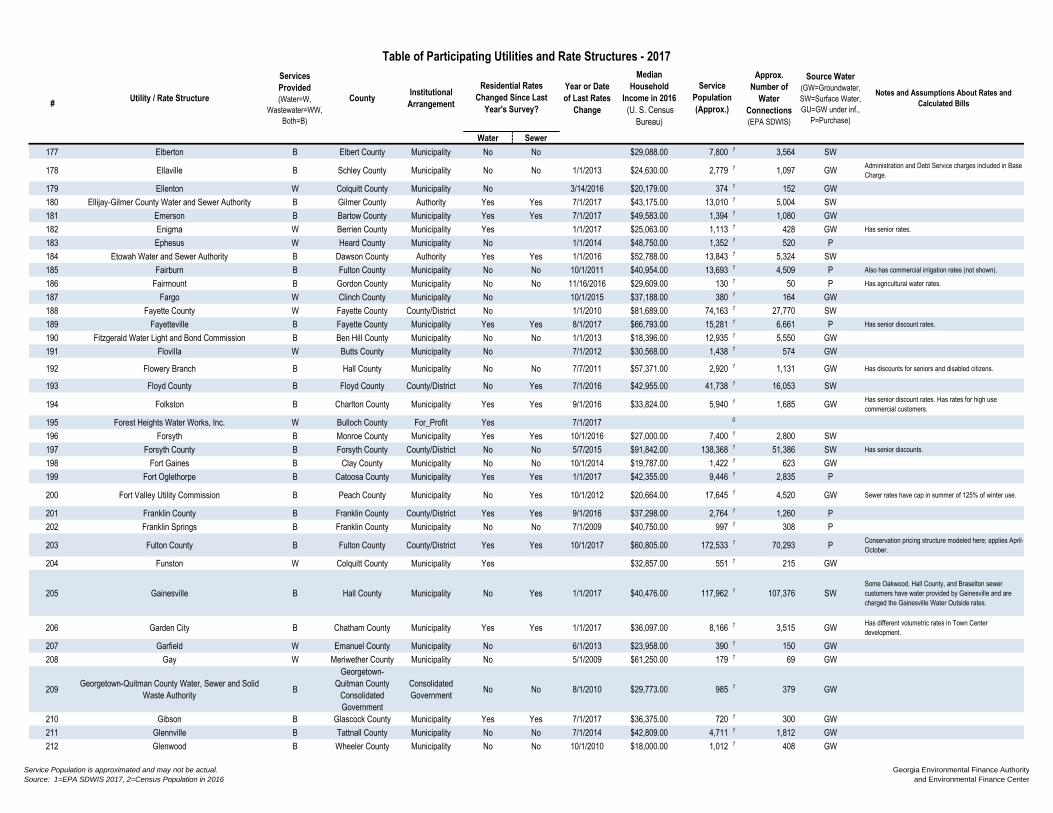
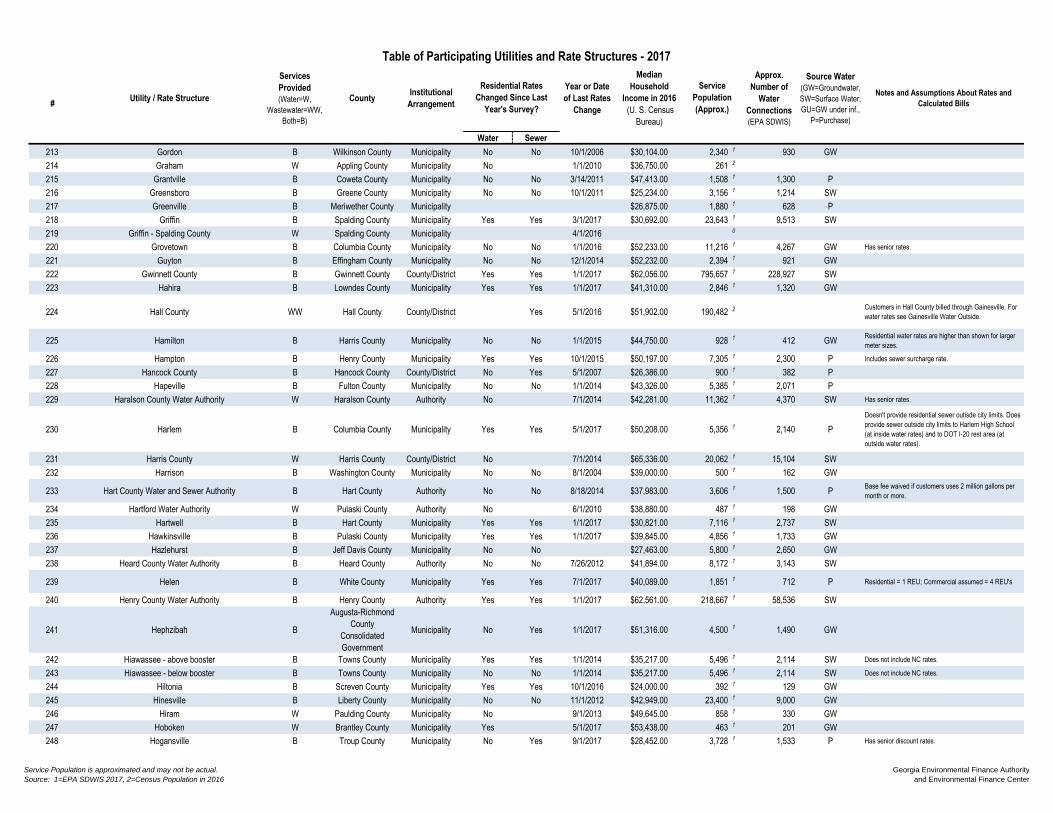
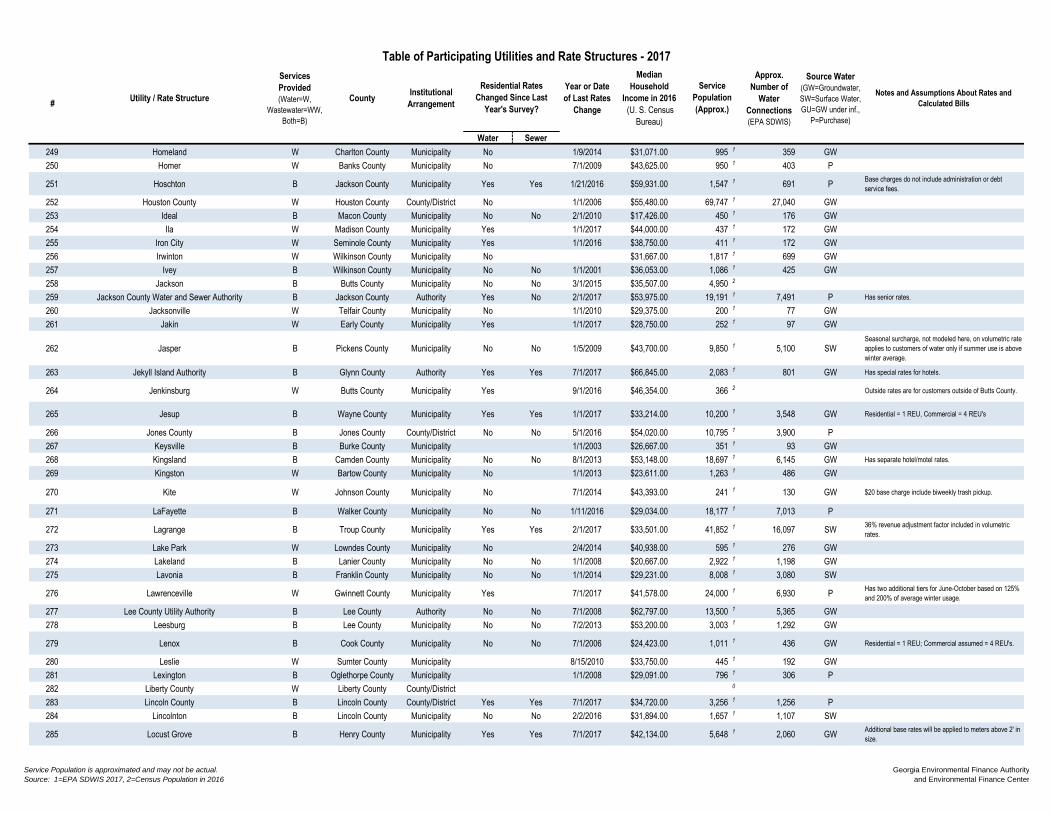
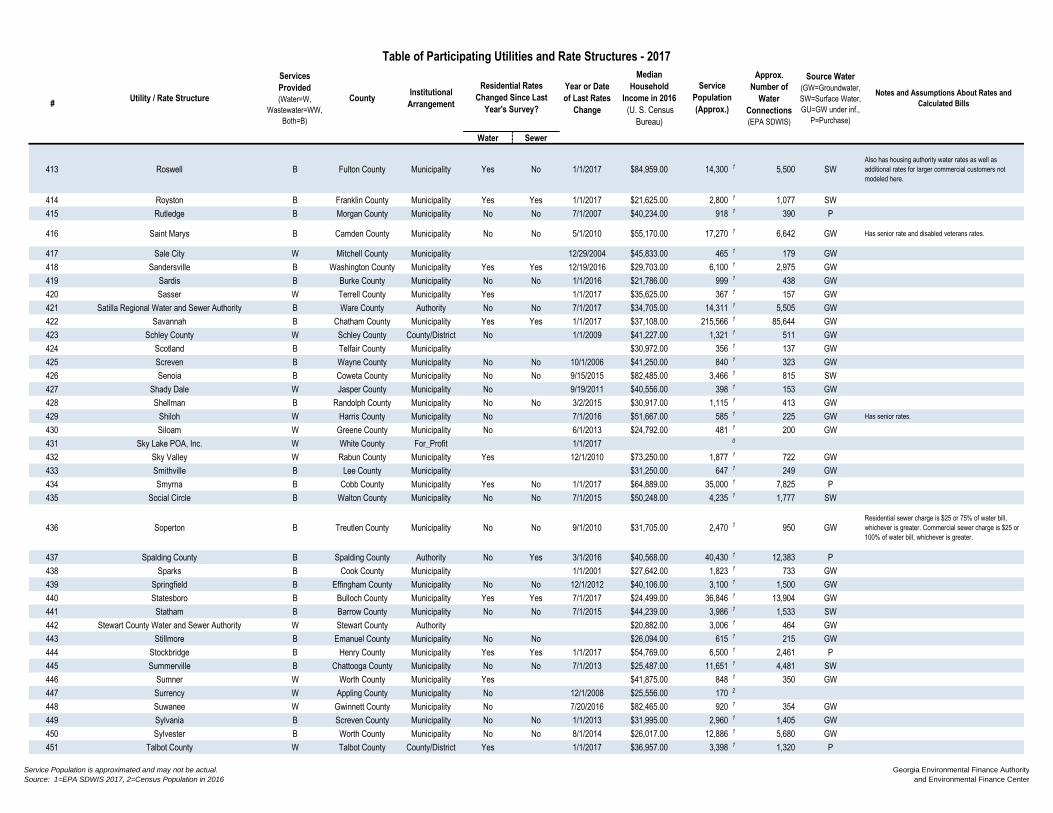
Table of Participating Utilities

Utility / Rate Structure
Services
Provided
(Water=W,
Wastewater=WW,
Both=B)
CountyInstitutional
Arrangement
Year or Date
of Last Rates
Change
Median
Household
Income in 2016
(U. S. Census
Bureau)
Approx.
Number of
Water
Connections
(EPA SDWIS)
Source Water
(GW=Groundwater,
SW=Surface Water,
GU=GW under inf.,
P=Purchase)
Notes and Assumptions About Rates and
Calculated Bills
Water Sewer
1 Adel B Cook County Municipality No No 2/15/2011 $33,292.00 5,311 1 2,500 GW
2 Adrian W Johnson County Municipality Yes 2/1/2014 $25,446.00 664 1 251 GW
Base charges calculated per ERU. Modeled here as
Residential = 1 ERU and Commercial = 4 ERUs. Base
charges also include a $2 administration charge and a
debt service charge per ERU.
3 Ailey B Montgomery County Municipality 7/1/2009 $60,313.00 527 1 165 GW
4 Alamo B Wheeler County Municipality No No 1/1/2007 $28,929.00 3,457 1 355 GW
5 Albany B Dougherty County Municipality Yes No 7/1/2017 $31,263.00 87,029 1 33,473 GU
Residential sewer usage determined by January,
February, and March water usage for existing customers
or 6,000 gallons usage for new customers. Commercial
sewer may include additional volumetric rates for BOD,
TSS, and oil/grease (not modeled here).
6 Alcovy Shores Water Authority W Jasper County Authority 1/1/2014 $41,434.00 432 1 275 P
7 Allentown W Wilkinson County Municipality No 1/1/2009 $27,250.00 175 1 119 GW
8 Alma B Bacon County Municipality No No 11/1/2012 $28,656.00 4,700 1 1,725 GW
9 Alston W Montgomery County Municipality Yes $56,250.00 169 1 92 GW
10 Alto W Habersham County Municipality No 1/1/2016 $37,600.00 2,500 1 973 GW Has senior rates. Churches pay $1.00 per month.
11 Americus B Sumter County Municipality No No 1/1/2016 $24,882.00 16,255 1 7,102 GW
12 Andersonville B Sumter County Municipality No No 3/1/2011 $29,792.00 400 1 171 GW
13 Arabi W Crisp County Municipality No 1/1/2009 $30,556.00 429 1 193 GW
14 Argyle W Clinch County Municipality 3/1/2016 $22,188.00 211 1 81 GW
15 Arlington B Calhoun County Municipality No No 8/12/2014 $18,125.00 1,243 1 478 GWAssuming 1 ERU per residential customer, 4 ERU per
commercial customer. Admin charge of $2 per account
split between water and sewer base charge.
16 Arnoldsville W Oglethorpe County Municipality No 9/1/2015 $44,375.00 1,040 1 404 GW
17 Ashburn B Turner County Municipality No No 4/1/2009 $25,951.00 4,272 1 1,897 GW
18 Athens-Clarke County B
Athens-Clarke
County Unified
Government
Consolidated
GovernmentYes Yes 7/1/2017 $33,357.00 120,266 1 39,457 SW
Water block rates determined by percentage of residential
customer's winter average (assumed here to be 4,000
gallons/month). Commercial customers modeled at
uniform rate.
19 Atlanta B Fulton County Municipality No No 7/1/2011 $49,398.00 650,000 1 240,780 SW Has senior discount.
20 Attapulgus W Decatur County Municipality Yes 9/1/2016 $30,156.00 715 1 275 GW
21 Auburn B Barrow County Municipality Yes Yes 4/15/2017 $53,255.00 6,904 1 2,524 P Senior discount applied to base charge.
22 Augusta B
Augusta-Richmond
County
Consolidated
Government
Municipality Yes Yes 4/1/2017 $38,458.00 204,000 1 78,500 SW Additional residential and commercial sewer-only rates.
23 Austell B Cobb County Municipality Yes No 1/1/2017 $49,850.00 7,774 1 2,990 P
24 Avera W Jefferson County Municipality No 7/1/2010 $27,000.00 240 1 156 GW
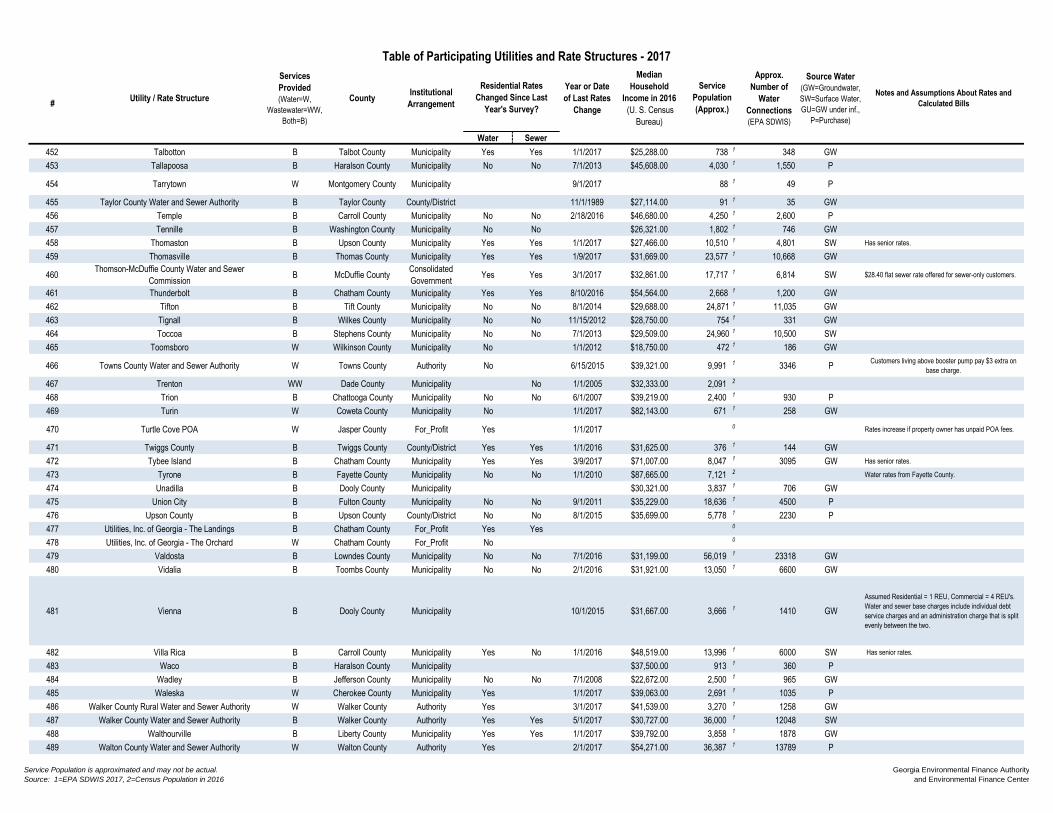
Table of Participating Utilities and Rate Structures - 2017
#
Residential Rates
Changed Since Last
Year's Survey?
Service
Population
(Approx.)
Service Population is approximated and may not be actual.
Source: 1=EPA SDWIS 2017, 2=Census Population in 2016
Georgia Environmental Finance Authority
and Environmental Finance Center

Utility / Rate Structure
Services
Provided
(Water=W,
Wastewater=WW,
Both=B)
CountyInstitutional
Arrangement
Year or Date
of Last Rates
Change
Median
Household
Income in 2016
(U. S. Census
Bureau)
Approx.
Number of
Water
Connections
(EPA SDWIS)
Source Water
(GW=Groundwater,
SW=Surface Water,
GU=GW under inf.,
P=Purchase)
Notes and Assumptions About Rates and
Calculated Bills
Water Sewer
Table of Participating Utilities and Rate Structures - 2017
#
Residential Rates
Changed Since Last
Year's Survey?
Service
Population
(Approx.)
25 Baconton B Mitchell County Municipality Yes Yes 1/1/2011 $26,736.00 985 1 379 GW
Assumed residential = 1 REU and commercial = 4 REUs.
$1.85/account administrative charge split between water
and sewer base charges. Water and sewer debt service
charges included in base charge.
26 Bainbridge B Decatur County Municipality Yes Yes 7/1/2017 $24,869.00 13,546 1 5,563 GW Water base charge includes water tank maintenance fee.
27 Baldwin B Habersham County Municipality No No 7/1/2013 $37,000.00 4,160 1 1,600 SW
28 Baldwin County B Baldwin County County/District 1/1/2017 $34,595.00 21,840 1 8,400 P
29 Ball Ground B Cherokee County Municipality No No 4/14/2016 $72,232.00 2,470 1 950 GW
30 Banks County B Banks County County/District Yes Yes 1/1/2017 $40,721.00 6,453 1 2,701 SW
31 Barnesville B Lamar County Municipality No No 11/1/2012 $28,128.00 6,755 1 3,819 SW
32 Barrow County Water and Sewer Authority B Barrow County Authority No Yes 7/1/2017 $53,133.00 14,043 1 5,415 PAdditional sewer treatment charges for high-strength
wastewater customers.
33 Bartow B Jefferson County Municipality No No 8/1/2011 $28,250.00 286 1 156 GW
34 Bartow County B Bartow County County/District Yes Yes 1/1/2017 $50,836.00 50,162 1 20,295 P
35 Barwick W Thomas County Municipality No 1/1/2011 $32,500.00 497 1 213 GWResidential rate for 1 REU. Commercial assumed to be 4
REUs.
36 Baxley B Appling County Municipality Yes Yes 10/1/2017 $35,896.00 4,737 2
37 Bent Tree B Pickens County For_Profit Yes 7/1/2017 0 Sewer rates only apply to customers living in System 6
(Villas).
38 Berlin W Colquitt County Municipality No $32,417.00 575 1 232 GW
39 Blackshear B Pierce County Municipality Yes Yes 12/1/2016 $33,896.00 5,811 1 2,235 GW
40 Blairsville B Union County Municipality No No 5/20/2013 $16,766.00 4,035 1 1,552 SW
41 Blakely B Early County Municipality Yes Yes 7/1/2017 $23,618.00 4,855 1 2,167 GW
42 Bloomingdale B Chatham County Municipality No No 7/1/2015 $55,911.00 1,690 1 266 GWUtility offers a rate of $42.75 per month for sewer only
customers.
43 Blue Ridge B Fannin County Municipality Yes Yes 6/30/2016 $37,656.00 5,506 1 2,343 SW
44 Blythe W
Augusta-Richmond
County
Consolidated
Government
Municipality Yes 1/1/2017 $39,219.00 1,004 1 386 GW
45 Boston B Thomas County Municipality No No 1/1/2015 $28,095.00 1,378 1 545 GW
46 Bowdon B Carroll County Municipality No No 7/1/2015 $24,155.00 6,045 1 2,015 SWWater base rates include a $5.50 maintenance charge
inside and $7.00 outside.
47 Bowersville W Hart County Municipality Yes $35,982.00 512 1 197 P
48 Bowman B Elbert County Municipality No No 2/28/2008 $20,833.00 862 1 434 GW
49 Braselton B Jackson County Municipality Yes Yes 1/1/2017 $90,284.00 8,580 1 6,255 PCustomers with water and sewer both owned and billed
by Braselton. Some Braselton residents are on
Gainesville water, see "Braselton - Gainesville".
50 Bremen B Haralson County Municipality No No 7/1/2013 $55,635.00 6,200 1 3,044 SW
51 Brinson W Decatur County Municipality No 4/24/2012 $34,643.00 257 1 99 GW
52 Bronwood W Terrell County Municipality No 12/1/2008 $31,250.00 593 1 228 GW
Service Population is approximated and may not be actual.
Source: 1=EPA SDWIS 2017, 2=Census Population in 2016
Georgia Environmental Finance Authority
and Environmental Finance Center
Utility / Rate Structure
Services
Provided
(Water=W,
Wastewater=WW,
Both=B)
CountyInstitutional
Arrangement
Year or Date
of Last Rates
Change
Median
Household
Income in 2016
(U. S. Census
Bureau)
Approx.
Number of
Water
Connections
(EPA SDWIS)
Source Water
(GW=Groundwater,
SW=Surface Water,
GU=GW under inf.,
P=Purchase)
Notes and Assumptions About Rates and
Calculated Bills
Water Sewer
Table of Participating Utilities and Rate Structures - 2017
#
Residential Rates
Changed Since Last
Year's Survey?
Service
Population
(Approx.)
53 Brooklet B Bulloch County Municipality Yes Yes 7/1/2017 $54,355.00 1,456 1 560 GWResidential = 1 REU, Commercial Assumed = 4 REUs.
Base charge includes an administration charge of $1.25.
54 Brooks WW Fayette County Municipality No $76,875.00 595 1 124 P For water rates, see "Fayette County".
55 Broxton B Coffee County Municipality No No 1/1/2012 $17,891.00 1,463 1 765 GW
56Brunswick-Glynn County Joint Water and Sewer
Commission - City of BrunswickB Glynn County
Consolidated
GovernmentYes Yes 7/1/2017 $42,933.00 62,457 1 27,881 GW
Residential = 1 REU, Commercial assumed to be = 4
REU. Base charge includes Administrative Fee and Debt
Charge. Sewer Only custmers monthly charged flat rate
based on 7,000 gallons per REU.
57Brunswick-Glynn County Joint Water and Sewer
Commission - Glynn CountyB Glynn County
Consolidated
GovernmentYes Yes 7/1/2017 $42,933.00 62,457 1 27,881 GW
Residential = 1 REU, Commercial assumed to be = 4
REU. Base charges include Administrative Fee and Debt
Charge. Sewer Only customers charged a monthly flat
rate based on 7,000 gallons per REU.
58 Buchanan B Haralson County Municipality No No 10/11/2016 $27,171.00 1,326 1 489 P
59 Buckhead W Morgan County Municipality No 4/10/2008 $45,625.00 312 1 122 GW
60 Buena Vista B Marion County Municipality No No 6/10/2003 $22,212.00 1,771 1 681 GW
61 Buford B Gwinnett County Municipality No No 7/1/2013 $51,463.00 8,045 1 3,094 SW Separate rates for Sewer Only customers.
62 Butler B Taylor County Municipality Yes Yes 11/1/2016 $24,598.00 2,948 1 1,247 GW
63 Butts County Water and Sewer Authority B Butts County Authority Yes Yes 9/1/2016 $40,753.00 21,600 1 7,300 SW
64 Byron B Peach County Municipality Yes Yes 5/11/2015 $53,206.00 6,617 1 2,885 GW
65 Cadwell B Laurens County Municipality No No $26,458.00 489 1 188 GWAdministration charge is split evenly between water and
sewer base charges. Residential = 1 REU, Commercial =
4 REUs.
66 Cairo B Grady County Municipality Yes Yes 7/1/2017 $25,161.00 9,703 1 4,373 GW
67 Calhoun B Gordon County Municipality Yes Yes 7/1/2017 $35,496.00 49,088 1 18,880 SWHas senior rates for sewer. Has agricultural rates for
water.
68 Camak B Warren County Municipality No No 1/1/2015 $45,313.00 182 1 80 P
69 Camilla B Mitchell County Municipality No No 2/1/2015 $31,121.00 5,922 1 2,609 GW
70 Canon W Franklin County Municipality Yes 7/1/2017 $27,614.00 800 1 631 P Has 10% senior discount.
71 Canton B Cherokee County Municipality Yes Yes 10/1/2017 $55,195.00 14,300 1 5,500 SW
72 Carlton W Madison County Municipality No 5/10/2016 $36,932.00 434 1 165 GW
73 Carnesville B Franklin County Municipality No No 1/1/2016 $30,714.00 736 1 283 GW
74 Carroll County Water Authority B Carroll County Authority Yes Yes 12/1/2017 $45,486.00 44,700 1 16,985 SW
75 Carrollton B Carroll County Municipality Yes Yes 7/1/2017 $37,074.00 24,310 1 9,350 SWHas senior rates. $6.50 "M & E fee" for customers outside
of the city limits is added to base charge.
76 Cartersville B Bartow County Municipality Yes Yes 7/1/2017 $46,264.00 24,830 1 9,550 SW
77 Catoosa Utility District Authority W Catoosa County Authority Yes 3/1/2017 $52,265.00 50,677 1 19,491 P
78 Cave Spring B Floyd County Municipality No No 7/1/2014 $38,281.00 4,180 1 1,608 GWSewer charges include debt service fee and volumetric
rate.
79 Cedartown B Polk County Municipality No No 1/1/2014 $29,353.00 9,750 1 3,687 P
80 Centerville B Houston County Municipality No No 7/1/2010 $55,625.00 9,940 1 3,931 GW
81 Chatsworth Water Works Commission B Murray County Municipality Yes Yes 1/1/2017 $32,975.00 29,617 1 11,391 SW
82 Chattooga County W Chattooga County County/District No 6/1/2010 $35,245.00 7,306 1 2,810 GWRates for Routes 1-9, does not include Cloudland and
Gore Subligna Rates.
Service Population is approximated and may not be actual.
Source: 1=EPA SDWIS 2017, 2=Census Population in 2016
Georgia Environmental Finance Authority
and Environmental Finance Center
Utility / Rate Structure
Services
Provided
(Water=W,
Wastewater=WW,
Both=B)
CountyInstitutional
Arrangement
Year or Date
of Last Rates
Change
Median
Household
Income in 2016
(U. S. Census
Bureau)
Approx.
Number of
Water
Connections
(EPA SDWIS)
Source Water
(GW=Groundwater,
SW=Surface Water,
GU=GW under inf.,
P=Purchase)
Notes and Assumptions About Rates and
Calculated Bills
Water Sewer
Table of Participating Utilities and Rate Structures - 2017
#
Residential Rates
Changed Since Last
Year's Survey?
Service
Population
(Approx.)
83 Chattooga County - Cloudland W Chattooga County County/District No 6/1/2010 $35,245.00 7,306 1 2,810 GW
84 Chattooga County - Gore Subligna W Chattooga County County/District No 6/1/2010 $35,245.00 7,306 1 2,810 GW
85 Cherokee County Water and Sewerage Authority B Cherokee County Authority No No 10/1/2017 $72,791.00 145,528 1 55,977 SWIrrigation base charges include $3.00 back flow
maintenance fee.
86 Chester B Dodge County Municipality No No 12/18/2000 $25,250.00 1,777 1 227 GW
87 Chickamauga B Walker County Municipality No No 6/2/2014 $45,461.00 4,150 1 2,224 GW
88 Clarkesville B Habersham County Municipality Yes Yes 1/1/2017 $41,125.00 5,785 1 2,225 SW
89 Claxton B Evans County Municipality Yes Yes $31,591.00 4,433 1 1,706 GW
90 Clay County W Clay County County/District Yes 8/2/2016 $22,120.00 744 1 286 GW Only serves outside customers.
91 Clayton B Rabun County Municipality Yes No 7/1/2017 $27,764.00 7,225 1 3,153 P Has senior discount rates.
92 Clayton - North Loop W Clayton County Municipality 0
93 Clayton County Water Authority B Clayton County Authority No No 5/1/2016 $41,314.00 270,000 1 77,652 SW
94 Cleveland B White County Municipality No No 3/9/2015 $40,281.00 3,640 1 1,941 P
95 Climax W Decatur County Municipality No 1/1/2015 $44,063.00 359 1 149 GW
96 Cobb County B Cobb County County/District No No 1/1/2015 $68,212.00 533,000 1 140,000 PBase charges modeled here as split evenly between water
and sewer. Has senior discounts.
97 Cobbtown W Cobb County Municipality 10/3/2010 $22,969.00 596 1 209 GW
98 Cochran B Bleckley County Municipality No No 8/1/2012 $32,263.00 5,124 1 2,154 GW
99 Coffee County W Coffee County County/District 5/25/2006 $34,536.00 1,635 1 629 GW
100 College Park B Fulton County Municipality No No 7/1/2012 $28,191.00 20,382 1 2,620 P
101 Collins B Tattnall County Municipality No No 1/1/2014 $22,768.00 780 1 302 GW
102 Colquitt B Miller County Municipality Yes Yes 10/1/2014 $21,541.00 1,895 1 910 GW
103 Columbia County B Columbia County County/District No No 4/1/2016 $71,962.00 101,967 1 41,490 SW
104 Columbus Water Works B
Columbus-
Muscogee County
Consolidated
Government
Municipality Yes Yes 1/1/2015 $42,661.00 229,000 1 64,078 SW
105 Comer B Madison County Municipality No No 10/1/2013 $41,974.00 1,380 1 610 GW
106 Commerce B Jackson County Municipality No No 5/1/2012 $40,483.00 6,819 1 2,985 SW
107 Concord B Pike County Municipality No No 7/1/2016 $41,667.00 741 1 298 GW
108 Consolidated Utilities, Inc. B Chatham County For_Profit No No 0
109Consolidated Utilities, Inc. - Coastal Water &
Sewerage, LLC - 21 CentreB Chatham County For_Profit 0
110Consolidated Utilities, Inc. - Coastal Water &
Sewerage, LLC - Cypress LakesW Chatham County For_Profit No 0
Customers on Old Rail Rd., Pelican Point, and Windward
Passage.
111Consolidated Utilities, Inc. - Coastal Water &
Sewerage, LLC - Little Neck PlantationW Chatham County For_Profit 2/26/2016 0
Customers on Hopeton Court, Little Neck Road, and
Zipperer Drive. These customers were previously serviced
by Chatham County and now receive water service from
Coastal Water and Sewerage, LLC.
112Consolidated Utilities, Inc. - Coastal Water &
Sewerage, LLC - Rebel EstatesW Effingham County For_Profit No 0
Customers on Rebel Estates Drive. Customers on Old
Dixie Highway should see the rates for "Consolidated
Utilities, Inc. - Coastal Water and Sewerage, LLC - Sandy
Woods, South Pointe, Southern Hills, White Bluff,
Mingledorff".
113
Consolidated Utilities, Inc. - Coastal Water &
Sewerage, LLC - Ridgecrest, Park of Commerce,
Millcreek
B Chatham County For_Profit No No 0
Service Population is approximated and may not be actual.
Source: 1=EPA SDWIS 2017, 2=Census Population in 2016
Georgia Environmental Finance Authority
and Environmental Finance Center
Utility / Rate Structure
Services
Provided
(Water=W,
Wastewater=WW,
Both=B)
CountyInstitutional
Arrangement
Year or Date
of Last Rates
Change
Median
Household
Income in 2016
(U. S. Census
Bureau)
Approx.
Number of
Water
Connections
(EPA SDWIS)
Source Water
(GW=Groundwater,
SW=Surface Water,
GU=GW under inf.,
P=Purchase)
Notes and Assumptions About Rates and
Calculated Bills
Water Sewer
Table of Participating Utilities and Rate Structures - 2017
#
Residential Rates
Changed Since Last
Year's Survey?
Service
Population
(Approx.)
114
Consolidated Utilities, Inc. - Coastal Water &
Sewerage, LLC - Sandy Woods, South Pointe,
Southern Hills, White Bluff, Mingledorff, Cottonvale
W Chatham County For_Profit 0
115 Consolidated Utilities, Inc. - Coastal Water Company B Chatham County For_Profit 0
116Consolidated Utilities, Inc. - Coastal Water Company -
Rate 2B Chatham County For_Profit No No 0
117 Consolidated Utilities, Inc. - Golden Isles W Chatham County For_Profit No 0 Also has flat rate of $36 for duplexes.
118 Consolidated Utilities, Inc. - Whitemarsh Estates W Chatham County For_Profit 0
119 Consolidated Utilities, Inc. - Woodlawn W Chatham County For_Profit No 0
120 Coolidge B Thomas County Municipality Yes Yes 8/21/2017 $24,904.00 692 1 289 GW
121 Coosa Water Authority W Union County Authority Yes 7/1/2015 $41,686.00 3,944 1 1,517 GW
122 Cordele B Crisp County Municipality No No 5/1/2016 $23,294.00 10,691 1 5,140 GW
123 Cornelia B Habersham County Municipality Yes Yes 7/1/2016 $25,000.00 6,130 1 2,427 SW Has senior discounts.
124 Covington B Newton County Municipality No No 1/1/2014 $32,793.00 20,379 1 8,737 P
125 Coweta County Water and Sewer Authority B Coweta County Authority No No $65,248.00 59,800 1 23,000 SW Has special rates for schools and churches.
126 Crawford B Oglethorpe County Municipality No No 1/1/2015 $21,927.00 1,170 1 450 SW
127 Crawford County W Crawford County County/District $40,459.00 1,625 1 650 GW
128 Crawfordville B Taliaferro County Municipality No No 10/2/2012 $28,417.00 582 1 263 GWHas special rates for nonprofit corporations that use their
property three or less days per month.
129 Cumming B Forsyth County Municipality No No 6/1/2016 $45,846.00 47,541 1 18,285 SW Has senior rates on water only.
130 Cusseta-Chattahoochee County W Coweta CountyConsolidated
GovernmentNo 6/1/2007 $43,929.00 3,300 1 1,234 GW
131 Cuthbert B Randolph County Municipality No No 1/1/2008 $25,642.00 2,613 1 1,093 GW
132 Dade County Water and Sewer Authority B Dade County Authority No Yes 5/1/2017 $43,463.00 36,400 1 7,007 SWSee other structures under Dade County for water
customers in the following areas: Canyon Ridge and
North End.
133Dade County Water and Sewer Authority - Canyon
RidgeB Dade County Authority No Yes 5/1/2017 $43,463.00 36,400 1 7,007 SW
See other structures under Dade County for different
regions.
134 Dade County Water and Sewer Authority - Flintstone B Dade County Authority No Yes 5/1/2017 $43,463.00 36,400 1 7,007 SWSee other structures under Dade County for different
regions.
135Dade County Water and Sewer Authority - Mountain
(Pumped 2x)B Dade County Authority No Yes 5/1/2017 $43,463.00 36,400 1 7,007 SW
See other structures under Dade County for different
regions.
136Dade County Water and Sewer Authority - Mountain
(Pumped 3x)B Dade County Authority No Yes 5/1/2017 $43,463.00 36,400 1 7,007 SW
See other structures under Dade County for different
regions.
137 Dade County Water and Sewer Authority - North End WW Dade County Authority 5/1/2017 0
138 Dade County Water and Sewer Authority - South End WW Dade County Authority 5/1/2017 $43,463.00 36,400 1 7,007 SWSee other structures under Dade County for different
regions.
139 Dade County Water and Sewer Authority - Valley B Dade County Authority No Yes 5/1/2017 $43,463.00 36,400 1 7,007 SWSee other structures under Dade County for different
regions.
140 Dahlonega B Lumpkin County Municipality Yes Yes 10/1/2016 $30,413.00 4,120 1 1,584 SW Has senior discount.
141 Daisy W Evans County Municipality No 3/1/2009 $28,750.00 117 1 117 GW
142 Dallas B Paulding County Municipality Yes Yes 1/1/2014 $50,795.00 7,556 1 2,834 P
143 Damascus W Early County Municipality No 1/1/2012 $17,768.00 239 1 97 GW
144 Danielsville B Madison County Municipality No No 9/1/2012 $45,938.00 1,092 1 555 GW
145 Danville W Wilkinson County Municipality No 4/1/2009 $25,938.00 393 1 151 GW
Service Population is approximated and may not be actual.
Source: 1=EPA SDWIS 2017, 2=Census Population in 2016
Georgia Environmental Finance Authority
and Environmental Finance Center
Utility / Rate Structure
Services
Provided
(Water=W,
Wastewater=WW,
Both=B)
CountyInstitutional
Arrangement
Year or Date
of Last Rates
Change
Median
Household
Income in 2016
(U. S. Census
Bureau)
Approx.
Number of
Water
Connections
(EPA SDWIS)
Source Water
(GW=Groundwater,
SW=Surface Water,
GU=GW under inf.,
P=Purchase)
Notes and Assumptions About Rates and
Calculated Bills
Water Sewer
Table of Participating Utilities and Rate Structures - 2017
#
Residential Rates
Changed Since Last
Year's Survey?
Service
Population
(Approx.)
146 Darien B McIntosh County Municipality No No 7/1/2014 $30,799.00 3,242 1 1,247 GW
147 Davisboro B Washington County Municipality Yes Yes 1/14/2013 $34,167.00 1,535 1 208 GWBase charges calculated per ERU. Modeled here as
Residential = 1 ERU, Commercial = 4 ERU.
148 Dawson B Terrell County Municipality No No 9/1/2011 $25,592.00 4,836 1 2,096 GW
149 Dawsonville B Dawson County Municipality Yes Yes 7/1/2016 $45,500.00 2,424 1 932 P
150Decatur Consolidated Water Services, Inc. -
Doublegate Phase VIW Dougherty County For_Profit Yes 7/1/2017 0
151 Decatur Consolidated Water Services, Inc. - Holly Isles W Seminole County For_Profit No 0
152Decatur Consolidated Water Services, Inc. - Pebble
Hill EstatesW Colquitt County For_Profit Yes 7/1/2017 0
153Decatur Consolidated Water Services, Inc. - Redrock
EstatesW Worth County For_Profit Yes 7/1/2017 0
154Decatur Consolidated Water Services, Inc. - Riverbend
EstatesW Putnam County For_Profit Yes 7/1/2017 0
155Decatur Consolidated Water Services, Inc. -
Woodcrest SubdivisionW Worth County For_Profit Yes 7/1/2017 0
156 Deepstep W Washington County Municipality No 4/1/2010 $79,375.00 133 1 90 GW
157 Dekalb County B DeKalb County County/District No No 1/1/2014 $53,045.00 670,000 1 257,692 SW Most customers billed bi-monthly.
158 Demorest B Habersham County Municipality No No 7/1/2015 $44,732.00 15,130 1 6,050 P
159 Denton W Jeff Davis County Municipality No 1/1/1998 $35,000.00 253 1 107 GW
160 Dexter B Laurens County Municipality Yes Yes 1/1/2017 $34,044.00 1,976 1 289 GW
161 Dillard B Rabun County Municipality Yes No 1/1/2017 $44,688.00 133 1 26 PSome commercial customer's sewer rates differ based on
size and characteristics of business. Also has commercial
sewer volumetric rates for BOD concentrations.
162 Doerun B Colquitt County Municipality No No 11/3/2014 $32,917.00 967 1 423 GWEach account's administration charge of $2.00 is split
evenly between the water and sewer base charges.
163 Donalsonville B Seminole County Municipality No No 2,782 1 1,070 GW Residential = 1 REU; Commercial assumed = 4 REU's.
164 Dooling W Dooly County Municipality $35,448.00 99,315 1 36,481 SW
165 Douglas B Coffee County Municipality Yes Yes 3/1/2017 $29,757.00 10,688 1 5,116 GW
166Douglasville-Douglas County Water and Sewer
AuthorityB Douglas County Authority Yes Yes 12/1/2016 $53,746.00 109,694 1 42,190 SW Has senior discount rates.
167 Du Pont W Clinch County Municipality No 1/1/2004 $20,982.00 120 1 29 GW
168 Dublin B Laurens County Municipality Yes Yes 7/10/2017 $27,847.00 17,500 1 7,604 SW
169 Dudley B Laurens County Municipality No Yes 4/1/2016 $60,446.00 546 1 220 GW Has sewer only rates.
170 East Dublin B Laurens County Municipality Yes Yes 7/1/2017 $25,938.00 2,657 1 1,187 GW Has commercial irrigation ("Sprinkler") rates, not
modeled here.
171 East Point B Fulton County Municipality No No 8/1/2011 $36,863.00 33,712 1 10,566 SW
172 Eastman B Dodge County Municipality No No 5/1/2008 $31,935.00 7,491 1 3,157 GW Has senior rates.
173 Eatonton-Putnam Water and Sewer Authority B Putnam County Authority Yes Yes 3/1/2017 $41,991.00 12,272 1 4,720 POutside rates are for the county, outside of the City of
Eatonton.
174 Echols County Water Authority W Echols County Authority No 1/1/2008 $35,354.00 824 1 347 GW
175 Edison B Calhoun County Municipality Yes No 9/4/2017 $17,917.00 1,331 1 512 GW Commercial sewer rates reflect "small commercial" rates.
176 Effingham County B Effingham County County/District No No 5/2/2017 $62,820.00 7,700 1 935 P
Service Population is approximated and may not be actual.
Source: 1=EPA SDWIS 2017, 2=Census Population in 2016
Georgia Environmental Finance Authority
and Environmental Finance Center
Utility / Rate Structure
Services
Provided
(Water=W,
Wastewater=WW,
Both=B)
CountyInstitutional
Arrangement
Year or Date
of Last Rates
Change
Median
Household
Income in 2016
(U. S. Census
Bureau)
Approx.
Number of
Water
Connections
(EPA SDWIS)
Source Water
(GW=Groundwater,
SW=Surface Water,
GU=GW under inf.,
P=Purchase)
Notes and Assumptions About Rates and
Calculated Bills
Water Sewer
Table of Participating Utilities and Rate Structures - 2017
#
Residential Rates
Changed Since Last
Year's Survey?
Service
Population
(Approx.)
177 Elberton B Elbert County Municipality No No $29,088.00 7,800 1 3,564 SW
178 Ellaville B Schley County Municipality No No 1/1/2013 $24,630.00 2,779 1 1,097 GWAdministration and Debt Service charges included in Base
Charge.
179 Ellenton W Colquitt County Municipality No 3/14/2016 $20,179.00 374 1 152 GW
180 Ellijay-Gilmer County Water and Sewer Authority B Gilmer County Authority Yes Yes 7/1/2017 $43,175.00 13,010 1 5,004 SW
181 Emerson B Bartow County Municipality Yes Yes 7/1/2017 $49,583.00 1,394 1 1,080 GW
182 Enigma W Berrien County Municipality Yes 1/1/2017 $25,063.00 1,113 1 428 GW Has senior rates.
183 Ephesus W Heard County Municipality No 1/1/2014 $48,750.00 1,352 1 520 P
184 Etowah Water and Sewer Authority B Dawson County Authority Yes Yes 1/1/2016 $52,788.00 13,843 1 5,324 SW
185 Fairburn B Fulton County Municipality No No 10/1/2011 $40,954.00 13,693 1 4,509 P Also has commercial irrigation rates (not shown).
186 Fairmount B Gordon County Municipality No No 11/16/2016 $29,609.00 130 1 50 P Has agricultural water rates.
187 Fargo W Clinch County Municipality No 10/1/2015 $37,188.00 380 1 164 GW
188 Fayette County W Fayette County County/District No 1/1/2010 $81,689.00 74,163 1 27,770 SW
189 Fayetteville B Fayette County Municipality Yes Yes 8/1/2017 $66,793.00 15,281 1 6,661 P Has senior discount rates.
190 Fitzgerald Water Light and Bond Commission B Ben Hill County Municipality No No 1/1/2013 $18,396.00 12,935 1 5,550 GW
191 Flovilla W Butts County Municipality No 7/1/2012 $30,568.00 1,438 1 574 GW
192 Flowery Branch B Hall County Municipality No No 7/7/2011 $57,371.00 2,920 1 1,131 GW Has discounts for seniors and disabled citizens.
193 Floyd County B Floyd County County/District No Yes 7/1/2016 $42,955.00 41,738 1 16,053 SW
194 Folkston B Charlton County Municipality Yes Yes 9/1/2016 $33,824.00 5,940 1 1,685 GWHas senior discount rates. Has rates for high use
commercial customers.
195 Forest Heights Water Works, Inc. W Bulloch County For_Profit Yes 7/1/2017 0
196 Forsyth B Monroe County Municipality Yes Yes 10/1/2016 $27,000.00 7,400 1 2,800 SW
197 Forsyth County B Forsyth County County/District No No 5/7/2015 $91,842.00 138,368 1 51,386 SW Has senior discounts.
198 Fort Gaines B Clay County Municipality No No 10/1/2014 $19,787.00 1,422 1 623 GW
199 Fort Oglethorpe B Catoosa County Municipality Yes Yes 1/1/2017 $42,355.00 9,446 1 2,835 P
200 Fort Valley Utility Commission B Peach County Municipality No Yes 10/1/2012 $20,664.00 17,645 1 4,520 GW Sewer rates have cap in summer of 125% of winter use.
201 Franklin County B Franklin County County/District Yes Yes 9/1/2016 $37,298.00 2,764 1 1,260 P
202 Franklin Springs B Franklin County Municipality No No 7/1/2009 $40,750.00 997 1 308 P
203 Fulton County B Fulton County County/District Yes Yes 10/1/2017 $60,805.00 172,533 1 70,293 PConservation pricing structure modeled here; applies April-
October.
204 Funston W Colquitt County Municipality Yes $32,857.00 551 1 215 GW
205 Gainesville B Hall County Municipality No Yes 1/1/2017 $40,476.00 117,962 1 107,376 SWSome Oakwood, Hall County, and Braselton sewer
customers have water provided by Gainesville and are
charged the Gainesville Water Outside rates.
206 Garden City B Chatham County Municipality Yes Yes 1/1/2017 $36,097.00 8,166 1 3,515 GWHas different volumetric rates in Town Center
development.
207 Garfield W Emanuel County Municipality No 6/1/2013 $23,958.00 390 1 150 GW
208 Gay W Meriwether County Municipality No 5/1/2009 $61,250.00 179 1 69 GW
209Georgetown-Quitman County Water, Sewer and Solid
Waste AuthorityB
Georgetown-
Quitman County
Consolidated
Government
Consolidated
GovernmentNo No 8/1/2010 $29,773.00 985 1 379 GW
210 Gibson B Glascock County Municipality Yes Yes 7/1/2017 $36,375.00 720 1 300 GW
211 Glennville B Tattnall County Municipality No No 7/1/2014 $42,809.00 4,711 1 1,812 GW
212 Glenwood B Wheeler County Municipality No No 10/1/2010 $18,000.00 1,012 1 408 GW
Service Population is approximated and may not be actual.
Source: 1=EPA SDWIS 2017, 2=Census Population in 2016
Georgia Environmental Finance Authority
and Environmental Finance Center
Utility / Rate Structure
Services
Provided
(Water=W,
Wastewater=WW,
Both=B)
CountyInstitutional
Arrangement
Year or Date
of Last Rates
Change
Median
Household
Income in 2016
(U. S. Census
Bureau)
Approx.
Number of
Water
Connections
(EPA SDWIS)
Source Water
(GW=Groundwater,
SW=Surface Water,
GU=GW under inf.,
P=Purchase)
Notes and Assumptions About Rates and
Calculated Bills
Water Sewer
Table of Participating Utilities and Rate Structures - 2017
#
Residential Rates
Changed Since Last
Year's Survey?
Service
Population
(Approx.)
213 Gordon B Wilkinson County Municipality No No 10/1/2006 $30,104.00 2,340 1 930 GW
214 Graham W Appling County Municipality No 1/1/2010 $36,750.00 261 2
215 Grantville B Coweta County Municipality No No 3/14/2011 $47,413.00 1,508 1 1,300 P
216 Greensboro B Greene County Municipality No No 10/1/2011 $25,234.00 3,156 1 1,214 SW
217 Greenville B Meriwether County Municipality $26,875.00 1,880 1 628 P
218 Griffin B Spalding County Municipality Yes Yes 3/1/2017 $30,692.00 23,643 1 9,513 SW
219 Griffin - Spalding County W Spalding County Municipality 4/1/2016 0
220 Grovetown B Columbia County Municipality No No 1/1/2016 $52,233.00 11,216 1 4,267 GW Has senior rates.
221 Guyton B Effingham County Municipality No No 12/1/2014 $52,232.00 2,394 1 921 GW
222 Gwinnett County B Gwinnett County County/District Yes Yes 1/1/2017 $62,056.00 795,657 1 228,927 SW
223 Hahira B Lowndes County Municipality Yes Yes 1/1/2017 $41,310.00 2,846 1 1,320 GW
224 Hall County WW Hall County County/District Yes 5/1/2016 $51,902.00 190,482 2 Customers in Hall County billed through Gainesville. For
water rates see Gainesville Water Outside.
225 Hamilton B Harris County Municipality No No 1/1/2015 $44,750.00 928 1 412 GWResidential water rates are higher than shown for larger
meter sizes.
226 Hampton B Henry County Municipality Yes Yes 10/1/2015 $50,197.00 7,305 1 2,300 P Includes sewer surcharge rate.
227 Hancock County B Hancock County County/District No Yes 5/1/2007 $26,386.00 900 1 382 P
228 Hapeville B Fulton County Municipality No No 1/1/2014 $43,326.00 5,385 1 2,071 P
229 Haralson County Water Authority W Haralson County Authority No 7/1/2014 $42,281.00 11,362 1 4,370 SW Has senior rates.
230 Harlem B Columbia County Municipality Yes Yes 5/1/2017 $50,208.00 5,356 1 2,140 P
Doesn't provide residential sewer outisde city limits. Does
provide sewer outside city limits to Harlem High School
(at inside water rates) and to DOT I-20 rest area (at
outside water rates).
231 Harris County W Harris County County/District No 7/1/2014 $65,336.00 20,062 1 15,104 SW
232 Harrison B Washington County Municipality No No 8/1/2004 $39,000.00 500 1 162 GW
233 Hart County Water and Sewer Authority B Hart County Authority No No 8/18/2014 $37,983.00 3,606 1 1,500 PBase fee waived if customers uses 2 million gallons per
month or more.
234 Hartford Water Authority W Pulaski County Authority No 6/1/2010 $38,880.00 487 1 198 GW
235 Hartwell B Hart County Municipality Yes Yes 1/1/2017 $30,821.00 7,116 1 2,737 SW
236 Hawkinsville B Pulaski County Municipality Yes Yes 1/1/2017 $39,845.00 4,856 1 1,733 GW
237 Hazlehurst B Jeff Davis County Municipality No No $27,463.00 5,800 1 2,650 GW
238 Heard County Water Authority B Heard County Authority No No 7/26/2012 $41,894.00 8,172 1 3,143 SW
239 Helen B White County Municipality Yes Yes 7/1/2017 $40,089.00 1,851 1 712 P Residential = 1 REU; Commercial assumed = 4 REU's
240 Henry County Water Authority B Henry County Authority Yes Yes 1/1/2017 $62,561.00 218,667 1 58,536 SW
241 Hephzibah B
Augusta-Richmond
County
Consolidated
Government
Municipality No Yes 1/1/2017 $51,316.00 4,500 1 1,490 GW
242 Hiawassee - above booster B Towns County Municipality Yes Yes 1/1/2014 $35,217.00 5,496 1 2,114 SW Does not include NC rates.
243 Hiawassee - below booster B Towns County Municipality No No 1/1/2014 $35,217.00 5,496 1 2,114 SW Does not include NC rates.
244 Hiltonia B Screven County Municipality Yes Yes 10/1/2016 $24,000.00 392 1 129 GW
245 Hinesville B Liberty County Municipality No No 11/1/2012 $42,949.00 23,400 1 9,000 GW
246 Hiram W Paulding County Municipality No 9/1/2013 $49,645.00 858 1 330 GW
247 Hoboken W Brantley County Municipality Yes 5/1/2017 $53,438.00 463 1 201 GW
248 Hogansville B Troup County Municipality No Yes 9/1/2017 $28,452.00 3,728 1 1,533 P Has senior discount rates.
Service Population is approximated and may not be actual.
Source: 1=EPA SDWIS 2017, 2=Census Population in 2016
Georgia Environmental Finance Authority
and Environmental Finance Center
Utility / Rate Structure
Services
Provided
(Water=W,
Wastewater=WW,
Both=B)
CountyInstitutional
Arrangement
Year or Date
of Last Rates
Change
Median
Household
Income in 2016
(U. S. Census
Bureau)
Approx.
Number of
Water
Connections
(EPA SDWIS)
Source Water
(GW=Groundwater,
SW=Surface Water,
GU=GW under inf.,
P=Purchase)
Notes and Assumptions About Rates and
Calculated Bills
Water Sewer
Table of Participating Utilities and Rate Structures - 2017
#
Residential Rates
Changed Since Last
Year's Survey?
Service
Population
(Approx.)
249 Homeland W Charlton County Municipality No 1/9/2014 $31,071.00 995 1 359 GW
250 Homer W Banks County Municipality No 7/1/2009 $43,625.00 950 1 403 P
251 Hoschton B Jackson County Municipality Yes Yes 1/21/2016 $59,931.00 1,547 1 691 PBase charges do not include administration or debt
service fees.
252 Houston County W Houston County County/District No 1/1/2006 $55,480.00 69,747 1 27,040 GW
253 Ideal B Macon County Municipality No No 2/1/2010 $17,426.00 450 1 176 GW
254 Ila W Madison County Municipality Yes 1/1/2017 $44,000.00 437 1 172 GW
255 Iron City W Seminole County Municipality Yes 1/1/2016 $38,750.00 411 1 172 GW
256 Irwinton W Wilkinson County Municipality No $31,667.00 1,817 1 699 GW
257 Ivey B Wilkinson County Municipality No No 1/1/2001 $36,053.00 1,086 1 425 GW
258 Jackson B Butts County Municipality No No 3/1/2015 $35,507.00 4,950 2
259 Jackson County Water and Sewer Authority B Jackson County Authority Yes No 2/1/2017 $53,975.00 19,191 1 7,491 P Has senior rates.
260 Jacksonville W Telfair County Municipality No 1/1/2010 $29,375.00 200 1 77 GW
261 Jakin W Early County Municipality Yes 1/1/2017 $28,750.00 252 1 97 GW
262 Jasper B Pickens County Municipality No No 1/5/2009 $43,700.00 9,850 1 5,100 SWSeasonal surcharge, not modeled here, on volumetric rate
applies to customers of water only if summer use is above
winter average.
263 Jekyll Island Authority B Glynn County Authority Yes Yes 7/1/2017 $66,845.00 2,083 1 801 GW Has special rates for hotels.
264 Jenkinsburg W Butts County Municipality Yes 9/1/2016 $46,354.00 366 2 Outside rates are for customers outside of Butts County.
265 Jesup B Wayne County Municipality Yes Yes 1/1/2017 $33,214.00 10,200 1 3,548 GW Residential = 1 REU, Commercial = 4 REU's
266 Jones County B Jones County County/District No No 5/1/2016 $54,020.00 10,795 1 3,900 P
267 Keysville B Burke County Municipality 1/1/2003 $26,667.00 351 1 93 GW
268 Kingsland B Camden County Municipality No No 8/1/2013 $53,148.00 18,697 1 6,145 GW Has separate hotel/motel rates.
269 Kingston W Bartow County Municipality No 1/1/2013 $23,611.00 1,263 1 486 GW
270 Kite W Johnson County Municipality No 7/1/2014 $43,393.00 241 1 130 GW $20 base charge include biweekly trash pickup.
271 LaFayette B Walker County Municipality No No 1/11/2016 $29,034.00 18,177 1 7,013 P
272 Lagrange B Troup County Municipality Yes Yes 2/1/2017 $33,501.00 41,852 1 16,097 SW36% revenue adjustment factor included in volumetric
rates.
273 Lake Park W Lowndes County Municipality No 2/4/2014 $40,938.00 595 1 276 GW
274 Lakeland B Lanier County Municipality No No 1/1/2008 $20,667.00 2,922 1 1,198 GW
275 Lavonia B Franklin County Municipality No No 1/1/2014 $29,231.00 8,008 1 3,080 SW
276 Lawrenceville W Gwinnett County Municipality Yes 7/1/2017 $41,578.00 24,000 1 6,930 PHas two additional tiers for June-October based on 125%
and 200% of average winter usage.
277 Lee County Utility Authority B Lee County Authority No No 7/1/2008 $62,797.00 13,500 1 5,365 GW
278 Leesburg B Lee County Municipality No No 7/2/2013 $53,200.00 3,003 1 1,292 GW
279 Lenox B Cook County Municipality No No 7/1/2006 $24,423.00 1,011 1 436 GW Residential = 1 REU; Commercial assumed = 4 REU's.
280 Leslie W Sumter County Municipality 8/15/2010 $33,750.00 445 1 192 GW
281 Lexington B Oglethorpe County Municipality 1/1/2008 $29,091.00 796 1 306 P
282 Liberty County W Liberty County County/District 0
283 Lincoln County B Lincoln County County/District Yes Yes 7/1/2017 $34,720.00 3,256 1 1,256 P
284 Lincolnton B Lincoln County Municipality No No 2/2/2016 $31,894.00 1,657 1 1,107 SW
285 Locust Grove B Henry County Municipality Yes Yes 7/1/2017 $42,134.00 5,648 1 2,060 GWAdditional base rates will be applied to meters above 2' in
size.
Service Population is approximated and may not be actual.
Source: 1=EPA SDWIS 2017, 2=Census Population in 2016
Georgia Environmental Finance Authority
and Environmental Finance Center

Utility / Rate Structure
Services
Provided
(Water=W,
Wastewater=WW,
Both=B)
CountyInstitutional
Arrangement
Year or Date
of Last Rates
Change
Median
Household
Income in 2016
(U. S. Census
Bureau)
Approx.
Number of
Water
Connections
(EPA SDWIS)
Source Water
(GW=Groundwater,
SW=Surface Water,
GU=GW under inf.,
P=Purchase)
Notes and Assumptions About Rates and
Calculated Bills
Water Sewer
Table of Participating Utilities and Rate Structures - 2017
#
Residential Rates
Changed Since Last
Year's Survey?
Service
Population
(Approx.)
286 Loganville B Walton County Municipality No No 1/1/2016 $55,286.00 10,923 1 4,201 P Have senior rates.
287 Lone Oak W Meriwether County Municipality 1/1/2005 $31,875.00 276 1 106 GW
288 Lookout Mountain WW Walker County Municipality 6/20/2013 $105,296.00 1,754 2
289 Louisville B Jefferson County Municipality Yes Yes 1/1/2017 $26,165.00 2,575 1 1,085 GW
290 Lowndes County B Lowndes County County/District Yes No 1/1/2017 $38,915.00 13,988 1 5,761 GW
291 Ludowici B Long County Municipality No No $44,396.00 1,651 1 623 GW
292 Lula B Hall County Municipality Yes Yes 9/1/2017 $47,297.00 2,714 1 1,072 GW
293 Lumber City B Telfair County Municipality 1/1/2006 $27,768.00 993 1 416 GW
294 Lumpkin W Stewart County Municipality No 1/1/2012 $22,045.00 1,386 1 598 GWBase charges include administration charge. Residential =
1 ERU; Commercial assumed = 4 ERU's.
295 Lumpkin County Water and Sewer Authority B Lumpkin County Authority No 1/1/2010 $40,634.00 3,226 1 1,029 GW
296 Luthersville W Meriwether County Municipality 11/1/2016 $29,821.00 1,274 1 545 GW
297 Lyerly B Chattooga County Municipality No No 10/10/2012 $29,861.00 1,360 1 544 P
298 Lyons B Toombs County Municipality Yes Yes 1/1/2017 $21,726.00 4,100 1 2,109 GW
299 Macon Water Authority - Bibb County B Macon-Bibb County Authority Yes Yes 1/1/2017 $21,250.00 130,024 1 51,500 SW
Residential sewer use calculated as 80% of water usage
(with a 30 ccf cap) for customers without irrigation meters
(modeled here) and at 95% water usage for customers
with irrigation meters.
300 Macon Water Authority - Jones County B Jones County Authority Yes Yes 1/1/2015 $21,250.00 130,024 1 51,500 SW
301 Macon Water Authority - Monroe County B Monroe County Authority No No 1/1/2014 $21,250.00 130,024 1 51,500 SW
302 Madison B Morgan County Municipality No No 3/30/2010 $53,226.00 5,215 1 2,592 SWAlso has sewer flat rate of $20 for some customers not
modeled here.
303 Manchester B Meriwether County Municipality No No 7/13/2015 $26,736.00 4,995 1 1,974 SW
304 Mansfield B Newton County Municipality Yes Yes 6/12/2017 $34,028.00 791 1 304 P Separate rates for extra large commerical customers.
305 Marietta Power and Water B Cobb County Municipality No No 1/1/2016 $48,154.00 60,100 1 17,900 P
306 Marion County W Marion County County/District No 1/12/2016 $35,484.00 3,783 1 1,455 GWCommercial rates here apply to new customers. Older
customers may be on a rate structure of $950.00 base for
175 thousand gallons and $4.25/ 1000 gal thereafter.
307 Marshallville B Macon County Municipality 4/1/2016 $24,352.00 1,241 1 477 GW
308 Martin W Stephens County Municipality No 6/1/2015 $40,643.00 1,599 1 615 GW
309 Maxeys W Oglethorpe County Municipality No $65,417.00 325 1 125 GW Outside rates input here are for a Special Service District.
310 Maysville B Banks County Municipality Yes Yes 1/1/2017 $37,714.00 2,057 1 791 P
311 McCaysville B Fannin County Municipality Yes Yes 8/1/2016 $24,103.00 7,020 1 2,700 SW
312 McDonough B Henry County Municipality No No 7/1/2015 $45,517.00 8,962 1 4,023 SW
313 McIntosh County W McIntosh County County/District No 4/9/2013 $45,248.00 2,808 1 1,105 GW
314 McIntyre W Wilkinson County Municipality No 1/1/2015 $31,979.00 684 1 313 GWBase charges include $2.10 operations and maintenance
fee.
315 McRae-Helena B Telfair County Municipality No No 7/1/2015 $28,411.00 5,488 1 1,429 GW
316 Meansville W Pike County Municipality No $46,250.00 263 1 103 GW
Service Population is approximated and may not be actual.
Source: 1=EPA SDWIS 2017, 2=Census Population in 2016
Georgia Environmental Finance Authority
and Environmental Finance Center

Utility / Rate Structure
Services
Provided
(Water=W,
Wastewater=WW,
Both=B)
CountyInstitutional
Arrangement
Year or Date
of Last Rates
Change
Median
Household
Income in 2016
(U. S. Census
Bureau)
Approx.
Number of
Water
Connections
(EPA SDWIS)
Source Water
(GW=Groundwater,
SW=Surface Water,
GU=GW under inf.,
P=Purchase)
Notes and Assumptions About Rates and
Calculated Bills
Water Sewer
Table of Participating Utilities and Rate Structures - 2017
#
Residential Rates
Changed Since Last
Year's Survey?
Service
Population
(Approx.)
317 Meigs B Thomas County Municipality Yes Yes 1/1/2015 $21,500.00 1,154 1 444 GWBase charges include an Administration Charge split
evenly between water and sewer. Residential = 1 REU,
Commercial Assumed to be = 4 REU's
318 Menlo B Chattooga County Municipality No No 7/1/2015 $22,625.00 949 1 365 GW
319 Metter B Candler County Municipality Yes Yes 9/1/2017 $22,500.00 4,776 1 2,200 GW
320 Midville B Burke County Municipality 1/1/2007 $34,375.00 700 1 269 GW
321 Midway B Liberty County Municipality No No 1/1/2016 $54,344.00 2,595 1 998 GW$2 admin charge split evenly between water and sewer.
Residential = 1 REU and Commercial = 4 REU.
322 Milledgeville B Baldwin County Municipality No No 7/1/2013 $21,158.00 19,456 1 7,483 SW
323 Millen B Jenkins County Municipality Yes Yes 7/1/2017 $20,441.00 4,000 1 1,548 GW
324 Milner B Lamar County Municipality No No 1/1/2016 $47,695.00 902 1 371 P
325 Mitchell W Glascock County Municipality 1/1/2016 $40,417.00 325 1 125 GW
326 Molena W Pike County Municipality No 1/1/2014 $31,094.00 467 1 161 GW
327 Monroe B Walton County Municipality Yes No 1/1/2016 $33,927.00 21,739 1 8,991 SW
328 Monroe County W Monroe County County/District 1/1/2017 $50,625.00 6,653 1 2,593 P
329 Montezuma B Macon County Municipality No No 8/1/2014 $30,603.00 3,443 1 1,537 GWResidential = 1 REU, Commercial Assumed to be = 4
REU's
330 Monticello B Jasper County Municipality Yes Yes 1/1/2017 $27,431.00 3,505 1 1,348 SW
331 Morganton W Fannin County Municipality No 7/1/2013 $36,667.00 2,060 1 792 GW
332 Morven W Brooks County Municipality No 5/15/2011 $29,722.00 601 1 250 GW
333 Moultrie B Colquitt County Municipality No No 1/1/2016 $24,696.00 15,634 1 7,029 GW
334 Mount Airy W Habersham County Municipality No 1/1/2014 $41,125.00 1,384 1 532 GW
335 Mount Zion W Carroll County Municipality No 2/1/2016 $46,974.00 1,638 1 630 P
336 Mountain Park B Fulton County Municipality Yes No 1/1/2017 $74,375.00 798 1 307 P
337 MSO Water Systems, Inc. W Bulloch County For_Profit No 0
338 MSO Water Systems, Inc. - Briarcrest W Long County For_Profit No 0
339 MSO Water Systems, Inc. - English Oaks W Bulloch County For_Profit Yes 0
340 Nahunta B Brantley County Municipality No No 3/1/2011 $25,000.00 1,074 1 519 GW
Base charges include an Administration Charge, split
evenly between water and sewer, and sewer base charge
includes a Debt Service Charge. Residential = 1 REU,
Commercial Assumed to be = 4 REU's
341 Nashville B Berrien County Municipality No No 8/1/2015 $27,104.00 4,896 1 2,300 GWBase charges include an Administration Charge, split
evenly between water and sewer, and individual Debt
Service Charges for water and sewer.
342 Newborn W Newton County Municipality 7/1/2017 $38,125.00 832 1 322 P
343 Newington B Screven County Municipality No Yes 10/1/2014 $20,000.00 227 1 150 GW
344 Newnan Utilities B Coweta County Municipality Yes Yes 1/1/2017 $51,693.00 34,000 1 16,135 SW
345 Newton W Baker County Municipality 5/1/2010 $21,587.00 681 1 288 GW
346 Newton County Water and Sewer Authority B Newton County Authority Yes Yes 7/1/2017 $50,750.00 62,384 1 22,851 POut of town water rates are charged to customers within
Jasper County.
Service Population is approximated and may not be actual.
Source: 1=EPA SDWIS 2017, 2=Census Population in 2016
Georgia Environmental Finance Authority
and Environmental Finance Center

Utility / Rate Structure
Services
Provided
(Water=W,
Wastewater=WW,
Both=B)
CountyInstitutional
Arrangement
Year or Date
of Last Rates
Change
Median
Household
Income in 2016
(U. S. Census
Bureau)
Approx.
Number of
Water
Connections
(EPA SDWIS)
Source Water
(GW=Groundwater,
SW=Surface Water,
GU=GW under inf.,
P=Purchase)
Notes and Assumptions About Rates and
Calculated Bills
Water Sewer
Table of Participating Utilities and Rate Structures - 2017
#
Residential Rates
Changed Since Last
Year's Survey?
Service
Population
(Approx.)
347 Nicholls B Coffee County Municipality 7/1/2012 $26,364.00 2,745 1 444 GWAdministration Charge is split evenly between water and
sewer base charges. Residential = 1 REU, Commercial =
4 REU.
348 Nicholson Water Authority W Jackson County Authority Yes 1/1/2017 $42,214.00 2,857 1 1,099 GW
349 Norman Park B Colquitt County Municipality No No 7/1/2009 $42,375.00 1,173 1 483 GW
Administration charge split evenly between water and
sewer base charges. Water and Sewer base charges also
include unique Debt Service Charges. Residential = 1
REU, Commercial = 4 REU.
350 Norwood B Warren County Municipality No Yes 7/1/2016 $25,000.00 364 1 149 GW
351 Notla Water Authority W Union County Authority Yes 7/1/2015 $41,686.00 13,465 1 5,179 SW
352 Oakwood - Flowery Branch WW Hall County Municipality Yes 11/9/2015 $41,733.00 4,098 2 Customers in Oakwood billed by Flowery Branch. For
water rates see Gainesville's Water Outside rates.
353 Oakwood - Gainesville WW Hall County Municipality No $41,733.00 4,098 2 Customers in Oakwood billed by Gainesville. For water
rates see Gainesville's Water Outside rates.
354 Ochlocknee B Thomas County Municipality Yes Yes 2/1/2017 $33,750.00 789 1 319 GW
355 Ocilla B Irwin County Municipality No No 1/1/2008 $20,821.00 2,540 1 1,226 GW
356 Oconee W Washington County Municipality $60,008.00 280 1 114 GW
357 Oconee County B Oconee County County/District Yes Yes 7/1/2017 $75,960.00 19,279 1 9,630 P Sewer includes Calls Creek, LAS, and Athens System.
358 Odum B Wayne County Municipality No No 7/1/2004 $51,146.00 645 1 248 GW
359 Oxford B Newton County Municipality Yes Yes 9/1/2016 $45,395.00 2,214 1 911 P
360 Palmetto B Fulton County Municipality No No 7/1/2013 $48,590.00 3,965 1 1,502 SW
361 Parrott W Terrell County Municipality No $37,750.00 229 1 116 GW
362 Patterson B Pierce County Municipality No No 1/1/2012 $31,806.00 972 1 374 GWAdministration charge split evenly between water and
sewer base charges. Residential = 1 REU, Commercial
Assumed to be = 4 REU's
363 Paulding County B Paulding County County/District Yes Yes 1/1/2017 $60,971.00 113,204 1 43,540 P
364 Pavo W Thomas County Municipality No 3/1/2014 $32,740.00 741 1 304 GW
365 Peachtree City Water and Sewerage Authority WW Fayette County Authority No 12/1/2010 $90,051.00 34,988 2
366 Pearson B Atkinson County Municipality No No 7/1/2016 $23,911.00 2,000 2
Non-residential user base charge billed per ERU
(Equivalent Residential Unit). Modeled here as
Commercial = 4 ERU. Churches pay unique flat rate of
$20.75 for water service.
367 Pelham B Mitchell County Municipality No No 4/30/2017 $22,482.00 3,601 1 1,385 GW
368 Pembroke B Bryan County Municipality Yes No 2/1/2017 $37,243.00 2,571 1 989 GW Has senior rates.
369 Perkins Water Authority W Jenkins County Authority $27,398.00 140 1 38 GW
370 Pickens County Water Authority W Pickens County Authority Yes 1/1/2017 $56,769.00 6,357 1 2,600 P
371 Piedmont Water Co. - Lake Oconee B Greene County For_Profit No No 2/1/2015 0
372 Pike County Water and Sewer Authority W Pike County Authority No 1/1/2005 $50,819.00 434 1 167 P
373 Pine Mountain B Harris County Municipality No No 3/10/2008 $24,659.00 1,697 1 767 GW
374 Pinehurst B Dooly County Municipality No No 6/1/2015 $27,031.00 460 1 143 GW
375 Pineview W Wilcox County Municipality 1/1/2017 $21,979.00 512 1 184 GW
376 Pitts W Wilcox County Municipality No $20,833.00 590 1 239 GW
377 Plains B Sumter County Municipality No No 2/1/2015 $28,750.00 892 1 360 GW Residential = 1 REU; Commercial assumed = 4 REU's
Service Population is approximated and may not be actual.
Source: 1=EPA SDWIS 2017, 2=Census Population in 2016
Georgia Environmental Finance Authority
and Environmental Finance Center

Utility / Rate Structure
Services
Provided
(Water=W,
Wastewater=WW,
Both=B)
CountyInstitutional
Arrangement
Year or Date
of Last Rates
Change
Median
Household
Income in 2016
(U. S. Census
Bureau)
Approx.
Number of
Water
Connections
(EPA SDWIS)
Source Water
(GW=Groundwater,
SW=Surface Water,
GU=GW under inf.,
P=Purchase)
Notes and Assumptions About Rates and
Calculated Bills
Water Sewer
Table of Participating Utilities and Rate Structures - 2017
#
Residential Rates
Changed Since Last
Year's Survey?
Service
Population
(Approx.)
378 Polk County Water Authority B Polk County Authority Yes Yes 10/1/2016 $39,066.00 24,061 1 9,254 P Polk County only has sewer customers in Aragon.
379 Polk County Water Authority - Vinson Mountain W Polk County Authority Yes 10/1/2016 $39,066.00 24,061 1 9,254 P
380 Pooler B Chatham County Municipality Yes Yes 1/1/2017 $73,125.00 21,187 1 6,046 PHas senior discount rates and a flat rate for sewer only
customers.
381 Port Wentworth B Chatham County Municipality Yes Yes 8/1/2016 $64,485.00 4,160 1 4,814 GW
382 Portal B Bulloch County Municipality No No 11/1/2014 $36,250.00 879 1 363 GW
383 Poulan W Worth County Municipality No 7/1/2016 $37,813.00 2,002 1 786 GW Base charge includes a $6.00 Debt Service Charge.
384 Powder Springs B Cobb County Municipality Yes No 1/1/2017 $60,621.00 14,000 1 5,270 PResidential assumed = 1 REU and commercial assumed
= 4 REUs.
385 Pulaski W Candler County Municipality No 7/1/2009 $38,438.00 280 1 95 GWCustom commercial water rate for nursing home, not
modeled here.
386 Quitman B Brooks County Municipality Yes Yes $25,199.00 4,942 1 2,212 GW
387 Rabun County Water and Sewer Authority B Rabun County Authority No No 4/1/2015 0
388 Randolph County Water Authority W Randolph County Authority No 231 1 89 GW
389 Ray City B Berrien County Municipality Yes No $25,068.00 845 1 325 GWBase rates charged per REU. Modeled here as
Residential = 1 REU and Commercial = 4 REU.
390 Register W Bulloch County Municipality Yes 7/20/2017 $32,500.00 182 1 74 GW
391 Remerton B Lowndes County Municipality $23,587.00 1,479 1 642 GW
392 Rentz B Laurens County Municipality No No 1/1/2015 $26,875.00 310 1 202 GW
393 Reynolds B Taylor County Municipality Yes No 9/18/2017 $29,038.00 1,373 1 558 GW
394 Rhine W Dodge County Municipality Yes $24,063.00 413 1 159 GW
395 Riceboro B Liberty County Municipality No No 4/1/2008 $28,229.00 1,131 1 435 GWFor base charge, commercial customers assumed to be 4
EDU.
396 Richland B Stewart County Municipality No No 3/28/2011 $19,756.00 1,323 1 531 GW
397 Richmond Hill B Bryan County Municipality No No 1/1/2016 $56,364.00 11,258 1 4,330 GW Senior Citizens (65+) get 2,000 gals free.
398 Riddleville W Washington County Municipality No 7/1/2007 $83,750.00 128 1 90 GW
399 Rincon B Effingham County Municipality Yes Yes 2/1/2017 $63,029.00 9,880 1 4,000 P
400 Ringgold B Catoosa County Municipality No Yes 3/10/2016 $41,098.00 2,743 1 1,281 SW
401 Ringgold - Dalton WW Catoosa County Municipality 8/1/2016 0
402 Ringgold - Meadows WW Catoosa County Municipality 8/1/2016 0
403 Roberta B Crawford County Municipality No Yes 7/1/2017 $23,362.00 1,615 1 621 GW
404 Rochelle B Wilcox County Municipality Yes Yes 2/1/2017 $31,641.00 1,581 1 692 GW
405 Rockdale County Water and Sewer Authority B Rockdale County County/District No No 9/27/2016 $49,113.00 72,621 1 27,931 SW
406 Rockmart B Polk County Municipality Yes Yes 7/1/2017 $28,841.00 6,500 1 2,500 GU
407 Rocky Ford W Screven County Municipality Yes 8/9/2016 $25,962.00 165 1 75 GW
408 Rome - Zone 1 B Floyd County Municipality 1/1/2016 $36,616.00 45,586 1 17,533 SW Zone 1
409 Rome - Zone 2 B Floyd County Municipality 1/1/2016 $36,616.00 45,586 1 17,533 SW Zone 2
410 Rome - Zone 3 B Floyd County Municipality 1/1/2016 $36,616.00 45,586 1 17,533 SW Zone 3
411 Rome - Zone 4 B Floyd County Municipality 1/1/2016 $36,616.00 45,586 1 17,533 SW Zone 4, Sewer Outside rates are for Floyd Co.
412 Roopville W Carroll County Municipality 11/1/2007 $50,781.00 252 1 97 GW
Service Population is approximated and may not be actual.
Source: 1=EPA SDWIS 2017, 2=Census Population in 2016
Georgia Environmental Finance Authority
and Environmental Finance Center
Utility / Rate Structure
Services
Provided
(Water=W,
Wastewater=WW,
Both=B)
CountyInstitutional
Arrangement
Year or Date
of Last Rates
Change
Median
Household
Income in 2016
(U. S. Census
Bureau)
Approx.
Number of
Water
Connections
(EPA SDWIS)
Source Water
(GW=Groundwater,
SW=Surface Water,
GU=GW under inf.,
P=Purchase)
Notes and Assumptions About Rates and
Calculated Bills
Water Sewer
Table of Participating Utilities and Rate Structures - 2017
#
Residential Rates
Changed Since Last
Year's Survey?
Service
Population
(Approx.)
413 Roswell B Fulton County Municipality Yes No 1/1/2017 $84,959.00 14,300 1 5,500 SWAlso has housing authority water rates as well as
additional rates for larger commercial customers not
modeled here.
414 Royston B Franklin County Municipality Yes Yes 1/1/2017 $21,625.00 2,800 1 1,077 SW
415 Rutledge B Morgan County Municipality No No 7/1/2007 $40,234.00 918 1 390 P
416 Saint Marys B Camden County Municipality No No 5/1/2010 $55,170.00 17,270 1 6,642 GW Has senior rate and disabled veterans rates.
417 Sale City W Mitchell County Municipality 12/29/2004 $45,833.00 465 1 179 GW
418 Sandersville B Washington County Municipality Yes Yes 12/19/2016 $29,703.00 6,100 1 2,975 GW
419 Sardis B Burke County Municipality No No 1/1/2016 $21,786.00 999 1 438 GW
420 Sasser W Terrell County Municipality Yes 1/1/2017 $35,625.00 367 1 157 GW
421 Satilla Regional Water and Sewer Authority B Ware County Authority No No 7/1/2017 $34,705.00 14,311 1 5,505 GW
422 Savannah B Chatham County Municipality Yes Yes 1/1/2017 $37,108.00 215,566 1 85,644 GW
423 Schley County W Schley County County/District No 1/1/2009 $41,227.00 1,321 1 511 GW
424 Scotland B Telfair County Municipality $30,972.00 356 1 137 GW
425 Screven B Wayne County Municipality No No 10/1/2006 $41,250.00 840 1 323 GW
426 Senoia B Coweta County Municipality No No 9/15/2015 $82,485.00 3,466 1 815 SW
427 Shady Dale W Jasper County Municipality No 9/19/2011 $40,556.00 398 1 153 GW
428 Shellman B Randolph County Municipality No No 3/2/2015 $30,917.00 1,115 1 413 GW
429 Shiloh W Harris County Municipality No 7/1/2016 $51,667.00 585 1 225 GW Has senior rates.
430 Siloam W Greene County Municipality No 6/1/2013 $24,792.00 481 1 200 GW
431 Sky Lake POA, Inc. W White County For_Profit 1/1/2017 0
432 Sky Valley W Rabun County Municipality Yes 12/1/2010 $73,250.00 1,877 1 722 GW
433 Smithville B Lee County Municipality $31,250.00 647 1 249 GW
434 Smyrna B Cobb County Municipality Yes No 1/1/2017 $64,889.00 35,000 1 7,825 P
435 Social Circle B Walton County Municipality No No 7/1/2015 $50,248.00 4,235 1 1,777 SW
436 Soperton B Treutlen County Municipality No No 9/1/2010 $31,705.00 2,470 1 950 GWResidential sewer charge is $25 or 75% of water bill,
whichever is greater. Commercial sewer charge is $25 or
100% of water bill, whichever is greater.
437 Spalding County B Spalding County Authority No Yes 3/1/2016 $40,568.00 40,430 1 12,383 P
438 Sparks B Cook County Municipality 1/1/2001 $27,642.00 1,823 1 733 GW
439 Springfield B Effingham County Municipality No No 12/1/2012 $40,106.00 3,100 1 1,500 GW
440 Statesboro B Bulloch County Municipality Yes Yes 7/1/2017 $24,499.00 36,846 1 13,904 GW
441 Statham B Barrow County Municipality No No 7/1/2015 $44,239.00 3,986 1 1,533 SW
442 Stewart County Water and Sewer Authority W Stewart County Authority $20,882.00 3,006 1 464 GW
443 Stillmore B Emanuel County Municipality No No $26,094.00 615 1 215 GW
444 Stockbridge B Henry County Municipality Yes Yes 1/1/2017 $54,769.00 6,500 1 2,461 P
445 Summerville B Chattooga County Municipality No No 7/1/2013 $25,487.00 11,651 1 4,481 SW
446 Sumner W Worth County Municipality Yes $41,875.00 848 1 350 GW
447 Surrency W Appling County Municipality No 12/1/2008 $25,556.00 170 2
448 Suwanee W Gwinnett County Municipality No 7/20/2016 $82,465.00 920 1 354 GW
449 Sylvania B Screven County Municipality No No 1/1/2013 $31,995.00 2,960 1 1,405 GW
450 Sylvester B Worth County Municipality No No 8/1/2014 $26,017.00 12,886 1 5,680 GW
451 Talbot County W Talbot County County/District Yes 1/1/2017 $36,957.00 3,398 1 1,320 P
Service Population is approximated and may not be actual.
Source: 1=EPA SDWIS 2017, 2=Census Population in 2016
Georgia Environmental Finance Authority
and Environmental Finance Center
Utility / Rate Structure
Services
Provided
(Water=W,
Wastewater=WW,
Both=B)
CountyInstitutional
Arrangement
Year or Date
of Last Rates
Change
Median
Household
Income in 2016
(U. S. Census
Bureau)
Approx.
Number of
Water
Connections
(EPA SDWIS)
Source Water
(GW=Groundwater,
SW=Surface Water,
GU=GW under inf.,
P=Purchase)
Notes and Assumptions About Rates and
Calculated Bills
Water Sewer
Table of Participating Utilities and Rate Structures - 2017
#
Residential Rates
Changed Since Last
Year's Survey?
Service
Population
(Approx.)
452 Talbotton B Talbot County Municipality Yes Yes 1/1/2017 $25,288.00 738 1 348 GW
453 Tallapoosa B Haralson County Municipality No No 7/1/2013 $45,608.00 4,030 1 1,550 P
454 Tarrytown W Montgomery County Municipality 9/1/2017 88 1 49 P
455 Taylor County Water and Sewer Authority B Taylor County County/District 11/1/1989 $27,114.00 91 1 35 GW
456 Temple B Carroll County Municipality No No 2/18/2016 $46,680.00 4,250 1 2,600 P
457 Tennille B Washington County Municipality No No $26,321.00 1,802 1 746 GW
458 Thomaston B Upson County Municipality Yes Yes 1/1/2017 $27,466.00 10,510 1 4,801 SW Has senior rates.
459 Thomasville B Thomas County Municipality Yes Yes 1/9/2017 $31,669.00 23,577 1 10,668 GW
460Thomson-McDuffie County Water and Sewer
CommissionB McDuffie County
Consolidated
GovernmentYes Yes 3/1/2017 $32,861.00 17,717 1 6,814 SW $28.40 flat sewer rate offered for sewer-only customers.
461 Thunderbolt B Chatham County Municipality Yes Yes 8/10/2016 $54,564.00 2,668 1 1,200 GW
462 Tifton B Tift County Municipality No No 8/1/2014 $29,688.00 24,871 1 11,035 GW
463 Tignall B Wilkes County Municipality No No 11/15/2012 $28,750.00 754 1 331 GW
464 Toccoa B Stephens County Municipality No No 7/1/2013 $29,509.00 24,960 1 10,500 SW
465 Toomsboro W Wilkinson County Municipality No 1/1/2012 $18,750.00 472 1 186 GW
466 Towns County Water and Sewer Authority W Towns County Authority No 6/15/2015 $39,321.00 9,991 1 3346 PCustomers living above booster pump pay $3 extra on
base charge.
467 Trenton WW Dade County Municipality No 1/1/2005 $32,333.00 2,091 2
468 Trion B Chattooga County Municipality No No 6/1/2007 $39,219.00 2,400 1 930 P
469 Turin W Coweta County Municipality No 1/1/2017 $82,143.00 671 1 258 GW
470 Turtle Cove POA W Jasper County For_Profit Yes 1/1/2017 0 Rates increase if property owner has unpaid POA fees.
471 Twiggs County B Twiggs County County/District Yes Yes 1/1/2016 $31,625.00 376 1 144 GW
472 Tybee Island B Chatham County Municipality Yes Yes 3/9/2017 $71,007.00 8,047 1 3095 GW Has senior rates.
473 Tyrone B Fayette County Municipality No No 1/1/2010 $87,665.00 7,121 2 Water rates from Fayette County.
474 Unadilla B Dooly County Municipality $30,321.00 3,837 1 706 GW
475 Union City B Fulton County Municipality No No 9/1/2011 $35,229.00 18,636 1 4500 P
476 Upson County B Upson County County/District No No 8/1/2015 $35,699.00 5,778 1 2230 P
477 Utilities, Inc. of Georgia - The Landings B Chatham County For_Profit Yes Yes 0
478 Utilities, Inc. of Georgia - The Orchard W Chatham County For_Profit No 0
479 Valdosta B Lowndes County Municipality No No 7/1/2016 $31,199.00 56,019 1 23318 GW
480 Vidalia B Toombs County Municipality No No 2/1/2016 $31,921.00 13,050 1 6600 GW
481 Vienna B Dooly County Municipality 10/1/2015 $31,667.00 3,666 1 1410 GW
Assumed Residential = 1 REU, Commercial = 4 REU's.
Water and sewer base charges include individual debt
service charges and an administration charge that is split
evenly between the two.
482 Villa Rica B Carroll County Municipality Yes No 1/1/2016 $48,519.00 13,996 1 6000 SW Has senior rates.
483 Waco B Haralson County Municipality $37,500.00 913 1 360 P
484 Wadley B Jefferson County Municipality No No 7/1/2008 $22,672.00 2,500 1 965 GW
485 Waleska W Cherokee County Municipality Yes 1/1/2017 $39,063.00 2,691 1 1035 P
486 Walker County Rural Water and Sewer Authority W Walker County Authority Yes 3/1/2017 $41,539.00 3,270 1 1258 GW
487 Walker County Water and Sewer Authority B Walker County Authority Yes Yes 5/1/2017 $30,727.00 36,000 1 12048 SW
488 Walthourville B Liberty County Municipality Yes Yes 1/1/2017 $39,792.00 3,858 1 1878 GW
489 Walton County Water and Sewer Authority W Walton County Authority Yes 2/1/2017 $54,271.00 36,387 1 13789 P
Service Population is approximated and may not be actual.
Source: 1=EPA SDWIS 2017, 2=Census Population in 2016
Georgia Environmental Finance Authority
and Environmental Finance Center

Utility / Rate Structure
Services
Provided
(Water=W,
Wastewater=WW,
Both=B)
CountyInstitutional
Arrangement
Year or Date
of Last Rates
Change
Median
Household
Income in 2016
(U. S. Census
Bureau)
Approx.
Number of
Water
Connections
(EPA SDWIS)
Source Water
(GW=Groundwater,
SW=Surface Water,
GU=GW under inf.,
P=Purchase)
Notes and Assumptions About Rates and
Calculated Bills
Water Sewer
Table of Participating Utilities and Rate Structures - 2017
#
Residential Rates
Changed Since Last
Year's Survey?
Service
Population
(Approx.)
490 Warm Springs B Meriwether County Municipality No No 1/1/2015 $32,321.00 1,120 1 456 GW
491 Warner Robins B Houston County Municipality No No 7/1/2014 $46,446.00 64,163 1 24678 GW
492 Warrenton B Warren County Municipality Yes Yes 4/1/2017 $18,019.00 2,800 1 1500 SW
493 Warwick W Worth County Municipality No 1/1/2011 $23,500.00 864 1 382 GWBase charge includes a debt service charge and an
administration charge.
494 Washington B Wilkes County Municipality No No 1/1/2016 $29,340.00 4,134 1 2388 SW
495 Water Service Company of Georgia - Lake Riverside B Thomas County For_Profit No No 0 Flat rate for non-metered customers.
496 Waycross B Ware County Municipality Yes Yes $26,963.00 21,154 1 7743 GW
497 Waynesboro B Burke County Municipality No No 1/7/2013 $26,303.00 5,813 1 2200 GW
498 Webster County WWebster County
Unified GovernmentConsolidated Government No 1/1/2010 $37,072.00 1,038 1 404 GW
499 West Point B Troup County Municipality No No 1/1/2015 $31,489.00 3,929 1 1511 SW
500 Whigham W Grady County Municipality Yes 8/8/2017 $36,607.00 879 1 370 GW Base charge includes $8.00 monthly maintenance fee.
501 White B Bartow County Municipality No No 7/1/2017 $39,750.00 806 1 310 GW
502 White County Water Authority W White County Authority No 7/1/2016 $42,264.00 4,420 1 1700 SW
503 White Plains W Greene County Municipality No 1/1/2005 $27,321.00 413 1 169 GW
504 Whitesburg W Carroll County Municipality No 4/1/2016 $37,500.00 931 1 358 GW
505 Willacoochee B Atkinson County Municipality No No 5/1/2010 $31,046.00 1,940 1 746 GW
506 Williamson W Pike County Municipality No 1/20/2016 $41,667.00 408 1 185 P
507 Winder B Barrow County Municipality Yes Yes 10/1/2016 $44,191.00 32,971 1 14009 SWCommercial customers pay higher surcharge rates for
water in the summertime above their winter average use.
508 Woodbine B Camden County Municipality 5/1/2012 $40,000.00 1,508 1 580 GW
509 Woodbury B Meriwether County Municipality 4/1/2016 $26,029.00 961 1 591 SW
510 Woodstock B Cherokee County Municipality No No 7/1/2014 $68,286.00 10,070 1 3412 P
511 Wrens B Jefferson County Municipality No No 8/1/2009 $27,426.00 2,375 1 1190 GW
Service Population is approximated and may not be actual.
Source: 1=EPA SDWIS 2017, 2=Census Population in 2016
Georgia Environmental Finance Authority
and Environmental Finance Center

Utility / Rate Structure
Billing Period
(Monthly,
Bimonthly,
Quarterly, Other)
Base Charge
Pricing
Monthly Gallons
Provided with
Base Charge
(Allowance)
Water Rate StructureNumber of
Blocks
First Block
Maximum
(Monthly
Gallons)
Outside/Inside
Bill Differential at
5,000 Gallons
Adel 5,311 1 Monthly Constant 2,000 Decreasing Block 3 8,000
Adrian 664 1Monthly Constant 0 Increasing Block 4 2,000
Ailey 527 1 Monthly Constant 2,000 Uniform Rate
Alamo 3,457 1 Monthly Constant 2,000 Uniform Rate
Albany 87,029 1 Monthly Constant 3,000 Decreasing Block 2 7,000
Alcovy Shores Water Authority 432 1 Monthly Constant 0 Uniform Rate
Allentown 175 1 Monthly Constant 2,000 Uniform Rate
Alma 4,700 1 Monthly Constant 2,000 Increasing Block 3 3,000 200%
Alston 169 1 Monthly Constant 2,000 Increasing Block 5 5,000
Alto 2,500 1 Monthly Constant 2,000 Uniform Rate 133%
Americus 16,255 1 Monthly Constant 0 Uniform Rate 200%
Andersonville 400 1 Monthly Constant 2,000 Uniform Rate
Arabi 429 1 Monthly Constant 2,000 Uniform Rate
Argyle 211 1 Monthly None 0 Non-Volumetric Flat Charge
Arlington 1,243 1 Monthly Constant 0 Increasing Block 4 2,000
Arnoldsville 1,040 1 Monthly Constant 3,000 Increasing Block 2 5,999 175%
Ashburn 4,272 1 Monthly Constant 0 Increasing Block 5 5,000
Athens-Clarke County 120,266 1 Monthly By Meter Size 0 Increasing Block 4 4,000
Atlanta 650,000 1 Monthly Constant 0 Increasing Block 3 2,244 121%
Attapulgus 715 1 Monthly Constant 3,000 Uniform Rate 112%
Auburn 6,904 1 Monthly Constant 0 Increasing Block 9 1,000 119%
Augusta 204,000 1 Monthly Constant 0 Increasing Block 2 3,000
Austell 7,774 1 Monthly Constant 2,000 Increasing Block 3 7,000 106%
Avera 240 1 Monthly Constant 1,000 Increasing Block 2 5,000
Baconton 985 1 Monthly Constant 0 Uniform Rate 137%
Bainbridge 13,546 1 Monthly Constant 0 Uniform Rate 113%
Baldwin 4,160 1 Monthly Constant 2,000 Increasing Block 3 6,000 170%
Baldwin County 21,840 1 Monthly Constant 2,000 Increasing Block 5 4,999
Ball Ground 2,470 1 Monthly Constant 0 Increasing Block 5 3,000 134%
Banks County 6,453 1 Monthly Constant 2,000 Increasing Block 5 6,000
Barnesville 6,755 1 Monthly Constant 2,000 Uniform at One Block's Rate 3 5,000 126%
Barrow County Water and Sewer Authority 14,043 1 Monthly Constant 0 Increasing Block 2 10,000
Bartow 286 1 Monthly Constant 2,000 Uniform Rate 145%
Bartow County 50,162 1 Monthly By Meter Size 0 Increasing Block 4 5,000
Barwick 497 1 Monthly Constant 0 Increasing Block 6 2,000
Rate Table 1: 2017 Water Rate Structures for Residential Customers
Service
Population
(Approx.)
Service Population is approximated and may not be actual.
Source: 1=EPA SDWIS 2017, 2=Census Population in 2016
Georgia Environmental Finance Authority
and Environmental Finance Center
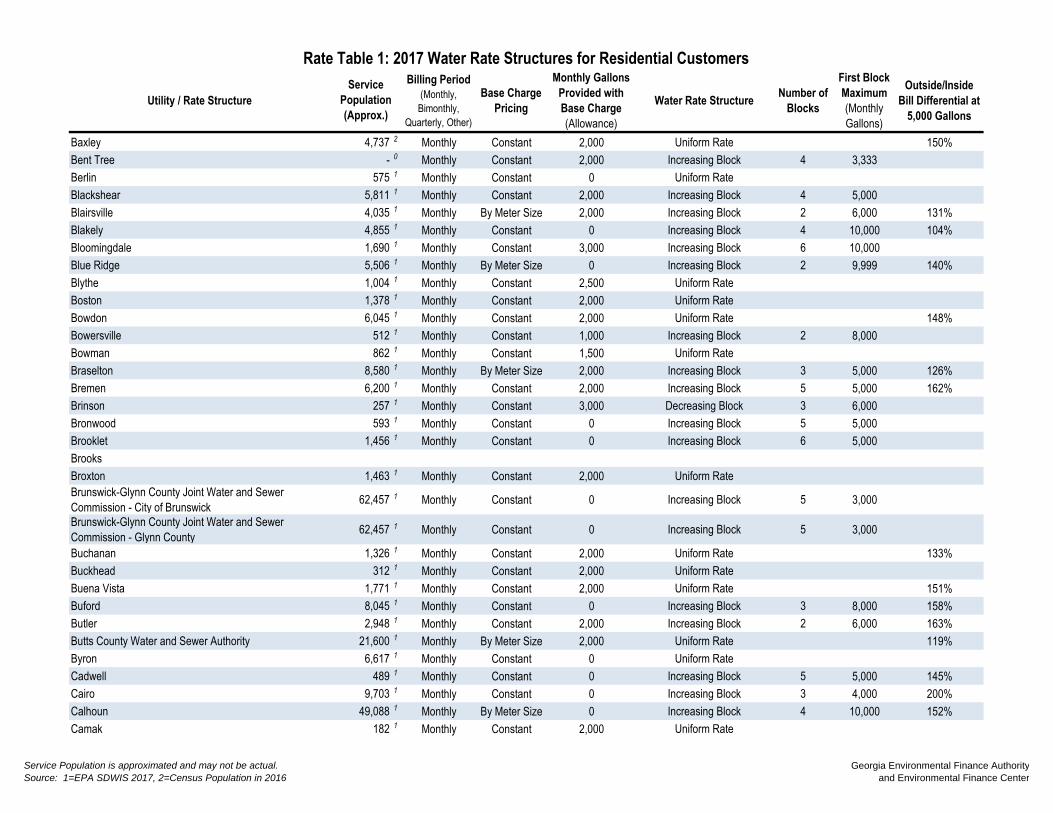
Utility / Rate Structure
Billing Period
(Monthly,
Bimonthly,
Quarterly, Other)
Base Charge
Pricing
Monthly Gallons
Provided with
Base Charge
(Allowance)
Water Rate StructureNumber of
Blocks
First Block
Maximum
(Monthly
Gallons)
Outside/Inside
Bill Differential at
5,000 Gallons
Rate Table 1: 2017 Water Rate Structures for Residential Customers
Service
Population
(Approx.)
Baxley 4,737 2 Monthly Constant 2,000 Uniform Rate 150%
Bent Tree - 0 Monthly Constant 2,000 Increasing Block 4 3,333
Berlin 575 1 Monthly Constant 0 Uniform Rate
Blackshear 5,811 1 Monthly Constant 2,000 Increasing Block 4 5,000
Blairsville 4,035 1 Monthly By Meter Size 2,000 Increasing Block 2 6,000 131%
Blakely 4,855 1 Monthly Constant 0 Increasing Block 4 10,000 104%
Bloomingdale 1,690 1 Monthly Constant 3,000 Increasing Block 6 10,000
Blue Ridge 5,506 1 Monthly By Meter Size 0 Increasing Block 2 9,999 140%
Blythe 1,004 1 Monthly Constant 2,500 Uniform Rate
Boston 1,378 1 Monthly Constant 2,000 Uniform Rate
Bowdon 6,045 1 Monthly Constant 2,000 Uniform Rate 148%
Bowersville 512 1 Monthly Constant 1,000 Increasing Block 2 8,000
Bowman 862 1 Monthly Constant 1,500 Uniform Rate
Braselton 8,580 1 Monthly By Meter Size 2,000 Increasing Block 3 5,000 126%
Bremen 6,200 1 Monthly Constant 2,000 Increasing Block 5 5,000 162%
Brinson 257 1 Monthly Constant 3,000 Decreasing Block 3 6,000
Bronwood 593 1 Monthly Constant 0 Increasing Block 5 5,000
Brooklet 1,456 1 Monthly Constant 0 Increasing Block 6 5,000
Brooks
Broxton 1,463 1 Monthly Constant 2,000 Uniform Rate
Brunswick-Glynn County Joint Water and Sewer
Commission - City of Brunswick 62,457 1 Monthly Constant 0 Increasing Block 5 3,000
Brunswick-Glynn County Joint Water and Sewer
Commission - Glynn County 62,457 1 Monthly Constant 0 Increasing Block 5 3,000
Buchanan 1,326 1 Monthly Constant 2,000 Uniform Rate 133%
Buckhead 312 1 Monthly Constant 2,000 Uniform Rate
Buena Vista 1,771 1 Monthly Constant 2,000 Uniform Rate 151%
Buford 8,045 1 Monthly Constant 0 Increasing Block 3 8,000 158%
Butler 2,948 1 Monthly Constant 2,000 Increasing Block 2 6,000 163%
Butts County Water and Sewer Authority 21,600 1 Monthly By Meter Size 2,000 Uniform Rate 119%
Byron 6,617 1 Monthly Constant 0 Uniform Rate
Cadwell 489 1 Monthly Constant 0 Increasing Block 5 5,000 145%
Cairo 9,703 1 Monthly Constant 0 Increasing Block 3 4,000 200%
Calhoun 49,088 1 Monthly By Meter Size 0 Increasing Block 4 10,000 152%
Camak 182 1 Monthly Constant 2,000 Uniform Rate
Service Population is approximated and may not be actual.
Source: 1=EPA SDWIS 2017, 2=Census Population in 2016
Georgia Environmental Finance Authority
and Environmental Finance Center

Utility / Rate Structure
Billing Period
(Monthly,
Bimonthly,
Quarterly, Other)
Base Charge
Pricing
Monthly Gallons
Provided with
Base Charge
(Allowance)
Water Rate StructureNumber of
Blocks
First Block
Maximum
(Monthly
Gallons)
Outside/Inside
Bill Differential at
5,000 Gallons
Rate Table 1: 2017 Water Rate Structures for Residential Customers
Service
Population
(Approx.)
Camilla 5,922 1 Monthly Constant 2,000 Uniform Rate 146%
Canon 800 1 Monthly Constant 0 Uniform Rate 115%
Canton 14,300 1 Monthly Constant 2,000 Increasing Block 3 10,000
Carlton 434 1 Monthly Constant 2,000 Uniform Rate 103%
Carnesville 736 1 Monthly By Meter Size 0 Uniform Rate 118%
Carroll County Water Authority 44,700 1 Monthly By Meter Size 1,496 Increasing Block 4 5,984
Carrollton 24,310 1 Monthly Constant 2,244 Uniform Rate 142%
Cartersville 24,830 1 Monthly By Meter Size 0 Increasing Block 4 5,984 193%
Catoosa Utility District Authority 50,677 1 Monthly Constant 2,000 Uniform Rate
Cave Spring 4,180 1 Monthly By Meter Size 2,000 Uniform Rate 187%
Cedartown 9,750 1 Monthly By Meter Size 3,740 Implied Uniform Rate 2 187,000 146%
Centerville 9,940 1 Monthly Constant 2,000 Uniform Rate
Chatsworth Water Works Commission 29,617 1 Monthly By Meter Size 500 Uniform Rate 158%
Chattooga County 7,306 1 Monthly Constant 2,000 Increasing/Decreasing Block 3 3,000
Chattooga County - Cloudland 7,306 1 Monthly Constant 2,000 Uniform Rate
Chattooga County - Gore Subligna 7,306 1 Monthly Constant 2,000 Increasing/Decreasing Block 3 3,000
Cherokee County Water and Sewerage Authority 145,528 1 Monthly By Meter Size 0 Increasing Block 3 2,000
Chester 1,777 1 Monthly Constant 3,000 Uniform Rate
Chickamauga 4,150 1 Monthly Constant 0 Increasing Block 2 5,000 133%
Clarkesville 5,785 1 Monthly Constant 2,000 Uniform Rate 186%
Claxton 4,433 1 Monthly Constant 3,000 Increasing Block 4 5,000 156%
Clay County 744 1 Monthly Constant 0 Increasing Block 6 2,000
Clayton 7,225 1 Monthly By Meter Size 2,000 Increasing Block 4 6,000 130%
Clayton - North Loop - 0 Monthly By Meter Size 2,000 Increasing Block 4 6,000
Clayton County Water Authority 270,000 1 Monthly Constant 0 Increasing Block 4 3,000
Cleveland 3,640 1 Monthly By Meter Size 2,000 Increasing Block 3 4,000 150%
Climax 359 1 Monthly Constant 4,000 Uniform Rate 137%
Cobb County 533,000 1 Monthly By Meter Size 0 Increasing Block 5 3,000 102%
Cobbtown 596 1 Monthly Constant 2,000 Increasing Block 2 9,000
Cochran 5,124 1 Monthly Constant 1,000 Uniform Rate 177%
Coffee County 1,635 1 Monthly Constant 4,000 Decreasing Block 2 10,000
College Park 20,382 1 Monthly Constant 0 Increasing Block 3 4,000
Collins 780 1 Monthly Constant 2,000 Increasing Block 2 9,000
Colquitt 1,895 1 Monthly By Meter Size 0 Implied Uniform Rate 3 15,000
Columbia County 101,967 1 Monthly Constant 0 Increasing Block 4 10,000
Service Population is approximated and may not be actual.
Source: 1=EPA SDWIS 2017, 2=Census Population in 2016
Georgia Environmental Finance Authority
and Environmental Finance Center

Utility / Rate Structure
Billing Period
(Monthly,
Bimonthly,
Quarterly, Other)
Base Charge
Pricing
Monthly Gallons
Provided with
Base Charge
(Allowance)
Water Rate StructureNumber of
Blocks
First Block
Maximum
(Monthly
Gallons)
Outside/Inside
Bill Differential at
5,000 Gallons
Rate Table 1: 2017 Water Rate Structures for Residential Customers
Service
Population
(Approx.)
Columbus Water Works 229,000 1 Monthly By Meter Size 0 Increasing Block 2 11,220
Comer 1,380 1 Monthly Constant 1,500 Uniform Rate 225%
Commerce 6,819 1 Monthly Constant 0 Uniform Rate 145%
Concord 741 1 Monthly Constant 2,000 Uniform Rate 107%
Consolidated Utilities, Inc. - 0 Monthly Constant 0 Increasing Block 3 5,000
Consolidated Utilities, Inc. - Coastal Water & Sewerage,
LLC - 21 Centre - 0 Monthly None 0 Non-Volumetric Flat Charge
Consolidated Utilities, Inc. - Coastal Water & Sewerage,
LLC - Cypress Lakes - 0 Monthly None 0 Non-Volumetric Flat Charge
Consolidated Utilities, Inc. - Coastal Water & Sewerage,
LLC - Little Neck Plantation - 0 Monthly Constant 0 Uniform Rate with a Cap
Consolidated Utilities, Inc. - Coastal Water & Sewerage,
LLC - Rebel Estates - 0 Monthly None 0 Non-Volumetric Flat Charge
Consolidated Utilities, Inc. - Coastal Water & Sewerage,
LLC - Ridgecrest, Park of Commerce, Millcreek - 0 Monthly Constant 0 Increasing Block 2 5,000
Consolidated Utilities, Inc. - Coastal Water & Sewerage,
LLC - Sandy Woods, South Pointe, Southern Hills, White
Bluff, Mingledorff, Cottonvale
- 0 Monthly Constant 5,000 Uniform Rate
Consolidated Utilities, Inc. - Coastal Water Company - 0 Monthly Constant 0 Increasing Block 2 5,000
Consolidated Utilities, Inc. - Coastal Water Company -
Rate 2 - 0 Monthly Constant 0 Increasing Block 2 5,000
Consolidated Utilities, Inc. - Golden Isles - 0 Monthly Constant 5,000 Uniform Rate
Consolidated Utilities, Inc. - Whitemarsh Estates - 0 Monthly Constant 5,000 Uniform Rate
Consolidated Utilities, Inc. - Woodlawn - 0 Monthly Constant 5,000 Uniform Rate
Coolidge 692 1 Monthly Constant 0 Uniform Rate 124%
Coosa Water Authority 3,944 1 Monthly Constant 2,000 Increasing Block 3 6,000
Cordele 10,691 1 Monthly Constant 0 Uniform Rate 152%
Cornelia 6,130 1 Monthly Constant 2,000 Increasing Block 3 10,000 132%
Covington 20,379 1 Monthly Constant 3,000 Implied Uniform Rate 2 50,000
Coweta County Water and Sewer Authority 59,800 1 Monthly Constant 0 Increasing Block 4 5,000
Crawford 1,170 1 Monthly Constant 2,000 Increasing Block 2 10,000 154%
Crawford County 1,625 1 Monthly Constant 1,000 Uniform Rate
Crawfordville 582 1 Monthly Constant 1,500 Increasing Block 3 5,000 150%
Cumming 47,541 1 Monthly Constant 0 Increasing Block 3 6,000 124%
Cusseta-Chattahoochee County 3,300 1 Monthly Constant 2,000 Uniform Rate
Cuthbert 2,613 1 Monthly Constant 2,000 Increasing Block 2 5,000 131%
Dade County Water and Sewer Authority 36,400 1 Monthly Constant 2,000 Uniform Rate
Service Population is approximated and may not be actual.
Source: 1=EPA SDWIS 2017, 2=Census Population in 2016
Georgia Environmental Finance Authority
and Environmental Finance Center

Utility / Rate Structure
Billing Period
(Monthly,
Bimonthly,
Quarterly, Other)
Base Charge
Pricing
Monthly Gallons
Provided with
Base Charge
(Allowance)
Water Rate StructureNumber of
Blocks
First Block
Maximum
(Monthly
Gallons)
Outside/Inside
Bill Differential at
5,000 Gallons
Rate Table 1: 2017 Water Rate Structures for Residential Customers
Service
Population
(Approx.)
Dade County Water and Sewer Authority - Canyon Ridge 36,400 1 Monthly Constant 2,000 Uniform Rate
Dade County Water and Sewer Authority - Flintstone 36,400 1 Monthly Constant 2,000 Uniform Rate
Dade County Water and Sewer Authority - Mountain
(Pumped 2x) 36,400 1 Monthly Constant 2,000 Uniform Rate
Dade County Water and Sewer Authority - Mountain
(Pumped 3x) 36,400 1 Monthly Constant 2,000 Uniform Rate
Dade County Water and Sewer Authority - North End
Dade County Water and Sewer Authority - South End
Dade County Water and Sewer Authority - Valley 36,400 1 Monthly Constant 2,000 Uniform Rate
Dahlonega 4,120 1 Monthly By Meter Size 0 Increasing Block 3 5,000
Daisy 117 1 Monthly Constant 3,000 Increasing Block 3 5,000
Dallas 7,556 1 Monthly None 0 Increasing Block 4 6,000 121%
Damascus 239 1 Monthly None 0 Non-Volumetric Flat Charge
Danielsville 1,092 1 Monthly Constant 2,000 Increasing Block 3 6,000 230%
Danville 393 1 Monthly Constant 2,000 Uniform Rate
Darien 3,242 1 Monthly Constant 0 Increasing Block 5 5,000 145%
Davisboro 1,535 1 Monthly Constant 0 Increasing Block 2 2,000
Dawson 4,836 1 Monthly Constant 2,000 Uniform Rate
Dawsonville 2,424 1 Monthly Constant 1,500 Increasing Block 3 5,000 147%
Decatur Consolidated Water Services, Inc. - Doublegate
Phase VI - 0 Monthly Constant 2,000 Uniform Rate
Decatur Consolidated Water Services, Inc. - Holly Isles - 0 Monthly Constant 5,000 Uniform Rate
Decatur Consolidated Water Services, Inc. - Pebble Hill
Estates - 0 Monthly Constant 2,000 Uniform Rate
Decatur Consolidated Water Services, Inc. - Redrock
Estates - 0 Monthly Constant 5,000 Uniform Rate
Decatur Consolidated Water Services, Inc. - Riverbend
Estates - 0 Monthly Constant 2,000 Uniform Rate
Decatur Consolidated Water Services, Inc. - Woodcrest
Subdivision - 0 Monthly Constant 3,000 Uniform Rate
Deepstep 133 1 Monthly Constant 1,000 Uniform Rate
Dekalb County 670,000 1 Bi-monthly By Meter Size 0 Increasing Block 4 2,000
Demorest 15,130 1 Monthly Constant 2,000 Increasing Block 3 5,000 129%
Denton 253 1 Monthly Constant 2,000 Decreasing Block 2 5,000
Dexter 1,976 1 Monthly Constant 2,000 Increasing Block 4 5,000 111%
Dillard 133 1 Monthly Constant 1,000 Uniform Rate
Service Population is approximated and may not be actual.
Source: 1=EPA SDWIS 2017, 2=Census Population in 2016
Georgia Environmental Finance Authority
and Environmental Finance Center

Utility / Rate Structure
Billing Period
(Monthly,
Bimonthly,
Quarterly, Other)
Base Charge
Pricing
Monthly Gallons
Provided with
Base Charge
(Allowance)
Water Rate StructureNumber of
Blocks
First Block
Maximum
(Monthly
Gallons)
Outside/Inside
Bill Differential at
5,000 Gallons
Rate Table 1: 2017 Water Rate Structures for Residential Customers
Service
Population
(Approx.)
Doerun 967 1 Monthly Constant 0 Increasing Block 6 2,000
Donalsonville 2,782 1 Monthly Constant 0 Increasing Block 6 5,000
Dooling 99,315 1 Monthly Constant 1,000 Uniform Rate
Douglas 10,688 1 Monthly Constant 0 Decreasing Block 4 10,000
Douglasville-Douglas County Water and Sewer Authority 109,694 1 Monthly By Meter Size 0 Increasing Block 3 5,000
Du Pont 120 1 Monthly None 0 Non-Volumetric Flat Charge
Dublin 17,500 1 Monthly By Meter Size 2,000 Uniform Rate 182%
Dudley 546 1 Monthly Constant 2,000 Uniform Rate
East Dublin 2,657 1 Monthly Constant 2,100 Uniform Rate 181%
East Point 33,712 1 Monthly By Meter Size 3,000 Increasing Block 3 7,000
Eastman 7,491 1 Monthly Constant 2,000 Uniform Rate 155%
Eatonton-Putnam Water and Sewer Authority 12,272 1 Monthly By Meter Size 1,000 Increasing Block 6 2,000 114%
Echols County Water Authority 824 1 Monthly Constant 4,000 Uniform Rate
Edison 1,331 1 Monthly Constant 2,000 Uniform Rate
Effingham County 7,700 1 Monthly Constant 0 Increasing Block 3 5,000
Elberton 7,800 1 Monthly By Meter Size 0 Implied Uniform Rate 2 149,600 146%
Ellaville 2,779 1 Monthly Constant 0 Increasing Block 6 2,000 136%
Ellenton 374 1 Monthly Constant 3,000 Increasing Block 3 10,000
Ellijay-Gilmer County Water and Sewer Authority 13,010 1 Monthly Constant 0 Increasing Block 5 2,000
Emerson 1,394 1 Monthly Constant 0 Increasing Block 3 5,000 140%
Enigma 1,113 1 Monthly Constant 3,500 Uniform Rate
Ephesus 1,352 1 Monthly Constant 2,000 Uniform Rate
Etowah Water and Sewer Authority 13,843 1 Monthly By Meter Size 500 Increasing Block 3 7,000
Fairburn 13,693 1 Monthly Constant 0 Increasing Block 3 4,000 125%
Fairmount 130 1 Monthly Constant 1,000 Increasing Block 3 3,000
Fargo 380 1 Monthly Constant 3,000 Uniform Rate
Fayette County 74,163 1 Monthly By Meter Size 2,000 Implied Uniform Rate 2 20,000
Fayetteville 15,281 1 Monthly Constant 2,000 Increasing Block 3 10,000
Fitzgerald Water Light and Bond Commission 12,935 1 Monthly Constant 0 Uniform Rate 141%
Flovilla 1,438 1 Monthly Constant 1,000 Uniform Rate 109%
Flowery Branch 2,920 1 Monthly Constant 4,500 Increasing Block 2 7,500 133%
Floyd County 41,738 1 Monthly By Meter Size 2,000 Uniform Rate
Folkston 5,940 1 Monthly Constant 3,000 Uniform Rate 123%
Forest Heights Water Works, Inc. - 0 Monthly Constant 6,000 Increasing Block 3 12,000
Service Population is approximated and may not be actual.
Source: 1=EPA SDWIS 2017, 2=Census Population in 2016
Georgia Environmental Finance Authority
and Environmental Finance Center

Utility / Rate Structure
Billing Period
(Monthly,
Bimonthly,
Quarterly, Other)
Base Charge
Pricing
Monthly Gallons
Provided with
Base Charge
(Allowance)
Water Rate StructureNumber of
Blocks
First Block
Maximum
(Monthly
Gallons)
Outside/Inside
Bill Differential at
5,000 Gallons
Rate Table 1: 2017 Water Rate Structures for Residential Customers
Service
Population
(Approx.)
Forsyth 7,400 1 Monthly Constant 2,000 Decreasing Block 3 5,000 144%
Forsyth County 138,368 1 Monthly By Meter Size 1,000 Increasing Block 5 6,000
Fort Gaines 1,422 1 Monthly Constant 0 Uniform Rate
Fort Oglethorpe 9,446 1 Monthly Constant 2,000 Uniform Rate
Fort Valley Utility Commission 17,645 1 Monthly Constant 0 Increasing Block 3 4,488
Franklin County 2,764 1 Monthly By Meter Size 2,000 Increasing Block 2 6,000
Franklin Springs 997 1 Monthly Constant 0 Uniform Rate
Fulton County 172,533 1 Bi-monthly Constant 0 Increasing Block 3 10,530
Funston 551 1 Monthly Constant 2,000 Uniform Rate
Gainesville 117,962 1 Monthly Constant 0 Increasing Block 3 7,480 185%
Garden City 8,166 1 Monthly Constant 0 Increasing Block 6 2,500 126%
Garfield 390 1 Monthly Constant 3,000 Uniform Rate
Gay 179 1 Monthly Constant 2,000 Uniform Rate
Georgetown-Quitman County Water, Sewer and Solid
Waste Authority 985 1 Monthly Constant 2,000 Uniform Rate 117%
Gibson 720 1 Monthly Constant 3,000 Uniform Rate 109%
Glennville 4,711 1 Monthly By Meter Size 2,000 Increasing Block 4 5,000
Glenwood 1,012 1 Monthly Constant 2,000 Uniform Rate
Gordon 2,340 1 Monthly Constant 2,000 Uniform Rate
Graham 261 2 Monthly Constant 2,000 Uniform Rate
Grantville 1,508 1 Monthly Constant 2,000 Increasing Block 2 5,000
Greensboro 3,156 1 Monthly Constant 3,000 Uniform Rate 114%
Greenville 1,880 1 Monthly By Meter Size 0 Uniform Rate 117%
Griffin 23,643 1 Monthly By Meter Size 2,000 Increasing Block 3 7,000
Griffin - Spalding County - 0 Monthly Constant 0 Increasing Block 3 7,000
Grovetown 11,216 1 Monthly Constant 3,000 Increasing Block 5 10,000 154%
Guyton 2,394 1 Monthly Constant 2,000 Increasing Block 5 5,000
Gwinnett County 795,657 1 Monthly By Meter Size 0 Increasing Block 3 7,999
Hahira 2,846 1 Monthly Constant 3,000 Uniform Rate 133%
Hall County
Hamilton 928 1 Monthly By Meter Size 1,000 Increasing Block 3 3,000
Hampton 7,305 1 Monthly Constant 0 Increasing Block 3 6,000
Hancock County 900 1 Monthly Constant 2,000 Uniform Rate
Hapeville 5,385 1 Monthly Constant 2,000 Increasing Block 3 9,900
Haralson County Water Authority 11,362 1 Monthly Constant 2,000 Increasing Block 3 6,000
Service Population is approximated and may not be actual.
Source: 1=EPA SDWIS 2017, 2=Census Population in 2016
Georgia Environmental Finance Authority
and Environmental Finance Center
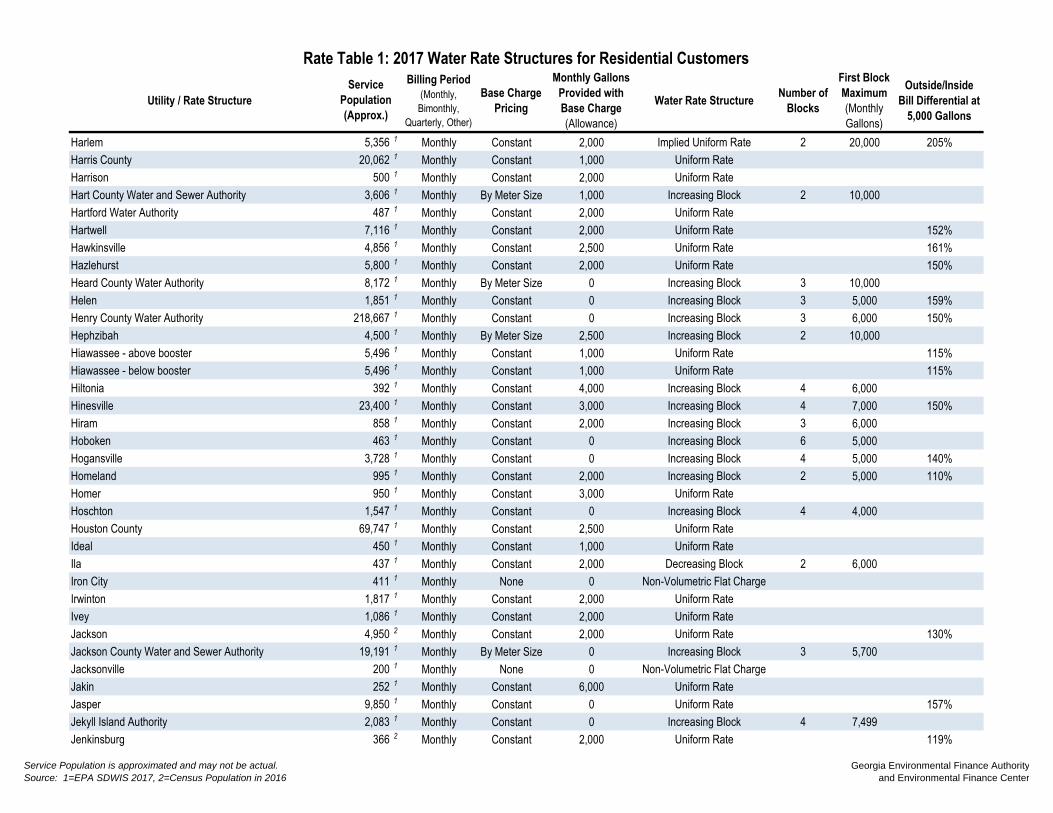
Utility / Rate Structure
Billing Period
(Monthly,
Bimonthly,
Quarterly, Other)
Base Charge
Pricing
Monthly Gallons
Provided with
Base Charge
(Allowance)
Water Rate StructureNumber of
Blocks
First Block
Maximum
(Monthly
Gallons)
Outside/Inside
Bill Differential at
5,000 Gallons
Rate Table 1: 2017 Water Rate Structures for Residential Customers
Service
Population
(Approx.)
Harlem 5,356 1 Monthly Constant 2,000 Implied Uniform Rate 2 20,000 205%
Harris County 20,062 1 Monthly Constant 1,000 Uniform Rate
Harrison 500 1 Monthly Constant 2,000 Uniform Rate
Hart County Water and Sewer Authority 3,606 1 Monthly By Meter Size 1,000 Increasing Block 2 10,000
Hartford Water Authority 487 1 Monthly Constant 2,000 Uniform Rate
Hartwell 7,116 1 Monthly Constant 2,000 Uniform Rate 152%
Hawkinsville 4,856 1 Monthly Constant 2,500 Uniform Rate 161%
Hazlehurst 5,800 1 Monthly Constant 2,000 Uniform Rate 150%
Heard County Water Authority 8,172 1 Monthly By Meter Size 0 Increasing Block 3 10,000
Helen 1,851 1 Monthly Constant 0 Increasing Block 3 5,000 159%
Henry County Water Authority 218,667 1 Monthly Constant 0 Increasing Block 3 6,000 150%
Hephzibah 4,500 1 Monthly By Meter Size 2,500 Increasing Block 2 10,000
Hiawassee - above booster 5,496 1 Monthly Constant 1,000 Uniform Rate 115%
Hiawassee - below booster 5,496 1 Monthly Constant 1,000 Uniform Rate 115%
Hiltonia 392 1 Monthly Constant 4,000 Increasing Block 4 6,000
Hinesville 23,400 1 Monthly Constant 3,000 Increasing Block 4 7,000 150%
Hiram 858 1 Monthly Constant 2,000 Increasing Block 3 6,000
Hoboken 463 1 Monthly Constant 0 Increasing Block 6 5,000
Hogansville 3,728 1 Monthly Constant 0 Increasing Block 4 5,000 140%
Homeland 995 1 Monthly Constant 2,000 Increasing Block 2 5,000 110%
Homer 950 1 Monthly Constant 3,000 Uniform Rate
Hoschton 1,547 1 Monthly Constant 0 Increasing Block 4 4,000
Houston County 69,747 1 Monthly Constant 2,500 Uniform Rate
Ideal 450 1 Monthly Constant 1,000 Uniform Rate
Ila 437 1 Monthly Constant 2,000 Decreasing Block 2 6,000
Iron City 411 1 Monthly None 0 Non-Volumetric Flat Charge
Irwinton 1,817 1 Monthly Constant 2,000 Uniform Rate
Ivey 1,086 1 Monthly Constant 2,000 Uniform Rate
Jackson 4,950 2 Monthly Constant 2,000 Uniform Rate 130%
Jackson County Water and Sewer Authority 19,191 1 Monthly By Meter Size 0 Increasing Block 3 5,700
Jacksonville 200 1 Monthly None 0 Non-Volumetric Flat Charge
Jakin 252 1 Monthly Constant 6,000 Uniform Rate
Jasper 9,850 1 Monthly Constant 0 Uniform Rate 157%
Jekyll Island Authority 2,083 1 Monthly Constant 0 Increasing Block 4 7,499
Jenkinsburg 366 2 Monthly Constant 2,000 Uniform Rate 119%
Service Population is approximated and may not be actual.
Source: 1=EPA SDWIS 2017, 2=Census Population in 2016
Georgia Environmental Finance Authority
and Environmental Finance Center

Utility / Rate Structure
Billing Period
(Monthly,
Bimonthly,
Quarterly, Other)
Base Charge
Pricing
Monthly Gallons
Provided with
Base Charge
(Allowance)
Water Rate StructureNumber of
Blocks
First Block
Maximum
(Monthly
Gallons)
Outside/Inside
Bill Differential at
5,000 Gallons
Rate Table 1: 2017 Water Rate Structures for Residential Customers
Service
Population
(Approx.)
Jesup 10,200 1 Monthly Constant 0 Increasing Block 6 2,000
Jones County 10,795 1 Monthly By Meter Size 2,000 Uniform Rate
Keysville 351 1 Monthly Constant 2,000 Uniform Rate
Kingsland 18,697 1 Monthly Constant 0 Increasing Block 2 6,000 143%
Kingston 1,263 1 Monthly By Meter Size 0 Increasing Block 4 5,000 150%
Kite 241 1 Monthly Constant 2,000 Uniform Rate
LaFayette 18,177 1 Monthly By Meter Size 0 Uniform Rate 150%
LaGrange 41,852 1 Monthly Constant 0 Implied Uniform Rate 5 25,000 150%
Lake Park 595 1 Monthly Constant 2,000 Uniform Rate
Lakeland 2,922 1 Monthly Constant 1,000 Uniform Rate
Lavonia 8,008 1 Monthly Constant 2,000 Uniform Rate 143%
Lawrenceville 24,000 1 Monthly Constant 2,000 Uniform Rate
Lee County Utility Authority 13,500 1 Monthly Constant 0 Increasing Block 4 9,000
Leesburg 3,003 1 Monthly Constant 0 Uniform Rate 120%
Lenox 1,011 1 Monthly Constant 0 Increasing Block 5 5,000 150%
Leslie 445 1 Monthly Constant 1,000 Increasing Block 2 10,000
Lexington 796 1 Monthly Constant 3,000 Uniform at One Block's Rate 2 6,000 136%
Liberty County - 0 Monthly By Meter Size 2,000 Increasing Block 4 6,000
Lincoln County 3,256 1 Monthly By Meter Size 1,500 Uniform Rate
Lincolnton 1,657 1 Monthly By Meter Size 1,500 Uniform Rate
Locust Grove 5,648 1 Monthly Constant 2,000 Increasing Block 2 10,000
Loganville 10,923 1 Monthly Constant 2,000 Increasing Block 3 8,000
Lone Oak 276 1 Monthly Constant 0 Uniform Rate 102%
Lookout Mountain
Louisville 2,575 1 Monthly Constant 2,000 Uniform Rate
Lowndes County 13,988 1 Monthly Constant 3,000 Increasing Block 4 6,000
Ludowici 1,651 1 Monthly Constant 2,000 Increasing Block 4 4,000 114%
Lula 2,714 1 Monthly Constant 0 Increasing Block 5 5,000 118%
Lumber City 993 1 Monthly Constant 4,000 Uniform Rate
Lumpkin 1,386 1 Monthly Constant 0 Increasing Block 5 2,000 129%
Lumpkin County Water and Sewer Authority 3,226 1 Monthly Constant 0 Increasing Block 5 3,000
Luthersville 1,274 1 Monthly Constant 2,000 Uniform Rate 105%
Lyerly 1,360 1 Monthly Constant 1,500 Uniform Rate 107%
Lyons 4,100 1 Monthly Constant 3,000 Increasing Block 2 10,000 200%
Macon Water Authority - Bibb County 130,024 1 Monthly By Meter Size 0 Increasing Block 2 2,244
Service Population is approximated and may not be actual.
Source: 1=EPA SDWIS 2017, 2=Census Population in 2016
Georgia Environmental Finance Authority
and Environmental Finance Center
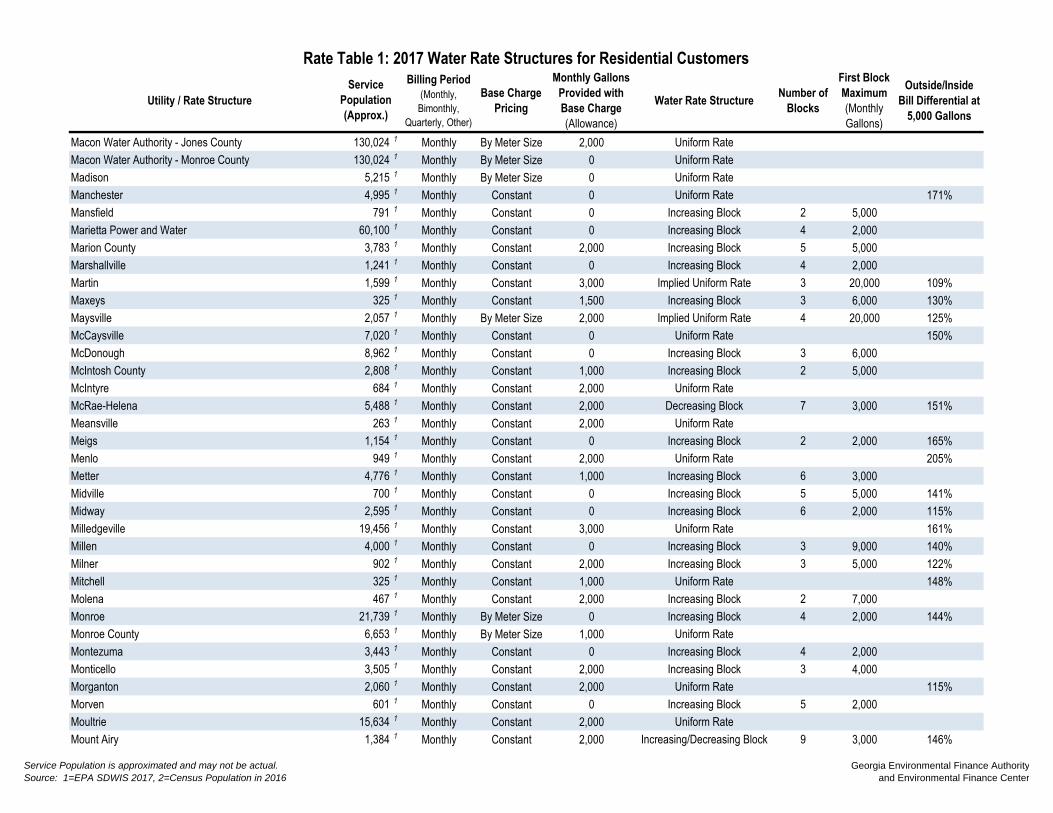
Utility / Rate Structure
Billing Period
(Monthly,
Bimonthly,
Quarterly, Other)
Base Charge
Pricing
Monthly Gallons
Provided with
Base Charge
(Allowance)
Water Rate StructureNumber of
Blocks
First Block
Maximum
(Monthly
Gallons)
Outside/Inside
Bill Differential at
5,000 Gallons
Rate Table 1: 2017 Water Rate Structures for Residential Customers
Service
Population
(Approx.)
Macon Water Authority - Jones County 130,024 1 Monthly By Meter Size 2,000 Uniform Rate
Macon Water Authority - Monroe County 130,024 1 Monthly By Meter Size 0 Uniform Rate
Madison 5,215 1 Monthly By Meter Size 0 Uniform Rate
Manchester 4,995 1 Monthly Constant 0 Uniform Rate 171%
Mansfield 791 1 Monthly Constant 0 Increasing Block 2 5,000
Marietta Power and Water 60,100 1 Monthly Constant 0 Increasing Block 4 2,000
Marion County 3,783 1 Monthly Constant 2,000 Increasing Block 5 5,000
Marshallville 1,241 1 Monthly Constant 0 Increasing Block 4 2,000
Martin 1,599 1 Monthly Constant 3,000 Implied Uniform Rate 3 20,000 109%
Maxeys 325 1 Monthly Constant 1,500 Increasing Block 3 6,000 130%
Maysville 2,057 1 Monthly By Meter Size 2,000 Implied Uniform Rate 4 20,000 125%
McCaysville 7,020 1 Monthly Constant 0 Uniform Rate 150%
McDonough 8,962 1 Monthly Constant 0 Increasing Block 3 6,000
McIntosh County 2,808 1 Monthly Constant 1,000 Increasing Block 2 5,000
McIntyre 684 1 Monthly Constant 2,000 Uniform Rate
McRae-Helena 5,488 1 Monthly Constant 2,000 Decreasing Block 7 3,000 151%
Meansville 263 1 Monthly Constant 2,000 Uniform Rate
Meigs 1,154 1 Monthly Constant 0 Increasing Block 2 2,000 165%
Menlo 949 1 Monthly Constant 2,000 Uniform Rate 205%
Metter 4,776 1 Monthly Constant 1,000 Increasing Block 6 3,000
Midville 700 1 Monthly Constant 0 Increasing Block 5 5,000 141%
Midway 2,595 1 Monthly Constant 0 Increasing Block 6 2,000 115%
Milledgeville 19,456 1 Monthly Constant 3,000 Uniform Rate 161%
Millen 4,000 1 Monthly Constant 0 Increasing Block 3 9,000 140%
Milner 902 1 Monthly Constant 2,000 Increasing Block 3 5,000 122%
Mitchell 325 1 Monthly Constant 1,000 Uniform Rate 148%
Molena 467 1 Monthly Constant 2,000 Increasing Block 2 7,000
Monroe 21,739 1 Monthly By Meter Size 0 Increasing Block 4 2,000 144%
Monroe County 6,653 1 Monthly By Meter Size 1,000 Uniform Rate
Montezuma 3,443 1 Monthly Constant 0 Increasing Block 4 2,000
Monticello 3,505 1 Monthly Constant 2,000 Increasing Block 3 4,000
Morganton 2,060 1 Monthly Constant 2,000 Uniform Rate 115%
Morven 601 1 Monthly Constant 0 Increasing Block 5 2,000
Moultrie 15,634 1 Monthly Constant 2,000 Uniform Rate
Mount Airy 1,384 1 Monthly Constant 2,000 Increasing/Decreasing Block 9 3,000 146%
Service Population is approximated and may not be actual.
Source: 1=EPA SDWIS 2017, 2=Census Population in 2016
Georgia Environmental Finance Authority
and Environmental Finance Center

Utility / Rate Structure
Billing Period
(Monthly,
Bimonthly,
Quarterly, Other)
Base Charge
Pricing
Monthly Gallons
Provided with
Base Charge
(Allowance)
Water Rate StructureNumber of
Blocks
First Block
Maximum
(Monthly
Gallons)
Outside/Inside
Bill Differential at
5,000 Gallons
Rate Table 1: 2017 Water Rate Structures for Residential Customers
Service
Population
(Approx.)
Mount Zion 1,638 1 Bi-monthly Constant 2,000 Uniform Rate 120%
Mountain Park 798 1 Monthly Constant 2,500 Increasing Block 2 4,500
MSO Water Systems, Inc. - 0 Monthly Constant 6,000 Increasing Block 3 12,000
MSO Water Systems, Inc. - Briarcrest - 0 Bi-monthly Constant 6,000 Increasing Block 3 9,000
MSO Water Systems, Inc. - English Oaks - 0 Monthly Constant 3,000 Increasing Block 2 9,000
Nahunta 1,074 1 Monthly Constant 0 Increasing Block 4 2,000
Nashville 4,896 1 Monthly Constant 0 Increasing Block 4 3,000
Newborn 832 1 Monthly Constant 1,000 Uniform Rate 128%
Newington 227 1 Monthly Constant 2,000 Increasing Block 4 5,000
Newnan Utilities 34,000 1 Monthly Constant 0 Increasing Block 3 4,000
Newton 681 1 Monthly Constant 8,000 Uniform Rate
Newton County Water and Sewer Authority 62,384 1 Monthly Constant 0 Increasing Block 4 3,000 150%
Nicholls 2,745 1 Monthly Constant 0 Increasing Block 4 2,000
Nicholson Water Authority 2,857 1 Monthly Constant 1,000 Increasing Block 3 6,000
Norman Park 1,173 1 Monthly Constant 0 Increasing Block 6 2,000 146%
Norwood 364 1 Monthly By Meter Size 2,000 Uniform Rate
Notla Water Authority 13,465 1 Monthly Constant 2,000 Uniform Rate
Oakwood - Flowery Branch
Oakwood - Gainesville
Ochlocknee 789 1 Monthly Constant 1,000 Uniform Rate 116%
Ocilla 2,540 1 Monthly Constant 2,000 Uniform Rate 168%
Oconee 280 1 Monthly Constant 2,000 Decreasing Block 2 3,000
Oconee County 19,279 1 Monthly By Meter Size 1,000 Increasing Block 3 7,000
Odum 645 1 Monthly Constant 1,000 Increasing Block 5 5,000
Oxford 2,214 1 Monthly By Meter Size 3,000 Uniform Rate
Palmetto 3,965 1 Monthly Constant 2,000 Increasing Block 3 8,000
Parrott 229 1 Monthly Constant 0 Increasing Block 3 6,000
Patterson 972 1 Monthly Constant 0 Increasing Block 6 3,000 133%
Paulding County 113,204 1 Monthly Constant 0 Increasing Block 3 8,000
Pavo 741 1 Monthly Constant 1,000 Uniform Rate 146%
Peachtree City Water and Sewerage Authority
Pearson 2,000 2 Monthly Constant 0 Increasing Block 4 2,000
Pelham 3,601 1 Monthly Constant 1,000 Uniform Rate 130%
Pembroke 2,571 1 Monthly By Meter Size 500 Increasing/Decreasing Block 6 2,000 102%
Perkins Water Authority 140 1 Monthly Constant 2,000 Uniform Rate
Service Population is approximated and may not be actual.
Source: 1=EPA SDWIS 2017, 2=Census Population in 2016
Georgia Environmental Finance Authority
and Environmental Finance Center
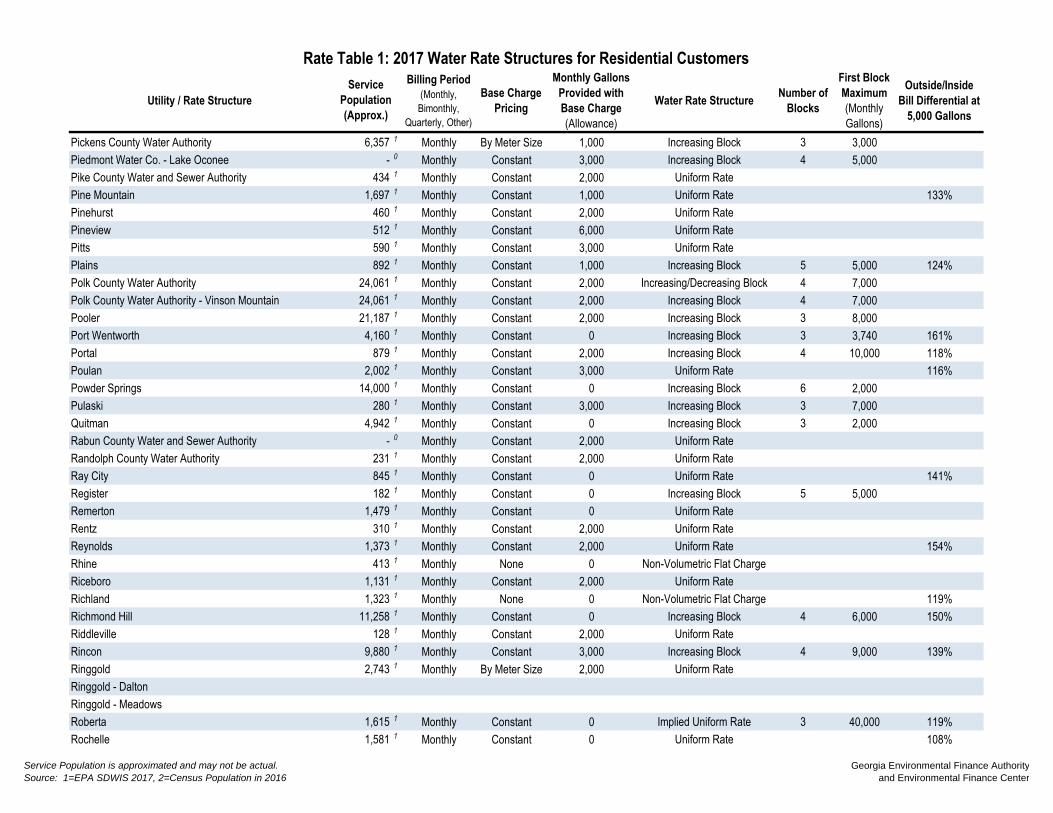
Utility / Rate Structure
Billing Period
(Monthly,
Bimonthly,
Quarterly, Other)
Base Charge
Pricing
Monthly Gallons
Provided with
Base Charge
(Allowance)
Water Rate StructureNumber of
Blocks
First Block
Maximum
(Monthly
Gallons)
Outside/Inside
Bill Differential at
5,000 Gallons
Rate Table 1: 2017 Water Rate Structures for Residential Customers
Service
Population
(Approx.)
Pickens County Water Authority 6,357 1 Monthly By Meter Size 1,000 Increasing Block 3 3,000
Piedmont Water Co. - Lake Oconee - 0 Monthly Constant 3,000 Increasing Block 4 5,000
Pike County Water and Sewer Authority 434 1 Monthly Constant 2,000 Uniform Rate
Pine Mountain 1,697 1 Monthly Constant 1,000 Uniform Rate 133%
Pinehurst 460 1 Monthly Constant 2,000 Uniform Rate
Pineview 512 1 Monthly Constant 6,000 Uniform Rate
Pitts 590 1 Monthly Constant 3,000 Uniform Rate
Plains 892 1 Monthly Constant 1,000 Increasing Block 5 5,000 124%
Polk County Water Authority 24,061 1 Monthly Constant 2,000 Increasing/Decreasing Block 4 7,000
Polk County Water Authority - Vinson Mountain 24,061 1 Monthly Constant 2,000 Increasing Block 4 7,000
Pooler 21,187 1 Monthly Constant 2,000 Increasing Block 3 8,000
Port Wentworth 4,160 1 Monthly Constant 0 Increasing Block 3 3,740 161%
Portal 879 1 Monthly Constant 2,000 Increasing Block 4 10,000 118%
Poulan 2,002 1 Monthly Constant 3,000 Uniform Rate 116%
Powder Springs 14,000 1 Monthly Constant 0 Increasing Block 6 2,000
Pulaski 280 1 Monthly Constant 3,000 Increasing Block 3 7,000
Quitman 4,942 1 Monthly Constant 0 Increasing Block 3 2,000
Rabun County Water and Sewer Authority - 0 Monthly Constant 2,000 Uniform Rate
Randolph County Water Authority 231 1 Monthly Constant 2,000 Uniform Rate
Ray City 845 1 Monthly Constant 0 Uniform Rate 141%
Register 182 1 Monthly Constant 0 Increasing Block 5 5,000
Remerton 1,479 1 Monthly Constant 0 Uniform Rate
Rentz 310 1 Monthly Constant 2,000 Uniform Rate
Reynolds 1,373 1 Monthly Constant 2,000 Uniform Rate 154%
Rhine 413 1 Monthly None 0 Non-Volumetric Flat Charge
Riceboro 1,131 1 Monthly Constant 2,000 Uniform Rate
Richland 1,323 1 Monthly None 0 Non-Volumetric Flat Charge 119%
Richmond Hill 11,258 1 Monthly Constant 0 Increasing Block 4 6,000 150%
Riddleville 128 1 Monthly Constant 2,000 Uniform Rate
Rincon 9,880 1 Monthly Constant 3,000 Increasing Block 4 9,000 139%
Ringgold 2,743 1 Monthly By Meter Size 2,000 Uniform Rate
Ringgold - Dalton
Ringgold - Meadows
Roberta 1,615 1 Monthly Constant 0 Implied Uniform Rate 3 40,000 119%
Rochelle 1,581 1 Monthly Constant 0 Uniform Rate 108%
Service Population is approximated and may not be actual.
Source: 1=EPA SDWIS 2017, 2=Census Population in 2016
Georgia Environmental Finance Authority
and Environmental Finance Center
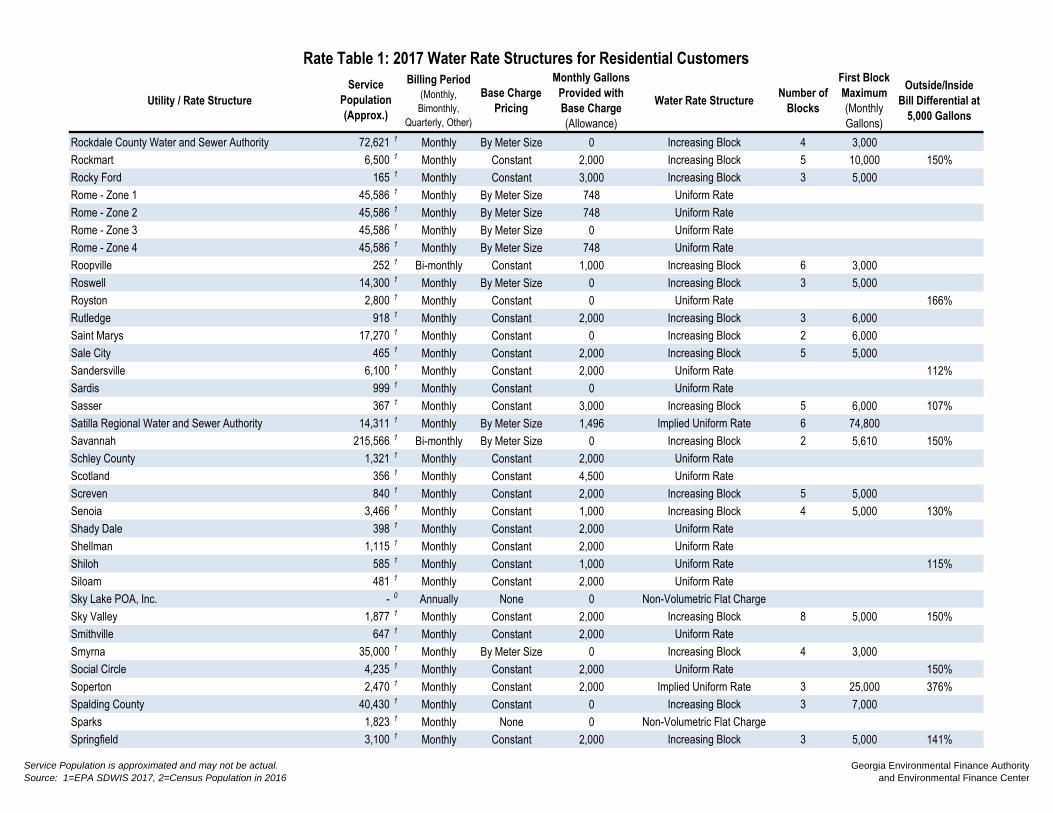
Utility / Rate Structure
Billing Period
(Monthly,
Bimonthly,
Quarterly, Other)
Base Charge
Pricing
Monthly Gallons
Provided with
Base Charge
(Allowance)
Water Rate StructureNumber of
Blocks
First Block
Maximum
(Monthly
Gallons)
Outside/Inside
Bill Differential at
5,000 Gallons
Rate Table 1: 2017 Water Rate Structures for Residential Customers
Service
Population
(Approx.)
Rockdale County Water and Sewer Authority 72,621 1 Monthly By Meter Size 0 Increasing Block 4 3,000
Rockmart 6,500 1 Monthly Constant 2,000 Increasing Block 5 10,000 150%
Rocky Ford 165 1 Monthly Constant 3,000 Increasing Block 3 5,000
Rome - Zone 1 45,586 1 Monthly By Meter Size 748 Uniform Rate
Rome - Zone 2 45,586 1 Monthly By Meter Size 748 Uniform Rate
Rome - Zone 3 45,586 1 Monthly By Meter Size 0 Uniform Rate
Rome - Zone 4 45,586 1 Monthly By Meter Size 748 Uniform Rate
Roopville 252 1 Bi-monthly Constant 1,000 Increasing Block 6 3,000
Roswell 14,300 1 Monthly By Meter Size 0 Increasing Block 3 5,000
Royston 2,800 1 Monthly Constant 0 Uniform Rate 166%
Rutledge 918 1 Monthly Constant 2,000 Increasing Block 3 6,000
Saint Marys 17,270 1 Monthly Constant 0 Increasing Block 2 6,000
Sale City 465 1 Monthly Constant 2,000 Increasing Block 5 5,000
Sandersville 6,100 1 Monthly Constant 2,000 Uniform Rate 112%
Sardis 999 1 Monthly Constant 0 Uniform Rate
Sasser 367 1 Monthly Constant 3,000 Increasing Block 5 6,000 107%
Satilla Regional Water and Sewer Authority 14,311 1 Monthly By Meter Size 1,496 Implied Uniform Rate 6 74,800
Savannah 215,566 1 Bi-monthly By Meter Size 0 Increasing Block 2 5,610 150%
Schley County 1,321 1 Monthly Constant 2,000 Uniform Rate
Scotland 356 1 Monthly Constant 4,500 Uniform Rate
Screven 840 1 Monthly Constant 2,000 Increasing Block 5 5,000
Senoia 3,466 1 Monthly Constant 1,000 Increasing Block 4 5,000 130%
Shady Dale 398 1 Monthly Constant 2,000 Uniform Rate
Shellman 1,115 1 Monthly Constant 2,000 Uniform Rate
Shiloh 585 1 Monthly Constant 1,000 Uniform Rate 115%
Siloam 481 1 Monthly Constant 2,000 Uniform Rate
Sky Lake POA, Inc. - 0 Annually None 0 Non-Volumetric Flat Charge
Sky Valley 1,877 1 Monthly Constant 2,000 Increasing Block 8 5,000 150%
Smithville 647 1 Monthly Constant 2,000 Uniform Rate
Smyrna 35,000 1 Monthly By Meter Size 0 Increasing Block 4 3,000
Social Circle 4,235 1 Monthly Constant 2,000 Uniform Rate 150%
Soperton 2,470 1 Monthly Constant 2,000 Implied Uniform Rate 3 25,000 376%
Spalding County 40,430 1 Monthly Constant 0 Increasing Block 3 7,000
Sparks 1,823 1 Monthly None 0 Non-Volumetric Flat Charge
Springfield 3,100 1 Monthly Constant 2,000 Increasing Block 3 5,000 141%
Service Population is approximated and may not be actual.
Source: 1=EPA SDWIS 2017, 2=Census Population in 2016
Georgia Environmental Finance Authority
and Environmental Finance Center
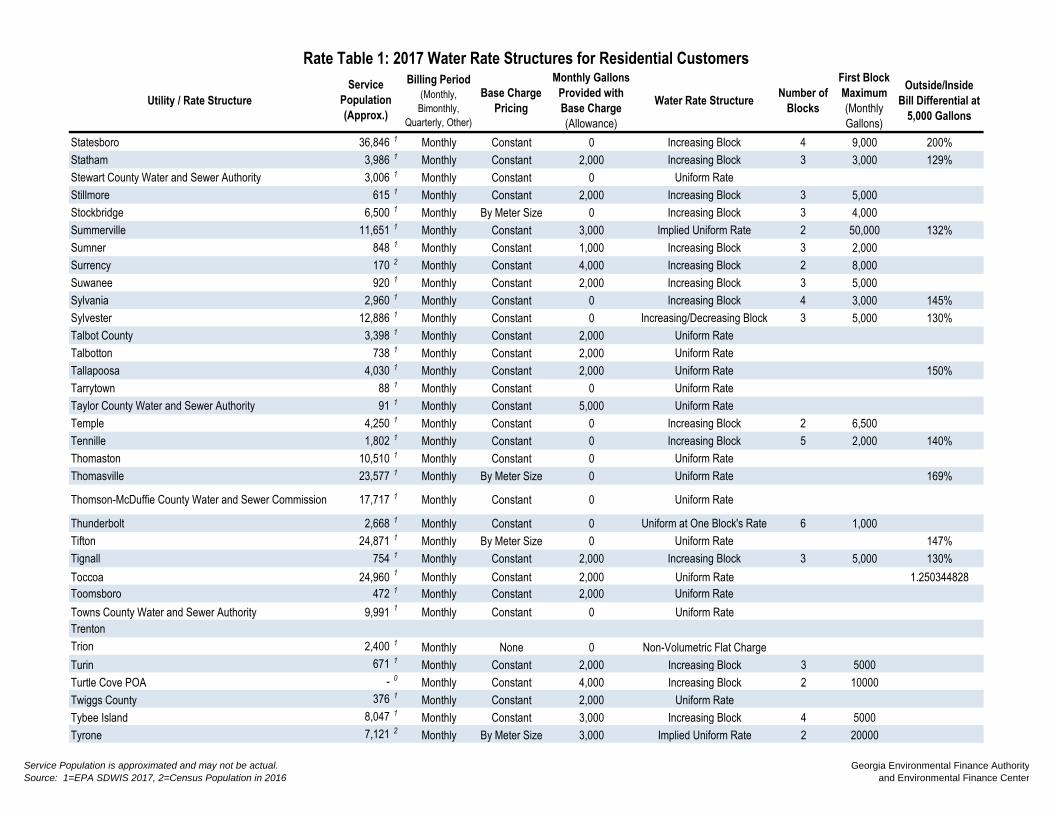
Utility / Rate Structure
Billing Period
(Monthly,
Bimonthly,
Quarterly, Other)
Base Charge
Pricing
Monthly Gallons
Provided with
Base Charge
(Allowance)
Water Rate StructureNumber of
Blocks
First Block
Maximum
(Monthly
Gallons)
Outside/Inside
Bill Differential at
5,000 Gallons
Rate Table 1: 2017 Water Rate Structures for Residential Customers
Service
Population
(Approx.)
Statesboro 36,846 1 Monthly Constant 0 Increasing Block 4 9,000 200%
Statham 3,986 1 Monthly Constant 2,000 Increasing Block 3 3,000 129%
Stewart County Water and Sewer Authority 3,006 1 Monthly Constant 0 Uniform Rate
Stillmore 615 1 Monthly Constant 2,000 Increasing Block 3 5,000
Stockbridge 6,500 1 Monthly By Meter Size 0 Increasing Block 3 4,000
Summerville 11,651 1 Monthly Constant 3,000 Implied Uniform Rate 2 50,000 132%
Sumner 848 1 Monthly Constant 1,000 Increasing Block 3 2,000
Surrency 170 2 Monthly Constant 4,000 Increasing Block 2 8,000
Suwanee 920 1 Monthly Constant 2,000 Increasing Block 3 5,000
Sylvania 2,960 1 Monthly Constant 0 Increasing Block 4 3,000 145%
Sylvester 12,886 1 Monthly Constant 0 Increasing/Decreasing Block 3 5,000 130%
Talbot County 3,398 1 Monthly Constant 2,000 Uniform Rate
Talbotton 738 1 Monthly Constant 2,000 Uniform Rate
Tallapoosa 4,030 1 Monthly Constant 2,000 Uniform Rate 150%
Tarrytown 88 1 Monthly Constant 0 Uniform Rate
Taylor County Water and Sewer Authority 91 1 Monthly Constant 5,000 Uniform Rate
Temple 4,250 1 Monthly Constant 0 Increasing Block 2 6,500
Tennille 1,802 1 Monthly Constant 0 Increasing Block 5 2,000 140%
Thomaston 10,510 1 Monthly Constant 0 Uniform Rate
Thomasville 23,577 1 Monthly By Meter Size 0 Uniform Rate 169%
Thomson-McDuffie County Water and Sewer Commission 17,717 1 Monthly Constant 0 Uniform Rate
Thunderbolt 2,668 1 Monthly Constant 0 Uniform at One Block's Rate 6 1,000
Tifton 24,871 1 Monthly By Meter Size 0 Uniform Rate 147%
Tignall 754 1 Monthly Constant 2,000 Increasing Block 3 5,000 130%
Toccoa 24,960 1
Monthly Constant 2,000 Uniform Rate 1.250344828
Toomsboro 472 1 Monthly Constant 2,000 Uniform Rate
Towns County Water and Sewer Authority 9,991 1
Monthly Constant 0 Uniform Rate
Trenton
Trion 2,400 1Monthly None 0 Non-Volumetric Flat Charge
Turin 671 1Monthly Constant 2,000 Increasing Block 3 5000
Turtle Cove POA - 0 Monthly Constant 4,000 Increasing Block 2 10000
Twiggs County 376 1Monthly Constant 2,000 Uniform Rate
Tybee Island 8,047 1Monthly Constant 3,000 Increasing Block 4 5000
Tyrone 7,121 2Monthly By Meter Size 3,000 Implied Uniform Rate 2 20000
Service Population is approximated and may not be actual.
Source: 1=EPA SDWIS 2017, 2=Census Population in 2016
Georgia Environmental Finance Authority
and Environmental Finance Center
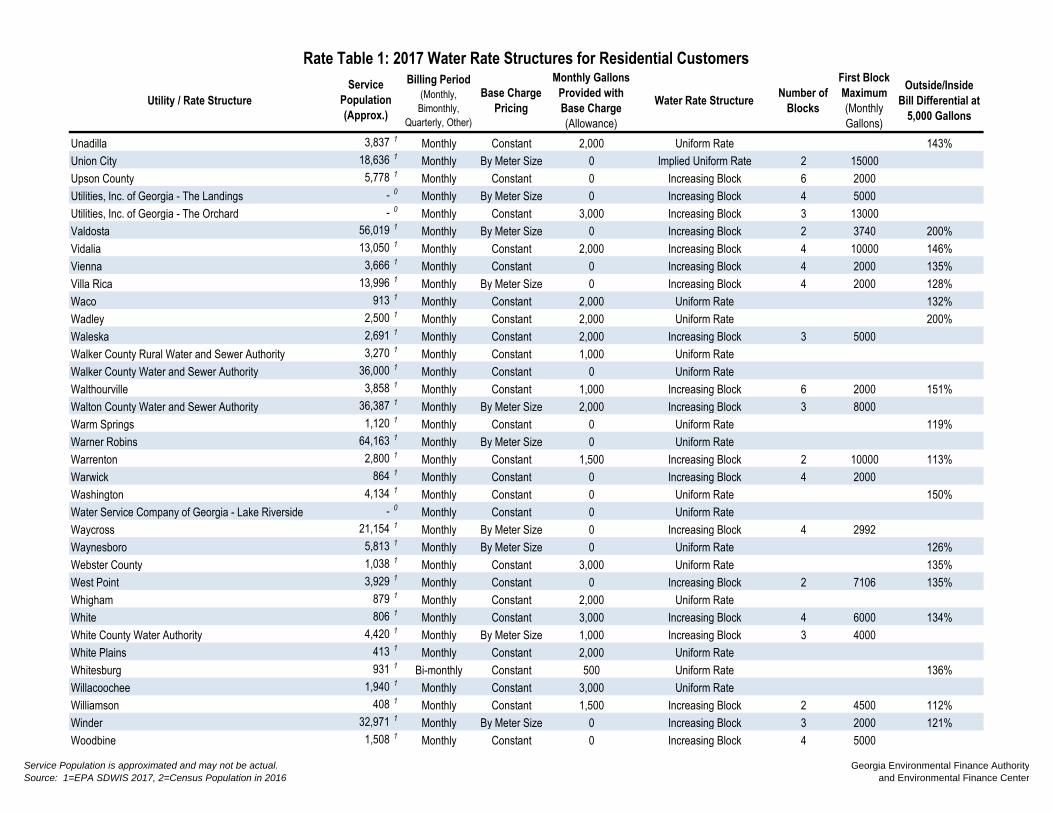
Utility / Rate Structure
Billing Period
(Monthly,
Bimonthly,
Quarterly, Other)
Base Charge
Pricing
Monthly Gallons
Provided with
Base Charge
(Allowance)
Water Rate StructureNumber of
Blocks
First Block
Maximum
(Monthly
Gallons)
Outside/Inside
Bill Differential at
5,000 Gallons
Rate Table 1: 2017 Water Rate Structures for Residential Customers
Service
Population
(Approx.)
Unadilla 3,837 1Monthly Constant 2,000 Uniform Rate 143%
Union City 18,636 1Monthly By Meter Size 0 Implied Uniform Rate 2 15000
Upson County 5,778 1Monthly Constant 0 Increasing Block 6 2000
Utilities, Inc. of Georgia - The Landings - 0 Monthly By Meter Size 0 Increasing Block 4 5000
Utilities, Inc. of Georgia - The Orchard - 0 Monthly Constant 3,000 Increasing Block 3 13000
Valdosta 56,019 1Monthly By Meter Size 0 Increasing Block 2 3740 200%
Vidalia 13,050 1Monthly Constant 2,000 Increasing Block 4 10000 146%
Vienna 3,666 1Monthly Constant 0 Increasing Block 4 2000 135%
Villa Rica 13,996 1Monthly By Meter Size 0 Increasing Block 4 2000 128%
Waco 913 1Monthly Constant 2,000 Uniform Rate 132%
Wadley 2,500 1Monthly Constant 2,000 Uniform Rate 200%
Waleska 2,691 1Monthly Constant 2,000 Increasing Block 3 5000
Walker County Rural Water and Sewer Authority 3,270 1Monthly Constant 1,000 Uniform Rate
Walker County Water and Sewer Authority 36,000 1Monthly Constant 0 Uniform Rate
Walthourville 3,858 1Monthly Constant 1,000 Increasing Block 6 2000 151%
Walton County Water and Sewer Authority 36,387 1Monthly By Meter Size 2,000 Increasing Block 3 8000
Warm Springs 1,120 1Monthly Constant 0 Uniform Rate 119%
Warner Robins 64,163 1Monthly By Meter Size 0 Uniform Rate
Warrenton 2,800 1Monthly Constant 1,500 Increasing Block 2 10000 113%
Warwick 864 1Monthly Constant 0 Increasing Block 4 2000
Washington 4,134 1Monthly Constant 0 Uniform Rate 150%
Water Service Company of Georgia - Lake Riverside - 0 Monthly Constant 0 Uniform Rate
Waycross 21,154 1Monthly By Meter Size 0 Increasing Block 4 2992
Waynesboro 5,813 1Monthly By Meter Size 0 Uniform Rate 126%
Webster County 1,038 1Monthly Constant 3,000 Uniform Rate 135%
West Point 3,929 1Monthly Constant 0 Increasing Block 2 7106 135%
Whigham 879 1Monthly Constant 2,000 Uniform Rate
White 806 1Monthly Constant 3,000 Increasing Block 4 6000 134%
White County Water Authority 4,420 1Monthly By Meter Size 1,000 Increasing Block 3 4000
White Plains 413 1Monthly Constant 2,000 Uniform Rate
Whitesburg 931 1Bi-monthly Constant 500 Uniform Rate 136%
Willacoochee 1,940 1Monthly Constant 3,000 Uniform Rate
Williamson 408 1Monthly Constant 1,500 Increasing Block 2 4500 112%
Winder 32,971 1Monthly By Meter Size 0 Increasing Block 3 2000 121%
Woodbine 1,508 1Monthly Constant 0 Increasing Block 4 5000
Service Population is approximated and may not be actual.
Source: 1=EPA SDWIS 2017, 2=Census Population in 2016
Georgia Environmental Finance Authority
and Environmental Finance Center

Utility / Rate Structure
Billing Period
(Monthly,
Bimonthly,
Quarterly, Other)
Base Charge
Pricing
Monthly Gallons
Provided with
Base Charge
(Allowance)
Water Rate StructureNumber of
Blocks
First Block
Maximum
(Monthly
Gallons)
Outside/Inside
Bill Differential at
5,000 Gallons
Rate Table 1: 2017 Water Rate Structures for Residential Customers
Service
Population
(Approx.)
Woodbury 961 1Monthly Constant 0 Increasing Block 3 5000 131%
Woodstock 10,070 1Monthly Constant 1,000 Increasing Block 2 10000
Wrens 2,375 1Monthly Constant 1,000 Increasing Block 3 6000 139%
Service Population is approximated and may not be actual.
Source: 1=EPA SDWIS 2017, 2=Census Population in 2016
Georgia Environmental Finance Authority
and Environmental Finance Center

Compare with caution. High rates may be justified and necessary to protect public health.
Inside Outside Inside Outside Inside Outside Inside Outside Inside Outside Inside Outside Inside Outside
Adel 5,311 1 1.33 $9.13 $12.16 $15.19 $18.22 $24.28 $32.81 $46.56
Adrian 664 1 0.89 $17.00 $29.25 $33.50 $37.75 $46.75 $60.25 $84.00
Ailey 527 1 0.92 $15.00 $17.00 $19.00 $21.00 $25.00 $31.00 $41.00
Alamo 3,457 1 1.00 $10.00 $11.25 $12.50 $13.75 $16.25 $20.00 $26.25
Albany 87,029 1 1.21 $11.61 $11.61 $14.12 $16.63 $21.65 $27.11 $36.21
Alcovy Shores Water Authority 432 1 0.99 $13.00 $34.00 $41.00 $48.00 $62.00 $83.00 $118.00
Allentown 175 1 1.13 $17.50 $19.50 $21.50 $23.50 $27.50 $33.50 $43.50
Alma 4,700 1 1.09 $7.00 $14.00 $14.05 $28.09 $26.55 $53.09 $39.80 $79.58 $66.30 $132.56 $106.05 $212.03 $172.30 $344.48
Alston 169 1 1.43 $18.00 $19.75 $21.50 $23.25 $27.25 $33.25 $44.25
Alto 2,500 1 $12.00 $17.00 $16.00 $22.00 $20.00 $27.00 $24.00 $32.00 $32.00 $42.00 $44.00 $57.00 $64.00 $82.00
Americus 16,255 1 1.17 $7.10 $14.20 $16.40 $32.81 $19.51 $39.01 $22.61 $45.22 $28.81 $57.62 $38.12 $76.23 $53.62 $107.25
Andersonville 400 1 $9.00 $12.00 $15.00 $18.00 $24.00 $33.00 $48.00
Arabi 429 1 0.82 $10.00 $11.20 $12.40 $13.60 $16.00 $19.60 $25.60
Argyle 211 1 1.13 $25.00 $25.00 $25.00 $25.00 $25.00 $25.00 $25.00
Arlington 1,243 1 0.86 $4.80 $15.85 $19.70 $23.55 $32.05 $44.80 $66.05
Arnoldsville 1,040 1 1.05 $18.00 $33.00 $18.00 $33.00 $21.00 $37.50 $24.00 $42.00 $31.00 $51.50 $43.00 $66.50 $63.00 $91.50
Ashburn 4,272 1 1.36 $14.00 $18.35 $19.80 $21.25 $24.75 $30.00 $43.75
Athens-Clarke County 120,266 1 1.72 $8.65 $24.85 $30.25 $37.81 $64.81 $105.31 $172.81
Atlanta 650,000 1 1.44 $6.56 $6.56 $19.70 $23.64 $26.84 $32.30 $34.54 $41.64 $51.01 $61.62 $75.71 $91.58 $116.89 $141.51
Attapulgus 715 1 0.55 $8.00 $9.00 $8.00 $9.00 $11.07 $12.45 $14.14 $15.90 $20.28 $22.80 $29.49 $33.15 $44.84 $50.40
Auburn 6,904 1 1.64 $15.00 $20.00 $31.32 $38.32 $37.32 $45.02 $43.61 $51.99 $57.28 $67.00 $79.63 $91.39 $117.38 $132.54
Augusta 204,000 1 1.08 $23.78 $23.78 $25.84 $28.38 $33.46 $41.08 $53.78
Austell 7,774 1 1.74 $8.28 $8.78 $12.49 $13.24 $16.70 $17.70 $20.91 $22.16 $29.33 $31.08 $43.85 $46.53 $68.05 $72.28
Avera 240 1 0.71 $12.00 $16.50 $18.75 $21.00 $25.60 $32.50 $44.00
Baconton 985 1 $9.42 $11.47 $15.87 $21.16 $18.02 $24.39 $20.17 $27.62 $24.47 $34.08 $30.92 $43.77 $41.67 $59.92
Bainbridge 13,546 1 1.05 $14.96 $14.96 $20.06 $21.86 $21.76 $24.16 $23.46 $26.46 $26.86 $31.06 $31.96 $37.96 $40.46 $49.46
Baldwin 4,160 1 $10.00 $19.00 $15.30 $31.50 $20.60 $37.75 $25.90 $44.00 $39.15 $62.76 $65.65 $97.14 $118.65 $159.64
Baldwin County 21,840 1 1.19 $19.00 $23.50 $28.00 $32.50 $42.60 $57.75 $85.75
Ball Ground 2,470 1 0.86 $18.00 $21.50 $24.90 $31.55 $27.40 $35.80 $29.90 $40.05 $38.20 $50.05 $51.25 $66.15 $81.25 $98.65
Banks County 6,453 1 $19.00 $25.35 $31.70 $38.05 $50.95 $70.60 $104.10
Barnesville 6,755 1 1.35 $10.00 $16.30 $14.80 $21.10 $19.60 $25.90 $24.40 $30.70 $39.00 $45.30 $56.40 $62.70 $97.75 $104.05
Barrow County Water and Sewer Authority 14,043 1 1.20 $7.50 $26.40 $32.70 $39.00 $51.60 $70.50 $112.55
Bartow 286 1 0.83 $14.00 $20.50 $15.30 $22.30 $16.60 $24.10 $17.90 $25.90 $20.50 $29.50 $24.40 $34.90 $30.90 $43.90
Bartow County 50,162 1 1.15 $6.49 $22.57 $27.93 $33.29 $46.67 $69.42 $109.57
Barwick 497 1 0.80 $12.00 $27.25 $32.50 $37.75 $48.75 $65.75 $94.50
Baxley 4,737 2 0.91 $11.35 $17.00 $14.75 $22.10 $18.15 $27.20 $21.55 $32.30 $28.35 $42.50 $38.55 $57.80 $55.55 $83.30
Bent Tree 0 $37.90 $45.00 $52.67 $60.62 $82.92 $116.37 $181.12
Berlin 575 1 $15.00 $19.50 $21.00 $22.50 $25.50 $30.00 $37.50
Blackshear 5,811 1 0.93 $13.56 $16.25 $18.94 $21.63 $27.09 $35.28 $49.08
Blairsville 4,035 1 1.51 $14.50 $18.90 $17.40 $22.75 $20.30 $26.60 $23.20 $30.45 $30.50 $39.60 $43.70 $55.50 $65.70 $82.00
Blakely 4,855 1 $16.00 $17.00 $21.52 $22.58 $23.36 $24.44 $25.20 $26.30 $28.88 $30.02 $34.40 $35.60 $44.30 $45.60
Bloomingdale 1,690 1 1.08 $18.00 $18.00 $20.25 $22.50 $27.00 $33.75 $47.50
Blue Ridge 5,506 1 1.45 $17.00 $21.00 $35.00 $48.00 $41.00 $57.00 $47.00 $66.00 $59.00 $84.00 $77.00 $111.00 $117.00 $166.00
Blythe 1,004 1 0.91 $18.50 $19.45 $21.34 $23.23 $27.01 $32.68 $42.13
Boston 1,378 1 0.80 $11.00 $13.50 $16.00 $18.50 $23.50 $31.00 $43.50
Bowdon 6,045 1 $19.50 $31.00 $22.58 $34.86 $25.66 $38.72 $28.74 $42.58 $34.90 $50.30 $44.14 $61.88 $59.54 $81.18
Bowersville 512 1 0.73 $18.00 $26.00 $30.00 $34.00 $42.00 $58.00 $88.00
Bowman 862 1 $15.90 $19.80 $22.40 $25.00 $30.20 $38.00 $51.00
7,000 Gallons
(936 cf)
10,000 Gallons
(1,337 cf)
15,000 Gallons
(2,005 cf)
4,000 Gallons
(535 cf)
Operating
Ratio
(FY2016)
Rate Table 2: 2017 Residential Monthly-Equivalent Water Bills at Various Consumption Levels (Includes Base Charges)
Utility / Rate StructureService Population
(Approx.)
Zero Gallons
(0 cf)
3,000 Gallons
(401 cf)
5,000 Gallons
(668 cf)
Service Population is approximated and may not be actual.
Source: 1=EPA SDWIS 2017, 2=Census Population in 2016 *Based on data from FY2015 or earlierGeorgia Environmental Finance Authority
and Environmental Finance Center
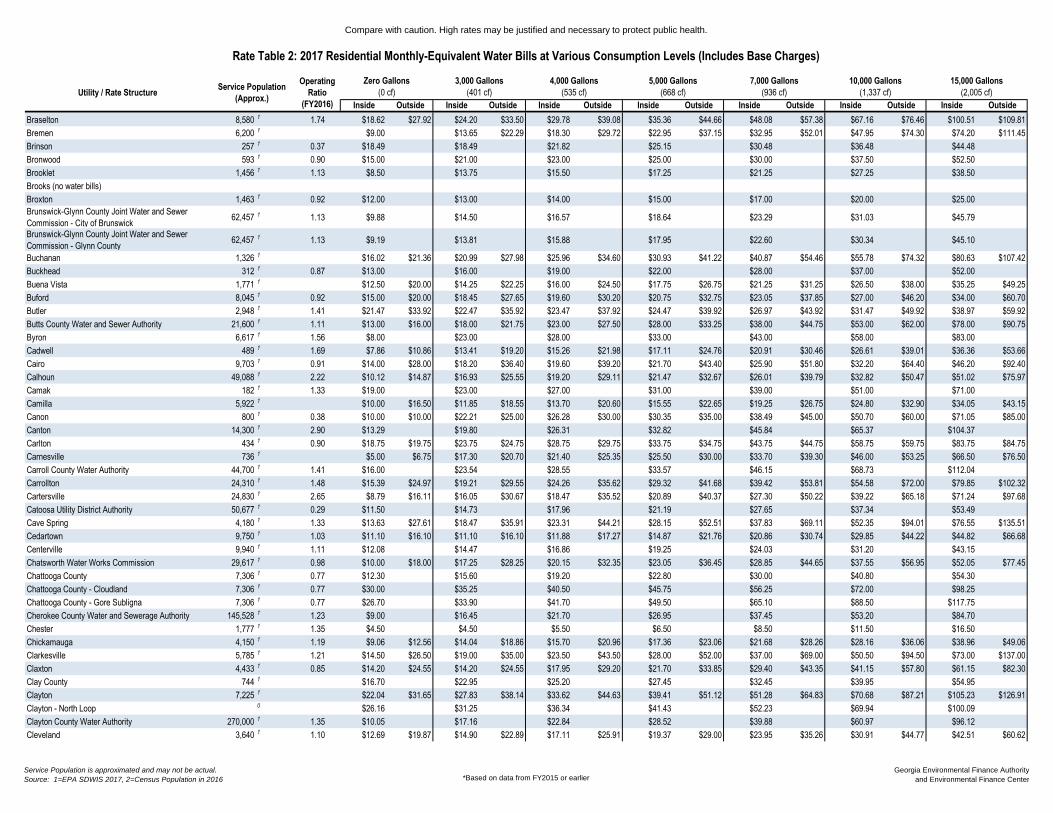
Compare with caution. High rates may be justified and necessary to protect public health.
Inside Outside Inside Outside Inside Outside Inside Outside Inside Outside Inside Outside Inside Outside
7,000 Gallons
(936 cf)
10,000 Gallons
(1,337 cf)
15,000 Gallons
(2,005 cf)
4,000 Gallons
(535 cf)
Operating
Ratio
(FY2016)
Rate Table 2: 2017 Residential Monthly-Equivalent Water Bills at Various Consumption Levels (Includes Base Charges)
Utility / Rate StructureService Population
(Approx.)
Zero Gallons
(0 cf)
3,000 Gallons
(401 cf)
5,000 Gallons
(668 cf)
Braselton 8,580 1 1.74 $18.62 $27.92 $24.20 $33.50 $29.78 $39.08 $35.36 $44.66 $48.08 $57.38 $67.16 $76.46 $100.51 $109.81
Bremen 6,200 1 $9.00 $13.65 $22.29 $18.30 $29.72 $22.95 $37.15 $32.95 $52.01 $47.95 $74.30 $74.20 $111.45
Brinson 257 1 0.37 $18.49 $18.49 $21.82 $25.15 $30.48 $36.48 $44.48
Bronwood 593 1 0.90 $15.00 $21.00 $23.00 $25.00 $30.00 $37.50 $52.50
Brooklet 1,456 1 1.13 $8.50 $13.75 $15.50 $17.25 $21.25 $27.25 $38.50
Brooks (no water bills)
Broxton 1,463 1 0.92 $12.00 $13.00 $14.00 $15.00 $17.00 $20.00 $25.00
Brunswick-Glynn County Joint Water and Sewer
Commission - City of Brunswick 62,457 1 1.13 $9.88 $14.50 $16.57 $18.64 $23.29 $31.03 $45.79
Brunswick-Glynn County Joint Water and Sewer
Commission - Glynn County 62,457 1 1.13 $9.19 $13.81 $15.88 $17.95 $22.60 $30.34 $45.10
Buchanan 1,326 1 $16.02 $21.36 $20.99 $27.98 $25.96 $34.60 $30.93 $41.22 $40.87 $54.46 $55.78 $74.32 $80.63 $107.42
Buckhead 312 1 0.87 $13.00 $16.00 $19.00 $22.00 $28.00 $37.00 $52.00
Buena Vista 1,771 1 $12.50 $20.00 $14.25 $22.25 $16.00 $24.50 $17.75 $26.75 $21.25 $31.25 $26.50 $38.00 $35.25 $49.25
Buford 8,045 1 0.92 $15.00 $20.00 $18.45 $27.65 $19.60 $30.20 $20.75 $32.75 $23.05 $37.85 $27.00 $46.20 $34.00 $60.70
Butler 2,948 1 1.41 $21.47 $33.92 $22.47 $35.92 $23.47 $37.92 $24.47 $39.92 $26.97 $43.92 $31.47 $49.92 $38.97 $59.92
Butts County Water and Sewer Authority 21,600 1 1.11 $13.00 $16.00 $18.00 $21.75 $23.00 $27.50 $28.00 $33.25 $38.00 $44.75 $53.00 $62.00 $78.00 $90.75
Byron 6,617 1 1.56 $8.00 $23.00 $28.00 $33.00 $43.00 $58.00 $83.00
Cadwell 489 1 1.69 $7.86 $10.86 $13.41 $19.20 $15.26 $21.98 $17.11 $24.76 $20.91 $30.46 $26.61 $39.01 $36.36 $53.66
Cairo 9,703 1 0.91 $14.00 $28.00 $18.20 $36.40 $19.60 $39.20 $21.70 $43.40 $25.90 $51.80 $32.20 $64.40 $46.20 $92.40
Calhoun 49,088 1 2.22 $10.12 $14.87 $16.93 $25.55 $19.20 $29.11 $21.47 $32.67 $26.01 $39.79 $32.82 $50.47 $51.02 $75.97
Camak 182 1 1.33 $19.00 $23.00 $27.00 $31.00 $39.00 $51.00 $71.00
Camilla 5,922 1 $10.00 $16.50 $11.85 $18.55 $13.70 $20.60 $15.55 $22.65 $19.25 $26.75 $24.80 $32.90 $34.05 $43.15
Canon 800 1 0.38 $10.00 $10.00 $22.21 $25.00 $26.28 $30.00 $30.35 $35.00 $38.49 $45.00 $50.70 $60.00 $71.05 $85.00
Canton 14,300 1 2.90 $13.29 $19.80 $26.31 $32.82 $45.84 $65.37 $104.37
Carlton 434 1 0.90 $18.75 $19.75 $23.75 $24.75 $28.75 $29.75 $33.75 $34.75 $43.75 $44.75 $58.75 $59.75 $83.75 $84.75
Carnesville 736 1 $5.00 $6.75 $17.30 $20.70 $21.40 $25.35 $25.50 $30.00 $33.70 $39.30 $46.00 $53.25 $66.50 $76.50
Carroll County Water Authority 44,700 1 1.41 $16.00 $23.54 $28.55 $33.57 $46.15 $68.73 $112.04
Carrollton 24,310 1 1.48 $15.39 $24.97 $19.21 $29.55 $24.26 $35.62 $29.32 $41.68 $39.42 $53.81 $54.58 $72.00 $79.85 $102.32
Cartersville 24,830 1 2.65 $8.79 $16.11 $16.05 $30.67 $18.47 $35.52 $20.89 $40.37 $27.30 $50.22 $39.22 $65.18 $71.24 $97.68
Catoosa Utility District Authority 50,677 1 0.29 $11.50 $14.73 $17.96 $21.19 $27.65 $37.34 $53.49
Cave Spring 4,180 1 1.33 $13.63 $27.61 $18.47 $35.91 $23.31 $44.21 $28.15 $52.51 $37.83 $69.11 $52.35 $94.01 $76.55 $135.51
Cedartown 9,750 1 1.03 $11.10 $16.10 $11.10 $16.10 $11.88 $17.27 $14.87 $21.76 $20.86 $30.74 $29.85 $44.22 $44.82 $66.68
Centerville 9,940 1 1.11 $12.08 $14.47 $16.86 $19.25 $24.03 $31.20 $43.15
Chatsworth Water Works Commission 29,617 1 0.98 $10.00 $18.00 $17.25 $28.25 $20.15 $32.35 $23.05 $36.45 $28.85 $44.65 $37.55 $56.95 $52.05 $77.45
Chattooga County 7,306 1 0.77 $12.30 $15.60 $19.20 $22.80 $30.00 $40.80 $54.30
Chattooga County - Cloudland 7,306 1 0.77 $30.00 $35.25 $40.50 $45.75 $56.25 $72.00 $98.25
Chattooga County - Gore Subligna 7,306 1 0.77 $26.70 $33.90 $41.70 $49.50 $65.10 $88.50 $117.75
Cherokee County Water and Sewerage Authority 145,528 1 1.23 $9.00 $16.45 $21.70 $26.95 $37.45 $53.20 $84.70
Chester 1,777 1 1.35 $4.50 $4.50 $5.50 $6.50 $8.50 $11.50 $16.50
Chickamauga 4,150 1 1.19 $9.06 $12.56 $14.04 $18.86 $15.70 $20.96 $17.36 $23.06 $21.68 $28.26 $28.16 $36.06 $38.96 $49.06
Clarkesville 5,785 1 1.21 $14.50 $26.50 $19.00 $35.00 $23.50 $43.50 $28.00 $52.00 $37.00 $69.00 $50.50 $94.50 $73.00 $137.00
Claxton 4,433 1 0.85 $14.20 $24.55 $14.20 $24.55 $17.95 $29.20 $21.70 $33.85 $29.40 $43.35 $41.15 $57.80 $61.15 $82.30
Clay County 744 1 $16.70 $22.95 $25.20 $27.45 $32.45 $39.95 $54.95
Clayton 7,225 1 $22.04 $31.65 $27.83 $38.14 $33.62 $44.63 $39.41 $51.12 $51.28 $64.83 $70.68 $87.21 $105.23 $126.91
Clayton - North Loop 0 $26.16 $31.25 $36.34 $41.43 $52.23 $69.94 $100.09
Clayton County Water Authority 270,000 1 1.35 $10.05 $17.16 $22.84 $28.52 $39.88 $60.97 $96.12
Cleveland 3,640 1 1.10 $12.69 $19.87 $14.90 $22.89 $17.11 $25.91 $19.37 $29.00 $23.95 $35.26 $30.91 $44.77 $42.51 $60.62
Service Population is approximated and may not be actual.
Source: 1=EPA SDWIS 2017, 2=Census Population in 2016 *Based on data from FY2015 or earlierGeorgia Environmental Finance Authority
and Environmental Finance Center
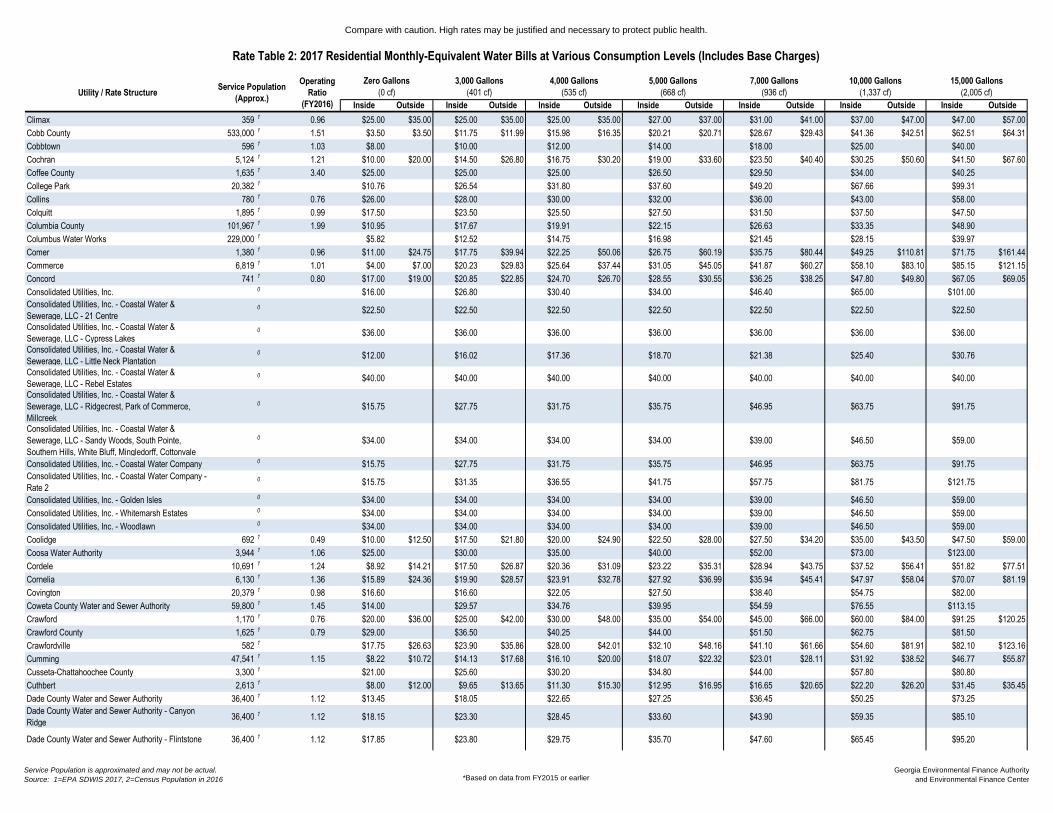
Compare with caution. High rates may be justified and necessary to protect public health.
Inside Outside Inside Outside Inside Outside Inside Outside Inside Outside Inside Outside Inside Outside
7,000 Gallons
(936 cf)
10,000 Gallons
(1,337 cf)
15,000 Gallons
(2,005 cf)
4,000 Gallons
(535 cf)
Operating
Ratio
(FY2016)
Rate Table 2: 2017 Residential Monthly-Equivalent Water Bills at Various Consumption Levels (Includes Base Charges)
Utility / Rate StructureService Population
(Approx.)
Zero Gallons
(0 cf)
3,000 Gallons
(401 cf)
5,000 Gallons
(668 cf)
Climax 359 1 0.96 $25.00 $35.00 $25.00 $35.00 $25.00 $35.00 $27.00 $37.00 $31.00 $41.00 $37.00 $47.00 $47.00 $57.00
Cobb County 533,000 1 1.51 $3.50 $3.50 $11.75 $11.99 $15.98 $16.35 $20.21 $20.71 $28.67 $29.43 $41.36 $42.51 $62.51 $64.31
Cobbtown 596 1 1.03 $8.00 $10.00 $12.00 $14.00 $18.00 $25.00 $40.00
Cochran 5,124 1 1.21 $10.00 $20.00 $14.50 $26.80 $16.75 $30.20 $19.00 $33.60 $23.50 $40.40 $30.25 $50.60 $41.50 $67.60
Coffee County 1,635 1 3.40 $25.00 $25.00 $25.00 $26.50 $29.50 $34.00 $40.25
College Park 20,382 1 $10.76 $26.54 $31.80 $37.60 $49.20 $67.66 $99.31
Collins 780 1 0.76 $26.00 $28.00 $30.00 $32.00 $36.00 $43.00 $58.00
Colquitt 1,895 1 0.99 $17.50 $23.50 $25.50 $27.50 $31.50 $37.50 $47.50
Columbia County 101,967 1 1.99 $10.95 $17.67 $19.91 $22.15 $26.63 $33.35 $48.90
Columbus Water Works 229,000 1 $5.82 $12.52 $14.75 $16.98 $21.45 $28.15 $39.97
Comer 1,380 1 0.96 $11.00 $24.75 $17.75 $39.94 $22.25 $50.06 $26.75 $60.19 $35.75 $80.44 $49.25 $110.81 $71.75 $161.44
Commerce 6,819 1 1.01 $4.00 $7.00 $20.23 $29.83 $25.64 $37.44 $31.05 $45.05 $41.87 $60.27 $58.10 $83.10 $85.15 $121.15
Concord 741 1 0.80 $17.00 $19.00 $20.85 $22.85 $24.70 $26.70 $28.55 $30.55 $36.25 $38.25 $47.80 $49.80 $67.05 $69.05
Consolidated Utilities, Inc. 0 $16.00 $26.80 $30.40 $34.00 $46.40 $65.00 $101.00
Consolidated Utilities, Inc. - Coastal Water &
Sewerage, LLC - 21 Centre 0 $22.50 $22.50 $22.50 $22.50 $22.50 $22.50 $22.50
Consolidated Utilities, Inc. - Coastal Water &
Sewerage, LLC - Cypress Lakes 0 $36.00 $36.00 $36.00 $36.00 $36.00 $36.00 $36.00
Consolidated Utilities, Inc. - Coastal Water &
Sewerage, LLC - Little Neck Plantation 0 $12.00 $16.02 $17.36 $18.70 $21.38 $25.40 $30.76
Consolidated Utilities, Inc. - Coastal Water &
Sewerage, LLC - Rebel Estates 0 $40.00 $40.00 $40.00 $40.00 $40.00 $40.00 $40.00
Consolidated Utilities, Inc. - Coastal Water &
Sewerage, LLC - Ridgecrest, Park of Commerce,
Millcreek
0 $15.75 $27.75 $31.75 $35.75 $46.95 $63.75 $91.75
Consolidated Utilities, Inc. - Coastal Water &
Sewerage, LLC - Sandy Woods, South Pointe,
Southern Hills, White Bluff, Mingledorff, Cottonvale
0 $34.00 $34.00 $34.00 $34.00 $39.00 $46.50 $59.00
Consolidated Utilities, Inc. - Coastal Water Company 0 $15.75 $27.75 $31.75 $35.75 $46.95 $63.75 $91.75
Consolidated Utilities, Inc. - Coastal Water Company -
Rate 2 0 $15.75 $31.35 $36.55 $41.75 $57.75 $81.75 $121.75
Consolidated Utilities, Inc. - Golden Isles 0 $34.00 $34.00 $34.00 $34.00 $39.00 $46.50 $59.00
Consolidated Utilities, Inc. - Whitemarsh Estates 0 $34.00 $34.00 $34.00 $34.00 $39.00 $46.50 $59.00
Consolidated Utilities, Inc. - Woodlawn 0 $34.00 $34.00 $34.00 $34.00 $39.00 $46.50 $59.00
Coolidge 692 1 0.49 $10.00 $12.50 $17.50 $21.80 $20.00 $24.90 $22.50 $28.00 $27.50 $34.20 $35.00 $43.50 $47.50 $59.00
Coosa Water Authority 3,944 1 1.06 $25.00 $30.00 $35.00 $40.00 $52.00 $73.00 $123.00
Cordele 10,691 1 1.24 $8.92 $14.21 $17.50 $26.87 $20.36 $31.09 $23.22 $35.31 $28.94 $43.75 $37.52 $56.41 $51.82 $77.51
Cornelia 6,130 1 1.36 $15.89 $24.36 $19.90 $28.57 $23.91 $32.78 $27.92 $36.99 $35.94 $45.41 $47.97 $58.04 $70.07 $81.19
Covington 20,379 1 0.98 $16.60 $16.60 $22.05 $27.50 $38.40 $54.75 $82.00
Coweta County Water and Sewer Authority 59,800 1 1.45 $14.00 $29.57 $34.76 $39.95 $54.59 $76.55 $113.15
Crawford 1,170 1 0.76 $20.00 $36.00 $25.00 $42.00 $30.00 $48.00 $35.00 $54.00 $45.00 $66.00 $60.00 $84.00 $91.25 $120.25
Crawford County 1,625 1 0.79 $29.00 $36.50 $40.25 $44.00 $51.50 $62.75 $81.50
Crawfordville 582 1 $17.75 $26.63 $23.90 $35.86 $28.00 $42.01 $32.10 $48.16 $41.10 $61.66 $54.60 $81.91 $82.10 $123.16
Cumming 47,541 1 1.15 $8.22 $10.72 $14.13 $17.68 $16.10 $20.00 $18.07 $22.32 $23.01 $28.11 $31.92 $38.52 $46.77 $55.87
Cusseta-Chattahoochee County 3,300 1 $21.00 $25.60 $30.20 $34.80 $44.00 $57.80 $80.80
Cuthbert 2,613 1 $8.00 $12.00 $9.65 $13.65 $11.30 $15.30 $12.95 $16.95 $16.65 $20.65 $22.20 $26.20 $31.45 $35.45
Dade County Water and Sewer Authority 36,400 1 1.12 $13.45 $18.05 $22.65 $27.25 $36.45 $50.25 $73.25
Dade County Water and Sewer Authority - Canyon
Ridge 36,400 1 1.12 $18.15 $23.30 $28.45 $33.60 $43.90 $59.35 $85.10
Dade County Water and Sewer Authority - Flintstone 36,400 1 1.12 $17.85 $23.80 $29.75 $35.70 $47.60 $65.45 $95.20
Service Population is approximated and may not be actual.
Source: 1=EPA SDWIS 2017, 2=Census Population in 2016 *Based on data from FY2015 or earlierGeorgia Environmental Finance Authority
and Environmental Finance Center
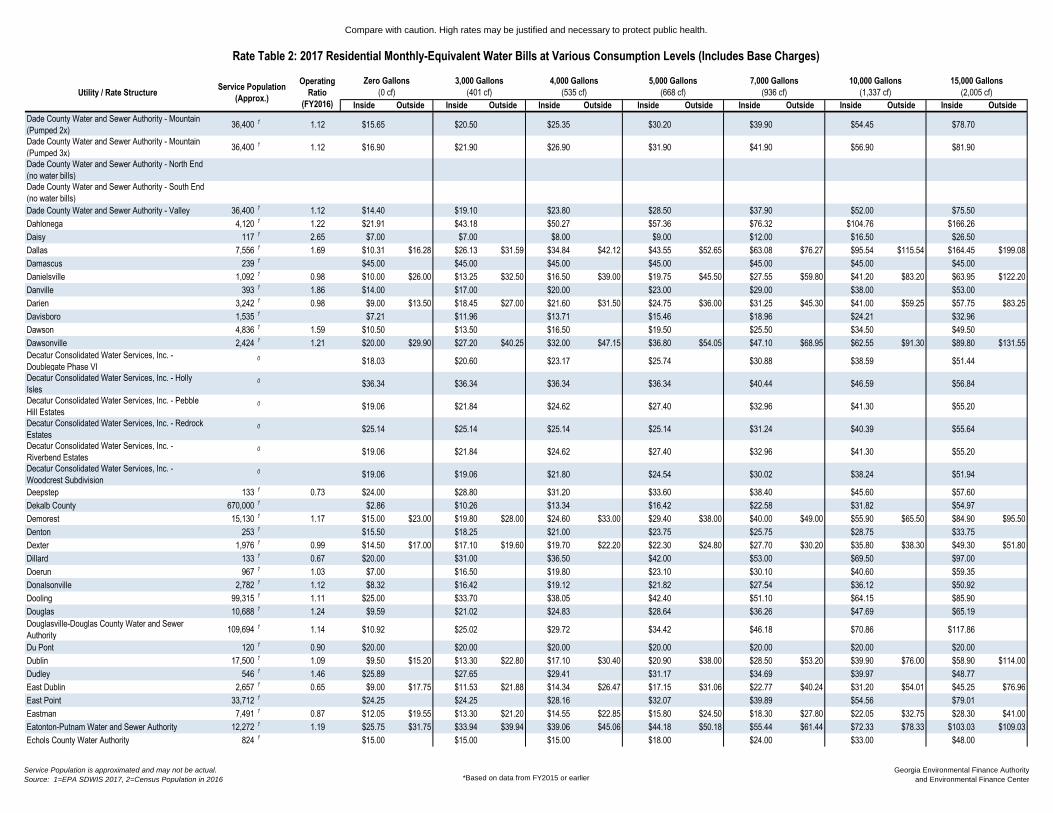
Compare with caution. High rates may be justified and necessary to protect public health.
Inside Outside Inside Outside Inside Outside Inside Outside Inside Outside Inside Outside Inside Outside
7,000 Gallons
(936 cf)
10,000 Gallons
(1,337 cf)
15,000 Gallons
(2,005 cf)
4,000 Gallons
(535 cf)
Operating
Ratio
(FY2016)
Rate Table 2: 2017 Residential Monthly-Equivalent Water Bills at Various Consumption Levels (Includes Base Charges)
Utility / Rate StructureService Population
(Approx.)
Zero Gallons
(0 cf)
3,000 Gallons
(401 cf)
5,000 Gallons
(668 cf)
Dade County Water and Sewer Authority - Mountain
(Pumped 2x) 36,400 1 1.12 $15.65 $20.50 $25.35 $30.20 $39.90 $54.45 $78.70
Dade County Water and Sewer Authority - Mountain
(Pumped 3x) 36,400 1 1.12 $16.90 $21.90 $26.90 $31.90 $41.90 $56.90 $81.90
Dade County Water and Sewer Authority - North End
(no water bills)
Dade County Water and Sewer Authority - South End
(no water bills)
Dade County Water and Sewer Authority - Valley 36,400 1 1.12 $14.40 $19.10 $23.80 $28.50 $37.90 $52.00 $75.50
Dahlonega 4,120 1 1.22 $21.91 $43.18 $50.27 $57.36 $76.32 $104.76 $166.26
Daisy 117 1 2.65 $7.00 $7.00 $8.00 $9.00 $12.00 $16.50 $26.50
Dallas 7,556 1 1.69 $10.31 $16.28 $26.13 $31.59 $34.84 $42.12 $43.55 $52.65 $63.08 $76.27 $95.54 $115.54 $164.45 $199.08
Damascus 239 1 $45.00 $45.00 $45.00 $45.00 $45.00 $45.00 $45.00
Danielsville 1,092 1 0.98 $10.00 $26.00 $13.25 $32.50 $16.50 $39.00 $19.75 $45.50 $27.55 $59.80 $41.20 $83.20 $63.95 $122.20
Danville 393 1 1.86 $14.00 $17.00 $20.00 $23.00 $29.00 $38.00 $53.00
Darien 3,242 1 0.98 $9.00 $13.50 $18.45 $27.00 $21.60 $31.50 $24.75 $36.00 $31.25 $45.30 $41.00 $59.25 $57.75 $83.25
Davisboro 1,535 1 $7.21 $11.96 $13.71 $15.46 $18.96 $24.21 $32.96
Dawson 4,836 1 1.59 $10.50 $13.50 $16.50 $19.50 $25.50 $34.50 $49.50
Dawsonville 2,424 1 1.21 $20.00 $29.90 $27.20 $40.25 $32.00 $47.15 $36.80 $54.05 $47.10 $68.95 $62.55 $91.30 $89.80 $131.55
Decatur Consolidated Water Services, Inc. -
Doublegate Phase VI 0 $18.03 $20.60 $23.17 $25.74 $30.88 $38.59 $51.44
Decatur Consolidated Water Services, Inc. - Holly
Isles 0 $36.34 $36.34 $36.34 $36.34 $40.44 $46.59 $56.84
Decatur Consolidated Water Services, Inc. - Pebble
Hill Estates 0 $19.06 $21.84 $24.62 $27.40 $32.96 $41.30 $55.20
Decatur Consolidated Water Services, Inc. - Redrock
Estates 0 $25.14 $25.14 $25.14 $25.14 $31.24 $40.39 $55.64
Decatur Consolidated Water Services, Inc. -
Riverbend Estates 0 $19.06 $21.84 $24.62 $27.40 $32.96 $41.30 $55.20
Decatur Consolidated Water Services, Inc. -
Woodcrest Subdivision 0 $19.06 $19.06 $21.80 $24.54 $30.02 $38.24 $51.94
Deepstep 133 1 0.73 $24.00 $28.80 $31.20 $33.60 $38.40 $45.60 $57.60
Dekalb County 670,000 1 $2.86 $10.26 $13.34 $16.42 $22.58 $31.82 $54.97
Demorest 15,130 1 1.17 $15.00 $23.00 $19.80 $28.00 $24.60 $33.00 $29.40 $38.00 $40.00 $49.00 $55.90 $65.50 $84.90 $95.50
Denton 253 1 $15.50 $18.25 $21.00 $23.75 $25.75 $28.75 $33.75
Dexter 1,976 1 0.99 $14.50 $17.00 $17.10 $19.60 $19.70 $22.20 $22.30 $24.80 $27.70 $30.20 $35.80 $38.30 $49.30 $51.80
Dillard 133 1 0.67 $20.00 $31.00 $36.50 $42.00 $53.00 $69.50 $97.00
Doerun 967 1 1.03 $7.00 $16.50 $19.80 $23.10 $30.10 $40.60 $59.35
Donalsonville 2,782 1 1.12 $8.32 $16.42 $19.12 $21.82 $27.54 $36.12 $50.92
Dooling 99,315 1 1.11 $25.00 $33.70 $38.05 $42.40 $51.10 $64.15 $85.90
Douglas 10,688 1 1.24 $9.59 $21.02 $24.83 $28.64 $36.26 $47.69 $65.19
Douglasville-Douglas County Water and Sewer
Authority 109,694 1 1.14 $10.92 $25.02 $29.72 $34.42 $46.18 $70.86 $117.86
Du Pont 120 1 0.90 $20.00 $20.00 $20.00 $20.00 $20.00 $20.00 $20.00
Dublin 17,500 1 1.09 $9.50 $15.20 $13.30 $22.80 $17.10 $30.40 $20.90 $38.00 $28.50 $53.20 $39.90 $76.00 $58.90 $114.00
Dudley 546 1 1.46 $25.89 $27.65 $29.41 $31.17 $34.69 $39.97 $48.77
East Dublin 2,657 1 0.65 $9.00 $17.75 $11.53 $21.88 $14.34 $26.47 $17.15 $31.06 $22.77 $40.24 $31.20 $54.01 $45.25 $76.96
East Point 33,712 1 $24.25 $24.25 $28.16 $32.07 $39.89 $54.56 $79.01
Eastman 7,491 1 0.87 $12.05 $19.55 $13.30 $21.20 $14.55 $22.85 $15.80 $24.50 $18.30 $27.80 $22.05 $32.75 $28.30 $41.00
Eatonton-Putnam Water and Sewer Authority 12,272 1 1.19 $25.75 $31.75 $33.94 $39.94 $39.06 $45.06 $44.18 $50.18 $55.44 $61.44 $72.33 $78.33 $103.03 $109.03
Echols County Water Authority 824 1 $15.00 $15.00 $15.00 $18.00 $24.00 $33.00 $48.00
Service Population is approximated and may not be actual.
Source: 1=EPA SDWIS 2017, 2=Census Population in 2016 *Based on data from FY2015 or earlierGeorgia Environmental Finance Authority
and Environmental Finance Center
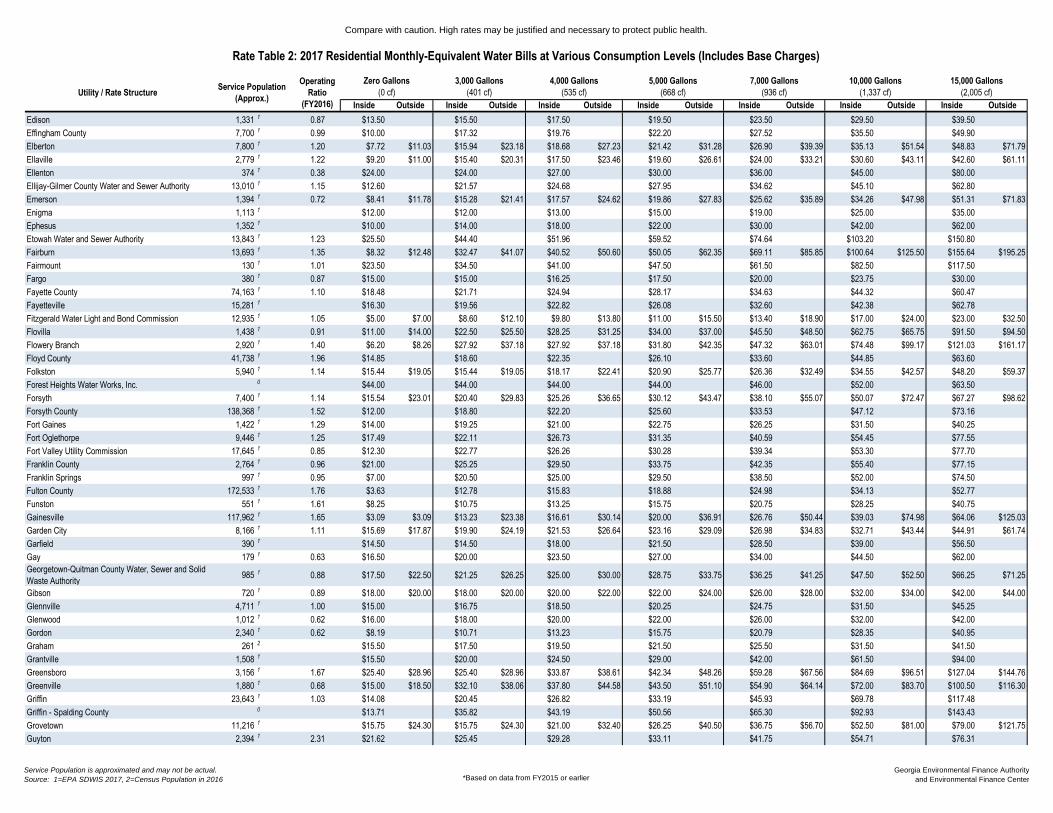
Compare with caution. High rates may be justified and necessary to protect public health.
Inside Outside Inside Outside Inside Outside Inside Outside Inside Outside Inside Outside Inside Outside
7,000 Gallons
(936 cf)
10,000 Gallons
(1,337 cf)
15,000 Gallons
(2,005 cf)
4,000 Gallons
(535 cf)
Operating
Ratio
(FY2016)
Rate Table 2: 2017 Residential Monthly-Equivalent Water Bills at Various Consumption Levels (Includes Base Charges)
Utility / Rate StructureService Population
(Approx.)
Zero Gallons
(0 cf)
3,000 Gallons
(401 cf)
5,000 Gallons
(668 cf)
Edison 1,331 1 0.87 $13.50 $15.50 $17.50 $19.50 $23.50 $29.50 $39.50
Effingham County 7,700 1 0.99 $10.00 $17.32 $19.76 $22.20 $27.52 $35.50 $49.90
Elberton 7,800 1 1.20 $7.72 $11.03 $15.94 $23.18 $18.68 $27.23 $21.42 $31.28 $26.90 $39.39 $35.13 $51.54 $48.83 $71.79
Ellaville 2,779 1 1.22 $9.20 $11.00 $15.40 $20.31 $17.50 $23.46 $19.60 $26.61 $24.00 $33.21 $30.60 $43.11 $42.60 $61.11
Ellenton 374 1 0.38 $24.00 $24.00 $27.00 $30.00 $36.00 $45.00 $80.00
Ellijay-Gilmer County Water and Sewer Authority 13,010 1 1.15 $12.60 $21.57 $24.68 $27.95 $34.62 $45.10 $62.80
Emerson 1,394 1 0.72 $8.41 $11.78 $15.28 $21.41 $17.57 $24.62 $19.86 $27.83 $25.62 $35.89 $34.26 $47.98 $51.31 $71.83
Enigma 1,113 1 $12.00 $12.00 $13.00 $15.00 $19.00 $25.00 $35.00
Ephesus 1,352 1 $10.00 $14.00 $18.00 $22.00 $30.00 $42.00 $62.00
Etowah Water and Sewer Authority 13,843 1 1.23 $25.50 $44.40 $51.96 $59.52 $74.64 $103.20 $150.80
Fairburn 13,693 1 1.35 $8.32 $12.48 $32.47 $41.07 $40.52 $50.60 $50.05 $62.35 $69.11 $85.85 $100.64 $125.50 $155.64 $195.25
Fairmount 130 1 1.01 $23.50 $34.50 $41.00 $47.50 $61.50 $82.50 $117.50
Fargo 380 1 0.87 $15.00 $15.00 $16.25 $17.50 $20.00 $23.75 $30.00
Fayette County 74,163 1 1.10 $18.48 $21.71 $24.94 $28.17 $34.63 $44.32 $60.47
Fayetteville 15,281 1 $16.30 $19.56 $22.82 $26.08 $32.60 $42.38 $62.78
Fitzgerald Water Light and Bond Commission 12,935 1 1.05 $5.00 $7.00 $8.60 $12.10 $9.80 $13.80 $11.00 $15.50 $13.40 $18.90 $17.00 $24.00 $23.00 $32.50
Flovilla 1,438 1 0.91 $11.00 $14.00 $22.50 $25.50 $28.25 $31.25 $34.00 $37.00 $45.50 $48.50 $62.75 $65.75 $91.50 $94.50
Flowery Branch 2,920 1 1.40 $6.20 $8.26 $27.92 $37.18 $27.92 $37.18 $31.80 $42.35 $47.32 $63.01 $74.48 $99.17 $121.03 $161.17
Floyd County 41,738 1 1.96 $14.85 $18.60 $22.35 $26.10 $33.60 $44.85 $63.60
Folkston 5,940 1 1.14 $15.44 $19.05 $15.44 $19.05 $18.17 $22.41 $20.90 $25.77 $26.36 $32.49 $34.55 $42.57 $48.20 $59.37
Forest Heights Water Works, Inc. 0 $44.00 $44.00 $44.00 $44.00 $46.00 $52.00 $63.50
Forsyth 7,400 1 1.14 $15.54 $23.01 $20.40 $29.83 $25.26 $36.65 $30.12 $43.47 $38.10 $55.07 $50.07 $72.47 $67.27 $98.62
Forsyth County 138,368 1 1.52 $12.00 $18.80 $22.20 $25.60 $33.53 $47.12 $73.16
Fort Gaines 1,422 1 1.29 $14.00 $19.25 $21.00 $22.75 $26.25 $31.50 $40.25
Fort Oglethorpe 9,446 1 1.25 $17.49 $22.11 $26.73 $31.35 $40.59 $54.45 $77.55
Fort Valley Utility Commission 17,645 1 0.85 $12.30 $22.77 $26.26 $30.28 $39.34 $53.30 $77.70
Franklin County 2,764 1 0.96 $21.00 $25.25 $29.50 $33.75 $42.35 $55.40 $77.15
Franklin Springs 997 1 0.95 $7.00 $20.50 $25.00 $29.50 $38.50 $52.00 $74.50
Fulton County 172,533 1 1.76 $3.63 $12.78 $15.83 $18.88 $24.98 $34.13 $52.77
Funston 551 1 1.61 $8.25 $10.75 $13.25 $15.75 $20.75 $28.25 $40.75
Gainesville 117,962 1 1.65 $3.09 $3.09 $13.23 $23.38 $16.61 $30.14 $20.00 $36.91 $26.76 $50.44 $39.03 $74.98 $64.06 $125.03
Garden City 8,166 1 1.11 $15.69 $17.87 $19.90 $24.19 $21.53 $26.64 $23.16 $29.09 $26.98 $34.83 $32.71 $43.44 $44.91 $61.74
Garfield 390 1 $14.50 $14.50 $18.00 $21.50 $28.50 $39.00 $56.50
Gay 179 1 0.63 $16.50 $20.00 $23.50 $27.00 $34.00 $44.50 $62.00
Georgetown-Quitman County Water, Sewer and Solid
Waste Authority 985 1 0.88 $17.50 $22.50 $21.25 $26.25 $25.00 $30.00 $28.75 $33.75 $36.25 $41.25 $47.50 $52.50 $66.25 $71.25
Gibson 720 1 0.89 $18.00 $20.00 $18.00 $20.00 $20.00 $22.00 $22.00 $24.00 $26.00 $28.00 $32.00 $34.00 $42.00 $44.00
Glennville 4,711 1 1.00 $15.00 $16.75 $18.50 $20.25 $24.75 $31.50 $45.25
Glenwood 1,012 1 0.62 $16.00 $18.00 $20.00 $22.00 $26.00 $32.00 $42.00
Gordon 2,340 1 0.62 $8.19 $10.71 $13.23 $15.75 $20.79 $28.35 $40.95
Graham 261 2 $15.50 $17.50 $19.50 $21.50 $25.50 $31.50 $41.50
Grantville 1,508 1 $15.50 $20.00 $24.50 $29.00 $42.00 $61.50 $94.00
Greensboro 3,156 1 1.67 $25.40 $28.96 $25.40 $28.96 $33.87 $38.61 $42.34 $48.26 $59.28 $67.56 $84.69 $96.51 $127.04 $144.76
Greenville 1,880 1 0.68 $15.00 $18.50 $32.10 $38.06 $37.80 $44.58 $43.50 $51.10 $54.90 $64.14 $72.00 $83.70 $100.50 $116.30
Griffin 23,643 1 1.03 $14.08 $20.45 $26.82 $33.19 $45.93 $69.78 $117.48
Griffin - Spalding County 0 $13.71 $35.82 $43.19 $50.56 $65.30 $92.93 $143.43
Grovetown 11,216 1 $15.75 $24.30 $15.75 $24.30 $21.00 $32.40 $26.25 $40.50 $36.75 $56.70 $52.50 $81.00 $79.00 $121.75
Guyton 2,394 1 2.31 $21.62 $25.45 $29.28 $33.11 $41.75 $54.71 $76.31
Service Population is approximated and may not be actual.
Source: 1=EPA SDWIS 2017, 2=Census Population in 2016 *Based on data from FY2015 or earlierGeorgia Environmental Finance Authority
and Environmental Finance Center

Compare with caution. High rates may be justified and necessary to protect public health.
Inside Outside Inside Outside Inside Outside Inside Outside Inside Outside Inside Outside Inside Outside
7,000 Gallons
(936 cf)
10,000 Gallons
(1,337 cf)
15,000 Gallons
(2,005 cf)
4,000 Gallons
(535 cf)
Operating
Ratio
(FY2016)
Rate Table 2: 2017 Residential Monthly-Equivalent Water Bills at Various Consumption Levels (Includes Base Charges)
Utility / Rate StructureService Population
(Approx.)
Zero Gallons
(0 cf)
3,000 Gallons
(401 cf)
5,000 Gallons
(668 cf)
Gwinnett County 795,657 1 1.56 $7.50 $22.26 $27.18 $32.10 $41.94 $61.62 $105.90
Hahira 2,846 1 0.86 $15.39 $22.82 $15.39 $22.82 $19.10 $26.53 $22.81 $30.24 $30.23 $37.66 $41.36 $48.79 $59.91 $67.34
Hall County (no water bills)
Hamilton 928 1 1.52 $12.00 $19.00 $23.00 $27.00 $35.00 $47.00 $72.00
Hampton 7,305 1 1.11 $9.25 $24.16 $29.13 $34.11 $45.82 $66.04 $115.39
Hancock County 900 1 0.35 $24.00 $27.75 $31.50 $35.25 $42.75 $54.00 $72.75
Hapeville 5,385 1 1.39 $17.56 $26.34 $35.12 $43.90 $61.46 $88.02 $142.92
Haralson County Water Authority 11,362 1 1.07 $15.00 $18.98 $22.96 $26.94 $35.57 $49.52 $84.52
Harlem 5,356 1 1.01 $13.93 $27.86 $17.72 $35.82 $21.51 $43.78 $25.30 $51.74 $32.88 $67.66 $44.25 $91.54 $63.20 $131.34
Harris County 20,062 1 1.29 $13.60 $23.92 $29.08 $34.24 $44.56 $60.04 $85.84
Harrison 500 1 0.44 $10.00 $12.70 $15.40 $18.10 $23.50 $31.60 $45.10
Hart County Water and Sewer Authority 3,606 1 1.10 $19.00 $25.60 $28.90 $32.20 $38.80 $48.70 $73.45
Hartford Water Authority 487 1 $24.00 $27.50 $31.00 $34.50 $41.50 $52.00 $69.50
Hartwell 7,116 1 1.13 $11.77 $19.43 $15.02 $23.85 $18.27 $28.27 $21.52 $32.69 $28.02 $41.53 $37.77 $54.79 $54.02 $76.89
Hawkinsville 4,856 1 1.12 $11.00 $22.00 $12.43 $23.43 $15.28 $26.28 $18.13 $29.13 $23.83 $34.83 $32.38 $43.38 $46.63 $57.63
Hazlehurst 5,800 1 1.09 $15.00 $22.50 $17.25 $25.87 $19.50 $29.24 $21.75 $32.61 $26.25 $39.35 $33.00 $49.46 $44.25 $66.31
Heard County Water Authority 8,172 1 0.85 $13.95 $28.95 $33.95 $38.95 $48.95 $63.95 $96.45
Helen 1,851 1 0.87 $8.00 $15.50 $15.35 $25.49 $17.80 $28.82 $20.25 $32.15 $25.65 $39.55 $33.75 $50.65 $47.25 $69.15
Henry County Water Authority 218,667 1 0.88 $12.39 $18.59 $26.70 $40.05 $31.47 $47.21 $36.24 $54.36 $47.51 $71.27 $67.01 $100.52 $114.51 $171.77
Hephzibah 4,500 1 0.84 $11.00 $11.78 $13.33 $14.88 $17.98 $22.63 $31.38
Hiawassee - above booster 5,496 1 1.04 $22.03 $25.33 $30.43 $34.93 $34.63 $39.73 $38.83 $44.53 $47.23 $54.13 $59.83 $68.53 $80.83 $92.53
Hiawassee - below booster 5,496 1 1.04 $19.27 $22.16 $27.67 $31.76 $31.87 $36.56 $36.07 $41.36 $44.47 $50.96 $57.07 $65.36 $78.07 $89.36
Hiltonia 392 1 1.12 $17.50 $17.50 $17.50 $19.75 $24.50 $32.50 $47.50
Hinesville 23,400 1 0.89 $13.71 $20.57 $13.71 $20.57 $15.85 $23.78 $17.99 $26.99 $22.27 $33.41 $29.29 $43.94 $41.59 $62.39
Hiram 858 1 0.68 $11.00 $16.50 $22.00 $27.50 $41.25 $71.50 $126.50
Hoboken 463 1 1.31 $10.00 $14.80 $16.40 $18.00 $21.60 $27.00 $37.00
Hogansville 3,728 1 0.74 $9.50 $12.75 $22.88 $31.74 $27.34 $38.07 $31.80 $44.40 $44.24 $62.34 $62.90 $89.25 $94.00 $134.10
Homeland 995 1 1.04 $13.50 $14.85 $18.00 $19.80 $22.50 $24.75 $27.00 $29.70 $37.00 $40.70 $52.00 $57.20 $77.00 $84.70
Homer 950 1 0.83 $14.00 $14.00 $18.50 $23.00 $32.00 $45.50 $68.00
Hoschton 1,547 1 0.90 $15.38 $30.77 $35.90 $43.23 $59.35 $93.04 $155.29
Houston County 69,747 1 0.98 $9.00 $9.89 $11.66 $13.43 $16.97 $22.28 $31.13
Ideal 450 1 0.91 $18.34 $21.34 $22.84 $24.34 $27.34 $31.84 $39.34
Ila 437 1 0.75 $21.00 $27.50 $34.00 $40.50 $50.75 $62.00 $80.75
Iron City 411 1 0.78 $20.00 $20.00 $20.00 $20.00 $20.00 $20.00 $20.00
Irwinton 1,817 1 $17.50 $21.50 $25.50 $29.50 $37.50 $49.50 $69.50
Ivey 1,086 1 $12.50 $15.00 $17.50 $20.00 $25.00 $32.50 $45.00
Jackson 4,950 2 1.26 $12.00 $14.00 $14.75 $18.13 $17.50 $22.26 $20.25 $26.39 $25.75 $34.65 $34.00 $47.04 $47.75 $67.69
Jackson County Water and Sewer Authority 19,191 1 1.20 $12.00 $30.48 $36.64 $42.80 $59.29 $94.75 $156.30
Jacksonville 200 1 0.77 $15.00 $15.00 $15.00 $15.00 $15.00 $15.00 $15.00
Jakin 252 1 0.53 $25.00 $25.00 $25.00 $25.00 $26.69 $31.76 $40.21
Jasper 9,850 1 1.08 $15.00 $25.00 $21.75 $34.75 $24.00 $38.00 $26.25 $41.25 $30.75 $47.75 $37.50 $57.50 $48.75 $73.75
Jekyll Island Authority 2,083 1 $9.52 $15.73 $17.80 $19.87 $24.01 $31.00 $44.25
Jenkinsburg 366 2 0.92 $13.00 $16.00 $18.00 $21.75 $23.00 $27.50 $28.00 $33.25 $38.00 $44.75 $53.00 $62.00 $78.00 $90.75
Jesup 10,200 1 0.99 $5.00 $11.88 $14.24 $16.60 $21.52 $28.90 $41.70
Jones County 10,795 1 0.86 $18.00 $21.64 $25.28 $28.92 $36.20 $47.12 $65.32
Keysville 351 1 0.92 $20.00 $22.69 $25.38 $28.07 $33.45 $41.52 $54.97
Kingsland 18,697 1 1.36 $12.65 $18.65 $19.04 $27.50 $21.17 $30.45 $23.30 $33.40 $27.90 $39.64 $35.31 $49.51 $47.66 $65.96
Kingston 1,263 1 1.38 $8.00 $12.00 $20.00 $30.00 $24.00 $36.00 $28.00 $42.00 $45.00 $67.50 $72.00 $108.00 $102.00 $153.00
Service Population is approximated and may not be actual.
Source: 1=EPA SDWIS 2017, 2=Census Population in 2016 *Based on data from FY2015 or earlierGeorgia Environmental Finance Authority
and Environmental Finance Center
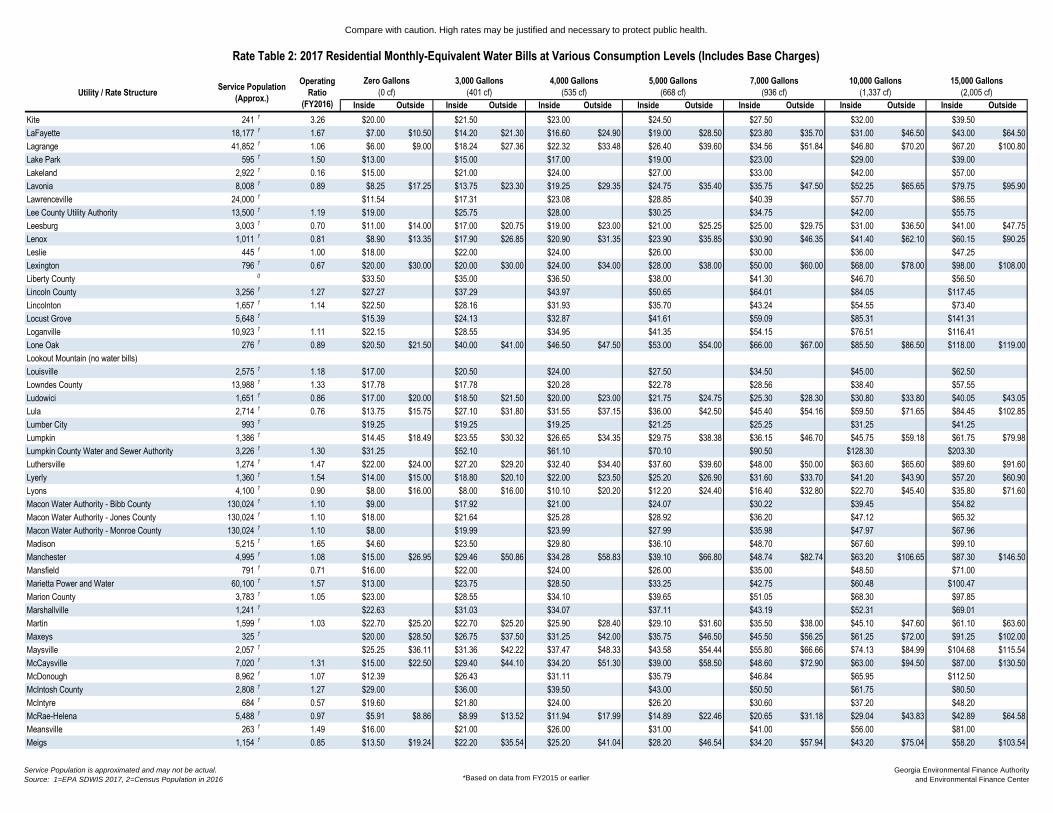
Compare with caution. High rates may be justified and necessary to protect public health.
Inside Outside Inside Outside Inside Outside Inside Outside Inside Outside Inside Outside Inside Outside
7,000 Gallons
(936 cf)
10,000 Gallons
(1,337 cf)
15,000 Gallons
(2,005 cf)
4,000 Gallons
(535 cf)
Operating
Ratio
(FY2016)
Rate Table 2: 2017 Residential Monthly-Equivalent Water Bills at Various Consumption Levels (Includes Base Charges)
Utility / Rate StructureService Population
(Approx.)
Zero Gallons
(0 cf)
3,000 Gallons
(401 cf)
5,000 Gallons
(668 cf)
Kite 241 1 3.26 $20.00 $21.50 $23.00 $24.50 $27.50 $32.00 $39.50
LaFayette 18,177 1 1.67 $7.00 $10.50 $14.20 $21.30 $16.60 $24.90 $19.00 $28.50 $23.80 $35.70 $31.00 $46.50 $43.00 $64.50
Lagrange 41,852 1 1.06 $6.00 $9.00 $18.24 $27.36 $22.32 $33.48 $26.40 $39.60 $34.56 $51.84 $46.80 $70.20 $67.20 $100.80
Lake Park 595 1 1.50 $13.00 $15.00 $17.00 $19.00 $23.00 $29.00 $39.00
Lakeland 2,922 1 0.16 $15.00 $21.00 $24.00 $27.00 $33.00 $42.00 $57.00
Lavonia 8,008 1 0.89 $8.25 $17.25 $13.75 $23.30 $19.25 $29.35 $24.75 $35.40 $35.75 $47.50 $52.25 $65.65 $79.75 $95.90
Lawrenceville 24,000 1 $11.54 $17.31 $23.08 $28.85 $40.39 $57.70 $86.55
Lee County Utility Authority 13,500 1 1.19 $19.00 $25.75 $28.00 $30.25 $34.75 $42.00 $55.75
Leesburg 3,003 1 0.70 $11.00 $14.00 $17.00 $20.75 $19.00 $23.00 $21.00 $25.25 $25.00 $29.75 $31.00 $36.50 $41.00 $47.75
Lenox 1,011 1 0.81 $8.90 $13.35 $17.90 $26.85 $20.90 $31.35 $23.90 $35.85 $30.90 $46.35 $41.40 $62.10 $60.15 $90.25
Leslie 445 1 1.00 $18.00 $22.00 $24.00 $26.00 $30.00 $36.00 $47.25
Lexington 796 1 0.67 $20.00 $30.00 $20.00 $30.00 $24.00 $34.00 $28.00 $38.00 $50.00 $60.00 $68.00 $78.00 $98.00 $108.00
Liberty County 0 $33.50 $35.00 $36.50 $38.00 $41.30 $46.70 $56.50
Lincoln County 3,256 1 1.27 $27.27 $37.29 $43.97 $50.65 $64.01 $84.05 $117.45
Lincolnton 1,657 1 1.14 $22.50 $28.16 $31.93 $35.70 $43.24 $54.55 $73.40
Locust Grove 5,648 1 $15.39 $24.13 $32.87 $41.61 $59.09 $85.31 $141.31
Loganville 10,923 1 1.11 $22.15 $28.55 $34.95 $41.35 $54.15 $76.51 $116.41
Lone Oak 276 1 0.89 $20.50 $21.50 $40.00 $41.00 $46.50 $47.50 $53.00 $54.00 $66.00 $67.00 $85.50 $86.50 $118.00 $119.00
Lookout Mountain (no water bills)
Louisville 2,575 1 1.18 $17.00 $20.50 $24.00 $27.50 $34.50 $45.00 $62.50
Lowndes County 13,988 1 1.33 $17.78 $17.78 $20.28 $22.78 $28.56 $38.40 $57.55
Ludowici 1,651 1 0.86 $17.00 $20.00 $18.50 $21.50 $20.00 $23.00 $21.75 $24.75 $25.30 $28.30 $30.80 $33.80 $40.05 $43.05
Lula 2,714 1 0.76 $13.75 $15.75 $27.10 $31.80 $31.55 $37.15 $36.00 $42.50 $45.40 $54.16 $59.50 $71.65 $84.45 $102.85
Lumber City 993 1 $19.25 $19.25 $19.25 $21.25 $25.25 $31.25 $41.25
Lumpkin 1,386 1 $14.45 $18.49 $23.55 $30.32 $26.65 $34.35 $29.75 $38.38 $36.15 $46.70 $45.75 $59.18 $61.75 $79.98
Lumpkin County Water and Sewer Authority 3,226 1 1.30 $31.25 $52.10 $61.10 $70.10 $90.50 $128.30 $203.30
Luthersville 1,274 1 1.47 $22.00 $24.00 $27.20 $29.20 $32.40 $34.40 $37.60 $39.60 $48.00 $50.00 $63.60 $65.60 $89.60 $91.60
Lyerly 1,360 1 1.54 $14.00 $15.00 $18.80 $20.10 $22.00 $23.50 $25.20 $26.90 $31.60 $33.70 $41.20 $43.90 $57.20 $60.90
Lyons 4,100 1 0.90 $8.00 $16.00 $8.00 $16.00 $10.10 $20.20 $12.20 $24.40 $16.40 $32.80 $22.70 $45.40 $35.80 $71.60
Macon Water Authority - Bibb County 130,024 1 1.10 $9.00 $17.92 $21.00 $24.07 $30.22 $39.45 $54.82
Macon Water Authority - Jones County 130,024 1 1.10 $18.00 $21.64 $25.28 $28.92 $36.20 $47.12 $65.32
Macon Water Authority - Monroe County 130,024 1 1.10 $8.00 $19.99 $23.99 $27.99 $35.98 $47.97 $67.96
Madison 5,215 1 1.65 $4.60 $23.50 $29.80 $36.10 $48.70 $67.60 $99.10
Manchester 4,995 1 1.08 $15.00 $26.95 $29.46 $50.86 $34.28 $58.83 $39.10 $66.80 $48.74 $82.74 $63.20 $106.65 $87.30 $146.50
Mansfield 791 1 0.71 $16.00 $22.00 $24.00 $26.00 $35.00 $48.50 $71.00
Marietta Power and Water 60,100 1 1.57 $13.00 $23.75 $28.50 $33.25 $42.75 $60.48 $100.47
Marion County 3,783 1 1.05 $23.00 $28.55 $34.10 $39.65 $51.05 $68.30 $97.85
Marshallville 1,241 1 $22.63 $31.03 $34.07 $37.11 $43.19 $52.31 $69.01
Martin 1,599 1 1.03 $22.70 $25.20 $22.70 $25.20 $25.90 $28.40 $29.10 $31.60 $35.50 $38.00 $45.10 $47.60 $61.10 $63.60
Maxeys 325 1 $20.00 $28.50 $26.75 $37.50 $31.25 $42.00 $35.75 $46.50 $45.50 $56.25 $61.25 $72.00 $91.25 $102.00
Maysville 2,057 1 $25.25 $36.11 $31.36 $42.22 $37.47 $48.33 $43.58 $54.44 $55.80 $66.66 $74.13 $84.99 $104.68 $115.54
McCaysville 7,020 1 1.31 $15.00 $22.50 $29.40 $44.10 $34.20 $51.30 $39.00 $58.50 $48.60 $72.90 $63.00 $94.50 $87.00 $130.50
McDonough 8,962 1 1.07 $12.39 $26.43 $31.11 $35.79 $46.84 $65.95 $112.50
McIntosh County 2,808 1 1.27 $29.00 $36.00 $39.50 $43.00 $50.50 $61.75 $80.50
McIntyre 684 1 0.57 $19.60 $21.80 $24.00 $26.20 $30.60 $37.20 $48.20
McRae-Helena 5,488 1 0.97 $5.91 $8.86 $8.99 $13.52 $11.94 $17.99 $14.89 $22.46 $20.65 $31.18 $29.04 $43.83 $42.89 $64.58
Meansville 263 1 1.49 $16.00 $21.00 $26.00 $31.00 $41.00 $56.00 $81.00
Meigs 1,154 1 0.85 $13.50 $19.24 $22.20 $35.54 $25.20 $41.04 $28.20 $46.54 $34.20 $57.94 $43.20 $75.04 $58.20 $103.54
Service Population is approximated and may not be actual.
Source: 1=EPA SDWIS 2017, 2=Census Population in 2016 *Based on data from FY2015 or earlierGeorgia Environmental Finance Authority
and Environmental Finance Center

Compare with caution. High rates may be justified and necessary to protect public health.
Inside Outside Inside Outside Inside Outside Inside Outside Inside Outside Inside Outside Inside Outside
7,000 Gallons
(936 cf)
10,000 Gallons
(1,337 cf)
15,000 Gallons
(2,005 cf)
4,000 Gallons
(535 cf)
Operating
Ratio
(FY2016)
Rate Table 2: 2017 Residential Monthly-Equivalent Water Bills at Various Consumption Levels (Includes Base Charges)
Utility / Rate StructureService Population
(Approx.)
Zero Gallons
(0 cf)
3,000 Gallons
(401 cf)
5,000 Gallons
(668 cf)
Menlo 949 1 1.38 $12.00 $20.00 $16.50 $33.88 $21.00 $43.13 $25.50 $52.38 $34.50 $70.88 $48.00 $98.63 $70.50 $144.88
Metter 4,776 1 0.95 $9.00 $13.60 $16.36 $19.12 $24.64 $32.92 $47.32
Midville 700 1 0.63 $6.25 $8.25 $10.00 $13.89 $11.25 $15.77 $12.50 $17.65 $15.50 $22.15 $20.00 $28.90 $28.75 $42.05
Midway 2,595 1 1.49 $16.39 $18.34 $21.14 $24.04 $22.89 $26.14 $24.64 $28.24 $28.64 $33.04 $34.64 $40.24 $45.89 $53.74
Milledgeville 19,456 1 0.96 $12.89 $20.48 $12.89 $20.48 $15.74 $25.18 $18.59 $29.88 $24.29 $39.28 $32.84 $53.38 $47.09 $76.88
Millen 4,000 1 1.22 $12.00 $16.00 $18.21 $25.24 $20.28 $28.32 $22.35 $31.40 $26.49 $37.56 $32.81 $46.80 $43.71 $62.20
Milner 902 1 $16.00 $22.00 $22.00 $28.50 $28.00 $35.00 $34.00 $41.50 $46.50 $55.00 $65.25 $75.25 $97.75 $110.25
Mitchell 325 1 0.94 $17.00 $31.00 $23.00 $37.00 $26.00 $40.00 $29.00 $43.00 $35.00 $49.00 $44.00 $58.00 $59.00 $73.00
Molena 467 1 1.09 $14.00 $19.75 $25.50 $31.25 $42.75 $63.00 $96.75
Monroe 21,739 1 1.20 $11.25 $15.00 $22.01 $31.15 $27.39 $39.22 $32.77 $47.29 $44.88 $65.46 $65.07 $95.76 $105.42 $156.36
Monroe County 6,653 1 0.55 $12.00 $20.88 $25.32 $29.76 $38.64 $51.96 $74.16
Montezuma 3,443 1 1.08 $6.00 $18.50 $23.00 $27.50 $36.50 $50.00 $75.00
Monticello 3,505 1 1.46 $24.00 $27.50 $31.00 $36.50 $47.60 $64.40 $92.40
Morganton 2,060 1 $31.00 $34.50 $35.00 $39.50 $39.00 $44.50 $43.00 $49.50 $51.00 $59.50 $63.00 $74.50 $83.00 $99.50
Morven 601 1 0.74 $15.15 $24.40 $27.65 $30.90 $37.90 $48.40 $67.15
Moultrie 15,634 1 1.46 $20.50 $22.90 $25.30 $27.70 $32.50 $39.70 $51.70
Mount Airy 1,384 1 0.98 $16.00 $28.00 $20.88 $32.50 $24.04 $36.25 $27.49 $40.25 $35.26 $49.00 $49.06 $64.00 $87.81 $114.00
Mount Zion 1,638 1 $11.38 $16.38 $15.73 $20.73 $20.08 $25.08 $24.43 $29.43 $33.13 $38.13 $46.18 $51.18 $67.93 $72.93
Mountain Park 798 1 $7.22 $20.55 $32.75 $48.45 $86.85 $144.45 $240.45
MSO Water Systems, Inc. 0 $39.00 $39.00 $39.00 $39.00 $41.00 $47.00 $60.00
MSO Water Systems, Inc. - Briarcrest 0 $39.00 $39.00 $39.00 $39.00 $41.00 $48.00 $66.00
MSO Water Systems, Inc. - English Oaks 0 $33.00 $33.00 $35.50 $38.00 $43.00 $51.00 $66.00
Nahunta 1,074 1 1.25 $7.00 $14.75 $17.50 $20.25 $25.75 $34.00 $47.75
Nashville 4,896 1 1.32 $7.95 $13.20 $15.20 $17.20 $21.70 $28.45 $40.95
Newborn 832 1 1.52 $16.52 $21.52 $24.18 $33.01 $28.01 $36.84 $31.84 $40.67 $39.50 $48.33 $50.99 $59.82 $70.14 $78.97
Newington 227 1 0.74 $17.00 $18.50 $20.00 $21.50 $24.80 $29.85 $39.85
Newnan Utilities 34,000 1 $12.25 $23.53 $27.29 $32.93 $44.21 $64.85 $102.35
Newton 681 1 $19.00 $19.00 $19.00 $19.00 $19.00 $21.00 $26.00
Newton County Water and Sewer Authority 62,384 1 1.31 $11.72 $30.00 $20.33 $30.00 $26.81 $40.00 $33.29 $50.00 $46.25 $70.00 $68.47 $100.00 $107.82 $150.00
Nicholls 2,745 1 1.09 $6.36 $9.41 $10.46 $11.51 $13.61 $16.76 $22.01
Nicholson Water Authority 2,857 1 0.94 $13.00 $25.50 $31.75 $38.00 $51.00 $71.25 $112.50
Norman Park 1,173 1 0.96 $8.50 $11.82 $16.25 $23.45 $19.00 $27.58 $21.75 $31.71 $27.75 $40.71 $36.75 $54.21 $53.00 $78.61
Norwood 364 1 $9.00 $10.10 $11.20 $12.30 $14.50 $17.80 $23.30
Notla Water Authority 13,465 1 1.10 $19.00 $22.95 $26.90 $30.85 $38.75 $50.60 $70.35
Oakwood - Flowery Branch (no water bills)
Oakwood - Gainesville (no water bills)
Ochlocknee 789 1 0.54 $11.00 $11.80 $13.00 $14.60 $14.00 $16.00 $15.00 $17.40 $17.00 $20.20 $20.00 $24.40 $25.00 $31.40
Ocilla 2,540 1 1.01 $10.25 $20.25 $11.75 $21.75 $13.25 $23.25 $14.75 $24.75 $17.75 $27.75 $22.25 $32.25 $29.75 $39.75
Oconee 280 1 0.31 $15.00 $17.00 $18.00 $19.00 $21.00 $24.00 $29.00
Oconee County 19,279 1 2.44 $16.90 $30.35 $35.53 $40.71 $51.07 $72.34 $109.69
Odum 645 1 0.68 $10.50 $13.50 $15.00 $16.50 $20.00 $25.25 $34.50
Oxford 2,214 1 1.35 $19.77 $19.77 $26.36 $32.95 $46.13 $65.90 $98.85
Palmetto 3,965 1 $14.65 $19.65 $24.65 $29.65 $39.65 $56.65 $86.65
Parrott 229 1 0.86 $11.00 $18.80 $21.40 $24.00 $29.50 $38.20 $54.30
Patterson 972 1 0.85 $17.50 $21.50 $23.50 $30.50 $25.75 $33.88 $28.00 $37.26 $33.00 $44.76 $40.50 $56.01 $54.25 $76.66
Paulding County 113,204 1 1.04 $6.00 $29.13 $36.84 $44.55 $59.97 $84.64 $127.04
Pavo 741 1 0.61 $11.00 $16.00 $17.00 $24.80 $20.00 $29.20 $23.00 $33.60 $29.00 $42.40 $38.00 $55.60 $53.00 $77.60
Service Population is approximated and may not be actual.
Source: 1=EPA SDWIS 2017, 2=Census Population in 2016 *Based on data from FY2015 or earlierGeorgia Environmental Finance Authority
and Environmental Finance Center

Compare with caution. High rates may be justified and necessary to protect public health.
Inside Outside Inside Outside Inside Outside Inside Outside Inside Outside Inside Outside Inside Outside
7,000 Gallons
(936 cf)
10,000 Gallons
(1,337 cf)
15,000 Gallons
(2,005 cf)
4,000 Gallons
(535 cf)
Operating
Ratio
(FY2016)
Rate Table 2: 2017 Residential Monthly-Equivalent Water Bills at Various Consumption Levels (Includes Base Charges)
Utility / Rate StructureService Population
(Approx.)
Zero Gallons
(0 cf)
3,000 Gallons
(401 cf)
5,000 Gallons
(668 cf)
Peachtree City Water and Sewerage Authority (no
water bills)
Pearson 2,000 2 1.14 $7.31 $16.86 $20.11 $23.36 $30.36 $40.86 $58.36
Pelham 3,601 1 1.70 $19.00 $24.70 $23.60 $30.68 $25.90 $33.67 $28.20 $36.66 $32.80 $42.64 $39.70 $51.61 $51.20 $66.56
Pembroke 2,571 1 0.83 $19.50 $20.00 $28.15 $28.65 $29.75 $30.25 $31.35 $31.85 $35.35 $35.85 $41.55 $42.05 $52.95 $53.45
Perkins Water Authority 140 1 $22.00 $24.90 $27.80 $30.70 $36.50 $45.20 $59.70
Pickens County Water Authority 6,357 1 1.12 $36.00 $46.00 $52.00 $58.00 $72.00 $93.00 $128.00
Piedmont Water Co. - Lake Oconee 0 $34.50 $34.50 $42.00 $49.50 $66.50 $92.00 $137.50
Pike County Water and Sewer Authority 434 1 0.32 $37.00 $43.50 $50.00 $56.50 $69.50 $89.00 $121.50
Pine Mountain 1,697 1 0.83 $12.00 $15.00 $16.50 $21.50 $18.75 $24.75 $21.00 $28.00 $25.50 $34.50 $32.25 $44.25 $43.50 $60.50
Pinehurst 460 1 2.29 $27.50 $29.00 $30.50 $32.00 $35.00 $39.50 $47.00
Pineview 512 1 1.10 $12.00 $12.00 $12.00 $12.00 $13.00 $16.00 $21.00
Pitts 590 1 0.67 $7.50 $7.50 $8.85 $10.20 $12.90 $16.95 $23.70
Plains 892 1 0.65 $12.65 $15.56 $15.85 $19.56 $17.45 $21.56 $19.05 $23.56 $22.35 $27.68 $27.30 $33.86 $35.80 $44.51
Polk County Water Authority 24,061 1 0.94 $14.19 $20.34 $26.49 $32.64 $44.94 $63.03 $93.51
Polk County Water Authority - Vinson Mountain 24,061 1 0.94 $13.49 $20.67 $27.85 $35.03 $49.39 $71.53 $109.15
Pooler 21,187 1 1.09 $9.15 $11.56 $13.97 $16.38 $21.20 $30.81 $52.43
Port Wentworth 4,160 1 1.20 $11.60 $20.27 $17.42 $28.93 $19.45 $31.90 $21.78 $35.10 $26.43 $41.49 $34.49 $52.49 $48.26 $71.27
Portal 879 1 0.80 $15.00 $18.00 $17.00 $20.25 $19.00 $22.50 $21.00 $24.75 $25.00 $29.25 $31.00 $36.00 $41.50 $48.50
Poulan 2,002 1 1.26 $21.00 $25.00 $21.00 $25.00 $23.00 $27.00 $25.00 $29.00 $29.00 $33.00 $35.00 $39.00 $45.00 $49.00
Powder Springs 14,000 1 1.16 $7.16 $23.57 $29.24 $34.91 $46.83 $64.71 $96.01
Pulaski 280 1 0.85 $13.00 $13.00 $15.00 $17.00 $21.00 $30.00 $48.00
Quitman 4,942 1 0.98 $6.37 $13.52 $16.27 $19.02 $25.02 $34.02 $49.02
Rabun County Water and Sewer Authority 0 0.77 $18.00 $27.00 $36.00 $45.00 $63.00 $90.00 $135.00
Randolph County Water Authority 231 1 $20.00 $21.50 $23.00 $24.50 $27.50 $32.00 $39.50
Ray City 845 1 1.05 $7.46 $9.46 $13.91 $19.15 $16.06 $22.38 $18.21 $25.61 $22.51 $32.07 $28.96 $41.76 $39.71 $57.91
Register 182 1 $20.00 $29.75 $33.00 $36.25 $42.95 $53.00 $70.25
Remerton 1,479 1 0.94 $16.10 $22.10 $24.10 $26.10 $30.10 $36.10 $46.10
Rentz 310 1 1.64 $17.50 $19.30 $21.10 $22.90 $26.50 $31.90 $40.90
Reynolds 1,373 1 0.68 $12.50 $17.50 $15.15 $22.15 $17.80 $26.80 $20.45 $31.45 $25.75 $40.75 $33.70 $54.70 $46.95 $77.95
Rhine 413 1 1.22 $30.00 $30.00 $30.00 $30.00 $30.00 $30.00 $30.00
Riceboro 1,131 1 0.68 $15.00 $16.00 $17.00 $18.00 $20.00 $23.00 $28.00
Richland 1,323 1 0.62 $33.50 $40.00 $33.50 $40.00 $33.50 $40.00 $33.50 $40.00 $33.50 $40.00 $33.50 $40.00 $33.50 $40.00
Richmond Hill 11,258 1 1.52 $20.50 $30.75 $30.10 $45.15 $33.30 $49.95 $36.50 $54.75 $43.10 $64.65 $53.30 $79.95 $72.30 $108.45
Riddleville 128 1 0.47 $12.50 $15.50 $18.50 $21.50 $27.50 $36.50 $51.50
Rincon 9,880 1 1.94 $12.00 $17.50 $12.00 $17.50 $15.50 $22.00 $19.00 $26.50 $26.00 $35.50 $37.50 $49.75 $60.00 $76.00
Ringgold 2,743 1 1.05 $14.03 $17.84 $21.65 $25.46 $33.08 $44.51 $63.56
Ringgold - Dalton (no water bills)
Ringgold - Meadows (no water bills)
Roberta 1,615 1 0.86 $10.50 $13.75 $18.75 $22.75 $21.50 $25.75 $24.25 $28.75 $29.75 $34.75 $38.00 $43.75 $51.75 $58.75
Rochelle 1,581 1 1.33 $14.50 $16.50 $21.25 $23.25 $23.50 $25.50 $25.75 $27.75 $30.25 $32.25 $37.00 $39.00 $48.25 $50.25
Rockdale County Water and Sewer Authority 72,621 1 $14.63 $24.38 $28.45 $32.52 $40.66 $55.30 $82.13
Rockmart 6,500 1 1.39 $8.84 $13.27 $13.26 $19.90 $17.68 $26.53 $22.10 $33.16 $30.94 $46.42 $44.20 $66.31 $67.40 $101.06
Rocky Ford 165 1 1.06 $13.50 $13.50 $17.50 $21.50 $30.00 $42.75 $65.25
Rome - Zone 1 45,586 1 1.54 $12.04 $19.99 $23.52 $27.05 $34.11 $44.69 $62.34
Rome - Zone 2 45,586 1 1.54 $12.04 $19.99 $23.52 $27.05 $34.11 $44.69 $62.34
Rome - Zone 3 45,586 1 1.54 $13.85 $25.40 $29.25 $33.10 $40.80 $52.35 $71.60
Rome - Zone 4 45,586 1 1.54 $15.06 $23.73 $27.58 $31.43 $39.13 $50.68 $69.93
Service Population is approximated and may not be actual.
Source: 1=EPA SDWIS 2017, 2=Census Population in 2016 *Based on data from FY2015 or earlierGeorgia Environmental Finance Authority
and Environmental Finance Center

Compare with caution. High rates may be justified and necessary to protect public health.
Inside Outside Inside Outside Inside Outside Inside Outside Inside Outside Inside Outside Inside Outside
7,000 Gallons
(936 cf)
10,000 Gallons
(1,337 cf)
15,000 Gallons
(2,005 cf)
4,000 Gallons
(535 cf)
Operating
Ratio
(FY2016)
Rate Table 2: 2017 Residential Monthly-Equivalent Water Bills at Various Consumption Levels (Includes Base Charges)
Utility / Rate StructureService Population
(Approx.)
Zero Gallons
(0 cf)
3,000 Gallons
(401 cf)
5,000 Gallons
(668 cf)
Roopville 252 1 $1.50 $3.50 $6.25 $9.00 $15.50 $26.75 $50.50
Roswell 14,300 1 1.33 $5.01 $17.37 $21.49 $25.61 $42.07 $66.76 $128.51
Royston 2,800 1 0.94 $9.28 $16.10 $18.73 $31.40 $21.88 $36.50 $25.03 $41.60 $31.33 $51.80 $40.78 $67.10 $56.53 $92.60
Rutledge 918 1 1.63 $14.00 $18.00 $22.00 $26.00 $34.25 $47.00 $70.75
Saint Marys 17,270 1 0.93 $20.45 $29.03 $31.89 $34.75 $40.89 $50.73 $67.13
Sale City 465 1 $11.00 $13.00 $15.00 $17.00 $22.00 $29.50 $44.50
Sandersville 6,100 1 2.55 $18.00 $18.00 $19.95 $20.93 $21.90 $23.86 $23.85 $26.79 $27.75 $32.65 $33.60 $41.44 $43.35 $56.09
Sardis 999 1 0.99 $12.00 $20.70 $23.60 $26.50 $32.30 $41.00 $55.50
Sasser 367 1 $25.00 $25.00 $25.00 $25.00 $27.00 $28.00 $29.00 $31.00 $33.50 $37.50 $41.00 $48.00 $55.00 $67.00
Satilla Regional Water and Sewer Authority 14,311 1 1.40 $12.00 $16.22 $19.03 $21.84 $27.45 $35.87 $49.91
Savannah 215,566 1 1.22 $5.53 $8.30 $9.66 $14.47 $11.04 $16.53 $12.42 $18.59 $15.50 $23.21 $20.36 $30.47 $28.44 $42.57
Schley County 1,321 1 1.20 $28.00 $31.00 $34.00 $37.00 $43.00 $52.00 $67.00
Scotland 356 1 $13.00 $13.00 $13.00 $13.75 $16.75 $21.25 $28.75
Screven 840 1 $12.00 $14.10 $16.20 $18.30 $22.80 $29.55 $41.30
Senoia 3,466 1 1.18 $16.00 $23.50 $27.00 $36.50 $32.50 $43.00 $38.00 $49.50 $50.40 $63.90 $69.00 $85.50 $103.50 $125.00
Shady Dale 398 1 0.80 $25.00 $29.50 $34.00 $38.50 $47.50 $61.00 $83.50
Shellman 1,115 1 0.74 $10.00 $11.32 $12.64 $13.96 $16.60 $20.56 $27.16
Shiloh 585 1 0.96 $13.00 $15.00 $19.50 $22.50 $22.75 $26.25 $26.00 $30.00 $32.50 $37.50 $42.25 $48.75 $58.50 $67.50
Siloam 481 1 0.81 $17.00 $20.00 $23.00 $26.00 $32.00 $41.00 $56.00
Sky Lake POA, Inc. 0 $27.92 $27.92 $27.92 $27.92 $27.92 $27.92 $27.92
Sky Valley 1,877 1 $30.00 $45.00 $40.00 $60.00 $50.00 $75.00 $90.00 $135.00 $112.00 $168.00 $200.00 $300.00 $320.00 $480.00
Smithville 647 1 0.42 $15.00 $16.50 $18.00 $19.50 $22.50 $27.00 $34.50
Smyrna 35,000 1 1.19 $15.18 $27.09 $32.37 $37.65 $48.21 $67.98 $102.05
Social Circle 4,235 1 1.51 $19.90 $29.85 $29.65 $44.47 $39.40 $59.09 $49.15 $73.71 $68.65 $102.95 $97.90 $146.81 $146.65 $219.91
Soperton 2,470 1 1.02 $10.00 $50.00 $11.50 $51.50 $13.00 $53.00 $14.50 $54.50 $17.50 $57.50 $22.00 $62.00 $29.50 $69.50
Spalding County 40,430 1 1.20 $13.71 $35.82 $43.19 $50.56 $65.30 $92.93 $143.43
Sparks 1,823 1 1.14 $20.75 $20.75 $20.75 $20.75 $20.75 $20.75 $20.75
Springfield 3,100 1 1.15 $10.00 $15.00 $12.00 $17.50 $14.00 $20.00 $16.00 $22.50 $21.00 $29.50 $28.50 $40.00 $41.00 $57.50
Statesboro 36,846 1 1.27 $7.50 $15.00 $14.25 $28.50 $16.50 $33.00 $18.75 $37.50 $23.25 $46.50 $30.10 $60.20 $41.85 $83.70
Statham 3,986 1 $17.92 $26.88 $22.90 $32.14 $28.61 $38.30 $34.77 $44.85 $47.09 $57.95 $65.57 $77.60 $96.37 $110.35
Stewart County Water and Sewer Authority 3,006 1 $15.25 $21.25 $23.25 $25.25 $29.25 $35.25 $45.25
Stillmore 615 1 $17.50 $19.75 $22.00 $24.25 $31.01 $41.15 $63.65
Stockbridge 6,500 1 1.09 $6.00 $23.46 $29.28 $38.22 $56.10 $86.00 $146.10
Summerville 11,651 1 1.22 $15.10 $19.94 $15.10 $19.94 $18.98 $25.07 $22.86 $30.20 $30.62 $40.46 $42.26 $55.85 $61.66 $81.50
Sumner 848 1 $12.50 $17.00 $20.50 $24.00 $31.00 $41.50 $59.00
Surrency 170 2 0.45 $9.00 $9.00 $9.00 $9.60 $10.80 $13.80 $19.80
Suwanee 920 1 1.24 $20.50 $24.16 $27.82 $31.48 $41.68 $60.82 $95.92
Sylvania 2,960 1 1.31 $12.00 $16.75 $18.24 $26.11 $20.49 $29.48 $22.73 $32.85 $27.22 $39.58 $33.95 $49.68 $45.43 $67.02
Sylvester 12,886 1 1.39 $15.00 $18.00 $21.75 $27.75 $24.00 $31.00 $26.25 $34.25 $31.21 $41.21 $38.65 $51.65 $48.65 $66.65
Talbot County 3,398 1 0.87 $35.59 $40.09 $44.59 $49.09 $58.09 $71.59 $94.09
Talbotton 738 1 0.79 $28.73 $33.23 $37.73 $42.23 $51.23 $64.73 $87.23
Tallapoosa 4,030 1 0.69 $8.00 $12.00 $12.70 $19.05 $17.40 $26.10 $22.10 $33.15 $31.50 $47.25 $45.60 $68.40 $69.10 $103.65
Tarrytown 88 1 0.61 $30.00 $40.50 $44.00 $47.50 $54.50 $65.00 $82.50
Taylor County Water and Sewer Authority 91 1 $24.50 $24.50 $24.50 $24.50 $26.90 $30.50 $36.50
Temple 4,250 1 0.89 $5.00 $18.50 $23.00 $27.50 $36.75 $51.75 $76.75
Tennille 1,802 1 0.89 $6.96 $8.46 $15.16 $20.76 $17.96 $24.96 $20.76 $29.16 $26.76 $38.16 $35.76 $51.66 $52.01 $76.06
Thomaston 10,510 1 1.07 $6.50 $28.79 $36.22 $43.65 $58.51 $80.80 $117.95
Thomasville 23,577 1 1.23 $17.09 $30.32 $23.12 $39.65 $25.13 $42.76 $27.14 $45.87 $31.16 $52.09 $37.19 $61.42 $47.24 $76.97
Service Population is approximated and may not be actual.
Source: 1=EPA SDWIS 2017, 2=Census Population in 2016 *Based on data from FY2015 or earlierGeorgia Environmental Finance Authority
and Environmental Finance Center

Compare with caution. High rates may be justified and necessary to protect public health.
Inside Outside Inside Outside Inside Outside Inside Outside Inside Outside Inside Outside Inside Outside
7,000 Gallons
(936 cf)
10,000 Gallons
(1,337 cf)
15,000 Gallons
(2,005 cf)
4,000 Gallons
(535 cf)
Operating
Ratio
(FY2016)
Rate Table 2: 2017 Residential Monthly-Equivalent Water Bills at Various Consumption Levels (Includes Base Charges)
Utility / Rate StructureService Population
(Approx.)
Zero Gallons
(0 cf)
3,000 Gallons
(401 cf)
5,000 Gallons
(668 cf)
Thomson-McDuffie County Water and Sewer
Commission 17,717 1 $7.45 $21.34 $25.97 $30.60 $39.86 $53.75 $76.90
Thunderbolt 2,668 1 0.84 $8.00 $13.07 $14.76 $16.45 $22.42 $28.60 $44.45
Tifton 24,871 1 1.69 $7.72 $11.49 $11.38 $16.77 $12.60 $18.53 $13.82 $20.29 $16.26 $23.81 $19.92 $29.09 $26.02 $37.89
Tignall 754 1 0.84 $17.75 $30.00 $21.85 $33.00 $25.95 $36.00 $30.05 $39.00 $39.05 $52.50 $52.55 $72.75 $80.05 $114.00
Toccoa 24,960 1 1.47 $14.75 $18.44 $19.50 $24.38 $24.25 $30.32 $29.00 $36.26 $38.50 $48.14 $52.75 $65.96 $76.50 $95.66
Toomsboro 472 1 0.86 $18.00 $22.00 $26.00 $30.00 $38.00 $50.00 $70.00
Towns County Water and Sewer Authority 9,991 1 1.44 $24.00 $39.00 $44.00 $49.00 $59.00 $74.00 $99.00
Trenton (no water bills)
Trion 24001 1.00 $15.00 $15.00 $15.00 $15.00 $15.00 $15.00 $15.00
Turin 6711 1.48 $16.50 $21.45 $26.40 $31.35 $44.05 $63.10 $101.10
Turtle Cove POA 0 $40.00 $40.00 $40.00 $46.00 $58.00 $76.00 $126.00
Twiggs County 3761 0.51 $23.50 $28.75 $34.00 $39.25 $49.75 $65.50 $91.75
Tybee Island 80471 0.86 $10.72 $10.72 $14.09 $17.46 $24.76 $35.71 $55.36
Tyrone 71212 0.88 $18.48 $18.48 $21.71 $24.94 $31.40 $41.09 $57.24
Unadilla 38371 1.76 $9.00 $15.95 $11.34 $18.29 $13.68 $20.63 $16.02 $22.97 $20.70 $27.65 $27.72 $34.67 $39.42 $46.37
Union City 186361 1.18 $4.00 $32.68 $42.24 $51.80 $70.92 $99.60 $147.40
Upson County 57781 1.38 $23.00 $36.75 $41.50 $46.25 $56.25 $71.25 $97.50
Utilities, Inc. of Georgia - The Landings 0 $18.25 $25.18 $27.49 $29.80 $36.08 $45.50 $78.60
Utilities, Inc. of Georgia - The Orchard 0 $46.00 $46.00 $51.75 $57.50 $69.00 $86.25 $121.10
Valdosta 560191 0.53 $7.00 $14.00 $12.62 $25.23 $14.61 $29.22 $16.95 $33.90 $21.63 $43.25 $28.65 $57.29 $40.34 $80.69
Vidalia 130501 0.78 $8.00 $12.00 $9.66 $14.33 $11.32 $16.66 $12.98 $18.99 $16.30 $23.65 $21.28 $30.64 $30.93 $43.64
Vienna 36661 1.25 $10.90 $13.15 $17.15 $22.53 $19.40 $25.91 $21.65 $29.29 $26.15 $36.05 $32.90 $46.19 $45.40 $64.94
Villa Rica 139961 1.02 $12.00 $15.00 $21.92 $26.28 $25.68 $31.92 $29.44 $37.69 $36.96 $51.51 $48.24 $82.51 $71.79 $138.91
Waco 9131 $16.00 $24.00 $20.50 $29.00 $25.00 $34.00 $29.50 $39.00 $38.50 $49.00 $52.00 $64.00 $74.50 $89.00
Wadley 25001 1.47 $15.00 $30.00 $16.75 $33.50 $18.50 $37.00 $20.25 $40.50 $23.75 $47.50 $29.00 $58.00 $37.75 $75.50
Waleska 26911 1.00 $15.52 $22.63 $29.74 $36.85 $52.37 $75.65 $114.45
Walker County Rural Water and Sewer Authority 32701 1.38 $17.70 $26.80 $31.35 $35.90 $45.00 $58.65 $81.40
Walker County Water and Sewer Authority 360001 0.96 $15.00 $25.50 $29.00 $32.50 $39.50 $50.00 $67.50
Walthourville 38581 1.06 $14.70 $19.20 $19.00 $28.80 $21.20 $32.10 $23.40 $35.40 $28.00 $42.30 $34.90 $52.65 $46.90 $70.65
Walton County Water and Sewer Authority 363871 $23.75 $30.87 $37.99 $45.11 $59.35 $84.37 $129.12
Warm Springs 11201 0.90 $12.00 $15.00 $29.85 $35.85 $35.80 $42.80 $41.75 $49.75 $53.65 $63.65 $71.50 $84.50 $101.25 $119.25
Warner Robins 641631 1.14 $6.80 $11.99 $13.72 $15.45 $18.91 $24.10 $32.75
Warrenton 28001 1.15 $18.34 $20.92 $24.94 $28.35 $29.34 $33.30 $33.74 $38.25 $42.54 $48.15 $55.74 $63.00 $85.89 $95.85
Warwick 8641 $9.00 $18.55 $21.80 $25.05 $31.95 $42.30 $59.80
Washington 41341 1.06 $19.00 $28.50 $31.00 $46.50 $35.00 $52.50 $39.00 $58.50 $47.00 $70.50 $59.00 $88.50 $79.00 $118.50
Water Service Company of Georgia - Lake Riverside 0 $23.58 $38.31 $43.22 $48.13 $57.95 $72.68 $97.23
Waycross 211541 0.84 $17.01 $20.66 $22.16 $23.66 $26.65 $31.22 $40.18
Waynesboro 58131 0.88 $3.19 $3.19 $16.51 $20.53 $20.95 $26.31 $25.39 $32.09 $34.27 $43.65 $47.59 $60.99 $69.79 $89.89
Webster County 10381 1.19 $14.00 $20.00 $14.00 $20.00 $15.50 $21.50 $17.00 $23.00 $20.00 $26.00 $24.50 $30.50 $32.00 $38.00
West Point 39291 $8.94 $13.41 $20.69 $28.49 $24.61 $33.52 $28.53 $38.54 $36.36 $48.60 $53.72 $66.08 $83.00 $95.35
Whigham 8791 1.50 $18.02 $20.24 $22.46 $24.68 $29.12 $35.78 $46.88
White 8061 $12.00 $16.00 $12.00 $16.00 $14.50 $19.35 $17.00 $22.70 $22.63 $30.24 $32.64 $43.65 $51.39 $68.80
White County Water Authority 44201 0.89 $26.00 $34.34 $38.51 $43.24 $53.63 $70.61 $98.91
White Plains 4131 $17.00 $20.00 $23.00 $26.00 $32.00 $41.00 $56.00
Whitesburg 9311 $15.00 $19.00 $21.18 $28.25 $23.65 $31.95 $26.12 $35.65 $31.06 $43.05 $38.47 $54.15 $50.82 $72.65
Willacoochee 19401 1.25 $12.50 $12.50 $15.50 $18.50 $24.50 $33.50 $48.50
Service Population is approximated and may not be actual.
Source: 1=EPA SDWIS 2017, 2=Census Population in 2016 *Based on data from FY2015 or earlierGeorgia Environmental Finance Authority
and Environmental Finance Center

Compare with caution. High rates may be justified and necessary to protect public health.
Inside Outside Inside Outside Inside Outside Inside Outside Inside Outside Inside Outside Inside Outside
7,000 Gallons
(936 cf)
10,000 Gallons
(1,337 cf)
15,000 Gallons
(2,005 cf)
4,000 Gallons
(535 cf)
Operating
Ratio
(FY2016)
Rate Table 2: 2017 Residential Monthly-Equivalent Water Bills at Various Consumption Levels (Includes Base Charges)
Utility / Rate StructureService Population
(Approx.)
Zero Gallons
(0 cf)
3,000 Gallons
(401 cf)
5,000 Gallons
(668 cf)
Williamson 4081 0.86 $15.00 $15.00 $23.78 $25.65 $29.63 $32.75 $36.63 $40.88 $52.93 $59.18 $77.38 $86.63 $118.13 $132.38
Winder 329711 1.46 $16.25 $25.20 $29.55 $39.20 $37.55 $47.20 $45.55 $55.20 $61.55 $71.20 $88.55 $98.20 $133.55 $143.20
Woodbine 15081 1.25 $6.00 $11.64 $13.52 $15.40 $19.68 $26.10 $37.85
Woodbury 9611 1.06 $14.39 $19.37 $29.00 $38.12 $33.87 $44.37 $38.74 $50.62 $53.34 $69.38 $80.12 $103.78 $128.82 $166.33
Woodstock 100701 1.00 $12.00 $23.00 $28.50 $34.00 $45.00 $61.50 $90.65
Wrens 23751 0.97 $16.60 $23.60 $22.70 $31.82 $25.75 $35.93 $28.80 $40.04 $36.43 $50.31 $50.17 $68.79 $73.07 $99.59
Service Population is approximated and may not be actual.
Source: 1=EPA SDWIS 2017, 2=Census Population in 2016 *Based on data from FY2015 or earlierGeorgia Environmental Finance Authority
and Environmental Finance Center

Utility / Rate Structure
Billing Period
(Monthly,
Bimonthly,
Quarterly, Other)
Base Charge
Pricing
Monthly Gallons
Provided with
Base Charge
(Allowance)
Sewer Rate Structure
Number
of
Blocks
First Block
Maximum
(Monthly
Gallons)
Outside/Inside
Bill Differential at
5,000 Gallons
Adel 5,311 1 Monthly Constant 9,000 Uniform Rate
Adrian
Ailey 527 1 Monthly Constant 2,000 Uniform Rate
Alamo 3,457 1 Monthly Constant 2,000 Uniform Rate
Albany 87,029 1 Monthly Constant 0 Uniform Rate 84%
Alcovy Shores Water Authority
Allentown
Alma 4,700 1 Monthly Constant 2,000 Increasing Block 4 5,000 200%
Alston
Alto
Americus 16,255 1 Monthly Constant 0 Uniform Rate 200%
Andersonville 400 1 Monthly Constant 2,000 Uniform Rate
Arabi
Argyle
Arlington 1,243 1 Monthly Constant 0 Increasing Block 4 2,000
Arnoldsville
Ashburn 4,272 1 Monthly Constant 0 Increasing Block 5 5,000
Athens-Clarke County 120,266 1 Monthly Constant 0 Uniform Rate
Atlanta 650,000 1 Monthly Constant 0 Increasing Block 3 2,244 35%
Attapulgus
Auburn 6,904 1 Monthly Constant 2,000 Uniform Rate
Augusta 204,000 1 Monthly Constant 0 Uniform Rate
Austell 7,774 1 Monthly None 0 Uniform Rate 104%
Avera
Baconton 985 1 Monthly Constant 0 Uniform Rate 137%
Bainbridge 13,546 1 Monthly Constant 0 Uniform Rate with a Cap
Baldwin 4,160 1 Monthly Constant 2,000 Increasing Block 3 6,000 109%
Baldwin County 21,840 1 Monthly Constant 2,000 Increasing Block 5 4,999
Ball Ground 2,470 1 Monthly Constant 0 Uniform Rate
Banks County 6,453 1 Monthly Constant 2,000 Increasing Block 5 6,000
Barnesville 6,755 1 Monthly Constant 2,000 Uniform at One Block's Rate 3 5,000
Barrow County Water and Sewer Authority 14,043 1 Monthly Constant 2,000 Uniform Rate
Bartow 286 1 Monthly Constant 2,000 Uniform Rate 113%
Bartow County 50,162 1 Monthly By Meter Size 0 Uniform Rate
Rate Table 3: 2017 Sewer Rate Structures for Residential Customers
Service
Population
(Approx.)
Service Population is approximated and may not be actual.
Source: 1=EPA SDWIS 2017, 2=Census Population in 2016
Georgia Environmental Finance Authority
and Environmental Finance Center

Utility / Rate Structure
Billing Period
(Monthly,
Bimonthly,
Quarterly, Other)
Base Charge
Pricing
Monthly Gallons
Provided with
Base Charge
(Allowance)
Sewer Rate Structure
Number
of
Blocks
First Block
Maximum
(Monthly
Gallons)
Outside/Inside
Bill Differential at
5,000 Gallons
Rate Table 3: 2017 Sewer Rate Structures for Residential Customers
Service
Population
(Approx.)
Barwick
Baxley 4,737 2 Monthly Constant 2,000 Uniform Rate 150%
Bent Tree - 0 Monthly None 0 Non-Volumetric Flat Charge
Berlin
Blackshear 5,811 1 Monthly Constant 2,000 Uniform Rate
Blairsville 4,035 1 Monthly By Meter Size 2,000 Increasing Block 2 6,000 150%
Blakely 4,855 1 Monthly Constant 0 Increasing Block 4 10,000 105%
Bloomingdale 1,690 1 Monthly Constant 0 Implied Uniform Rate 2 20,000
Blue Ridge 5,506 1 Monthly By Meter Size 0 Uniform Rate 116%
Blythe
Boston 1,378 1 Monthly Constant 2,000 Uniform Rate
Bowdon 6,045 1 Monthly Constant 2,000 Uniform Rate
Bowersville
Bowman 862 1 Monthly Constant 1,500 Uniform Rate
Braselton 8,580 1 Monthly Constant 2,000 Increasing Block 2 5,000
Bremen 6,200 1 Monthly Constant 2,000 Increasing Block 5 5,000 162%
Brinson
Bronwood
Brooklet 1,456 1 Monthly Constant 0 Increasing Block 6 5,000
Brooks 595 1 Monthly By Meter Size 2,000 Implied Uniform Rate 2 20,000
Broxton 1,463 1 Monthly Constant 2,000 Uniform Rate
Brunswick-Glynn County Joint Water and Sewer Commission -
City of Brunswick 62,457 1 Monthly Constant 0 Uniform Rate
Brunswick-Glynn County Joint Water and Sewer Commission -
Glynn County 62,457 1 Monthly Constant 0 Uniform Rate
Buchanan 1,326 1 Monthly Constant 2,000 Uniform Rate 171%
Buckhead
Buena Vista 1,771 1 Monthly Constant 2,000 Uniform Rate 151%
Buford 8,045 1 Monthly Constant 4,000 Uniform Rate
Butler 2,948 1 Monthly Constant 2,000 Uniform Rate 110%
Butts County Water and Sewer Authority 21,600 1 Monthly By Meter Size 2,000 Uniform Rate 120%
Byron 6,617 1 Monthly Constant 0 Uniform Rate
Cadwell 489 1 Monthly Constant 0 Increasing Block 5 5,000 148%
Cairo 9,703 1 Monthly Constant 0 Uniform Rate with a Cap 200%
Calhoun 49,088 1 Monthly By Meter Size 0 Uniform Rate 150%
Service Population is approximated and may not be actual.
Source: 1=EPA SDWIS 2017, 2=Census Population in 2016
Georgia Environmental Finance Authority
and Environmental Finance Center

Utility / Rate Structure
Billing Period
(Monthly,
Bimonthly,
Quarterly, Other)
Base Charge
Pricing
Monthly Gallons
Provided with
Base Charge
(Allowance)
Sewer Rate Structure
Number
of
Blocks
First Block
Maximum
(Monthly
Gallons)
Outside/Inside
Bill Differential at
5,000 Gallons
Rate Table 3: 2017 Sewer Rate Structures for Residential Customers
Service
Population
(Approx.)
Camak 182 1 Monthly Constant 1,000 Uniform Rate
Camilla 5,922 1 Monthly Constant 2,000 Uniform Rate with a Cap 153%
Canon
Canton 14,300 1 Monthly Constant 2,000 Uniform Rate
Carlton
Carnesville 736 1 Monthly By Meter Size 0 Uniform Rate 118%
Carroll County Water Authority 44,700 1 Monthly By Meter Size 1,496 Uniform Rate
Carrollton 24,310 1 Monthly Constant 2,244 Uniform Rate 120%
Cartersville 24,830 1 Monthly By Meter Size 0 Uniform Rate 161%
Catoosa Utility District Authority
Cave Spring 4,180 1 Monthly Constant 2,000 Uniform Rate
Cedartown 9,750 1 Monthly By Meter Size 3,740 Implied Uniform Rate 2 187,000 142%
Centerville 9,940 1 Monthly Constant 2,000 Uniform Rate with a Cap
Chatsworth Water Works Commission 29,617 1 Monthly Constant 500 Uniform Rate 138%
Chattooga County
Chattooga County - Cloudland
Chattooga County - Gore Subligna
Cherokee County Water and Sewerage Authority 145,528 1 Monthly By Meter Size 2,000 Uniform Rate
Chester 1,777 1 Monthly Constant 3,000 Uniform Rate
Chickamauga 4,150 1 Monthly Constant 0 Increasing Block 2 5,000 146%
Clarkesville 5,785 1 Monthly Constant 2,000 Uniform Rate 188%
Claxton 4,433 1 Monthly Constant 3,000 Increasing Block 4 5,000 156%
Clay County
Clayton 7,225 1 Monthly By Meter Size 2,000 Increasing Block 4 6,000 128%
Clayton - North Loop
Clayton County Water Authority 270,000 1 Monthly Constant 0 Increasing Block 2 3,000
Cleveland 3,640 1 Monthly By Meter Size 2,000 Increasing Block 3 4,000 173%
Climax
Cobb County 533,000 1 Monthly By Meter Size 0 Uniform Rate 103%
Cobbtown
Cochran 5,124 1 Monthly Constant 1,000 Uniform Rate with a Cap 142%
Coffee County
College Park 20,382 1 Monthly Constant 0 Increasing Block 3 4,000
Collins 780 1 Monthly None 0 Non-Volumetric Flat Charge
Service Population is approximated and may not be actual.
Source: 1=EPA SDWIS 2017, 2=Census Population in 2016
Georgia Environmental Finance Authority
and Environmental Finance Center

Utility / Rate Structure
Billing Period
(Monthly,
Bimonthly,
Quarterly, Other)
Base Charge
Pricing
Monthly Gallons
Provided with
Base Charge
(Allowance)
Sewer Rate Structure
Number
of
Blocks
First Block
Maximum
(Monthly
Gallons)
Outside/Inside
Bill Differential at
5,000 Gallons
Rate Table 3: 2017 Sewer Rate Structures for Residential Customers
Service
Population
(Approx.)
Colquitt 1,895 1 Monthly By Meter Size 0 Implied Uniform Rate 3 15,000
Columbia County 101,967 1 Monthly Constant 0 Uniform Rate
Columbus Water Works 229,000 1 Monthly Constant 0 Uniform Rate with a Cap
Comer 1,380 1 Monthly Constant 1,500 Uniform Rate 225%
Commerce 6,819 1 Monthly Constant 0 Uniform Rate 163%
Concord 741 1 Monthly Constant 2,000 Uniform Rate 107%
Consolidated Utilities, Inc. - 0 Monthly Constant 0 Increasing Block 3 5,000
Consolidated Utilities, Inc. - Coastal Water & Sewerage, LLC - 21
Centre - 0 Monthly None 0 Non-Volumetric Flat Charge
Consolidated Utilities, Inc. - Coastal Water & Sewerage, LLC -
Cypress Lakes
Consolidated Utilities, Inc. - Coastal Water & Sewerage, LLC -
Little Neck Plantation
Consolidated Utilities, Inc. - Coastal Water & Sewerage, LLC -
Rebel Estates
Consolidated Utilities, Inc. - Coastal Water & Sewerage, LLC -
Ridgecrest, Park of Commerce, Millcreek - 0 Monthly Constant 0 Increasing Block 2 5,000
Consolidated Utilities, Inc. - Coastal Water & Sewerage, LLC -
Sandy Woods, South Pointe, Southern Hills, White Bluff,
Mingledorff, Cottonvale
Consolidated Utilities, Inc. - Coastal Water Company - 0 Monthly Constant 0 Increasing Block 2 5,000
Consolidated Utilities, Inc. - Coastal Water Company - Rate 2 - 0 Monthly Constant 0 Increasing Block 2 5,000
Consolidated Utilities, Inc. - Golden Isles
Consolidated Utilities, Inc. - Whitemarsh Estates
Consolidated Utilities, Inc. - Woodlawn
Coolidge 692 1 Monthly Constant 0 Uniform Rate 127%
Coosa Water Authority
Cordele 10,691 1 Monthly Constant 0 Uniform Rate 171%
Cornelia 6,130 1 Monthly Constant 2,000 Increasing Block 3 10,000 132%
Covington 20,379 1 Monthly Constant 3,000 Uniform Rate
Coweta County Water and Sewer Authority 59,800 1 Monthly Constant 0 Increasing Block 4 5,000
Crawford 1,170 1 Monthly Constant 2,000 Increasing Block 2 10,000 193%
Crawford County
Crawfordville 582 1 Monthly Constant 1,500 Increasing Block 3 5,000
Cumming 47,541 1 Monthly Constant 0 Uniform Rate
Cusseta-Chattahoochee County
Service Population is approximated and may not be actual.
Source: 1=EPA SDWIS 2017, 2=Census Population in 2016
Georgia Environmental Finance Authority
and Environmental Finance Center

Utility / Rate Structure
Billing Period
(Monthly,
Bimonthly,
Quarterly, Other)
Base Charge
Pricing
Monthly Gallons
Provided with
Base Charge
(Allowance)
Sewer Rate Structure
Number
of
Blocks
First Block
Maximum
(Monthly
Gallons)
Outside/Inside
Bill Differential at
5,000 Gallons
Rate Table 3: 2017 Sewer Rate Structures for Residential Customers
Service
Population
(Approx.)
Cuthbert 2,613 1 Monthly Constant 2,000 Increasing Block 2 5,000 118%
Dade County Water and Sewer Authority 36,400 1 Monthly Constant 2,000 Uniform Rate
Dade County Water and Sewer Authority - Canyon Ridge 36,400 1 Monthly None 0 Non-Volumetric Flat Charge
Dade County Water and Sewer Authority - Flintstone 36,400 1 Monthly Constant 2,000 Uniform Rate
Dade County Water and Sewer Authority - Mountain (Pumped 2x) 36,400 1 Monthly Constant 2,000 Uniform Rate
Dade County Water and Sewer Authority - Mountain (Pumped 3x) 36,400 1 Monthly Constant 2,000 Uniform Rate
Dade County Water and Sewer Authority - North End - 0 Monthly Constant 2,000 Uniform Rate
Dade County Water and Sewer Authority - South End 36,400 1 Monthly Constant 2,000 Uniform Rate 142%
Dade County Water and Sewer Authority - Valley 36,400 1 Monthly Constant 2,000 Uniform Rate
Dahlonega 4,120 1 Monthly By Meter Size 0 Uniform Rate
Daisy
Dallas 7,556 1 Monthly None 0 Increasing Block 4 6,000 121%
Damascus
Danielsville 1,092 1 Monthly Constant 2,000 Increasing Block 3 6,000 230%
Danville
Darien 3,242 1 Monthly Constant 0 Increasing Block 5 5,000 127%
Davisboro 1,535 1 Monthly Constant 0 Uniform Rate
Dawson 4,836 1 Monthly Constant 2,000 Uniform Rate with a Cap
Dawsonville 2,424 1 Monthly Constant 1,500 Increasing Block 3 5,000 139%
Decatur Consolidated Water Services, Inc. - Doublegate Phase VI
Decatur Consolidated Water Services, Inc. - Holly Isles
Decatur Consolidated Water Services, Inc. - Pebble Hill Estates
Decatur Consolidated Water Services, Inc. - Redrock Estates
Decatur Consolidated Water Services, Inc. - Riverbend Estates
Decatur Consolidated Water Services, Inc. - Woodcrest
Subdivision
Deepstep
Dekalb County 670,000 1 Bi-monthly By Meter Size 0 Uniform Rate
Demorest 15,130 1 Monthly Constant 2,000 Increasing Block 3 5,000 127%
Denton
Dexter 1,976 1 Monthly Constant 2,000 Increasing Block 4 5,000 111%
Dillard 133 1 Monthly None 0 Non-Volumetric Flat Charge
Service Population is approximated and may not be actual.
Source: 1=EPA SDWIS 2017, 2=Census Population in 2016
Georgia Environmental Finance Authority
and Environmental Finance Center

Utility / Rate Structure
Billing Period
(Monthly,
Bimonthly,
Quarterly, Other)
Base Charge
Pricing
Monthly Gallons
Provided with
Base Charge
(Allowance)
Sewer Rate Structure
Number
of
Blocks
First Block
Maximum
(Monthly
Gallons)
Outside/Inside
Bill Differential at
5,000 Gallons
Rate Table 3: 2017 Sewer Rate Structures for Residential Customers
Service
Population
(Approx.)
Doerun 967 1 Monthly Constant 0 Increasing Block 6 2,000
Donalsonville 2,782 1 Monthly Constant 0 Increasing Block 6 5,000
Dooling
Douglas 10,688 1 Monthly Constant 0 Uniform Rate
Douglasville-Douglas County Water and Sewer Authority 109,694 1 Monthly By Meter Size 0 Increasing Block 2 5,000
Du Pont
Dublin 17,500 1 Monthly Constant 2,000 Uniform Rate 182%
Dudley 546 1 Monthly Constant 2,000 Uniform Rate
East Dublin 2,657 1 Monthly Constant 2,100 Uniform Rate 129%
East Point 33,712 1 Monthly By Meter Size 3,000 Uniform Rate
Eastman 7,491 1 Monthly Constant 2,000 Uniform Rate 123%
Eatonton-Putnam Water and Sewer Authority 12,272 1 Monthly By Meter Size 1,000 Increasing Block 6 2,000
Echols County Water Authority
Edison 1,331 1 Monthly Constant 0 Uniform Rate
Effingham County 7,700 1 Monthly Constant 0 Increasing Block 3 5,000
Elberton 7,800 1 Monthly Constant 0 Implied Uniform Rate 2 149,600 131%
Ellaville 2,779 1 Monthly Constant 0 Increasing Block 6 2,000 138%
Ellenton
Ellijay-Gilmer County Water and Sewer Authority 13,010 1 Monthly Constant 0 Increasing Block 5 2,000
Emerson 1,394 1 Monthly Constant 0 Uniform Rate 140%
Enigma
Ephesus
Etowah Water and Sewer Authority 13,843 1 Monthly By Meter Size 500 Uniform Rate
Fairburn 13,693 1 Monthly Constant 0 Increasing Block 3 4,000 140%
Fairmount 130 1 Monthly Constant 2,000 Uniform Rate
Fargo
Fayette County
Fayetteville 15,281 1 Monthly Constant 2,000 Uniform Rate
Fitzgerald Water Light and Bond Commission 12,935 1 Monthly Constant 0 Uniform Rate 141%
Flovilla
Flowery Branch 2,920 1 Monthly Constant 4,500 Uniform Rate 133%
Floyd County 41,738 1 Monthly By Meter Size 1,000 Uniform Rate
Folkston 5,940 1 Monthly Constant 1,000 Uniform Rate 123%
Forest Heights Water Works, Inc.
Service Population is approximated and may not be actual.
Source: 1=EPA SDWIS 2017, 2=Census Population in 2016
Georgia Environmental Finance Authority
and Environmental Finance Center

Utility / Rate Structure
Billing Period
(Monthly,
Bimonthly,
Quarterly, Other)
Base Charge
Pricing
Monthly Gallons
Provided with
Base Charge
(Allowance)
Sewer Rate Structure
Number
of
Blocks
First Block
Maximum
(Monthly
Gallons)
Outside/Inside
Bill Differential at
5,000 Gallons
Rate Table 3: 2017 Sewer Rate Structures for Residential Customers
Service
Population
(Approx.)
Forsyth 7,400 1 Monthly Constant 2,000 Uniform Rate 146%
Forsyth County 138,368 1 Monthly Constant 0 Uniform Rate
Fort Gaines 1,422 1 Monthly Constant 0 Uniform Rate with a Cap
Fort Oglethorpe 9,446 1 Monthly Constant 2,000 Uniform Rate 130%
Fort Valley Utility Commission 17,645 1 Monthly Constant 0 Increasing Block 3 4,488
Franklin County 2,764 1 Monthly By Meter Size 2,000 Uniform Rate
Franklin Springs 997 1 Monthly Constant 0 Uniform Rate
Fulton County 172,533 1 Bi-monthly Constant 0 Uniform Rate
Funston
Gainesville 117,962 1 Monthly Constant 0 Uniform Rate with a Cap
Garden City 8,166 1 Monthly Constant 0 Increasing Block 6 2,500 128%
Garfield
Gay
Georgetown-Quitman County Water, Sewer and Solid Waste
Authority 985 1 Monthly Constant 2,000 Uniform Rate
Gibson 720 1 Monthly Constant 3,000 Uniform Rate
Glennville 4,711 1 Monthly By Meter Size 2,000 Increasing Block 4 5,000
Glenwood 1,012 1 Monthly Constant 2,000 Uniform Rate
Gordon 2,340 1 Monthly Constant 2,000 Uniform Rate
Graham
Grantville 1,508 1 Monthly Constant 2,000 Uniform Rate
Greensboro 3,156 1 Monthly Constant 3,000 Uniform Rate 114%
Greenville 1,880 1 Monthly By Meter Size 0 Uniform Rate 117%
Griffin 23,643 1 Monthly By Meter Size 2,000 Uniform Rate
Griffin - Spalding County
Grovetown 11,216 1 Monthly Constant 3,000 Increasing Block 5 10,000 156%
Guyton 2,394 1 Monthly Constant 2,000 Implied Uniform Rate 2 15,000
Gwinnett County 795,657 1 Monthly Constant 0 Uniform Rate
Hahira 2,846 1 Monthly Constant 3,000 Uniform Rate
Hall County 190,482 2 Monthly By Meter Size 0 Uniform Rate with a Cap
Hamilton 928 1 Monthly Constant 0 Uniform Rate
Hampton 7,305 1 Monthly Constant 0 Increasing Block 3 6,000
Hancock County 900 1 Monthly None 0 Non-Volumetric Flat Charge
Hapeville 5,385 1 Monthly Constant 2,000 Increasing Block 3 9,900
Service Population is approximated and may not be actual.
Source: 1=EPA SDWIS 2017, 2=Census Population in 2016
Georgia Environmental Finance Authority
and Environmental Finance Center

Utility / Rate Structure
Billing Period
(Monthly,
Bimonthly,
Quarterly, Other)
Base Charge
Pricing
Monthly Gallons
Provided with
Base Charge
(Allowance)
Sewer Rate Structure
Number
of
Blocks
First Block
Maximum
(Monthly
Gallons)
Outside/Inside
Bill Differential at
5,000 Gallons
Rate Table 3: 2017 Sewer Rate Structures for Residential Customers
Service
Population
(Approx.)
Haralson County Water Authority
Harlem 5,356 1 Monthly Constant 2,000 Implied Uniform Rate 2 20,000
Harris County
Harrison 500 1 Monthly Constant 2,000 Uniform Rate
Hart County Water and Sewer Authority 3,606 1 Monthly By Meter Size 1,000 Increasing Block 2 10,000
Hartford Water Authority
Hartwell 7,116 1 Monthly Constant 2,000 Uniform Rate 144%
Hawkinsville 4,856 1 Monthly Constant 2,500 Uniform Rate 159%
Hazlehurst 5,800 1 Monthly Constant 2,000 Uniform Rate 147%
Heard County Water Authority 8,172 1 Monthly By Meter Size 0 Uniform Rate
Helen 1,851 1 Monthly Constant 0 Increasing Block 3 5,000 129%
Henry County Water Authority 218,667 1 Monthly Constant 0 Increasing Block 2 6,000 150%
Hephzibah 4,500 1 Monthly By Meter Size 2,500 Uniform Rate
Hiawassee - above booster 5,496 1 Monthly Constant 1,000 Uniform Rate 115%
Hiawassee - below booster 5,496 1 Monthly Constant 1,000 Uniform Rate 115%
Hiltonia 392 1 Monthly Constant 4,000 Increasing Block 4 6,000
Hinesville 23,400 1 Monthly Constant 5,000 Increasing Block 4 7,000 150%
Hiram
Hoboken
Hogansville 3,728 1 Monthly By Meter Size 0 Increasing Block 4 5,000 139%
Homeland
Homer
Hoschton 1,547 1 Monthly Constant 0 Increasing Block 3 2,000
Houston County
Ideal 450 1 Monthly Constant 1,000 Uniform Rate
Ila
Iron City
Irwinton
Ivey 1,086 1 Monthly Constant 2,000 Uniform Rate
Jackson 4,950 2 Monthly Constant 2,000 Uniform Rate 185%
Jackson County Water and Sewer Authority 19,191 1 Monthly Constant 1,500 Uniform Rate
Jacksonville
Jakin
Jasper 9,850 1 Monthly Constant 0 Uniform Rate 134%
Service Population is approximated and may not be actual.
Source: 1=EPA SDWIS 2017, 2=Census Population in 2016
Georgia Environmental Finance Authority
and Environmental Finance Center
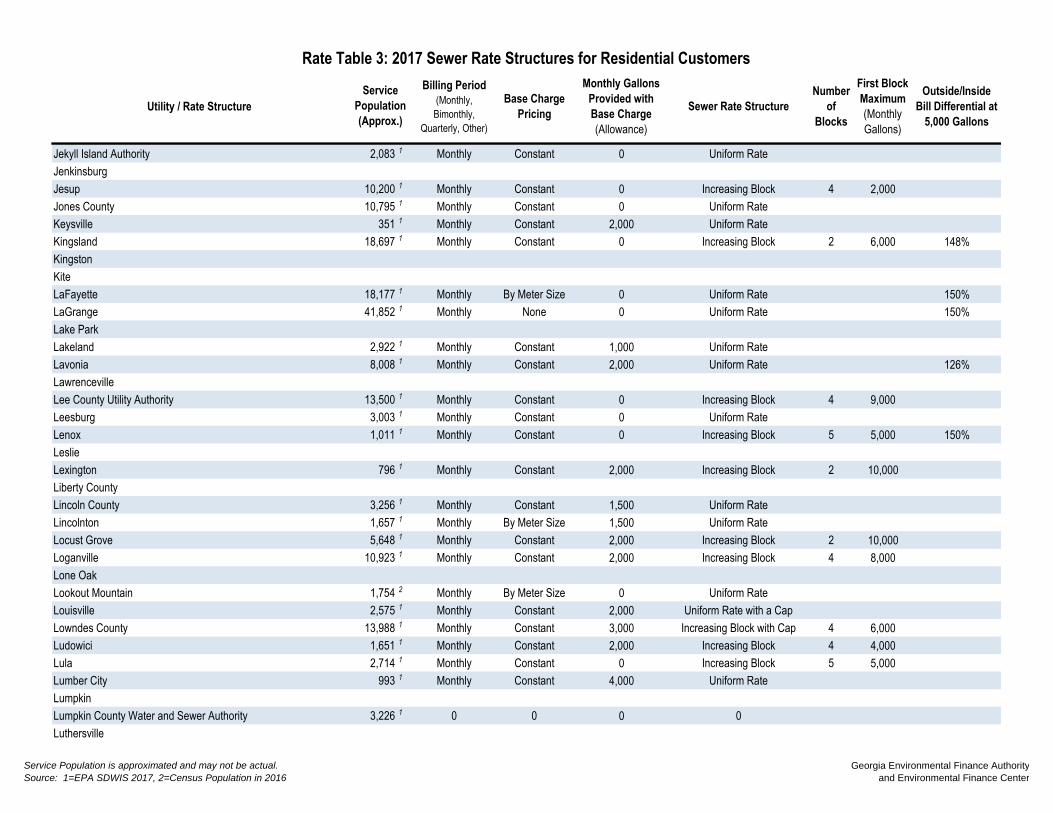
Utility / Rate Structure
Billing Period
(Monthly,
Bimonthly,
Quarterly, Other)
Base Charge
Pricing
Monthly Gallons
Provided with
Base Charge
(Allowance)
Sewer Rate Structure
Number
of
Blocks
First Block
Maximum
(Monthly
Gallons)
Outside/Inside
Bill Differential at
5,000 Gallons
Rate Table 3: 2017 Sewer Rate Structures for Residential Customers
Service
Population
(Approx.)
Jekyll Island Authority 2,083 1 Monthly Constant 0 Uniform Rate
Jenkinsburg
Jesup 10,200 1 Monthly Constant 0 Increasing Block 4 2,000
Jones County 10,795 1 Monthly Constant 0 Uniform Rate
Keysville 351 1 Monthly Constant 2,000 Uniform Rate
Kingsland 18,697 1 Monthly Constant 0 Increasing Block 2 6,000 148%
Kingston
Kite
LaFayette 18,177 1 Monthly By Meter Size 0 Uniform Rate 150%
LaGrange 41,852 1 Monthly None 0 Uniform Rate 150%
Lake Park
Lakeland 2,922 1 Monthly Constant 1,000 Uniform Rate
Lavonia 8,008 1 Monthly Constant 2,000 Uniform Rate 126%
Lawrenceville
Lee County Utility Authority 13,500 1 Monthly Constant 0 Increasing Block 4 9,000
Leesburg 3,003 1 Monthly Constant 0 Uniform Rate
Lenox 1,011 1 Monthly Constant 0 Increasing Block 5 5,000 150%
Leslie
Lexington 796 1 Monthly Constant 2,000 Increasing Block 2 10,000
Liberty County
Lincoln County 3,256 1 Monthly Constant 1,500 Uniform Rate
Lincolnton 1,657 1 Monthly By Meter Size 1,500 Uniform Rate
Locust Grove 5,648 1 Monthly Constant 2,000 Increasing Block 2 10,000
Loganville 10,923 1 Monthly Constant 2,000 Increasing Block 4 8,000
Lone Oak
Lookout Mountain 1,754 2 Monthly By Meter Size 0 Uniform Rate
Louisville 2,575 1 Monthly Constant 2,000 Uniform Rate with a Cap
Lowndes County 13,988 1 Monthly Constant 3,000 Increasing Block with Cap 4 6,000
Ludowici 1,651 1 Monthly Constant 2,000 Increasing Block 4 4,000
Lula 2,714 1 Monthly Constant 0 Increasing Block 5 5,000
Lumber City 993 1 Monthly Constant 4,000 Uniform Rate
Lumpkin
Lumpkin County Water and Sewer Authority 3,226 1 0 0 0 0
Luthersville
Service Population is approximated and may not be actual.
Source: 1=EPA SDWIS 2017, 2=Census Population in 2016
Georgia Environmental Finance Authority
and Environmental Finance Center

Utility / Rate Structure
Billing Period
(Monthly,
Bimonthly,
Quarterly, Other)
Base Charge
Pricing
Monthly Gallons
Provided with
Base Charge
(Allowance)
Sewer Rate Structure
Number
of
Blocks
First Block
Maximum
(Monthly
Gallons)
Outside/Inside
Bill Differential at
5,000 Gallons
Rate Table 3: 2017 Sewer Rate Structures for Residential Customers
Service
Population
(Approx.)
Lyerly 1,360 1 Monthly Constant 2,500 Uniform Rate
Lyons 4,100 1 Monthly Constant 3,000 Increasing Block 2 10,000 200%
Macon Water Authority - Bibb County 130,024 1 Monthly By Meter Size 0 Increasing Block with Cap 3 2,244
Macon Water Authority - Jones County 130,024 1 Monthly Constant 0 Uniform Rate
Macon Water Authority - Monroe County 130,024 1 Monthly By Meter Size 0 Uniform Rate
Madison 5,215 1 Monthly Constant 0 Uniform Rate
Manchester 4,995 1 Monthly Constant 0 Uniform Rate
Mansfield 791 1 Monthly Constant 0 Increasing Block 2 5,000
Marietta Power and Water 60,100 1 Monthly Constant 2,000 Uniform Rate
Marion County
Marshallville 1,241 1 Monthly Constant 0 Increasing Block 4 2,000
Martin
Maxeys
Maysville 2,057 1 Monthly By Meter Size 2,000 Implied Uniform Rate 4 20,000
McCaysville 7,020 1 Monthly Constant 0 Uniform Rate 150%
McDonough 8,962 1 Monthly Constant 0 Increasing Block 2 6,000
McIntosh County
McIntyre
McRae-Helena 5,488 1 Monthly Constant 2,000 Decreasing Block 7 3,000 151%
Meansville
Meigs 1,154 1 Monthly Constant 0 Increasing Block 2 2,000 150%
Menlo 949 1 Monthly Constant 0 Uniform Rate
Metter 4,776 1 Monthly Constant 1,000 Increasing Block 6 3,000
Midville 700 1 Monthly Constant 0 Increasing Block 5 5,000 136%
Midway 2,595 1 Monthly Constant 0 Increasing Block 6 2,000 116%
Milledgeville 19,456 1 Monthly Constant 3,000 Uniform Rate 161%
Millen 4,000 1 Monthly Constant 0 Uniform Rate with a Cap 106%
Milner 902 1 Monthly Constant 2,000 Increasing Block 3 5,000
Mitchell
Molena
Monroe 21,739 1 Monthly Constant 0 Uniform Rate 142%
Monroe County
Montezuma 3,443 1 Monthly Constant 0 Increasing Block 4 2,000
Monticello 3,505 1 Monthly Constant 2,000 Increasing Block 3 4,000
Service Population is approximated and may not be actual.
Source: 1=EPA SDWIS 2017, 2=Census Population in 2016
Georgia Environmental Finance Authority
and Environmental Finance Center
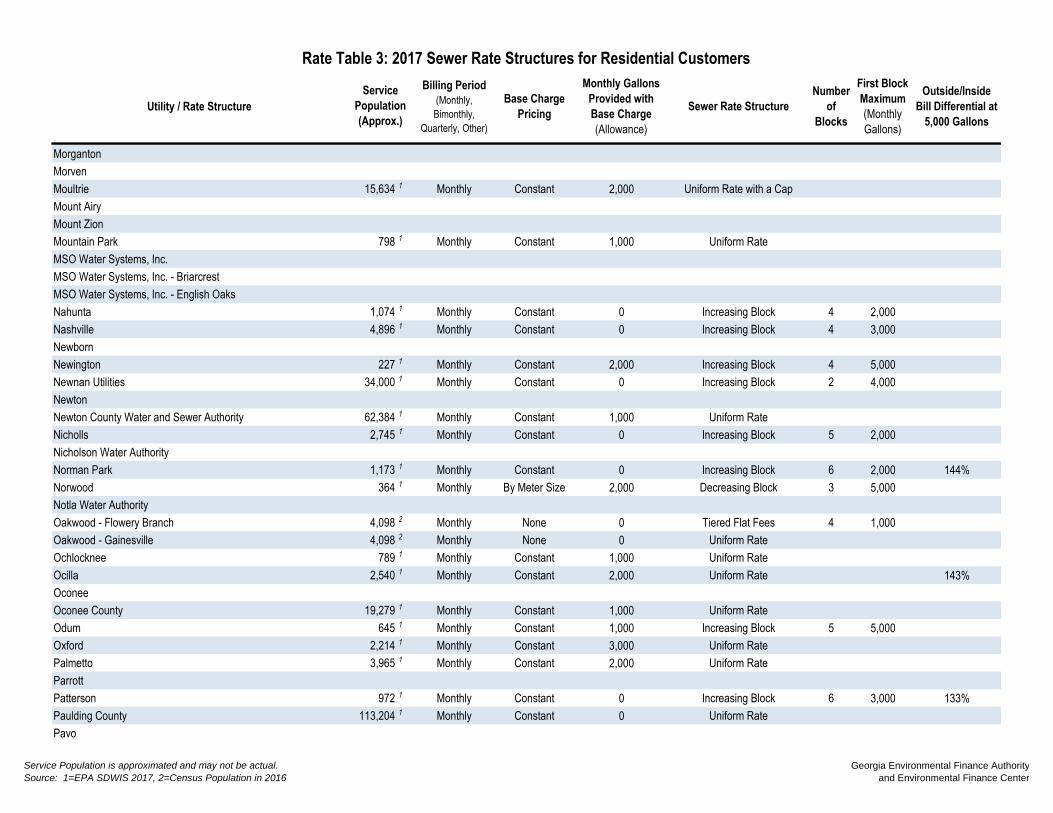
Utility / Rate Structure
Billing Period
(Monthly,
Bimonthly,
Quarterly, Other)
Base Charge
Pricing
Monthly Gallons
Provided with
Base Charge
(Allowance)
Sewer Rate Structure
Number
of
Blocks
First Block
Maximum
(Monthly
Gallons)
Outside/Inside
Bill Differential at
5,000 Gallons
Rate Table 3: 2017 Sewer Rate Structures for Residential Customers
Service
Population
(Approx.)
Morganton
Morven
Moultrie 15,634 1 Monthly Constant 2,000 Uniform Rate with a Cap
Mount Airy
Mount Zion
Mountain Park 798 1 Monthly Constant 1,000 Uniform Rate
MSO Water Systems, Inc.
MSO Water Systems, Inc. - Briarcrest
MSO Water Systems, Inc. - English Oaks
Nahunta 1,074 1 Monthly Constant 0 Increasing Block 4 2,000
Nashville 4,896 1 Monthly Constant 0 Increasing Block 4 3,000
Newborn
Newington 227 1 Monthly Constant 2,000 Increasing Block 4 5,000
Newnan Utilities 34,000 1 Monthly Constant 0 Increasing Block 2 4,000
Newton
Newton County Water and Sewer Authority 62,384 1 Monthly Constant 1,000 Uniform Rate
Nicholls 2,745 1 Monthly Constant 0 Increasing Block 5 2,000
Nicholson Water Authority
Norman Park 1,173 1 Monthly Constant 0 Increasing Block 6 2,000 144%
Norwood 364 1 Monthly By Meter Size 2,000 Decreasing Block 3 5,000
Notla Water Authority
Oakwood - Flowery Branch 4,098 2 Monthly None 0 Tiered Flat Fees 4 1,000
Oakwood - Gainesville 4,098 2 Monthly None 0 Uniform Rate
Ochlocknee 789 1 Monthly Constant 1,000 Uniform Rate
Ocilla 2,540 1 Monthly Constant 2,000 Uniform Rate 143%
Oconee
Oconee County 19,279 1 Monthly Constant 1,000 Uniform Rate
Odum 645 1 Monthly Constant 1,000 Increasing Block 5 5,000
Oxford 2,214 1 Monthly Constant 3,000 Uniform Rate
Palmetto 3,965 1 Monthly Constant 2,000 Uniform Rate
Parrott
Patterson 972 1 Monthly Constant 0 Increasing Block 6 3,000 133%
Paulding County 113,204 1 Monthly Constant 0 Uniform Rate
Pavo
Service Population is approximated and may not be actual.
Source: 1=EPA SDWIS 2017, 2=Census Population in 2016
Georgia Environmental Finance Authority
and Environmental Finance Center
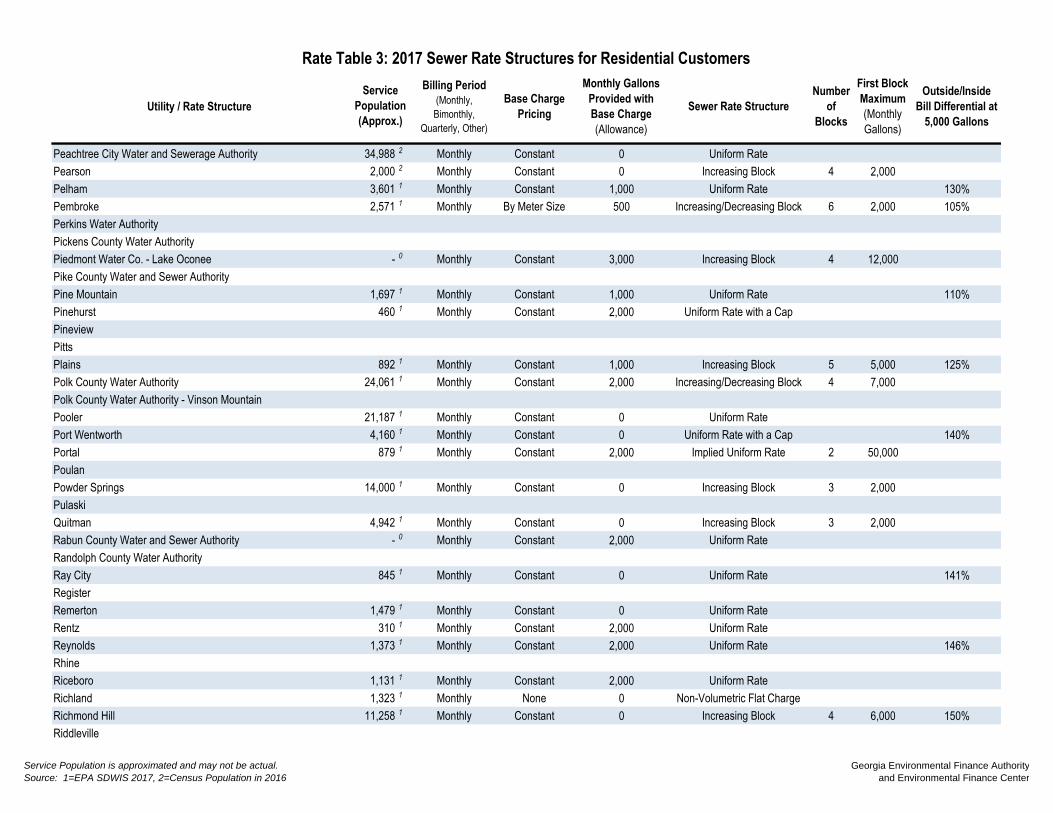
Utility / Rate Structure
Billing Period
(Monthly,
Bimonthly,
Quarterly, Other)
Base Charge
Pricing
Monthly Gallons
Provided with
Base Charge
(Allowance)
Sewer Rate Structure
Number
of
Blocks
First Block
Maximum
(Monthly
Gallons)
Outside/Inside
Bill Differential at
5,000 Gallons
Rate Table 3: 2017 Sewer Rate Structures for Residential Customers
Service
Population
(Approx.)
Peachtree City Water and Sewerage Authority 34,988 2 Monthly Constant 0 Uniform Rate
Pearson 2,000 2 Monthly Constant 0 Increasing Block 4 2,000
Pelham 3,601 1 Monthly Constant 1,000 Uniform Rate 130%
Pembroke 2,571 1 Monthly By Meter Size 500 Increasing/Decreasing Block 6 2,000 105%
Perkins Water Authority
Pickens County Water Authority
Piedmont Water Co. - Lake Oconee - 0 Monthly Constant 3,000 Increasing Block 4 12,000
Pike County Water and Sewer Authority
Pine Mountain 1,697 1 Monthly Constant 1,000 Uniform Rate 110%
Pinehurst 460 1 Monthly Constant 2,000 Uniform Rate with a Cap
Pineview
Pitts
Plains 892 1 Monthly Constant 1,000 Increasing Block 5 5,000 125%
Polk County Water Authority 24,061 1 Monthly Constant 2,000 Increasing/Decreasing Block 4 7,000
Polk County Water Authority - Vinson Mountain
Pooler 21,187 1 Monthly Constant 0 Uniform Rate
Port Wentworth 4,160 1 Monthly Constant 0 Uniform Rate with a Cap 140%
Portal 879 1 Monthly Constant 2,000 Implied Uniform Rate 2 50,000
Poulan
Powder Springs 14,000 1 Monthly Constant 0 Increasing Block 3 2,000
Pulaski
Quitman 4,942 1 Monthly Constant 0 Increasing Block 3 2,000
Rabun County Water and Sewer Authority - 0 Monthly Constant 2,000 Uniform Rate
Randolph County Water Authority
Ray City 845 1 Monthly Constant 0 Uniform Rate 141%
Register
Remerton 1,479 1 Monthly Constant 0 Uniform Rate
Rentz 310 1 Monthly Constant 2,000 Uniform Rate
Reynolds 1,373 1 Monthly Constant 2,000 Uniform Rate 146%
Rhine
Riceboro 1,131 1 Monthly Constant 2,000 Uniform Rate
Richland 1,323 1 Monthly None 0 Non-Volumetric Flat Charge
Richmond Hill 11,258 1 Monthly Constant 0 Increasing Block 4 6,000 150%
Riddleville
Service Population is approximated and may not be actual.
Source: 1=EPA SDWIS 2017, 2=Census Population in 2016
Georgia Environmental Finance Authority
and Environmental Finance Center

Utility / Rate Structure
Billing Period
(Monthly,
Bimonthly,
Quarterly, Other)
Base Charge
Pricing
Monthly Gallons
Provided with
Base Charge
(Allowance)
Sewer Rate Structure
Number
of
Blocks
First Block
Maximum
(Monthly
Gallons)
Outside/Inside
Bill Differential at
5,000 Gallons
Rate Table 3: 2017 Sewer Rate Structures for Residential Customers
Service
Population
(Approx.)
Rincon 9,880 1 Monthly Constant 3,000 Increasing Block 4 9,000 137%
Ringgold 2,743 1 Monthly By Meter Size 2,000 Uniform Rate
Ringgold - Dalton - 0 Monthly By Meter Size 0 Uniform Rate
Ringgold - Meadows - 0 Monthly Constant 0 Uniform Rate
Roberta 1,615 1 Monthly Constant 0 Implied Uniform Rate 3 40,000 121%
Rochelle 1,581 1 Monthly Constant 0 Uniform Rate 108%
Rockdale County Water and Sewer Authority 72,621 1 Monthly By Meter Size 0 Uniform Rate
Rockmart 6,500 1 Monthly Constant 2,000 Increasing Block 5 10,000 150%
Rocky Ford
Rome - Zone 1 45,586 1 Monthly By Meter Size 748 Uniform Rate
Rome - Zone 2 45,586 1 Monthly By Meter Size 748 Uniform Rate 172%
Rome - Zone 3 45,586 1 Monthly Constant 0 Uniform Rate
Rome - Zone 4 45,586 1 Monthly By Meter Size 748 Uniform Rate 143%
Roopville
Roswell 14,300 1 Bi-monthly Constant 0 Uniform Rate
Royston 2,800 1 Monthly Constant 0 Uniform Rate 166%
Rutledge 918 1 Monthly Constant 2,000 Increasing Block 3 6,000
Saint Marys 17,270 1 Monthly Constant 0 Increasing Block 2 6,000
Sale City
Sandersville 6,100 1 Monthly Constant 2,000 Uniform Rate 112%
Sardis 999 1 Monthly Constant 0 Uniform Rate
Sasser
Satilla Regional Water and Sewer Authority 14,311 1 Monthly By Meter Size 1,496 Uniform Rate
Savannah 215,566 1 Bi-monthly Constant 0 Increasing Block with Cap 3 5,610 150%
Schley County
Scotland 356 1 Monthly None 0 Non-Volumetric Flat Charge
Screven 840 1 Monthly Constant 2,000 Increasing Block 5 5,000
Senoia 3,466 1 Monthly Constant 1,000 Uniform Rate
Shady Dale
Shellman 1,115 1 Monthly Constant 2,000 Uniform Rate with a Cap
Shiloh
Siloam
Sky Lake POA, Inc.
Sky Valley
Service Population is approximated and may not be actual.
Source: 1=EPA SDWIS 2017, 2=Census Population in 2016
Georgia Environmental Finance Authority
and Environmental Finance Center

Utility / Rate Structure
Billing Period
(Monthly,
Bimonthly,
Quarterly, Other)
Base Charge
Pricing
Monthly Gallons
Provided with
Base Charge
(Allowance)
Sewer Rate Structure
Number
of
Blocks
First Block
Maximum
(Monthly
Gallons)
Outside/Inside
Bill Differential at
5,000 Gallons
Rate Table 3: 2017 Sewer Rate Structures for Residential Customers
Service
Population
(Approx.)
Smithville 647 1 Monthly None 0 Non-Volumetric Flat Charge
Smyrna 35,000 1 Monthly By Meter Size 0 Uniform Rate
Social Circle 4,235 1 Monthly Constant 2,000 Uniform Rate 150%
Soperton 2,470 1 Monthly Constant 2,000 Implied Uniform Rate 3 25,000 164%
Spalding County 40,430 1 Monthly Constant 2,000 Uniform Rate
Sparks 1,823 1 Monthly None 0 Non-Volumetric Flat Charge
Springfield 3,100 1 Monthly Constant 2,000 Uniform Rate 172%
Statesboro 36,846 1 Monthly Constant 0 Increasing Block 3 9,000 200%
Statham 3,986 1 Monthly Constant 2,000 Increasing Block 3 3,000 130%
Stewart County Water and Sewer Authority
Stillmore 615 1 Monthly Constant 2,000 Increasing Block 3 5,000
Stockbridge 6,500 1 Monthly By Meter Size 0 Increasing Block 3 4,000
Summerville 11,651 1 Monthly Constant 3,000 Implied Uniform Rate 2 50,000 132%
Sumner
Surrency
Suwanee
Sylvania 2,960 1 Monthly Constant 0 Increasing Block 4 3,000 143%
Sylvester 12,886 1 Monthly Constant 0 Increasing Block with Cap 4 5,000
Talbot County
Talbotton 738 1 Monthly Constant 2,000 Uniform Rate
Tallapoosa 4,030 1 Monthly Constant 0 Increasing Block 5 2,000 155%
Tarrytown
Taylor County Water and Sewer Authority 91 1 Monthly Constant 5,000 Uniform Rate
Temple 4,250 1 Monthly Constant 0 Increasing Block 2 6,500
Tennille 1,802 1 Monthly Constant 0 Increasing Block 5 2,000 123%
Thomaston 10,510 1 Monthly Constant 0 Uniform Rate
Thomasville 23,577 1 Monthly Constant 0 Uniform Rate 150%
Thomson-McDuffie County Water and Sewer Commission 17,717 1 Monthly Constant 0 Uniform Rate with a Cap
Thunderbolt 2,668 1 Monthly Constant 0 Implied Uniform Rate 2 20,000
Tifton 24,871 1 Monthly By Meter Size 0 Uniform Rate 148%
Tignall 754 1 Monthly Constant 2,000 Increasing Block 3 5,000
Toccoa 24,960 1 Monthly Constant 2,000 Uniform Rate
Toomsboro
Towns County Water and Sewer Authority
Service Population is approximated and may not be actual.
Source: 1=EPA SDWIS 2017, 2=Census Population in 2016
Georgia Environmental Finance Authority
and Environmental Finance Center

Utility / Rate Structure
Billing Period
(Monthly,
Bimonthly,
Quarterly, Other)
Base Charge
Pricing
Monthly Gallons
Provided with
Base Charge
(Allowance)
Sewer Rate Structure
Number
of
Blocks
First Block
Maximum
(Monthly
Gallons)
Outside/Inside
Bill Differential at
5,000 Gallons
Rate Table 3: 2017 Sewer Rate Structures for Residential Customers
Service
Population
(Approx.)
Trenton 2,091 2 Monthly Constant 3,000 Implied Uniform Rate 2 21,000 150%
Trion 2,400 1 Monthly None 0 Non-Volumetric Flat Charge
Turin
Turtle Cove POA
Twiggs County 376 1 Monthly Constant 2,000 Uniform Rate
Tybee Island 8,047 1 Monthly Constant 3,000 Increasing Block 4 5,000
Tyrone 7,121 2 Monthly Constant 4,000 Uniform Rate
Unadilla 3,837 1 Monthly Constant 2,000 Uniform Rate
Union City 18,636 1 Monthly By Meter Size 0 Implied Uniform Rate 2 15,000
Upson County 5,778 1 Monthly Constant 0 Increasing Block 6 2,000
Utilities, Inc. of Georgia - The Landings - 0 Monthly By Meter Size 0 Uniform Rate with a Cap
Utilities, Inc. of Georgia - The Orchard
Valdosta 56,019 1 Monthly By Meter Size 0 Uniform Rate
Vidalia 13,050 1 Monthly Constant 2,000 Increasing Block 4 10,000
Vienna 3,666 1 Monthly Constant 0 Increasing Block 4 2,000 137%
Villa Rica 13,996 1 Monthly By Meter Size 0 Uniform Rate 141%
Waco 913 1 Monthly Constant 1,000 Uniform Rate
Wadley 2,500 1 Monthly Constant 2,000 Uniform Rate
Waleska
Walker County Rural Water and Sewer Authority
Walker County Water and Sewer Authority 36,000 1 Monthly Constant 0 Uniform Rate
Walthourville 3,858 1 Monthly Constant 0 Increasing Block 6 2,000
Walton County Water and Sewer Authority
Warm Springs 1,120 1 Monthly Constant 0 Uniform Rate 119%
Warner Robins 64,163 1 Monthly By Meter Size 0 Uniform Rate
Warrenton 2,800 1 Monthly Constant 1,500 Uniform Rate 113%
Warwick
Washington 4,134 1 Monthly Constant 0 Uniform Rate 150%
Water Service Company of Georgia - Lake Riverside - 0 Monthly None 0 Non-Volumetric Flat Charge
Waycross 21,154 1 Monthly Constant 0 Uniform Rate
Waynesboro 5,813 1 Monthly Constant 0 Uniform Rate
Webster County
West Point 3,929 1 Monthly Constant 0 Uniform Rate
Whigham
Service Population is approximated and may not be actual.
Source: 1=EPA SDWIS 2017, 2=Census Population in 2016
Georgia Environmental Finance Authority
and Environmental Finance Center
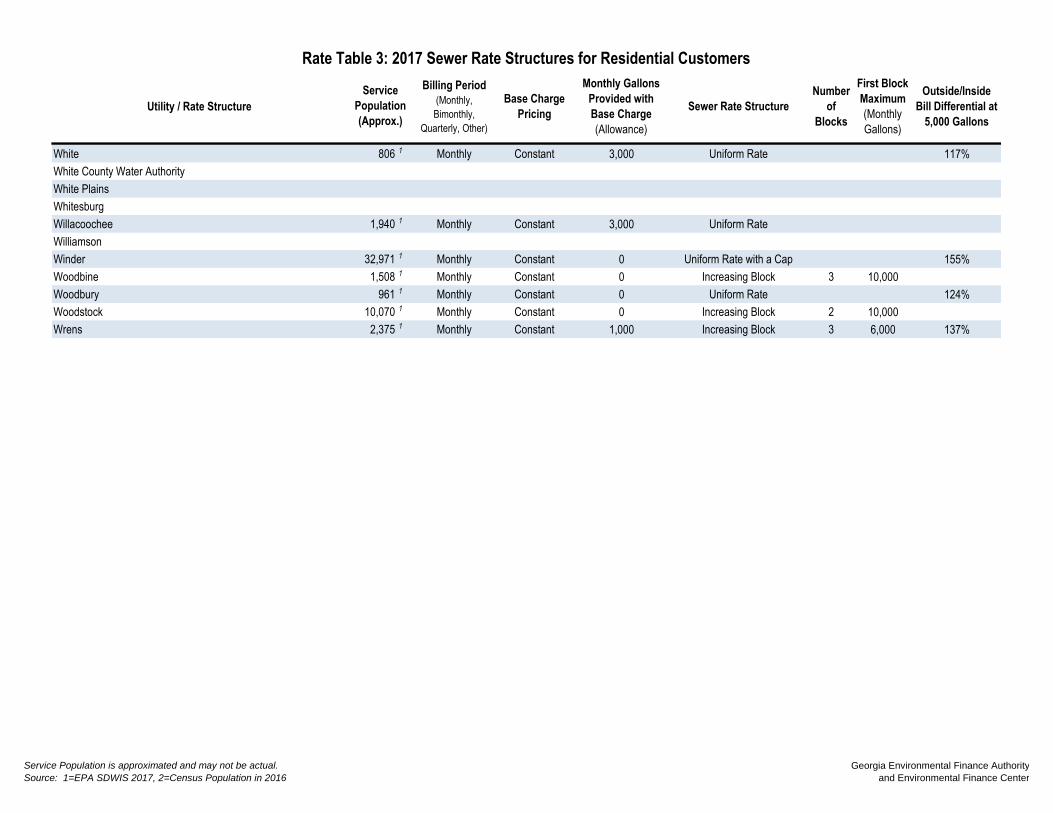
Utility / Rate Structure
Billing Period
(Monthly,
Bimonthly,
Quarterly, Other)
Base Charge
Pricing
Monthly Gallons
Provided with
Base Charge
(Allowance)
Sewer Rate Structure
Number
of
Blocks
First Block
Maximum
(Monthly
Gallons)
Outside/Inside
Bill Differential at
5,000 Gallons
Rate Table 3: 2017 Sewer Rate Structures for Residential Customers
Service
Population
(Approx.)
White 806 1 Monthly Constant 3,000 Uniform Rate 117%
White County Water Authority
White Plains
Whitesburg
Willacoochee 1,940 1 Monthly Constant 3,000 Uniform Rate
Williamson
Winder 32,971 1 Monthly Constant 0 Uniform Rate with a Cap 155%
Woodbine 1,508 1 Monthly Constant 0 Increasing Block 3 10,000
Woodbury 961 1 Monthly Constant 0 Uniform Rate 124%
Woodstock 10,070 1 Monthly Constant 0 Increasing Block 2 10,000
Wrens 2,375 1 Monthly Constant 1,000 Increasing Block 3 6,000 137%
Service Population is approximated and may not be actual.
Source: 1=EPA SDWIS 2017, 2=Census Population in 2016
Georgia Environmental Finance Authority
and Environmental Finance Center
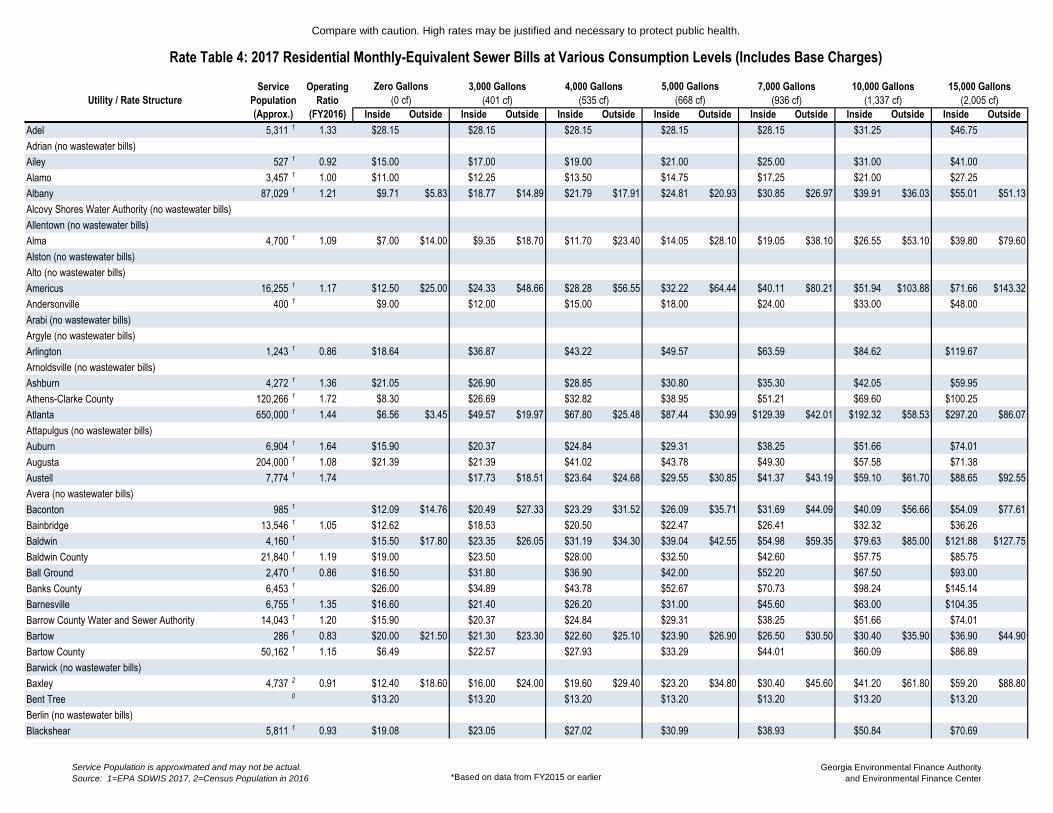
Compare with caution. High rates may be justified and necessary to protect public health.
Inside Outside Inside Outside Inside Outside Inside Outside Inside Outside Inside Outside Inside Outside
Adel 5,311 1 1.33 $28.15 $28.15 $28.15 $28.15 $28.15 $31.25 $46.75
Adrian (no wastewater bills)
Ailey 527 1 0.92 $15.00 $17.00 $19.00 $21.00 $25.00 $31.00 $41.00
Alamo 3,457 1 1.00 $11.00 $12.25 $13.50 $14.75 $17.25 $21.00 $27.25
Albany 87,029 1 1.21 $9.71 $5.83 $18.77 $14.89 $21.79 $17.91 $24.81 $20.93 $30.85 $26.97 $39.91 $36.03 $55.01 $51.13
Alcovy Shores Water Authority (no wastewater bills)
Allentown (no wastewater bills)
Alma 4,700 1 1.09 $7.00 $14.00 $9.35 $18.70 $11.70 $23.40 $14.05 $28.10 $19.05 $38.10 $26.55 $53.10 $39.80 $79.60
Alston (no wastewater bills)
Alto (no wastewater bills)
Americus 16,255 1 1.17 $12.50 $25.00 $24.33 $48.66 $28.28 $56.55 $32.22 $64.44 $40.11 $80.21 $51.94 $103.88 $71.66 $143.32
Andersonville 400 1 $9.00 $12.00 $15.00 $18.00 $24.00 $33.00 $48.00
Arabi (no wastewater bills)
Argyle (no wastewater bills)
Arlington 1,243 1 0.86 $18.64 $36.87 $43.22 $49.57 $63.59 $84.62 $119.67
Arnoldsville (no wastewater bills)
Ashburn 4,272 1 1.36 $21.05 $26.90 $28.85 $30.80 $35.30 $42.05 $59.95
Athens-Clarke County 120,266 1 1.72 $8.30 $26.69 $32.82 $38.95 $51.21 $69.60 $100.25
Atlanta 650,000 1 1.44 $6.56 $3.45 $49.57 $19.97 $67.80 $25.48 $87.44 $30.99 $129.39 $42.01 $192.32 $58.53 $297.20 $86.07
Attapulgus (no wastewater bills)
Auburn 6,904 1 1.64 $15.90 $20.37 $24.84 $29.31 $38.25 $51.66 $74.01
Augusta 204,000 1 1.08 $21.39 $21.39 $41.02 $43.78 $49.30 $57.58 $71.38
Austell 7,774 1 1.74 $17.73 $18.51 $23.64 $24.68 $29.55 $30.85 $41.37 $43.19 $59.10 $61.70 $88.65 $92.55
Avera (no wastewater bills)
Baconton 985 1 $12.09 $14.76 $20.49 $27.33 $23.29 $31.52 $26.09 $35.71 $31.69 $44.09 $40.09 $56.66 $54.09 $77.61
Bainbridge 13,546 1 1.05 $12.62 $18.53 $20.50 $22.47 $26.41 $32.32 $36.26
Baldwin 4,160 1 $15.50 $17.80 $23.35 $26.05 $31.19 $34.30 $39.04 $42.55 $54.98 $59.35 $79.63 $85.00 $121.88 $127.75
Baldwin County 21,840 1 1.19 $19.00 $23.50 $28.00 $32.50 $42.60 $57.75 $85.75
Ball Ground 2,470 1 0.86 $16.50 $31.80 $36.90 $42.00 $52.20 $67.50 $93.00
Banks County 6,453 1 $26.00 $34.89 $43.78 $52.67 $70.73 $98.24 $145.14
Barnesville 6,755 1 1.35 $16.60 $21.40 $26.20 $31.00 $45.60 $63.00 $104.35
Barrow County Water and Sewer Authority 14,043 1 1.20 $15.90 $20.37 $24.84 $29.31 $38.25 $51.66 $74.01
Bartow 286 1 0.83 $20.00 $21.50 $21.30 $23.30 $22.60 $25.10 $23.90 $26.90 $26.50 $30.50 $30.40 $35.90 $36.90 $44.90
Bartow County 50,162 1 1.15 $6.49 $22.57 $27.93 $33.29 $44.01 $60.09 $86.89
Barwick (no wastewater bills)
Baxley 4,737 2 0.91 $12.40 $18.60 $16.00 $24.00 $19.60 $29.40 $23.20 $34.80 $30.40 $45.60 $41.20 $61.80 $59.20 $88.80
Bent Tree 0 $13.20 $13.20 $13.20 $13.20 $13.20 $13.20 $13.20
Berlin (no wastewater bills)
Blackshear 5,811 1 0.93 $19.08 $23.05 $27.02 $30.99 $38.93 $50.84 $70.69
7,000 Gallons
(936 cf)
10,000 Gallons
(1,337 cf)
15,000 Gallons
(2,005 cf)
4,000 Gallons
(535 cf)
Operating
Ratio
(FY2016)
Rate Table 4: 2017 Residential Monthly-Equivalent Sewer Bills at Various Consumption Levels (Includes Base Charges)
Utility / Rate Structure
Service
Population
(Approx.)
Zero Gallons
(0 cf)
3,000 Gallons
(401 cf)
5,000 Gallons
(668 cf)
Service Population is approximated and may not be actual.
Source: 1=EPA SDWIS 2017, 2=Census Population in 2016 *Based on data from FY2015 or earlierGeorgia Environmental Finance Authority
and Environmental Finance Center
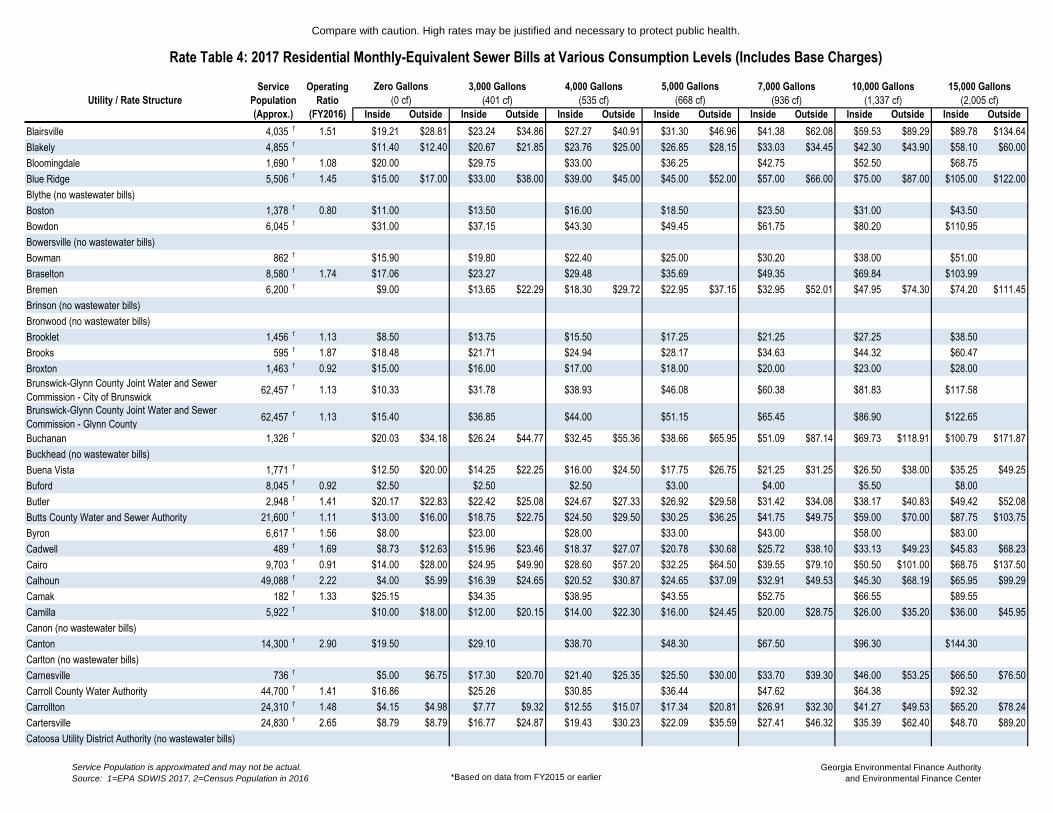
Compare with caution. High rates may be justified and necessary to protect public health.
Inside Outside Inside Outside Inside Outside Inside Outside Inside Outside Inside Outside Inside Outside
7,000 Gallons
(936 cf)
10,000 Gallons
(1,337 cf)
15,000 Gallons
(2,005 cf)
4,000 Gallons
(535 cf)
Operating
Ratio
(FY2016)
Rate Table 4: 2017 Residential Monthly-Equivalent Sewer Bills at Various Consumption Levels (Includes Base Charges)
Utility / Rate Structure
Service
Population
(Approx.)
Zero Gallons
(0 cf)
3,000 Gallons
(401 cf)
5,000 Gallons
(668 cf)
Blairsville 4,035 1 1.51 $19.21 $28.81 $23.24 $34.86 $27.27 $40.91 $31.30 $46.96 $41.38 $62.08 $59.53 $89.29 $89.78 $134.64
Blakely 4,855 1 $11.40 $12.40 $20.67 $21.85 $23.76 $25.00 $26.85 $28.15 $33.03 $34.45 $42.30 $43.90 $58.10 $60.00
Bloomingdale 1,690 1 1.08 $20.00 $29.75 $33.00 $36.25 $42.75 $52.50 $68.75
Blue Ridge 5,506 1 1.45 $15.00 $17.00 $33.00 $38.00 $39.00 $45.00 $45.00 $52.00 $57.00 $66.00 $75.00 $87.00 $105.00 $122.00
Blythe (no wastewater bills)
Boston 1,378 1 0.80 $11.00 $13.50 $16.00 $18.50 $23.50 $31.00 $43.50
Bowdon 6,045 1 $31.00 $37.15 $43.30 $49.45 $61.75 $80.20 $110.95
Bowersville (no wastewater bills)
Bowman 862 1 $15.90 $19.80 $22.40 $25.00 $30.20 $38.00 $51.00
Braselton 8,580 1 1.74 $17.06 $23.27 $29.48 $35.69 $49.35 $69.84 $103.99
Bremen 6,200 1 $9.00 $13.65 $22.29 $18.30 $29.72 $22.95 $37.15 $32.95 $52.01 $47.95 $74.30 $74.20 $111.45
Brinson (no wastewater bills)
Bronwood (no wastewater bills)
Brooklet 1,456 1 1.13 $8.50 $13.75 $15.50 $17.25 $21.25 $27.25 $38.50
Brooks 595 1 1.87 $18.48 $21.71 $24.94 $28.17 $34.63 $44.32 $60.47
Broxton 1,463 1 0.92 $15.00 $16.00 $17.00 $18.00 $20.00 $23.00 $28.00
Brunswick-Glynn County Joint Water and Sewer
Commission - City of Brunswick 62,457 1 1.13 $10.33 $31.78 $38.93 $46.08 $60.38 $81.83 $117.58
Brunswick-Glynn County Joint Water and Sewer
Commission - Glynn County 62,457 1 1.13 $15.40 $36.85 $44.00 $51.15 $65.45 $86.90 $122.65
Buchanan 1,326 1 $20.03 $34.18 $26.24 $44.77 $32.45 $55.36 $38.66 $65.95 $51.09 $87.14 $69.73 $118.91 $100.79 $171.87
Buckhead (no wastewater bills)
Buena Vista 1,771 1 $12.50 $20.00 $14.25 $22.25 $16.00 $24.50 $17.75 $26.75 $21.25 $31.25 $26.50 $38.00 $35.25 $49.25
Buford 8,045 1 0.92 $2.50 $2.50 $2.50 $3.00 $4.00 $5.50 $8.00
Butler 2,948 1 1.41 $20.17 $22.83 $22.42 $25.08 $24.67 $27.33 $26.92 $29.58 $31.42 $34.08 $38.17 $40.83 $49.42 $52.08
Butts County Water and Sewer Authority 21,600 1 1.11 $13.00 $16.00 $18.75 $22.75 $24.50 $29.50 $30.25 $36.25 $41.75 $49.75 $59.00 $70.00 $87.75 $103.75
Byron 6,617 1 1.56 $8.00 $23.00 $28.00 $33.00 $43.00 $58.00 $83.00
Cadwell 489 1 1.69 $8.73 $12.63 $15.96 $23.46 $18.37 $27.07 $20.78 $30.68 $25.72 $38.10 $33.13 $49.23 $45.83 $68.23
Cairo 9,703 1 0.91 $14.00 $28.00 $24.95 $49.90 $28.60 $57.20 $32.25 $64.50 $39.55 $79.10 $50.50 $101.00 $68.75 $137.50
Calhoun 49,088 1 2.22 $4.00 $5.99 $16.39 $24.65 $20.52 $30.87 $24.65 $37.09 $32.91 $49.53 $45.30 $68.19 $65.95 $99.29
Camak 182 1 1.33 $25.15 $34.35 $38.95 $43.55 $52.75 $66.55 $89.55
Camilla 5,922 1 $10.00 $18.00 $12.00 $20.15 $14.00 $22.30 $16.00 $24.45 $20.00 $28.75 $26.00 $35.20 $36.00 $45.95
Canon (no wastewater bills)
Canton 14,300 1 2.90 $19.50 $29.10 $38.70 $48.30 $67.50 $96.30 $144.30
Carlton (no wastewater bills)
Carnesville 736 1 $5.00 $6.75 $17.30 $20.70 $21.40 $25.35 $25.50 $30.00 $33.70 $39.30 $46.00 $53.25 $66.50 $76.50
Carroll County Water Authority 44,700 1 1.41 $16.86 $25.26 $30.85 $36.44 $47.62 $64.38 $92.32
Carrollton 24,310 1 1.48 $4.15 $4.98 $7.77 $9.32 $12.55 $15.07 $17.34 $20.81 $26.91 $32.30 $41.27 $49.53 $65.20 $78.24
Cartersville 24,830 1 2.65 $8.79 $8.79 $16.77 $24.87 $19.43 $30.23 $22.09 $35.59 $27.41 $46.32 $35.39 $62.40 $48.70 $89.20
Catoosa Utility District Authority (no wastewater bills)
Service Population is approximated and may not be actual.
Source: 1=EPA SDWIS 2017, 2=Census Population in 2016 *Based on data from FY2015 or earlierGeorgia Environmental Finance Authority
and Environmental Finance Center
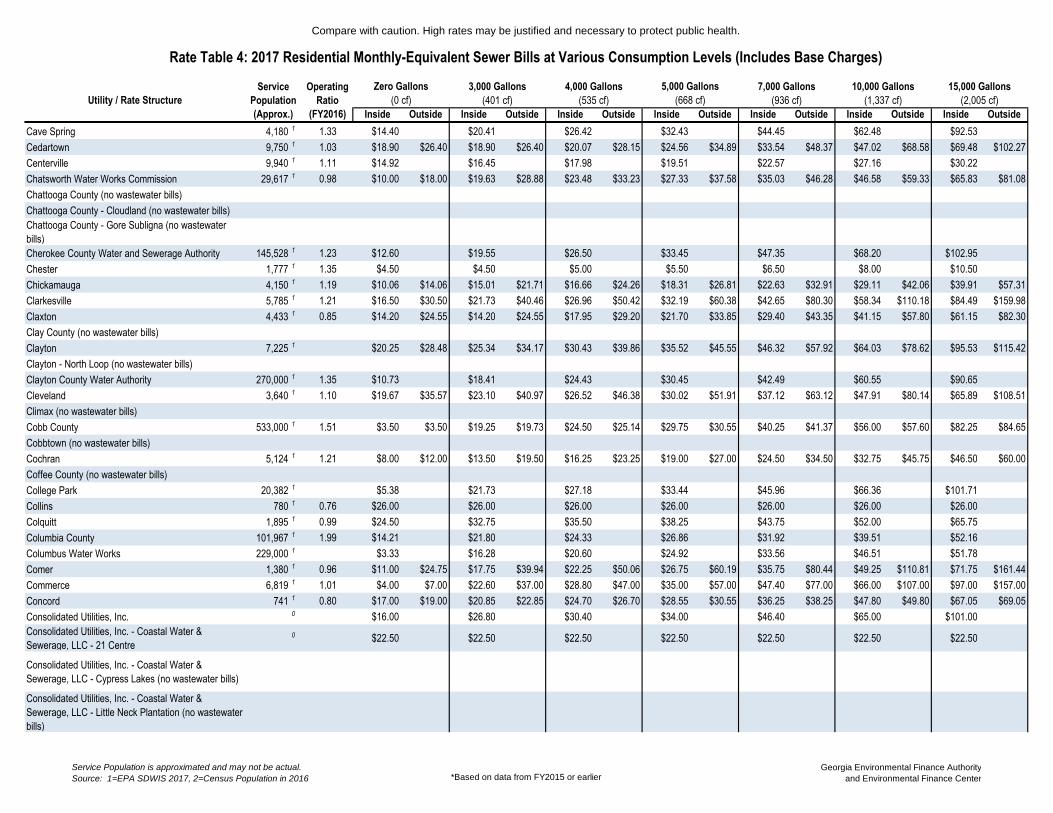
Compare with caution. High rates may be justified and necessary to protect public health.
Inside Outside Inside Outside Inside Outside Inside Outside Inside Outside Inside Outside Inside Outside
7,000 Gallons
(936 cf)
10,000 Gallons
(1,337 cf)
15,000 Gallons
(2,005 cf)
4,000 Gallons
(535 cf)
Operating
Ratio
(FY2016)
Rate Table 4: 2017 Residential Monthly-Equivalent Sewer Bills at Various Consumption Levels (Includes Base Charges)
Utility / Rate Structure
Service
Population
(Approx.)
Zero Gallons
(0 cf)
3,000 Gallons
(401 cf)
5,000 Gallons
(668 cf)
Cave Spring 4,180 1 1.33 $14.40 $20.41 $26.42 $32.43 $44.45 $62.48 $92.53
Cedartown 9,750 1 1.03 $18.90 $26.40 $18.90 $26.40 $20.07 $28.15 $24.56 $34.89 $33.54 $48.37 $47.02 $68.58 $69.48 $102.27
Centerville 9,940 1 1.11 $14.92 $16.45 $17.98 $19.51 $22.57 $27.16 $30.22
Chatsworth Water Works Commission 29,617 1 0.98 $10.00 $18.00 $19.63 $28.88 $23.48 $33.23 $27.33 $37.58 $35.03 $46.28 $46.58 $59.33 $65.83 $81.08
Chattooga County (no wastewater bills)
Chattooga County - Cloudland (no wastewater bills)
Chattooga County - Gore Subligna (no wastewater
bills)
Cherokee County Water and Sewerage Authority 145,528 1 1.23 $12.60 $19.55 $26.50 $33.45 $47.35 $68.20 $102.95
Chester 1,777 1 1.35 $4.50 $4.50 $5.00 $5.50 $6.50 $8.00 $10.50
Chickamauga 4,150 1 1.19 $10.06 $14.06 $15.01 $21.71 $16.66 $24.26 $18.31 $26.81 $22.63 $32.91 $29.11 $42.06 $39.91 $57.31
Clarkesville 5,785 1 1.21 $16.50 $30.50 $21.73 $40.46 $26.96 $50.42 $32.19 $60.38 $42.65 $80.30 $58.34 $110.18 $84.49 $159.98
Claxton 4,433 1 0.85 $14.20 $24.55 $14.20 $24.55 $17.95 $29.20 $21.70 $33.85 $29.40 $43.35 $41.15 $57.80 $61.15 $82.30
Clay County (no wastewater bills)
Clayton 7,225 1 $20.25 $28.48 $25.34 $34.17 $30.43 $39.86 $35.52 $45.55 $46.32 $57.92 $64.03 $78.62 $95.53 $115.42
Clayton - North Loop (no wastewater bills)
Clayton County Water Authority 270,000 1 1.35 $10.73 $18.41 $24.43 $30.45 $42.49 $60.55 $90.65
Cleveland 3,640 1 1.10 $19.67 $35.57 $23.10 $40.97 $26.52 $46.38 $30.02 $51.91 $37.12 $63.12 $47.91 $80.14 $65.89 $108.51
Climax (no wastewater bills)
Cobb County 533,000 1 1.51 $3.50 $3.50 $19.25 $19.73 $24.50 $25.14 $29.75 $30.55 $40.25 $41.37 $56.00 $57.60 $82.25 $84.65
Cobbtown (no wastewater bills)
Cochran 5,124 1 1.21 $8.00 $12.00 $13.50 $19.50 $16.25 $23.25 $19.00 $27.00 $24.50 $34.50 $32.75 $45.75 $46.50 $60.00
Coffee County (no wastewater bills)
College Park 20,382 1 $5.38 $21.73 $27.18 $33.44 $45.96 $66.36 $101.71
Collins 780 1 0.76 $26.00 $26.00 $26.00 $26.00 $26.00 $26.00 $26.00
Colquitt 1,895 1 0.99 $24.50 $32.75 $35.50 $38.25 $43.75 $52.00 $65.75
Columbia County 101,967 1 1.99 $14.21 $21.80 $24.33 $26.86 $31.92 $39.51 $52.16
Columbus Water Works 229,000 1 $3.33 $16.28 $20.60 $24.92 $33.56 $46.51 $51.78
Comer 1,380 1 0.96 $11.00 $24.75 $17.75 $39.94 $22.25 $50.06 $26.75 $60.19 $35.75 $80.44 $49.25 $110.81 $71.75 $161.44
Commerce 6,819 1 1.01 $4.00 $7.00 $22.60 $37.00 $28.80 $47.00 $35.00 $57.00 $47.40 $77.00 $66.00 $107.00 $97.00 $157.00
Concord 741 1 0.80 $17.00 $19.00 $20.85 $22.85 $24.70 $26.70 $28.55 $30.55 $36.25 $38.25 $47.80 $49.80 $67.05 $69.05
Consolidated Utilities, Inc. 0 $16.00 $26.80 $30.40 $34.00 $46.40 $65.00 $101.00
Consolidated Utilities, Inc. - Coastal Water &
Sewerage, LLC - 21 Centre 0 $22.50 $22.50 $22.50 $22.50 $22.50 $22.50 $22.50
Consolidated Utilities, Inc. - Coastal Water &
Sewerage, LLC - Cypress Lakes (no wastewater bills)
Consolidated Utilities, Inc. - Coastal Water &
Sewerage, LLC - Little Neck Plantation (no wastewater
bills)
Service Population is approximated and may not be actual.
Source: 1=EPA SDWIS 2017, 2=Census Population in 2016 *Based on data from FY2015 or earlierGeorgia Environmental Finance Authority
and Environmental Finance Center
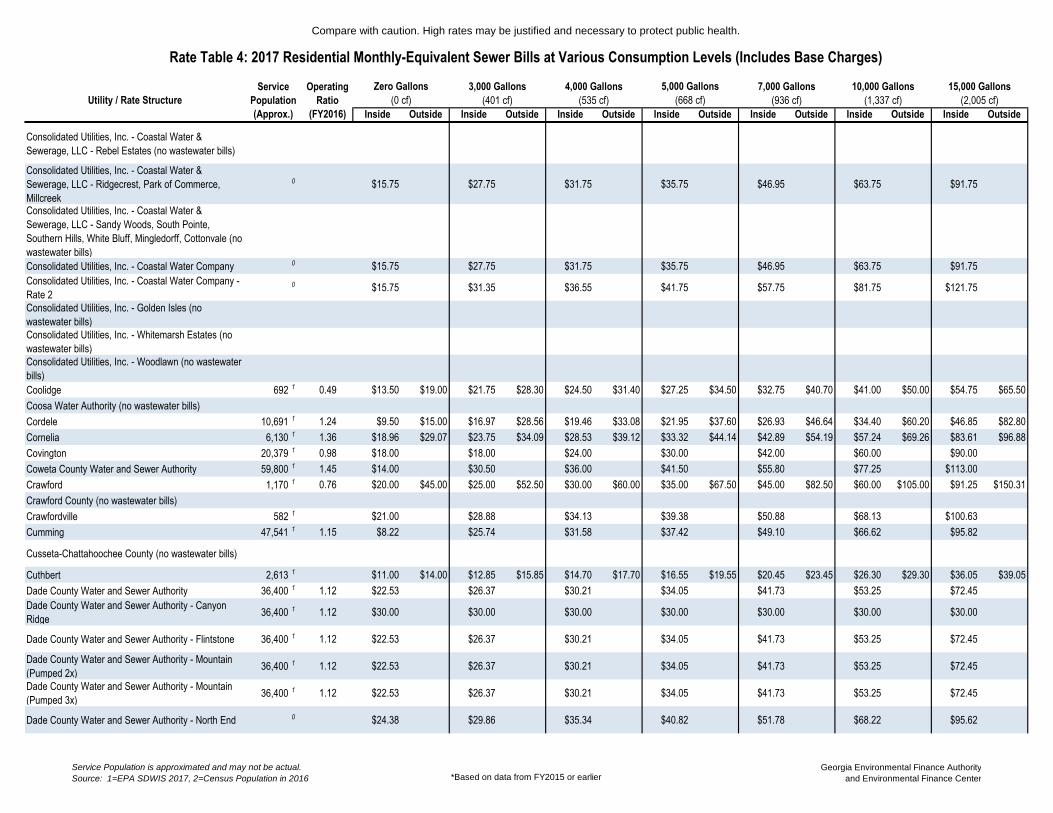
Compare with caution. High rates may be justified and necessary to protect public health.
Inside Outside Inside Outside Inside Outside Inside Outside Inside Outside Inside Outside Inside Outside
7,000 Gallons
(936 cf)
10,000 Gallons
(1,337 cf)
15,000 Gallons
(2,005 cf)
4,000 Gallons
(535 cf)
Operating
Ratio
(FY2016)
Rate Table 4: 2017 Residential Monthly-Equivalent Sewer Bills at Various Consumption Levels (Includes Base Charges)
Utility / Rate Structure
Service
Population
(Approx.)
Zero Gallons
(0 cf)
3,000 Gallons
(401 cf)
5,000 Gallons
(668 cf)
Consolidated Utilities, Inc. - Coastal Water &
Sewerage, LLC - Rebel Estates (no wastewater bills)
Consolidated Utilities, Inc. - Coastal Water &
Sewerage, LLC - Ridgecrest, Park of Commerce,
Millcreek
0 $15.75 $27.75 $31.75 $35.75 $46.95 $63.75 $91.75
Consolidated Utilities, Inc. - Coastal Water &
Sewerage, LLC - Sandy Woods, South Pointe,
Southern Hills, White Bluff, Mingledorff, Cottonvale (no
wastewater bills)
Consolidated Utilities, Inc. - Coastal Water Company 0 $15.75 $27.75 $31.75 $35.75 $46.95 $63.75 $91.75
Consolidated Utilities, Inc. - Coastal Water Company -
Rate 2 0 $15.75 $31.35 $36.55 $41.75 $57.75 $81.75 $121.75
Consolidated Utilities, Inc. - Golden Isles (no
wastewater bills)
Consolidated Utilities, Inc. - Whitemarsh Estates (no
wastewater bills)
Consolidated Utilities, Inc. - Woodlawn (no wastewater
bills)
Coolidge 692 1 0.49 $13.50 $19.00 $21.75 $28.30 $24.50 $31.40 $27.25 $34.50 $32.75 $40.70 $41.00 $50.00 $54.75 $65.50
Coosa Water Authority (no wastewater bills)
Cordele 10,691 1 1.24 $9.50 $15.00 $16.97 $28.56 $19.46 $33.08 $21.95 $37.60 $26.93 $46.64 $34.40 $60.20 $46.85 $82.80
Cornelia 6,130 1 1.36 $18.96 $29.07 $23.75 $34.09 $28.53 $39.12 $33.32 $44.14 $42.89 $54.19 $57.24 $69.26 $83.61 $96.88
Covington 20,379 1 0.98 $18.00 $18.00 $24.00 $30.00 $42.00 $60.00 $90.00
Coweta County Water and Sewer Authority 59,800 1 1.45 $14.00 $30.50 $36.00 $41.50 $55.80 $77.25 $113.00
Crawford 1,170 1 0.76 $20.00 $45.00 $25.00 $52.50 $30.00 $60.00 $35.00 $67.50 $45.00 $82.50 $60.00 $105.00 $91.25 $150.31
Crawford County (no wastewater bills)
Crawfordville 582 1 $21.00 $28.88 $34.13 $39.38 $50.88 $68.13 $100.63
Cumming 47,541 1 1.15 $8.22 $25.74 $31.58 $37.42 $49.10 $66.62 $95.82
Cusseta-Chattahoochee County (no wastewater bills)
Cuthbert 2,613 1 $11.00 $14.00 $12.85 $15.85 $14.70 $17.70 $16.55 $19.55 $20.45 $23.45 $26.30 $29.30 $36.05 $39.05
Dade County Water and Sewer Authority 36,400 1 1.12 $22.53 $26.37 $30.21 $34.05 $41.73 $53.25 $72.45
Dade County Water and Sewer Authority - Canyon
Ridge 36,400 1 1.12 $30.00 $30.00 $30.00 $30.00 $30.00 $30.00 $30.00
Dade County Water and Sewer Authority - Flintstone 36,400 1 1.12 $22.53 $26.37 $30.21 $34.05 $41.73 $53.25 $72.45
Dade County Water and Sewer Authority - Mountain
(Pumped 2x) 36,400 1 1.12 $22.53 $26.37 $30.21 $34.05 $41.73 $53.25 $72.45
Dade County Water and Sewer Authority - Mountain
(Pumped 3x) 36,400 1 1.12 $22.53 $26.37 $30.21 $34.05 $41.73 $53.25 $72.45
Dade County Water and Sewer Authority - North End 0 $24.38 $29.86 $35.34 $40.82 $51.78 $68.22 $95.62
Service Population is approximated and may not be actual.
Source: 1=EPA SDWIS 2017, 2=Census Population in 2016 *Based on data from FY2015 or earlierGeorgia Environmental Finance Authority
and Environmental Finance Center

Compare with caution. High rates may be justified and necessary to protect public health.
Inside Outside Inside Outside Inside Outside Inside Outside Inside Outside Inside Outside Inside Outside
7,000 Gallons
(936 cf)
10,000 Gallons
(1,337 cf)
15,000 Gallons
(2,005 cf)
4,000 Gallons
(535 cf)
Operating
Ratio
(FY2016)
Rate Table 4: 2017 Residential Monthly-Equivalent Sewer Bills at Various Consumption Levels (Includes Base Charges)
Utility / Rate Structure
Service
Population
(Approx.)
Zero Gallons
(0 cf)
3,000 Gallons
(401 cf)
5,000 Gallons
(668 cf)
Dade County Water and Sewer Authority - South End 36,400 1 1.12 $22.53 $36.75 $26.37 $40.59 $30.21 $44.43 $34.05 $48.27 $41.73 $55.95 $53.25 $67.47 $72.45 $86.67
Dade County Water and Sewer Authority - Valley 36,400 1 1.12 $22.53 $26.37 $30.21 $34.05 $41.73 $53.25 $72.45
Dahlonega 4,120 1 1.22 $13.48 $35.56 $42.92 $50.28 $65.00 $87.08 $123.88
Daisy (no wastewater bills)
Dallas 7,556 1 1.69 $10.31 $16.28 $26.13 $31.59 $34.84 $42.12 $43.55 $52.65 $63.08 $76.27 $95.54 $115.54 $164.45 $199.08
Damascus (no wastewater bills)
Danielsville 1,092 1 0.98 $11.50 $29.90 $15.24 $37.38 $18.98 $44.86 $22.72 $52.34 $31.69 $68.79 $47.38 $95.70 $73.53 $140.55
Danville (no wastewater bills)
Darien 3,242 1 0.98 $11.00 $14.00 $23.03 $29.27 $27.04 $34.36 $31.05 $39.45 $39.29 $49.89 $51.65 $65.55 $72.75 $92.30
Davisboro 1,535 1 $18.54 $26.19 $28.74 $31.29 $36.39 $44.04 $56.79
Dawson 4,836 1 1.59 $11.50 $14.70 $17.90 $21.10 $27.50 $37.10 $39.60
Dawsonville 2,424 1 1.21 $23.00 $34.50 $32.45 $46.58 $38.75 $54.63 $45.05 $62.68 $58.85 $79.88 $79.55 $105.68 $116.80 $151.68
Decatur Consolidated Water Services, Inc. -
Doublegate Phase VI (no wastewater bills)
Decatur Consolidated Water Services, Inc. - Holly
Isles (no wastewater bills)
Decatur Consolidated Water Services, Inc. - Pebble
Hill Estates (no wastewater bills)
Decatur Consolidated Water Services, Inc. - Redrock
Estates (no wastewater bills)
Decatur Consolidated Water Services, Inc. -
Riverbend Estates (no wastewater bills)
Decatur Consolidated Water Services, Inc. -
Woodcrest Subdivision (no wastewater bills)
Deepstep (no wastewater bills)
Dekalb County 670,000 1 $6.89 $40.91 $52.25 $63.59 $86.27 $120.29 $176.99
Demorest 15,130 1 1.17 $20.00 $27.00 $24.00 $31.50 $28.00 $36.00 $32.00 $40.50 $42.00 $51.00 $57.00 $66.75 $87.00 $101.75
Denton (no wastewater bills)
Dexter 1,976 1 0.99 $14.50 $17.00 $17.20 $19.70 $19.90 $22.40 $22.60 $25.10 $28.20 $30.70 $36.60 $39.10 $50.60 $53.10
Dillard 133 1 0.67 $20.00 $20.00 $20.00 $20.00 $20.00 $20.00 $20.00
Doerun 967 1 1.03 $11.00 $21.49 $25.48 $29.47 $37.97 $50.72 $73.62
Donalsonville 2,782 1 1.12 $10.40 $19.46 $22.48 $25.50 $31.74 $41.10 $57.20
Dooling (no wastewater bills)
Douglas 10,688 1 1.24 $11.34 $27.96 $33.50 $39.04 $50.12 $66.74 $94.44
Douglasville-Douglas County Water and Sewer
Authority 109,694 1 1.14 $6.04 $25.72 $32.28 $38.84 $54.17 $77.16 $115.48
Du Pont (no wastewater bills)
Dublin 17,500 1 1.09 $9.50 $15.20 $13.35 $22.90 $17.20 $30.60 $21.05 $38.30 $28.75 $53.70 $40.30 $76.80 $59.55 $115.30
Dudley 546 1 1.46 $25.89 $27.65 $29.41 $31.17 $34.69 $39.97 $48.77
East Dublin 2,657 1 0.65 $16.00 $21.00 $18.84 $24.53 $21.99 $28.45 $25.14 $32.37 $31.44 $40.21 $40.89 $51.97 $56.64 $71.57
East Point 33,712 1 $23.55 $23.55 $29.33 $35.11 $46.67 $64.01 $92.91
Service Population is approximated and may not be actual.
Source: 1=EPA SDWIS 2017, 2=Census Population in 2016 *Based on data from FY2015 or earlierGeorgia Environmental Finance Authority
and Environmental Finance Center
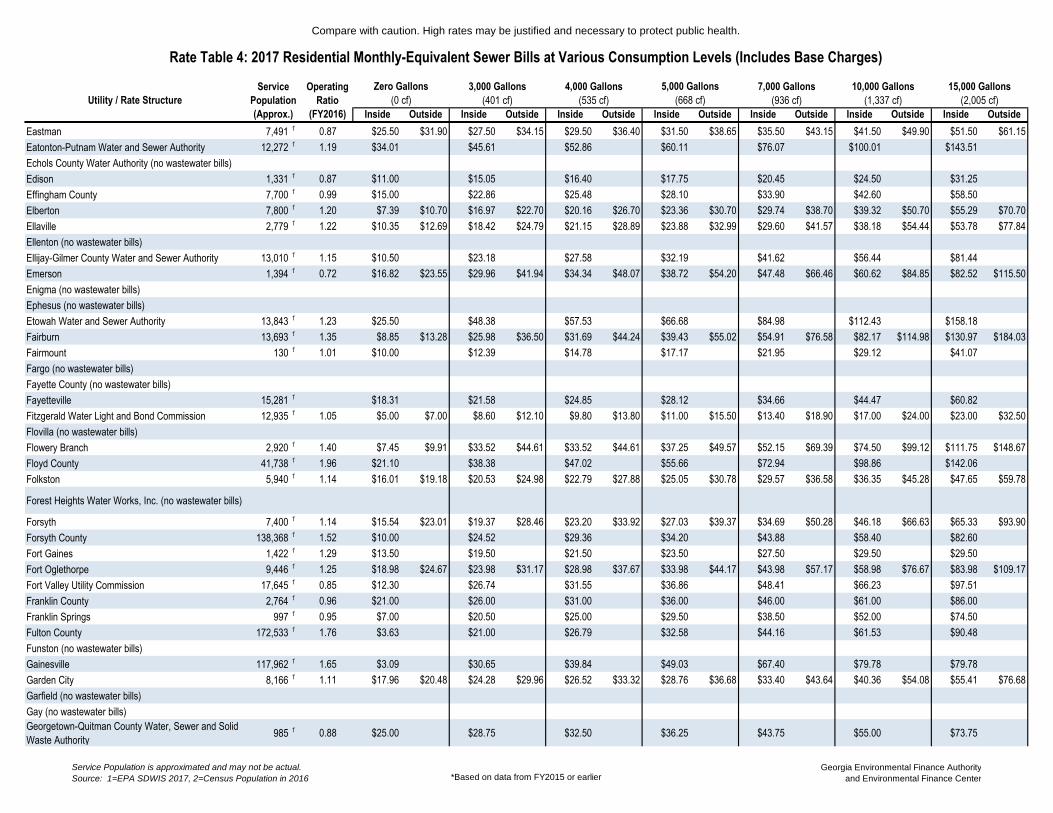
Compare with caution. High rates may be justified and necessary to protect public health.
Inside Outside Inside Outside Inside Outside Inside Outside Inside Outside Inside Outside Inside Outside
7,000 Gallons
(936 cf)
10,000 Gallons
(1,337 cf)
15,000 Gallons
(2,005 cf)
4,000 Gallons
(535 cf)
Operating
Ratio
(FY2016)
Rate Table 4: 2017 Residential Monthly-Equivalent Sewer Bills at Various Consumption Levels (Includes Base Charges)
Utility / Rate Structure
Service
Population
(Approx.)
Zero Gallons
(0 cf)
3,000 Gallons
(401 cf)
5,000 Gallons
(668 cf)
Eastman 7,491 1 0.87 $25.50 $31.90 $27.50 $34.15 $29.50 $36.40 $31.50 $38.65 $35.50 $43.15 $41.50 $49.90 $51.50 $61.15
Eatonton-Putnam Water and Sewer Authority 12,272 1 1.19 $34.01 $45.61 $52.86 $60.11 $76.07 $100.01 $143.51
Echols County Water Authority (no wastewater bills)
Edison 1,331 1 0.87 $11.00 $15.05 $16.40 $17.75 $20.45 $24.50 $31.25
Effingham County 7,700 1 0.99 $15.00 $22.86 $25.48 $28.10 $33.90 $42.60 $58.50
Elberton 7,800 1 1.20 $7.39 $10.70 $16.97 $22.70 $20.16 $26.70 $23.36 $30.70 $29.74 $38.70 $39.32 $50.70 $55.29 $70.70
Ellaville 2,779 1 1.22 $10.35 $12.69 $18.42 $24.79 $21.15 $28.89 $23.88 $32.99 $29.60 $41.57 $38.18 $54.44 $53.78 $77.84
Ellenton (no wastewater bills)
Ellijay-Gilmer County Water and Sewer Authority 13,010 1 1.15 $10.50 $23.18 $27.58 $32.19 $41.62 $56.44 $81.44
Emerson 1,394 1 0.72 $16.82 $23.55 $29.96 $41.94 $34.34 $48.07 $38.72 $54.20 $47.48 $66.46 $60.62 $84.85 $82.52 $115.50
Enigma (no wastewater bills)
Ephesus (no wastewater bills)
Etowah Water and Sewer Authority 13,843 1 1.23 $25.50 $48.38 $57.53 $66.68 $84.98 $112.43 $158.18
Fairburn 13,693 1 1.35 $8.85 $13.28 $25.98 $36.50 $31.69 $44.24 $39.43 $55.02 $54.91 $76.58 $82.17 $114.98 $130.97 $184.03
Fairmount 130 1 1.01 $10.00 $12.39 $14.78 $17.17 $21.95 $29.12 $41.07
Fargo (no wastewater bills)
Fayette County (no wastewater bills)
Fayetteville 15,281 1 $18.31 $21.58 $24.85 $28.12 $34.66 $44.47 $60.82
Fitzgerald Water Light and Bond Commission 12,935 1 1.05 $5.00 $7.00 $8.60 $12.10 $9.80 $13.80 $11.00 $15.50 $13.40 $18.90 $17.00 $24.00 $23.00 $32.50
Flovilla (no wastewater bills)
Flowery Branch 2,920 1 1.40 $7.45 $9.91 $33.52 $44.61 $33.52 $44.61 $37.25 $49.57 $52.15 $69.39 $74.50 $99.12 $111.75 $148.67
Floyd County 41,738 1 1.96 $21.10 $38.38 $47.02 $55.66 $72.94 $98.86 $142.06
Folkston 5,940 1 1.14 $16.01 $19.18 $20.53 $24.98 $22.79 $27.88 $25.05 $30.78 $29.57 $36.58 $36.35 $45.28 $47.65 $59.78
Forest Heights Water Works, Inc. (no wastewater bills)
Forsyth 7,400 1 1.14 $15.54 $23.01 $19.37 $28.46 $23.20 $33.92 $27.03 $39.37 $34.69 $50.28 $46.18 $66.63 $65.33 $93.90
Forsyth County 138,368 1 1.52 $10.00 $24.52 $29.36 $34.20 $43.88 $58.40 $82.60
Fort Gaines 1,422 1 1.29 $13.50 $19.50 $21.50 $23.50 $27.50 $29.50 $29.50
Fort Oglethorpe 9,446 1 1.25 $18.98 $24.67 $23.98 $31.17 $28.98 $37.67 $33.98 $44.17 $43.98 $57.17 $58.98 $76.67 $83.98 $109.17
Fort Valley Utility Commission 17,645 1 0.85 $12.30 $26.74 $31.55 $36.86 $48.41 $66.23 $97.51
Franklin County 2,764 1 0.96 $21.00 $26.00 $31.00 $36.00 $46.00 $61.00 $86.00
Franklin Springs 997 1 0.95 $7.00 $20.50 $25.00 $29.50 $38.50 $52.00 $74.50
Fulton County 172,533 1 1.76 $3.63 $21.00 $26.79 $32.58 $44.16 $61.53 $90.48
Funston (no wastewater bills)
Gainesville 117,962 1 1.65 $3.09 $30.65 $39.84 $49.03 $67.40 $79.78 $79.78
Garden City 8,166 1 1.11 $17.96 $20.48 $24.28 $29.96 $26.52 $33.32 $28.76 $36.68 $33.40 $43.64 $40.36 $54.08 $55.41 $76.68
Garfield (no wastewater bills)
Gay (no wastewater bills)
Georgetown-Quitman County Water, Sewer and Solid
Waste Authority 985 1 0.88 $25.00 $28.75 $32.50 $36.25 $43.75 $55.00 $73.75
Service Population is approximated and may not be actual.
Source: 1=EPA SDWIS 2017, 2=Census Population in 2016 *Based on data from FY2015 or earlierGeorgia Environmental Finance Authority
and Environmental Finance Center

Compare with caution. High rates may be justified and necessary to protect public health.
Inside Outside Inside Outside Inside Outside Inside Outside Inside Outside Inside Outside Inside Outside
7,000 Gallons
(936 cf)
10,000 Gallons
(1,337 cf)
15,000 Gallons
(2,005 cf)
4,000 Gallons
(535 cf)
Operating
Ratio
(FY2016)
Rate Table 4: 2017 Residential Monthly-Equivalent Sewer Bills at Various Consumption Levels (Includes Base Charges)
Utility / Rate Structure
Service
Population
(Approx.)
Zero Gallons
(0 cf)
3,000 Gallons
(401 cf)
5,000 Gallons
(668 cf)
Gibson 720 1 0.89 $18.00 $18.00 $20.00 $22.00 $26.00 $32.00 $42.00
Glennville 4,711 1 1.00 $15.00 $16.75 $18.50 $20.25 $24.75 $31.50 $45.25
Glenwood 1,012 1 0.62 $20.00 $22.00 $24.00 $26.00 $30.00 $36.00 $46.00
Gordon 2,340 1 0.62 $6.83 $8.41 $9.99 $11.57 $14.73 $19.47 $27.37
Graham (no wastewater bills)
Grantville 1,508 1 $20.00 $26.00 $32.00 $38.00 $50.00 $68.00 $98.00
Greensboro 3,156 1 1.67 $25.40 $28.96 $25.40 $28.96 $33.87 $38.61 $42.34 $48.26 $59.28 $67.56 $84.69 $96.51 $127.04 $144.76
Greenville 1,880 1 0.68 $15.00 $18.50 $32.10 $38.06 $37.80 $44.58 $43.50 $51.10 $54.90 $64.14 $72.00 $83.70 $100.50 $116.30
Griffin 23,643 1 1.03 $17.58 $25.63 $33.68 $41.73 $57.83 $81.98 $122.23
Griffin - Spalding County (no wastewater bills)
Grovetown 11,216 1 $12.90 $20.10 $12.90 $20.10 $17.20 $26.80 $21.50 $33.50 $30.10 $46.90 $43.00 $67.00 $64.75 $100.75
Guyton 2,394 1 2.31 $23.41 $27.24 $31.07 $34.90 $42.56 $54.05 $73.20
Gwinnett County 795,657 1 1.56 $5.00 $28.94 $36.92 $44.90 $60.86 $84.80 $124.70
Hahira 2,846 1 0.86 $19.64 $19.64 $24.95 $30.26 $40.88 $56.81 $83.36
Hall County 190,482 2 1.02 $12.00 $39.56 $48.75 $57.94 $76.32 $88.70 $88.70
Hamilton 928 1 1.52 $15.00 $24.00 $27.00 $30.00 $36.00 $45.00 $60.00
Hampton 7,305 1 1.11 $9.25 $34.66 $43.13 $51.60 $70.31 $101.04 $167.88
Hancock County 900 1 0.35 $28.00 $28.00 $28.00 $28.00 $28.00 $28.00 $28.00
Hapeville 5,385 1 1.39 $12.24 $20.01 $27.78 $35.55 $51.09 $74.48 $117.38
Haralson County Water Authority (no wastewater bills)
Harlem 5,356 1 1.01 $13.93 $17.72 $21.51 $25.30 $32.88 $44.25 $63.20
Harris County (no wastewater bills)
Harrison 500 1 0.44 $10.00 $12.70 $15.40 $18.10 $23.50 $31.60 $45.10
Hart County Water and Sewer Authority 3,606 1 1.10 $19.00 $30.00 $35.50 $41.00 $52.00 $68.50 $109.75
Hartford Water Authority (no wastewater bills)
Hartwell 7,116 1 1.13 $11.67 $17.23 $15.80 $23.02 $19.93 $28.81 $24.06 $34.60 $32.32 $46.18 $44.71 $63.55 $65.36 $92.50
Hawkinsville 4,856 1 1.12 $11.00 $22.00 $12.50 $23.50 $15.50 $26.50 $18.50 $29.50 $24.50 $35.50 $33.50 $44.50 $48.50 $59.50
Hazlehurst 5,800 1 1.09 $15.50 $23.00 $18.00 $26.62 $20.50 $30.24 $23.00 $33.86 $28.00 $41.10 $35.50 $51.96 $48.00 $70.06
Heard County Water Authority 8,172 1 0.85 $13.95 $28.95 $33.95 $38.95 $48.95 $63.95 $88.95
Helen 1,851 1 0.87 $14.86 $18.10 $24.58 $31.21 $27.82 $35.58 $31.06 $39.95 $38.18 $49.67 $48.86 $64.25 $66.66 $88.55
Henry County Water Authority 218,667 1 0.88 $12.39 $18.59 $26.70 $40.05 $31.47 $47.21 $36.24 $54.36 $47.51 $71.27 $67.01 $100.52 $99.51 $149.27
Hephzibah 4,500 1 0.84 $11.00 $11.50 $12.50 $13.50 $15.50 $18.50 $23.50
Hiawassee - above booster 5,496 1 1.04 $24.88 $28.61 $37.48 $43.01 $43.78 $50.21 $50.08 $57.41 $62.68 $71.81 $81.58 $93.41 $113.08 $129.41
Hiawassee - below booster 5,496 1 1.04 $24.88 $28.61 $37.48 $43.01 $43.78 $50.21 $50.08 $57.41 $62.68 $71.81 $81.58 $93.41 $113.08 $129.41
Hiltonia 392 1 1.12 $12.50 $12.50 $12.50 $14.75 $19.50 $27.50 $42.50
Hinesville 23,400 1 0.89 $13.71 $20.57 $13.71 $20.57 $13.71 $20.57 $13.71 $20.57 $17.99 $26.99 $25.01 $37.52 $37.31 $55.97
Hiram (no wastewater bills)
Hoboken (no wastewater bills)
Service Population is approximated and may not be actual.
Source: 1=EPA SDWIS 2017, 2=Census Population in 2016 *Based on data from FY2015 or earlierGeorgia Environmental Finance Authority
and Environmental Finance Center

Compare with caution. High rates may be justified and necessary to protect public health.
Inside Outside Inside Outside Inside Outside Inside Outside Inside Outside Inside Outside Inside Outside
7,000 Gallons
(936 cf)
10,000 Gallons
(1,337 cf)
15,000 Gallons
(2,005 cf)
4,000 Gallons
(535 cf)
Operating
Ratio
(FY2016)
Rate Table 4: 2017 Residential Monthly-Equivalent Sewer Bills at Various Consumption Levels (Includes Base Charges)
Utility / Rate Structure
Service
Population
(Approx.)
Zero Gallons
(0 cf)
3,000 Gallons
(401 cf)
5,000 Gallons
(668 cf)
Hogansville 3,728 1 0.74 $17.00 $22.00 $33.50 $46.00 $39.00 $54.00 $44.50 $62.00 $57.50 $82.00 $77.00 $112.00 $109.50 $162.00
Homeland (no wastewater bills)
Homer (no wastewater bills)
Hoschton 1,547 1 0.90 $18.30 $40.05 $47.74 $55.43 $76.79 $108.83 $162.23
Houston County (no wastewater bills)
Ideal 450 1 0.91 $14.95 $19.43 $21.67 $23.91 $28.39 $35.11 $46.31
Ila (no wastewater bills)
Iron City (no wastewater bills)
Irwinton (no wastewater bills)
Ivey 1,086 1 $28.00 $31.50 $35.00 $38.50 $45.50 $56.00 $73.50
Jackson 4,950 2 1.26 $12.00 $14.00 $14.97 $22.26 $17.94 $30.52 $20.91 $38.78 $26.85 $55.30 $35.76 $80.08 $50.61 $121.38
Jackson County Water and Sewer Authority 19,191 1 1.20 $19.08 $31.49 $39.76 $48.03 $64.57 $89.38 $130.73
Jacksonville (no wastewater bills)
Jakin (no wastewater bills)
Jasper 9,850 1 1.08 $10.00 $12.00 $16.45 $21.45 $18.60 $24.60 $20.75 $27.75 $25.05 $34.05 $31.50 $43.50 $42.25 $59.25
Jekyll Island Authority 2,083 1 $7.99 $19.24 $22.99 $26.74 $34.24 $45.49 $64.24
Jenkinsburg (no wastewater bills)
Jesup 10,200 1 0.99 $11.65 $20.58 $23.59 $26.60 $33.02 $42.65 $60.20
Jones County 10,795 1 0.86 $18.00 $31.98 $36.64 $41.30 $50.62 $64.60 $87.90
Keysville 351 1 0.92 $20.00 $22.69 $25.38 $28.07 $33.45 $41.52 $54.97
Kingsland 18,697 1 1.36 $12.65 $17.15 $19.04 $27.50 $21.17 $30.95 $23.30 $34.40 $27.90 $41.64 $35.31 $53.01 $47.66 $71.96
Kingston (no wastewater bills)
Kite (no wastewater bills)
LaFayette 18,177 1 1.67 $8.40 $12.60 $17.04 $25.56 $19.92 $29.88 $22.80 $34.20 $28.56 $42.84 $37.20 $55.80 $51.60 $77.40
Lagrange 41,852 1 1.06 $15.30 $22.97 $20.40 $30.63 $25.50 $38.28 $35.70 $53.60 $51.00 $76.57 $76.50 $114.85
Lake Park (no wastewater bills)
Lakeland 2,922 1 0.16 $10.00 $14.50 $16.75 $19.00 $23.50 $30.25 $41.50
Lavonia 8,008 1 0.89 $9.00 $14.50 $15.00 $21.05 $21.00 $27.60 $27.00 $34.15 $39.00 $47.25 $57.00 $66.90 $87.00 $99.65
Lawrenceville (no wastewater bills)
Lee County Utility Authority 13,500 1 1.19 $19.00 $25.75 $28.00 $30.25 $34.75 $42.00 $55.75
Leesburg 3,003 1 0.70 $12.00 $19.50 $22.00 $24.50 $29.50 $37.00 $49.50
Lenox 1,011 1 0.81 $11.57 $17.36 $23.27 $34.91 $27.17 $40.76 $31.07 $46.61 $40.17 $60.27 $53.82 $80.76 $78.22 $117.31
Leslie (no wastewater bills)
Lexington 796 1 0.67 $20.00 $25.00 $30.00 $35.00 $45.00 $60.00 $91.25
Liberty County (no wastewater bills)
Lincoln County 3,256 1 1.27 $29.02 $39.39 $46.30 $53.21 $67.03 $87.76 $122.31
Lincolnton 1,657 1 1.14 $19.50 $26.78 $31.63 $36.48 $46.18 $60.73 $84.98
Locust Grove 5,648 1 $15.39 $24.13 $32.87 $41.61 $59.09 $85.31 $141.31
Loganville 10,923 1 1.11 $20.91 $26.16 $31.41 $36.66 $47.16 $65.07 $98.63
Service Population is approximated and may not be actual.
Source: 1=EPA SDWIS 2017, 2=Census Population in 2016 *Based on data from FY2015 or earlierGeorgia Environmental Finance Authority
and Environmental Finance Center

Compare with caution. High rates may be justified and necessary to protect public health.
Inside Outside Inside Outside Inside Outside Inside Outside Inside Outside Inside Outside Inside Outside
7,000 Gallons
(936 cf)
10,000 Gallons
(1,337 cf)
15,000 Gallons
(2,005 cf)
4,000 Gallons
(535 cf)
Operating
Ratio
(FY2016)
Rate Table 4: 2017 Residential Monthly-Equivalent Sewer Bills at Various Consumption Levels (Includes Base Charges)
Utility / Rate Structure
Service
Population
(Approx.)
Zero Gallons
(0 cf)
3,000 Gallons
(401 cf)
5,000 Gallons
(668 cf)
Lone Oak (no wastewater bills)
Lookout Mountain 1,754 2 1.43 $11.10 $30.23 $36.61 $42.99 $55.74 $74.87 $106.76
Louisville 2,575 1 1.18 $17.00 $20.50 $24.00 $27.50 $34.50 $41.00 $41.00
Lowndes County 13,988 1 1.33 $23.03 $23.03 $27.06 $31.09 $40.35 $56.04 $74.55
Ludowici 1,651 1 0.86 $12.00 $13.75 $15.50 $17.35 $21.10 $26.90 $36.65
Lula 2,714 1 0.76 $13.75 $32.44 $38.67 $44.90 $58.20 $78.15 $112.55
Lumber City 993 1 $19.25 $19.25 $19.25 $21.25 $25.25 $31.25 $41.25
Lumpkin (no wastewater bills)
Lumpkin County Water and Sewer Authority (no
wastewater bills)
Luthersville (no wastewater bills)
Lyerly 1,360 1 1.54 $20.00 $21.45 $24.35 $27.25 $33.05 $41.75 $56.25
Lyons 4,100 1 0.90 $10.00 $20.00 $10.00 $20.00 $12.10 $24.20 $14.20 $28.40 $18.40 $36.80 $24.70 $49.40 $37.80 $75.60
Macon Water Authority - Bibb County 130,024 1 1.10 $9.00 $16.97 $19.71 $22.45 $27.93 $36.14 $49.83
Macon Water Authority - Jones County 130,024 1 1.10 $18.00 $31.98 $36.64 $41.30 $50.62 $64.60 $87.90
Macon Water Authority - Monroe County 130,024 1 1.10 $10.00 $22.91 $27.22 $31.52 $40.13 $53.05 $74.57
Madison 5,215 1 1.65 $4.60 $23.50 $29.80 $36.10 $48.70 $67.60 $99.10
Manchester 4,995 1 1.08 $15.00 $29.46 $34.28 $39.10 $48.74 $63.20 $87.30
Mansfield 791 1 0.71 $16.00 $26.35 $29.80 $33.25 $45.43 $63.70 $94.15
Marietta Power and Water 60,100 1 1.57 $15.10 $22.65 $30.20 $37.75 $52.85 $75.50 $113.25
Marion County (no wastewater bills)
Marshallville 1,241 1 $16.98 $27.89 $31.84 $35.79 $43.69 $55.54 $77.29
Martin (no wastewater bills)
Maxeys (no wastewater bills)
Maysville 2,057 1 $19.10 $24.83 $30.56 $36.29 $47.75 $64.94 $93.59
McCaysville 7,020 1 1.31 $15.00 $22.50 $33.00 $49.50 $39.00 $58.50 $45.00 $67.50 $57.00 $85.50 $75.00 $112.50 $105.00 $157.50
McDonough 8,962 1 1.07 $12.39 $26.43 $31.11 $35.79 $46.84 $65.95 $97.80
McIntosh County (no wastewater bills)
McIntyre (no wastewater bills)
McRae-Helena 5,488 1 0.97 $5.91 $8.86 $8.99 $13.52 $11.94 $17.99 $14.89 $22.46 $20.65 $31.18 $29.04 $43.83 $42.89 $64.58
Meansville (no wastewater bills)
Meigs 1,154 1 0.85 $14.34 $22.89 $25.66 $39.17 $29.56 $44.73 $33.46 $50.29 $41.26 $61.99 $52.96 $79.54 $72.46 $108.79
Menlo 949 1 1.38 $4.60 $9.10 $10.60 $12.10 $15.10 $19.60 $27.10
Metter 4,776 1 0.95 $9.00 $13.72 $16.77 $19.82 $25.92 $35.07 $50.92
Midville 700 1 0.63 $10.28 $12.88 $15.17 $20.20 $16.80 $22.64 $18.43 $25.08 $22.33 $30.94 $28.18 $39.73 $39.58 $56.78
Midway 2,595 1 1.49 $24.90 $28.21 $32.98 $37.90 $35.96 $41.47 $38.94 $45.04 $45.74 $53.20 $55.94 $65.44 $75.09 $88.39
Milledgeville 19,456 1 0.96 $12.89 $20.48 $12.89 $20.48 $16.88 $27.06 $20.87 $33.64 $28.85 $46.80 $40.82 $66.54 $60.77 $99.44
Millen 4,000 1 1.22 $13.50 $13.50 $21.48 $22.38 $24.14 $25.34 $26.80 $28.30 $32.12 $34.22 $40.10 $43.10 $53.40 $57.90
Milner 902 1 $21.00 $27.00 $33.00 $39.00 $51.50 $70.25 $102.75
Service Population is approximated and may not be actual.
Source: 1=EPA SDWIS 2017, 2=Census Population in 2016 *Based on data from FY2015 or earlierGeorgia Environmental Finance Authority
and Environmental Finance Center

Compare with caution. High rates may be justified and necessary to protect public health.
Inside Outside Inside Outside Inside Outside Inside Outside Inside Outside Inside Outside Inside Outside
7,000 Gallons
(936 cf)
10,000 Gallons
(1,337 cf)
15,000 Gallons
(2,005 cf)
4,000 Gallons
(535 cf)
Operating
Ratio
(FY2016)
Rate Table 4: 2017 Residential Monthly-Equivalent Sewer Bills at Various Consumption Levels (Includes Base Charges)
Utility / Rate Structure
Service
Population
(Approx.)
Zero Gallons
(0 cf)
3,000 Gallons
(401 cf)
5,000 Gallons
(668 cf)
Mitchell (no wastewater bills)
Molena (no wastewater bills)
Monroe 21,739 1 1.20 $15.00 $20.00 $25.74 $35.99 $29.32 $41.32 $32.90 $46.65 $40.06 $57.31 $50.80 $73.30 $68.70 $99.95
Monroe County (no wastewater bills)
Montezuma 3,443 1 1.08 $12.45 $24.95 $29.45 $33.95 $42.95 $56.45 $81.45
Monticello 3,505 1 1.46 $24.00 $27.50 $31.00 $36.50 $47.60 $64.40 $92.40
Morganton (no wastewater bills)
Morven (no wastewater bills)
Moultrie 15,634 1 1.46 $20.50 $23.15 $25.80 $28.45 $33.75 $41.70 $54.95
Mount Airy (no wastewater bills)
Mount Zion (no wastewater bills)
Mountain Park 798 1 $13.88 $27.75 $27.75 $40.00 $64.50 $101.25 $162.50
MSO Water Systems, Inc. (no wastewater bills)
MSO Water Systems, Inc. - Briarcrest (no wastewater
bills)
MSO Water Systems, Inc. - English Oaks (no
wastewater bills)
Nahunta 1,074 1 1.25 $14.65 $23.95 $27.25 $30.55 $37.15 $47.05 $63.55
Nashville 4,896 1 1.32 $16.50 $23.34 $25.94 $28.54 $34.40 $43.19 $59.44
Newborn (no wastewater bills)
Newington 227 1 0.74 $17.00 $18.50 $20.00 $21.50 $24.80 $29.85 $39.85
Newnan Utilities 34,000 1 $12.25 $30.04 $35.97 $43.67 $59.07 $82.17 $120.67
Newton (no wastewater bills)
Newton County Water and Sewer Authority 62,384 1 1.31 $12.25 $26.47 $33.58 $40.69 $54.91 $76.24 $111.79
Nicholls 2,745 1 1.09 $9.93 $13.90 $15.27 $16.64 $19.90 $24.79 $32.94
Nicholson Water Authority (no wastewater bills)
Norman Park 1,173 1 0.96 $15.01 $20.33 $27.41 $38.93 $31.81 $45.53 $36.21 $52.13 $45.81 $66.53 $60.21 $88.13 $86.21 $127.13
Norwood 364 1 $18.00 $20.20 $22.40 $24.60 $27.60 $32.10 $37.10
Notla Water Authority (no wastewater bills)
Oakwood - Flowery Branch 4,098 2 0.96 $12.75 $57.38 $57.38 $63.75 $89.25 $127.50 $191.25
Oakwood - Gainesville 4,098 2 0.96 $38.26 $51.02 $63.77 $89.28 $127.54 $191.31
Ochlocknee 789 1 0.54 $20.00 $22.00 $23.00 $24.00 $26.00 $29.00 $34.00
Ocilla 2,540 1 1.01 $12.75 $20.25 $14.25 $21.75 $15.75 $23.25 $17.25 $24.75 $20.25 $27.75 $24.75 $32.25 $32.25 $39.75
Oconee (no wastewater bills)
Oconee County 19,279 1 2.44 $18.74 $29.34 $34.64 $39.94 $50.54 $66.44 $92.94
Odum 645 1 0.68 $13.50 $17.00 $18.75 $20.50 $24.50 $30.50 $41.00
Oxford 2,214 1 1.35 $21.68 $21.68 $28.91 $36.14 $50.60 $72.29 $108.44
Palmetto 3,965 1 $14.65 $24.55 $34.45 $44.35 $64.15 $93.85 $143.35
Parrott (no wastewater bills)
Patterson 972 1 0.85 $21.06 $25.80 $29.22 $38.01 $32.28 $42.59 $35.34 $47.17 $42.14 $57.35 $52.34 $72.62 $70.99 $100.62
Service Population is approximated and may not be actual.
Source: 1=EPA SDWIS 2017, 2=Census Population in 2016 *Based on data from FY2015 or earlierGeorgia Environmental Finance Authority
and Environmental Finance Center

Compare with caution. High rates may be justified and necessary to protect public health.
Inside Outside Inside Outside Inside Outside Inside Outside Inside Outside Inside Outside Inside Outside
7,000 Gallons
(936 cf)
10,000 Gallons
(1,337 cf)
15,000 Gallons
(2,005 cf)
4,000 Gallons
(535 cf)
Operating
Ratio
(FY2016)
Rate Table 4: 2017 Residential Monthly-Equivalent Sewer Bills at Various Consumption Levels (Includes Base Charges)
Utility / Rate Structure
Service
Population
(Approx.)
Zero Gallons
(0 cf)
3,000 Gallons
(401 cf)
5,000 Gallons
(668 cf)
Paulding County 113,204 1 1.04 $2.50 $24.85 $32.30 $39.75 $54.65 $77.00 $114.25
Pavo (no wastewater bills)
Peachtree City Water and Sewerage Authority 34,988 2 2.84 $26.00 $39.95 $44.60 $49.25 $58.55 $72.50 $95.75
Pearson 2,000 2 1.14 $14.45 $33.07 $39.41 $45.75 $59.41 $79.90 $114.05
Pelham 3,601 1 1.70 $19.00 $24.70 $23.90 $31.08 $26.35 $34.27 $28.80 $37.46 $33.70 $43.84 $41.05 $53.41 $53.30 $69.36
Pembroke 2,571 1 0.83 $24.75 $26.50 $32.75 $34.50 $34.75 $36.50 $36.75 $38.50 $41.15 $42.90 $47.95 $49.70 $60.35 $62.10
Perkins Water Authority (no wastewater bills)
Pickens County Water Authority (no wastewater bills)
Piedmont Water Co. - Lake Oconee 0 $39.50 $39.50 $49.00 $58.50 $77.50 $106.00 $156.50
Pike County Water and Sewer Authority (no
wastewater bills)
Pine Mountain 1,697 1 0.83 $12.00 $15.00 $21.20 $24.20 $25.80 $28.80 $30.40 $33.40 $39.60 $42.60 $53.40 $56.40 $76.40 $79.40
Pinehurst 460 1 2.29 $13.17 $15.73 $18.29 $20.85 $25.97 $33.65 $33.65
Pineview (no wastewater bills)
Pitts (no wastewater bills)
Plains 892 1 0.65 $15.45 $19.32 $21.05 $26.32 $23.85 $29.82 $26.65 $33.32 $32.43 $40.56 $41.10 $51.42 $56.00 $70.07
Polk County Water Authority 24,061 1 0.94 $18.45 $26.44 $34.44 $42.43 $58.42 $81.94 $121.56
Polk County Water Authority - Vinson Mountain (no
wastewater bills)
Pooler 21,187 1 1.09 $12.34 $21.94 $25.14 $28.34 $34.74 $44.34 $60.34
Port Wentworth 4,160 1 1.20 $13.40 $21.28 $27.64 $39.69 $32.38 $45.83 $37.13 $51.96 $46.62 $64.23 $48.90 $82.64 $48.90 $113.33
Portal 879 1 0.80 $19.00 $22.50 $26.00 $29.50 $36.50 $47.00 $64.50
Poulan (no wastewater bills)
Powder Springs 14,000 1 1.16 $7.44 $27.39 $34.28 $41.17 $55.67 $77.42 $113.67
Pulaski (no wastewater bills)
Quitman 4,942 1 0.98 $5.86 $16.96 $21.06 $25.16 $33.76 $46.66 $68.16
Rabun County Water and Sewer Authority 0 0.77 $18.00 $23.53 $29.05 $34.58 $45.63 $62.20 $89.83
Randolph County Water Authority (no wastewater
bills)
Ray City 845 1 1.05 $11.27 $14.47 $21.59 $29.95 $25.03 $35.11 $28.47 $40.27 $35.35 $50.59 $45.67 $66.07 $62.87 $91.87
Register (no wastewater bills)
Remerton 1,479 1 0.94 $8.25 $17.25 $20.25 $23.25 $29.25 $38.25 $53.25
Rentz 310 1 1.64 $17.50 $19.50 $21.50 $23.50 $27.50 $33.50 $43.50
Reynolds 1,373 1 0.68 $15.00 $22.00 $18.90 $27.70 $22.80 $33.40 $26.70 $39.10 $34.50 $50.50 $46.20 $67.60 $65.70 $96.10
Rhine (no wastewater bills)
Riceboro 1,131 1 0.68 $15.00 $16.50 $18.00 $19.50 $22.50 $27.00 $34.50
Richland 1,323 1 0.62 $15.00 $15.00 $15.00 $15.00 $15.00 $15.00 $15.00
Richmond Hill 11,258 1 1.52 $20.50 $30.75 $30.10 $45.15 $33.30 $49.95 $36.50 $54.75 $43.10 $64.65 $53.30 $79.95 $72.30 $108.45
Riddleville (no wastewater bills)
Service Population is approximated and may not be actual.
Source: 1=EPA SDWIS 2017, 2=Census Population in 2016 *Based on data from FY2015 or earlierGeorgia Environmental Finance Authority
and Environmental Finance Center

Compare with caution. High rates may be justified and necessary to protect public health.
Inside Outside Inside Outside Inside Outside Inside Outside Inside Outside Inside Outside Inside Outside
7,000 Gallons
(936 cf)
10,000 Gallons
(1,337 cf)
15,000 Gallons
(2,005 cf)
4,000 Gallons
(535 cf)
Operating
Ratio
(FY2016)
Rate Table 4: 2017 Residential Monthly-Equivalent Sewer Bills at Various Consumption Levels (Includes Base Charges)
Utility / Rate Structure
Service
Population
(Approx.)
Zero Gallons
(0 cf)
3,000 Gallons
(401 cf)
5,000 Gallons
(668 cf)
Rincon 9,880 1 1.94 $19.00 $27.00 $19.00 $27.00 $22.50 $31.25 $26.00 $35.50 $33.00 $44.00 $44.25 $57.75 $65.50 $84.00
Ringgold 2,743 1 1.05 $15.30 $19.11 $22.92 $26.73 $34.35 $45.78 $64.83
Ringgold - Dalton 0 $23.22 $38.46 $43.54 $48.62 $58.78 $74.02 $99.42
Ringgold - Meadows 0 $21.53 $44.09 $51.61 $59.13 $74.17 $96.73 $134.33
Roberta 1,615 1 0.86 $13.13 $17.99 $23.45 $29.24 $26.89 $32.99 $30.33 $36.74 $37.21 $44.24 $47.53 $55.49 $64.73 $74.24
Rochelle 1,581 1 1.33 $14.50 $16.50 $20.50 $22.50 $22.50 $24.50 $24.50 $26.50 $28.50 $30.50 $34.50 $36.50 $44.50 $46.50
Rockdale County Water and Sewer Authority 72,621 1 $14.63 $33.35 $39.59 $45.83 $58.31 $77.03 $108.23
Rockmart 6,500 1 1.39 $13.27 $19.90 $19.90 $29.84 $26.53 $39.78 $33.16 $49.72 $46.42 $69.60 $66.31 $99.42 $101.16 $151.57
Rocky Ford (no wastewater bills)
Rome - Zone 1 45,586 1 1.54 $13.07 $25.08 $30.42 $35.75 $46.42 $62.42 $89.09
Rome - Zone 2 45,586 1 1.54 $13.07 $18.15 $25.08 $44.14 $30.42 $52.80 $35.75 $61.47 $46.42 $78.79 $62.42 $104.78 $89.09 $148.10
Rome - Zone 3 45,586 1 1.54 $18.15 $44.14 $52.80 $61.47 $78.79 $104.78 $148.10
Rome - Zone 4 45,586 1 1.54 $18.15 $21.10 $37.66 $55.75 $46.32 $67.30 $54.99 $78.85 $72.31 $101.96 $98.30 $136.61 $141.62 $194.36
Roopville (no wastewater bills)
Roswell 14,300 1 1.33 $3.45 $19.98 $25.49 $31.00 $42.02 $58.55 $86.10
Royston 2,800 1 0.94 $9.28 $16.10 $18.73 $31.40 $21.88 $36.50 $25.03 $41.60 $31.33 $51.80 $40.78 $67.10 $56.53 $92.60
Rutledge 918 1 1.63 $14.00 $18.00 $22.00 $26.00 $34.25 $47.00 $70.75
Saint Marys 17,270 1 0.93 $20.45 $29.03 $31.89 $34.75 $40.89 $50.73 $67.13
Sale City (no wastewater bills)
Sandersville 6,100 1 2.55 $18.00 $18.00 $19.95 $20.93 $21.90 $23.86 $23.85 $26.79 $27.75 $32.65 $33.60 $41.44 $43.35 $56.09
Sardis 999 1 0.99 $17.69 $36.59 $42.89 $49.19 $61.79 $80.69 $112.19
Sasser (no wastewater bills)
Satilla Regional Water and Sewer Authority 14,311 1 1.40 $30.00 $37.64 $42.72 $47.80 $57.96 $73.20 $98.60
Savannah 215,566 1 1.22 $4.40 $6.60 $17.92 $26.85 $22.42 $33.61 $26.93 $40.36 $36.64 $54.92 $51.68 $77.46 $76.75 $115.03
Schley County (no wastewater bills)
Scotland 356 1 $13.00 $13.00 $13.00 $13.00 $13.00 $13.00 $13.00
Screven 840 1 $15.00 $17.25 $19.50 $21.75 $26.75 $34.25 $47.25
Senoia 3,466 1 1.18 $20.57 $30.25 $35.09 $39.93 $49.61 $64.13 $88.33
Shady Dale (no wastewater bills)
Shellman 1,115 1 0.74 $10.00 $11.32 $12.64 $13.96 $16.60 $16.85 $16.85
Shiloh (no wastewater bills)
Siloam (no wastewater bills)
Sky Lake POA, Inc. (no wastewater bills)
Sky Valley (no wastewater bills)
Smithville 647 1 0.42 $17.00 $17.00 $17.00 $17.00 $17.00 $17.00 $17.00
Smyrna 35,000 1 1.19 $15.18 $36.93 $44.18 $51.43 $65.93 $87.68 $123.93
Social Circle 4,235 1 1.51 $19.40 $29.15 $27.39 $41.14 $35.38 $53.13 $43.37 $65.12 $59.35 $89.10 $83.32 $125.07 $123.27 $185.02
Soperton 2,470 1 1.02 $25.00 $37.50 $25.00 $38.63 $25.00 $39.75 $25.00 $40.88 $25.00 $43.13 $25.00 $46.50 $25.00 $52.13
Spalding County 40,430 1 1.20 $16.98 $24.76 $32.54 $40.32 $55.88 $79.22 $118.12
Service Population is approximated and may not be actual.
Source: 1=EPA SDWIS 2017, 2=Census Population in 2016 *Based on data from FY2015 or earlierGeorgia Environmental Finance Authority
and Environmental Finance Center

Compare with caution. High rates may be justified and necessary to protect public health.
Inside Outside Inside Outside Inside Outside Inside Outside Inside Outside Inside Outside Inside Outside
7,000 Gallons
(936 cf)
10,000 Gallons
(1,337 cf)
15,000 Gallons
(2,005 cf)
4,000 Gallons
(535 cf)
Operating
Ratio
(FY2016)
Rate Table 4: 2017 Residential Monthly-Equivalent Sewer Bills at Various Consumption Levels (Includes Base Charges)
Utility / Rate Structure
Service
Population
(Approx.)
Zero Gallons
(0 cf)
3,000 Gallons
(401 cf)
5,000 Gallons
(668 cf)
Sparks 1,823 1 1.14 $20.75 $20.75 $20.75 $20.75 $20.75 $20.75 $20.75
Springfield 3,100 1 1.15 $15.60 $31.20 $18.72 $35.10 $21.84 $39.00 $24.96 $42.90 $31.20 $50.70 $40.56 $62.40 $56.16 $81.90
Statesboro 36,846 1 1.27 $7.50 $15.00 $15.60 $31.20 $18.30 $36.60 $21.00 $42.00 $26.40 $52.80 $34.60 $69.20 $48.60 $97.20
Statham 3,986 1 $13.44 $21.28 $17.98 $25.93 $22.63 $30.69 $27.39 $35.56 $36.91 $45.30 $51.19 $59.91 $74.99 $84.26
Stewart County Water and Sewer Authority (no
wastewater bills)
Stillmore 615 1 $17.50 $19.75 $22.00 $24.25 $31.01 $41.15 $63.65
Stockbridge 6,500 1 1.09 $6.00 $23.46 $29.28 $38.22 $56.10 $86.00 $146.10
Summerville 11,651 1 1.22 $17.37 $22.93 $17.37 $22.93 $21.83 $28.83 $26.29 $34.73 $35.21 $46.53 $48.59 $64.23 $70.89 $93.73
Sumner (no wastewater bills)
Surrency (no wastewater bills)
Suwanee (no wastewater bills)
Sylvania 2,960 1 1.31 $15.75 $21.50 $23.12 $32.58 $25.80 $36.60 $28.47 $40.61 $33.81 $48.65 $41.83 $60.71 $55.50 $81.21
Sylvester 12,886 1 1.39 $15.00 $21.75 $24.00 $26.25 $31.21 $38.65 $43.81
Talbot County (no wastewater bills)
Talbotton 738 1 0.79 $20.60 $25.69 $30.79 $35.88 $46.07 $61.35 $86.81
Tallapoosa 4,030 1 0.69 $6.00 $10.50 $16.50 $26.00 $20.50 $32.00 $24.50 $38.00 $34.00 $52.50 $48.25 $74.25 $74.50 $114.25
Tarrytown (no wastewater bills)
Taylor County Water and Sewer Authority 91 1 $5.00 $5.00 $5.00 $5.00 $6.20 $8.00 $11.00
Temple 4,250 1 0.89 $15.00 $28.50 $33.00 $37.50 $47.75 $68.75 $103.75
Tennille 1,802 1 0.89 $36.49 $38.89 $49.61 $58.57 $54.09 $65.29 $58.57 $72.01 $68.17 $86.41 $82.57 $108.01 $108.57 $147.01
Thomaston 10,510 1 1.07 $6.70 $26.20 $32.70 $39.20 $52.20 $71.70 $104.20
Thomasville 23,577 1 1.23 $23.63 $35.44 $33.24 $49.86 $36.44 $54.67 $39.65 $59.48 $46.05 $69.10 $55.66 $83.52 $71.68 $107.56
Thomson-McDuffie County Water and Sewer
Commission 17,717 1 $7.45 $17.92 $21.41 $24.90 $31.88 $42.35 $59.80
Thunderbolt 2,668 1 0.84 $17.00 $34.25 $40.00 $45.75 $57.25 $74.50 $103.25
Tifton 24,871 1 1.69 $16.97 $25.92 $22.49 $33.60 $24.33 $36.16 $26.17 $38.72 $29.85 $43.84 $35.37 $51.52 $44.57 $64.32
Tignall 754 1 0.84 $21.00 $26.25 $31.50 $36.75 $48.25 $65.50 $98.00
Toccoa 24,960 1 1.47 $10.35 $16.72 $23.09 $29.46 $42.20 $61.31 $93.16
Toomsboro (no wastewater bills)
Towns County Water and Sewer Authority (no
wastewater bills)
Trenton 2,091 2 1.06 $15.01 $22.53 $15.01 $22.53 $17.16 $25.76 $19.31 $28.99 $23.61 $35.45 $30.06 $45.14 $40.81 $61.29
Trion 2,400 1 1.00 $15.00 $15.00 $15.00 $15.00 $15.00 $15.00 $15.00
Turin (no wastewater bills)
Turtle Cove POA (no wastewater bills)
Twiggs County 376 1 0.51 $23.50 $28.75 $34.00 $39.25 $49.75 $65.50 $91.75
Tybee Island 8,047 1 0.86 $24.54 $24.54 $27.91 $31.28 $38.58 $49.53 $69.18
Tyrone 7,121 2 0.88 $30.00 $30.00 $30.00 $38.45 $55.35 $80.70 $122.95
Unadilla 3,837 1 1.76 $20.00 $22.75 $25.50 $28.25 $33.75 $42.00 $55.75
Service Population is approximated and may not be actual.
Source: 1=EPA SDWIS 2017, 2=Census Population in 2016 *Based on data from FY2015 or earlierGeorgia Environmental Finance Authority
and Environmental Finance Center

Compare with caution. High rates may be justified and necessary to protect public health.
Inside Outside Inside Outside Inside Outside Inside Outside Inside Outside Inside Outside Inside Outside
7,000 Gallons
(936 cf)
10,000 Gallons
(1,337 cf)
15,000 Gallons
(2,005 cf)
4,000 Gallons
(535 cf)
Operating
Ratio
(FY2016)
Rate Table 4: 2017 Residential Monthly-Equivalent Sewer Bills at Various Consumption Levels (Includes Base Charges)
Utility / Rate Structure
Service
Population
(Approx.)
Zero Gallons
(0 cf)
3,000 Gallons
(401 cf)
5,000 Gallons
(668 cf)
Union City 18,636 1 1.18 $21.75 $33.57 $37.51 $41.45 $49.33 $61.15 $80.85
Upson County 5,778 1 1.38 $4.20 $23.45 $30.10 $36.75 $50.75 $71.75 $108.50
Utilities, Inc. of Georgia - The Landings 0 $21.64 $30.76 $33.80 $36.84 $42.92 $52.04 $52.04
Utilities, Inc. of Georgia - The Orchard (no wastewater
bills)
Valdosta 56,019 1 0.53 $7.00 $18.23 $21.97 $25.72 $33.20 $44.43 $63.15
Vidalia 13,050 1 0.78 $8.00 $9.66 $11.32 $12.98 $16.30 $21.28 $30.93
Vienna 3,666 1 1.25 $12.48 $15.41 $20.61 $27.60 $23.54 $31.99 $26.47 $36.38 $32.33 $45.16 $41.12 $58.33 $57.37 $82.73
Villa Rica 13,996 1 1.02 $12.00 $15.00 $27.30 $37.65 $32.40 $45.20 $37.50 $52.75 $47.70 $67.85 $63.00 $90.50 $88.50 $128.25
Waco 913 1 $18.00 $26.50 $30.75 $35.00 $43.50 $56.25 $77.50
Wadley 2,500 1 1.47 $13.00 $14.75 $16.50 $18.25 $21.75 $27.00 $35.75
Waleska (no wastewater bills)
Walker County Rural Water and Sewer Authority (no
wastewater bills)
Walker County Water and Sewer Authority 36,000 1 0.96 $15.00 $25.50 $29.00 $32.50 $39.50 $50.00 $67.50
Walthourville 3,858 1 1.06 $30.00 $38.35 $41.20 $44.05 $50.05 $59.05 $74.80
Walton County Water and Sewer Authority (no
wastewater bills)
Warm Springs 1,120 1 0.90 $12.00 $15.00 $29.85 $35.85 $35.80 $42.80 $41.75 $49.75 $53.65 $63.65 $71.50 $84.50 $101.25 $119.25
Warner Robins 64,163 1 1.14 $6.80 $11.15 $12.60 $14.05 $16.95 $21.30 $28.55
Warrenton 2,800 1 1.15 $20.88 $23.85 $26.07 $29.57 $29.53 $33.38 $32.99 $37.19 $39.91 $44.81 $50.29 $56.24 $67.59 $75.29
Warwick (no wastewater bills)
Washington 4,134 1 1.06 $19.00 $28.50 $31.00 $46.50 $35.00 $52.50 $39.00 $58.50 $47.00 $70.50 $59.00 $88.50 $79.00 $118.50
Water Service Company of Georgia - Lake Riverside 0 $58.10 $58.10 $58.10 $58.10 $58.10 $58.10 $58.10
Waycross 21,154 1 0.84 $10.45 $23.12 $27.35 $31.57 $40.02 $52.70 $73.82
Waynesboro 5,813 1 0.88 $3.69 $17.82 $22.53 $27.24 $36.66 $50.79 $74.34
Webster County (no wastewater bills)
West Point 3,929 1 $9.25 $23.93 $28.82 $33.72 $43.50 $58.18 $82.65
Whigham (no wastewater bills)
White 806 1 $36.00 $43.00 $36.00 $43.00 $39.00 $46.00 $42.00 $49.00 $48.00 $55.00 $57.00 $64.00 $72.00 $79.00
White County Water Authority (no wastewater bills)
White Plains (no wastewater bills)
Whitesburg (no wastewater bills)
Willacoochee 1,940 1 1.25 $12.50 $12.50 $15.50 $18.50 $24.50 $33.50 $48.50
Williamson (no wastewater bills)
Winder 32,971 1 1.46 $19.30 $32.90 $31.72 $50.30 $35.86 $56.10 $40.00 $61.90 $48.28 $73.50 $60.70 $90.90 $74.50 $102.50
Woodbine 1,508 1 1.25 $18.50 $29.21 $32.78 $36.35 $43.49 $54.20 $75.10
Woodbury 961 1 1.06 $11.00 $14.00 $22.64 $28.28 $26.52 $33.04 $30.40 $37.80 $38.16 $47.32 $49.80 $61.60 $69.20 $85.40
Woodstock 10,070 1 1.00 $7.88 $33.35 $41.84 $50.33 $67.31 $92.78 $142.28
Service Population is approximated and may not be actual.
Source: 1=EPA SDWIS 2017, 2=Census Population in 2016 *Based on data from FY2015 or earlierGeorgia Environmental Finance Authority
and Environmental Finance Center
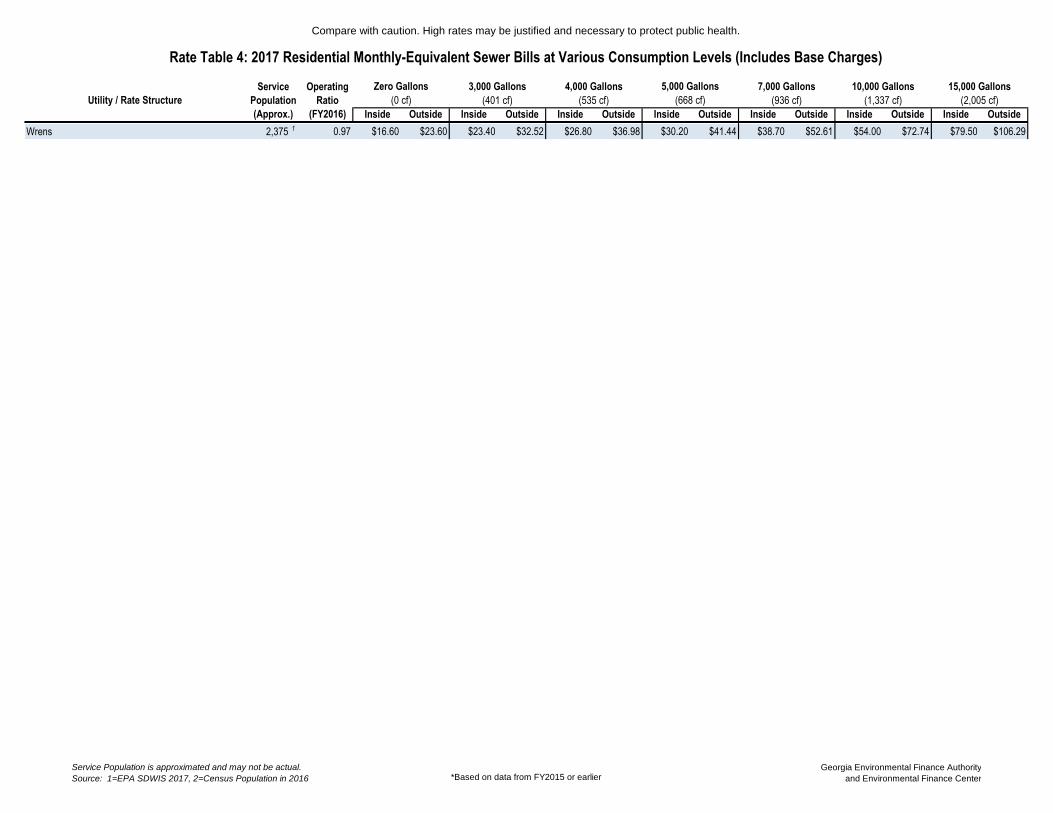
Compare with caution. High rates may be justified and necessary to protect public health.
Inside Outside Inside Outside Inside Outside Inside Outside Inside Outside Inside Outside Inside Outside
7,000 Gallons
(936 cf)
10,000 Gallons
(1,337 cf)
15,000 Gallons
(2,005 cf)
4,000 Gallons
(535 cf)
Operating
Ratio
(FY2016)
Rate Table 4: 2017 Residential Monthly-Equivalent Sewer Bills at Various Consumption Levels (Includes Base Charges)
Utility / Rate Structure
Service
Population
(Approx.)
Zero Gallons
(0 cf)
3,000 Gallons
(401 cf)
5,000 Gallons
(668 cf)
Wrens 2,375 1 0.97 $16.60 $23.60 $23.40 $32.52 $26.80 $36.98 $30.20 $41.44 $38.70 $52.61 $54.00 $72.74 $79.50 $106.29
Service Population is approximated and may not be actual.
Source: 1=EPA SDWIS 2017, 2=Census Population in 2016 *Based on data from FY2015 or earlierGeorgia Environmental Finance Authority
and Environmental Finance Center

Utility / Rate Structure
Different
than
Residential
Water Rate
Structure?
Billing Period
(Monthly,
Bimonthly,
Quarterly, Other)
Base Charge
Pricing
Monthly
Gallons
Provided with
Base Charge
(Allowance)
Residential Irrigation Rate
Structure
Number
of
Blocks
First Block
Maximum
(Monthly
Gallons)
Irrigation/Water
Bill Differential
at 15,000
Gallons
Adel 5,311 1 No Monthly Constant 2,000 Decreasing Block 3 8,000
Adrian 664 1 No Monthly Constant 0 Increasing Block 4 2,000
Ailey 527 1 No Monthly Constant 2,000 Uniform Rate
Alamo 3,457 1 Yes Monthly Constant 2,000 Uniform Rate 112%
Albany 87,029 1 No Monthly Constant 3,000 Decreasing Block 2 7,000
Alcovy Shores Water Authority 432 1 No Monthly Constant 0 Uniform Rate
Allentown 175 1 No Monthly Constant 2,000 Uniform Rate
Alma 4,700 1 No Monthly Constant 2,000 Increasing Block 3 3,000
Alston 169 1 No Monthly Constant 2,000 Increasing Block 5 5,000
Alto 2,500 1 No Monthly Constant 2,000 Uniform Rate
Americus 16,255 1 No Monthly Constant 0 Uniform Rate
Andersonville 400 1 No Monthly Constant 2,000 Uniform Rate
Arabi 429 1 No Monthly Constant 2,000 Uniform Rate
Argyle 211 1 No Monthly None 0 Non-Volumetric Flat Charge
Arlington 1,243 1 No Monthly Constant 0 Increasing Block 4 2,000
Arnoldsville 1,040 1 No Monthly Constant 3,000 Increasing Block 2 5,999
Ashburn 4,272 1 Yes Monthly Constant 0 Increasing Block 5 5,000 100%
Athens-Clarke County 120,266 1 Yes Monthly By Meter Size 0 Uniform Rate 122%
Atlanta 650,000 1 No Monthly Constant 0 Increasing Block 3 2,244
Attapulgus 715 1 No Monthly Constant 3,000 Uniform Rate
Auburn 6,904 1 No Monthly Constant 0 Increasing Block 9 1,000
Augusta 204,000 1 No Monthly Constant 0 Increasing Block 2 3,000
Austell 7,774 1 No Monthly Constant 2,000 Increasing Block 3 7,000
Avera 240 1 No Monthly Constant 1,000 Increasing Block 2 5,000
Baconton 985 1 No Monthly Constant 0 Uniform Rate
Bainbridge 13,546 1 No Monthly Constant 0 Uniform Rate
Baldwin 4,160 1 No Monthly Constant 2,000 Increasing Block 3 6,000
Baldwin County 21,840 1 No Monthly Constant 2,000 Increasing Block 5 4,999
Ball Ground 2,470 1 No Monthly Constant 0 Increasing Block 5 3,000
Banks County 6,453 1 No Monthly Constant 2,000 Increasing Block 5 6,000
Barnesville 6,755 1 Yes Monthly Constant 0 Uniform Rate 114%
Rate Table 5: 2017 Irrigation Rate Structures for Residential Customers
Service
Population
(Approx.)
Service Population is approximated and may not be actual.
Source: 1=EPA SDWIS 2017, 2=Census Population in 2016
Georgia Environmental Finance Authority
and Environmental Finance Center
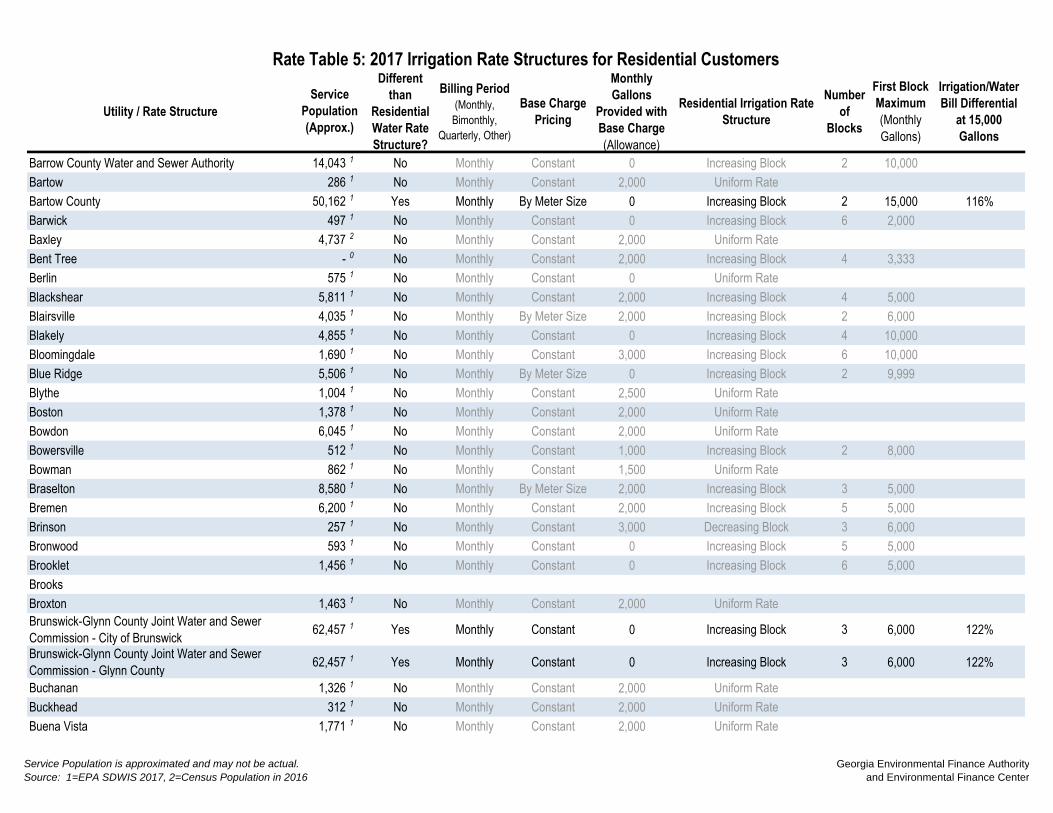
Utility / Rate Structure
Different
than
Residential
Water Rate
Structure?
Billing Period
(Monthly,
Bimonthly,
Quarterly, Other)
Base Charge
Pricing
Monthly
Gallons
Provided with
Base Charge
(Allowance)
Residential Irrigation Rate
Structure
Number
of
Blocks
First Block
Maximum
(Monthly
Gallons)
Irrigation/Water
Bill Differential
at 15,000
Gallons
Rate Table 5: 2017 Irrigation Rate Structures for Residential Customers
Service
Population
(Approx.)
Barrow County Water and Sewer Authority 14,043 1 No Monthly Constant 0 Increasing Block 2 10,000
Bartow 286 1 No Monthly Constant 2,000 Uniform Rate
Bartow County 50,162 1 Yes Monthly By Meter Size 0 Increasing Block 2 15,000 116%
Barwick 497 1 No Monthly Constant 0 Increasing Block 6 2,000
Baxley 4,737 2 No Monthly Constant 2,000 Uniform Rate
Bent Tree - 0 No Monthly Constant 2,000 Increasing Block 4 3,333
Berlin 575 1 No Monthly Constant 0 Uniform Rate
Blackshear 5,811 1 No Monthly Constant 2,000 Increasing Block 4 5,000
Blairsville 4,035 1 No Monthly By Meter Size 2,000 Increasing Block 2 6,000
Blakely 4,855 1 No Monthly Constant 0 Increasing Block 4 10,000
Bloomingdale 1,690 1 No Monthly Constant 3,000 Increasing Block 6 10,000
Blue Ridge 5,506 1 No Monthly By Meter Size 0 Increasing Block 2 9,999
Blythe 1,004 1 No Monthly Constant 2,500 Uniform Rate
Boston 1,378 1 No Monthly Constant 2,000 Uniform Rate
Bowdon 6,045 1 No Monthly Constant 2,000 Uniform Rate
Bowersville 512 1 No Monthly Constant 1,000 Increasing Block 2 8,000
Bowman 862 1 No Monthly Constant 1,500 Uniform Rate
Braselton 8,580 1 No Monthly By Meter Size 2,000 Increasing Block 3 5,000
Bremen 6,200 1 No Monthly Constant 2,000 Increasing Block 5 5,000
Brinson 257 1 No Monthly Constant 3,000 Decreasing Block 3 6,000
Bronwood 593 1 No Monthly Constant 0 Increasing Block 5 5,000
Brooklet 1,456 1 No Monthly Constant 0 Increasing Block 6 5,000
Brooks
Broxton 1,463 1 No Monthly Constant 2,000 Uniform Rate
Brunswick-Glynn County Joint Water and Sewer
Commission - City of Brunswick 62,457 1 Yes Monthly Constant 0 Increasing Block 3 6,000 122%
Brunswick-Glynn County Joint Water and Sewer
Commission - Glynn County 62,457 1 Yes Monthly Constant 0 Increasing Block 3 6,000 122%
Buchanan 1,326 1 No Monthly Constant 2,000 Uniform Rate
Buckhead 312 1 No Monthly Constant 2,000 Uniform Rate
Buena Vista 1,771 1 No Monthly Constant 2,000 Uniform Rate
Service Population is approximated and may not be actual.
Source: 1=EPA SDWIS 2017, 2=Census Population in 2016
Georgia Environmental Finance Authority
and Environmental Finance Center
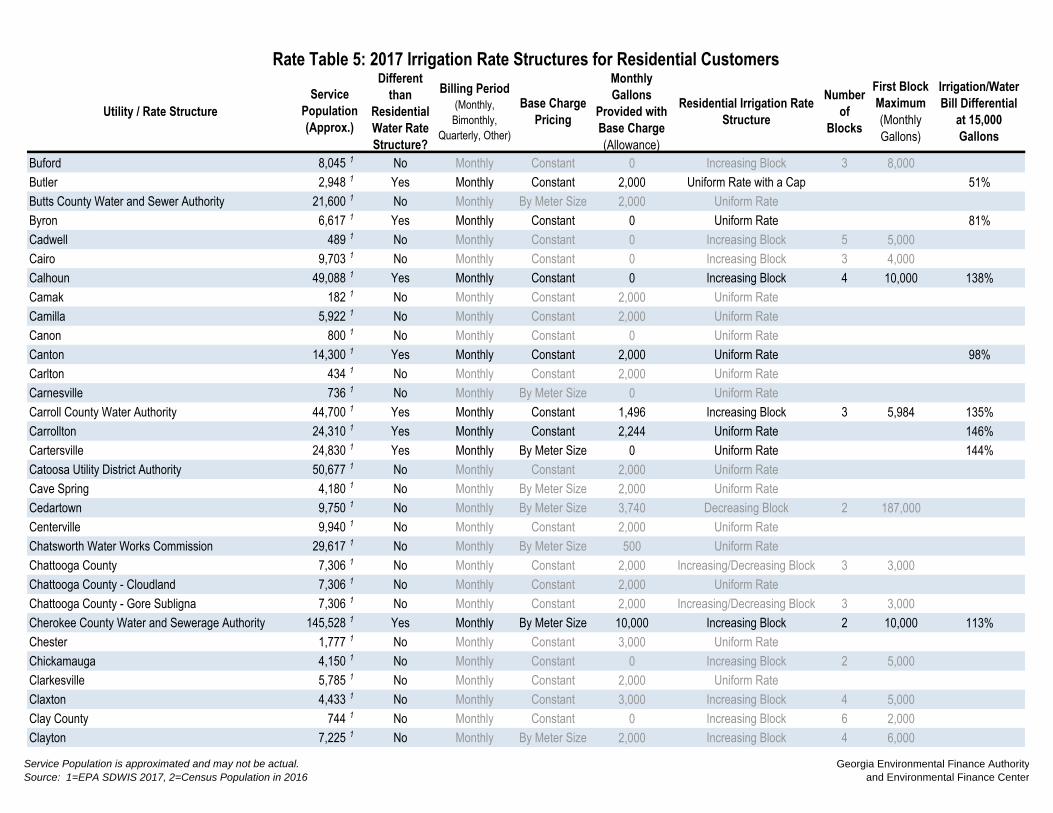
Utility / Rate Structure
Different
than
Residential
Water Rate
Structure?
Billing Period
(Monthly,
Bimonthly,
Quarterly, Other)
Base Charge
Pricing
Monthly
Gallons
Provided with
Base Charge
(Allowance)
Residential Irrigation Rate
Structure
Number
of
Blocks
First Block
Maximum
(Monthly
Gallons)
Irrigation/Water
Bill Differential
at 15,000
Gallons
Rate Table 5: 2017 Irrigation Rate Structures for Residential Customers
Service
Population
(Approx.)
Buford 8,045 1 No Monthly Constant 0 Increasing Block 3 8,000
Butler 2,948 1 Yes Monthly Constant 2,000 Uniform Rate with a Cap 51%
Butts County Water and Sewer Authority 21,600 1 No Monthly By Meter Size 2,000 Uniform Rate
Byron 6,617 1 Yes Monthly Constant 0 Uniform Rate 81%
Cadwell 489 1 No Monthly Constant 0 Increasing Block 5 5,000
Cairo 9,703 1 No Monthly Constant 0 Increasing Block 3 4,000
Calhoun 49,088 1 Yes Monthly Constant 0 Increasing Block 4 10,000 138%
Camak 182 1 No Monthly Constant 2,000 Uniform Rate
Camilla 5,922 1 No Monthly Constant 2,000 Uniform Rate
Canon 800 1 No Monthly Constant 0 Uniform Rate
Canton 14,300 1 Yes Monthly Constant 2,000 Uniform Rate 98%
Carlton 434 1 No Monthly Constant 2,000 Uniform Rate
Carnesville 736 1 No Monthly By Meter Size 0 Uniform Rate
Carroll County Water Authority 44,700 1 Yes Monthly Constant 1,496 Increasing Block 3 5,984 135%
Carrollton 24,310 1 Yes Monthly Constant 2,244 Uniform Rate 146%
Cartersville 24,830 1 Yes Monthly By Meter Size 0 Uniform Rate 144%
Catoosa Utility District Authority 50,677 1 No Monthly Constant 2,000 Uniform Rate
Cave Spring 4,180 1 No Monthly By Meter Size 2,000 Uniform Rate
Cedartown 9,750 1 No Monthly By Meter Size 3,740 Decreasing Block 2 187,000
Centerville 9,940 1 No Monthly Constant 2,000 Uniform Rate
Chatsworth Water Works Commission 29,617 1 No Monthly By Meter Size 500 Uniform Rate
Chattooga County 7,306 1 No Monthly Constant 2,000 Increasing/Decreasing Block 3 3,000
Chattooga County - Cloudland 7,306 1 No Monthly Constant 2,000 Uniform Rate
Chattooga County - Gore Subligna 7,306 1 No Monthly Constant 2,000 Increasing/Decreasing Block 3 3,000
Cherokee County Water and Sewerage Authority 145,528 1 Yes Monthly By Meter Size 10,000 Increasing Block 2 10,000 113%
Chester 1,777 1 No Monthly Constant 3,000 Uniform Rate
Chickamauga 4,150 1 No Monthly Constant 0 Increasing Block 2 5,000
Clarkesville 5,785 1 No Monthly Constant 2,000 Uniform Rate
Claxton 4,433 1 No Monthly Constant 3,000 Increasing Block 4 5,000
Clay County 744 1 No Monthly Constant 0 Increasing Block 6 2,000
Clayton 7,225 1 No Monthly By Meter Size 2,000 Increasing Block 4 6,000
Service Population is approximated and may not be actual.
Source: 1=EPA SDWIS 2017, 2=Census Population in 2016
Georgia Environmental Finance Authority
and Environmental Finance Center

Utility / Rate Structure
Different
than
Residential
Water Rate
Structure?
Billing Period
(Monthly,
Bimonthly,
Quarterly, Other)
Base Charge
Pricing
Monthly
Gallons
Provided with
Base Charge
(Allowance)
Residential Irrigation Rate
Structure
Number
of
Blocks
First Block
Maximum
(Monthly
Gallons)
Irrigation/Water
Bill Differential
at 15,000
Gallons
Rate Table 5: 2017 Irrigation Rate Structures for Residential Customers
Service
Population
(Approx.)
Clayton - North Loop - 0 No Monthly By Meter Size 2,000 Increasing Block 4 6,000
Clayton County Water Authority 270,000 1 Yes Monthly None 0 Uniform Rate 132%
Cleveland 3,640 1 No Monthly By Meter Size 2,000 Increasing Block 3 4,000
Climax 359 1 No Monthly Constant 4,000 Uniform Rate
Cobb County 533,000 1 Yes Monthly By Meter Size 0 Uniform Rate 223%
Cobbtown 596 1 No Monthly Constant 2,000 Increasing Block 2 9,000
Cochran 5,124 1 No Monthly Constant 1,000 Uniform Rate
Coffee County 1,635 1 No Monthly Constant 4,000 Decreasing Block 2 10,000
College Park 20,382 1 Yes Monthly Constant 0 Uniform Rate 106%
Collins 780 1 No Monthly Constant 2,000 Increasing Block 2 9,000
Colquitt 1,895 1 No Monthly By Meter Size 0 Increasing Block 3 15,000
Columbia County 101,967 1 No Monthly Constant 0 Increasing Block 4 10,000
Columbus Water Works 229,000 1 No Monthly By Meter Size 0 Increasing Block 2 11,220
Comer 1,380 1 No Monthly Constant 1,500 Uniform Rate
Commerce 6,819 1 No Monthly Constant 0 Uniform Rate
Concord 741 1 No Monthly Constant 2,000 Uniform Rate
Consolidated Utilities, Inc. - 0 No Monthly Constant 0 Increasing Block 3 5,000
Consolidated Utilities, Inc. - Coastal Water &
Sewerage, LLC - 21 Centre - 0 No Monthly None 0 Non-Volumetric Flat Charge
Consolidated Utilities, Inc. - Coastal Water &
Sewerage, LLC - Cypress Lakes - 0 No Monthly None 0 Non-Volumetric Flat Charge
Consolidated Utilities, Inc. - Coastal Water &
Sewerage, LLC - Little Neck Plantation - 0 No Monthly Constant 0 Uniform Rate with a Cap
Consolidated Utilities, Inc. - Coastal Water &
Sewerage, LLC - Rebel Estates - 0 No Monthly None 0 Non-Volumetric Flat Charge
Consolidated Utilities, Inc. - Coastal Water &
Sewerage, LLC - Ridgecrest, Park of Commerce,
Millcreek
- 0 No Monthly Constant 0 Increasing Block 2 5,000
Consolidated Utilities, Inc. - Coastal Water &
Sewerage, LLC - Sandy Woods, South Pointe,
Southern Hills, White Bluff, Mingledorff, Cottonvale
- 0 No Monthly Constant 5,000 Uniform Rate
Consolidated Utilities, Inc. - Coastal Water Company - 0 No Monthly Constant 0 Increasing Block 2 5,000
Service Population is approximated and may not be actual.
Source: 1=EPA SDWIS 2017, 2=Census Population in 2016
Georgia Environmental Finance Authority
and Environmental Finance Center

Utility / Rate Structure
Different
than
Residential
Water Rate
Structure?
Billing Period
(Monthly,
Bimonthly,
Quarterly, Other)
Base Charge
Pricing
Monthly
Gallons
Provided with
Base Charge
(Allowance)
Residential Irrigation Rate
Structure
Number
of
Blocks
First Block
Maximum
(Monthly
Gallons)
Irrigation/Water
Bill Differential
at 15,000
Gallons
Rate Table 5: 2017 Irrigation Rate Structures for Residential Customers
Service
Population
(Approx.)
Consolidated Utilities, Inc. - Coastal Water Company -
Rate 2 - 0 No Monthly Constant 0 Increasing Block 2 5,000
Consolidated Utilities, Inc. - Golden Isles - 0 No Monthly Constant 5,000 Uniform Rate
Consolidated Utilities, Inc. - Whitemarsh Estates - 0 No Monthly Constant 5,000 Uniform Rate
Consolidated Utilities, Inc. - Woodlawn - 0 No Monthly Constant 5,000 Uniform Rate
Coolidge 692 1 No Monthly Constant 0 Uniform Rate
Coosa Water Authority 3,944 1 No Monthly Constant 2,000 Increasing Block 3 6,000
Cordele 10,691 1 No Monthly Constant 0 Uniform Rate
Cornelia 6,130 1 No Monthly Constant 2,000 Increasing Block 3 10,000
Covington 20,379 1 No Monthly Constant 3,000 Increasing Block 2 50,000
Coweta County Water and Sewer Authority 59,800 1 No Monthly Constant 0 Increasing Block 4 5,000
Crawford 1,170 1 No Monthly Constant 2,000 Increasing Block 2 10,000
Crawford County 1,625 1 No Monthly Constant 1,000 Uniform Rate
Crawfordville 582 1 No Monthly Constant 1,500 Increasing Block 3 5,000
Cumming 47,541 1 No Monthly Constant 0 Increasing Block 3 6,000
Cusseta-Chattahoochee County 3,300 1 No Monthly Constant 2,000 Uniform Rate
Cuthbert 2,613 1 No Monthly Constant 2,000 Increasing Block 2 5,000
Dade County Water and Sewer Authority 36,400 1 No Monthly Constant 2,000 Uniform Rate
Dade County Water and Sewer Authority - Canyon
Ridge 36,400 1 No Monthly Constant 2,000 Uniform Rate
Dade County Water and Sewer Authority - Flintstone 36,400 1 No Monthly Constant 2,000 Uniform Rate
Dade County Water and Sewer Authority - Mountain
(Pumped 2x) 36,400 1 No Monthly Constant 2,000 Uniform Rate
Dade County Water and Sewer Authority - Mountain
(Pumped 3x) 36,400 1 No Monthly Constant 2,000 Uniform Rate
Dade County Water and Sewer Authority - North End
Dade County Water and Sewer Authority - South End
Dade County Water and Sewer Authority - Valley 36,400 1 No Monthly Constant 2,000 Uniform Rate
Dahlonega 4,120 1 No Monthly By Meter Size 0 Increasing Block 3 5,000
Daisy 117 1 No Monthly Constant 3,000 Increasing Block 3 5,000
Service Population is approximated and may not be actual.
Source: 1=EPA SDWIS 2017, 2=Census Population in 2016
Georgia Environmental Finance Authority
and Environmental Finance Center

Utility / Rate Structure
Different
than
Residential
Water Rate
Structure?
Billing Period
(Monthly,
Bimonthly,
Quarterly, Other)
Base Charge
Pricing
Monthly
Gallons
Provided with
Base Charge
(Allowance)
Residential Irrigation Rate
Structure
Number
of
Blocks
First Block
Maximum
(Monthly
Gallons)
Irrigation/Water
Bill Differential
at 15,000
Gallons
Rate Table 5: 2017 Irrigation Rate Structures for Residential Customers
Service
Population
(Approx.)
Dallas 7,556 1 Yes Monthly None 0 Increasing Block 4 6,000 200%
Damascus 239 1 No Monthly None 0 Non-Volumetric Flat Charge
Danielsville 1,092 1 No Monthly Constant 2,000 Increasing Block 3 6,000
Danville 393 1 No Monthly Constant 2,000 Uniform Rate
Darien 3,242 1 No Monthly Constant 0 Increasing Block 5 5,000
Davisboro 1,535 1 No Monthly Constant 0 Increasing Block 2 2,000
Dawson 4,836 1 No Monthly Constant 2,000 Uniform Rate
Dawsonville 2,424 1 No Monthly Constant 1,500 Increasing Block 3 5,000
Decatur Consolidated Water Services, Inc. -
Doublegate Phase VI - 0 No Monthly Constant 2,000 Uniform Rate
Decatur Consolidated Water Services, Inc. - Holly
Isles - 0 No Monthly Constant 5,000 Uniform Rate
Decatur Consolidated Water Services, Inc. - Pebble
Hill Estates - 0 No Monthly Constant 2,000 Uniform Rate
Decatur Consolidated Water Services, Inc. - Redrock
Estates - 0 No Monthly Constant 5,000 Uniform Rate
Decatur Consolidated Water Services, Inc. -
Riverbend Estates - 0 No Monthly Constant 2,000 Uniform Rate
Decatur Consolidated Water Services, Inc. -
Woodcrest Subdivision - 0 No Monthly Constant 3,000 Uniform Rate
Deepstep 133 1 No Monthly Constant 1,000 Uniform Rate
Dekalb County 670,000 1 Yes Bi-monthly By Meter Size 0 Uniform Rate 226%
Demorest 15,130 1 No Monthly Constant 2,000 Increasing Block 3 5,000
Denton 253 1 No Monthly Constant 2,000 Decreasing Block 2 5,000
Dexter 1,976 1 No Monthly Constant 2,000 Increasing Block 4 5,000
Dillard 133 1 No Monthly Constant 1,000 Uniform Rate
Doerun 967 1 No Monthly Constant 0 Increasing Block 6 2,000
Donalsonville 2,782 1 No Monthly Constant 0 Increasing Block 6 5,000
Dooling 99,315 1 No Monthly Constant 1,000 Uniform Rate
Douglas 10,688 1 No Monthly Constant 0 Decreasing Block 4 10,000
Douglasville-Douglas County Water and Sewer
Authority 109,694 1 No Monthly By Meter Size 0 Increasing Block 3 5,000
Du Pont 120 1 No Monthly None 0 Non-Volumetric Flat Charge
Service Population is approximated and may not be actual.
Source: 1=EPA SDWIS 2017, 2=Census Population in 2016
Georgia Environmental Finance Authority
and Environmental Finance Center
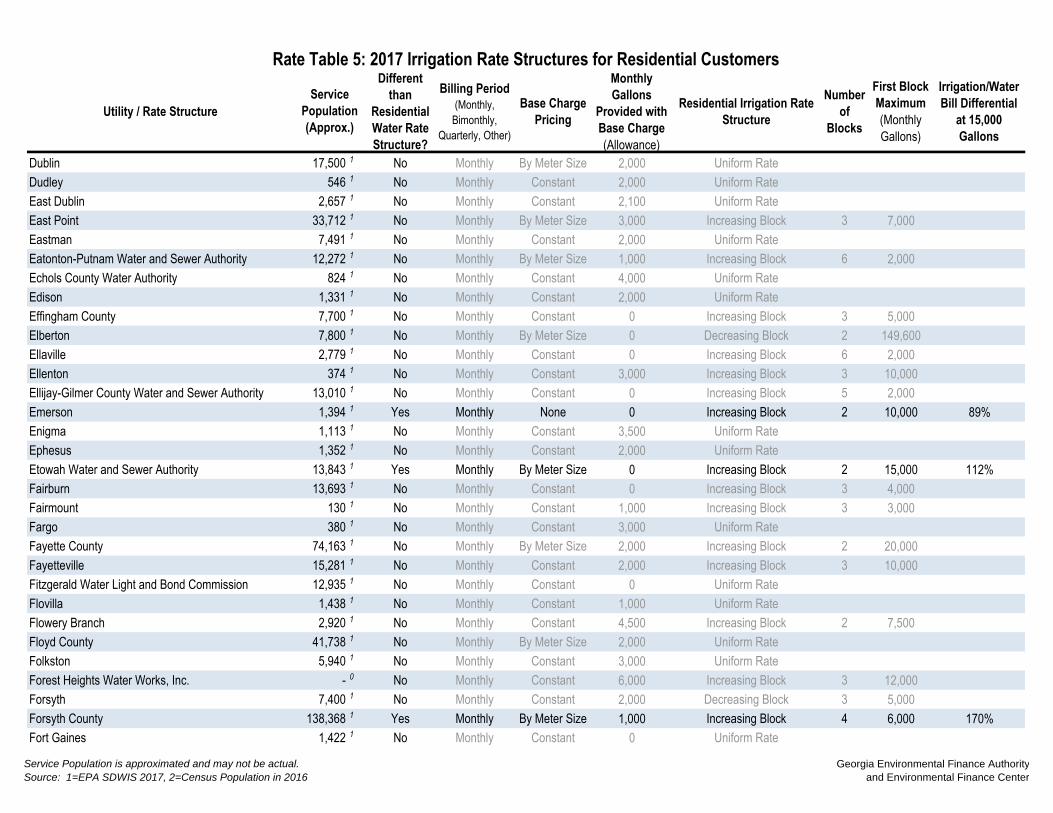
Utility / Rate Structure
Different
than
Residential
Water Rate
Structure?
Billing Period
(Monthly,
Bimonthly,
Quarterly, Other)
Base Charge
Pricing
Monthly
Gallons
Provided with
Base Charge
(Allowance)
Residential Irrigation Rate
Structure
Number
of
Blocks
First Block
Maximum
(Monthly
Gallons)
Irrigation/Water
Bill Differential
at 15,000
Gallons
Rate Table 5: 2017 Irrigation Rate Structures for Residential Customers
Service
Population
(Approx.)
Dublin 17,500 1 No Monthly By Meter Size 2,000 Uniform Rate
Dudley 546 1 No Monthly Constant 2,000 Uniform Rate
East Dublin 2,657 1 No Monthly Constant 2,100 Uniform Rate
East Point 33,712 1 No Monthly By Meter Size 3,000 Increasing Block 3 7,000
Eastman 7,491 1 No Monthly Constant 2,000 Uniform Rate
Eatonton-Putnam Water and Sewer Authority 12,272 1 No Monthly By Meter Size 1,000 Increasing Block 6 2,000
Echols County Water Authority 824 1 No Monthly Constant 4,000 Uniform Rate
Edison 1,331 1 No Monthly Constant 2,000 Uniform Rate
Effingham County 7,700 1 No Monthly Constant 0 Increasing Block 3 5,000
Elberton 7,800 1 No Monthly By Meter Size 0 Decreasing Block 2 149,600
Ellaville 2,779 1 No Monthly Constant 0 Increasing Block 6 2,000
Ellenton 374 1 No Monthly Constant 3,000 Increasing Block 3 10,000
Ellijay-Gilmer County Water and Sewer Authority 13,010 1 No Monthly Constant 0 Increasing Block 5 2,000
Emerson 1,394 1 Yes Monthly None 0 Increasing Block 2 10,000 89%
Enigma 1,113 1 No Monthly Constant 3,500 Uniform Rate
Ephesus 1,352 1 No Monthly Constant 2,000 Uniform Rate
Etowah Water and Sewer Authority 13,843 1 Yes Monthly By Meter Size 0 Increasing Block 2 15,000 112%
Fairburn 13,693 1 No Monthly Constant 0 Increasing Block 3 4,000
Fairmount 130 1 No Monthly Constant 1,000 Increasing Block 3 3,000
Fargo 380 1 No Monthly Constant 3,000 Uniform Rate
Fayette County 74,163 1 No Monthly By Meter Size 2,000 Increasing Block 2 20,000
Fayetteville 15,281 1 No Monthly Constant 2,000 Increasing Block 3 10,000
Fitzgerald Water Light and Bond Commission 12,935 1 No Monthly Constant 0 Uniform Rate
Flovilla 1,438 1 No Monthly Constant 1,000 Uniform Rate
Flowery Branch 2,920 1 No Monthly Constant 4,500 Increasing Block 2 7,500
Floyd County 41,738 1 No Monthly By Meter Size 2,000 Uniform Rate
Folkston 5,940 1 No Monthly Constant 3,000 Uniform Rate
Forest Heights Water Works, Inc. - 0 No Monthly Constant 6,000 Increasing Block 3 12,000
Forsyth 7,400 1 No Monthly Constant 2,000 Decreasing Block 3 5,000
Forsyth County 138,368 1 Yes Monthly By Meter Size 1,000 Increasing Block 4 6,000 170%
Fort Gaines 1,422 1 No Monthly Constant 0 Uniform Rate
Service Population is approximated and may not be actual.
Source: 1=EPA SDWIS 2017, 2=Census Population in 2016
Georgia Environmental Finance Authority
and Environmental Finance Center

Utility / Rate Structure
Different
than
Residential
Water Rate
Structure?
Billing Period
(Monthly,
Bimonthly,
Quarterly, Other)
Base Charge
Pricing
Monthly
Gallons
Provided with
Base Charge
(Allowance)
Residential Irrigation Rate
Structure
Number
of
Blocks
First Block
Maximum
(Monthly
Gallons)
Irrigation/Water
Bill Differential
at 15,000
Gallons
Rate Table 5: 2017 Irrigation Rate Structures for Residential Customers
Service
Population
(Approx.)
Fort Oglethorpe 9,446 1 No Monthly Constant 2,000 Uniform Rate
Fort Valley Utility Commission 17,645 1 No Monthly Constant 0 Increasing Block 3 4,488
Franklin County 2,764 1 No Monthly By Meter Size 2,000 Increasing Block 2 6,000
Franklin Springs 997 1 No Monthly Constant 0 Uniform Rate
Fulton County 172,533 1 Yes Bi-monthly Constant 0 Uniform Rate 180%
Funston 551 1 No Monthly Constant 2,000 Uniform Rate
Gainesville 117,962 1 Yes Monthly None 0 Uniform Rate 158%
Garden City 8,166 1 No Monthly Constant 0 Increasing Block 6 2,500
Garfield 390 1 No Monthly Constant 3,000 Uniform Rate
Gay 179 1 No Monthly Constant 2,000 Uniform Rate
Georgetown-Quitman County Water, Sewer and Solid
Waste Authority 985 1 No Monthly Constant 2,000 Uniform Rate
Gibson 720 1 No Monthly Constant 3,000 Uniform Rate
Glennville 4,711 1 No Monthly By Meter Size 2,000 Increasing Block 4 5,000
Glenwood 1,012 1 No Monthly Constant 2,000 Uniform Rate
Gordon 2,340 1 No Monthly Constant 2,000 Uniform Rate
Graham 261 2 No Monthly Constant 2,000 Uniform Rate
Grantville 1,508 1 No Monthly Constant 2,000 Increasing Block 2 5,000
Greensboro 3,156 1 No Monthly Constant 3,000 Uniform Rate
Greenville 1,880 1 No Monthly By Meter Size 0 Uniform Rate
Griffin 23,643 1 Yes Monthly By Meter Size 2,000 Uniform Rate 118%
Griffin - Spalding County - 0 No Monthly Constant 0 Increasing Block 3 7,000
Grovetown 11,216 1 No Monthly Constant 3,000 Increasing Block 5 10,000
Guyton 2,394 1 No Monthly Constant 2,000 Increasing Block 5 5,000
Gwinnett County 795,657 1 Yes Monthly By Meter Size 0 Uniform Rate 146%
Hahira 2,846 1 No Monthly Constant 3,000 Uniform Rate
Hall County
Hamilton 928 1 No Monthly By Meter Size 1,000 Increasing Block 3 3,000
Hampton 7,305 1 No Monthly Constant 0 Increasing Block 3 6,000
Hancock County 900 1 No Monthly Constant 2,000 Uniform Rate
Hapeville 5,385 1 No Monthly Constant 2,000 Increasing Block 3 9,900
Service Population is approximated and may not be actual.
Source: 1=EPA SDWIS 2017, 2=Census Population in 2016
Georgia Environmental Finance Authority
and Environmental Finance Center

Utility / Rate Structure
Different
than
Residential
Water Rate
Structure?
Billing Period
(Monthly,
Bimonthly,
Quarterly, Other)
Base Charge
Pricing
Monthly
Gallons
Provided with
Base Charge
(Allowance)
Residential Irrigation Rate
Structure
Number
of
Blocks
First Block
Maximum
(Monthly
Gallons)
Irrigation/Water
Bill Differential
at 15,000
Gallons
Rate Table 5: 2017 Irrigation Rate Structures for Residential Customers
Service
Population
(Approx.)
Haralson County Water Authority 11,362 1 No Monthly Constant 2,000 Increasing Block 3 6,000
Harlem 5,356 1 No Monthly Constant 2,000 Increasing Block 2 20,000
Harris County 20,062 1 No Monthly Constant 1,000 Uniform Rate
Harrison 500 1 No Monthly Constant 2,000 Uniform Rate
Hart County Water and Sewer Authority 3,606 1 No Monthly By Meter Size 1,000 Increasing Block 2 10,000
Hartford Water Authority 487 1 No Monthly Constant 2,000 Uniform Rate
Hartwell 7,116 1 No Monthly Constant 2,000 Uniform Rate
Hawkinsville 4,856 1 No Monthly Constant 2,500 Uniform Rate
Hazlehurst 5,800 1 No Monthly Constant 2,000 Uniform Rate
Heard County Water Authority 8,172 1 No Monthly By Meter Size 0 Increasing Block 3 10,000
Helen 1,851 1 No Monthly Constant 0 Increasing Block 3 5,000
Henry County Water Authority 218,667 1 Yes Monthly Constant 0 Uniform Rate 135%
Hephzibah 4,500 1 No Monthly By Meter Size 2,500 Increasing Block 2 10,000
Hiawassee - above booster 5,496 1 No Monthly Constant 1,000 Uniform Rate
Hiawassee - below booster 5,496 1 No Monthly Constant 1,000 Uniform Rate
Hiltonia 392 1 No Monthly Constant 4,000 Increasing Block 4 6,000
Hinesville 23,400 1 No Monthly Constant 3,000 Increasing Block 4 7,000
Hiram 858 1 No Monthly Constant 2,000 Increasing Block 3 6,000
Hoboken 463 1 No Monthly Constant 0 Increasing Block 6 5,000
Hogansville 3,728 1 No Monthly Constant 0 Increasing Block 4 5,000
Homeland 995 1 No Monthly Constant 2,000 Increasing Block 2 5,000
Homer 950 1 No Monthly Constant 3,000 Uniform Rate
Hoschton 1,547 1 No Monthly Constant 0 Increasing Block 4 4,000
Houston County 69,747 1 No Monthly Constant 2,500 Uniform Rate
Ideal 450 1 No Monthly Constant 1,000 Uniform Rate
Ila 437 1 No Monthly Constant 2,000 Decreasing Block 2 6,000
Iron City 411 1 No Monthly None 0 Non-Volumetric Flat Charge
Irwinton 1,817 1 No Monthly Constant 2,000 Uniform Rate
Ivey 1,086 1 No Monthly Constant 2,000 Uniform Rate
Jackson 4,950 2 Yes Monthly Constant 2,000 Uniform Rate 126%
Jackson County Water and Sewer Authority 19,191 1 Yes Monthly By Meter Size 0 Uniform Rate 126%
Service Population is approximated and may not be actual.
Source: 1=EPA SDWIS 2017, 2=Census Population in 2016
Georgia Environmental Finance Authority
and Environmental Finance Center
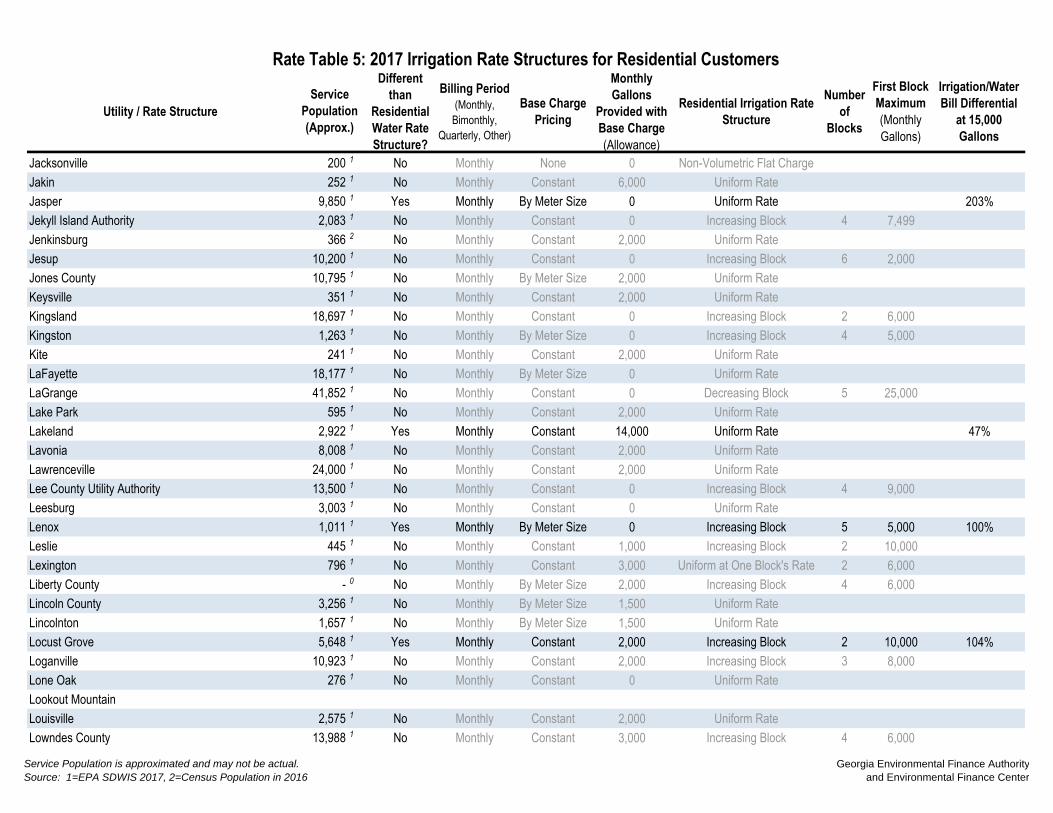
Utility / Rate Structure
Different
than
Residential
Water Rate
Structure?
Billing Period
(Monthly,
Bimonthly,
Quarterly, Other)
Base Charge
Pricing
Monthly
Gallons
Provided with
Base Charge
(Allowance)
Residential Irrigation Rate
Structure
Number
of
Blocks
First Block
Maximum
(Monthly
Gallons)
Irrigation/Water
Bill Differential
at 15,000
Gallons
Rate Table 5: 2017 Irrigation Rate Structures for Residential Customers
Service
Population
(Approx.)
Jacksonville 200 1 No Monthly None 0 Non-Volumetric Flat Charge
Jakin 252 1 No Monthly Constant 6,000 Uniform Rate
Jasper 9,850 1 Yes Monthly By Meter Size 0 Uniform Rate 203%
Jekyll Island Authority 2,083 1 No Monthly Constant 0 Increasing Block 4 7,499
Jenkinsburg 366 2 No Monthly Constant 2,000 Uniform Rate
Jesup 10,200 1 No Monthly Constant 0 Increasing Block 6 2,000
Jones County 10,795 1 No Monthly By Meter Size 2,000 Uniform Rate
Keysville 351 1 No Monthly Constant 2,000 Uniform Rate
Kingsland 18,697 1 No Monthly Constant 0 Increasing Block 2 6,000
Kingston 1,263 1 No Monthly By Meter Size 0 Increasing Block 4 5,000
Kite 241 1 No Monthly Constant 2,000 Uniform Rate
LaFayette 18,177 1 No Monthly By Meter Size 0 Uniform Rate
LaGrange 41,852 1 No Monthly Constant 0 Decreasing Block 5 25,000
Lake Park 595 1 No Monthly Constant 2,000 Uniform Rate
Lakeland 2,922 1 Yes Monthly Constant 14,000 Uniform Rate 47%
Lavonia 8,008 1 No Monthly Constant 2,000 Uniform Rate
Lawrenceville 24,000 1 No Monthly Constant 2,000 Uniform Rate
Lee County Utility Authority 13,500 1 No Monthly Constant 0 Increasing Block 4 9,000
Leesburg 3,003 1 No Monthly Constant 0 Uniform Rate
Lenox 1,011 1 Yes Monthly By Meter Size 0 Increasing Block 5 5,000 100%
Leslie 445 1 No Monthly Constant 1,000 Increasing Block 2 10,000
Lexington 796 1 No Monthly Constant 3,000 Uniform at One Block's Rate 2 6,000
Liberty County - 0 No Monthly By Meter Size 2,000 Increasing Block 4 6,000
Lincoln County 3,256 1 No Monthly By Meter Size 1,500 Uniform Rate
Lincolnton 1,657 1 No Monthly By Meter Size 1,500 Uniform Rate
Locust Grove 5,648 1 Yes Monthly Constant 2,000 Increasing Block 2 10,000 104%
Loganville 10,923 1 No Monthly Constant 2,000 Increasing Block 3 8,000
Lone Oak 276 1 No Monthly Constant 0 Uniform Rate
Lookout Mountain
Louisville 2,575 1 No Monthly Constant 2,000 Uniform Rate
Lowndes County 13,988 1 No Monthly Constant 3,000 Increasing Block 4 6,000
Service Population is approximated and may not be actual.
Source: 1=EPA SDWIS 2017, 2=Census Population in 2016
Georgia Environmental Finance Authority
and Environmental Finance Center
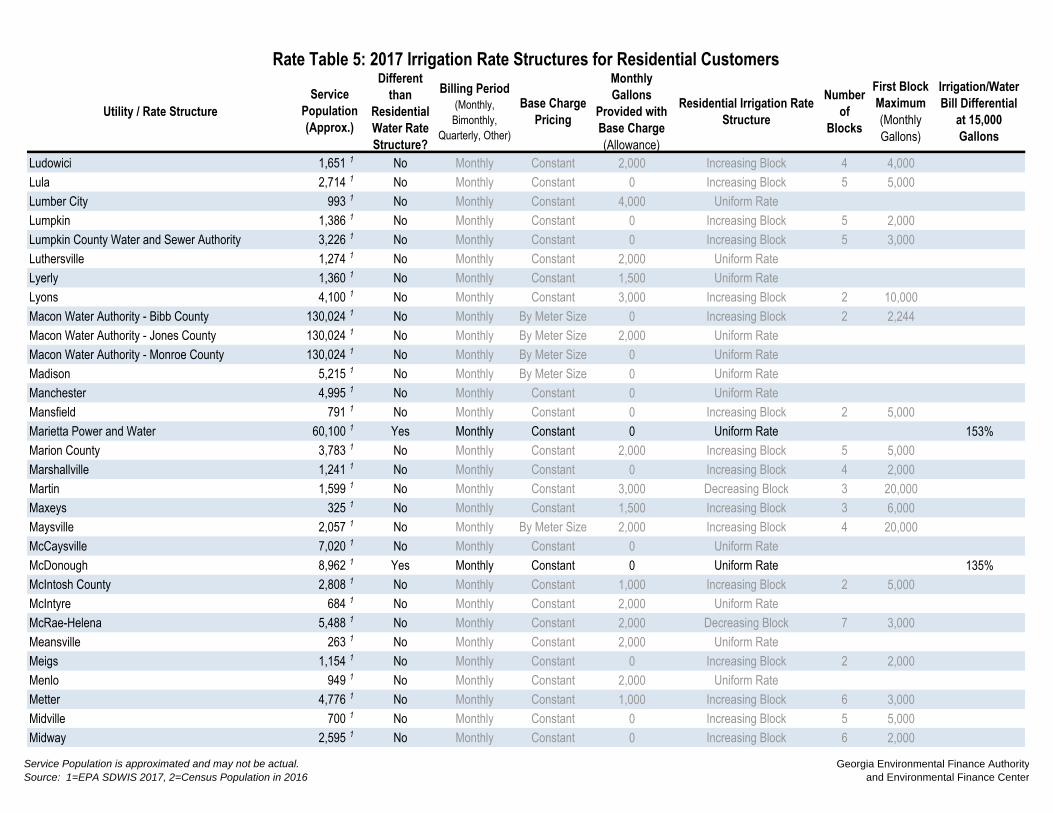
Utility / Rate Structure
Different
than
Residential
Water Rate
Structure?
Billing Period
(Monthly,
Bimonthly,
Quarterly, Other)
Base Charge
Pricing
Monthly
Gallons
Provided with
Base Charge
(Allowance)
Residential Irrigation Rate
Structure
Number
of
Blocks
First Block
Maximum
(Monthly
Gallons)
Irrigation/Water
Bill Differential
at 15,000
Gallons
Rate Table 5: 2017 Irrigation Rate Structures for Residential Customers
Service
Population
(Approx.)
Ludowici 1,651 1 No Monthly Constant 2,000 Increasing Block 4 4,000
Lula 2,714 1 No Monthly Constant 0 Increasing Block 5 5,000
Lumber City 993 1 No Monthly Constant 4,000 Uniform Rate
Lumpkin 1,386 1 No Monthly Constant 0 Increasing Block 5 2,000
Lumpkin County Water and Sewer Authority 3,226 1 No Monthly Constant 0 Increasing Block 5 3,000
Luthersville 1,274 1 No Monthly Constant 2,000 Uniform Rate
Lyerly 1,360 1 No Monthly Constant 1,500 Uniform Rate
Lyons 4,100 1 No Monthly Constant 3,000 Increasing Block 2 10,000
Macon Water Authority - Bibb County 130,024 1 No Monthly By Meter Size 0 Increasing Block 2 2,244
Macon Water Authority - Jones County 130,024 1 No Monthly By Meter Size 2,000 Uniform Rate
Macon Water Authority - Monroe County 130,024 1 No Monthly By Meter Size 0 Uniform Rate
Madison 5,215 1 No Monthly By Meter Size 0 Uniform Rate
Manchester 4,995 1 No Monthly Constant 0 Uniform Rate
Mansfield 791 1 No Monthly Constant 0 Increasing Block 2 5,000
Marietta Power and Water 60,100 1 Yes Monthly Constant 0 Uniform Rate 153%
Marion County 3,783 1 No Monthly Constant 2,000 Increasing Block 5 5,000
Marshallville 1,241 1 No Monthly Constant 0 Increasing Block 4 2,000
Martin 1,599 1 No Monthly Constant 3,000 Decreasing Block 3 20,000
Maxeys 325 1 No Monthly Constant 1,500 Increasing Block 3 6,000
Maysville 2,057 1 No Monthly By Meter Size 2,000 Increasing Block 4 20,000
McCaysville 7,020 1 No Monthly Constant 0 Uniform Rate
McDonough 8,962 1 Yes Monthly Constant 0 Uniform Rate 135%
McIntosh County 2,808 1 No Monthly Constant 1,000 Increasing Block 2 5,000
McIntyre 684 1 No Monthly Constant 2,000 Uniform Rate
McRae-Helena 5,488 1 No Monthly Constant 2,000 Decreasing Block 7 3,000
Meansville 263 1 No Monthly Constant 2,000 Uniform Rate
Meigs 1,154 1 No Monthly Constant 0 Increasing Block 2 2,000
Menlo 949 1 No Monthly Constant 2,000 Uniform Rate
Metter 4,776 1 No Monthly Constant 1,000 Increasing Block 6 3,000
Midville 700 1 No Monthly Constant 0 Increasing Block 5 5,000
Midway 2,595 1 No Monthly Constant 0 Increasing Block 6 2,000
Service Population is approximated and may not be actual.
Source: 1=EPA SDWIS 2017, 2=Census Population in 2016
Georgia Environmental Finance Authority
and Environmental Finance Center

Utility / Rate Structure
Different
than
Residential
Water Rate
Structure?
Billing Period
(Monthly,
Bimonthly,
Quarterly, Other)
Base Charge
Pricing
Monthly
Gallons
Provided with
Base Charge
(Allowance)
Residential Irrigation Rate
Structure
Number
of
Blocks
First Block
Maximum
(Monthly
Gallons)
Irrigation/Water
Bill Differential
at 15,000
Gallons
Rate Table 5: 2017 Irrigation Rate Structures for Residential Customers
Service
Population
(Approx.)
Milledgeville 19,456 1 No Monthly Constant 3,000 Uniform Rate
Millen 4,000 1 No Monthly Constant 0 Increasing Block 3 9,000
Milner 902 1 No Monthly Constant 2,000 Increasing Block 3 5,000
Mitchell 325 1 No Monthly Constant 1,000 Uniform Rate
Molena 467 1 No Monthly Constant 2,000 Increasing Block 2 7,000
Monroe 21,739 1 Yes Monthly By Meter Size 0 Uniform Rate 88%
Monroe County 6,653 1 No Monthly By Meter Size 1,000 Uniform Rate
Montezuma 3,443 1 No Monthly Constant 0 Increasing Block 4 2,000
Monticello 3,505 1 No Monthly Constant 2,000 Increasing Block 3 4,000
Morganton 2,060 1 No Monthly Constant 2,000 Uniform Rate
Morven 601 1 No Monthly Constant 0 Increasing Block 5 2,000
Moultrie 15,634 1 No Monthly Constant 2,000 Uniform Rate
Mount Airy 1,384 1 No Monthly Constant 2,000 Increasing/Decreasing Block 9 3,000
Mount Zion 1,638 1 No Bi-monthly Constant 2,000 Uniform Rate
Mountain Park 798 1 No Monthly Constant 2,500 Increasing Block 2 4,500
MSO Water Systems, Inc. - 0 No Monthly Constant 6,000 Increasing Block 3 12,000
MSO Water Systems, Inc. - Briarcrest - 0 No Bi-monthly Constant 6,000 Increasing Block 3 9,000
MSO Water Systems, Inc. - English Oaks - 0 No Monthly Constant 3,000 Increasing Block 2 9,000
Nahunta 1,074 1 No Monthly Constant 0 Increasing Block 4 2,000
Nashville 4,896 1 No Monthly Constant 0 Increasing Block 4 3,000
Newborn 832 1 No Monthly Constant 1,000 Uniform Rate
Newington 227 1 No Monthly Constant 2,000 Increasing Block 4 5,000
Newnan Utilities 34,000 1 Yes Monthly Constant 0 Uniform Rate 115%
Newton 681 1 No Monthly Constant 8,000 Uniform Rate
Newton County Water and Sewer Authority 62,384 1 No Monthly Constant 0 Increasing Block 4 3,000
Nicholls 2,745 1 No Monthly Constant 0 Increasing Block 4 2,000
Nicholson Water Authority 2,857 1 No Monthly Constant 1,000 Increasing Block 3 6,000
Norman Park 1,173 1 No Monthly Constant 0 Increasing Block 6 2,000
Norwood 364 1 No Monthly By Meter Size 2,000 Uniform Rate
Notla Water Authority 13,465 1 No Monthly Constant 2,000 Uniform Rate
Oakwood - Flowery Branch
Service Population is approximated and may not be actual.
Source: 1=EPA SDWIS 2017, 2=Census Population in 2016
Georgia Environmental Finance Authority
and Environmental Finance Center
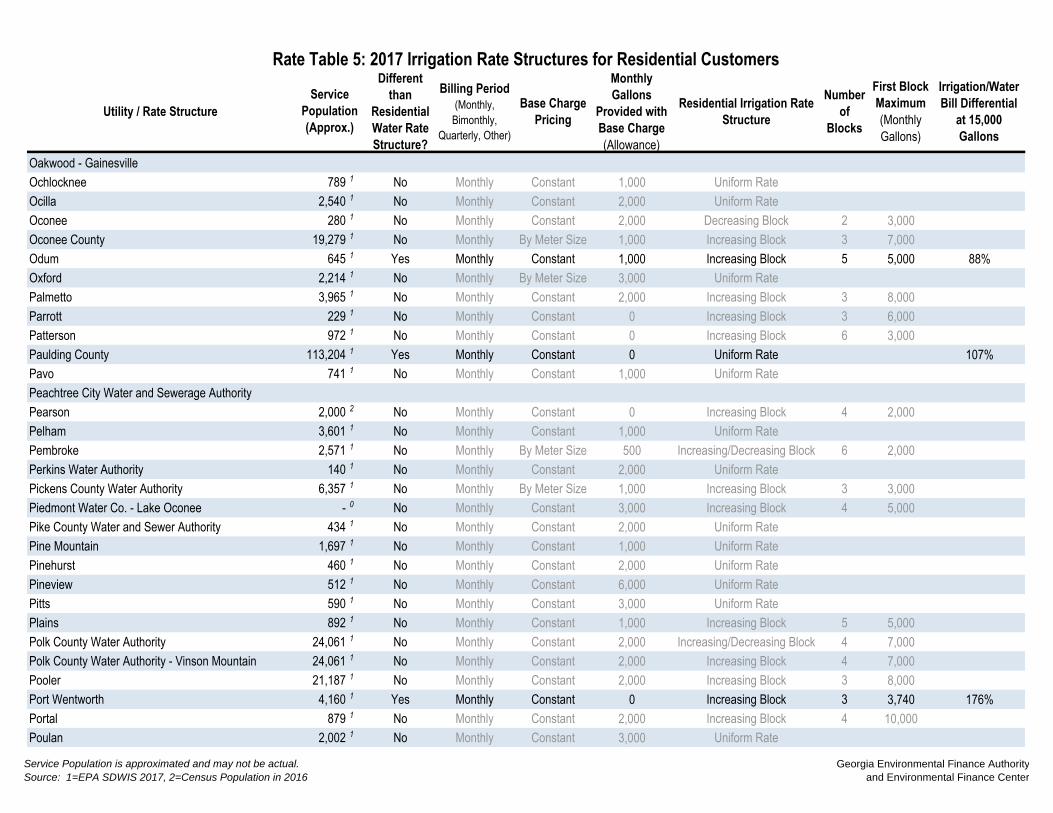
Utility / Rate Structure
Different
than
Residential
Water Rate
Structure?
Billing Period
(Monthly,
Bimonthly,
Quarterly, Other)
Base Charge
Pricing
Monthly
Gallons
Provided with
Base Charge
(Allowance)
Residential Irrigation Rate
Structure
Number
of
Blocks
First Block
Maximum
(Monthly
Gallons)
Irrigation/Water
Bill Differential
at 15,000
Gallons
Rate Table 5: 2017 Irrigation Rate Structures for Residential Customers
Service
Population
(Approx.)
Oakwood - Gainesville
Ochlocknee 789 1 No Monthly Constant 1,000 Uniform Rate
Ocilla 2,540 1 No Monthly Constant 2,000 Uniform Rate
Oconee 280 1 No Monthly Constant 2,000 Decreasing Block 2 3,000
Oconee County 19,279 1 No Monthly By Meter Size 1,000 Increasing Block 3 7,000
Odum 645 1 Yes Monthly Constant 1,000 Increasing Block 5 5,000 88%
Oxford 2,214 1 No Monthly By Meter Size 3,000 Uniform Rate
Palmetto 3,965 1 No Monthly Constant 2,000 Increasing Block 3 8,000
Parrott 229 1 No Monthly Constant 0 Increasing Block 3 6,000
Patterson 972 1 No Monthly Constant 0 Increasing Block 6 3,000
Paulding County 113,204 1 Yes Monthly Constant 0 Uniform Rate 107%
Pavo 741 1 No Monthly Constant 1,000 Uniform Rate
Peachtree City Water and Sewerage Authority
Pearson 2,000 2 No Monthly Constant 0 Increasing Block 4 2,000
Pelham 3,601 1 No Monthly Constant 1,000 Uniform Rate
Pembroke 2,571 1 No Monthly By Meter Size 500 Increasing/Decreasing Block 6 2,000
Perkins Water Authority 140 1 No Monthly Constant 2,000 Uniform Rate
Pickens County Water Authority 6,357 1 No Monthly By Meter Size 1,000 Increasing Block 3 3,000
Piedmont Water Co. - Lake Oconee - 0 No Monthly Constant 3,000 Increasing Block 4 5,000
Pike County Water and Sewer Authority 434 1 No Monthly Constant 2,000 Uniform Rate
Pine Mountain 1,697 1 No Monthly Constant 1,000 Uniform Rate
Pinehurst 460 1 No Monthly Constant 2,000 Uniform Rate
Pineview 512 1 No Monthly Constant 6,000 Uniform Rate
Pitts 590 1 No Monthly Constant 3,000 Uniform Rate
Plains 892 1 No Monthly Constant 1,000 Increasing Block 5 5,000
Polk County Water Authority 24,061 1 No Monthly Constant 2,000 Increasing/Decreasing Block 4 7,000
Polk County Water Authority - Vinson Mountain 24,061 1 No Monthly Constant 2,000 Increasing Block 4 7,000
Pooler 21,187 1 No Monthly Constant 2,000 Increasing Block 3 8,000
Port Wentworth 4,160 1 Yes Monthly Constant 0 Increasing Block 3 3,740 176%
Portal 879 1 No Monthly Constant 2,000 Increasing Block 4 10,000
Poulan 2,002 1 No Monthly Constant 3,000 Uniform Rate
Service Population is approximated and may not be actual.
Source: 1=EPA SDWIS 2017, 2=Census Population in 2016
Georgia Environmental Finance Authority
and Environmental Finance Center

Utility / Rate Structure
Different
than
Residential
Water Rate
Structure?
Billing Period
(Monthly,
Bimonthly,
Quarterly, Other)
Base Charge
Pricing
Monthly
Gallons
Provided with
Base Charge
(Allowance)
Residential Irrigation Rate
Structure
Number
of
Blocks
First Block
Maximum
(Monthly
Gallons)
Irrigation/Water
Bill Differential
at 15,000
Gallons
Rate Table 5: 2017 Irrigation Rate Structures for Residential Customers
Service
Population
(Approx.)
Powder Springs 14,000 1 No Monthly Constant 0 Increasing Block 6 2,000
Pulaski 280 1 No Monthly Constant 3,000 Increasing Block 3 7,000
Quitman 4,942 1 No Monthly Constant 0 Increasing Block 3 2,000
Rabun County Water and Sewer Authority - 0 No Monthly Constant 2,000 Uniform Rate
Randolph County Water Authority 231 1 No Monthly Constant 2,000 Uniform Rate
Ray City 845 1 No Monthly Constant 0 Uniform Rate
Register 182 1 No Monthly Constant 0 Increasing Block 5 5,000
Remerton 1,479 1 No Monthly Constant 0 Uniform Rate
Rentz 310 1 No Monthly Constant 2,000 Uniform Rate
Reynolds 1,373 1 No Monthly Constant 2,000 Uniform Rate
Rhine 413 1 No Monthly None 0 Non-Volumetric Flat Charge
Riceboro 1,131 1 No Monthly Constant 2,000 Uniform Rate
Richland 1,323 1 No Monthly None 0 Non-Volumetric Flat Charge
Richmond Hill 11,258 1 Yes Monthly Constant 0 Uniform Rate 126%
Riddleville 128 1 No Monthly Constant 2,000 Uniform Rate
Rincon 9,880 1 No Monthly Constant 3,000 Increasing Block 4 9,000
Ringgold 2,743 1 No Monthly By Meter Size 2,000 Uniform Rate
Ringgold - Dalton
Ringgold - Meadows
Roberta 1,615 1 No Monthly Constant 0 Increasing Block 3 40,000
Rochelle 1,581 1 No Monthly Constant 0 Uniform Rate
Rockdale County Water and Sewer Authority 72,621 1 Yes Monthly By Meter Size 0 Uniform Rate 122%
Rockmart 6,500 1 No Monthly Constant 2,000 Increasing Block 5 10,000
Rocky Ford 165 1 No Monthly Constant 3,000 Increasing Block 3 5,000
Rome - Zone 1 45,586 1 Yes Monthly By Meter Size 748 Uniform Rate 130%
Rome - Zone 2 45,586 1 Yes Monthly By Meter Size 0 Uniform Rate 135%
Rome - Zone 3 45,586 1 Yes Monthly Constant 0 Uniform Rate 130%
Rome - Zone 4 45,586 1 Yes Monthly By Meter Size 748 Uniform Rate 130%
Roopville 252 1 No Bi-monthly Constant 1,000 Increasing Block 6 3,000
Roswell 14,300 1 Yes Monthly By Meter Size 0 Uniform Rate 148%
Royston 2,800 1 No Monthly Constant 0 Uniform Rate
Service Population is approximated and may not be actual.
Source: 1=EPA SDWIS 2017, 2=Census Population in 2016
Georgia Environmental Finance Authority
and Environmental Finance Center
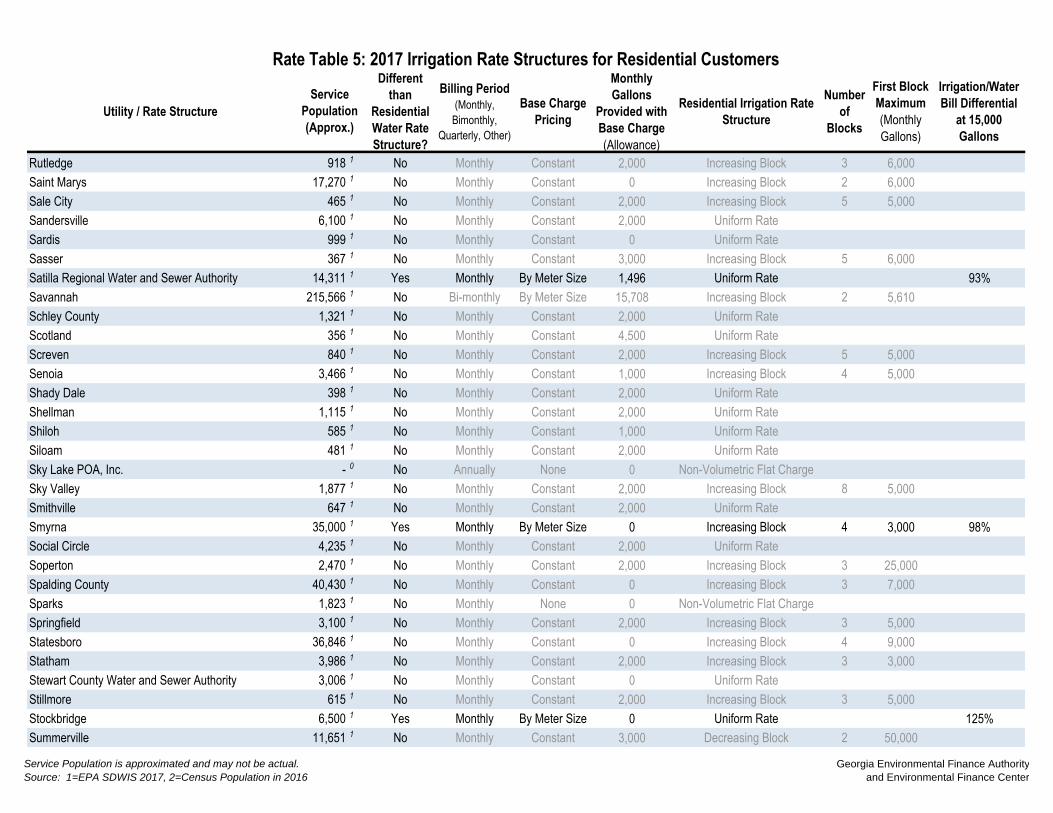
Utility / Rate Structure
Different
than
Residential
Water Rate
Structure?
Billing Period
(Monthly,
Bimonthly,
Quarterly, Other)
Base Charge
Pricing
Monthly
Gallons
Provided with
Base Charge
(Allowance)
Residential Irrigation Rate
Structure
Number
of
Blocks
First Block
Maximum
(Monthly
Gallons)
Irrigation/Water
Bill Differential
at 15,000
Gallons
Rate Table 5: 2017 Irrigation Rate Structures for Residential Customers
Service
Population
(Approx.)
Rutledge 918 1 No Monthly Constant 2,000 Increasing Block 3 6,000
Saint Marys 17,270 1 No Monthly Constant 0 Increasing Block 2 6,000
Sale City 465 1 No Monthly Constant 2,000 Increasing Block 5 5,000
Sandersville 6,100 1 No Monthly Constant 2,000 Uniform Rate
Sardis 999 1 No Monthly Constant 0 Uniform Rate
Sasser 367 1 No Monthly Constant 3,000 Increasing Block 5 6,000
Satilla Regional Water and Sewer Authority 14,311 1 Yes Monthly By Meter Size 1,496 Uniform Rate 93%
Savannah 215,566 1 No Bi-monthly By Meter Size 15,708 Increasing Block 2 5,610
Schley County 1,321 1 No Monthly Constant 2,000 Uniform Rate
Scotland 356 1 No Monthly Constant 4,500 Uniform Rate
Screven 840 1 No Monthly Constant 2,000 Increasing Block 5 5,000
Senoia 3,466 1 No Monthly Constant 1,000 Increasing Block 4 5,000
Shady Dale 398 1 No Monthly Constant 2,000 Uniform Rate
Shellman 1,115 1 No Monthly Constant 2,000 Uniform Rate
Shiloh 585 1 No Monthly Constant 1,000 Uniform Rate
Siloam 481 1 No Monthly Constant 2,000 Uniform Rate
Sky Lake POA, Inc. - 0 No Annually None 0 Non-Volumetric Flat Charge
Sky Valley 1,877 1 No Monthly Constant 2,000 Increasing Block 8 5,000
Smithville 647 1 No Monthly Constant 2,000 Uniform Rate
Smyrna 35,000 1 Yes Monthly By Meter Size 0 Increasing Block 4 3,000 98%
Social Circle 4,235 1 No Monthly Constant 2,000 Uniform Rate
Soperton 2,470 1 No Monthly Constant 2,000 Increasing Block 3 25,000
Spalding County 40,430 1 No Monthly Constant 0 Increasing Block 3 7,000
Sparks 1,823 1 No Monthly None 0 Non-Volumetric Flat Charge
Springfield 3,100 1 No Monthly Constant 2,000 Increasing Block 3 5,000
Statesboro 36,846 1 No Monthly Constant 0 Increasing Block 4 9,000
Statham 3,986 1 No Monthly Constant 2,000 Increasing Block 3 3,000
Stewart County Water and Sewer Authority 3,006 1 No Monthly Constant 0 Uniform Rate
Stillmore 615 1 No Monthly Constant 2,000 Increasing Block 3 5,000
Stockbridge 6,500 1 Yes Monthly By Meter Size 0 Uniform Rate 125%
Summerville 11,651 1 No Monthly Constant 3,000 Decreasing Block 2 50,000
Service Population is approximated and may not be actual.
Source: 1=EPA SDWIS 2017, 2=Census Population in 2016
Georgia Environmental Finance Authority
and Environmental Finance Center

Utility / Rate Structure
Different
than
Residential
Water Rate
Structure?
Billing Period
(Monthly,
Bimonthly,
Quarterly, Other)
Base Charge
Pricing
Monthly
Gallons
Provided with
Base Charge
(Allowance)
Residential Irrigation Rate
Structure
Number
of
Blocks
First Block
Maximum
(Monthly
Gallons)
Irrigation/Water
Bill Differential
at 15,000
Gallons
Rate Table 5: 2017 Irrigation Rate Structures for Residential Customers
Service
Population
(Approx.)
Sumner 848 1 No Monthly Constant 1,000 Increasing Block 3 2,000
Surrency 170 2 No Monthly Constant 4,000 Increasing Block 2 8,000
Suwanee 920 1 No Monthly Constant 2,000 Increasing Block 3 5,000
Sylvania 2,960 1 No Monthly Constant 0 Increasing Block 4 3,000
Sylvester 12,886 1 No Monthly Constant 0 Increasing/Decreasing Block 3 5,000
Talbot County 3,398 1 No Monthly Constant 2,000 Uniform Rate
Talbotton 738 1 No Monthly Constant 2,000 Uniform Rate
Tallapoosa 4,030 1 No Monthly Constant 2,000 Uniform Rate
Tarrytown 88 1 No Monthly Constant 0 Uniform Rate
Taylor County Water and Sewer Authority 91 1 No Monthly Constant 5,000 Uniform Rate
Temple 4,250 1 No Monthly Constant 0 Increasing Block 2 6,500
Tennille 1,802 1 Yes Monthly Constant 0 Increasing Block 5 2,000 50%
Thomaston 10,510 1 No Monthly Constant 0 Uniform Rate
Thomasville 23,577 1 No Monthly By Meter Size 0 Uniform Rate
Thomson-McDuffie County Water and Sewer
Commission 17,717 1 No Monthly Constant 0 Uniform Rate
Thunderbolt 2,668 1 No Monthly Constant 0 Uniform at One Block's Rate 6 1,000
Tifton 24,871 1 No Monthly By Meter Size 0 Uniform Rate
Tignall 754 1 No Monthly Constant 2,000 Increasing Block 3 5,000
Toccoa 24,960 1 No Monthly Constant 2,000 Uniform Rate
Toomsboro 472 1 No Monthly Constant 2,000 Uniform Rate
Towns County Water and Sewer Authority 9,991 1 No Monthly Constant 0 Uniform Rate
Trenton
Trion 2,400 1 No Monthly None 0 Non-Volumetric Flat Charge
Turin 671 1 No Monthly Constant 2,000 Increasing Block 3 5,000
Turtle Cove POA - 0 No Monthly Constant 4,000 Increasing Block 2 10,000
Twiggs County 376 1 No Monthly Constant 2,000 Uniform Rate
Tybee Island 8,047 1 Yes Monthly Constant 0 Increasing Block 4 5,000 118%
Tyrone 7,121 2 No Monthly By Meter Size 3,000 Increasing Block 2 20,000
Unadilla 3,837 1 No Monthly Constant 2,000 Uniform Rate
Union City 18,636 1 No Monthly By Meter Size 0 Increasing Block 2 15,000
Service Population is approximated and may not be actual.
Source: 1=EPA SDWIS 2017, 2=Census Population in 2016
Georgia Environmental Finance Authority
and Environmental Finance Center

Utility / Rate Structure
Different
than
Residential
Water Rate
Structure?
Billing Period
(Monthly,
Bimonthly,
Quarterly, Other)
Base Charge
Pricing
Monthly
Gallons
Provided with
Base Charge
(Allowance)
Residential Irrigation Rate
Structure
Number
of
Blocks
First Block
Maximum
(Monthly
Gallons)
Irrigation/Water
Bill Differential
at 15,000
Gallons
Rate Table 5: 2017 Irrigation Rate Structures for Residential Customers
Service
Population
(Approx.)
Upson County 5,778 1 No Monthly Constant 0 Increasing Block 6 2,000
Utilities, Inc. of Georgia - The Landings - 0 No Monthly By Meter Size 0 Increasing Block 4 5,000
Utilities, Inc. of Georgia - The Orchard - 0 No Monthly Constant 3,000 Increasing Block 3 13,000
Valdosta 56,019 1 No Monthly By Meter Size 0 Increasing Block 2 3,740
Vidalia 13,050 1 No Monthly Constant 2,000 Increasing Block 4 10,000
Vienna 3,666 1 No Monthly Constant 0 Increasing Block 4 2,000
Villa Rica 13,996 1 Yes Monthly None 0 Uniform Rate 157%
Waco 913 1 No Monthly Constant 2,000 Uniform Rate
Wadley 2,500 1 No Monthly Constant 2,000 Uniform Rate
Waleska 2,691 1 No Monthly Constant 2,000 Increasing Block 3 5,000
Walker County Rural Water and Sewer Authority 3,270 1 No Monthly Constant 1,000 Uniform Rate
Walker County Water and Sewer Authority 36,000 1 No Monthly Constant 0 Uniform Rate
Walthourville 3,858 1 No Monthly Constant 1,000 Increasing Block 6 2,000
Walton County Water and Sewer Authority 36,387 1 No Monthly By Meter Size 2,000 Increasing Block 3 8,000
Warm Springs 1,120 1 No Monthly Constant 0 Uniform Rate
Warner Robins 64,163 1 No Monthly By Meter Size 0 Uniform Rate
Warrenton 2,800 1 No Monthly Constant 1,500 Increasing Block 2 10,000
Warwick 864 1 No Monthly Constant 0 Increasing Block 4 2,000
Washington 4,134 1 No Monthly Constant 0 Uniform Rate
Water Service Company of Georgia - Lake Riverside - 0 No Monthly Constant 0 Uniform Rate
Waycross 21,154 1 Yes Monthly By Meter Size 0 Uniform Rate 94%
Waynesboro 5,813 1 No Monthly By Meter Size 0 Uniform Rate
Webster County 1,038 1 No Monthly Constant 3,000 Uniform Rate
West Point 3,929 1 Yes Monthly Constant 0 Uniform Rate 97%
Whigham 879 1 No Monthly Constant 2,000 Uniform Rate
White 806 1 No Monthly Constant 3,000 Increasing Block 4 6,000
White County Water Authority 4,420 1 No Monthly By Meter Size 1,000 Increasing Block 3 4,000
White Plains 413 1 No Monthly Constant 2,000 Uniform Rate
Whitesburg 931 1 No Bi-monthly Constant 500 Uniform Rate
Willacoochee 1,940 1 No Monthly Constant 3,000 Uniform Rate
Service Population is approximated and may not be actual.
Source: 1=EPA SDWIS 2017, 2=Census Population in 2016
Georgia Environmental Finance Authority
and Environmental Finance Center

Utility / Rate Structure
Different
than
Residential
Water Rate
Structure?
Billing Period
(Monthly,
Bimonthly,
Quarterly, Other)
Base Charge
Pricing
Monthly
Gallons
Provided with
Base Charge
(Allowance)
Residential Irrigation Rate
Structure
Number
of
Blocks
First Block
Maximum
(Monthly
Gallons)
Irrigation/Water
Bill Differential
at 15,000
Gallons
Rate Table 5: 2017 Irrigation Rate Structures for Residential Customers
Service
Population
(Approx.)
Williamson 408 1 No Monthly Constant 1,500 Increasing Block 2 4,500
Winder 32,971 1 No Monthly By Meter Size 0 Increasing Block 3 2,000
Woodbine 1,508 1 Yes Monthly None 0 Increasing Block 4 5,000 84%
Woodbury 961 1 No Monthly Constant 0 Increasing Block 3 5,000
Woodstock 10,070 1 Yes Monthly Constant 1,000 Increasing Block 2 10,000 104%
Wrens 2,375 1 Yes Monthly Constant 1,000 Uniform Rate 96%
Service Population is approximated and may not be actual.
Source: 1=EPA SDWIS 2017, 2=Census Population in 2016
Georgia Environmental Finance Authority
and Environmental Finance Center

Compare with caution. High rates may be justified and necessary to protect public health.
Inside Outside Inside Outside Inside Outside Inside Outside Inside Outside Inside Outside
Adel 5,311 1 1.33 $9.13 $18.22 $32.81 $46.56 $57.86 $80.46
Adrian 664 1 0.89 $17.00 $37.75 $60.25 $84.00 $107.75 $155.25
Ailey 527 1 0.92 $15.00 $21.00 $31.00 $41.00 $51.00 $71.00
Alamo 3,457 1 1.00 $10.00 $14.50 $22.00 $29.50 $37.00 $52.00
Albany 87,029 1 1.21 $11.61 $16.63 $27.11 $36.21 $45.31 $63.51
Alcovy Shores Water Authority 432 1 0.99 $13.00 $48.00 $83.00 $118.00 $153.00 $223.00
Allentown 175 1 1.13 $17.50 $23.50 $33.50 $43.50 $53.50 $73.50
Alma 4,700 1 1.09 $7.00 $14.00 $39.80 $79.58 $106.05 $212.03 $172.30 $344.48 $238.55 $476.93 $371.05 $741.83
Alston 169 1 1.43 $18.00 $23.25 $33.25 $44.25 $56.75 $84.25
Alto 2,500 1 $12.00 $17.00 $24.00 $32.00 $44.00 $57.00 $64.00 $82.00 $84.00 $107.00 $124.00 $157.00
Americus 16,255 1 1.17 $7.10 $14.20 $22.61 $45.22 $38.12 $76.23 $53.62 $107.25 $69.13 $138.26 $100.15 $200.30
Andersonville 400 1 $9.00 $18.00 $33.00 $48.00 $63.00 $93.00
Arabi 429 1 0.82 $10.00 $13.60 $19.60 $25.60 $31.60 $43.60
Argyle 211 1 1.13 $25.00 $25.00 $25.00 $25.00 $25.00 $25.00
Arlington 1,243 1 0.86 $4.80 $23.55 $44.80 $66.05 $87.30 $129.80
Arnoldsville 1,040 1 1.05 $18.00 $33.00 $24.00 $42.00 $43.00 $66.50 $63.00 $91.50 $83.00 $116.50 $123.00 $166.50
Ashburn 4,272 1 1.36 $14.00 $21.25 $30.00 $43.75 $60.25 $98.75
Athens-Clarke County 120,266 1 1.72 $8.65 $76.15 $143.65 $211.15 $278.65 $413.65
Atlanta 650,000 1 1.44 $6.56 $6.56 $34.54 $41.64 $75.71 $91.58 $116.89 $141.51 $158.07 $191.44 $240.42 $291.31
Attapulgus 715 1 0.55 $8.00 $9.00 $14.14 $15.90 $29.49 $33.15 $44.84 $50.40 $60.19 $67.65 $90.89 $102.15
Auburn 6,904 1 1.64 $15.00 $20.00 $43.61 $51.99 $79.63 $91.39 $117.38 $132.54 $155.13 $173.69 $230.63 $255.99
Augusta 204,000 1 1.08 $23.78 $28.38 $41.08 $53.78 $66.48 $91.88
Austell 7,774 1 1.74 $8.28 $8.78 $20.91 $22.16 $43.85 $46.53 $68.05 $72.28 $101.75 $108.48 $169.15 $180.88
Avera 240 1 0.71 $12.00 $21.00 $32.50 $44.00 $55.50 $78.50
Baconton 985 1 $9.42 $11.47 $20.17 $27.62 $30.92 $43.77 $41.67 $59.92 $52.42 $76.07 $73.92 $108.37
Bainbridge 13,546 1 1.05 $14.96 $14.96 $23.46 $26.46 $31.96 $37.96 $40.46 $49.46 $48.96 $60.96 $65.96 $83.96
Baldwin 4,160 1 $10.00 $19.00 $25.90 $44.00 $65.65 $97.14 $118.65 $159.64 $171.65 $222.14 $277.65 $347.14
Baldwin County 21,840 1 1.19 $19.00 $32.50 $57.75 $85.75 $113.75 $175.25
Ball Ground 2,470 1 0.86 $18.00 $21.50 $29.90 $40.05 $51.25 $66.15 $81.25 $98.65 $111.25 $131.15 $171.25 $196.15
Banks County 6,453 1 $19.00 $38.05 $70.60 $104.10 $138.60 $208.60
Barnesville 6,755 1 1.35 $10.00 $16.30 $43.75 $50.05 $77.50 $83.80 $111.25 $117.55 $145.00 $151.30 $212.50 $218.80
Barrow County Water and Sewer Authority 14,043 1 1.20 $7.50 $39.00 $70.50 $112.55 $154.60 $238.70
Bartow 286 1 0.83 $14.00 $20.50 $17.90 $25.90 $24.40 $34.90 $30.90 $43.90 $37.40 $52.90 $50.40 $70.90
Bartow County 50,162 1 1.15 $6.49 $46.64 $86.79 $126.94 $180.49 $287.59
Barwick 497 1 0.80 $12.00 $37.75 $65.75 $94.50 $124.50 $185.75
Rate Table 6: 2017 Monthly-Equivalent RESIDENTIAL IRRIGATION Bills at Various Consumption Levels (Includes Base Charges)
Utility / Rate Structure
Service
Population
(Approx.)
Zero Gallons
(0 cf)
5,000 Gallons
(802 cf)
10,000 Gallons
(1,337cf)
15,000 Gallons
(2,005 cf)
20,000 Gallons
(2,674 cf)
30,000 Gallons
(4,011 cf)
Operating
Ratio
(FY2016)
Service Population is approximated and may not be actual.
Source: 1=EPA SDWIS 2017, 2=Census Population in 2016 *Based on data from FY2015 or earlierGeorgia Environmental Finance Authority
and Environmental Finance Center
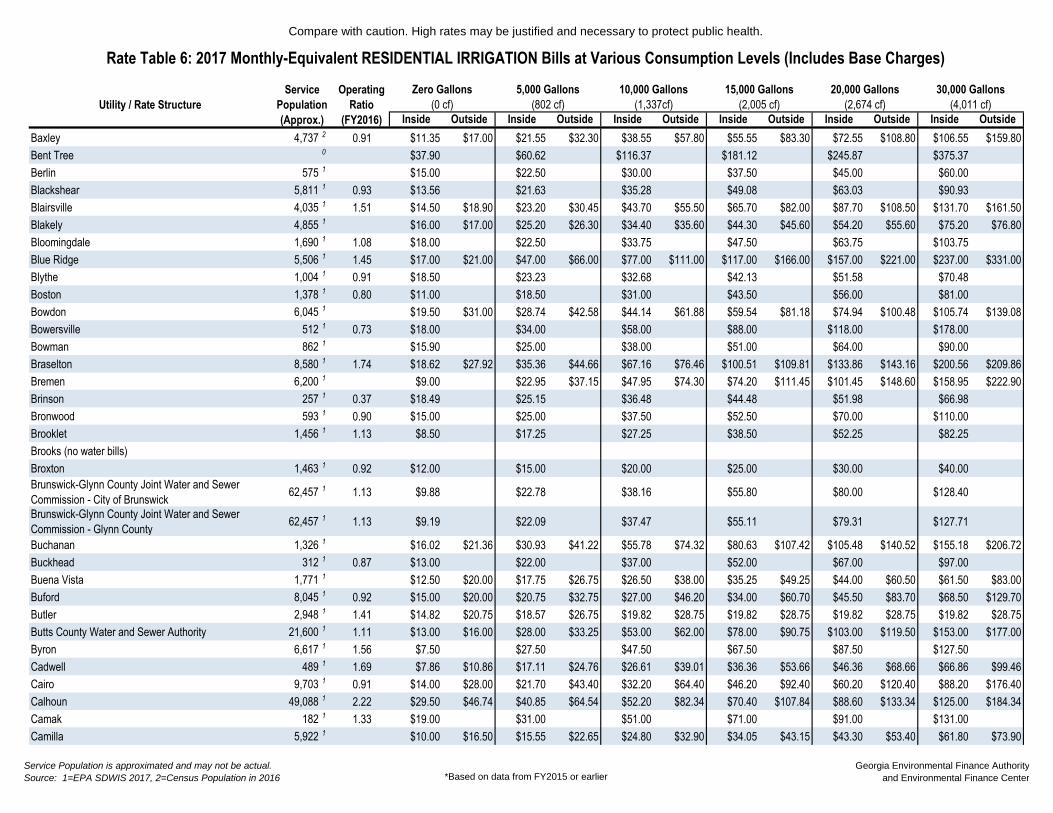
Compare with caution. High rates may be justified and necessary to protect public health.
Inside Outside Inside Outside Inside Outside Inside Outside Inside Outside Inside Outside
Rate Table 6: 2017 Monthly-Equivalent RESIDENTIAL IRRIGATION Bills at Various Consumption Levels (Includes Base Charges)
Utility / Rate Structure
Service
Population
(Approx.)
Zero Gallons
(0 cf)
5,000 Gallons
(802 cf)
10,000 Gallons
(1,337cf)
15,000 Gallons
(2,005 cf)
20,000 Gallons
(2,674 cf)
30,000 Gallons
(4,011 cf)
Operating
Ratio
(FY2016)
Baxley 4,737 2 0.91 $11.35 $17.00 $21.55 $32.30 $38.55 $57.80 $55.55 $83.30 $72.55 $108.80 $106.55 $159.80
Bent Tree 0 $37.90 $60.62 $116.37 $181.12 $245.87 $375.37
Berlin 575 1 $15.00 $22.50 $30.00 $37.50 $45.00 $60.00
Blackshear 5,811 1 0.93 $13.56 $21.63 $35.28 $49.08 $63.03 $90.93
Blairsville 4,035 1 1.51 $14.50 $18.90 $23.20 $30.45 $43.70 $55.50 $65.70 $82.00 $87.70 $108.50 $131.70 $161.50
Blakely 4,855 1 $16.00 $17.00 $25.20 $26.30 $34.40 $35.60 $44.30 $45.60 $54.20 $55.60 $75.20 $76.80
Bloomingdale 1,690 1 1.08 $18.00 $22.50 $33.75 $47.50 $63.75 $103.75
Blue Ridge 5,506 1 1.45 $17.00 $21.00 $47.00 $66.00 $77.00 $111.00 $117.00 $166.00 $157.00 $221.00 $237.00 $331.00
Blythe 1,004 1 0.91 $18.50 $23.23 $32.68 $42.13 $51.58 $70.48
Boston 1,378 1 0.80 $11.00 $18.50 $31.00 $43.50 $56.00 $81.00
Bowdon 6,045 1 $19.50 $31.00 $28.74 $42.58 $44.14 $61.88 $59.54 $81.18 $74.94 $100.48 $105.74 $139.08
Bowersville 512 1 0.73 $18.00 $34.00 $58.00 $88.00 $118.00 $178.00
Bowman 862 1 $15.90 $25.00 $38.00 $51.00 $64.00 $90.00
Braselton 8,580 1 1.74 $18.62 $27.92 $35.36 $44.66 $67.16 $76.46 $100.51 $109.81 $133.86 $143.16 $200.56 $209.86
Bremen 6,200 1 $9.00 $22.95 $37.15 $47.95 $74.30 $74.20 $111.45 $101.45 $148.60 $158.95 $222.90
Brinson 257 1 0.37 $18.49 $25.15 $36.48 $44.48 $51.98 $66.98
Bronwood 593 1 0.90 $15.00 $25.00 $37.50 $52.50 $70.00 $110.00
Brooklet 1,456 1 1.13 $8.50 $17.25 $27.25 $38.50 $52.25 $82.25
Brooks (no water bills)
Broxton 1,463 1 0.92 $12.00 $15.00 $20.00 $25.00 $30.00 $40.00
Brunswick-Glynn County Joint Water and Sewer
Commission - City of Brunswick 62,457 1 1.13 $9.88 $22.78 $38.16 $55.80 $80.00 $128.40
Brunswick-Glynn County Joint Water and Sewer
Commission - Glynn County 62,457 1 1.13 $9.19 $22.09 $37.47 $55.11 $79.31 $127.71
Buchanan 1,326 1 $16.02 $21.36 $30.93 $41.22 $55.78 $74.32 $80.63 $107.42 $105.48 $140.52 $155.18 $206.72
Buckhead 312 1 0.87 $13.00 $22.00 $37.00 $52.00 $67.00 $97.00
Buena Vista 1,771 1 $12.50 $20.00 $17.75 $26.75 $26.50 $38.00 $35.25 $49.25 $44.00 $60.50 $61.50 $83.00
Buford 8,045 1 0.92 $15.00 $20.00 $20.75 $32.75 $27.00 $46.20 $34.00 $60.70 $45.50 $83.70 $68.50 $129.70
Butler 2,948 1 1.41 $14.82 $20.75 $18.57 $26.75 $19.82 $28.75 $19.82 $28.75 $19.82 $28.75 $19.82 $28.75
Butts County Water and Sewer Authority 21,600 1 1.11 $13.00 $16.00 $28.00 $33.25 $53.00 $62.00 $78.00 $90.75 $103.00 $119.50 $153.00 $177.00
Byron 6,617 1 1.56 $7.50 $27.50 $47.50 $67.50 $87.50 $127.50
Cadwell 489 1 1.69 $7.86 $10.86 $17.11 $24.76 $26.61 $39.01 $36.36 $53.66 $46.36 $68.66 $66.86 $99.46
Cairo 9,703 1 0.91 $14.00 $28.00 $21.70 $43.40 $32.20 $64.40 $46.20 $92.40 $60.20 $120.40 $88.20 $176.40
Calhoun 49,088 1 2.22 $29.50 $46.74 $40.85 $64.54 $52.20 $82.34 $70.40 $107.84 $88.60 $133.34 $125.00 $184.34
Camak 182 1 1.33 $19.00 $31.00 $51.00 $71.00 $91.00 $131.00
Camilla 5,922 1 $10.00 $16.50 $15.55 $22.65 $24.80 $32.90 $34.05 $43.15 $43.30 $53.40 $61.80 $73.90
Service Population is approximated and may not be actual.
Source: 1=EPA SDWIS 2017, 2=Census Population in 2016 *Based on data from FY2015 or earlierGeorgia Environmental Finance Authority
and Environmental Finance Center
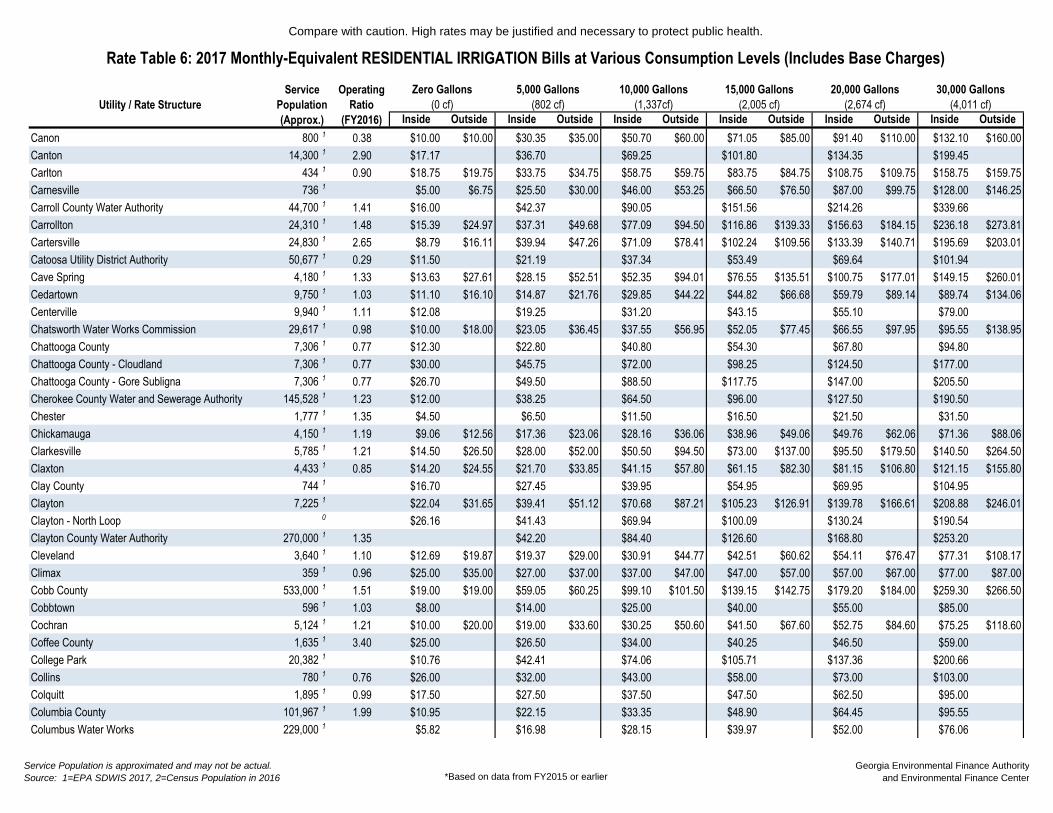
Compare with caution. High rates may be justified and necessary to protect public health.
Inside Outside Inside Outside Inside Outside Inside Outside Inside Outside Inside Outside
Rate Table 6: 2017 Monthly-Equivalent RESIDENTIAL IRRIGATION Bills at Various Consumption Levels (Includes Base Charges)
Utility / Rate Structure
Service
Population
(Approx.)
Zero Gallons
(0 cf)
5,000 Gallons
(802 cf)
10,000 Gallons
(1,337cf)
15,000 Gallons
(2,005 cf)
20,000 Gallons
(2,674 cf)
30,000 Gallons
(4,011 cf)
Operating
Ratio
(FY2016)
Canon 800 1 0.38 $10.00 $10.00 $30.35 $35.00 $50.70 $60.00 $71.05 $85.00 $91.40 $110.00 $132.10 $160.00
Canton 14,300 1 2.90 $17.17 $36.70 $69.25 $101.80 $134.35 $199.45
Carlton 434 1 0.90 $18.75 $19.75 $33.75 $34.75 $58.75 $59.75 $83.75 $84.75 $108.75 $109.75 $158.75 $159.75
Carnesville 736 1 $5.00 $6.75 $25.50 $30.00 $46.00 $53.25 $66.50 $76.50 $87.00 $99.75 $128.00 $146.25
Carroll County Water Authority 44,700 1 1.41 $16.00 $42.37 $90.05 $151.56 $214.26 $339.66
Carrollton 24,310 1 1.48 $15.39 $24.97 $37.31 $49.68 $77.09 $94.50 $116.86 $139.33 $156.63 $184.15 $236.18 $273.81
Cartersville 24,830 1 2.65 $8.79 $16.11 $39.94 $47.26 $71.09 $78.41 $102.24 $109.56 $133.39 $140.71 $195.69 $203.01
Catoosa Utility District Authority 50,677 1 0.29 $11.50 $21.19 $37.34 $53.49 $69.64 $101.94
Cave Spring 4,180 1 1.33 $13.63 $27.61 $28.15 $52.51 $52.35 $94.01 $76.55 $135.51 $100.75 $177.01 $149.15 $260.01
Cedartown 9,750 1 1.03 $11.10 $16.10 $14.87 $21.76 $29.85 $44.22 $44.82 $66.68 $59.79 $89.14 $89.74 $134.06
Centerville 9,940 1 1.11 $12.08 $19.25 $31.20 $43.15 $55.10 $79.00
Chatsworth Water Works Commission 29,617 1 0.98 $10.00 $18.00 $23.05 $36.45 $37.55 $56.95 $52.05 $77.45 $66.55 $97.95 $95.55 $138.95
Chattooga County 7,306 1 0.77 $12.30 $22.80 $40.80 $54.30 $67.80 $94.80
Chattooga County - Cloudland 7,306 1 0.77 $30.00 $45.75 $72.00 $98.25 $124.50 $177.00
Chattooga County - Gore Subligna 7,306 1 0.77 $26.70 $49.50 $88.50 $117.75 $147.00 $205.50
Cherokee County Water and Sewerage Authority 145,528 1 1.23 $12.00 $38.25 $64.50 $96.00 $127.50 $190.50
Chester 1,777 1 1.35 $4.50 $6.50 $11.50 $16.50 $21.50 $31.50
Chickamauga 4,150 1 1.19 $9.06 $12.56 $17.36 $23.06 $28.16 $36.06 $38.96 $49.06 $49.76 $62.06 $71.36 $88.06
Clarkesville 5,785 1 1.21 $14.50 $26.50 $28.00 $52.00 $50.50 $94.50 $73.00 $137.00 $95.50 $179.50 $140.50 $264.50
Claxton 4,433 1 0.85 $14.20 $24.55 $21.70 $33.85 $41.15 $57.80 $61.15 $82.30 $81.15 $106.80 $121.15 $155.80
Clay County 744 1 $16.70 $27.45 $39.95 $54.95 $69.95 $104.95
Clayton 7,225 1 $22.04 $31.65 $39.41 $51.12 $70.68 $87.21 $105.23 $126.91 $139.78 $166.61 $208.88 $246.01
Clayton - North Loop 0 $26.16 $41.43 $69.94 $100.09 $130.24 $190.54
Clayton County Water Authority 270,000 1 1.35 $42.20 $84.40 $126.60 $168.80 $253.20
Cleveland 3,640 1 1.10 $12.69 $19.87 $19.37 $29.00 $30.91 $44.77 $42.51 $60.62 $54.11 $76.47 $77.31 $108.17
Climax 359 1 0.96 $25.00 $35.00 $27.00 $37.00 $37.00 $47.00 $47.00 $57.00 $57.00 $67.00 $77.00 $87.00
Cobb County 533,000 1 1.51 $19.00 $19.00 $59.05 $60.25 $99.10 $101.50 $139.15 $142.75 $179.20 $184.00 $259.30 $266.50
Cobbtown 596 1 1.03 $8.00 $14.00 $25.00 $40.00 $55.00 $85.00
Cochran 5,124 1 1.21 $10.00 $20.00 $19.00 $33.60 $30.25 $50.60 $41.50 $67.60 $52.75 $84.60 $75.25 $118.60
Coffee County 1,635 1 3.40 $25.00 $26.50 $34.00 $40.25 $46.50 $59.00
College Park 20,382 1 $10.76 $42.41 $74.06 $105.71 $137.36 $200.66
Collins 780 1 0.76 $26.00 $32.00 $43.00 $58.00 $73.00 $103.00
Colquitt 1,895 1 0.99 $17.50 $27.50 $37.50 $47.50 $62.50 $95.00
Columbia County 101,967 1 1.99 $10.95 $22.15 $33.35 $48.90 $64.45 $95.55
Columbus Water Works 229,000 1 $5.82 $16.98 $28.15 $39.97 $52.00 $76.06
Service Population is approximated and may not be actual.
Source: 1=EPA SDWIS 2017, 2=Census Population in 2016 *Based on data from FY2015 or earlierGeorgia Environmental Finance Authority
and Environmental Finance Center

Compare with caution. High rates may be justified and necessary to protect public health.
Inside Outside Inside Outside Inside Outside Inside Outside Inside Outside Inside Outside
Rate Table 6: 2017 Monthly-Equivalent RESIDENTIAL IRRIGATION Bills at Various Consumption Levels (Includes Base Charges)
Utility / Rate Structure
Service
Population
(Approx.)
Zero Gallons
(0 cf)
5,000 Gallons
(802 cf)
10,000 Gallons
(1,337cf)
15,000 Gallons
(2,005 cf)
20,000 Gallons
(2,674 cf)
30,000 Gallons
(4,011 cf)
Operating
Ratio
(FY2016)
Comer 1,380 1 0.96 $11.00 $24.75 $26.75 $60.19 $49.25 $110.81 $71.75 $161.44 $94.25 $212.06 $139.25 $313.31
Commerce 6,819 1 1.01 $4.00 $7.00 $31.05 $45.05 $58.10 $83.10 $85.15 $121.15 $112.20 $159.20 $166.30 $235.30
Concord 741 1 0.80 $17.00 $19.00 $28.55 $30.55 $47.80 $49.80 $67.05 $69.05 $86.30 $88.30 $124.80 $126.80
Consolidated Utilities, Inc. 0 $16.00 $34.00 $65.00 $101.00 $137.00 $209.00
Consolidated Utilities, Inc. - Coastal Water &
Sewerage, LLC - 21 Centre 0 $22.50 $22.50 $22.50 $22.50 $22.50 $22.50
Consolidated Utilities, Inc. - Coastal Water &
Sewerage, LLC - Cypress Lakes 0 $36.00 $36.00 $36.00 $36.00 $36.00 $36.00
Consolidated Utilities, Inc. - Coastal Water &
Sewerage, LLC - Little Neck Plantation 0 $12.00 $18.70 $25.40 $30.76 $30.76 $30.76
Consolidated Utilities, Inc. - Coastal Water &
Sewerage, LLC - Rebel Estates 0 $40.00 $40.00 $40.00 $40.00 $40.00 $40.00
Consolidated Utilities, Inc. - Coastal Water &
Sewerage, LLC - Ridgecrest, Park of Commerce,
Millcreek
0 $15.75 $35.75 $63.75 $91.75 $119.75 $175.75
Consolidated Utilities, Inc. - Coastal Water &
Sewerage, LLC - Sandy Woods, South Pointe,
Southern Hills, White Bluff, Mingledorff, Cottonvale
0 $34.00 $34.00 $46.50 $59.00 $71.50 $96.50
Consolidated Utilities, Inc. - Coastal Water Company 0 $15.75 $35.75 $63.75 $91.75 $119.75 $175.75
Consolidated Utilities, Inc. - Coastal Water Company -
Rate 2 0 $15.75 $41.75 $81.75 $121.75 $161.75 $241.75
Consolidated Utilities, Inc. - Golden Isles 0 $34.00 $34.00 $46.50 $59.00 $71.50 $96.50
Consolidated Utilities, Inc. - Whitemarsh Estates 0 $34.00 $34.00 $46.50 $59.00 $71.50 $96.50
Consolidated Utilities, Inc. - Woodlawn 0 $34.00 $34.00 $46.50 $59.00 $71.50 $96.50
Coolidge 692 1 0.49 $10.00 $12.50 $22.50 $28.00 $35.00 $43.50 $47.50 $59.00 $60.00 $74.50 $85.00 $105.50
Coosa Water Authority 3,944 1 1.06 $25.00 $40.00 $73.00 $123.00 $173.00 $273.00
Cordele 10,691 1 1.24 $8.92 $14.21 $23.22 $35.31 $37.52 $56.41 $51.82 $77.51 $66.12 $98.61 $94.72 $140.81
Cornelia 6,130 1 1.36 $15.89 $24.36 $27.92 $36.99 $47.97 $58.04 $70.07 $81.19 $92.17 $104.34 $142.87 $155.34
Covington 20,379 1 0.98 $16.60 $27.50 $54.75 $82.00 $109.25 $163.75
Coweta County Water and Sewer Authority 59,800 1 1.45 $14.00 $39.95 $76.55 $113.15 $155.85 $241.25
Crawford 1,170 1 0.76 $20.00 $36.00 $35.00 $54.00 $60.00 $84.00 $91.25 $120.25 $122.50 $156.50 $185.00 $229.00
Crawford County 1,625 1 0.79 $29.00 $44.00 $62.75 $81.50 $100.25 $137.75
Crawfordville 582 1 $17.75 $26.63 $32.10 $48.16 $54.60 $81.91 $82.10 $123.16 $109.60 $164.41 $164.60 $246.91
Cumming 47,541 1 1.15 $8.22 $10.72 $18.07 $22.32 $31.92 $38.52 $46.77 $55.87 $67.57 $79.17 $114.77 $131.37
Cusseta-Chattahoochee County 3,300 1 $21.00 $34.80 $57.80 $80.80 $103.80 $149.80
Cuthbert 2,613 1 $8.00 $12.00 $12.95 $16.95 $22.20 $26.20 $31.45 $35.45 $40.70 $44.70 $59.20 $63.20
Dade County Water and Sewer Authority 36,400 1 1.12 $13.45 $27.25 $50.25 $73.25 $96.25 $142.25
Service Population is approximated and may not be actual.
Source: 1=EPA SDWIS 2017, 2=Census Population in 2016 *Based on data from FY2015 or earlierGeorgia Environmental Finance Authority
and Environmental Finance Center
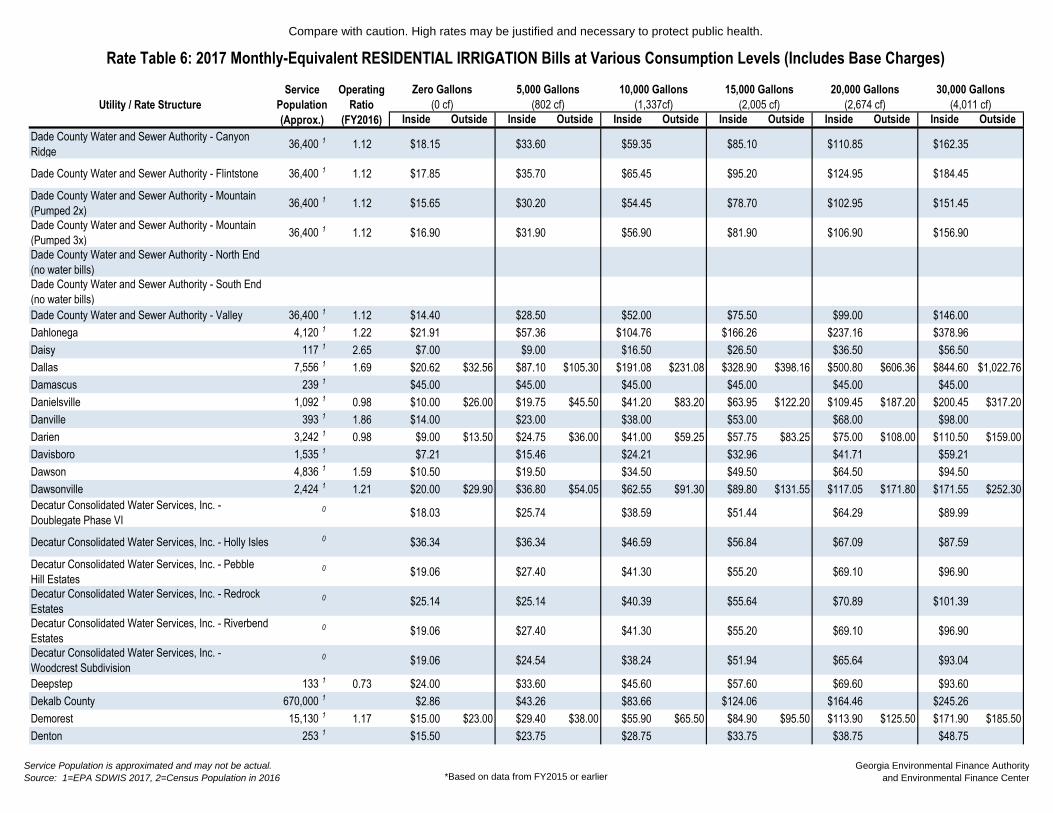
Compare with caution. High rates may be justified and necessary to protect public health.
Inside Outside Inside Outside Inside Outside Inside Outside Inside Outside Inside Outside
Rate Table 6: 2017 Monthly-Equivalent RESIDENTIAL IRRIGATION Bills at Various Consumption Levels (Includes Base Charges)
Utility / Rate Structure
Service
Population
(Approx.)
Zero Gallons
(0 cf)
5,000 Gallons
(802 cf)
10,000 Gallons
(1,337cf)
15,000 Gallons
(2,005 cf)
20,000 Gallons
(2,674 cf)
30,000 Gallons
(4,011 cf)
Operating
Ratio
(FY2016)
Dade County Water and Sewer Authority - Canyon
Ridge 36,400 1 1.12 $18.15 $33.60 $59.35 $85.10 $110.85 $162.35
Dade County Water and Sewer Authority - Flintstone 36,400 1 1.12 $17.85 $35.70 $65.45 $95.20 $124.95 $184.45
Dade County Water and Sewer Authority - Mountain
(Pumped 2x) 36,400 1 1.12 $15.65 $30.20 $54.45 $78.70 $102.95 $151.45
Dade County Water and Sewer Authority - Mountain
(Pumped 3x) 36,400 1 1.12 $16.90 $31.90 $56.90 $81.90 $106.90 $156.90
Dade County Water and Sewer Authority - North End
(no water bills)
Dade County Water and Sewer Authority - South End
(no water bills)
Dade County Water and Sewer Authority - Valley 36,400 1 1.12 $14.40 $28.50 $52.00 $75.50 $99.00 $146.00
Dahlonega 4,120 1 1.22 $21.91 $57.36 $104.76 $166.26 $237.16 $378.96
Daisy 117 1 2.65 $7.00 $9.00 $16.50 $26.50 $36.50 $56.50
Dallas 7,556 1 1.69 $20.62 $32.56 $87.10 $105.30 $191.08 $231.08 $328.90 $398.16 $500.80 $606.36 $844.60 $1,022.76
Damascus 239 1 $45.00 $45.00 $45.00 $45.00 $45.00 $45.00
Danielsville 1,092 1 0.98 $10.00 $26.00 $19.75 $45.50 $41.20 $83.20 $63.95 $122.20 $109.45 $187.20 $200.45 $317.20
Danville 393 1 1.86 $14.00 $23.00 $38.00 $53.00 $68.00 $98.00
Darien 3,242 1 0.98 $9.00 $13.50 $24.75 $36.00 $41.00 $59.25 $57.75 $83.25 $75.00 $108.00 $110.50 $159.00
Davisboro 1,535 1 $7.21 $15.46 $24.21 $32.96 $41.71 $59.21
Dawson 4,836 1 1.59 $10.50 $19.50 $34.50 $49.50 $64.50 $94.50
Dawsonville 2,424 1 1.21 $20.00 $29.90 $36.80 $54.05 $62.55 $91.30 $89.80 $131.55 $117.05 $171.80 $171.55 $252.30
Decatur Consolidated Water Services, Inc. -
Doublegate Phase VI 0 $18.03 $25.74 $38.59 $51.44 $64.29 $89.99
Decatur Consolidated Water Services, Inc. - Holly Isles 0 $36.34 $36.34 $46.59 $56.84 $67.09 $87.59
Decatur Consolidated Water Services, Inc. - Pebble
Hill Estates 0 $19.06 $27.40 $41.30 $55.20 $69.10 $96.90
Decatur Consolidated Water Services, Inc. - Redrock
Estates 0 $25.14 $25.14 $40.39 $55.64 $70.89 $101.39
Decatur Consolidated Water Services, Inc. - Riverbend
Estates 0 $19.06 $27.40 $41.30 $55.20 $69.10 $96.90
Decatur Consolidated Water Services, Inc. -
Woodcrest Subdivision 0 $19.06 $24.54 $38.24 $51.94 $65.64 $93.04
Deepstep 133 1 0.73 $24.00 $33.60 $45.60 $57.60 $69.60 $93.60
Dekalb County 670,000 1 $2.86 $43.26 $83.66 $124.06 $164.46 $245.26
Demorest 15,130 1 1.17 $15.00 $23.00 $29.40 $38.00 $55.90 $65.50 $84.90 $95.50 $113.90 $125.50 $171.90 $185.50
Denton 253 1 $15.50 $23.75 $28.75 $33.75 $38.75 $48.75
Service Population is approximated and may not be actual.
Source: 1=EPA SDWIS 2017, 2=Census Population in 2016 *Based on data from FY2015 or earlierGeorgia Environmental Finance Authority
and Environmental Finance Center

Compare with caution. High rates may be justified and necessary to protect public health.
Inside Outside Inside Outside Inside Outside Inside Outside Inside Outside Inside Outside
Rate Table 6: 2017 Monthly-Equivalent RESIDENTIAL IRRIGATION Bills at Various Consumption Levels (Includes Base Charges)
Utility / Rate Structure
Service
Population
(Approx.)
Zero Gallons
(0 cf)
5,000 Gallons
(802 cf)
10,000 Gallons
(1,337cf)
15,000 Gallons
(2,005 cf)
20,000 Gallons
(2,674 cf)
30,000 Gallons
(4,011 cf)
Operating
Ratio
(FY2016)
Dexter 1,976 1 0.99 $14.50 $17.00 $22.30 $24.80 $35.80 $38.30 $49.30 $51.80 $63.05 $65.55 $90.80 $93.30
Dillard 133 1 0.67 $20.00 $42.00 $69.50 $97.00 $124.50 $179.50
Doerun 967 1 1.03 $7.00 $23.10 $40.60 $59.35 $78.10 $118.10
Donalsonville 2,782 1 1.12 $8.32 $21.82 $36.12 $50.92 $66.52 $100.87
Dooling 99,315 1 1.11 $25.00 $42.40 $64.15 $85.90 $107.65 $151.15
Douglas 10,688 1 1.24 $9.59 $28.64 $47.69 $65.19 $82.69 $116.79
Douglasville-Douglas County Water and Sewer
Authority 109,694 1 1.14 $10.92 $34.42 $70.86 $117.86 $164.86 $258.86
Du Pont 120 1 0.90 $20.00 $20.00 $20.00 $20.00 $20.00 $20.00
Dublin 17,500 1 1.09 $9.50 $15.20 $20.90 $38.00 $39.90 $76.00 $58.90 $114.00 $77.90 $152.00 $115.90 $228.00
Dudley 546 1 1.46 $25.89 $31.17 $39.97 $48.77 $57.57 $75.17
East Dublin 2,657 1 0.65 $9.00 $17.75 $17.15 $31.06 $31.20 $54.01 $45.25 $76.96 $59.30 $99.91 $87.40 $145.81
East Point 33,712 1 $24.25 $32.07 $54.56 $79.01 $113.21 $181.61
Eastman 7,491 1 0.87 $12.05 $19.55 $15.80 $24.50 $22.05 $32.75 $28.30 $41.00 $34.55 $49.25 $47.05 $65.75
Eatonton-Putnam Water and Sewer Authority 12,272 1 1.19 $25.75 $31.75 $44.18 $50.18 $72.33 $78.33 $103.03 $109.03 $133.73 $139.73 $200.23 $206.23
Echols County Water Authority 824 1 $15.00 $18.00 $33.00 $48.00 $63.00 $93.00
Edison 1,331 1 0.87 $13.50 $19.50 $29.50 $39.50 $49.50 $69.50
Effingham County 7,700 1 0.99 $10.00 $22.20 $35.50 $49.90 $64.30 $93.10
Elberton 7,800 1 1.20 $7.72 $11.03 $21.42 $31.28 $35.13 $51.54 $48.83 $71.79 $62.53 $92.05 $89.94 $132.55
Ellaville 2,779 1 1.22 $9.20 $11.00 $19.60 $26.61 $30.60 $43.11 $42.60 $61.11 $54.60 $79.11 $79.60 $116.61
Ellenton 374 1 0.38 $24.00 $30.00 $45.00 $80.00 $115.00 $195.00
Ellijay-Gilmer County Water and Sewer Authority 13,010 1 1.15 $12.60 $27.95 $45.10 $62.80 $80.50 $115.90
Emerson 1,394 1 0.72 $14.40 $20.15 $28.80 $40.30 $45.85 $64.15 $62.90 $88.00 $97.00 $135.70
Enigma 1,113 1 $12.00 $15.00 $25.00 $35.00 $45.00 $65.00
Ephesus 1,352 1 $10.00 $22.00 $42.00 $62.00 $82.00 $122.00
Etowah Water and Sewer Authority 13,843 1 1.23 $25.50 $73.10 $120.70 $168.30 $225.40 $339.60
Fairburn 13,693 1 1.35 $8.32 $12.48 $50.05 $62.35 $100.64 $125.50 $155.64 $195.25 $210.64 $265.00 $320.64 $404.50
Fairmount 130 1 1.01 $23.50 $47.50 $82.50 $117.50 $152.50 $222.50
Fargo 380 1 0.87 $15.00 $17.50 $23.75 $30.00 $36.25 $48.75
Fayette County 74,163 1 1.10 $18.48 $28.17 $44.32 $60.47 $76.62 $120.52
Fayetteville 15,281 1 $16.30 $26.08 $42.38 $62.78 $83.18 $148.28
Fitzgerald Water Light and Bond Commission 12,935 1 1.05 $5.00 $7.00 $11.00 $15.50 $17.00 $24.00 $23.00 $32.50 $29.00 $41.00 $41.00 $58.00
Flovilla 1,438 1 0.91 $11.00 $14.00 $34.00 $37.00 $62.75 $65.75 $91.50 $94.50 $120.25 $123.25 $177.75 $180.75
Flowery Branch 2,920 1 1.40 $6.20 $8.26 $31.80 $42.35 $74.48 $99.17 $121.03 $161.17 $167.58 $223.17 $260.68 $347.17
Floyd County 41,738 1 1.96 $14.85 $26.10 $44.85 $63.60 $82.35 $119.85
Folkston 5,940 1 1.14 $15.44 $19.05 $20.90 $25.77 $34.55 $42.57 $48.20 $59.37 $61.85 $76.17 $89.15 $109.77
Service Population is approximated and may not be actual.
Source: 1=EPA SDWIS 2017, 2=Census Population in 2016 *Based on data from FY2015 or earlierGeorgia Environmental Finance Authority
and Environmental Finance Center

Compare with caution. High rates may be justified and necessary to protect public health.
Inside Outside Inside Outside Inside Outside Inside Outside Inside Outside Inside Outside
Rate Table 6: 2017 Monthly-Equivalent RESIDENTIAL IRRIGATION Bills at Various Consumption Levels (Includes Base Charges)
Utility / Rate Structure
Service
Population
(Approx.)
Zero Gallons
(0 cf)
5,000 Gallons
(802 cf)
10,000 Gallons
(1,337cf)
15,000 Gallons
(2,005 cf)
20,000 Gallons
(2,674 cf)
30,000 Gallons
(4,011 cf)
Operating
Ratio
(FY2016)
Forest Heights Water Works, Inc. 0 $44.00 $44.00 $52.00 $63.50 $77.00 $107.00
Forsyth 7,400 1 1.14 $15.54 $23.01 $30.12 $43.47 $50.07 $72.47 $67.27 $98.62 $84.47 $124.77 $118.87 $177.07
Forsyth County 138,368 1 1.52 $12.00 $39.20 $77.72 $124.18 $175.18 $289.60
Fort Gaines 1,422 1 1.29 $14.00 $22.75 $31.50 $40.25 $49.00 $66.50
Fort Oglethorpe 9,446 1 1.25 $17.49 $31.35 $54.45 $77.55 $100.65 $146.85
Fort Valley Utility Commission 17,645 1 0.85 $12.30 $30.28 $53.30 $77.70 $102.09 $150.89
Franklin County 2,764 1 0.96 $21.00 $33.75 $55.40 $77.15 $98.90 $142.40
Franklin Springs 997 1 0.95 $7.00 $29.50 $52.00 $74.50 $97.00 $142.00
Fulton County 172,533 1 1.76 $3.63 $34.13 $64.63 $95.13 $125.63 $186.63
Funston 551 1 1.61 $8.25 $15.75 $28.25 $40.75 $53.25 $78.25
Gainesville 117,962 1 1.65 $33.82 $67.65 $67.65 $135.29 $101.47 $202.94 $135.29 $270.59 $202.94 $405.88
Garden City 8,166 1 1.11 $15.69 $17.87 $23.16 $29.09 $32.71 $43.44 $44.91 $61.74 $59.86 $84.19 $95.16 $137.19
Garfield 390 1 $14.50 $21.50 $39.00 $56.50 $74.00 $109.00
Gay 179 1 0.63 $16.50 $27.00 $44.50 $62.00 $79.50 $114.50
Georgetown-Quitman County Water, Sewer and Solid
Waste Authority 985 1 0.88 $17.50 $22.50 $28.75 $33.75 $47.50 $52.50 $66.25 $71.25 $85.00 $90.00 $122.50 $127.50
Gibson 720 1 0.89 $18.00 $20.00 $22.00 $24.00 $32.00 $34.00 $42.00 $44.00 $52.00 $54.00 $72.00 $74.00
Glennville 4,711 1 1.00 $15.00 $20.25 $31.50 $45.25 $59.00 $86.50
Glenwood 1,012 1 0.62 $16.00 $22.00 $32.00 $42.00 $52.00 $72.00
Gordon 2,340 1 0.62 $8.19 $15.75 $28.35 $40.95 $53.55 $78.75
Graham 261 2 $15.50 $21.50 $31.50 $41.50 $51.50 $71.50
Grantville 1,508 1 $15.50 $29.00 $61.50 $94.00 $126.50 $191.50
Greensboro 3,156 1 1.67 $25.40 $28.96 $42.34 $48.26 $84.69 $96.51 $127.04 $144.76 $169.39 $193.01 $254.09 $289.51
Greenville 1,880 1 0.68 $15.00 $18.50 $43.50 $51.10 $72.00 $83.70 $100.50 $116.30 $129.00 $148.90 $186.00 $214.10
Griffin 23,643 1 1.03 $14.08 $42.70 $90.40 $138.10 $185.80 $281.20
Griffin - Spalding County 0 $13.71 $50.56 $92.93 $143.43 $193.93 $294.93
Grovetown 11,216 1 $15.75 $24.30 $26.25 $40.50 $52.50 $81.00 $79.00 $121.75 $105.50 $162.50 $159.00 $244.50
Guyton 2,394 1 2.31 $21.62 $33.11 $54.71 $76.31 $97.91 $158.71
Gwinnett County 795,657 1 1.56 $7.50 $56.70 $105.90 $155.10 $204.30 $302.70
Hahira 2,846 1 0.86 $15.39 $22.82 $22.81 $30.24 $41.36 $48.79 $59.91 $67.34 $78.46 $85.89 $115.56 $122.99
Hall County (no water bills)
Hamilton 928 1 1.52 $12.00 $27.00 $47.00 $72.00 $97.00 $147.00
Hampton 7,305 1 1.11 $9.25 $34.11 $66.04 $115.39 $164.73 $263.42
Hancock County 900 1 0.35 $24.00 $35.25 $54.00 $72.75 $91.50 $129.00
Hapeville 5,385 1 1.39 $17.56 $43.90 $88.02 $142.92 $224.80 $400.40
Haralson County Water Authority 11,362 1 1.07 $15.00 $26.94 $49.52 $84.52 $119.52 $189.52
Service Population is approximated and may not be actual.
Source: 1=EPA SDWIS 2017, 2=Census Population in 2016 *Based on data from FY2015 or earlierGeorgia Environmental Finance Authority
and Environmental Finance Center
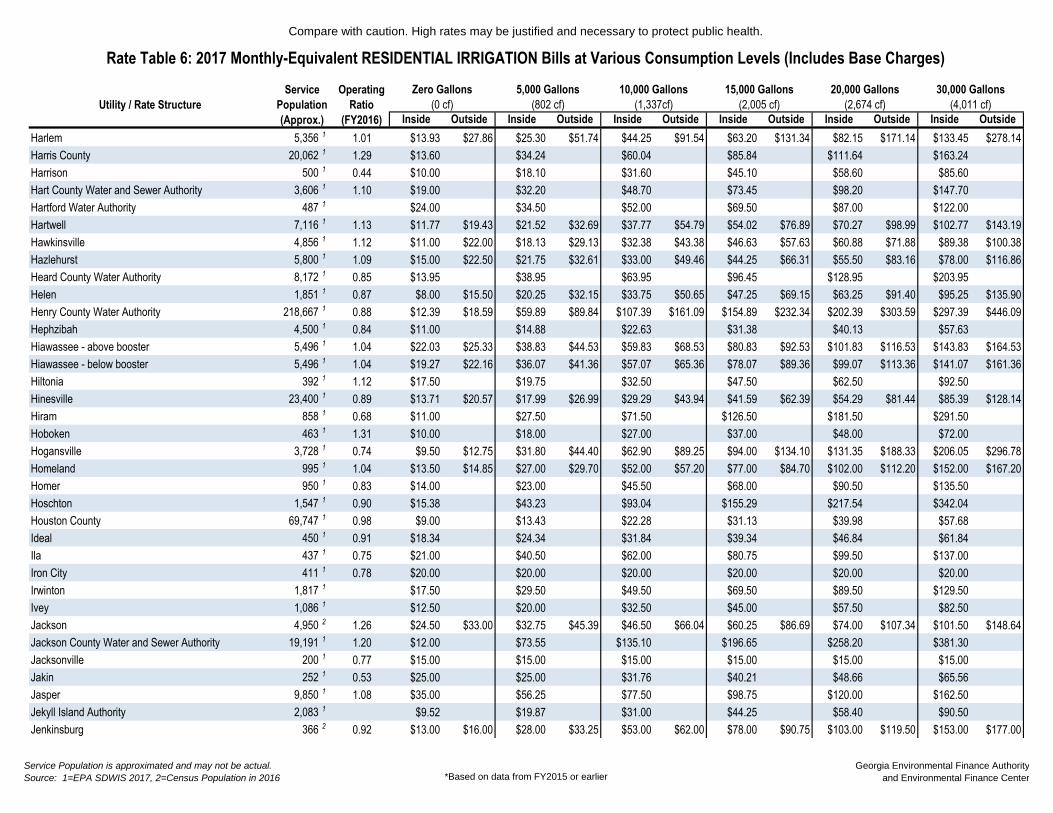
Compare with caution. High rates may be justified and necessary to protect public health.
Inside Outside Inside Outside Inside Outside Inside Outside Inside Outside Inside Outside
Rate Table 6: 2017 Monthly-Equivalent RESIDENTIAL IRRIGATION Bills at Various Consumption Levels (Includes Base Charges)
Utility / Rate Structure
Service
Population
(Approx.)
Zero Gallons
(0 cf)
5,000 Gallons
(802 cf)
10,000 Gallons
(1,337cf)
15,000 Gallons
(2,005 cf)
20,000 Gallons
(2,674 cf)
30,000 Gallons
(4,011 cf)
Operating
Ratio
(FY2016)
Harlem 5,356 1 1.01 $13.93 $27.86 $25.30 $51.74 $44.25 $91.54 $63.20 $131.34 $82.15 $171.14 $133.45 $278.14
Harris County 20,062 1 1.29 $13.60 $34.24 $60.04 $85.84 $111.64 $163.24
Harrison 500 1 0.44 $10.00 $18.10 $31.60 $45.10 $58.60 $85.60
Hart County Water and Sewer Authority 3,606 1 1.10 $19.00 $32.20 $48.70 $73.45 $98.20 $147.70
Hartford Water Authority 487 1 $24.00 $34.50 $52.00 $69.50 $87.00 $122.00
Hartwell 7,116 1 1.13 $11.77 $19.43 $21.52 $32.69 $37.77 $54.79 $54.02 $76.89 $70.27 $98.99 $102.77 $143.19
Hawkinsville 4,856 1 1.12 $11.00 $22.00 $18.13 $29.13 $32.38 $43.38 $46.63 $57.63 $60.88 $71.88 $89.38 $100.38
Hazlehurst 5,800 1 1.09 $15.00 $22.50 $21.75 $32.61 $33.00 $49.46 $44.25 $66.31 $55.50 $83.16 $78.00 $116.86
Heard County Water Authority 8,172 1 0.85 $13.95 $38.95 $63.95 $96.45 $128.95 $203.95
Helen 1,851 1 0.87 $8.00 $15.50 $20.25 $32.15 $33.75 $50.65 $47.25 $69.15 $63.25 $91.40 $95.25 $135.90
Henry County Water Authority 218,667 1 0.88 $12.39 $18.59 $59.89 $89.84 $107.39 $161.09 $154.89 $232.34 $202.39 $303.59 $297.39 $446.09
Hephzibah 4,500 1 0.84 $11.00 $14.88 $22.63 $31.38 $40.13 $57.63
Hiawassee - above booster 5,496 1 1.04 $22.03 $25.33 $38.83 $44.53 $59.83 $68.53 $80.83 $92.53 $101.83 $116.53 $143.83 $164.53
Hiawassee - below booster 5,496 1 1.04 $19.27 $22.16 $36.07 $41.36 $57.07 $65.36 $78.07 $89.36 $99.07 $113.36 $141.07 $161.36
Hiltonia 392 1 1.12 $17.50 $19.75 $32.50 $47.50 $62.50 $92.50
Hinesville 23,400 1 0.89 $13.71 $20.57 $17.99 $26.99 $29.29 $43.94 $41.59 $62.39 $54.29 $81.44 $85.39 $128.14
Hiram 858 1 0.68 $11.00 $27.50 $71.50 $126.50 $181.50 $291.50
Hoboken 463 1 1.31 $10.00 $18.00 $27.00 $37.00 $48.00 $72.00
Hogansville 3,728 1 0.74 $9.50 $12.75 $31.80 $44.40 $62.90 $89.25 $94.00 $134.10 $131.35 $188.33 $206.05 $296.78
Homeland 995 1 1.04 $13.50 $14.85 $27.00 $29.70 $52.00 $57.20 $77.00 $84.70 $102.00 $112.20 $152.00 $167.20
Homer 950 1 0.83 $14.00 $23.00 $45.50 $68.00 $90.50 $135.50
Hoschton 1,547 1 0.90 $15.38 $43.23 $93.04 $155.29 $217.54 $342.04
Houston County 69,747 1 0.98 $9.00 $13.43 $22.28 $31.13 $39.98 $57.68
Ideal 450 1 0.91 $18.34 $24.34 $31.84 $39.34 $46.84 $61.84
Ila 437 1 0.75 $21.00 $40.50 $62.00 $80.75 $99.50 $137.00
Iron City 411 1 0.78 $20.00 $20.00 $20.00 $20.00 $20.00 $20.00
Irwinton 1,817 1 $17.50 $29.50 $49.50 $69.50 $89.50 $129.50
Ivey 1,086 1 $12.50 $20.00 $32.50 $45.00 $57.50 $82.50
Jackson 4,950 2 1.26 $24.50 $33.00 $32.75 $45.39 $46.50 $66.04 $60.25 $86.69 $74.00 $107.34 $101.50 $148.64
Jackson County Water and Sewer Authority 19,191 1 1.20 $12.00 $73.55 $135.10 $196.65 $258.20 $381.30
Jacksonville 200 1 0.77 $15.00 $15.00 $15.00 $15.00 $15.00 $15.00
Jakin 252 1 0.53 $25.00 $25.00 $31.76 $40.21 $48.66 $65.56
Jasper 9,850 1 1.08 $35.00 $56.25 $77.50 $98.75 $120.00 $162.50
Jekyll Island Authority 2,083 1 $9.52 $19.87 $31.00 $44.25 $58.40 $90.50
Jenkinsburg 366 2 0.92 $13.00 $16.00 $28.00 $33.25 $53.00 $62.00 $78.00 $90.75 $103.00 $119.50 $153.00 $177.00
Service Population is approximated and may not be actual.
Source: 1=EPA SDWIS 2017, 2=Census Population in 2016 *Based on data from FY2015 or earlierGeorgia Environmental Finance Authority
and Environmental Finance Center
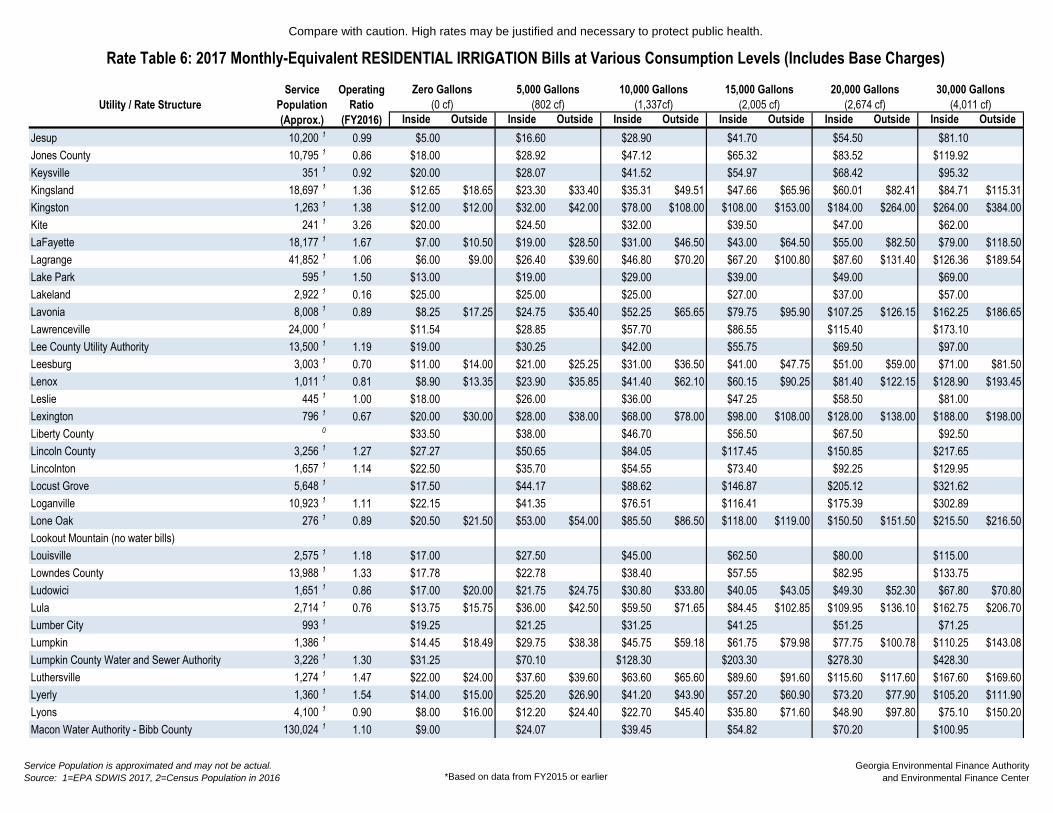
Compare with caution. High rates may be justified and necessary to protect public health.
Inside Outside Inside Outside Inside Outside Inside Outside Inside Outside Inside Outside
Rate Table 6: 2017 Monthly-Equivalent RESIDENTIAL IRRIGATION Bills at Various Consumption Levels (Includes Base Charges)
Utility / Rate Structure
Service
Population
(Approx.)
Zero Gallons
(0 cf)
5,000 Gallons
(802 cf)
10,000 Gallons
(1,337cf)
15,000 Gallons
(2,005 cf)
20,000 Gallons
(2,674 cf)
30,000 Gallons
(4,011 cf)
Operating
Ratio
(FY2016)
Jesup 10,200 1 0.99 $5.00 $16.60 $28.90 $41.70 $54.50 $81.10
Jones County 10,795 1 0.86 $18.00 $28.92 $47.12 $65.32 $83.52 $119.92
Keysville 351 1 0.92 $20.00 $28.07 $41.52 $54.97 $68.42 $95.32
Kingsland 18,697 1 1.36 $12.65 $18.65 $23.30 $33.40 $35.31 $49.51 $47.66 $65.96 $60.01 $82.41 $84.71 $115.31
Kingston 1,263 1 1.38 $12.00 $12.00 $32.00 $42.00 $78.00 $108.00 $108.00 $153.00 $184.00 $264.00 $264.00 $384.00
Kite 241 1 3.26 $20.00 $24.50 $32.00 $39.50 $47.00 $62.00
LaFayette 18,177 1 1.67 $7.00 $10.50 $19.00 $28.50 $31.00 $46.50 $43.00 $64.50 $55.00 $82.50 $79.00 $118.50
Lagrange 41,852 1 1.06 $6.00 $9.00 $26.40 $39.60 $46.80 $70.20 $67.20 $100.80 $87.60 $131.40 $126.36 $189.54
Lake Park 595 1 1.50 $13.00 $19.00 $29.00 $39.00 $49.00 $69.00
Lakeland 2,922 1 0.16 $25.00 $25.00 $25.00 $27.00 $37.00 $57.00
Lavonia 8,008 1 0.89 $8.25 $17.25 $24.75 $35.40 $52.25 $65.65 $79.75 $95.90 $107.25 $126.15 $162.25 $186.65
Lawrenceville 24,000 1 $11.54 $28.85 $57.70 $86.55 $115.40 $173.10
Lee County Utility Authority 13,500 1 1.19 $19.00 $30.25 $42.00 $55.75 $69.50 $97.00
Leesburg 3,003 1 0.70 $11.00 $14.00 $21.00 $25.25 $31.00 $36.50 $41.00 $47.75 $51.00 $59.00 $71.00 $81.50
Lenox 1,011 1 0.81 $8.90 $13.35 $23.90 $35.85 $41.40 $62.10 $60.15 $90.25 $81.40 $122.15 $128.90 $193.45
Leslie 445 1 1.00 $18.00 $26.00 $36.00 $47.25 $58.50 $81.00
Lexington 796 1 0.67 $20.00 $30.00 $28.00 $38.00 $68.00 $78.00 $98.00 $108.00 $128.00 $138.00 $188.00 $198.00
Liberty County 0 $33.50 $38.00 $46.70 $56.50 $67.50 $92.50
Lincoln County 3,256 1 1.27 $27.27 $50.65 $84.05 $117.45 $150.85 $217.65
Lincolnton 1,657 1 1.14 $22.50 $35.70 $54.55 $73.40 $92.25 $129.95
Locust Grove 5,648 1 $17.50 $44.17 $88.62 $146.87 $205.12 $321.62
Loganville 10,923 1 1.11 $22.15 $41.35 $76.51 $116.41 $175.39 $302.89
Lone Oak 276 1 0.89 $20.50 $21.50 $53.00 $54.00 $85.50 $86.50 $118.00 $119.00 $150.50 $151.50 $215.50 $216.50
Lookout Mountain (no water bills)
Louisville 2,575 1 1.18 $17.00 $27.50 $45.00 $62.50 $80.00 $115.00
Lowndes County 13,988 1 1.33 $17.78 $22.78 $38.40 $57.55 $82.95 $133.75
Ludowici 1,651 1 0.86 $17.00 $20.00 $21.75 $24.75 $30.80 $33.80 $40.05 $43.05 $49.30 $52.30 $67.80 $70.80
Lula 2,714 1 0.76 $13.75 $15.75 $36.00 $42.50 $59.50 $71.65 $84.45 $102.85 $109.95 $136.10 $162.75 $206.70
Lumber City 993 1 $19.25 $21.25 $31.25 $41.25 $51.25 $71.25
Lumpkin 1,386 1 $14.45 $18.49 $29.75 $38.38 $45.75 $59.18 $61.75 $79.98 $77.75 $100.78 $110.25 $143.08
Lumpkin County Water and Sewer Authority 3,226 1 1.30 $31.25 $70.10 $128.30 $203.30 $278.30 $428.30
Luthersville 1,274 1 1.47 $22.00 $24.00 $37.60 $39.60 $63.60 $65.60 $89.60 $91.60 $115.60 $117.60 $167.60 $169.60
Lyerly 1,360 1 1.54 $14.00 $15.00 $25.20 $26.90 $41.20 $43.90 $57.20 $60.90 $73.20 $77.90 $105.20 $111.90
Lyons 4,100 1 0.90 $8.00 $16.00 $12.20 $24.40 $22.70 $45.40 $35.80 $71.60 $48.90 $97.80 $75.10 $150.20
Macon Water Authority - Bibb County 130,024 1 1.10 $9.00 $24.07 $39.45 $54.82 $70.20 $100.95
Service Population is approximated and may not be actual.
Source: 1=EPA SDWIS 2017, 2=Census Population in 2016 *Based on data from FY2015 or earlierGeorgia Environmental Finance Authority
and Environmental Finance Center
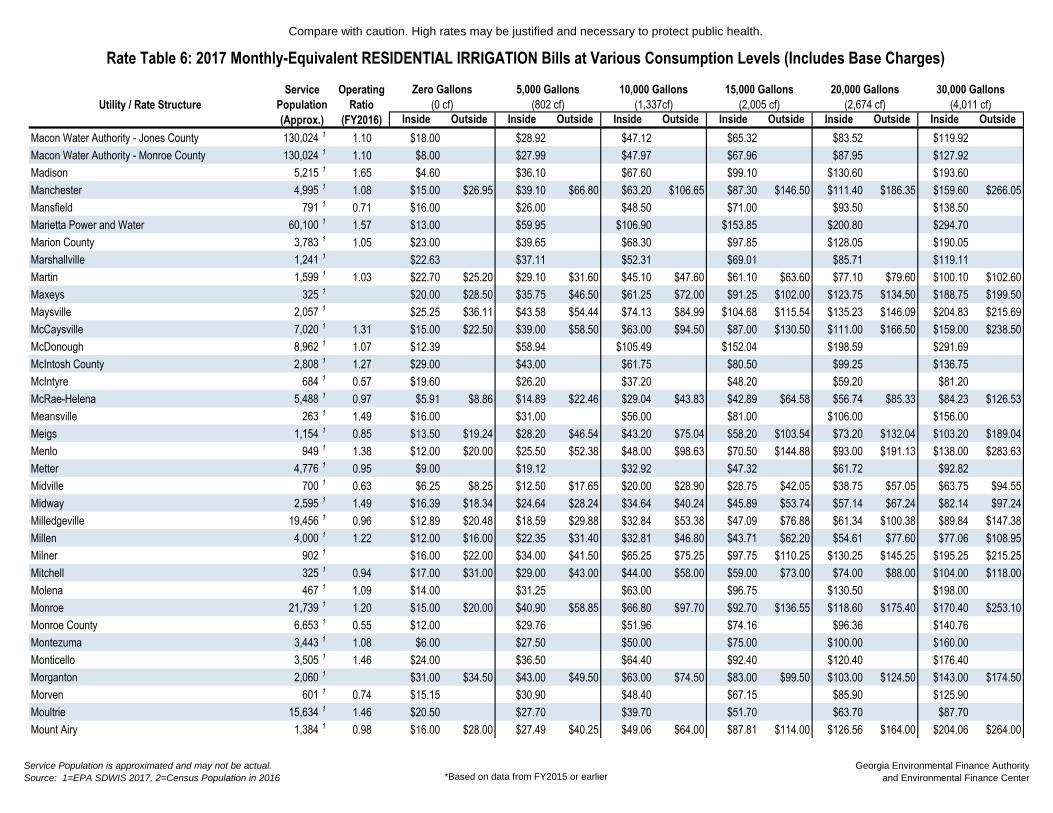
Compare with caution. High rates may be justified and necessary to protect public health.
Inside Outside Inside Outside Inside Outside Inside Outside Inside Outside Inside Outside
Rate Table 6: 2017 Monthly-Equivalent RESIDENTIAL IRRIGATION Bills at Various Consumption Levels (Includes Base Charges)
Utility / Rate Structure
Service
Population
(Approx.)
Zero Gallons
(0 cf)
5,000 Gallons
(802 cf)
10,000 Gallons
(1,337cf)
15,000 Gallons
(2,005 cf)
20,000 Gallons
(2,674 cf)
30,000 Gallons
(4,011 cf)
Operating
Ratio
(FY2016)
Macon Water Authority - Jones County 130,024 1 1.10 $18.00 $28.92 $47.12 $65.32 $83.52 $119.92
Macon Water Authority - Monroe County 130,024 1 1.10 $8.00 $27.99 $47.97 $67.96 $87.95 $127.92
Madison 5,215 1 1.65 $4.60 $36.10 $67.60 $99.10 $130.60 $193.60
Manchester 4,995 1 1.08 $15.00 $26.95 $39.10 $66.80 $63.20 $106.65 $87.30 $146.50 $111.40 $186.35 $159.60 $266.05
Mansfield 791 1 0.71 $16.00 $26.00 $48.50 $71.00 $93.50 $138.50
Marietta Power and Water 60,100 1 1.57 $13.00 $59.95 $106.90 $153.85 $200.80 $294.70
Marion County 3,783 1 1.05 $23.00 $39.65 $68.30 $97.85 $128.05 $190.05
Marshallville 1,241 1 $22.63 $37.11 $52.31 $69.01 $85.71 $119.11
Martin 1,599 1 1.03 $22.70 $25.20 $29.10 $31.60 $45.10 $47.60 $61.10 $63.60 $77.10 $79.60 $100.10 $102.60
Maxeys 325 1 $20.00 $28.50 $35.75 $46.50 $61.25 $72.00 $91.25 $102.00 $123.75 $134.50 $188.75 $199.50
Maysville 2,057 1 $25.25 $36.11 $43.58 $54.44 $74.13 $84.99 $104.68 $115.54 $135.23 $146.09 $204.83 $215.69
McCaysville 7,020 1 1.31 $15.00 $22.50 $39.00 $58.50 $63.00 $94.50 $87.00 $130.50 $111.00 $166.50 $159.00 $238.50
McDonough 8,962 1 1.07 $12.39 $58.94 $105.49 $152.04 $198.59 $291.69
McIntosh County 2,808 1 1.27 $29.00 $43.00 $61.75 $80.50 $99.25 $136.75
McIntyre 684 1 0.57 $19.60 $26.20 $37.20 $48.20 $59.20 $81.20
McRae-Helena 5,488 1 0.97 $5.91 $8.86 $14.89 $22.46 $29.04 $43.83 $42.89 $64.58 $56.74 $85.33 $84.23 $126.53
Meansville 263 1 1.49 $16.00 $31.00 $56.00 $81.00 $106.00 $156.00
Meigs 1,154 1 0.85 $13.50 $19.24 $28.20 $46.54 $43.20 $75.04 $58.20 $103.54 $73.20 $132.04 $103.20 $189.04
Menlo 949 1 1.38 $12.00 $20.00 $25.50 $52.38 $48.00 $98.63 $70.50 $144.88 $93.00 $191.13 $138.00 $283.63
Metter 4,776 1 0.95 $9.00 $19.12 $32.92 $47.32 $61.72 $92.82
Midville 700 1 0.63 $6.25 $8.25 $12.50 $17.65 $20.00 $28.90 $28.75 $42.05 $38.75 $57.05 $63.75 $94.55
Midway 2,595 1 1.49 $16.39 $18.34 $24.64 $28.24 $34.64 $40.24 $45.89 $53.74 $57.14 $67.24 $82.14 $97.24
Milledgeville 19,456 1 0.96 $12.89 $20.48 $18.59 $29.88 $32.84 $53.38 $47.09 $76.88 $61.34 $100.38 $89.84 $147.38
Millen 4,000 1 1.22 $12.00 $16.00 $22.35 $31.40 $32.81 $46.80 $43.71 $62.20 $54.61 $77.60 $77.06 $108.95
Milner 902 1 $16.00 $22.00 $34.00 $41.50 $65.25 $75.25 $97.75 $110.25 $130.25 $145.25 $195.25 $215.25
Mitchell 325 1 0.94 $17.00 $31.00 $29.00 $43.00 $44.00 $58.00 $59.00 $73.00 $74.00 $88.00 $104.00 $118.00
Molena 467 1 1.09 $14.00 $31.25 $63.00 $96.75 $130.50 $198.00
Monroe 21,739 1 1.20 $15.00 $20.00 $40.90 $58.85 $66.80 $97.70 $92.70 $136.55 $118.60 $175.40 $170.40 $253.10
Monroe County 6,653 1 0.55 $12.00 $29.76 $51.96 $74.16 $96.36 $140.76
Montezuma 3,443 1 1.08 $6.00 $27.50 $50.00 $75.00 $100.00 $160.00
Monticello 3,505 1 1.46 $24.00 $36.50 $64.40 $92.40 $120.40 $176.40
Morganton 2,060 1 $31.00 $34.50 $43.00 $49.50 $63.00 $74.50 $83.00 $99.50 $103.00 $124.50 $143.00 $174.50
Morven 601 1 0.74 $15.15 $30.90 $48.40 $67.15 $85.90 $125.90
Moultrie 15,634 1 1.46 $20.50 $27.70 $39.70 $51.70 $63.70 $87.70
Mount Airy 1,384 1 0.98 $16.00 $28.00 $27.49 $40.25 $49.06 $64.00 $87.81 $114.00 $126.56 $164.00 $204.06 $264.00
Service Population is approximated and may not be actual.
Source: 1=EPA SDWIS 2017, 2=Census Population in 2016 *Based on data from FY2015 or earlierGeorgia Environmental Finance Authority
and Environmental Finance Center
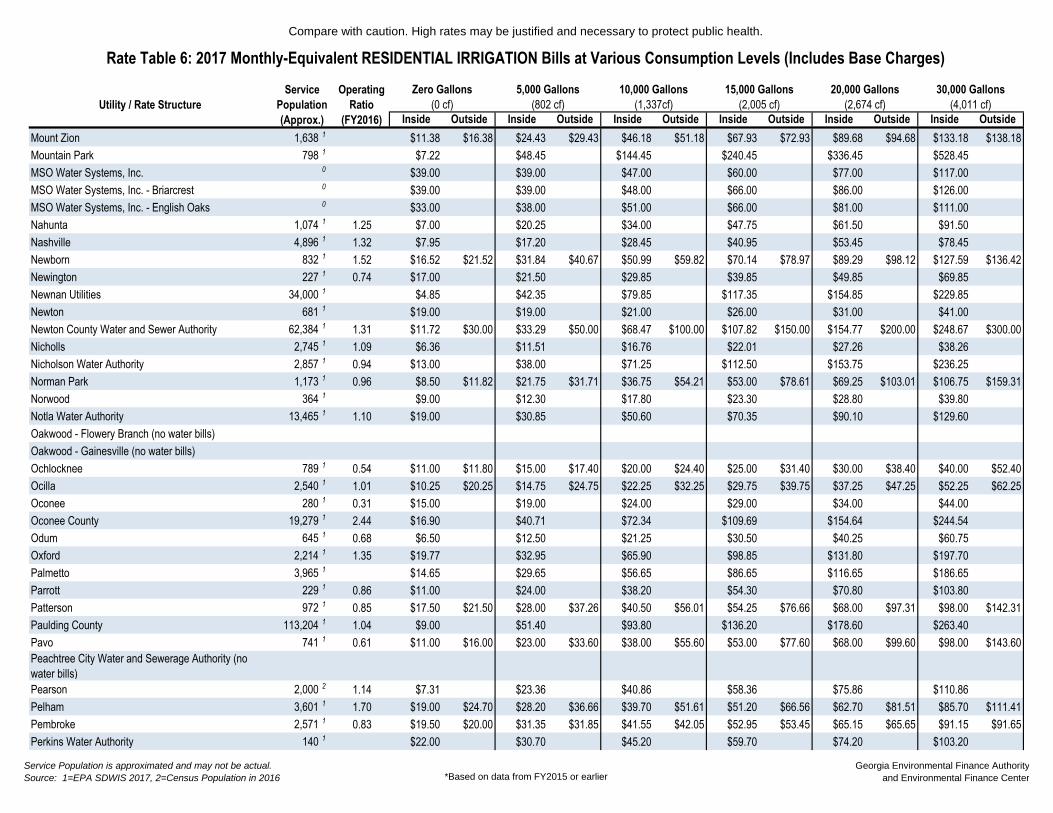
Compare with caution. High rates may be justified and necessary to protect public health.
Inside Outside Inside Outside Inside Outside Inside Outside Inside Outside Inside Outside
Rate Table 6: 2017 Monthly-Equivalent RESIDENTIAL IRRIGATION Bills at Various Consumption Levels (Includes Base Charges)
Utility / Rate Structure
Service
Population
(Approx.)
Zero Gallons
(0 cf)
5,000 Gallons
(802 cf)
10,000 Gallons
(1,337cf)
15,000 Gallons
(2,005 cf)
20,000 Gallons
(2,674 cf)
30,000 Gallons
(4,011 cf)
Operating
Ratio
(FY2016)
Mount Zion 1,638 1 $11.38 $16.38 $24.43 $29.43 $46.18 $51.18 $67.93 $72.93 $89.68 $94.68 $133.18 $138.18
Mountain Park 798 1 $7.22 $48.45 $144.45 $240.45 $336.45 $528.45
MSO Water Systems, Inc. 0 $39.00 $39.00 $47.00 $60.00 $77.00 $117.00
MSO Water Systems, Inc. - Briarcrest 0 $39.00 $39.00 $48.00 $66.00 $86.00 $126.00
MSO Water Systems, Inc. - English Oaks 0 $33.00 $38.00 $51.00 $66.00 $81.00 $111.00
Nahunta 1,074 1 1.25 $7.00 $20.25 $34.00 $47.75 $61.50 $91.50
Nashville 4,896 1 1.32 $7.95 $17.20 $28.45 $40.95 $53.45 $78.45
Newborn 832 1 1.52 $16.52 $21.52 $31.84 $40.67 $50.99 $59.82 $70.14 $78.97 $89.29 $98.12 $127.59 $136.42
Newington 227 1 0.74 $17.00 $21.50 $29.85 $39.85 $49.85 $69.85
Newnan Utilities 34,000 1 $4.85 $42.35 $79.85 $117.35 $154.85 $229.85
Newton 681 1 $19.00 $19.00 $21.00 $26.00 $31.00 $41.00
Newton County Water and Sewer Authority 62,384 1 1.31 $11.72 $30.00 $33.29 $50.00 $68.47 $100.00 $107.82 $150.00 $154.77 $200.00 $248.67 $300.00
Nicholls 2,745 1 1.09 $6.36 $11.51 $16.76 $22.01 $27.26 $38.26
Nicholson Water Authority 2,857 1 0.94 $13.00 $38.00 $71.25 $112.50 $153.75 $236.25
Norman Park 1,173 1 0.96 $8.50 $11.82 $21.75 $31.71 $36.75 $54.21 $53.00 $78.61 $69.25 $103.01 $106.75 $159.31
Norwood 364 1 $9.00 $12.30 $17.80 $23.30 $28.80 $39.80
Notla Water Authority 13,465 1 1.10 $19.00 $30.85 $50.60 $70.35 $90.10 $129.60
Oakwood - Flowery Branch (no water bills)
Oakwood - Gainesville (no water bills)
Ochlocknee 789 1 0.54 $11.00 $11.80 $15.00 $17.40 $20.00 $24.40 $25.00 $31.40 $30.00 $38.40 $40.00 $52.40
Ocilla 2,540 1 1.01 $10.25 $20.25 $14.75 $24.75 $22.25 $32.25 $29.75 $39.75 $37.25 $47.25 $52.25 $62.25
Oconee 280 1 0.31 $15.00 $19.00 $24.00 $29.00 $34.00 $44.00
Oconee County 19,279 1 2.44 $16.90 $40.71 $72.34 $109.69 $154.64 $244.54
Odum 645 1 0.68 $6.50 $12.50 $21.25 $30.50 $40.25 $60.75
Oxford 2,214 1 1.35 $19.77 $32.95 $65.90 $98.85 $131.80 $197.70
Palmetto 3,965 1 $14.65 $29.65 $56.65 $86.65 $116.65 $186.65
Parrott 229 1 0.86 $11.00 $24.00 $38.20 $54.30 $70.80 $103.80
Patterson 972 1 0.85 $17.50 $21.50 $28.00 $37.26 $40.50 $56.01 $54.25 $76.66 $68.00 $97.31 $98.00 $142.31
Paulding County 113,204 1 1.04 $9.00 $51.40 $93.80 $136.20 $178.60 $263.40
Pavo 741 1 0.61 $11.00 $16.00 $23.00 $33.60 $38.00 $55.60 $53.00 $77.60 $68.00 $99.60 $98.00 $143.60
Peachtree City Water and Sewerage Authority (no
water bills)
Pearson 2,000 2 1.14 $7.31 $23.36 $40.86 $58.36 $75.86 $110.86
Pelham 3,601 1 1.70 $19.00 $24.70 $28.20 $36.66 $39.70 $51.61 $51.20 $66.56 $62.70 $81.51 $85.70 $111.41
Pembroke 2,571 1 0.83 $19.50 $20.00 $31.35 $31.85 $41.55 $42.05 $52.95 $53.45 $65.15 $65.65 $91.15 $91.65
Perkins Water Authority 140 1 $22.00 $30.70 $45.20 $59.70 $74.20 $103.20
Service Population is approximated and may not be actual.
Source: 1=EPA SDWIS 2017, 2=Census Population in 2016 *Based on data from FY2015 or earlierGeorgia Environmental Finance Authority
and Environmental Finance Center

Compare with caution. High rates may be justified and necessary to protect public health.
Inside Outside Inside Outside Inside Outside Inside Outside Inside Outside Inside Outside
Rate Table 6: 2017 Monthly-Equivalent RESIDENTIAL IRRIGATION Bills at Various Consumption Levels (Includes Base Charges)
Utility / Rate Structure
Service
Population
(Approx.)
Zero Gallons
(0 cf)
5,000 Gallons
(802 cf)
10,000 Gallons
(1,337cf)
15,000 Gallons
(2,005 cf)
20,000 Gallons
(2,674 cf)
30,000 Gallons
(4,011 cf)
Operating
Ratio
(FY2016)
Pickens County Water Authority 6,357 1 1.12 $36.00 $58.00 $93.00 $128.00 $163.00 $233.00
Piedmont Water Co. - Lake Oconee 0 $34.50 $49.50 $92.00 $137.50 $185.00 $280.00
Pike County Water and Sewer Authority 434 1 0.32 $37.00 $56.50 $89.00 $121.50 $154.00 $219.00
Pine Mountain 1,697 1 0.83 $12.00 $15.00 $21.00 $28.00 $32.25 $44.25 $43.50 $60.50 $54.75 $76.75 $77.25 $109.25
Pinehurst 460 1 2.29 $27.50 $32.00 $39.50 $47.00 $54.50 $69.50
Pineview 512 1 1.10 $12.00 $12.00 $16.00 $21.00 $26.00 $36.00
Pitts 590 1 0.67 $7.50 $10.20 $16.95 $23.70 $30.45 $43.95
Plains 892 1 0.65 $12.65 $15.56 $19.05 $23.56 $27.30 $33.86 $35.80 $44.51 $44.55 $55.51 $62.55 $78.01
Polk County Water Authority 24,061 1 0.94 $14.19 $32.64 $63.03 $93.51 $124.21 $188.71
Polk County Water Authority - Vinson Mountain 24,061 1 0.94 $13.49 $35.03 $71.53 $109.15 $147.25 $225.05
Pooler 21,187 1 1.09 $9.15 $16.38 $30.81 $52.43 $88.53 $160.73
Port Wentworth 4,160 1 1.20 $28.94 $45.55 $64.58 $84.90 $105.22 $145.87
Portal 879 1 0.80 $15.00 $18.00 $21.00 $24.75 $31.00 $36.00 $41.50 $48.50 $52.00 $61.00 $73.00 $86.00
Poulan 2,002 1 1.26 $21.00 $25.00 $25.00 $29.00 $35.00 $39.00 $45.00 $49.00 $55.00 $59.00 $75.00 $79.00
Powder Springs 14,000 1 1.16 $7.16 $34.91 $64.71 $96.01 $127.31 $192.81
Pulaski 280 1 0.85 $13.00 $17.00 $30.00 $48.00 $68.00 $108.00
Quitman 4,942 1 0.98 $6.37 $19.02 $34.02 $49.02 $64.02 $94.02
Rabun County Water and Sewer Authority 0 0.77 $18.00 $45.00 $90.00 $135.00 $180.00 $270.00
Randolph County Water Authority 231 1 $20.00 $24.50 $32.00 $39.50 $47.00 $62.00
Ray City 845 1 1.05 $7.46 $9.46 $18.21 $25.61 $28.96 $41.76 $39.71 $57.91 $50.46 $74.06 $71.96 $106.36
Register 182 1 $20.00 $36.25 $53.00 $70.25 $88.00 $124.50
Remerton 1,479 1 0.94 $16.10 $26.10 $36.10 $46.10 $56.10 $76.10
Rentz 310 1 1.64 $17.50 $22.90 $31.90 $40.90 $49.90 $67.90
Reynolds 1,373 1 0.68 $12.50 $17.50 $20.45 $31.45 $33.70 $54.70 $46.95 $77.95 $60.20 $101.20 $86.70 $147.70
Rhine 413 1 1.22 $30.00 $30.00 $30.00 $30.00 $30.00 $30.00
Riceboro 1,131 1 0.68 $15.00 $18.00 $23.00 $28.00 $33.00 $43.00
Richland 1,323 1 0.62 $33.50 $40.00 $33.50 $40.00 $33.50 $40.00 $33.50 $40.00 $33.50 $40.00 $33.50 $40.00
Richmond Hill 11,258 1 1.52 $20.50 $30.75 $44.00 $66.00 $67.50 $101.25 $91.00 $136.50 $114.50 $171.75 $161.50 $242.25
Riddleville 128 1 0.47 $12.50 $21.50 $36.50 $51.50 $66.50 $96.50
Rincon 9,880 1 1.94 $12.00 $17.50 $19.00 $26.50 $37.50 $49.75 $60.00 $76.00 $86.25 $104.75 $138.75 $162.25
Ringgold 2,743 1 1.05 $14.03 $25.46 $44.51 $63.56 $82.61 $120.71
Ringgold - Dalton (no water bills)
Ringgold - Meadows (no water bills)
Roberta 1,615 1 0.86 $10.50 $13.75 $24.25 $28.75 $38.00 $43.75 $51.75 $58.75 $65.50 $73.75 $93.00 $103.75
Rochelle 1,581 1 1.33 $14.50 $16.50 $25.75 $27.75 $37.00 $39.00 $48.25 $50.25 $59.50 $61.50 $82.00 $84.00
Service Population is approximated and may not be actual.
Source: 1=EPA SDWIS 2017, 2=Census Population in 2016 *Based on data from FY2015 or earlierGeorgia Environmental Finance Authority
and Environmental Finance Center

Compare with caution. High rates may be justified and necessary to protect public health.
Inside Outside Inside Outside Inside Outside Inside Outside Inside Outside Inside Outside
Rate Table 6: 2017 Monthly-Equivalent RESIDENTIAL IRRIGATION Bills at Various Consumption Levels (Includes Base Charges)
Utility / Rate Structure
Service
Population
(Approx.)
Zero Gallons
(0 cf)
5,000 Gallons
(802 cf)
10,000 Gallons
(1,337cf)
15,000 Gallons
(2,005 cf)
20,000 Gallons
(2,674 cf)
30,000 Gallons
(4,011 cf)
Operating
Ratio
(FY2016)
Rockdale County Water and Sewer Authority 72,621 1 $14.63 $43.08 $71.53 $99.98 $128.43 $185.33
Rockmart 6,500 1 1.39 $8.84 $13.27 $22.10 $33.16 $44.20 $66.31 $67.40 $101.06 $90.60 $135.81 $138.15 $207.06
Rocky Ford 165 1 1.06 $13.50 $21.50 $42.75 $65.25 $87.75 $132.75
Rome - Zone 1 45,586 1 1.54 $15.65 $35.15 $58.08 $81.00 $103.93 $149.79
Rome - Zone 2 45,586 1 1.54 $15.65 $38.58 $61.51 $84.43 $107.36 $153.22
Rome - Zone 3 45,586 1 1.54 $18.00 $43.00 $68.00 $93.00 $118.00 $168.00
Rome - Zone 4 45,586 1 1.54 $19.58 $40.84 $65.84 $90.84 $115.84 $165.84
Roopville 252 1 $1.50 $9.00 $26.75 $50.50 $81.75 $154.25
Roswell 14,300 1 1.33 $5.01 $66.76 $128.51 $190.26 $252.01 $375.51
Royston 2,800 1 0.94 $9.28 $16.10 $25.03 $41.60 $40.78 $67.10 $56.53 $92.60 $72.28 $118.10 $103.78 $169.10
Rutledge 918 1 1.63 $14.00 $26.00 $47.00 $70.75 $94.50 $142.00
Saint Marys 17,270 1 0.93 $20.45 $34.75 $50.73 $67.13 $83.53 $116.33
Sale City 465 1 $11.00 $17.00 $29.50 $44.50 $62.00 $102.00
Sandersville 6,100 1 2.55 $18.00 $18.00 $23.85 $26.79 $33.60 $41.44 $43.35 $56.09 $53.10 $70.74 $72.60 $100.04
Sardis 999 1 0.99 $12.00 $26.50 $41.00 $55.50 $70.00 $99.00
Sasser 367 1 $25.00 $25.00 $29.00 $31.00 $41.00 $48.00 $55.00 $67.00 $71.00 $88.00 $110.00 $137.00
Satilla Regional Water and Sewer Authority 14,311 1 1.40 $6.00 $16.54 $31.58 $46.62 $61.66 $91.74
Savannah 215,566 1 1.22 $5.53 $8.30 $12.42 $18.59 $20.36 $30.47 $28.44 $42.57 $36.53 $54.67 $52.71 $78.86
Schley County 1,321 1 1.20 $28.00 $37.00 $52.00 $67.00 $82.00 $112.00
Scotland 356 1 $13.00 $13.75 $21.25 $28.75 $36.25 $51.25
Screven 840 1 $12.00 $18.30 $29.55 $41.30 $53.55 $79.05
Senoia 3,466 1 1.18 $16.00 $23.50 $38.00 $49.50 $69.00 $85.50 $103.50 $125.00 $141.50 $168.00 $217.50 $254.00
Shady Dale 398 1 0.80 $25.00 $38.50 $61.00 $83.50 $106.00 $151.00
Shellman 1,115 1 0.74 $10.00 $13.96 $20.56 $27.16 $33.76 $46.96
Shiloh 585 1 0.96 $13.00 $15.00 $26.00 $30.00 $42.25 $48.75 $58.50 $67.50 $74.75 $86.25 $107.25 $123.75
Siloam 481 1 0.81 $17.00 $26.00 $41.00 $56.00 $71.00 $101.00
Sky Lake POA, Inc. 0 $27.92 $27.92 $27.92 $27.92 $27.92 $27.92
Sky Valley 1,877 1 $30.00 $45.00 $90.00 $135.00 $200.00 $300.00 $320.00 $480.00 $450.00 $675.00 $665.00 $997.50
Smithville 647 1 0.42 $15.00 $19.50 $27.00 $34.50 $42.00 $57.00
Smyrna 35,000 1 1.19 $12.77 $35.24 $65.57 $99.64 $138.19 $215.29
Social Circle 4,235 1 1.51 $19.90 $29.85 $49.15 $73.71 $97.90 $146.81 $146.65 $219.91 $195.40 $293.01 $292.90 $439.21
Soperton 2,470 1 1.02 $10.00 $50.00 $14.50 $54.50 $22.00 $62.00 $29.50 $69.50 $37.00 $77.00 $54.50 $94.50
Spalding County 40,430 1 1.20 $13.71 $50.56 $92.93 $143.43 $193.93 $294.93
Sparks 1,823 1 1.14 $20.75 $20.75 $20.75 $20.75 $20.75 $20.75
Springfield 3,100 1 1.15 $10.00 $15.00 $16.00 $22.50 $28.50 $40.00 $41.00 $57.50 $53.50 $75.00 $81.00 $120.00
Service Population is approximated and may not be actual.
Source: 1=EPA SDWIS 2017, 2=Census Population in 2016 *Based on data from FY2015 or earlierGeorgia Environmental Finance Authority
and Environmental Finance Center

Compare with caution. High rates may be justified and necessary to protect public health.
Inside Outside Inside Outside Inside Outside Inside Outside Inside Outside Inside Outside
Rate Table 6: 2017 Monthly-Equivalent RESIDENTIAL IRRIGATION Bills at Various Consumption Levels (Includes Base Charges)
Utility / Rate Structure
Service
Population
(Approx.)
Zero Gallons
(0 cf)
5,000 Gallons
(802 cf)
10,000 Gallons
(1,337cf)
15,000 Gallons
(2,005 cf)
20,000 Gallons
(2,674 cf)
30,000 Gallons
(4,011 cf)
Operating
Ratio
(FY2016)
Statesboro 36,846 1 1.27 $7.50 $15.00 $18.75 $37.50 $30.10 $60.20 $41.85 $83.70 $53.85 $107.70 $79.85 $159.70
Statham 3,986 1 $17.92 $26.88 $34.77 $44.85 $65.57 $77.60 $96.37 $110.35 $127.17 $143.10 $188.77 $208.60
Stewart County Water and Sewer Authority 3,006 1 $15.25 $25.25 $35.25 $45.25 $55.25 $75.25
Stillmore 615 1 $17.50 $24.25 $41.15 $63.65 $86.15 $131.15
Stockbridge 6,500 1 1.09 $6.00 $65.10 $124.20 $183.30 $242.40 $360.60
Summerville 11,651 1 1.22 $15.10 $19.94 $22.86 $30.20 $42.26 $55.85 $61.66 $81.50 $81.06 $107.15 $119.86 $158.45
Sumner 848 1 $12.50 $24.00 $41.50 $59.00 $76.50 $111.50
Surrency 170 2 0.45 $9.00 $9.60 $13.80 $19.80 $25.80 $37.80
Suwanee 920 1 1.24 $20.50 $31.48 $60.82 $95.92 $131.02 $201.22
Sylvania 2,960 1 1.31 $12.00 $16.75 $22.73 $32.85 $33.95 $49.68 $45.43 $67.02 $56.90 $84.36 $82.71 $123.12
Sylvester 12,886 1 1.39 $15.00 $18.00 $26.25 $34.25 $38.65 $51.65 $48.65 $66.65 $58.65 $81.65 $78.65 $111.65
Talbot County 3,398 1 0.87 $35.59 $49.09 $71.59 $94.09 $116.59 $161.59
Talbotton 738 1 0.79 $28.73 $42.23 $64.73 $87.23 $109.73 $154.73
Tallapoosa 4,030 1 0.69 $8.00 $12.00 $22.10 $33.15 $45.60 $68.40 $69.10 $103.65 $92.60 $138.90 $139.60 $209.40
Tarrytown 88 1 0.61 $30.00 $47.50 $65.00 $82.50 $100.00 $135.00
Taylor County Water and Sewer Authority 91 1 $24.50 $24.50 $30.50 $36.50 $42.50 $54.50
Temple 4,250 1 0.89 $5.00 $27.50 $51.75 $76.75 $101.75 $151.75
Tennille 1,802 1 0.89 $3.48 $10.38 $17.88 $26.03 $34.18 $50.48
Thomaston 10,510 1 1.07 $6.50 $43.65 $80.80 $117.95 $155.10 $229.40
Thomasville 23,577 1 1.23 $17.09 $30.32 $27.14 $45.87 $37.19 $61.42 $47.24 $76.97 $57.29 $92.52 $77.39 $123.62
Thomson-McDuffie County Water and Sewer
Commission 17,717 1 $7.45 $30.60 $53.75 $76.90 $100.05 $146.35
Thunderbolt 2,668 1 0.84 $8.00 $16.45 $28.60 $44.45 $64.00 $92.00
Tifton 24,871 1 1.69 $7.72 $11.49 $13.82 $20.29 $19.92 $29.09 $26.02 $37.89 $32.12 $46.69 $44.32 $64.29
Tignall 754 1 0.84 $17.75 $30.00 $30.05 $39.00 $52.55 $72.75 $80.05 $114.00 $107.55 $155.25 $162.55 $237.75
Toccoa 24,960 1 1.47 $14.75 $18.44 $29.00 $36.26 $52.75 $65.96 $76.50 $95.66 $100.25 $125.36 $147.75 $184.76
Toomsboro 472 1 0.86 $18.00 $30.00 $50.00 $70.00 $90.00 $130.00
Towns County Water and Sewer Authority 9,991 1 1.44 $24.00 $49.00 $74.00 $99.00 $124.00 $174.00
Trenton (no water bills)
Trion 2,400 1 1.00 $15.00 $15.00 $15.00 $15.00 $15.00 $15.00
Turin 671 1 1.48 $16.50 $31.35 $63.10 $101.10 $139.10 $215.10
Turtle Cove POA 0 $40.00 $46.00 $76.00 $126.00 $176.00 $276.00
Twiggs County 376 1 0.51 $23.50 $39.25 $65.50 $91.75 $118.00 $170.50
Tybee Island 8,047 1 0.86 $10.72 $27.57 $45.82 $65.47 $85.12 $135.62
Tyrone 7,121 2 0.88 $18.48 $24.94 $41.09 $57.24 $73.39 $117.29
Unadilla 3,837 1 1.76 $9.00 $15.95 $16.02 $22.97 $27.72 $34.67 $39.42 $46.37 $51.12 $58.07 $74.52 $81.47
Service Population is approximated and may not be actual.
Source: 1=EPA SDWIS 2017, 2=Census Population in 2016 *Based on data from FY2015 or earlierGeorgia Environmental Finance Authority
and Environmental Finance Center

Compare with caution. High rates may be justified and necessary to protect public health.
Inside Outside Inside Outside Inside Outside Inside Outside Inside Outside Inside Outside
Rate Table 6: 2017 Monthly-Equivalent RESIDENTIAL IRRIGATION Bills at Various Consumption Levels (Includes Base Charges)
Utility / Rate Structure
Service
Population
(Approx.)
Zero Gallons
(0 cf)
5,000 Gallons
(802 cf)
10,000 Gallons
(1,337cf)
15,000 Gallons
(2,005 cf)
20,000 Gallons
(2,674 cf)
30,000 Gallons
(4,011 cf)
Operating
Ratio
(FY2016)
Union City 18,636 1 1.18 $4.00 $51.80 $99.60 $147.40 $198.35 $300.25
Upson County 5,778 1 1.38 $23.00 $46.25 $71.25 $97.50 $123.75 $178.75
Utilities, Inc. of Georgia - The Landings 0 $18.25 $29.80 $45.50 $78.60 $111.70 $215.25
Utilities, Inc. of Georgia - The Orchard 0 $46.00 $57.50 $86.25 $121.10 $165.10 $283.90
Valdosta 56,019 1 0.53 $7.00 $14.00 $16.95 $33.90 $28.65 $57.29 $40.34 $80.69 $52.04 $104.08 $75.44 $150.87
Vidalia 13,050 1 0.78 $8.00 $12.00 $12.98 $18.99 $21.28 $30.64 $30.93 $43.64 $40.58 $56.64 $62.68 $85.44
Vienna 3,666 1 1.25 $10.90 $13.15 $21.65 $29.29 $32.90 $46.19 $45.40 $64.94 $57.90 $83.69 $82.90 $121.19
Villa Rica 13,996 1 1.02 $37.60 $56.40 $75.19 $112.79 $112.79 $169.19 $150.38 $225.58 $225.57 $338.37
Waco 913 1 $16.00 $24.00 $29.50 $39.00 $52.00 $64.00 $74.50 $89.00 $97.00 $114.00 $142.00 $164.00
Wadley 2,500 1 1.47 $15.00 $30.00 $20.25 $40.50 $29.00 $58.00 $37.75 $75.50 $46.50 $93.00 $64.00 $128.00
Waleska 2,691 1 1.00 $15.52 $36.85 $75.65 $114.45 $159.70 $250.20
Walker County Rural Water and Sewer Authority 3,270 1 1.38 $17.70 $35.90 $58.65 $81.40 $104.15 $149.65
Walker County Water and Sewer Authority 36,000 1 0.96 $15.00 $32.50 $50.00 $67.50 $85.00 $120.00
Walthourville 3,858 1 1.06 $14.70 $19.20 $23.40 $35.40 $34.90 $52.65 $46.90 $70.65 $58.90 $88.65 $83.90 $126.15
Walton County Water and Sewer Authority 36,387 1 $23.75 $45.11 $84.37 $129.12 $194.27 $334.77
Warm Springs 1,120 1 0.90 $12.00 $15.00 $41.75 $49.75 $71.50 $84.50 $101.25 $119.25 $131.00 $154.00 $190.50 $223.50
Warner Robins 64,163 1 1.14 $6.80 $15.45 $24.10 $32.75 $41.40 $58.70
Warrenton 2,800 1 1.15 $18.34 $20.92 $33.74 $38.25 $55.74 $63.00 $85.89 $95.85 $116.04 $128.70 $176.34 $194.40
Warwick 864 1 $9.00 $25.05 $42.30 $59.80 $77.30 $112.30
Washington 4,134 1 1.06 $19.00 $28.50 $39.00 $58.50 $59.00 $88.50 $79.00 $118.50 $99.00 $148.50 $139.00 $208.50
Water Service Company of Georgia - Lake Riverside 0 $23.58 $48.13 $72.68 $97.23 $121.78 $170.88
Waycross 21,154 1 0.84 $17.01 $23.96 $30.91 $37.87 $44.82 $58.72
Waynesboro 5,813 1 0.88 $3.19 $3.19 $25.39 $32.09 $47.59 $60.99 $69.79 $89.89 $91.99 $118.79 $136.39 $176.59
Webster County 1,038 1 1.19 $14.00 $20.00 $17.00 $23.00 $24.50 $30.50 $32.00 $38.00 $39.50 $45.50 $54.50 $60.50
West Point 3,929 1 $8.94 $13.41 $32.74 $37.21 $56.53 $61.00 $80.33 $84.80 $104.13 $108.60 $151.72 $156.19
Whigham 879 1 1.50 $18.02 $24.68 $35.78 $46.88 $57.98 $80.18
White 806 1 $12.00 $16.00 $17.00 $22.70 $32.64 $43.65 $51.39 $68.80 $75.14 $100.63 $125.14 $167.63
White County Water Authority 4,420 1 0.89 $26.00 $43.24 $70.61 $98.91 $127.21 $183.81
White Plains 413 1 $17.00 $26.00 $41.00 $56.00 $71.00 $101.00
Whitesburg 931 1 $15.00 $19.00 $26.12 $35.65 $38.47 $54.15 $50.82 $72.65 $63.17 $91.15 $87.87 $128.15
Willacoochee 1,940 1 1.25 $12.50 $18.50 $33.50 $48.50 $63.50 $93.50
Williamson 408 1 0.86 $15.00 $15.00 $36.63 $40.88 $77.38 $86.63 $118.13 $132.38 $158.88 $178.13 $240.38 $269.63
Winder 32,971 1 1.46 $16.25 $25.20 $45.55 $55.20 $88.55 $98.20 $133.55 $143.20 $178.55 $188.20 $268.55 $278.20
Woodbine 1,508 1 1.25 $9.40 $20.10 $31.85 $45.75 $73.55
Woodbury 961 1 1.06 $14.39 $19.37 $38.74 $50.62 $80.12 $103.78 $128.82 $166.33 $177.52 $228.88 $274.92 $353.98
Service Population is approximated and may not be actual.
Source: 1=EPA SDWIS 2017, 2=Census Population in 2016 *Based on data from FY2015 or earlierGeorgia Environmental Finance Authority
and Environmental Finance Center

Compare with caution. High rates may be justified and necessary to protect public health.
Inside Outside Inside Outside Inside Outside Inside Outside Inside Outside Inside Outside
Rate Table 6: 2017 Monthly-Equivalent RESIDENTIAL IRRIGATION Bills at Various Consumption Levels (Includes Base Charges)
Utility / Rate Structure
Service
Population
(Approx.)
Zero Gallons
(0 cf)
5,000 Gallons
(802 cf)
10,000 Gallons
(1,337cf)
15,000 Gallons
(2,005 cf)
20,000 Gallons
(2,674 cf)
30,000 Gallons
(4,011 cf)
Operating
Ratio
(FY2016)
Woodstock 10,070 1 1.00 $11.55 $34.67 $63.57 $94.17 $124.77 $185.97
Wrens 2,375 1 0.97 $16.60 $23.60 $31.88 $44.20 $50.98 $69.95 $70.08 $95.70 $89.18 $121.45 $127.38 $172.95
Service Population is approximated and may not be actual.
Source: 1=EPA SDWIS 2017, 2=Census Population in 2016 *Based on data from FY2015 or earlierGeorgia Environmental Finance Authority
and Environmental Finance Center

Utility / Rate Structure
Different
than
Residential
Water Rate
Structure?
Billing Period
(Monthly,
Bimonthly,
Quarterly, Other)
Base Charge
Pricing
Monthly Gallons
Provided with
Base Charge
(Allowance)
Commercial Water Rate
Structure
Number
of
Blocks
First Block
Maximum
(Monthly
Gallons)
Outside/Inside
Bill Differential at
25,000 Gallons
Adel 5,311 1 No Monthly Constant 2,000 Decreasing Block 3 8,000
Adrian 664 1 Yes Monthly Constant 0 Increasing Block 4 2,000
Ailey 527 1 No Monthly Constant 2,000 Uniform Rate
Alamo 3,457 1 No Monthly Constant 2,000 Uniform Rate
Albany 87,029 1 No Monthly Constant 3,000 Decreasing Block 2 7,000
Alcovy Shores Water Authority 432 1 No Monthly Constant 0 Uniform Rate
Allentown 175 1 No Monthly Constant 2,000 Uniform Rate
Alma 4,700 1 No Monthly Constant 2,000 Increasing Block 3 3,000 200%
Alston 169 1 No Monthly Constant 2,000 Increasing Block 5 5,000
Alto 2,500 1 Yes Monthly Constant 0 Increasing Block 3 1,000
Americus 16,255 1 No Monthly Constant 0 Uniform Rate 200%
Andersonville 400 1 No Monthly Constant 2,000 Uniform Rate
Arabi 429 1 Yes Monthly Constant 500 Uniform Rate
Argyle 211 1 No Monthly None 0 Non-Volumetric Flat Charge
Arlington 1,243 1 Yes Monthly Constant 0 Increasing Block 4 2,000
Arnoldsville 1,040 1 No Monthly Constant 3,000 Increasing Block 2 5,999 137%
Ashburn 4,272 1 Yes Monthly Constant 0 Increasing Block 5 5,000
Athens-Clarke County 120,266 1 Yes Monthly By Meter Size 0 Uniform Rate
Atlanta 650,000 1 No Monthly Constant 0 Increasing Block 3 2,244 121%
Attapulgus 715 1 No Monthly Constant 3,000 Uniform Rate 112%
Auburn 6,904 1 Yes Monthly Constant 0 Increasing Block 9 1,000
Augusta 204,000 1 Yes Monthly By Meter Size 0 Increasing Block 2 3,000
Austell 7,774 1 No Monthly Constant 2,000 Increasing Block 3 7,000 107%
Avera 240 1 No Monthly Constant 1,000 Increasing Block 2 5,000
Baconton 985 1 Yes Monthly Constant 0 Uniform Rate 140%
Bainbridge 13,546 1 No Monthly Constant 0 Uniform Rate 126%
Baldwin 4,160 1 No Monthly Constant 2,000 Increasing Block 3 6,000 127%
Baldwin County 21,840 1 No Monthly Constant 2,000 Increasing Block 5 4,999
Ball Ground 2,470 1 No Monthly Constant 0 Increasing Block 5 3,000 116%
Banks County 6,453 1 Yes Monthly Constant 2,000 Increasing Block 5 6,000
Barnesville 6,755 1 No Monthly Constant 2,000 Uniform at One Block's Rate 3 5,000 104%
Barrow County Water and Sewer Authority 14,043 1 No Monthly Constant 0 Increasing Block 2 10,000
Bartow 286 1 Yes Monthly Constant 50,000 Uniform Rate
Bartow County 50,162 1 Yes Monthly By Meter Size 0 Uniform Rate
Rate Table 7: 2017 Water Rate Structures for Commercial Customers
Service
Population
(Approx.)
Service Population is approximated and may not be actual.
Source: 1=EPA SDWIS 2017, 2=Census Population in 2016
Georgia Environmental Finance Authority
and Environmental Finance Center
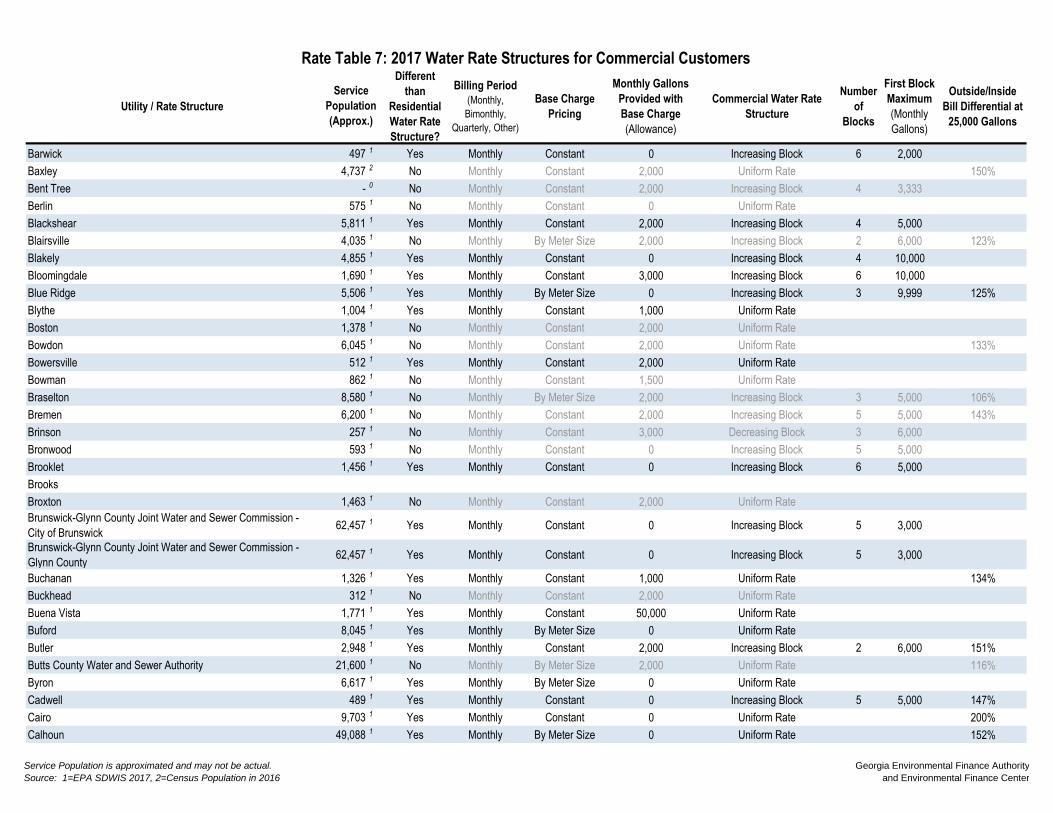
Utility / Rate Structure
Different
than
Residential
Water Rate
Structure?
Billing Period
(Monthly,
Bimonthly,
Quarterly, Other)
Base Charge
Pricing
Monthly Gallons
Provided with
Base Charge
(Allowance)
Commercial Water Rate
Structure
Number
of
Blocks
First Block
Maximum
(Monthly
Gallons)
Outside/Inside
Bill Differential at
25,000 Gallons
Rate Table 7: 2017 Water Rate Structures for Commercial Customers
Service
Population
(Approx.)
Barwick 497 1 Yes Monthly Constant 0 Increasing Block 6 2,000
Baxley 4,737 2 No Monthly Constant 2,000 Uniform Rate 150%
Bent Tree - 0 No Monthly Constant 2,000 Increasing Block 4 3,333
Berlin 575 1 No Monthly Constant 0 Uniform Rate
Blackshear 5,811 1 Yes Monthly Constant 2,000 Increasing Block 4 5,000
Blairsville 4,035 1 No Monthly By Meter Size 2,000 Increasing Block 2 6,000 123%
Blakely 4,855 1 Yes Monthly Constant 0 Increasing Block 4 10,000
Bloomingdale 1,690 1 Yes Monthly Constant 3,000 Increasing Block 6 10,000
Blue Ridge 5,506 1 Yes Monthly By Meter Size 0 Increasing Block 3 9,999 125%
Blythe 1,004 1 Yes Monthly Constant 1,000 Uniform Rate
Boston 1,378 1 No Monthly Constant 2,000 Uniform Rate
Bowdon 6,045 1 No Monthly Constant 2,000 Uniform Rate 133%
Bowersville 512 1 Yes Monthly Constant 2,000 Uniform Rate
Bowman 862 1 No Monthly Constant 1,500 Uniform Rate
Braselton 8,580 1 No Monthly By Meter Size 2,000 Increasing Block 3 5,000 106%
Bremen 6,200 1 No Monthly Constant 2,000 Increasing Block 5 5,000 143%
Brinson 257 1 No Monthly Constant 3,000 Decreasing Block 3 6,000
Bronwood 593 1 No Monthly Constant 0 Increasing Block 5 5,000
Brooklet 1,456 1 Yes Monthly Constant 0 Increasing Block 6 5,000
Brooks
Broxton 1,463 1 No Monthly Constant 2,000 Uniform Rate
Brunswick-Glynn County Joint Water and Sewer Commission -
City of Brunswick 62,457 1 Yes Monthly Constant 0 Increasing Block 5 3,000
Brunswick-Glynn County Joint Water and Sewer Commission -
Glynn County 62,457 1 Yes Monthly Constant 0 Increasing Block 5 3,000
Buchanan 1,326 1 Yes Monthly Constant 1,000 Uniform Rate 134%
Buckhead 312 1 No Monthly Constant 2,000 Uniform Rate
Buena Vista 1,771 1 Yes Monthly Constant 50,000 Uniform Rate
Buford 8,045 1 Yes Monthly By Meter Size 0 Uniform Rate
Butler 2,948 1 Yes Monthly Constant 2,000 Increasing Block 2 6,000 151%
Butts County Water and Sewer Authority 21,600 1 No Monthly By Meter Size 2,000 Uniform Rate 116%
Byron 6,617 1 Yes Monthly By Meter Size 0 Uniform Rate
Cadwell 489 1 Yes Monthly Constant 0 Increasing Block 5 5,000 147%
Cairo 9,703 1 Yes Monthly Constant 0 Uniform Rate 200%
Calhoun 49,088 1 Yes Monthly By Meter Size 0 Uniform Rate 152%
Service Population is approximated and may not be actual.
Source: 1=EPA SDWIS 2017, 2=Census Population in 2016
Georgia Environmental Finance Authority
and Environmental Finance Center
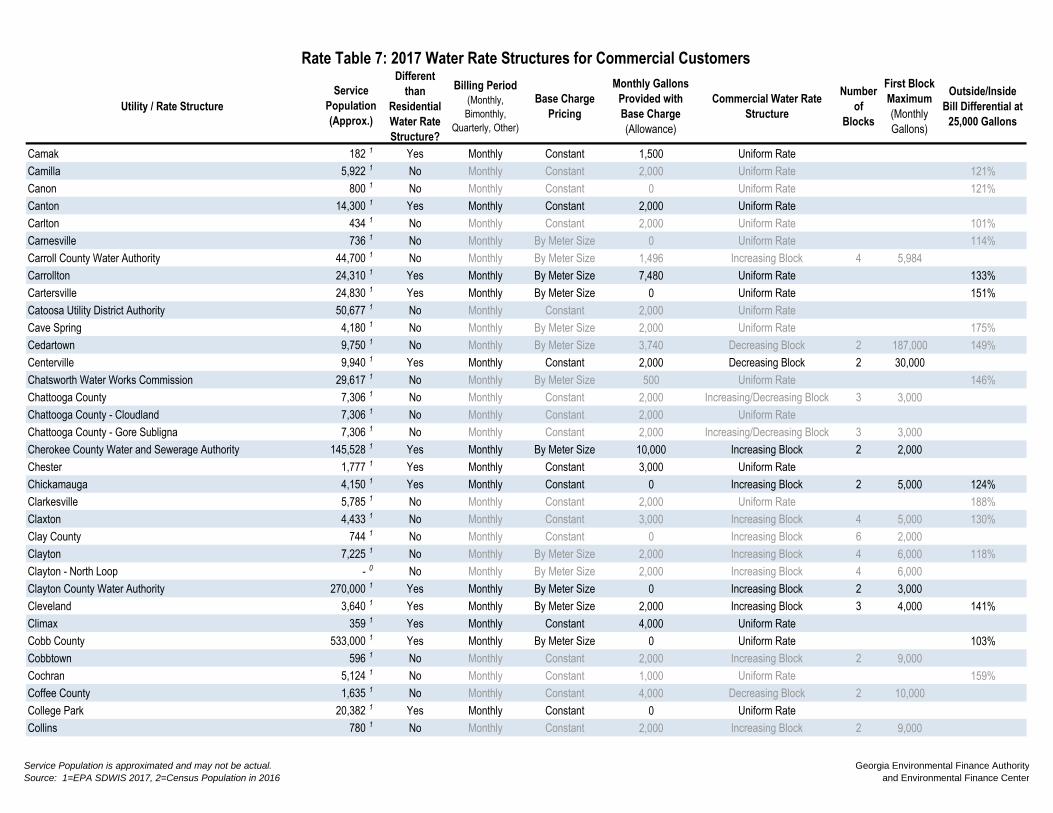
Utility / Rate Structure
Different
than
Residential
Water Rate
Structure?
Billing Period
(Monthly,
Bimonthly,
Quarterly, Other)
Base Charge
Pricing
Monthly Gallons
Provided with
Base Charge
(Allowance)
Commercial Water Rate
Structure
Number
of
Blocks
First Block
Maximum
(Monthly
Gallons)
Outside/Inside
Bill Differential at
25,000 Gallons
Rate Table 7: 2017 Water Rate Structures for Commercial Customers
Service
Population
(Approx.)
Camak 182 1 Yes Monthly Constant 1,500 Uniform Rate
Camilla 5,922 1 No Monthly Constant 2,000 Uniform Rate 121%
Canon 800 1 No Monthly Constant 0 Uniform Rate 121%
Canton 14,300 1 Yes Monthly Constant 2,000 Uniform Rate
Carlton 434 1 No Monthly Constant 2,000 Uniform Rate 101%
Carnesville 736 1 No Monthly By Meter Size 0 Uniform Rate 114%
Carroll County Water Authority 44,700 1 No Monthly By Meter Size 1,496 Increasing Block 4 5,984
Carrollton 24,310 1 Yes Monthly By Meter Size 7,480 Uniform Rate 133%
Cartersville 24,830 1 Yes Monthly By Meter Size 0 Uniform Rate 151%
Catoosa Utility District Authority 50,677 1 No Monthly Constant 2,000 Uniform Rate
Cave Spring 4,180 1 No Monthly By Meter Size 2,000 Uniform Rate 175%
Cedartown 9,750 1 No Monthly By Meter Size 3,740 Decreasing Block 2 187,000 149%
Centerville 9,940 1 Yes Monthly Constant 2,000 Decreasing Block 2 30,000
Chatsworth Water Works Commission 29,617 1 No Monthly By Meter Size 500 Uniform Rate 146%
Chattooga County 7,306 1 No Monthly Constant 2,000 Increasing/Decreasing Block 3 3,000
Chattooga County - Cloudland 7,306 1 No Monthly Constant 2,000 Uniform Rate
Chattooga County - Gore Subligna 7,306 1 No Monthly Constant 2,000 Increasing/Decreasing Block 3 3,000
Cherokee County Water and Sewerage Authority 145,528 1 Yes Monthly By Meter Size 10,000 Increasing Block 2 2,000
Chester 1,777 1 Yes Monthly Constant 3,000 Uniform Rate
Chickamauga 4,150 1 Yes Monthly Constant 0 Increasing Block 2 5,000 124%
Clarkesville 5,785 1 No Monthly Constant 2,000 Uniform Rate 188%
Claxton 4,433 1 No Monthly Constant 3,000 Increasing Block 4 5,000 130%
Clay County 744 1 No Monthly Constant 0 Increasing Block 6 2,000
Clayton 7,225 1 No Monthly By Meter Size 2,000 Increasing Block 4 6,000 118%
Clayton - North Loop - 0 No Monthly By Meter Size 2,000 Increasing Block 4 6,000
Clayton County Water Authority 270,000 1 Yes Monthly By Meter Size 0 Increasing Block 2 3,000
Cleveland 3,640 1 Yes Monthly By Meter Size 2,000 Increasing Block 3 4,000 141%
Climax 359 1 Yes Monthly Constant 4,000 Uniform Rate
Cobb County 533,000 1 Yes Monthly By Meter Size 0 Uniform Rate 103%
Cobbtown 596 1 No Monthly Constant 2,000 Increasing Block 2 9,000
Cochran 5,124 1 No Monthly Constant 1,000 Uniform Rate 159%
Coffee County 1,635 1 No Monthly Constant 4,000 Decreasing Block 2 10,000
College Park 20,382 1 Yes Monthly Constant 0 Uniform Rate
Collins 780 1 No Monthly Constant 2,000 Increasing Block 2 9,000
Service Population is approximated and may not be actual.
Source: 1=EPA SDWIS 2017, 2=Census Population in 2016
Georgia Environmental Finance Authority
and Environmental Finance Center
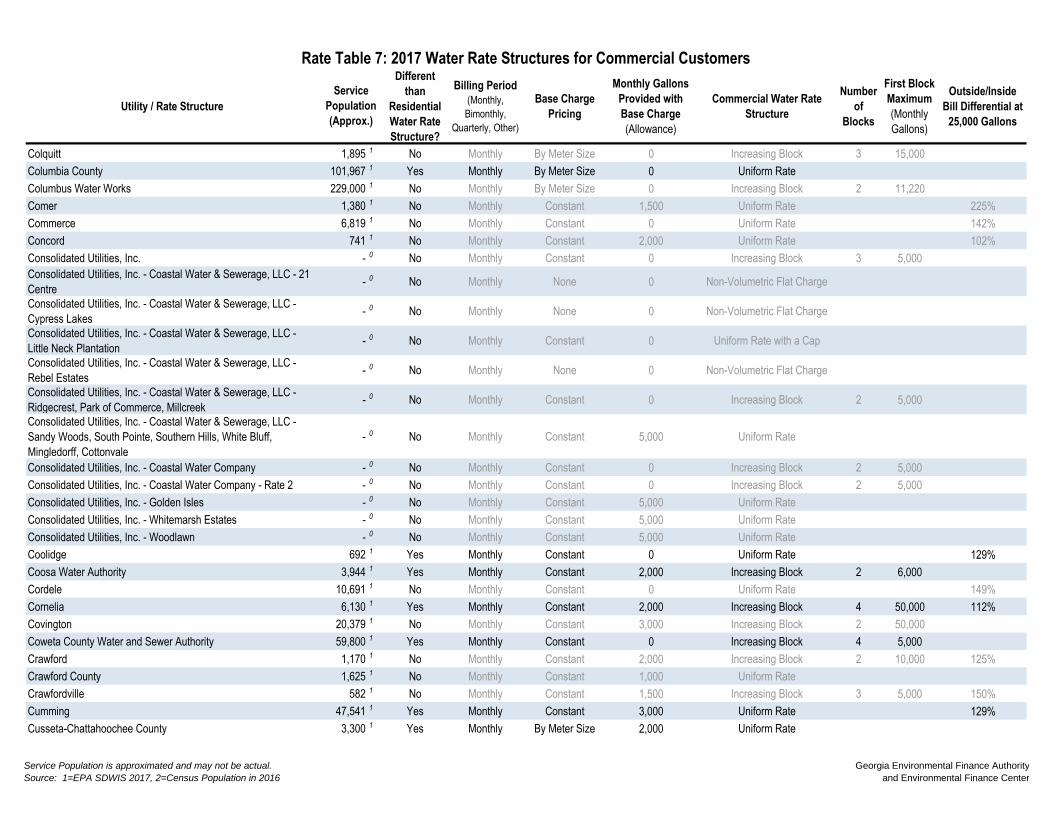
Utility / Rate Structure
Different
than
Residential
Water Rate
Structure?
Billing Period
(Monthly,
Bimonthly,
Quarterly, Other)
Base Charge
Pricing
Monthly Gallons
Provided with
Base Charge
(Allowance)
Commercial Water Rate
Structure
Number
of
Blocks
First Block
Maximum
(Monthly
Gallons)
Outside/Inside
Bill Differential at
25,000 Gallons
Rate Table 7: 2017 Water Rate Structures for Commercial Customers
Service
Population
(Approx.)
Colquitt 1,895 1 No Monthly By Meter Size 0 Increasing Block 3 15,000
Columbia County 101,967 1 Yes Monthly By Meter Size 0 Uniform Rate
Columbus Water Works 229,000 1 No Monthly By Meter Size 0 Increasing Block 2 11,220
Comer 1,380 1 No Monthly Constant 1,500 Uniform Rate 225%
Commerce 6,819 1 No Monthly Constant 0 Uniform Rate 142%
Concord 741 1 No Monthly Constant 2,000 Uniform Rate 102%
Consolidated Utilities, Inc. - 0 No Monthly Constant 0 Increasing Block 3 5,000
Consolidated Utilities, Inc. - Coastal Water & Sewerage, LLC - 21
Centre - 0 No Monthly None 0 Non-Volumetric Flat Charge
Consolidated Utilities, Inc. - Coastal Water & Sewerage, LLC -
Cypress Lakes - 0 No Monthly None 0 Non-Volumetric Flat Charge
Consolidated Utilities, Inc. - Coastal Water & Sewerage, LLC -
Little Neck Plantation - 0 No Monthly Constant 0 Uniform Rate with a Cap
Consolidated Utilities, Inc. - Coastal Water & Sewerage, LLC -
Rebel Estates - 0 No Monthly None 0 Non-Volumetric Flat Charge
Consolidated Utilities, Inc. - Coastal Water & Sewerage, LLC -
Ridgecrest, Park of Commerce, Millcreek - 0 No Monthly Constant 0 Increasing Block 2 5,000
Consolidated Utilities, Inc. - Coastal Water & Sewerage, LLC -
Sandy Woods, South Pointe, Southern Hills, White Bluff,
Mingledorff, Cottonvale
- 0 No Monthly Constant 5,000 Uniform Rate
Consolidated Utilities, Inc. - Coastal Water Company - 0 No Monthly Constant 0 Increasing Block 2 5,000
Consolidated Utilities, Inc. - Coastal Water Company - Rate 2 - 0 No Monthly Constant 0 Increasing Block 2 5,000
Consolidated Utilities, Inc. - Golden Isles - 0 No Monthly Constant 5,000 Uniform Rate
Consolidated Utilities, Inc. - Whitemarsh Estates - 0 No Monthly Constant 5,000 Uniform Rate
Consolidated Utilities, Inc. - Woodlawn - 0 No Monthly Constant 5,000 Uniform Rate
Coolidge 692 1 Yes Monthly Constant 0 Uniform Rate 129%
Coosa Water Authority 3,944 1 Yes Monthly Constant 2,000 Increasing Block 2 6,000
Cordele 10,691 1 No Monthly Constant 0 Uniform Rate 149%
Cornelia 6,130 1 Yes Monthly Constant 2,000 Increasing Block 4 50,000 112%
Covington 20,379 1 No Monthly Constant 3,000 Increasing Block 2 50,000
Coweta County Water and Sewer Authority 59,800 1 Yes Monthly Constant 0 Increasing Block 4 5,000
Crawford 1,170 1 No Monthly Constant 2,000 Increasing Block 2 10,000 125%
Crawford County 1,625 1 No Monthly Constant 1,000 Uniform Rate
Crawfordville 582 1 No Monthly Constant 1,500 Increasing Block 3 5,000 150%
Cumming 47,541 1 Yes Monthly Constant 3,000 Uniform Rate 129%
Cusseta-Chattahoochee County 3,300 1 Yes Monthly By Meter Size 2,000 Uniform Rate
Service Population is approximated and may not be actual.
Source: 1=EPA SDWIS 2017, 2=Census Population in 2016
Georgia Environmental Finance Authority
and Environmental Finance Center

Utility / Rate Structure
Different
than
Residential
Water Rate
Structure?
Billing Period
(Monthly,
Bimonthly,
Quarterly, Other)
Base Charge
Pricing
Monthly Gallons
Provided with
Base Charge
(Allowance)
Commercial Water Rate
Structure
Number
of
Blocks
First Block
Maximum
(Monthly
Gallons)
Outside/Inside
Bill Differential at
25,000 Gallons
Rate Table 7: 2017 Water Rate Structures for Commercial Customers
Service
Population
(Approx.)
Cuthbert 2,613 1 No Monthly Constant 2,000 Increasing Block 2 5,000 108%
Dade County Water and Sewer Authority 36,400 1 Yes Monthly Constant 2,000 Uniform Rate
Dade County Water and Sewer Authority - Canyon Ridge 36,400 1 No Monthly Constant 2,000 Uniform Rate
Dade County Water and Sewer Authority - Flintstone 36,400 1 No Monthly Constant 2,000 Uniform Rate
Dade County Water and Sewer Authority - Mountain (Pumped 2x) 36,400 1 Yes Monthly Constant 2,000 Uniform Rate
Dade County Water and Sewer Authority - Mountain (Pumped 3x) 36,400 1 No Monthly Constant 2,000 Uniform Rate
Dade County Water and Sewer Authority - North End
Dade County Water and Sewer Authority - South End
Dade County Water and Sewer Authority - Valley 36,400 1 Yes Monthly Constant 2,000 Uniform Rate
Dahlonega 4,120 1 Yes Monthly By Meter Size 0 Increasing Block 3 8,000
Daisy 117 1 No Monthly Constant 3,000 Increasing Block 3 5,000
Dallas 7,556 1 Yes Monthly None 0 Increasing Block 4 6,000 123%
Damascus 239 1 Yes Monthly None 0 Non-Volumetric Flat Charge
Danielsville 1,092 1 No Monthly Constant 2,000 Increasing Block 3 6,000 163%
Danville 393 1 No Monthly Constant 2,000 Uniform Rate
Darien 3,242 1 No Monthly Constant 0 Increasing Block 5 5,000 144%
Davisboro 1,535 1 Yes Monthly Constant 0 Increasing Block 2 2,000
Dawson 4,836 1 Yes Monthly Constant 1,000 Uniform Rate
Dawsonville 2,424 1 Yes Monthly Constant 1,500 Increasing Block 3 5,000 115%
Decatur Consolidated Water Services, Inc. - Doublegate Phase VI - 0 No Monthly Constant 2,000 Uniform Rate
Decatur Consolidated Water Services, Inc. - Holly Isles - 0 No Monthly Constant 5,000 Uniform Rate
Decatur Consolidated Water Services, Inc. - Pebble Hill Estates - 0 No Monthly Constant 2,000 Uniform Rate
Decatur Consolidated Water Services, Inc. - Redrock Estates - 0 No Monthly Constant 5,000 Uniform Rate
Decatur Consolidated Water Services, Inc. - Riverbend Estates - 0 No Monthly Constant 2,000 Uniform Rate
Decatur Consolidated Water Services, Inc. - Woodcrest
Subdivision - 0 No Monthly Constant 3,000 Uniform Rate
Deepstep 133 1 No Monthly Constant 1,000 Uniform Rate
Dekalb County 670,000 1 Yes Bi-monthly By Meter Size 0 Uniform Rate
Demorest 15,130 1 Yes Monthly Constant 2,000 Increasing Block 3 10,000 110%
Denton 253 1 No Monthly Constant 2,000 Decreasing Block 2 5,000
Dexter 1,976 1 Yes Monthly Constant 2,000 Increasing Block 4 5,000 113%
Dillard 133 1 No Monthly Constant 1,000 Uniform Rate
Doerun 967 1 No Monthly Constant 0 Increasing Block 6 2,000
Service Population is approximated and may not be actual.
Source: 1=EPA SDWIS 2017, 2=Census Population in 2016
Georgia Environmental Finance Authority
and Environmental Finance Center

Utility / Rate Structure
Different
than
Residential
Water Rate
Structure?
Billing Period
(Monthly,
Bimonthly,
Quarterly, Other)
Base Charge
Pricing
Monthly Gallons
Provided with
Base Charge
(Allowance)
Commercial Water Rate
Structure
Number
of
Blocks
First Block
Maximum
(Monthly
Gallons)
Outside/Inside
Bill Differential at
25,000 Gallons
Rate Table 7: 2017 Water Rate Structures for Commercial Customers
Service
Population
(Approx.)
Donalsonville 2,782 1 Yes Monthly Constant 0 Increasing Block 6 5,000
Dooling 99,315 1 No Monthly Constant 1,000 Uniform Rate
Douglas 10,688 1 Yes Monthly Constant 0 Decreasing Block 4 10,000
Douglasville-Douglas County Water and Sewer Authority 109,694 1 No Monthly By Meter Size 0 Increasing Block 3 5,000
Du Pont 120 1 No Monthly None 0 Non-Volumetric Flat Charge
Dublin 17,500 1 No Monthly By Meter Size 2,000 Uniform Rate 196%
Dudley 546 1 No Monthly Constant 2,000 Uniform Rate
East Dublin 2,657 1 Yes Monthly Constant 2,100 Uniform Rate 161%
East Point 33,712 1 No Monthly By Meter Size 3,000 Increasing Block 3 7,000
Eastman 7,491 1 Yes Monthly Constant 0 Uniform Rate 140%
Eatonton-Putnam Water and Sewer Authority 12,272 1 No Monthly By Meter Size 1,000 Increasing Block 6 2,000 104%
Echols County Water Authority 824 1 No Monthly Constant 4,000 Uniform Rate
Edison 1,331 1 Yes Monthly Constant 2,000 Uniform Rate
Effingham County 7,700 1 Yes Monthly Constant 0 Increasing Block 3 5,000
Elberton 7,800 1 No Monthly By Meter Size 0 Decreasing Block 2 149,600 147%
Ellaville 2,779 1 Yes Monthly Constant 0 Increasing Block 6 2,000 139%
Ellenton 374 1 Yes Monthly Constant 3,000 Increasing/Decreasing Block 4 4,000
Ellijay-Gilmer County Water and Sewer Authority 13,010 1 Yes Monthly Constant 0 Increasing Block 5 5,000
Emerson 1,394 1 Yes Monthly By Meter Size 0 Uniform Rate 140%
Enigma 1,113 1 No Monthly Constant 3,500 Uniform Rate
Ephesus 1,352 1 Yes Monthly Constant 17,000 Uniform Rate
Etowah Water and Sewer Authority 13,843 1 Yes Monthly By Meter Size 0 Uniform Rate
Fairburn 13,693 1 Yes Monthly Constant 0 Seasonal Uniform Rate 125%
Fairmount 130 1 Yes Monthly By Meter Size 1,000 Increasing Block 3 3,000
Fargo 380 1 Yes Monthly Constant 3,000 Uniform Rate
Fayette County 74,163 1 Yes Monthly By Meter Size 2,000 Uniform Rate
Fayetteville 15,281 1 Yes Monthly Constant 2,000 Uniform Rate
Fitzgerald Water Light and Bond Commission 12,935 1 Yes Monthly Constant 0 Uniform Rate
Flovilla 1,438 1 Yes Monthly Constant 6,000 Uniform Rate
Flowery Branch 2,920 1 Yes Monthly Constant 7,000 Increasing Block 2 60,000 133%
Floyd County 41,738 1 No Monthly By Meter Size 2,000 Uniform Rate
Folkston 5,940 1 Yes Monthly Constant 3,000 Uniform Rate
Forest Heights Water Works, Inc. - 0 No Monthly Constant 6,000 Increasing Block 3 12,000
Forsyth 7,400 1 No Monthly Constant 2,000 Decreasing Block 3 5,000 148%
Service Population is approximated and may not be actual.
Source: 1=EPA SDWIS 2017, 2=Census Population in 2016
Georgia Environmental Finance Authority
and Environmental Finance Center
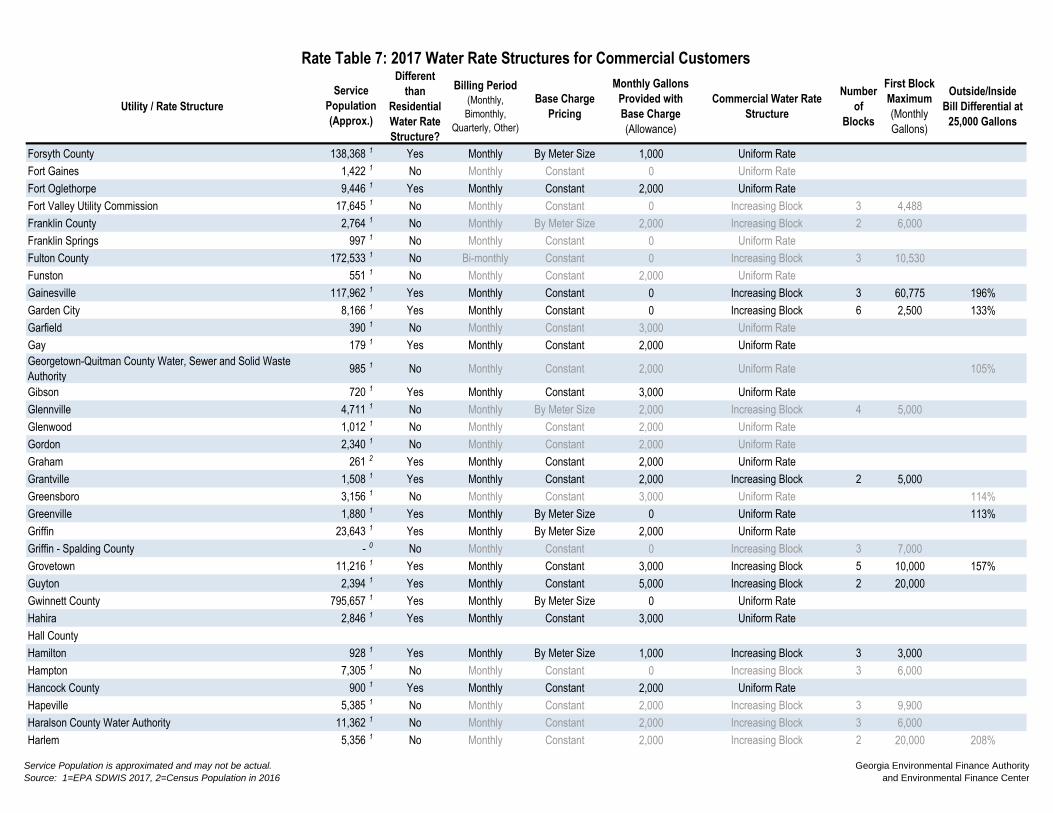
Utility / Rate Structure
Different
than
Residential
Water Rate
Structure?
Billing Period
(Monthly,
Bimonthly,
Quarterly, Other)
Base Charge
Pricing
Monthly Gallons
Provided with
Base Charge
(Allowance)
Commercial Water Rate
Structure
Number
of
Blocks
First Block
Maximum
(Monthly
Gallons)
Outside/Inside
Bill Differential at
25,000 Gallons
Rate Table 7: 2017 Water Rate Structures for Commercial Customers
Service
Population
(Approx.)
Forsyth County 138,368 1 Yes Monthly By Meter Size 1,000 Uniform Rate
Fort Gaines 1,422 1 No Monthly Constant 0 Uniform Rate
Fort Oglethorpe 9,446 1 Yes Monthly Constant 2,000 Uniform Rate
Fort Valley Utility Commission 17,645 1 No Monthly Constant 0 Increasing Block 3 4,488
Franklin County 2,764 1 No Monthly By Meter Size 2,000 Increasing Block 2 6,000
Franklin Springs 997 1 No Monthly Constant 0 Uniform Rate
Fulton County 172,533 1 No Bi-monthly Constant 0 Increasing Block 3 10,530
Funston 551 1 No Monthly Constant 2,000 Uniform Rate
Gainesville 117,962 1 Yes Monthly Constant 0 Increasing Block 3 60,775 196%
Garden City 8,166 1 Yes Monthly Constant 0 Increasing Block 6 2,500 133%
Garfield 390 1 No Monthly Constant 3,000 Uniform Rate
Gay 179 1 Yes Monthly Constant 2,000 Uniform Rate
Georgetown-Quitman County Water, Sewer and Solid Waste
Authority 985 1 No Monthly Constant 2,000 Uniform Rate 105%
Gibson 720 1 Yes Monthly Constant 3,000 Uniform Rate
Glennville 4,711 1 No Monthly By Meter Size 2,000 Increasing Block 4 5,000
Glenwood 1,012 1 No Monthly Constant 2,000 Uniform Rate
Gordon 2,340 1 No Monthly Constant 2,000 Uniform Rate
Graham 261 2 Yes Monthly Constant 2,000 Uniform Rate
Grantville 1,508 1 Yes Monthly Constant 2,000 Increasing Block 2 5,000
Greensboro 3,156 1 No Monthly Constant 3,000 Uniform Rate 114%
Greenville 1,880 1 Yes Monthly By Meter Size 0 Uniform Rate 113%
Griffin 23,643 1 Yes Monthly By Meter Size 2,000 Uniform Rate
Griffin - Spalding County - 0 No Monthly Constant 0 Increasing Block 3 7,000
Grovetown 11,216 1 Yes Monthly Constant 3,000 Increasing Block 5 10,000 157%
Guyton 2,394 1 Yes Monthly Constant 5,000 Increasing Block 2 20,000
Gwinnett County 795,657 1 Yes Monthly By Meter Size 0 Uniform Rate
Hahira 2,846 1 Yes Monthly Constant 3,000 Uniform Rate
Hall County
Hamilton 928 1 Yes Monthly By Meter Size 1,000 Increasing Block 3 3,000
Hampton 7,305 1 No Monthly Constant 0 Increasing Block 3 6,000
Hancock County 900 1 Yes Monthly Constant 2,000 Uniform Rate
Hapeville 5,385 1 No Monthly Constant 2,000 Increasing Block 3 9,900
Haralson County Water Authority 11,362 1 No Monthly Constant 2,000 Increasing Block 3 6,000
Harlem 5,356 1 No Monthly Constant 2,000 Increasing Block 2 20,000 208%
Service Population is approximated and may not be actual.
Source: 1=EPA SDWIS 2017, 2=Census Population in 2016
Georgia Environmental Finance Authority
and Environmental Finance Center

Utility / Rate Structure
Different
than
Residential
Water Rate
Structure?
Billing Period
(Monthly,
Bimonthly,
Quarterly, Other)
Base Charge
Pricing
Monthly Gallons
Provided with
Base Charge
(Allowance)
Commercial Water Rate
Structure
Number
of
Blocks
First Block
Maximum
(Monthly
Gallons)
Outside/Inside
Bill Differential at
25,000 Gallons
Rate Table 7: 2017 Water Rate Structures for Commercial Customers
Service
Population
(Approx.)
Harris County 20,062 1 Yes Monthly Constant 1,000 Uniform Rate
Harrison 500 1 No Monthly Constant 2,000 Uniform Rate
Hart County Water and Sewer Authority 3,606 1 Yes Monthly By Meter Size 1,000 Uniform Rate
Hartford Water Authority 487 1 Yes Monthly Constant 10,000 Decreasing Block 2 75,000
Hartwell 7,116 1 No Monthly Constant 2,000 Uniform Rate 140%
Hawkinsville 4,856 1 Yes Monthly Constant 2,500 Uniform Rate 120%
Hazlehurst 5,800 1 No Monthly Constant 2,000 Uniform Rate 150%
Heard County Water Authority 8,172 1 Yes Monthly By Meter Size 0 Uniform Rate
Helen 1,851 1 Yes Monthly Constant 0 Increasing Block 3 5,000 155%
Henry County Water Authority 218,667 1 Yes Monthly By Meter Size 0 Uniform Rate 150%
Hephzibah 4,500 1 No Monthly By Meter Size 2,500 Increasing Block 2 10,000
Hiawassee - above booster 5,496 1 Yes Monthly By Meter Size 1,000 Uniform Rate 111%
Hiawassee - below booster 5,496 1 Yes Monthly By Meter Size 1,000 Uniform Rate 111%
Hiltonia 392 1 No Monthly Constant 4,000 Increasing Block 4 6,000
Hinesville 23,400 1 No Monthly Constant 3,000 Increasing Block 4 7,000 150%
Hiram 858 1 No Monthly Constant 2,000 Increasing Block 3 6,000
Hoboken 463 1 No Monthly Constant 0 Increasing Block 6 5,000
Hogansville 3,728 1 Yes Monthly By Meter Size 0 Uniform Rate 144%
Homeland 995 1 Yes Monthly Constant 6,000 Increasing Block 2 15,000
Homer 950 1 Yes Monthly Constant 3,000 Uniform Rate
Hoschton 1,547 1 Yes Monthly Constant 0 Increasing Block 3 10,450
Houston County 69,747 1 Yes Monthly Constant 2,500 Uniform Rate
Ideal 450 1 Yes Monthly Constant 1,000 Uniform Rate
Ila 437 1 No Monthly Constant 2,000 Decreasing Block 2 6,000
Iron City 411 1 No Monthly None 0 Non-Volumetric Flat Charge
Irwinton 1,817 1 Yes Monthly Constant 2,000 Uniform Rate 104%
Ivey 1,086 1 No Monthly Constant 2,000 Uniform Rate
Jackson 4,950 2 No Monthly Constant 2,000 Uniform Rate 145%
Jackson County Water and Sewer Authority 19,191 1 Yes Monthly By Meter Size 0 Increasing Block 3 14,600
Jacksonville 200 1 No Monthly None 0 Non-Volumetric Flat Charge
Jakin 252 1 Yes Monthly Constant 6,000 Uniform Rate
Jasper 9,850 1 Yes Monthly By Meter Size 0 Uniform Rate 127%
Jekyll Island Authority 2,083 1 Yes Monthly Constant 0 Increasing Block 4 7,499
Jenkinsburg 366 2 No Monthly Constant 2,000 Uniform Rate 116%
Service Population is approximated and may not be actual.
Source: 1=EPA SDWIS 2017, 2=Census Population in 2016
Georgia Environmental Finance Authority
and Environmental Finance Center

Utility / Rate Structure
Different
than
Residential
Water Rate
Structure?
Billing Period
(Monthly,
Bimonthly,
Quarterly, Other)
Base Charge
Pricing
Monthly Gallons
Provided with
Base Charge
(Allowance)
Commercial Water Rate
Structure
Number
of
Blocks
First Block
Maximum
(Monthly
Gallons)
Outside/Inside
Bill Differential at
25,000 Gallons
Rate Table 7: 2017 Water Rate Structures for Commercial Customers
Service
Population
(Approx.)
Jesup 10,200 1 Yes Monthly Constant 0 Increasing Block 6 2,000
Jones County 10,795 1 No Monthly By Meter Size 2,000 Uniform Rate
Keysville 351 1 Yes Monthly Constant 2,000 Uniform Rate
Kingsland 18,697 1 Yes Monthly Constant 0 Increasing Block 2 6,000 150%
Kingston 1,263 1 Yes Monthly By Meter Size 0 Increasing Block 2 5,000 145%
Kite 241 1 No Monthly Constant 2,000 Uniform Rate
LaFayette 18,177 1 No Monthly By Meter Size 0 Uniform Rate 150%
LaGrange 41,852 1 No Monthly Constant 0 Decreasing Block 5 25,000 150%
Lake Park 595 1 No Monthly Constant 2,000 Uniform Rate
Lakeland 2,922 1 No Monthly Constant 1,000 Uniform Rate
Lavonia 8,008 1 Yes Monthly Constant 2,000 Uniform Rate 110%
Lawrenceville 24,000 1 Yes Monthly Constant 2,000 Uniform Rate
Lee County Utility Authority 13,500 1 No Monthly Constant 0 Increasing Block 4 9,000
Leesburg 3,003 1 No Monthly Constant 0 Uniform Rate 115%
Lenox 1,011 1 Yes Monthly Constant 0 Increasing Block 5 5,000 150%
Leslie 445 1 Yes Monthly Constant 1,000 Increasing Block 2 10,000
Lexington 796 1 No Monthly Constant 3,000 Uniform at One Block's Rate 2 6,000 106%
Liberty County - 0 Yes Monthly By Meter Size 2,000 Increasing Block 4 6,000
Lincoln County 3,256 1 No Monthly By Meter Size 1,500 Uniform Rate
Lincolnton 1,657 1 No Monthly By Meter Size 1,500 Uniform Rate
Locust Grove 5,648 1 No Monthly Constant 2,000 Increasing Block 2 10,000
Loganville 10,923 1 Yes Monthly Constant 2,000 Increasing Block 3 8,000
Lone Oak 276 1 No Monthly Constant 0 Uniform Rate 101%
Lookout Mountain
Louisville 2,575 1 Yes Monthly Constant 2,000 Uniform Rate
Lowndes County 13,988 1 No Monthly Constant 3,000 Increasing Block 4 6,000
Ludowici 1,651 1 Yes Monthly Constant 0 Increasing Block 5 5,000
Lula 2,714 1 No Monthly Constant 0 Increasing Block 5 5,000 126%
Lumber City 993 1 No Monthly Constant 4,000 Uniform Rate
Lumpkin 1,386 1 Yes Monthly Constant 0 Increasing Block 5 2,000 130%
Lumpkin County Water and Sewer Authority 3,226 1 Yes Monthly By Meter Size 0 Increasing Block 5 4,500
Luthersville 1,274 1 Yes Monthly Constant 2,000 Uniform Rate
Lyerly 1,360 1 Yes Monthly Constant 2,500 Uniform Rate 100%
Lyons 4,100 1 No Monthly Constant 3,000 Increasing Block 2 10,000 200%
Service Population is approximated and may not be actual.
Source: 1=EPA SDWIS 2017, 2=Census Population in 2016
Georgia Environmental Finance Authority
and Environmental Finance Center

Utility / Rate Structure
Different
than
Residential
Water Rate
Structure?
Billing Period
(Monthly,
Bimonthly,
Quarterly, Other)
Base Charge
Pricing
Monthly Gallons
Provided with
Base Charge
(Allowance)
Commercial Water Rate
Structure
Number
of
Blocks
First Block
Maximum
(Monthly
Gallons)
Outside/Inside
Bill Differential at
25,000 Gallons
Rate Table 7: 2017 Water Rate Structures for Commercial Customers
Service
Population
(Approx.)
Macon Water Authority - Bibb County 130,024 1 Yes Monthly By Meter Size 0 Uniform Rate
Macon Water Authority - Jones County 130,024 1 No Monthly By Meter Size 2,000 Uniform Rate
Macon Water Authority - Monroe County 130,024 1 No Monthly By Meter Size 0 Uniform Rate
Madison 5,215 1 No Monthly By Meter Size 0 Uniform Rate
Manchester 4,995 1 No Monthly Constant 0 Uniform Rate 167%
Mansfield 791 1 Yes Monthly Constant 0 Increasing Block 2 10,000
Marietta Power and Water 60,100 1 Yes Monthly By Meter Size 2,000 Uniform Rate
Marion County 3,783 1 Yes Monthly Constant 2,000 Increasing Block 5 5,000
Marshallville 1,241 1 No Monthly Constant 0 Increasing Block 4 2,000
Martin 1,599 1 No Monthly Constant 3,000 Decreasing Block 3 20,000 103%
Maxeys 325 1 No Monthly Constant 1,500 Increasing Block 3 6,000 107%
Maysville 2,057 1 No Monthly By Meter Size 2,000 Increasing Block 4 20,000 106%
McCaysville 7,020 1 Yes Monthly Constant 0 Uniform Rate 150%
McDonough 8,962 1 Yes Monthly By Meter Size 0 Uniform Rate
McIntosh County 2,808 1 No Monthly Constant 1,000 Increasing Block 2 5,000
McIntyre 684 1 Yes Monthly Constant 2,000 Uniform Rate
McRae-Helena 5,488 1 No Monthly Constant 2,000 Decreasing Block 7 3,000 150%
Meansville 263 1 No Monthly Constant 2,000 Uniform Rate
Meigs 1,154 1 Yes Monthly Constant 0 Increasing Block 2 2,000 171%
Menlo 949 1 No Monthly Constant 2,000 Uniform Rate 206%
Metter 4,776 1 No Monthly Constant 1,000 Increasing Block 6 3,000
Midville 700 1 No Monthly Constant 0 Increasing Block 5 5,000 148%
Midway 2,595 1 Yes Monthly Constant 0 Increasing Block 6 2,000 116%
Milledgeville 19,456 1 No Monthly Constant 3,000 Uniform Rate 164%
Millen 4,000 1 No Monthly Constant 0 Increasing Block 3 9,000 142%
Milner 902 1 No Monthly Constant 2,000 Increasing Block 3 5,000 111%
Mitchell 325 1 No Monthly Constant 1,000 Uniform Rate 116%
Molena 467 1 No Monthly Constant 2,000 Increasing Block 2 7,000
Monroe 21,739 1 Yes Monthly By Meter Size 0 Uniform Rate 149%
Monroe County 6,653 1 Yes Monthly By Meter Size 1,000 Uniform Rate
Montezuma 3,443 1 Yes Monthly Constant 0 Increasing Block 4 2,000
Monticello 3,505 1 No Monthly Constant 2,000 Increasing Block 3 4,000
Morganton 2,060 1 Yes Monthly Constant 2,000 Uniform Rate
Morven 601 1 No Monthly Constant 0 Increasing Block 5 2,000
Service Population is approximated and may not be actual.
Source: 1=EPA SDWIS 2017, 2=Census Population in 2016
Georgia Environmental Finance Authority
and Environmental Finance Center
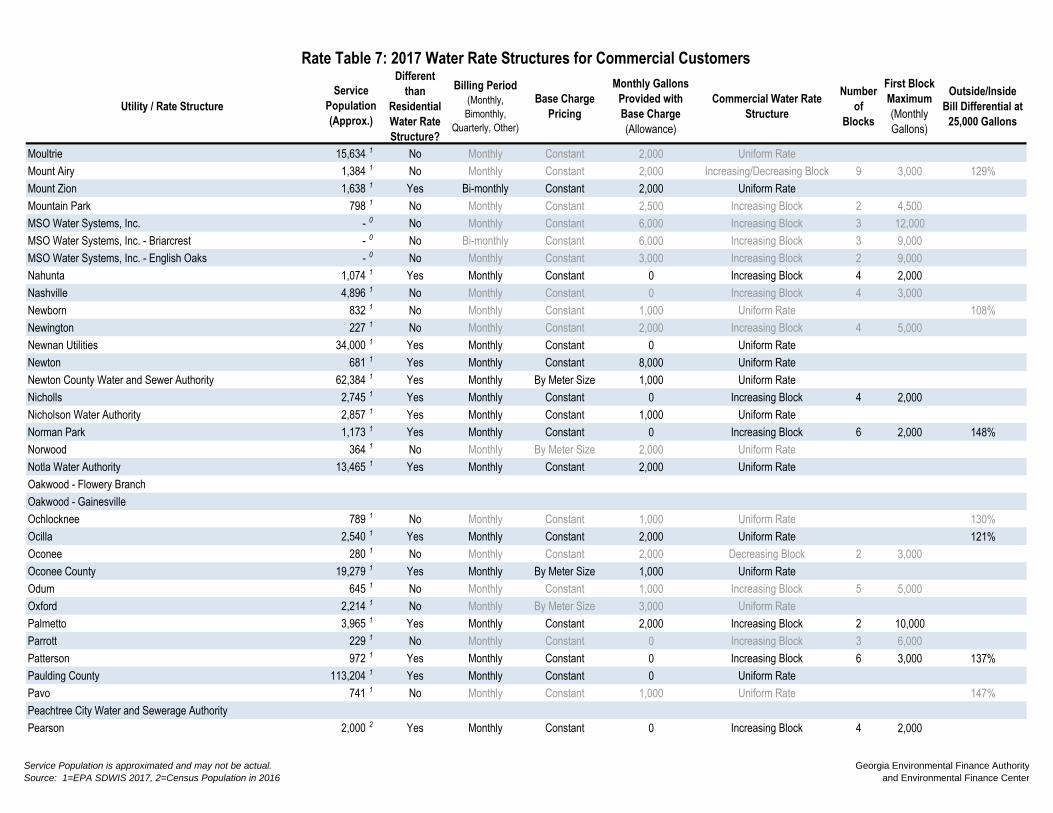
Utility / Rate Structure
Different
than
Residential
Water Rate
Structure?
Billing Period
(Monthly,
Bimonthly,
Quarterly, Other)
Base Charge
Pricing
Monthly Gallons
Provided with
Base Charge
(Allowance)
Commercial Water Rate
Structure
Number
of
Blocks
First Block
Maximum
(Monthly
Gallons)
Outside/Inside
Bill Differential at
25,000 Gallons
Rate Table 7: 2017 Water Rate Structures for Commercial Customers
Service
Population
(Approx.)
Moultrie 15,634 1 No Monthly Constant 2,000 Uniform Rate
Mount Airy 1,384 1 No Monthly Constant 2,000 Increasing/Decreasing Block 9 3,000 129%
Mount Zion 1,638 1 Yes Bi-monthly Constant 2,000 Uniform Rate
Mountain Park 798 1 No Monthly Constant 2,500 Increasing Block 2 4,500
MSO Water Systems, Inc. - 0 No Monthly Constant 6,000 Increasing Block 3 12,000
MSO Water Systems, Inc. - Briarcrest - 0 No Bi-monthly Constant 6,000 Increasing Block 3 9,000
MSO Water Systems, Inc. - English Oaks - 0 No Monthly Constant 3,000 Increasing Block 2 9,000
Nahunta 1,074 1 Yes Monthly Constant 0 Increasing Block 4 2,000
Nashville 4,896 1 No Monthly Constant 0 Increasing Block 4 3,000
Newborn 832 1 No Monthly Constant 1,000 Uniform Rate 108%
Newington 227 1 No Monthly Constant 2,000 Increasing Block 4 5,000
Newnan Utilities 34,000 1 Yes Monthly Constant 0 Uniform Rate
Newton 681 1 Yes Monthly Constant 8,000 Uniform Rate
Newton County Water and Sewer Authority 62,384 1 Yes Monthly By Meter Size 1,000 Uniform Rate
Nicholls 2,745 1 Yes Monthly Constant 0 Increasing Block 4 2,000
Nicholson Water Authority 2,857 1 Yes Monthly Constant 1,000 Uniform Rate
Norman Park 1,173 1 Yes Monthly Constant 0 Increasing Block 6 2,000 148%
Norwood 364 1 No Monthly By Meter Size 2,000 Uniform Rate
Notla Water Authority 13,465 1 Yes Monthly Constant 2,000 Uniform Rate
Oakwood - Flowery Branch
Oakwood - Gainesville
Ochlocknee 789 1 No Monthly Constant 1,000 Uniform Rate 130%
Ocilla 2,540 1 Yes Monthly Constant 2,000 Uniform Rate 121%
Oconee 280 1 No Monthly Constant 2,000 Decreasing Block 2 3,000
Oconee County 19,279 1 Yes Monthly By Meter Size 1,000 Uniform Rate
Odum 645 1 No Monthly Constant 1,000 Increasing Block 5 5,000
Oxford 2,214 1 No Monthly By Meter Size 3,000 Uniform Rate
Palmetto 3,965 1 Yes Monthly Constant 2,000 Increasing Block 2 10,000
Parrott 229 1 No Monthly Constant 0 Increasing Block 3 6,000
Patterson 972 1 Yes Monthly Constant 0 Increasing Block 6 3,000 137%
Paulding County 113,204 1 Yes Monthly Constant 0 Uniform Rate
Pavo 741 1 No Monthly Constant 1,000 Uniform Rate 147%
Peachtree City Water and Sewerage Authority
Pearson 2,000 2 Yes Monthly Constant 0 Increasing Block 4 2,000
Service Population is approximated and may not be actual.
Source: 1=EPA SDWIS 2017, 2=Census Population in 2016
Georgia Environmental Finance Authority
and Environmental Finance Center

Utility / Rate Structure
Different
than
Residential
Water Rate
Structure?
Billing Period
(Monthly,
Bimonthly,
Quarterly, Other)
Base Charge
Pricing
Monthly Gallons
Provided with
Base Charge
(Allowance)
Commercial Water Rate
Structure
Number
of
Blocks
First Block
Maximum
(Monthly
Gallons)
Outside/Inside
Bill Differential at
25,000 Gallons
Rate Table 7: 2017 Water Rate Structures for Commercial Customers
Service
Population
(Approx.)
Pelham 3,601 1 No Monthly Constant 1,000 Uniform Rate 130%
Pembroke 2,571 1 Yes Monthly By Meter Size 500 Increasing/Decreasing Block 6 2,000
Perkins Water Authority 140 1 No Monthly Constant 2,000 Uniform Rate
Pickens County Water Authority 6,357 1 No Monthly By Meter Size 1,000 Increasing Block 3 3,000
Piedmont Water Co. - Lake Oconee - 0 Yes Monthly Constant 3,000 Increasing Block 4 5,000
Pike County Water and Sewer Authority 434 1 Yes Monthly Constant 2,000 Uniform Rate
Pine Mountain 1,697 1 No Monthly Constant 1,000 Uniform Rate 141%
Pinehurst 460 1 Yes Monthly Constant 2,000 Uniform Rate
Pineview 512 1 No Monthly Constant 6,000 Uniform Rate
Pitts 590 1 No Monthly Constant 3,000 Uniform Rate
Plains 892 1 Yes Monthly Constant 1,000 Increasing Block 5 5,000 124%
Polk County Water Authority 24,061 1 No Monthly Constant 2,000 Increasing/Decreasing Block 4 7,000
Polk County Water Authority - Vinson Mountain 24,061 1 No Monthly Constant 2,000 Increasing Block 4 7,000
Pooler 21,187 1 Yes Monthly Constant 5,000 Increasing Block 3 25,000
Port Wentworth 4,160 1 Yes Monthly Constant 0 Increasing Block 3 3,740 122%
Portal 879 1 No Monthly Constant 2,000 Increasing Block 4 10,000 118%
Poulan 2,002 1 Yes Monthly Constant 0 Uniform Rate
Powder Springs 14,000 1 Yes Monthly Constant 0 Increasing Block 6 2,000
Pulaski 280 1 No Monthly Constant 3,000 Increasing Block 3 7,000
Quitman 4,942 1 No Monthly Constant 0 Increasing Block 3 2,000
Rabun County Water and Sewer Authority - 0 No Monthly Constant 2,000 Uniform Rate
Randolph County Water Authority 231 1 No Monthly Constant 2,000 Uniform Rate
Ray City 845 1 Yes Monthly Constant 0 Uniform Rate 145%
Register 182 1 Yes Monthly Constant 0 Increasing Block 5 5,000
Remerton 1,479 1 No Monthly Constant 0 Uniform Rate
Rentz 310 1 Yes Monthly Constant 2,000 Uniform Rate
Reynolds 1,373 1 Yes Monthly Constant 2,000 Uniform Rate 157%
Rhine 413 1 No Monthly None 0 Non-Volumetric Flat Charge
Riceboro 1,131 1 Yes Monthly Constant 1,000 Increasing Block 5 5,000
Richland 1,323 1 No Monthly None 0 Non-Volumetric Flat Charge 119%
Richmond Hill 11,258 1 Yes Monthly Constant 0 Uniform Rate 150%
Riddleville 128 1 No Monthly Constant 2,000 Uniform Rate
Rincon 9,880 1 Yes Monthly Constant 3,000 Increasing Block 4 9,000 121%
Ringgold 2,743 1 No Monthly By Meter Size 2,000 Uniform Rate
Service Population is approximated and may not be actual.
Source: 1=EPA SDWIS 2017, 2=Census Population in 2016
Georgia Environmental Finance Authority
and Environmental Finance Center

Utility / Rate Structure
Different
than
Residential
Water Rate
Structure?
Billing Period
(Monthly,
Bimonthly,
Quarterly, Other)
Base Charge
Pricing
Monthly Gallons
Provided with
Base Charge
(Allowance)
Commercial Water Rate
Structure
Number
of
Blocks
First Block
Maximum
(Monthly
Gallons)
Outside/Inside
Bill Differential at
25,000 Gallons
Rate Table 7: 2017 Water Rate Structures for Commercial Customers
Service
Population
(Approx.)
Ringgold - Dalton
Ringgold - Meadows
Roberta 1,615 1 Yes Monthly Constant 0 Increasing Block 3 40,000
Rochelle 1,581 1 No Monthly Constant 0 Uniform Rate 103%
Rockdale County Water and Sewer Authority 72,621 1 Yes Monthly By Meter Size 0 Uniform Rate
Rockmart 6,500 1 No Monthly Constant 2,000 Increasing Block 5 10,000 150%
Rocky Ford 165 1 No Monthly Constant 3,000 Increasing Block 3 5,000
Rome - Zone 1 45,586 1 No Monthly By Meter Size 748 Uniform Rate
Rome - Zone 2 45,586 1 No Monthly By Meter Size 748 Uniform Rate
Rome - Zone 3 45,586 1 No Monthly By Meter Size 0 Uniform Rate
Rome - Zone 4 45,586 1 No Monthly By Meter Size 748 Uniform Rate
Roopville 252 1 No Bi-monthly Constant 1,000 Increasing Block 6 3,000
Roswell 14,300 1 Yes Monthly By Meter Size 0 Increasing Block 3 50,000
Royston 2,800 1 Yes Monthly By Meter Size 0 Uniform Rate
Rutledge 918 1 No Monthly Constant 2,000 Increasing Block 3 6,000
Saint Marys 17,270 1 No Monthly Constant 0 Increasing Block 2 6,000
Sale City 465 1 No Monthly Constant 2,000 Increasing Block 5 5,000
Sandersville 6,100 1 No Monthly Constant 2,000 Uniform Rate 136%
Sardis 999 1 No Monthly Constant 0 Uniform Rate
Sasser 367 1 Yes Monthly Constant 3,000 Increasing Block 5 6,000
Satilla Regional Water and Sewer Authority 14,311 1 No Monthly By Meter Size 1,496 Increasing Block 6 74,800
Savannah 215,566 1 No Bi-monthly By Meter Size 15,708 Increasing Block 2 5,610 150%
Schley County 1,321 1 Yes Monthly Constant 10,000 Uniform Rate
Scotland 356 1 No Monthly Constant 4,500 Uniform Rate
Screven 840 1 No Monthly Constant 2,000 Increasing Block 5 5,000
Senoia 3,466 1 Yes Monthly Constant 1,000 Increasing Block 4 5,000
Shady Dale 398 1 Yes Monthly Constant 4,000 Uniform Rate
Shellman 1,115 1 Yes Monthly None 0 Non-Volumetric Flat Charge
Shiloh 585 1 Yes Monthly Constant 5,000 Uniform Rate
Siloam 481 1 No Monthly Constant 2,000 Uniform Rate
Sky Lake POA, Inc. - 0 No Annually None 0 Non-Volumetric Flat Charge
Sky Valley 1,877 1 Yes Monthly By Meter Size 2,000 Uniform Rate 150%
Smithville 647 1 No Monthly Constant 2,000 Uniform Rate
Smyrna 35,000 1 Yes Monthly By Meter Size 0 Uniform Rate
Service Population is approximated and may not be actual.
Source: 1=EPA SDWIS 2017, 2=Census Population in 2016
Georgia Environmental Finance Authority
and Environmental Finance Center
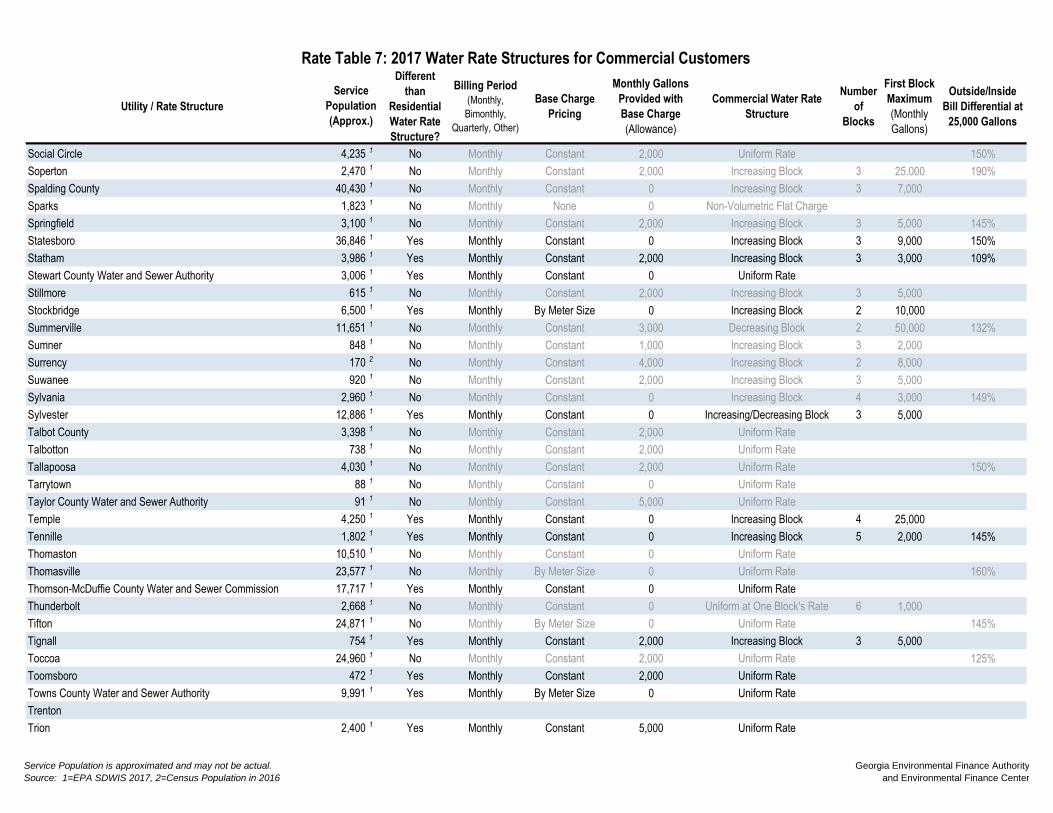
Utility / Rate Structure
Different
than
Residential
Water Rate
Structure?
Billing Period
(Monthly,
Bimonthly,
Quarterly, Other)
Base Charge
Pricing
Monthly Gallons
Provided with
Base Charge
(Allowance)
Commercial Water Rate
Structure
Number
of
Blocks
First Block
Maximum
(Monthly
Gallons)
Outside/Inside
Bill Differential at
25,000 Gallons
Rate Table 7: 2017 Water Rate Structures for Commercial Customers
Service
Population
(Approx.)
Social Circle 4,235 1 No Monthly Constant 2,000 Uniform Rate 150%
Soperton 2,470 1 No Monthly Constant 2,000 Increasing Block 3 25,000 190%
Spalding County 40,430 1 No Monthly Constant 0 Increasing Block 3 7,000
Sparks 1,823 1 No Monthly None 0 Non-Volumetric Flat Charge
Springfield 3,100 1 No Monthly Constant 2,000 Increasing Block 3 5,000 145%
Statesboro 36,846 1 Yes Monthly Constant 0 Increasing Block 3 9,000 150%
Statham 3,986 1 Yes Monthly Constant 2,000 Increasing Block 3 3,000 109%
Stewart County Water and Sewer Authority 3,006 1 Yes Monthly Constant 0 Uniform Rate
Stillmore 615 1 No Monthly Constant 2,000 Increasing Block 3 5,000
Stockbridge 6,500 1 Yes Monthly By Meter Size 0 Increasing Block 2 10,000
Summerville 11,651 1 No Monthly Constant 3,000 Decreasing Block 2 50,000 132%
Sumner 848 1 No Monthly Constant 1,000 Increasing Block 3 2,000
Surrency 170 2 No Monthly Constant 4,000 Increasing Block 2 8,000
Suwanee 920 1 No Monthly Constant 2,000 Increasing Block 3 5,000
Sylvania 2,960 1 No Monthly Constant 0 Increasing Block 4 3,000 149%
Sylvester 12,886 1 Yes Monthly Constant 0 Increasing/Decreasing Block 3 5,000
Talbot County 3,398 1 No Monthly Constant 2,000 Uniform Rate
Talbotton 738 1 No Monthly Constant 2,000 Uniform Rate
Tallapoosa 4,030 1 No Monthly Constant 2,000 Uniform Rate 150%
Tarrytown 88 1 No Monthly Constant 0 Uniform Rate
Taylor County Water and Sewer Authority 91 1 No Monthly Constant 5,000 Uniform Rate
Temple 4,250 1 Yes Monthly Constant 0 Increasing Block 4 25,000
Tennille 1,802 1 Yes Monthly Constant 0 Increasing Block 5 2,000 145%
Thomaston 10,510 1 No Monthly Constant 0 Uniform Rate
Thomasville 23,577 1 No Monthly By Meter Size 0 Uniform Rate 160%
Thomson-McDuffie County Water and Sewer Commission 17,717 1 Yes Monthly Constant 0 Uniform Rate
Thunderbolt 2,668 1 No Monthly Constant 0 Uniform at One Block's Rate 6 1,000
Tifton 24,871 1 No Monthly By Meter Size 0 Uniform Rate 145%
Tignall 754 1 Yes Monthly Constant 2,000 Increasing Block 3 5,000
Toccoa 24,960 1 No Monthly Constant 2,000 Uniform Rate 125%
Toomsboro 472 1 Yes Monthly Constant 2,000 Uniform Rate
Towns County Water and Sewer Authority 9,991 1 Yes Monthly By Meter Size 0 Uniform Rate
Trenton
Trion 2,400 1 Yes Monthly Constant 5,000 Uniform Rate
Service Population is approximated and may not be actual.
Source: 1=EPA SDWIS 2017, 2=Census Population in 2016
Georgia Environmental Finance Authority
and Environmental Finance Center

Utility / Rate Structure
Different
than
Residential
Water Rate
Structure?
Billing Period
(Monthly,
Bimonthly,
Quarterly, Other)
Base Charge
Pricing
Monthly Gallons
Provided with
Base Charge
(Allowance)
Commercial Water Rate
Structure
Number
of
Blocks
First Block
Maximum
(Monthly
Gallons)
Outside/Inside
Bill Differential at
25,000 Gallons
Rate Table 7: 2017 Water Rate Structures for Commercial Customers
Service
Population
(Approx.)
Turin 671 1 Yes Monthly Constant 2,000 Increasing Block 3 5,000
Turtle Cove POA - 0 No Monthly Constant 4,000 Increasing Block 2 10,000
Twiggs County 376 1 No Monthly Constant 2,000 Uniform Rate
Tybee Island 8,047 1 Yes Monthly Constant 3,000 Increasing Block 4 5,000
Tyrone 7,121 2 No Monthly By Meter Size 3,000 Increasing Block 2 20,000
Unadilla 3,837 1 Yes Monthly Constant 2,000 Uniform Rate
Union City 18,636 1 No Monthly By Meter Size 0 Increasing Block 2 15,000
Upson County 5,778 1 No Monthly Constant 0 Increasing Block 6 2,000
Utilities, Inc. of Georgia - The Landings - 0 No Monthly By Meter Size 0 Increasing Block 4 5,000
Utilities, Inc. of Georgia - The Orchard - 0 No Monthly Constant 3,000 Increasing Block 3 13,000
Valdosta 56,019 1 Yes Monthly By Meter Size 0 Uniform Rate 200%
Vidalia 13,050 1 No Monthly Constant 2,000 Increasing Block 4 10,000 138%
Vienna 3,666 1 Yes Monthly Constant 0 Increasing Block 4 2,000 139%
Villa Rica 13,996 1 Yes Monthly By Meter Size 1,000 Increasing Block 3 5,100 145%
Waco 913 1 No Monthly Constant 2,000 Uniform Rate 116%
Wadley 2,500 1 Yes Monthly Constant 2,000 Uniform Rate
Waleska 2,691 1 No Monthly Constant 2,000 Increasing Block 3 5,000
Walker County Rural Water and Sewer Authority 3,270 1 Yes Monthly By Meter Size 1,000 Uniform Rate
Walker County Water and Sewer Authority 36,000 1 Yes Monthly Constant 0 Uniform Rate
Walthourville 3,858 1 No Monthly Constant 1,000 Increasing Block 6 2,000 150%
Walton County Water and Sewer Authority 36,387 1 Yes Monthly By Meter Size 2,000 Increasing Block 2 12,000
Warm Springs 1,120 1 No Monthly Constant 0 Uniform Rate 117%
Warner Robins 64,163 1 Yes Monthly By Meter Size 0 Uniform Rate
Warrenton 2,800 1 Yes Monthly Constant 1,500 Uniform Rate 111%
Warwick 864 1 No Monthly Constant 0 Increasing Block 4 2,000
Washington 4,134 1 No Monthly Constant 0 Uniform Rate 150%
Water Service Company of Georgia - Lake Riverside - 0 No Monthly Constant 0 Uniform Rate
Waycross 21,154 1 Yes Monthly By Meter Size 0 Uniform Rate
Waynesboro 5,813 1 No Monthly By Meter Size 0 Uniform Rate 129%
Webster County 1,038 1 Yes Monthly Constant 25,000 Uniform Rate
West Point 3,929 1 Yes Monthly Constant 0 Increasing Block 2 11,220 124%
Whigham 879 1 No Monthly Constant 2,000 Uniform Rate
White 806 1 Yes Monthly By Meter Size 3,000 Uniform Rate 104%
White County Water Authority 4,420 1 Yes Monthly By Meter Size 1,000 Increasing Block 3 4,000
Service Population is approximated and may not be actual.
Source: 1=EPA SDWIS 2017, 2=Census Population in 2016
Georgia Environmental Finance Authority
and Environmental Finance Center

Utility / Rate Structure
Different
than
Residential
Water Rate
Structure?
Billing Period
(Monthly,
Bimonthly,
Quarterly, Other)
Base Charge
Pricing
Monthly Gallons
Provided with
Base Charge
(Allowance)
Commercial Water Rate
Structure
Number
of
Blocks
First Block
Maximum
(Monthly
Gallons)
Outside/Inside
Bill Differential at
25,000 Gallons
Rate Table 7: 2017 Water Rate Structures for Commercial Customers
Service
Population
(Approx.)
White Plains 413 1 No Monthly Constant 2,000 Uniform Rate
Whitesburg 931 1 No Bi-monthly Constant 500 Uniform Rate 145%
Willacoochee 1,940 1 Yes Monthly Constant 3,000 Uniform Rate
Williamson 408 1 Yes Monthly Constant 1,500 Increasing Block 2 4,500 129%
Winder 32,971 1 Yes Monthly By Meter Size 0 Uniform Rate 105%
Woodbine 1,508 1 Yes Monthly Constant 0 Increasing Block 3 10,000
Woodbury 961 1 Yes Monthly By Meter Size 0 Increasing Block 3 5,000
Woodstock 10,070 1 No Monthly Constant 1,000 Increasing Block 2 10,000
Wrens 2,375 1 Yes Monthly By Meter Size 1,000 Uniform Rate 121%
Service Population is approximated and may not be actual.
Source: 1=EPA SDWIS 2017, 2=Census Population in 2016
Georgia Environmental Finance Authority
and Environmental Finance Center

Compare with caution. High rates may be justified and necessary to protect public health.
Inside Outside Inside Outside Inside Outside Inside Outside Inside Outside Inside Outside Inside Outside
Adel 5,311 1 1.33 $9.13 $32.81 $69.16 $125.66 $238.66 $577.66 $1,142.66
Adrian 664 1 0.89 $62.00 $105.25 $176.50 $295.25 $532.75 $1,245.25 $2,432.75
Ailey 527 1 0.92 $15.00 $31.00 $61.00 $111.00 $211.00 $511.00 $1,011.00
Alamo 3,457 1 1.00 $10.00 $20.00 $38.75 $70.00 $132.50 $320.00 $632.50
Albany 87,029 1 1.21 $11.61 $27.11 $54.41 $99.91 $190.91 $463.91 $918.91
Alcovy Shores Water Authority 432 1 0.99 $13.00 $83.00 $188.00 $363.00 $713.00 $1,763.00 $3,513.00
Allentown 175 1 1.13 $17.50 $33.50 $63.50 $113.50 $213.50 $513.50 $1,013.50
Alma 4,700 1 1.09 $7.00 $14.00 $106.05 $212.03 $304.80 $609.38 $636.05 $1,271.63 $1,298.55 $2,596.13 $3,286.05 $6,569.63 $6,598.55 $13,192.13
Alston 169 1 1.43 $18.00 $33.25 $70.50 $139.25 $276.75 $689.25 $1,376.75
Alto 2,500 1 $40.00 $94.85 $177.35 $314.85 $614.85 $1,514.85 $3,014.85
Americus 16,255 1 1.17 $7.10 $14.20 $38.12 $76.23 $84.64 $169.28 $162.18 $324.36 $317.26 $634.52 $782.50 $1,565.00 $1,557.90 $3,115.80
Andersonville 400 1 $9.00 $33.00 $78.00 $153.00 $303.00 $753.00 $1,503.00
Arabi 429 1 0.82 $10.00 $21.40 $39.40 $69.40 $129.40 $309.40 $609.40
Argyle 211 1 1.13 $25.00 $25.00 $25.00 $25.00 $25.00 $25.00 $25.00
Arlington 1,243 1 0.86 $16.20 $56.20 $119.95 $226.20 $451.20 $1,126.20 $2,251.20
Arnoldsville 1,040 1 1.05 $18.00 $33.00 $43.00 $66.50 $103.00 $141.50 $203.00 $266.50 $403.00 $516.50 $1,003.00 $1,266.50 $2,003.00 $2,516.50
Ashburn 4,272 1 1.36 $16.00 $33.00 $84.00 $182.75 $380.25 $972.75 $1,960.25
Athens-Clarke County 120,266 1 1.72 $8.65 $62.65 $143.65 $278.65 $548.65 $1,359.33 $2,711.02
Atlanta 650,000 1 1.44 $6.56 $6.56 $75.71 $91.58 $199.24 $241.38 $405.12 $491.04 $816.89 $990.37 $2,052.18 $2,488.37 $4,111.01 $4,985.03
Attapulgus 715 1 0.55 $8.00 $9.00 $29.49 $33.15 $75.54 $84.90 $152.29 $171.15 $305.79 $343.65 $766.29 $861.15 $1,533.79 $1,723.65
Auburn 6,904 1 1.64 $20.00 $91.39 $214.84 $420.59 $832.09 $2,066.59 $4,124.09
Augusta 204,000 1 1.08 $17.89 $49.03 $97.18 $177.43 $337.93 $826.90 $1,646.03
Austell 7,774 1 1.74 $8.28 $8.78 $43.85 $46.53 $135.45 $144.68 $303.95 $325.68 $640.95 $687.68 $1,651.95 $1,773.68 $3,336.95 $3,583.68
Avera 240 1 0.71 $12.00 $32.50 $67.00 $124.50 $239.50 $584.50 $1,159.50
Baconton 985 1 $34.89 $43.09 $56.39 $75.39 $88.64 $123.84 $142.39 $204.59 $249.89 $366.09 $572.39 $850.59 $1,109.89 $1,658.09
Bainbridge 13,546 1 1.05 $14.96 $14.96 $31.96 $37.96 $57.46 $72.46 $99.96 $129.96 $184.96 $244.96 $439.96 $589.96 $864.96 $1,164.96
Baldwin 4,160 1 $10.00 $19.00 $65.65 $97.14 $224.65 $284.64 $489.65 $597.14 $1,019.65 $1,222.14 $2,609.65 $3,097.14 $5,259.65 $6,222.14
Baldwin County 21,840 1 1.19 $19.00 $57.75 $144.50 $298.25 $633.25 $1,638.25 $3,313.25
Ball Ground 2,470 1 0.86 $18.00 $21.50 $51.25 $66.15 $141.25 $163.65 $291.25 $326.15 $591.25 $651.15 $1,491.25 $1,626.15 $2,991.25 $3,251.15
Banks County 6,453 1 $26.50 $79.30 $184.80 $367.30 $732.30 $1,827.30 $3,652.30
Barnesville 6,755 1 1.35 $10.00 $16.30 $56.40 $62.70 $165.25 $171.55 $334.00 $340.30 $671.50 $677.80 $1,684.00 $1,690.30 $3,371.50 $3,377.80
Barrow County Water and Sewer Authority 14,043 1 1.20 $7.50 $70.50 $196.65 $406.90 $827.40 $2,088.90 $4,191.40
Bartow 286 1 0.83 $60.00 $60.00 $60.00 $60.00 $113.00 $272.00 $537.00
Bartow County 50,162 1 1.15 $6.49 $73.39 $173.74 $340.99 $675.49 $1,688.73 $3,377.46
Barwick 497 1 0.80 $48.00 $101.75 $190.50 $346.75 $659.25 $1,596.75 $3,159.25
Baxley 4,737 2 0.91 $11.35 $17.00 $38.55 $57.80 $89.55 $134.30 $174.55 $261.80 $344.55 $516.80 $854.55 $1,281.80 $1,704.55 $2,556.80
50,000 Gallons
(6,684 cf)
5/8" or 3/4" Meter
100,000 Gallons
(13,369 cf)
5/8" or 3/4" Meter
250,000 Gallons
(33,422 cf)
1" Meter
500,000 Gallons
(66,845 cf)
1.5" or 2" Meter
Operating
Ratio
(FY2016)
Rate Table 8: 2017 Commercial Monthly-Equivalent Water Bills at Various Consumption Levels (Includes Base Charges)
Utility / Rate Structure
Service
Population
(Approx.)
Zero Gallons
(0 cf)
5/8" or 3/4" Meter
10,000 Gallons
(1,337 cf)
5/8" or 3/4" Meter
25,000 Gallons
(3,342 cf)
5/8" or 3/4" Meter
Service Population is approximated and may not be actual.
Source: 1=EPA SDWIS 2017, 2=Census Population in 2016 *Based on data from FY2015 or earlierGeorgia Environmental Finance Authority
and Environmental Finance Center

Compare with caution. High rates may be justified and necessary to protect public health.
Inside Outside Inside Outside Inside Outside Inside Outside Inside Outside Inside Outside Inside Outside
50,000 Gallons
(6,684 cf)
5/8" or 3/4" Meter
100,000 Gallons
(13,369 cf)
5/8" or 3/4" Meter
250,000 Gallons
(33,422 cf)
1" Meter
500,000 Gallons
(66,845 cf)
1.5" or 2" Meter
Operating
Ratio
(FY2016)
Rate Table 8: 2017 Commercial Monthly-Equivalent Water Bills at Various Consumption Levels (Includes Base Charges)
Utility / Rate Structure
Service
Population
(Approx.)
Zero Gallons
(0 cf)
5/8" or 3/4" Meter
10,000 Gallons
(1,337 cf)
5/8" or 3/4" Meter
25,000 Gallons
(3,342 cf)
5/8" or 3/4" Meter
Bent Tree 0 $37.90 $116.37 $310.62 $634.37 $1,281.87 $3,224.37 $6,461.87
Berlin 575 1 $15.00 $30.00 $52.50 $90.00 $165.00 $390.00 $765.00
Blackshear 5,811 1 0.93 $16.01 $41.76 $90.96 $173.21 $337.71 $831.21 $1,653.71
Blairsville 4,035 1 1.51 $14.50 $18.90 $43.70 $55.50 $109.70 $135.00 $219.70 $267.50 $439.70 $532.50 $1,122.60 $1,363.60 $2,282.00 $2,778.60
Blakely 4,855 1 $19.00 $37.80 $68.70 $131.00 $260.00 $647.00 $1,292.00
Bloomingdale 1,690 1 1.08 $20.00 $35.75 $84.50 $200.75 $438.25 $1,150.75 $2,338.25
Blue Ridge 5,506 1 1.45 $19.00 $23.00 $99.00 $123.00 $239.00 $298.00 $489.00 $623.00 $989.00 $1,273.00 $2,491.00 $3,247.00 $4,999.00 $6,499.00
Blythe 1,004 1 0.91 $22.50 $56.34 $112.74 $206.74 $394.74 $958.74 $1,898.74
Boston 1,378 1 0.80 $11.00 $31.00 $68.50 $131.00 $256.00 $631.00 $1,256.00
Bowdon 6,045 1 $19.50 $31.00 $44.14 $61.88 $90.34 $119.78 $167.34 $216.28 $321.34 $409.28 $783.34 $988.28 $1,553.34 $1,953.28
Bowersville 512 1 0.73 $27.00 $59.00 $119.00 $219.00 $419.00 $1,019.00 $2,019.00
Bowman 862 1 $15.90 $38.00 $77.00 $142.00 $272.00 $662.00 $1,312.00
Braselton 8,580 1 1.74 $18.62 $27.92 $67.16 $76.46 $167.21 $176.51 $333.96 $343.26 $667.46 $676.76 $1,680.37 $1,695.88 $3,378.89 $3,409.92
Bremen 6,200 1 $9.00 $47.95 $74.30 $130.20 $185.75 $273.95 $371.50 $561.45 $743.00 $1,423.95 $1,857.50 $2,861.45 $3,715.00
Brinson 257 1 0.37 $18.49 $36.48 $59.48 $96.98 $171.98 $396.98 $771.98
Bronwood 593 1 0.90 $15.00 $37.50 $90.00 $190.00 $390.00 $990.00 $1,990.00
Brooklet 1,456 1 1.13 $30.25 $49.00 $89.00 $164.00 $364.00 $964.00 $1,964.00
Brooks (no water bills)
Broxton 1,463 1 0.92 $12.00 $20.00 $35.00 $60.00 $110.00 $260.00 $510.00
Brunswick-Glynn County Joint Water and Sewer
Commission - City of Brunswick 62,457 1 1.13 $16.81 $37.96 $92.92 $213.92 $455.92 $1,181.92 $2,391.92
Brunswick-Glynn County Joint Water and Sewer
Commission - Glynn County 62,457 1 1.13 $14.05 $35.20 $90.16 $211.16 $453.16 $1,179.16 $2,389.16
Buchanan 1,326 1 $29.76 $40.60 $74.49 $100.18 $149.04 $199.48 $273.29 $364.98 $521.79 $695.98 $1,267.29 $1,688.98 $2,509.79 $3,343.98
Buckhead 312 1 0.87 $13.00 $37.00 $82.00 $157.00 $307.00 $757.00 $1,507.00
Buena Vista 1,771 1 $350.00 $350.00 $350.00 $350.00 $412.50 $600.00 $912.50
Buford 8,045 1 0.92 $15.00 $46.00 $92.50 $170.00 $325.00 $790.00 $1,575.00
Butler 2,948 1 1.41 $28.99 $42.15 $40.99 $62.15 $70.99 $107.15 $120.99 $182.15 $220.99 $332.15 $520.99 $782.15 $1,020.99 $1,532.15
Butts County Water and Sewer Authority 21,600 1 1.11 $13.00 $16.00 $53.00 $62.00 $128.00 $148.25 $253.00 $292.00 $503.00 $579.50 $1,253.00 $1,442.00 $2,510.00 $2,889.50
Byron 6,617 1 1.56 $13.50 $63.50 $138.50 $263.50 $513.50 $1,277.50 $2,527.50
Cadwell 489 1 1.69 $28.65 $40.65 $47.40 $68.80 $77.40 $113.85 $128.65 $190.85 $231.15 $344.85 $538.65 $806.85 $1,051.15 $1,576.85
Cairo 9,703 1 0.91 $14.00 $28.00 $30.50 $61.00 $55.25 $110.50 $96.50 $193.00 $179.00 $358.00 $426.50 $853.00 $839.00 $1,678.00
Calhoun 49,088 1 2.22 $11.46 $16.92 $35.56 $53.62 $71.71 $108.67 $131.96 $200.42 $252.46 $383.92 $613.96 $934.42 $1,332.61 $2,030.44
Camak 182 1 1.33 $35.39 $75.34 $145.84 $263.34 $498.34 $1,203.34 $2,378.34
Camilla 5,922 1 $10.00 $16.50 $24.80 $32.90 $52.55 $63.65 $98.80 $114.90 $191.30 $217.40 $468.80 $524.90 $931.30 $1,037.40
Canon 800 1 0.38 $10.00 $10.00 $50.70 $60.00 $111.75 $135.00 $213.50 $260.00 $417.00 $510.00 $1,027.50 $1,260.00 $2,045.00 $2,510.00
Canton 14,300 1 2.90 $13.29 $65.37 $163.02 $325.77 $651.27 $1,627.77 $3,255.27
Service Population is approximated and may not be actual.
Source: 1=EPA SDWIS 2017, 2=Census Population in 2016 *Based on data from FY2015 or earlierGeorgia Environmental Finance Authority
and Environmental Finance Center

Compare with caution. High rates may be justified and necessary to protect public health.
Inside Outside Inside Outside Inside Outside Inside Outside Inside Outside Inside Outside Inside Outside
50,000 Gallons
(6,684 cf)
5/8" or 3/4" Meter
100,000 Gallons
(13,369 cf)
5/8" or 3/4" Meter
250,000 Gallons
(33,422 cf)
1" Meter
500,000 Gallons
(66,845 cf)
1.5" or 2" Meter
Operating
Ratio
(FY2016)
Rate Table 8: 2017 Commercial Monthly-Equivalent Water Bills at Various Consumption Levels (Includes Base Charges)
Utility / Rate Structure
Service
Population
(Approx.)
Zero Gallons
(0 cf)
5/8" or 3/4" Meter
10,000 Gallons
(1,337 cf)
5/8" or 3/4" Meter
25,000 Gallons
(3,342 cf)
5/8" or 3/4" Meter
Carlton 434 1 0.90 $18.75 $19.75 $58.75 $59.75 $133.75 $134.75 $258.75 $259.75 $508.75 $509.75 $1,258.75 $1,259.75 $2,508.75 $2,509.75
Carnesville 736 1 $5.00 $6.75 $46.00 $53.25 $107.50 $123.00 $210.00 $239.25 $415.00 $471.75 $1,032.50 $1,172.50 $2,060.00 $2,345.00
Carroll County Water Authority 44,700 1 1.41 $16.00 $68.73 $212.31 $462.98 $964.31 $2,468.32 $4,975.01
Carrollton 24,310 1 1.48 $15.39 $24.97 $27.38 $40.25 $98.77 $131.21 $217.76 $282.82 $455.73 $586.03 $1,119.89 $1,432.00 $2,226.19 $2,841.20
Cartersville 24,830 1 2.65 $8.18 $14.99 $45.35 $69.94 $101.09 $152.36 $194.01 $289.72 $379.84 $564.46 $948.23 $1,409.10 $1,896.45 $2,812.75
Catoosa Utility District Authority 50,677 1 0.29 $11.50 $37.34 $85.79 $166.54 $328.04 $812.54 $1,620.04
Cave Spring 4,180 1 1.33 $13.63 $27.61 $52.35 $94.01 $124.95 $218.51 $245.95 $426.01 $487.95 $841.01 $1,230.32 $2,106.00 $2,492.11 $4,218.59
Cedartown 9,750 1 1.03 $11.10 $16.10 $29.85 $44.22 $74.77 $111.60 $149.63 $223.90 $299.37 $448.50 $724.98 $1,086.92 $1,380.06 $2,069.54
Centerville 9,940 1 1.11 $33.74 $65.26 $124.36 $204.26 $354.76 $806.26 $1,558.76
Chatsworth Water Works Commission 29,617 1 0.98 $10.00 $18.00 $37.55 $56.95 $81.05 $118.45 $153.55 $220.95 $298.55 $425.95 $745.55 $1,047.95 $1,483.55 $2,087.95
Chattooga County 7,306 1 0.77 $12.30 $40.80 $81.30 $148.80 $283.80 $688.80 $1,363.80
Chattooga County - Cloudland 7,306 1 0.77 $30.00 $72.00 $150.75 $282.00 $544.50 $1,332.00 $2,644.50
Chattooga County - Gore Subligna 7,306 1 0.77 $26.70 $88.50 $176.25 $322.50 $615.00 $1,492.50 $2,955.00
Cherokee County Water and Sewerage Authority 145,528 1 1.23 $9.00 $53.20 $131.95 $263.20 $525.70 $1,313.20 $2,625.70
Chester 1,777 1 1.35 $4.50 $15.00 $37.50 $75.00 $150.00 $375.00 $750.00
Chickamauga 4,150 1 1.19 $11.06 $14.06 $38.36 $48.36 $86.81 $107.31 $167.56 $205.56 $329.06 $402.06 $813.56 $991.56 $1,621.06 $1,974.06
Clarkesville 5,785 1 1.21 $14.50 $26.50 $50.50 $94.50 $118.00 $222.00 $230.50 $434.50 $455.50 $859.50 $1,130.50 $2,134.50 $2,255.50 $4,259.50
Claxton 4,433 1 0.85 $14.20 $24.55 $41.15 $57.80 $101.15 $131.30 $201.15 $253.80 $401.15 $498.80 $1,001.15 $1,233.80 $2,001.15 $2,458.80
Clay County 744 1 $16.70 $39.95 $87.45 $174.95 $374.95 $974.95 $1,974.95
Clayton 7,225 1 $22.04 $31.65 $70.68 $87.21 $174.33 $206.31 $347.08 $404.81 $692.58 $801.81 $1,745.85 $2,017.29 $3,584.32 $4,164.18
Clayton - North Loop 0 $26.16 $69.94 $160.39 $311.14 $612.64 $1,538.10 $3,184.34
Clayton County Water Authority 270,000 1 1.35 $10.05 $59.56 $144.76 $286.76 $570.76 $1,426.29 $2,863.62
Cleveland 3,640 1 1.10 $19.87 $30.21 $38.09 $55.11 $72.89 $102.66 $130.89 $181.91 $246.89 $340.41 $602.68 $828.87 $1,200.63 $1,642.91
Climax 359 1 0.96 $24.00 $36.00 $66.00 $116.00 $216.00 $516.00 $1,016.00
Cobb County 533,000 1 1.51 $3.50 $3.50 $45.10 $46.30 $107.50 $110.50 $211.50 $217.50 $419.50 $431.50 $1,047.50 $1,077.50 $2,093.00 $2,153.00
Cobbtown 596 1 1.03 $8.00 $25.00 $70.00 $145.00 $295.00 $745.00 $1,495.00
Cochran 5,124 1 1.21 $10.00 $20.00 $30.25 $50.60 $64.00 $101.60 $120.25 $186.60 $232.75 $356.60 $570.25 $866.60 $1,132.75 $1,716.60
Coffee County 1,635 1 3.40 $25.00 $34.00 $52.75 $84.00 $146.50 $334.00 $646.50
College Park 20,382 1 $26.91 $81.61 $163.66 $300.41 $573.91 $1,394.41 $2,761.91
Collins 780 1 0.76 $26.00 $43.00 $88.00 $163.00 $313.00 $763.00 $1,513.00
Colquitt 1,895 1 0.99 $17.50 $37.50 $77.50 $165.00 $340.00 $881.00 $1,756.00
Columbia County 101,967 1 1.99 $19.42 $42.02 $75.92 $132.42 $245.42 $584.42 $1,173.68
Columbus Water Works 229,000 1 $5.82 $28.15 $64.03 $124.19 $244.51 $606.55 $1,209.23
Comer 1,380 1 0.96 $11.00 $24.75 $49.25 $110.81 $116.75 $262.69 $229.25 $515.81 $454.25 $1,022.06 $1,129.25 $2,540.81 $2,254.25 $5,072.06
Commerce 6,819 1 1.01 $4.00 $7.00 $58.10 $83.10 $139.25 $197.25 $274.50 $387.50 $545.00 $768.00 $1,356.50 $1,909.50 $2,709.00 $3,812.00
Concord 741 1 0.80 $17.00 $19.00 $47.80 $49.80 $105.55 $107.55 $201.80 $203.80 $394.30 $396.30 $971.80 $973.80 $1,934.30 $1,936.30
Service Population is approximated and may not be actual.
Source: 1=EPA SDWIS 2017, 2=Census Population in 2016 *Based on data from FY2015 or earlierGeorgia Environmental Finance Authority
and Environmental Finance Center

Compare with caution. High rates may be justified and necessary to protect public health.
Inside Outside Inside Outside Inside Outside Inside Outside Inside Outside Inside Outside Inside Outside
50,000 Gallons
(6,684 cf)
5/8" or 3/4" Meter
100,000 Gallons
(13,369 cf)
5/8" or 3/4" Meter
250,000 Gallons
(33,422 cf)
1" Meter
500,000 Gallons
(66,845 cf)
1.5" or 2" Meter
Operating
Ratio
(FY2016)
Rate Table 8: 2017 Commercial Monthly-Equivalent Water Bills at Various Consumption Levels (Includes Base Charges)
Utility / Rate Structure
Service
Population
(Approx.)
Zero Gallons
(0 cf)
5/8" or 3/4" Meter
10,000 Gallons
(1,337 cf)
5/8" or 3/4" Meter
25,000 Gallons
(3,342 cf)
5/8" or 3/4" Meter
Consolidated Utilities, Inc. 0 $16.00 $65.00 $173.00 $353.00 $713.00 $1,793.00 $3,593.00
Consolidated Utilities, Inc. - Coastal Water &
Sewerage, LLC - 21 Centre 0 $22.50 $22.50 $22.50 $22.50 $22.50 $22.50 $22.50
Consolidated Utilities, Inc. - Coastal Water &
Sewerage, LLC - Cypress Lakes 0 $36.00 $36.00 $36.00 $36.00 $36.00 $36.00 $36.00
Consolidated Utilities, Inc. - Coastal Water &
Sewerage, LLC - Little Neck Plantation 0 $12.00 $25.40 $30.76 $30.76 $30.76 $30.76 $30.76
Consolidated Utilities, Inc. - Coastal Water &
Sewerage, LLC - Rebel Estates 0 $40.00 $40.00 $40.00 $40.00 $40.00 $40.00 $40.00
Consolidated Utilities, Inc. - Coastal Water &
Sewerage, LLC - Ridgecrest, Park of Commerce,
Millcreek
0 $15.75 $63.75 $147.75 $287.75 $567.75 $1,407.75 $2,807.75
Consolidated Utilities, Inc. - Coastal Water &
Sewerage, LLC - Sandy Woods, South Pointe,
Southern Hills, White Bluff, Mingledorff, Cottonvale
0 $34.00 $46.50 $84.00 $146.50 $271.50 $646.50 $1,271.50
Consolidated Utilities, Inc. - Coastal Water Company 0 $15.75 $63.75 $147.75 $287.75 $567.75 $1,407.75 $2,807.75
Consolidated Utilities, Inc. - Coastal Water Company -
Rate 2 0 $15.75 $81.75 $201.75 $401.75 $801.75 $2,001.75 $4,001.75
Consolidated Utilities, Inc. - Golden Isles 0 $34.00 $46.50 $84.00 $146.50 $271.50 $646.50 $1,271.50
Consolidated Utilities, Inc. - Whitemarsh Estates 0 $34.00 $46.50 $84.00 $146.50 $271.50 $646.50 $1,271.50
Consolidated Utilities, Inc. - Woodlawn 0 $34.00 $46.50 $84.00 $146.50 $271.50 $646.50 $1,271.50
Coolidge 692 1 0.49 $40.00 $50.00 $67.50 $86.00 $108.75 $140.00 $177.50 $230.00 $315.00 $410.00 $727.50 $950.00 $1,415.00 $1,850.00
Coosa Water Authority 3,944 1 1.06 $50.00 $84.00 $155.25 $274.00 $511.50 $1,224.00 $2,411.50
Cordele 10,691 1 1.24 $8.92 $14.21 $37.52 $56.41 $80.42 $119.71 $151.92 $225.21 $294.92 $436.21 $723.92 $1,069.21 $1,438.92 $2,124.21
Cornelia 6,130 1 1.36 $15.88 $24.36 $47.96 $58.04 $108.11 $121.19 $208.36 $226.44 $414.36 $443.44 $1,039.86 $1,101.94 $2,082.36 $2,199.44
Covington 20,379 1 0.98 $16.60 $54.75 $136.50 $272.75 $560.25 $1,422.75 $2,860.25
Coweta County Water and Sewer Authority 59,800 1 1.45 $24.00 $94.15 $225.30 $478.45 $996.95 $2,552.45 $5,144.95
Crawford 1,170 1 0.76 $20.00 $36.00 $60.00 $84.00 $153.75 $192.75 $310.00 $374.00 $622.50 $736.50 $1,560.00 $1,824.00 $3,122.50 $3,636.50
Crawford County 1,625 1 0.79 $29.00 $62.75 $119.00 $212.75 $400.25 $962.75 $1,900.25
Crawfordville 582 1 $17.75 $26.63 $54.60 $81.91 $137.10 $205.66 $274.60 $411.91 $549.60 $824.41 $1,374.60 $2,061.91 $2,749.60 $4,124.41
Cumming 47,541 1 1.15 $10.72 $20.72 $31.16 $45.01 $74.96 $97.06 $147.96 $183.81 $293.96 $357.31 $731.96 $877.81 $1,461.96 $1,745.31
Cusseta-Chattahoochee County 3,300 1 $21.00 $57.80 $126.80 $241.80 $471.80 $1,161.80 $2,401.25
Cuthbert 2,613 1 $8.00 $12.00 $22.20 $26.20 $49.95 $53.95 $96.20 $100.20 $188.70 $192.70 $466.20 $470.20 $928.70 $932.70
Dade County Water and Sewer Authority 36,400 1 1.12 $20.35 $57.15 $126.15 $241.15 $471.15 $1,161.15 $2,311.15
Dade County Water and Sewer Authority - Canyon
Ridge 36,400 1 1.12 $18.15 $59.35 $136.60 $265.35 $522.85 $1,295.35 $2,582.85
Dade County Water and Sewer Authority - Flintstone 36,400 1 1.12 $17.85 $65.45 $154.70 $303.45 $600.95 $1,493.45 $2,980.95
Dade County Water and Sewer Authority - Mountain
(Pumped 2x) 36,400 1 1.12 $20.35 $59.15 $131.90 $253.15 $495.65 $1,223.15 $2,435.65
Service Population is approximated and may not be actual.
Source: 1=EPA SDWIS 2017, 2=Census Population in 2016 *Based on data from FY2015 or earlierGeorgia Environmental Finance Authority
and Environmental Finance Center

Compare with caution. High rates may be justified and necessary to protect public health.
Inside Outside Inside Outside Inside Outside Inside Outside Inside Outside Inside Outside Inside Outside
50,000 Gallons
(6,684 cf)
5/8" or 3/4" Meter
100,000 Gallons
(13,369 cf)
5/8" or 3/4" Meter
250,000 Gallons
(33,422 cf)
1" Meter
500,000 Gallons
(66,845 cf)
1.5" or 2" Meter
Operating
Ratio
(FY2016)
Rate Table 8: 2017 Commercial Monthly-Equivalent Water Bills at Various Consumption Levels (Includes Base Charges)
Utility / Rate Structure
Service
Population
(Approx.)
Zero Gallons
(0 cf)
5/8" or 3/4" Meter
10,000 Gallons
(1,337 cf)
5/8" or 3/4" Meter
25,000 Gallons
(3,342 cf)
5/8" or 3/4" Meter
Dade County Water and Sewer Authority - Mountain
(Pumped 3x) 36,400 1 1.12 $16.90 $56.90 $131.90 $256.90 $506.90 $1,256.90 $2,506.90
Dade County Water and Sewer Authority - North End
(no water bills)
Dade County Water and Sewer Authority - South End
(no water bills)
Dade County Water and Sewer Authority - Valley 36,400 1 1.12 $20.35 $57.95 $128.45 $245.95 $480.95 $1,185.95 $2,360.95
Dahlonega 4,120 1 1.22 $21.91 $95.17 $219.22 $425.97 $899.97 $2,312.79 $4,609.43
Daisy 117 1 2.65 $7.00 $16.50 $46.50 $96.50 $196.50 $496.50 $996.50
Dallas 7,556 1 1.69 $16.28 $20.94 $115.54 $142.10 $407.28 $501.86 $927.78 $1,143.86 $1,968.78 $2,427.86 $5,091.78 $6,279.86 $10,296.78 $12,699.86
Damascus 239 1 $100.00 $100.00 $100.00 $100.00 $100.00 $100.00 $100.00
Danielsville 1,092 1 0.98 $10.00 $26.00 $41.20 $83.20 $154.95 $252.20 $382.45 $635.70 $837.45 $1,480.70 $2,202.45 $4,015.70 $4,477.45 $8,240.70
Danville 393 1 1.86 $14.00 $38.00 $83.00 $158.00 $308.00 $758.00 $1,508.00
Darien 3,242 1 0.98 $9.00 $13.50 $41.00 $59.25 $92.75 $133.50 $181.50 $261.00 $359.00 $516.00 $891.50 $1,281.00 $1,779.00 $2,556.00
Davisboro 1,535 1 $22.84 $39.84 $66.09 $109.84 $197.34 $459.84 $897.34
Dawson 4,836 1 1.59 $27.00 $51.75 $93.00 $161.75 $299.25 $711.75 $1,399.25
Dawsonville 2,424 1 1.21 $28.75 $40.25 $75.53 $91.88 $170.03 $195.38 $327.53 $367.88 $642.53 $712.88 $1,587.53 $1,747.88 $3,162.53 $3,472.88
Decatur Consolidated Water Services, Inc. -
Doublegate Phase VI 0 $18.03 $38.59 $77.14 $141.39 $269.89 $655.39 $1,297.89
Decatur Consolidated Water Services, Inc. - Holly
Isles 0 $36.34 $46.59 $77.34 $128.59 $231.09 $538.59 $1,051.09
Decatur Consolidated Water Services, Inc. - Pebble
Hill Estates 0 $19.06 $41.30 $83.00 $152.50 $291.50 $708.50 $1,403.50
Decatur Consolidated Water Services, Inc. - Redrock
Estates 0 $25.14 $40.39 $86.14 $162.39 $314.89 $772.39 $1,534.89
Decatur Consolidated Water Services, Inc. -
Riverbend Estates 0 $19.06 $41.30 $83.00 $152.50 $291.50 $708.50 $1,403.50
Decatur Consolidated Water Services, Inc. -
Woodcrest Subdivision 0 $19.06 $38.24 $79.34 $147.84 $284.84 $695.84 $1,380.84
Deepstep 133 1 0.73 $24.00 $45.60 $81.60 $141.60 $261.60 $621.60 $1,221.60
Dekalb County 670,000 1 $5.71 $34.67 $121.37 $323.37 $727.37 $774.75 $1,549.51
Demorest 15,130 1 1.17 $30.00 $40.00 $71.20 $82.80 $150.70 $165.30 $283.20 $302.80 $573.20 $602.80 $1,443.20 $1,502.80 $2,893.20 $3,002.80
Denton 253 1 $15.50 $28.75 $43.75 $68.75 $118.75 $268.75 $518.75
Dexter 1,976 1 0.99 $17.00 $27.00 $38.30 $48.30 $79.30 $89.30 $149.30 $159.30 $289.30 $299.30 $709.30 $719.30 $1,409.30 $1,419.30
Dillard 133 1 0.67 $20.00 $69.50 $152.00 $289.50 $564.50 $1,389.50 $2,764.50
Doerun 967 1 1.03 $7.00 $40.60 $98.10 $198.10 $410.60 $1,048.10 $2,110.60
Donalsonville 2,782 1 1.12 $34.28 $62.08 $109.13 $197.63 $374.63 $905.63 $1,790.63
Dooling 99,315 1 1.11 $25.00 $64.15 $129.40 $238.15 $455.65 $1,108.15 $2,195.65
Douglas 10,688 1 1.24 $15.04 $53.14 $105.19 $190.44 $348.44 $822.44 $1,612.44
Service Population is approximated and may not be actual.
Source: 1=EPA SDWIS 2017, 2=Census Population in 2016 *Based on data from FY2015 or earlierGeorgia Environmental Finance Authority
and Environmental Finance Center

Compare with caution. High rates may be justified and necessary to protect public health.
Inside Outside Inside Outside Inside Outside Inside Outside Inside Outside Inside Outside Inside Outside
50,000 Gallons
(6,684 cf)
5/8" or 3/4" Meter
100,000 Gallons
(13,369 cf)
5/8" or 3/4" Meter
250,000 Gallons
(33,422 cf)
1" Meter
500,000 Gallons
(66,845 cf)
1.5" or 2" Meter
Operating
Ratio
(FY2016)
Rate Table 8: 2017 Commercial Monthly-Equivalent Water Bills at Various Consumption Levels (Includes Base Charges)
Utility / Rate Structure
Service
Population
(Approx.)
Zero Gallons
(0 cf)
5/8" or 3/4" Meter
10,000 Gallons
(1,337 cf)
5/8" or 3/4" Meter
25,000 Gallons
(3,342 cf)
5/8" or 3/4" Meter
Douglasville-Douglas County Water and Sewer
Authority 109,694 1 1.14 $10.92 $70.86 $211.86 $446.86 $916.86 $2,285.97 $4,567.55
Du Pont 120 1 0.90 $20.00 $20.00 $20.00 $20.00 $20.00 $20.00 $20.00
Dublin 17,500 1 1.09 $9.50 $15.20 $39.90 $76.00 $96.90 $190.00 $191.90 $380.00 $381.90 $760.00 $954.56 $1,904.26 $1,912.16 $3,816.42
Dudley 546 1 1.46 $25.89 $39.97 $66.37 $110.37 $198.37 $462.37 $902.37
East Dublin 2,657 1 0.65 $12.75 $23.50 $38.19 $63.40 $86.49 $139.15 $166.99 $265.40 $327.99 $517.90 $810.99 $1,275.40 $1,615.99 $2,537.90
East Point 33,712 1 $24.25 $54.56 $147.41 $318.41 $660.41 $1,705.19 $3,446.49
Eastman 7,491 1 0.87 $12.05 $19.55 $24.55 $36.05 $43.30 $60.80 $74.55 $102.05 $137.05 $184.55 $324.55 $432.05 $637.05 $844.55
Eatonton-Putnam Water and Sewer Authority 12,272 1 1.19 $25.75 $31.75 $72.33 $78.33 $166.98 $172.98 $333.23 $339.23 $691.23 $697.23 $1,765.23 $1,771.23 $3,569.23 $3,569.23
Echols County Water Authority 824 1 $15.00 $33.00 $78.00 $153.00 $303.00 $753.00 $1,503.00
Edison 1,331 1 0.87 $15.00 $31.80 $63.30 $115.80 $220.80 $535.80 $1,060.80
Effingham County 7,700 1 0.99 $50.00 $77.70 $124.35 $202.10 $357.60 $824.10 $1,601.60
Elberton 7,800 1 1.20 $7.72 $11.03 $35.13 $51.54 $76.24 $112.30 $144.75 $213.57 $281.78 $416.11 $647.53 $956.18 $1,203.34 $1,780.44
Ellaville 2,779 1 1.22 $33.80 $41.00 $55.20 $73.11 $91.70 $127.86 $154.20 $221.61 $284.20 $416.61 $674.20 $1,001.61 $1,324.20 $1,976.61
Ellenton 374 1 0.38 $32.00 $54.00 $164.00 $364.00 $764.00 $1,964.00 $3,964.00
Ellijay-Gilmer County Water and Sewer Authority 13,010 1 1.15 $12.60 $42.80 $89.45 $171.20 $334.70 $838.20 $1,709.20
Emerson 1,394 1 0.72 $15.62 $21.87 $44.42 $62.17 $87.62 $122.62 $159.62 $223.37 $303.62 $424.87 $741.04 $1,036.95 $1,482.06 $2,073.89
Enigma 1,113 1 $12.00 $25.00 $55.00 $105.00 $205.00 $505.00 $1,005.00
Ephesus 1,352 1 $40.00 $40.00 $58.80 $117.55 $235.05 $587.55 $1,175.05
Etowah Water and Sewer Authority 13,843 1 1.23 $25.50 $110.60 $238.25 $451.00 $876.50 $2,182.50 $4,430.00
Fairburn 13,693 1 1.35 $16.64 $24.96 $111.94 $142.46 $254.89 $318.71 $493.14 $612.46 $969.64 $1,199.96 $2,399.14 $2,962.46 $4,781.64 $5,899.96
Fairmount 130 1 1.01 $43.25 $102.25 $207.25 $382.25 $732.25 $1,782.25 $3,547.25
Fargo 380 1 0.87 $16.00 $26.50 $49.00 $86.50 $161.50 $386.50 $761.50
Fayette County 74,163 1 1.10 $18.48 $44.32 $92.77 $173.52 $335.02 $819.05 $1,632.33
Fayetteville 15,281 1 $29.91 $55.99 $104.89 $186.39 $349.39 $838.39 $1,653.39
Fitzgerald Water Light and Bond Commission 12,935 1 1.05 $8.00 $26.50 $54.25 $100.50 $193.00 $470.50 $933.00
Flovilla 1,438 1 0.91 $24.00 $47.00 $133.25 $277.00 $564.50 $1,427.00 $2,864.50
Flowery Branch 2,920 1 1.40 $27.95 $37.11 $42.92 $57.00 $117.77 $156.45 $242.52 $322.20 $532.42 $706.50 $1,432.42 $1,899.00 $2,932.42 $3,886.50
Floyd County 41,738 1 1.96 $14.85 $44.85 $101.10 $194.85 $382.35 $956.10 $1,908.56
Folkston 5,940 1 1.14 $17.30 $36.48 $77.58 $146.08 $283.08 $694.08 $1,379.08
Forest Heights Water Works, Inc. 0 $44.00 $52.00 $92.00 $167.00 $317.00 $767.00 $1,517.00
Forsyth 7,400 1 1.14 $15.54 $23.01 $50.07 $72.47 $101.67 $150.92 $187.67 $281.67 $359.67 $543.17 $875.67 $1,327.67 $1,735.67 $2,635.17
Forsyth County 138,368 1 1.52 $12.00 $45.48 $101.28 $194.28 $380.28 $941.28 $1,876.28
Fort Gaines 1,422 1 1.29 $14.00 $31.50 $57.75 $101.50 $189.00 $451.50 $889.00
Fort Oglethorpe 9,446 1 1.25 $22.96 $93.92 $226.97 $448.72 $892.22 $2,222.72 $4,440.22
Fort Valley Utility Commission 17,645 1 0.85 $12.30 $53.30 $126.49 $248.48 $492.47 $1,224.42 $2,444.34
Franklin County 2,764 1 0.96 $21.00 $55.40 $120.65 $229.40 $446.90 $1,117.40 $2,249.90
Service Population is approximated and may not be actual.
Source: 1=EPA SDWIS 2017, 2=Census Population in 2016 *Based on data from FY2015 or earlierGeorgia Environmental Finance Authority
and Environmental Finance Center

Compare with caution. High rates may be justified and necessary to protect public health.
Inside Outside Inside Outside Inside Outside Inside Outside Inside Outside Inside Outside Inside Outside
50,000 Gallons
(6,684 cf)
5/8" or 3/4" Meter
100,000 Gallons
(13,369 cf)
5/8" or 3/4" Meter
250,000 Gallons
(33,422 cf)
1" Meter
500,000 Gallons
(66,845 cf)
1.5" or 2" Meter
Operating
Ratio
(FY2016)
Rate Table 8: 2017 Commercial Monthly-Equivalent Water Bills at Various Consumption Levels (Includes Base Charges)
Utility / Rate Structure
Service
Population
(Approx.)
Zero Gallons
(0 cf)
5/8" or 3/4" Meter
10,000 Gallons
(1,337 cf)
5/8" or 3/4" Meter
25,000 Gallons
(3,342 cf)
5/8" or 3/4" Meter
Franklin Springs 997 1 0.95 $7.00 $52.00 $119.50 $232.00 $457.00 $1,132.00 $2,257.00
Fulton County 172,533 1 1.76 $3.63 $34.13 $111.02 $263.52 $568.52 $1,483.52 $3,008.52
Funston 551 1 1.61 $8.25 $28.25 $65.75 $128.25 $253.25 $628.25 $1,253.25
Gainesville 117,962 1 1.65 $3.09 $3.09 $36.91 $70.73 $87.64 $172.20 $172.20 $341.32 $381.37 $759.65 $1,396.07 $2,789.06 $3,087.25 $6,171.42
Garden City 8,166 1 1.11 $59.22 $67.94 $76.24 $93.51 $121.04 $160.76 $209.29 $293.26 $385.79 $558.26 $915.29 $1,353.26 $1,797.79 $2,678.26
Garfield 390 1 $14.50 $39.00 $91.50 $179.00 $354.00 $879.00 $1,754.00
Gay 179 1 0.63 $24.50 $56.50 $116.50 $216.50 $416.50 $1,016.50 $2,016.50
Georgetown-Quitman County Water, Sewer and Solid
Waste Authority 985 1 0.88 $17.50 $22.50 $47.50 $52.50 $103.75 $108.75 $197.50 $202.50 $385.00 $390.00 $947.50 $952.50 $1,885.00 $1,890.00
Gibson 720 1 0.89 $20.00 $34.00 $64.00 $114.00 $214.00 $514.00 $1,014.00
Glennville 4,711 1 1.00 $15.00 $31.50 $72.75 $141.50 $279.00 $724.50 $1,412.00
Glenwood 1,012 1 0.62 $16.00 $32.00 $62.00 $112.00 $212.00 $512.00 $1,012.00
Gordon 2,340 1 0.62 $8.19 $28.35 $66.15 $129.15 $255.15 $633.15 $1,263.15
Graham 261 2 $35.00 $51.00 $81.00 $131.00 $231.00 $531.00 $1,031.00
Grantville 1,508 1 $25.00 $71.00 $168.50 $331.00 $656.00 $1,631.00 $3,256.00
Greensboro 3,156 1 1.67 $25.40 $28.96 $84.69 $96.51 $211.74 $241.26 $423.49 $482.51 $846.99 $965.01 $2,117.49 $2,412.51 $4,234.99 $4,825.01
Greenville 1,880 1 0.68 $15.00 $20.50 $82.50 $95.00 $183.75 $206.75 $352.50 $393.00 $690.00 $765.50 $1,714.50 $1,898.50 $3,430.00 $3,790.00
Griffin 23,643 1 1.03 $14.08 $65.04 $160.59 $319.84 $638.34 $1,614.56 $3,213.68
Griffin - Spalding County 0 $13.71 $92.93 $244.43 $496.93 $1,001.93 $2,516.93 $5,041.93
Grovetown 11,216 1 $24.30 $38.10 $81.00 $127.00 $203.50 $318.50 $409.50 $639.50 $827.00 $1,287.00 $2,079.50 $3,229.50 $4,167.00 $6,467.00
Guyton 2,394 1 2.31 $38.82 $57.97 $117.87 $225.87 $441.87 $1,089.87 $2,169.87
Gwinnett County 795,657 1 1.56 $7.50 $56.70 $130.50 $253.50 $499.50 $1,246.50 $2,487.00
Hahira 2,846 1 0.86 $28.12 $54.09 $109.74 $202.49 $387.99 $944.49 $1,871.99
Hall County (no water bills)
Hamilton 928 1 1.52 $30.00 $74.00 $156.50 $294.00 $569.00 $1,413.50 $2,793.50
Hampton 7,305 1 1.11 $9.25 $66.04 $214.08 $460.80 $954.25 $2,434.60 $4,901.85
Hancock County 900 1 0.35 $25.00 $55.00 $111.25 $205.00 $392.50 $955.00 $1,892.50
Hapeville 5,385 1 1.39 $17.56 $88.02 $312.60 $751.60 $1,629.60 $4,263.60 $8,653.60
Haralson County Water Authority 11,362 1 1.07 $15.00 $49.52 $154.52 $329.52 $679.52 $1,729.52 $3,479.52
Harlem 5,356 1 1.01 $13.93 $27.86 $44.25 $91.54 $107.80 $224.64 $236.05 $492.14 $492.55 $1,027.14 $1,262.05 $2,632.14 $2,544.55 $5,307.14
Harris County 20,062 1 1.29 $32.52 $83.37 $168.12 $309.37 $591.87 $1,439.37 $2,851.87
Harrison 500 1 0.44 $10.00 $31.60 $72.10 $139.60 $274.60 $679.60 $1,354.60
Hart County Water and Sewer Authority 3,606 1 1.10 $19.00 $48.70 $98.20 $180.70 $345.70 $848.70 $1,701.70
Hartford Water Authority 487 1 $60.00 $60.00 $105.00 $180.00 $292.50 $517.50 $892.50
Hartwell 7,116 1 1.13 $11.77 $19.43 $37.77 $54.79 $86.52 $121.09 $167.77 $231.59 $330.27 $452.59 $817.77 $1,115.59 $1,630.27 $2,220.59
Hawkinsville 4,856 1 1.12 $16.50 $33.00 $37.88 $54.38 $80.63 $97.13 $151.88 $168.38 $294.38 $310.88 $721.88 $738.38 $1,434.38 $1,450.88
Hazlehurst 5,800 1 1.09 $15.00 $22.50 $33.00 $49.46 $66.75 $100.01 $123.00 $184.26 $235.50 $352.76 $573.00 $858.26 $1,135.50 $1,700.76
Service Population is approximated and may not be actual.
Source: 1=EPA SDWIS 2017, 2=Census Population in 2016 *Based on data from FY2015 or earlierGeorgia Environmental Finance Authority
and Environmental Finance Center
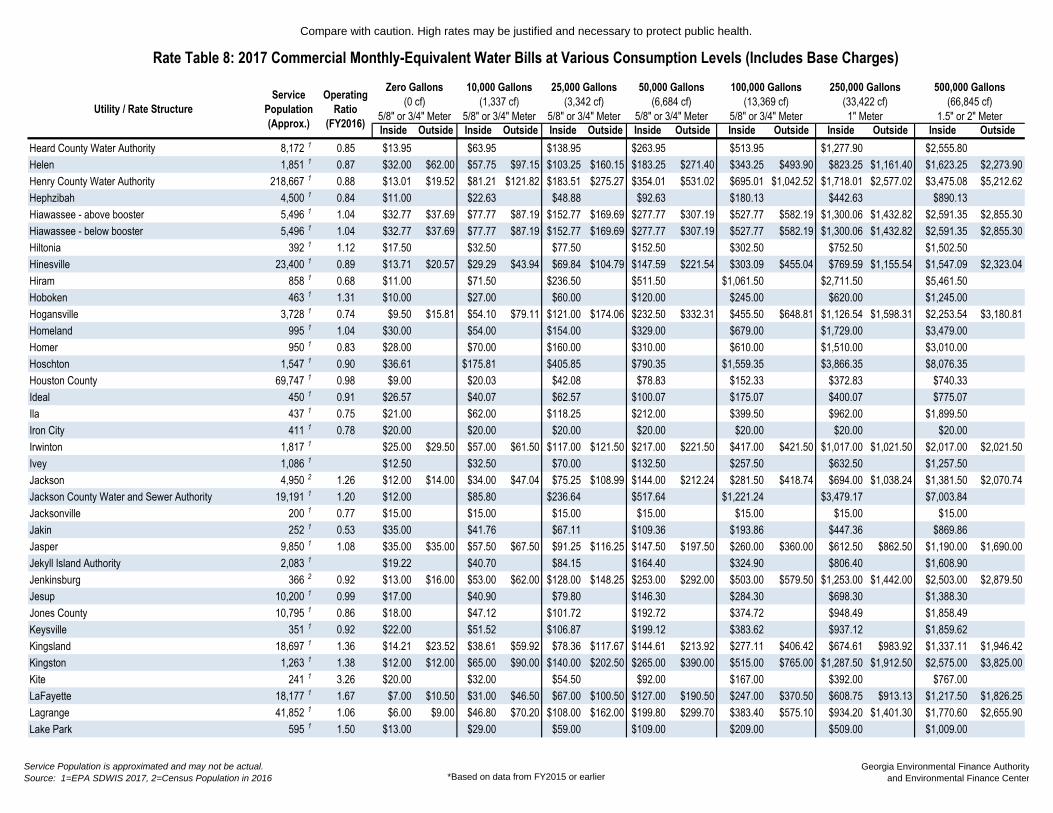
Compare with caution. High rates may be justified and necessary to protect public health.
Inside Outside Inside Outside Inside Outside Inside Outside Inside Outside Inside Outside Inside Outside
50,000 Gallons
(6,684 cf)
5/8" or 3/4" Meter
100,000 Gallons
(13,369 cf)
5/8" or 3/4" Meter
250,000 Gallons
(33,422 cf)
1" Meter
500,000 Gallons
(66,845 cf)
1.5" or 2" Meter
Operating
Ratio
(FY2016)
Rate Table 8: 2017 Commercial Monthly-Equivalent Water Bills at Various Consumption Levels (Includes Base Charges)
Utility / Rate Structure
Service
Population
(Approx.)
Zero Gallons
(0 cf)
5/8" or 3/4" Meter
10,000 Gallons
(1,337 cf)
5/8" or 3/4" Meter
25,000 Gallons
(3,342 cf)
5/8" or 3/4" Meter
Heard County Water Authority 8,172 1 0.85 $13.95 $63.95 $138.95 $263.95 $513.95 $1,277.90 $2,555.80
Helen 1,851 1 0.87 $32.00 $62.00 $57.75 $97.15 $103.25 $160.15 $183.25 $271.40 $343.25 $493.90 $823.25 $1,161.40 $1,623.25 $2,273.90
Henry County Water Authority 218,667 1 0.88 $13.01 $19.52 $81.21 $121.82 $183.51 $275.27 $354.01 $531.02 $695.01 $1,042.52 $1,718.01 $2,577.02 $3,475.08 $5,212.62
Hephzibah 4,500 1 0.84 $11.00 $22.63 $48.88 $92.63 $180.13 $442.63 $890.13
Hiawassee - above booster 5,496 1 1.04 $32.77 $37.69 $77.77 $87.19 $152.77 $169.69 $277.77 $307.19 $527.77 $582.19 $1,300.06 $1,432.82 $2,591.35 $2,855.30
Hiawassee - below booster 5,496 1 1.04 $32.77 $37.69 $77.77 $87.19 $152.77 $169.69 $277.77 $307.19 $527.77 $582.19 $1,300.06 $1,432.82 $2,591.35 $2,855.30
Hiltonia 392 1 1.12 $17.50 $32.50 $77.50 $152.50 $302.50 $752.50 $1,502.50
Hinesville 23,400 1 0.89 $13.71 $20.57 $29.29 $43.94 $69.84 $104.79 $147.59 $221.54 $303.09 $455.04 $769.59 $1,155.54 $1,547.09 $2,323.04
Hiram 858 1 0.68 $11.00 $71.50 $236.50 $511.50 $1,061.50 $2,711.50 $5,461.50
Hoboken 463 1 1.31 $10.00 $27.00 $60.00 $120.00 $245.00 $620.00 $1,245.00
Hogansville 3,728 1 0.74 $9.50 $15.81 $54.10 $79.11 $121.00 $174.06 $232.50 $332.31 $455.50 $648.81 $1,126.54 $1,598.31 $2,253.54 $3,180.81
Homeland 995 1 1.04 $30.00 $54.00 $154.00 $329.00 $679.00 $1,729.00 $3,479.00
Homer 950 1 0.83 $28.00 $70.00 $160.00 $310.00 $610.00 $1,510.00 $3,010.00
Hoschton 1,547 1 0.90 $36.61 $175.81 $405.85 $790.35 $1,559.35 $3,866.35 $8,076.35
Houston County 69,747 1 0.98 $9.00 $20.03 $42.08 $78.83 $152.33 $372.83 $740.33
Ideal 450 1 0.91 $26.57 $40.07 $62.57 $100.07 $175.07 $400.07 $775.07
Ila 437 1 0.75 $21.00 $62.00 $118.25 $212.00 $399.50 $962.00 $1,899.50
Iron City 411 1 0.78 $20.00 $20.00 $20.00 $20.00 $20.00 $20.00 $20.00
Irwinton 1,817 1 $25.00 $29.50 $57.00 $61.50 $117.00 $121.50 $217.00 $221.50 $417.00 $421.50 $1,017.00 $1,021.50 $2,017.00 $2,021.50
Ivey 1,086 1 $12.50 $32.50 $70.00 $132.50 $257.50 $632.50 $1,257.50
Jackson 4,950 2 1.26 $12.00 $14.00 $34.00 $47.04 $75.25 $108.99 $144.00 $212.24 $281.50 $418.74 $694.00 $1,038.24 $1,381.50 $2,070.74
Jackson County Water and Sewer Authority 19,191 1 1.20 $12.00 $85.80 $236.64 $517.64 $1,221.24 $3,479.17 $7,003.84
Jacksonville 200 1 0.77 $15.00 $15.00 $15.00 $15.00 $15.00 $15.00 $15.00
Jakin 252 1 0.53 $35.00 $41.76 $67.11 $109.36 $193.86 $447.36 $869.86
Jasper 9,850 1 1.08 $35.00 $35.00 $57.50 $67.50 $91.25 $116.25 $147.50 $197.50 $260.00 $360.00 $612.50 $862.50 $1,190.00 $1,690.00
Jekyll Island Authority 2,083 1 $19.22 $40.70 $84.15 $164.40 $324.90 $806.40 $1,608.90
Jenkinsburg 366 2 0.92 $13.00 $16.00 $53.00 $62.00 $128.00 $148.25 $253.00 $292.00 $503.00 $579.50 $1,253.00 $1,442.00 $2,503.00 $2,879.50
Jesup 10,200 1 0.99 $17.00 $40.90 $79.80 $146.30 $284.30 $698.30 $1,388.30
Jones County 10,795 1 0.86 $18.00 $47.12 $101.72 $192.72 $374.72 $948.49 $1,858.49
Keysville 351 1 0.92 $22.00 $51.52 $106.87 $199.12 $383.62 $937.12 $1,859.62
Kingsland 18,697 1 1.36 $14.21 $23.52 $38.61 $59.92 $78.36 $117.67 $144.61 $213.92 $277.11 $406.42 $674.61 $983.92 $1,337.11 $1,946.42
Kingston 1,263 1 1.38 $12.00 $12.00 $65.00 $90.00 $140.00 $202.50 $265.00 $390.00 $515.00 $765.00 $1,287.50 $1,912.50 $2,575.00 $3,825.00
Kite 241 1 3.26 $20.00 $32.00 $54.50 $92.00 $167.00 $392.00 $767.00
LaFayette 18,177 1 1.67 $7.00 $10.50 $31.00 $46.50 $67.00 $100.50 $127.00 $190.50 $247.00 $370.50 $608.75 $913.13 $1,217.50 $1,826.25
Lagrange 41,852 1 1.06 $6.00 $9.00 $46.80 $70.20 $108.00 $162.00 $199.80 $299.70 $383.40 $575.10 $934.20 $1,401.30 $1,770.60 $2,655.90
Lake Park 595 1 1.50 $13.00 $29.00 $59.00 $109.00 $209.00 $509.00 $1,009.00
Service Population is approximated and may not be actual.
Source: 1=EPA SDWIS 2017, 2=Census Population in 2016 *Based on data from FY2015 or earlierGeorgia Environmental Finance Authority
and Environmental Finance Center

Compare with caution. High rates may be justified and necessary to protect public health.
Inside Outside Inside Outside Inside Outside Inside Outside Inside Outside Inside Outside Inside Outside
50,000 Gallons
(6,684 cf)
5/8" or 3/4" Meter
100,000 Gallons
(13,369 cf)
5/8" or 3/4" Meter
250,000 Gallons
(33,422 cf)
1" Meter
500,000 Gallons
(66,845 cf)
1.5" or 2" Meter
Operating
Ratio
(FY2016)
Rate Table 8: 2017 Commercial Monthly-Equivalent Water Bills at Various Consumption Levels (Includes Base Charges)
Utility / Rate Structure
Service
Population
(Approx.)
Zero Gallons
(0 cf)
5/8" or 3/4" Meter
10,000 Gallons
(1,337 cf)
5/8" or 3/4" Meter
25,000 Gallons
(3,342 cf)
5/8" or 3/4" Meter
Lakeland 2,922 1 0.16 $15.00 $42.00 $87.00 $162.00 $312.00 $762.00 $1,512.00
Lavonia 8,008 1 0.89 $13.75 $14.75 $57.75 $63.15 $140.25 $153.90 $277.75 $305.15 $552.75 $607.65 $1,377.75 $1,515.15 $2,752.75 $3,027.65
Lawrenceville 24,000 1 $13.64 $68.20 $170.50 $341.00 $682.00 $1,705.00 $3,410.00
Lee County Utility Authority 13,500 1 1.19 $19.00 $42.00 $83.25 $152.00 $314.50 $877.00 $1,814.50
Leesburg 3,003 1 0.70 $11.00 $14.00 $31.00 $36.50 $61.00 $70.25 $111.00 $126.50 $211.00 $239.00 $511.00 $576.50 $1,011.00 $1,139.00
Lenox 1,011 1 0.81 $35.60 $53.40 $68.10 $102.15 $131.85 $197.85 $250.60 $376.10 $488.10 $732.60 $1,200.60 $1,802.10 $2,388.10 $3,584.60
Leslie 445 1 1.00 $20.00 $38.00 $71.75 $128.00 $240.50 $578.00 $1,140.50
Lexington 796 1 0.67 $20.00 $30.00 $68.00 $78.00 $158.00 $168.00 $308.00 $318.00 $608.00 $618.00 $1,508.00 $1,518.00 $3,008.00 $3,018.00
Liberty County 0 $44.00 $57.20 $90.50 $153.00 $278.00 $674.00 $1,354.00
Lincoln County 3,256 1 1.27 $27.27 $84.05 $184.25 $351.25 $685.25 $1,703.08 $3,388.90
Lincolnton 1,657 1 1.14 $22.50 $54.55 $111.10 $205.35 $393.85 $969.35 $1,926.85
Locust Grove 5,648 1 $15.39 $85.31 $253.31 $533.31 $1,093.31 $2,773.31 $5,573.31
Loganville 10,923 1 1.11 $23.54 $87.90 $269.19 $619.94 $1,321.44 $3,425.94 $6,933.44
Lone Oak 276 1 0.89 $20.50 $21.50 $85.50 $86.50 $183.00 $184.00 $345.50 $346.50 $670.50 $671.50 $1,645.50 $1,646.50 $3,270.50 $3,271.50
Lookout Mountain (no water bills)
Louisville 2,575 1 1.18 $20.00 $50.00 $106.25 $200.00 $387.50 $950.00 $1,887.50
Lowndes County 13,988 1 1.33 $17.78 $38.40 $108.35 $235.35 $489.35 $1,251.35 $2,521.35
Ludowici 1,651 1 0.86 $25.00 $48.45 $91.10 $167.60 $320.60 $779.60 $1,544.60
Lula 2,714 1 0.76 $13.75 $15.75 $59.50 $71.65 $136.35 $171.40 $268.35 $347.90 $532.35 $700.90 $1,324.35 $1,759.90 $2,644.35 $3,524.90
Lumber City 993 1 $19.25 $31.25 $61.25 $111.25 $211.25 $511.25 $1,011.25
Lumpkin 1,386 1 $54.80 $70.96 $86.10 $111.65 $134.35 $174.40 $215.60 $280.15 $390.60 $507.65 $915.60 $1,190.15 $1,790.60 $2,327.65
Lumpkin County Water and Sewer Authority 3,226 1 1.30 $44.00 $128.95 $341.18 $726.18 $1,496.18 $3,809.18 $7,723.18
Luthersville 1,274 1 1.47 $24.50 $66.10 $144.10 $274.10 $534.10 $1,314.10 $2,614.10
Lyerly 1,360 1 1.54 $30.00 $30.00 $56.10 $56.25 $108.30 $108.75 $195.30 $196.25 $369.30 $371.25 $891.30 $896.25 $1,761.30 $1,771.25
Lyons 4,100 1 0.90 $8.00 $16.00 $22.70 $45.40 $62.00 $124.00 $127.50 $255.00 $258.50 $517.00 $651.50 $1,303.00 $1,306.50 $2,613.00
Macon Water Authority - Bibb County 130,024 1 1.10 $9.00 $39.75 $85.87 $162.74 $316.49 $780.22 $1,563.48
Macon Water Authority - Jones County 130,024 1 1.10 $18.00 $47.12 $101.72 $192.72 $374.72 $948.49 $1,858.49
Macon Water Authority - Monroe County 130,024 1 1.10 $8.00 $47.97 $107.93 $207.87 $407.73 $1,011.33 $1,507.00
Madison 5,215 1 1.65 $4.60 $67.60 $162.10 $319.60 $634.60 $1,581.90 $3,166.10
Manchester 4,995 1 1.08 $15.00 $26.95 $63.20 $106.65 $135.50 $226.20 $256.00 $425.45 $497.00 $823.95 $1,220.00 $2,019.45 $2,425.00 $4,011.95
Mansfield 791 1 0.71 $18.00 $38.00 $105.50 $218.00 $443.00 $1,118.00 $2,243.00
Marietta Power and Water 60,100 1 1.57 $18.73 $55.93 $125.68 $241.93 $474.43 $1,171.93 $2,334.43
Marion County 3,783 1 1.05 $35.00 $74.15 $150.65 $281.90 $544.40 $1,361.90 $2,724.40
Marshallville 1,241 1 $22.63 $52.31 $102.41 $185.91 $367.91 $913.91 $1,823.91
Martin 1,599 1 1.03 $22.70 $25.20 $45.10 $47.60 $88.60 $91.10 $145.10 $147.60 $255.10 $257.60 $585.10 $587.60 $1,135.10 $1,137.60
Maxeys 325 1 $20.00 $28.50 $61.25 $72.00 $156.25 $167.00 $318.75 $329.50 $643.75 $654.50 $1,618.75 $1,629.50 $3,243.75 $3,254.50
Service Population is approximated and may not be actual.
Source: 1=EPA SDWIS 2017, 2=Census Population in 2016 *Based on data from FY2015 or earlierGeorgia Environmental Finance Authority
and Environmental Finance Center

Compare with caution. High rates may be justified and necessary to protect public health.
Inside Outside Inside Outside Inside Outside Inside Outside Inside Outside Inside Outside Inside Outside
50,000 Gallons
(6,684 cf)
5/8" or 3/4" Meter
100,000 Gallons
(13,369 cf)
5/8" or 3/4" Meter
250,000 Gallons
(33,422 cf)
1" Meter
500,000 Gallons
(66,845 cf)
1.5" or 2" Meter
Operating
Ratio
(FY2016)
Rate Table 8: 2017 Commercial Monthly-Equivalent Water Bills at Various Consumption Levels (Includes Base Charges)
Utility / Rate Structure
Service
Population
(Approx.)
Zero Gallons
(0 cf)
5/8" or 3/4" Meter
10,000 Gallons
(1,337 cf)
5/8" or 3/4" Meter
25,000 Gallons
(3,342 cf)
5/8" or 3/4" Meter
Maysville 2,057 1 $25.25 $36.11 $74.13 $84.99 $170.03 $180.89 $344.03 $354.89 $692.03 $702.89 $2,192.55 $2,212.02 $4,860.77 $4,904.19
McCaysville 7,020 1 1.31 $20.00 $30.00 $92.00 $138.00 $200.00 $300.00 $380.00 $570.00 $740.00 $1,110.00 $1,820.00 $2,730.00 $3,620.00 $5,430.00
McDonough 8,962 1 1.07 $13.01 $79.91 $180.26 $347.51 $682.01 $1,685.51 $3,410.08
McIntosh County 2,808 1 1.27 $29.00 $61.75 $118.00 $211.75 $399.25 $961.75 $1,899.25
McIntyre 684 1 0.57 $24.60 $42.20 $75.20 $130.20 $240.20 $570.20 $1,120.20
McRae-Helena 5,488 1 0.97 $5.91 $8.86 $29.04 $43.83 $70.59 $106.08 $124.96 $188.13 $206.96 $313.13 $452.96 $688.13 $862.96 $1,313.13
Meansville 263 1 1.49 $16.00 $56.00 $131.00 $256.00 $506.00 $1,256.00 $2,506.00
Meigs 1,154 1 0.85 $51.00 $73.96 $80.70 $129.76 $125.70 $215.26 $200.70 $357.76 $350.70 $642.76 $800.70 $1,497.76 $1,550.70 $2,922.76
Menlo 949 1 1.38 $12.00 $20.00 $48.00 $98.63 $115.50 $237.38 $228.00 $468.63 $453.00 $931.13 $1,128.00 $2,318.63 $2,253.00 $4,631.13
Metter 4,776 1 0.95 $9.00 $32.92 $77.27 $161.62 $340.12 $875.62 $1,768.12
Midville 700 1 0.63 $6.25 $8.25 $20.00 $28.90 $51.25 $75.80 $113.75 $169.55 $238.75 $357.05 $613.75 $919.55 $1,238.75 $1,857.05
Midway 2,595 1 1.49 $62.56 $70.36 $80.81 $92.26 $115.81 $134.26 $178.31 $209.26 $315.81 $374.26 $728.31 $869.26 $1,415.81 $1,694.26
Milledgeville 19,456 1 0.96 $12.89 $20.48 $32.84 $53.38 $75.59 $123.88 $146.84 $241.38 $289.34 $476.38 $716.84 $1,181.38 $1,429.34 $2,356.38
Millen 4,000 1 1.22 $12.00 $16.00 $32.81 $46.80 $65.51 $93.00 $123.26 $172.75 $238.76 $332.25 $585.26 $810.75 $1,162.76 $1,608.25
Milner 902 1 $16.00 $22.00 $65.25 $75.25 $162.75 $180.25 $325.25 $355.25 $650.25 $705.25 $1,625.25 $1,755.25 $3,250.25 $3,505.25
Mitchell 325 1 0.94 $17.00 $31.00 $44.00 $58.00 $89.00 $103.00 $164.00 $178.00 $314.00 $328.00 $764.00 $778.00 $1,514.00 $1,528.00
Molena 467 1 1.09 $14.00 $63.00 $164.25 $333.00 $670.50 $1,683.00 $3,370.50
Monroe 21,739 1 1.20 $11.25 $15.00 $65.05 $95.70 $145.75 $216.75 $280.25 $418.50 $549.25 $822.00 $1,356.25 $2,032.50 $2,735.00 $4,091.25
Monroe County 6,653 1 0.55 $16.00 $55.96 $122.56 $233.56 $455.56 $1,121.56 $2,239.56
Montezuma 3,443 1 1.08 $24.00 $68.00 $148.00 $298.00 $598.00 $1,498.00 $2,998.00
Monticello 3,505 1 1.46 $24.00 $64.40 $148.40 $288.40 $568.40 $1,408.40 $2,808.40
Morganton 2,060 1 $39.50 $87.50 $177.50 $327.50 $627.50 $1,527.50 $3,027.50
Morven 601 1 0.74 $15.15 $48.40 $105.90 $205.90 $405.90 $1,005.90 $2,005.90
Moultrie 15,634 1 1.46 $20.50 $39.70 $75.70 $135.70 $255.70 $615.70 $1,215.70
Mount Airy 1,384 1 0.98 $16.00 $28.00 $49.06 $64.00 $165.31 $214.00 $359.06 $464.00 $746.56 $964.00 $1,909.06 $2,464.00 $3,846.56 $4,964.00
Mount Zion 1,638 1 $57.30 $105.30 $195.30 $345.30 $645.30 $1,545.30 $3,045.30
Mountain Park 798 1 $7.22 $144.45 $432.45 $912.45 $1,872.45 $4,752.45 $9,552.45
MSO Water Systems, Inc. 0 $39.00 $47.00 $97.00 $197.00 $397.00 $997.00 $1,997.00
MSO Water Systems, Inc. - Briarcrest 0 $39.00 $48.00 $106.00 $206.00 $406.00 $1,006.00 $2,006.00
MSO Water Systems, Inc. - English Oaks 0 $33.00 $51.00 $96.00 $171.00 $321.00 $771.00 $1,521.00
Nahunta 1,074 1 1.25 $25.00 $52.00 $94.50 $169.50 $344.50 $869.50 $1,744.50
Nashville 4,896 1 1.32 $7.95 $28.45 $65.95 $128.45 $253.45 $628.45 $1,253.45
Newborn 832 1 1.52 $16.52 $21.52 $50.99 $59.82 $108.44 $117.27 $204.19 $213.02 $395.69 $404.52 $970.19 $979.02 $1,927.69 $1,936.52
Newington 227 1 0.74 $17.00 $29.85 $59.85 $109.85 $209.85 $509.85 $1,009.85
Newnan Utilities 34,000 1 $13.00 $56.70 $122.25 $231.50 $450.00 $1,105.50 $2,198.00
Newton 681 1 $21.00 $23.00 $38.00 $63.00 $113.00 $263.00 $513.00
Service Population is approximated and may not be actual.
Source: 1=EPA SDWIS 2017, 2=Census Population in 2016 *Based on data from FY2015 or earlierGeorgia Environmental Finance Authority
and Environmental Finance Center

Compare with caution. High rates may be justified and necessary to protect public health.
Inside Outside Inside Outside Inside Outside Inside Outside Inside Outside Inside Outside Inside Outside
50,000 Gallons
(6,684 cf)
5/8" or 3/4" Meter
100,000 Gallons
(13,369 cf)
5/8" or 3/4" Meter
250,000 Gallons
(33,422 cf)
1" Meter
500,000 Gallons
(66,845 cf)
1.5" or 2" Meter
Operating
Ratio
(FY2016)
Rate Table 8: 2017 Commercial Monthly-Equivalent Water Bills at Various Consumption Levels (Includes Base Charges)
Utility / Rate Structure
Service
Population
(Approx.)
Zero Gallons
(0 cf)
5/8" or 3/4" Meter
10,000 Gallons
(1,337 cf)
5/8" or 3/4" Meter
25,000 Gallons
(3,342 cf)
5/8" or 3/4" Meter
Newton County Water and Sewer Authority 62,384 1 1.31 $17.97 $63.33 $138.93 $264.93 $516.93 $1,272.93 $2,543.44
Nicholls 2,745 1 1.09 $22.44 $32.84 $48.84 $76.34 $133.84 $306.34 $593.84
Nicholson Water Authority 2,857 1 0.94 $13.00 $60.25 $139.00 $270.25 $532.75 $1,320.25 $2,632.75
Norman Park 1,173 1 0.96 $31.00 $44.28 $59.25 $86.67 $110.50 $163.62 $204.25 $304.37 $414.25 $619.37 $1,044.25 $1,564.37 $2,094.25 $3,139.37
Norwood 364 1 $9.00 $17.80 $34.30 $61.80 $116.80 $302.80 $587.80
Notla Water Authority 13,465 1 1.10 $38.00 $69.60 $128.85 $227.60 $425.10 $1,017.60 $2,005.10
Oakwood - Flowery Branch (no water bills)
Oakwood - Gainesville (no water bills)
Ochlocknee 789 1 0.54 $11.00 $11.80 $20.00 $24.40 $35.00 $45.40 $60.00 $80.40 $110.00 $150.40 $260.00 $360.40 $510.00 $710.40
Ocilla 2,540 1 1.01 $12.75 $22.75 $24.75 $34.75 $47.25 $57.25 $84.75 $94.75 $159.75 $169.75 $384.75 $394.75 $759.75 $769.75
Oconee 280 1 0.31 $15.00 $24.00 $39.00 $64.00 $114.00 $264.00 $514.00
Oconee County 19,279 1 2.44 $19.99 $76.06 $169.51 $325.26 $636.76 $1,591.21 $3,181.97
Odum 645 1 0.68 $10.50 $25.25 $54.50 $105.75 $208.25 $515.75 $1,028.25
Oxford 2,214 1 1.35 $19.77 $65.90 $164.75 $329.50 $659.00 $1,647.50 $3,295.00
Palmetto 3,965 1 $14.65 $62.65 $167.65 $342.65 $692.65 $1,742.65 $3,492.65
Parrott 229 1 0.86 $11.00 $38.20 $87.30 $169.80 $334.80 $829.80 $1,654.80
Patterson 972 1 0.85 $67.00 $83.00 $90.00 $117.51 $132.50 $181.31 $207.50 $293.81 $382.50 $556.31 $907.50 $1,343.81 $1,782.50 $2,656.31
Paulding County 113,204 1 1.04 $9.00 $86.10 $201.75 $394.50 $780.00 $1,936.50 $3,864.00
Pavo 741 1 0.61 $11.00 $16.00 $38.00 $55.60 $83.00 $121.60 $158.00 $231.60 $308.00 $451.60 $758.00 $1,111.60 $1,508.00 $2,211.60
Peachtree City Water and Sewerage Authority (no
water bills)
Pearson 2,000 2 1.14 $29.24 $62.79 $115.29 $202.79 $390.29 $952.79 $1,890.29
Pelham 3,601 1 1.70 $19.00 $24.70 $39.70 $51.61 $74.20 $96.46 $131.70 $171.21 $246.70 $320.71 $591.70 $769.21 $1,166.70 $1,516.71
Pembroke 2,571 1 0.83 $38.00 $60.05 $96.65 $161.65 $291.65 $711.65 $1,386.65
Perkins Water Authority 140 1 $22.00 $45.20 $88.70 $161.20 $306.20 $741.20 $1,466.20
Pickens County Water Authority 6,357 1 1.12 $36.00 $93.00 $198.00 $373.00 $723.00 $1,788.00 $3,553.00
Piedmont Water Co. - Lake Oconee 0 $39.50 $104.00 $259.50 $522.00 $1,072.00 $2,722.00 $5,472.00
Pike County Water and Sewer Authority 434 1 0.32 $42.00 $106.00 $226.00 $426.00 $826.00 $2,026.00 $4,026.00
Pine Mountain 1,697 1 0.83 $12.00 $15.00 $32.25 $44.25 $66.00 $93.00 $122.25 $174.25 $234.75 $336.75 $572.25 $824.25 $1,134.75 $1,636.75
Pinehurst 460 1 2.29 $38.50 $50.50 $73.00 $110.50 $185.50 $410.50 $785.50
Pineview 512 1 1.10 $12.00 $16.00 $31.00 $56.00 $106.00 $256.00 $506.00
Pitts 590 1 0.67 $7.50 $16.95 $37.20 $70.95 $138.45 $340.95 $678.45
Plains 892 1 0.65 $50.60 $62.24 $65.25 $80.54 $91.50 $113.44 $136.50 $169.69 $226.50 $282.19 $496.50 $619.69 $946.50 $1,182.19
Polk County Water Authority 24,061 1 0.94 $14.19 $63.03 $156.46 $317.71 $640.21 $1,607.71 $3,220.21
Polk County Water Authority - Vinson Mountain 24,061 1 0.94 $13.49 $71.53 $186.15 $380.65 $769.65 $1,936.65 $3,881.65
Pooler 21,187 1 1.09 $41.17 $53.22 $89.37 $179.37 $359.37 $989.87 $2,794.87
Port Wentworth 4,160 1 1.20 $28.95 $41.26 $64.59 $81.37 $125.55 $152.56 $227.16 $271.21 $430.37 $508.51 $1,039.99 $1,220.41 $2,056.04 $2,406.90
Service Population is approximated and may not be actual.
Source: 1=EPA SDWIS 2017, 2=Census Population in 2016 *Based on data from FY2015 or earlierGeorgia Environmental Finance Authority
and Environmental Finance Center

Compare with caution. High rates may be justified and necessary to protect public health.
Inside Outside Inside Outside Inside Outside Inside Outside Inside Outside Inside Outside Inside Outside
50,000 Gallons
(6,684 cf)
5/8" or 3/4" Meter
100,000 Gallons
(13,369 cf)
5/8" or 3/4" Meter
250,000 Gallons
(33,422 cf)
1" Meter
500,000 Gallons
(66,845 cf)
1.5" or 2" Meter
Operating
Ratio
(FY2016)
Rate Table 8: 2017 Commercial Monthly-Equivalent Water Bills at Various Consumption Levels (Includes Base Charges)
Utility / Rate Structure
Service
Population
(Approx.)
Zero Gallons
(0 cf)
5/8" or 3/4" Meter
10,000 Gallons
(1,337 cf)
5/8" or 3/4" Meter
25,000 Gallons
(3,342 cf)
5/8" or 3/4" Meter
Portal 879 1 0.80 $15.00 $18.00 $31.00 $36.00 $62.50 $73.50 $115.00 $136.00 $265.00 $313.50 $745.00 $876.00 $1,545.00 $1,813.50
Poulan 2,002 1 1.26 $21.00 $41.00 $71.00 $121.00 $221.00 $521.00 $1,021.00
Powder Springs 14,000 1 1.16 $28.64 $86.19 $181.54 $345.29 $687.79 $1,715.29 $3,427.79
Pulaski 280 1 0.85 $13.00 $30.00 $88.00 $188.00 $388.00 $988.00 $1,988.00
Quitman 4,942 1 0.98 $6.37 $34.02 $79.02 $154.02 $304.02 $754.02 $1,504.02
Rabun County Water and Sewer Authority 0 0.77 $18.00 $90.00 $225.00 $450.00 $900.00 $2,250.00 $4,500.00
Randolph County Water Authority 231 1 $20.00 $32.00 $54.50 $92.00 $167.00 $392.00 $767.00
Ray City 845 1 1.05 $23.84 $31.84 $45.34 $64.14 $77.59 $112.59 $131.34 $193.34 $238.84 $354.84 $561.34 $839.34 $1,098.84 $1,646.84
Register 182 1 $30.00 $63.00 $116.25 $207.50 $390.00 $937.50 $1,850.00
Remerton 1,479 1 0.94 $16.10 $36.10 $66.10 $116.10 $216.10 $516.10 $1,016.10
Rentz 310 1 1.64 $23.50 $37.90 $64.90 $109.90 $199.90 $469.90 $919.90
Reynolds 1,373 1 0.68 $25.00 $35.00 $50.20 $76.20 $97.45 $153.45 $176.20 $282.20 $333.70 $539.70 $806.20 $1,312.20 $1,593.70 $2,599.70
Rhine 413 1 1.22 $30.00 $30.00 $30.00 $30.00 $30.00 $30.00 $30.00
Riceboro 1,131 1 0.68 $46.00 $56.25 $76.75 $113.00 $185.50 $403.00 $765.50
Richland 1,323 1 0.62 $33.50 $40.00 $33.50 $40.00 $33.50 $40.00 $33.50 $40.00 $33.50 $40.00 $33.50 $40.00 $33.50 $40.00
Richmond Hill 11,258 1 1.52 $23.50 $35.25 $61.50 $92.25 $118.50 $177.75 $213.50 $320.25 $403.50 $605.25 $973.50 $1,460.25 $1,923.50 $2,885.25
Riddleville 128 1 0.47 $12.50 $36.50 $81.50 $156.50 $306.50 $756.50 $1,506.50
Rincon 9,880 1 1.94 $25.00 $36.00 $50.50 $68.25 $125.50 $152.00 $259.25 $299.50 $546.75 $624.50 $1,409.25 $1,599.50 $2,846.75 $3,224.50
Ringgold 2,743 1 1.05 $14.03 $44.51 $101.66 $196.91 $387.41 $958.84 $1,911.21
Ringgold - Dalton (no water bills)
Ringgold - Meadows (no water bills)
Roberta 1,615 1 0.86 $13.75 $43.75 $88.75 $171.25 $388.75 $1,101.25 $2,288.75
Rochelle 1,581 1 1.33 $14.50 $16.50 $37.00 $39.00 $70.75 $72.75 $127.00 $129.00 $239.50 $241.50 $577.00 $579.00 $1,139.50 $1,141.50
Rockdale County Water and Sewer Authority 72,621 1 $14.63 $55.33 $116.38 $218.13 $421.63 $1,048.85 $2,095.88
Rockmart 6,500 1 1.39 $8.84 $13.27 $44.20 $66.31 $113.80 $170.56 $235.55 $353.06 $524.55 $786.56 $1,412.55 $2,118.56 $2,892.55 $4,338.56
Rocky Ford 165 1 1.06 $13.50 $42.75 $110.25 $222.75 $447.75 $1,122.75 $2,247.75
Rome - Zone 1 45,586 1 1.54 $12.04 $44.69 $97.64 $185.87 $362.34 $898.08 $1,792.80
Rome - Zone 2 45,586 1 1.54 $12.04 $44.69 $97.64 $185.87 $362.34 $898.08 $1,792.80
Rome - Zone 3 45,586 1 1.54 $13.85 $52.35 $110.11 $206.36 $398.88 $983.70 $1,461.13
Rome - Zone 4 45,586 1 1.54 $15.06 $50.68 $108.44 $204.69 $397.21 $982.65 $1,960.66
Roopville 252 1 $1.50 $26.75 $118.00 $299.25 $661.75 $1,749.25 $3,561.75
Roswell 14,300 1 1.33 $5.01 $46.21 $108.01 $211.01 $725.51 $2,582.46 $5,676.08
Royston 2,800 1 0.94 $10.45 $40.45 $85.45 $160.45 $310.45 $760.45 $1,522.00
Rutledge 918 1 1.63 $14.00 $47.00 $118.25 $237.00 $474.50 $1,187.00 $2,374.50
Saint Marys 17,270 1 0.93 $20.45 $50.73 $99.93 $181.93 $345.93 $837.93 $1,657.93
Sale City 465 1 $11.00 $29.50 $82.00 $182.00 $382.00 $982.00 $1,982.00
Service Population is approximated and may not be actual.
Source: 1=EPA SDWIS 2017, 2=Census Population in 2016 *Based on data from FY2015 or earlierGeorgia Environmental Finance Authority
and Environmental Finance Center
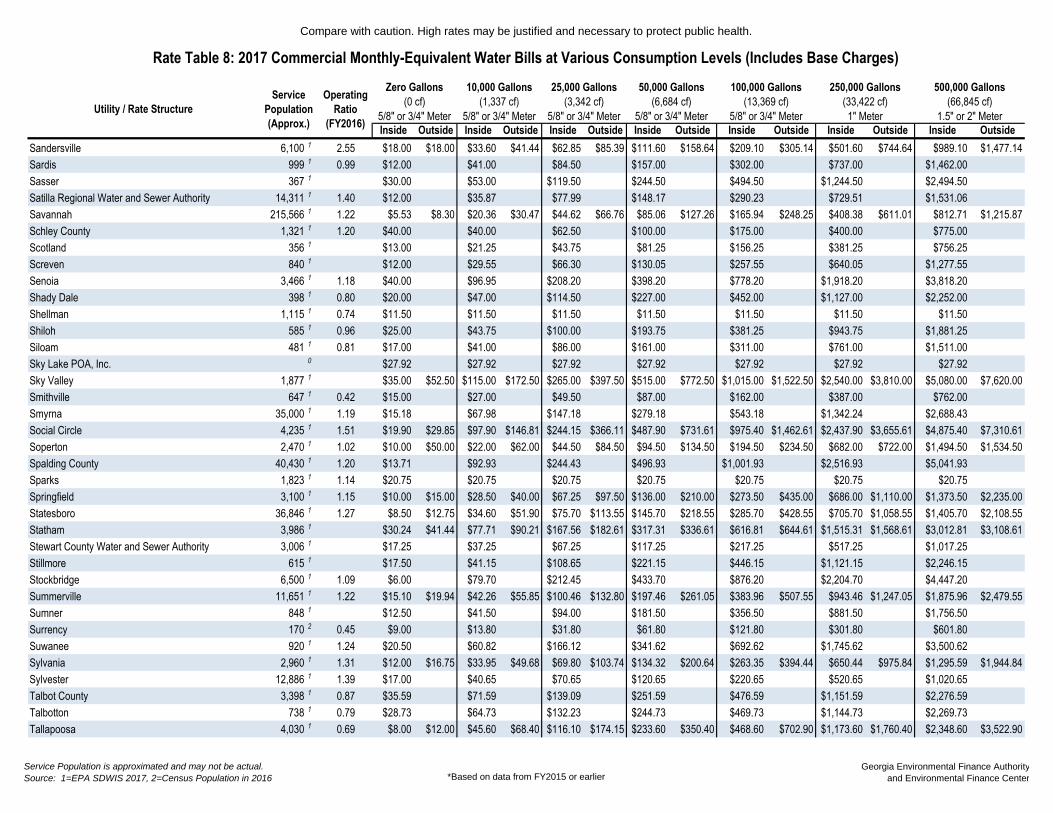
Compare with caution. High rates may be justified and necessary to protect public health.
Inside Outside Inside Outside Inside Outside Inside Outside Inside Outside Inside Outside Inside Outside
50,000 Gallons
(6,684 cf)
5/8" or 3/4" Meter
100,000 Gallons
(13,369 cf)
5/8" or 3/4" Meter
250,000 Gallons
(33,422 cf)
1" Meter
500,000 Gallons
(66,845 cf)
1.5" or 2" Meter
Operating
Ratio
(FY2016)
Rate Table 8: 2017 Commercial Monthly-Equivalent Water Bills at Various Consumption Levels (Includes Base Charges)
Utility / Rate Structure
Service
Population
(Approx.)
Zero Gallons
(0 cf)
5/8" or 3/4" Meter
10,000 Gallons
(1,337 cf)
5/8" or 3/4" Meter
25,000 Gallons
(3,342 cf)
5/8" or 3/4" Meter
Sandersville 6,100 1 2.55 $18.00 $18.00 $33.60 $41.44 $62.85 $85.39 $111.60 $158.64 $209.10 $305.14 $501.60 $744.64 $989.10 $1,477.14
Sardis 999 1 0.99 $12.00 $41.00 $84.50 $157.00 $302.00 $737.00 $1,462.00
Sasser 367 1 $30.00 $53.00 $119.50 $244.50 $494.50 $1,244.50 $2,494.50
Satilla Regional Water and Sewer Authority 14,311 1 1.40 $12.00 $35.87 $77.99 $148.17 $290.23 $729.51 $1,531.06
Savannah 215,566 1 1.22 $5.53 $8.30 $20.36 $30.47 $44.62 $66.76 $85.06 $127.26 $165.94 $248.25 $408.38 $611.01 $812.71 $1,215.87
Schley County 1,321 1 1.20 $40.00 $40.00 $62.50 $100.00 $175.00 $400.00 $775.00
Scotland 356 1 $13.00 $21.25 $43.75 $81.25 $156.25 $381.25 $756.25
Screven 840 1 $12.00 $29.55 $66.30 $130.05 $257.55 $640.05 $1,277.55
Senoia 3,466 1 1.18 $40.00 $96.95 $208.20 $398.20 $778.20 $1,918.20 $3,818.20
Shady Dale 398 1 0.80 $20.00 $47.00 $114.50 $227.00 $452.00 $1,127.00 $2,252.00
Shellman 1,115 1 0.74 $11.50 $11.50 $11.50 $11.50 $11.50 $11.50 $11.50
Shiloh 585 1 0.96 $25.00 $43.75 $100.00 $193.75 $381.25 $943.75 $1,881.25
Siloam 481 1 0.81 $17.00 $41.00 $86.00 $161.00 $311.00 $761.00 $1,511.00
Sky Lake POA, Inc. 0 $27.92 $27.92 $27.92 $27.92 $27.92 $27.92 $27.92
Sky Valley 1,877 1 $35.00 $52.50 $115.00 $172.50 $265.00 $397.50 $515.00 $772.50 $1,015.00 $1,522.50 $2,540.00 $3,810.00 $5,080.00 $7,620.00
Smithville 647 1 0.42 $15.00 $27.00 $49.50 $87.00 $162.00 $387.00 $762.00
Smyrna 35,000 1 1.19 $15.18 $67.98 $147.18 $279.18 $543.18 $1,342.24 $2,688.43
Social Circle 4,235 1 1.51 $19.90 $29.85 $97.90 $146.81 $244.15 $366.11 $487.90 $731.61 $975.40 $1,462.61 $2,437.90 $3,655.61 $4,875.40 $7,310.61
Soperton 2,470 1 1.02 $10.00 $50.00 $22.00 $62.00 $44.50 $84.50 $94.50 $134.50 $194.50 $234.50 $682.00 $722.00 $1,494.50 $1,534.50
Spalding County 40,430 1 1.20 $13.71 $92.93 $244.43 $496.93 $1,001.93 $2,516.93 $5,041.93
Sparks 1,823 1 1.14 $20.75 $20.75 $20.75 $20.75 $20.75 $20.75 $20.75
Springfield 3,100 1 1.15 $10.00 $15.00 $28.50 $40.00 $67.25 $97.50 $136.00 $210.00 $273.50 $435.00 $686.00 $1,110.00 $1,373.50 $2,235.00
Statesboro 36,846 1 1.27 $8.50 $12.75 $34.60 $51.90 $75.70 $113.55 $145.70 $218.55 $285.70 $428.55 $705.70 $1,058.55 $1,405.70 $2,108.55
Statham 3,986 1 $30.24 $41.44 $77.71 $90.21 $167.56 $182.61 $317.31 $336.61 $616.81 $644.61 $1,515.31 $1,568.61 $3,012.81 $3,108.61
Stewart County Water and Sewer Authority 3,006 1 $17.25 $37.25 $67.25 $117.25 $217.25 $517.25 $1,017.25
Stillmore 615 1 $17.50 $41.15 $108.65 $221.15 $446.15 $1,121.15 $2,246.15
Stockbridge 6,500 1 1.09 $6.00 $79.70 $212.45 $433.70 $876.20 $2,204.70 $4,447.20
Summerville 11,651 1 1.22 $15.10 $19.94 $42.26 $55.85 $100.46 $132.80 $197.46 $261.05 $383.96 $507.55 $943.46 $1,247.05 $1,875.96 $2,479.55
Sumner 848 1 $12.50 $41.50 $94.00 $181.50 $356.50 $881.50 $1,756.50
Surrency 170 2 0.45 $9.00 $13.80 $31.80 $61.80 $121.80 $301.80 $601.80
Suwanee 920 1 1.24 $20.50 $60.82 $166.12 $341.62 $692.62 $1,745.62 $3,500.62
Sylvania 2,960 1 1.31 $12.00 $16.75 $33.95 $49.68 $69.80 $103.74 $134.32 $200.64 $263.35 $394.44 $650.44 $975.84 $1,295.59 $1,944.84
Sylvester 12,886 1 1.39 $17.00 $40.65 $70.65 $120.65 $220.65 $520.65 $1,020.65
Talbot County 3,398 1 0.87 $35.59 $71.59 $139.09 $251.59 $476.59 $1,151.59 $2,276.59
Talbotton 738 1 0.79 $28.73 $64.73 $132.23 $244.73 $469.73 $1,144.73 $2,269.73
Tallapoosa 4,030 1 0.69 $8.00 $12.00 $45.60 $68.40 $116.10 $174.15 $233.60 $350.40 $468.60 $702.90 $1,173.60 $1,760.40 $2,348.60 $3,522.90
Service Population is approximated and may not be actual.
Source: 1=EPA SDWIS 2017, 2=Census Population in 2016 *Based on data from FY2015 or earlierGeorgia Environmental Finance Authority
and Environmental Finance Center

Compare with caution. High rates may be justified and necessary to protect public health.
Inside Outside Inside Outside Inside Outside Inside Outside Inside Outside Inside Outside Inside Outside
50,000 Gallons
(6,684 cf)
5/8" or 3/4" Meter
100,000 Gallons
(13,369 cf)
5/8" or 3/4" Meter
250,000 Gallons
(33,422 cf)
1" Meter
500,000 Gallons
(66,845 cf)
1.5" or 2" Meter
Operating
Ratio
(FY2016)
Rate Table 8: 2017 Commercial Monthly-Equivalent Water Bills at Various Consumption Levels (Includes Base Charges)
Utility / Rate Structure
Service
Population
(Approx.)
Zero Gallons
(0 cf)
5/8" or 3/4" Meter
10,000 Gallons
(1,337 cf)
5/8" or 3/4" Meter
25,000 Gallons
(3,342 cf)
5/8" or 3/4" Meter
Tarrytown 88 1 0.61 $30.00 $65.00 $117.50 $205.00 $380.00 $905.00 $1,780.00
Taylor County Water and Sewer Authority 91 1 $24.50 $30.50 $48.50 $78.50 $138.50 $318.50 $618.50
Temple 4,250 1 0.89 $75.00 $123.50 $221.25 $483.75 $933.75 $2,283.75 $4,533.75
Tennille 1,802 1 0.89 $21.84 $27.84 $50.64 $71.04 $99.39 $144.24 $180.64 $266.24 $355.64 $528.74 $880.64 $1,316.24 $1,755.64 $2,628.74
Thomaston 10,510 1 1.07 $6.50 $80.80 $192.25 $378.00 $749.50 $1,864.00 $3,721.50
Thomasville 23,577 1 1.23 $17.09 $30.32 $37.19 $61.42 $67.34 $108.07 $117.59 $185.82 $218.09 $341.32 $519.59 $807.82 $1,029.81 $1,599.10
Thomson-McDuffie County Water and Sewer
Commission 17,717 1 $11.45 $57.75 $127.20 $242.95 $474.45 $1,168.95 $2,326.45
Thunderbolt 2,668 1 0.84 $8.00 $28.60 $78.00 $148.00 $288.00 $708.00 $1,408.00
Tifton 24,871 1 1.69 $7.72 $11.49 $19.92 $29.09 $38.22 $55.49 $68.72 $99.49 $129.72 $187.49 $317.69 $458.88 $635.29 $917.63
Tignall 754 1 0.84 $21.50 $56.30 $138.80 $276.30 $551.30 $1,376.30 $2,751.30
Toccoa 24,960 1 1.47 $14.75 $18.44 $52.75 $65.96 $124.00 $155.06 $242.75 $303.56 $480.25 $600.56 $1,192.75 $1,491.56 $2,380.25 $2,976.56
Toomsboro 472 1 0.86 $22.00 $54.00 $114.00 $214.00 $414.00 $1,014.00 $2,014.00
Towns County Water and Sewer Authority 9,991 1 1.44 $40.00 $100.00 $190.00 $340.00 $640.00 $1,540.00 $3,070.00
Trenton (no water bills)
Trion 2,400 1 1.00 $15.00 $25.00 $55.00 $105.00 $205.00 $505.00 $1,005.00
Turin 671 1 1.48 $22.50 $69.10 $183.10 $373.10 $753.10 $1,893.10 $3,793.10
Turtle Cove POA 0 $40.00 $76.00 $226.00 $476.00 $976.00 $2,476.00 $4,976.00
Twiggs County 376 1 0.51 $23.50 $65.50 $144.25 $275.50 $538.00 $1,325.50 $2,638.00
Tybee Island 8,047 1 0.86 $12.20 $37.19 $97.54 $202.79 $413.29 $1,044.79 $2,097.29
Tyrone 7,121 2 0.88 $18.48 $41.09 $95.34 $205.09 $424.59 $1,076.16 $2,179.44
Unadilla 3,837 1 1.76 $15.95 $34.67 $69.77 $128.27 $245.27 $596.27 $1,181.27
Union City 18,636 1 1.18 $4.00 $99.60 $249.30 $504.05 $1,013.55 $2,545.05 $5,099.55
Upson County 5,778 1 1.38 $23.00 $71.25 $151.25 $288.75 $576.25 $1,438.75 $2,876.25
Utilities, Inc. of Georgia - The Landings 0 $18.25 $45.50 $144.80 $497.05 $1,201.55 $3,342.41 $6,910.53
Utilities, Inc. of Georgia - The Orchard 0 $46.00 $86.25 $217.90 $547.90 $1,207.90 $3,187.90 $6,487.90
Valdosta 56,019 1 0.53 $7.00 $14.00 $27.05 $54.11 $57.13 $114.27 $107.27 $214.53 $207.53 $415.07 $518.84 $1,037.67 $1,037.67 $2,075.35
Vidalia 13,050 1 0.78 $8.00 $12.00 $21.28 $30.64 $51.63 $71.04 $112.28 $151.84 $236.28 $317.84 $608.28 $815.84 $1,228.28 $1,645.84
Vienna 3,666 1 1.25 $40.60 $49.60 $62.60 $82.64 $100.10 $138.89 $162.60 $232.64 $312.60 $457.64 $762.60 $1,132.64 $1,512.60 $2,257.64
Villa Rica 13,996 1 1.02 $12.00 $15.00 $50.47 $72.00 $121.05 $175.69 $302.97 $448.28 $678.92 $1,012.23 $1,715.79 $2,560.60 $3,652.75 $5,469.01
Waco 913 1 $16.00 $24.00 $52.00 $64.00 $119.50 $139.00 $232.00 $264.00 $457.00 $514.00 $1,132.00 $1,264.00 $2,257.00 $2,514.00
Wadley 2,500 1 1.47 $25.00 $39.00 $65.25 $109.00 $196.50 $459.00 $896.50
Waleska 2,691 1 1.00 $15.52 $75.65 $204.95 $431.20 $883.70 $2,241.20 $4,503.70
Walker County Rural Water and Sewer Authority 3,270 1 1.38 $17.50 $58.45 $126.70 $240.45 $467.95 $1,151.20 $2,288.70
Walker County Water and Sewer Authority 36,000 1 0.96 $17.00 $56.70 $116.25 $215.50 $414.00 $1,009.50 $2,002.00
Walthourville 3,858 1 1.06 $14.70 $19.20 $34.90 $52.65 $71.40 $107.40 $133.90 $201.15 $271.40 $407.65 $683.90 $1,027.15 $1,371.40 $2,059.65
Walton County Water and Sewer Authority 36,387 1 $23.75 $87.35 $227.27 $465.77 $942.77 $2,374.62 $4,807.70
Service Population is approximated and may not be actual.
Source: 1=EPA SDWIS 2017, 2=Census Population in 2016 *Based on data from FY2015 or earlierGeorgia Environmental Finance Authority
and Environmental Finance Center

Compare with caution. High rates may be justified and necessary to protect public health.
Inside Outside Inside Outside Inside Outside Inside Outside Inside Outside Inside Outside Inside Outside
50,000 Gallons
(6,684 cf)
5/8" or 3/4" Meter
100,000 Gallons
(13,369 cf)
5/8" or 3/4" Meter
250,000 Gallons
(33,422 cf)
1" Meter
500,000 Gallons
(66,845 cf)
1.5" or 2" Meter
Operating
Ratio
(FY2016)
Rate Table 8: 2017 Commercial Monthly-Equivalent Water Bills at Various Consumption Levels (Includes Base Charges)
Utility / Rate Structure
Service
Population
(Approx.)
Zero Gallons
(0 cf)
5/8" or 3/4" Meter
10,000 Gallons
(1,337 cf)
5/8" or 3/4" Meter
25,000 Gallons
(3,342 cf)
5/8" or 3/4" Meter
Warm Springs 1,120 1 0.90 $12.00 $15.00 $71.50 $84.50 $160.75 $188.75 $309.50 $362.50 $607.00 $710.00 $1,499.50 $1,752.50 $2,987.00 $3,490.00
Warner Robins 64,163 1 1.14 $10.02 $35.92 $74.77 $139.52 $269.02 $660.33 $1,315.85
Warrenton 2,800 1 1.15 $37.21 $41.60 $79.29 $88.27 $153.54 $170.62 $277.29 $307.87 $524.79 $582.37 $1,267.29 $1,405.87 $2,504.79 $2,778.37
Warwick 864 1 $9.00 $42.30 $94.80 $182.30 $357.30 $882.30 $1,757.30
Washington 4,134 1 1.06 $19.00 $28.50 $59.00 $88.50 $119.00 $178.50 $219.00 $328.50 $419.00 $628.50 $1,019.00 $1,528.50 $2,019.00 $3,028.50
Water Service Company of Georgia - Lake Riverside 0 $23.58 $72.68 $146.33 $269.08 $514.58 $1,251.08 $2,478.58
Waycross 21,154 1 0.84 $16.76 $30.66 $51.52 $86.28 $155.80 $375.21 $744.67
Waynesboro 5,813 1 0.88 $3.19 $3.19 $47.59 $60.99 $114.19 $147.69 $225.19 $292.19 $447.19 $581.19 $1,114.78 $1,449.78 $2,227.18 $2,897.18
Webster County 1,038 1 1.19 $60.00 $60.00 $60.00 $97.50 $172.50 $397.50 $772.50
West Point 3,929 1 $17.93 $24.59 $57.10 $74.86 $142.57 $177.16 $288.96 $351.62 $581.74 $700.55 $1,460.08 $1,747.34 $2,923.99 $3,491.99
Whigham 879 1 1.50 $18.02 $35.78 $69.08 $124.58 $235.58 $568.58 $1,123.58
White 806 1 $19.00 $24.00 $48.33 $53.33 $111.18 $116.18 $215.93 $220.93 $425.43 $430.43 $1,074.93 $1,074.93 $2,142.43 $2,162.43
White County Water Authority 4,420 1 0.89 $32.00 $76.61 $161.51 $303.01 $586.01 $1,435.01 $2,877.01
White Plains 413 1 $17.00 $41.00 $86.00 $161.00 $311.00 $761.00 $1,511.00
Whitesburg 931 1 $15.00 $19.00 $38.47 $54.15 $75.52 $109.65 $137.27 $202.15 $260.77 $387.15 $631.27 $942.15 $1,248.77 $1,867.15
Willacoochee 1,940 1 1.25 $28.00 $49.00 $94.00 $169.00 $319.00 $769.00 $1,519.00
Williamson 408 1 0.86 $16.00 $26.00 $78.38 $106.28 $200.63 $258.53 $404.38 $512.28 $811.88 $1,019.78 $2,034.38 $2,542.28 $4,071.88 $5,079.78
Winder 32,971 1 1.46 $16.25 $25.20 $86.25 $95.20 $191.25 $200.20 $366.25 $375.20 $716.25 $725.20 $1,805.70 $1,806.20 $3,589.10 $3,589.90
Woodbine 1,508 1 1.25 $6.00 $30.50 $79.50 $165.25 $336.75 $851.25 $1,708.75
Woodbury 961 1 1.06 $14.39 $80.12 $226.22 $469.72 $956.72 $2,421.93 $4,875.52
Woodstock 10,070 1 1.00 $12.00 $61.50 $148.95 $294.70 $586.20 $1,460.70 $2,918.20
Wrens 2,375 1 0.97 $20.10 $26.70 $53.94 $66.84 $110.34 $133.74 $204.34 $245.24 $392.34 $468.24 $958.74 $1,137.24 $1,904.04 $2,258.64
Service Population is approximated and may not be actual.
Source: 1=EPA SDWIS 2017, 2=Census Population in 2016 *Based on data from FY2015 or earlierGeorgia Environmental Finance Authority
and Environmental Finance Center

Utility / Rate Structure
Different
than
Residential
Sewer Rate
Structure?
Billing Period
(Monthly,
Bimonthly,
Quarterly, Other)
Base Charge
Pricing
Monthly Gallons
Provided with
Base Charge
(Allowance)
Commercial Sewer Rate
Structure
Number
of
Blocks
First Block
Maximum
(Monthly
Gallons)
Outside/Inside
Bill Differential at
25,000 Gallons
Adel 5,311 1 Yes Monthly Constant 9,000 Uniform Rate
Adrian
Ailey 527 1 No Monthly Constant 2,000 Uniform Rate
Alamo 3,457 1 No Monthly Constant 2,000 Uniform Rate
Albany 87,029 1 No Monthly Constant 0 Uniform Rate 95%
Alcovy Shores Water Authority
Allentown
Alma 4,700 1 No Monthly Constant 2,000 Increasing Block 4 5,000 200%
Alston
Alto
Americus 16,255 1 No Monthly Constant 0 Uniform Rate 200%
Andersonville 400 1 No Monthly Constant 2,000 Uniform Rate
Arabi
Argyle
Arlington 1,243 1 Yes Monthly Constant 0 Increasing Block 4 2,000
Arnoldsville
Ashburn 4,272 1 Yes Monthly Constant 0 Increasing Block 2 5,000
Athens-Clarke County 120,266 1 No Monthly Constant 0 Uniform Rate
Atlanta 650,000 1 No Monthly Constant 0 Increasing Block 3 2,244 28%
Attapulgus
Auburn 6,904 1 No Monthly Constant 2,000 Uniform Rate
Augusta 204,000 1 Yes Monthly By Meter Size 0 Uniform Rate
Austell 7,774 1 No Monthly None 0 Uniform Rate 104%
Avera
Baconton 985 1 Yes Monthly Constant 0 Uniform Rate 139%
Bainbridge 13,546 1 Yes Monthly Constant 0 Uniform Rate
Baldwin 4,160 1 No Monthly Constant 2,000 Increasing Block 3 6,000 103%
Baldwin County 21,840 1 No Monthly Constant 2,000 Increasing Block 5 4,999
Ball Ground 2,470 1 No Monthly Constant 0 Uniform Rate
Banks County 6,453 1 Yes Monthly Constant 2,000 Increasing Block 5 6,000
Barnesville 6,755 1 No Monthly Constant 2,000 Uniform at One Block's Rate 3 5,000
Barrow County Water and Sewer Authority 14,043 1 No Monthly Constant 2,000 Uniform Rate
Bartow 286 1 Yes Monthly Constant 2,000 Uniform Rate
Bartow County 50,162 1 No Monthly By Meter Size 0 Uniform Rate
Rate Table 9: 2017 Sewer Rate Structures for Commercial Customers
Service
Population
(Approx.)
Service Population is approximated and may not be actual.
Source: 1=EPA SDWIS 2017, 2=Census Population in 2016
Georgia Environmental Finance Authority
and Environmental Finance Center
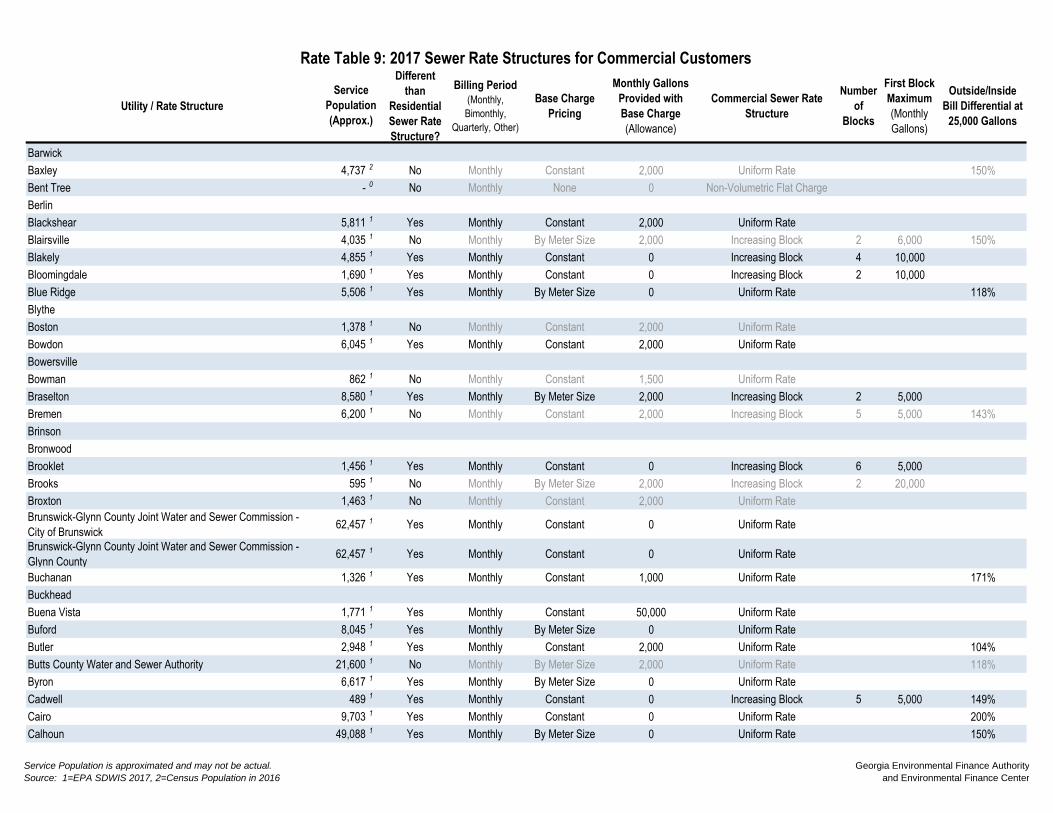
Utility / Rate Structure
Different
than
Residential
Sewer Rate
Structure?
Billing Period
(Monthly,
Bimonthly,
Quarterly, Other)
Base Charge
Pricing
Monthly Gallons
Provided with
Base Charge
(Allowance)
Commercial Sewer Rate
Structure
Number
of
Blocks
First Block
Maximum
(Monthly
Gallons)
Outside/Inside
Bill Differential at
25,000 Gallons
Rate Table 9: 2017 Sewer Rate Structures for Commercial Customers
Service
Population
(Approx.)
Barwick
Baxley 4,737 2 No Monthly Constant 2,000 Uniform Rate 150%
Bent Tree - 0 No Monthly None 0 Non-Volumetric Flat Charge
Berlin
Blackshear 5,811 1 Yes Monthly Constant 2,000 Uniform Rate
Blairsville 4,035 1 No Monthly By Meter Size 2,000 Increasing Block 2 6,000 150%
Blakely 4,855 1 Yes Monthly Constant 0 Increasing Block 4 10,000
Bloomingdale 1,690 1 Yes Monthly Constant 0 Increasing Block 2 10,000
Blue Ridge 5,506 1 Yes Monthly By Meter Size 0 Uniform Rate 118%
Blythe
Boston 1,378 1 No Monthly Constant 2,000 Uniform Rate
Bowdon 6,045 1 Yes Monthly Constant 2,000 Uniform Rate
Bowersville
Bowman 862 1 No Monthly Constant 1,500 Uniform Rate
Braselton 8,580 1 Yes Monthly By Meter Size 2,000 Increasing Block 2 5,000
Bremen 6,200 1 No Monthly Constant 2,000 Increasing Block 5 5,000 143%
Brinson
Bronwood
Brooklet 1,456 1 Yes Monthly Constant 0 Increasing Block 6 5,000
Brooks 595 1 No Monthly By Meter Size 2,000 Increasing Block 2 20,000
Broxton 1,463 1 No Monthly Constant 2,000 Uniform Rate
Brunswick-Glynn County Joint Water and Sewer Commission -
City of Brunswick 62,457 1 Yes Monthly Constant 0 Uniform Rate
Brunswick-Glynn County Joint Water and Sewer Commission -
Glynn County 62,457 1 Yes Monthly Constant 0 Uniform Rate
Buchanan 1,326 1 Yes Monthly Constant 1,000 Uniform Rate 171%
Buckhead
Buena Vista 1,771 1 Yes Monthly Constant 50,000 Uniform Rate
Buford 8,045 1 Yes Monthly By Meter Size 0 Uniform Rate
Butler 2,948 1 Yes Monthly Constant 2,000 Uniform Rate 104%
Butts County Water and Sewer Authority 21,600 1 No Monthly By Meter Size 2,000 Uniform Rate 118%
Byron 6,617 1 Yes Monthly By Meter Size 0 Uniform Rate
Cadwell 489 1 Yes Monthly Constant 0 Increasing Block 5 5,000 149%
Cairo 9,703 1 Yes Monthly Constant 0 Uniform Rate 200%
Calhoun 49,088 1 Yes Monthly By Meter Size 0 Uniform Rate 150%
Service Population is approximated and may not be actual.
Source: 1=EPA SDWIS 2017, 2=Census Population in 2016
Georgia Environmental Finance Authority
and Environmental Finance Center

Utility / Rate Structure
Different
than
Residential
Sewer Rate
Structure?
Billing Period
(Monthly,
Bimonthly,
Quarterly, Other)
Base Charge
Pricing
Monthly Gallons
Provided with
Base Charge
(Allowance)
Commercial Sewer Rate
Structure
Number
of
Blocks
First Block
Maximum
(Monthly
Gallons)
Outside/Inside
Bill Differential at
25,000 Gallons
Rate Table 9: 2017 Sewer Rate Structures for Commercial Customers
Service
Population
(Approx.)
Camak 182 1 No Monthly Constant 1,000 Uniform Rate
Camilla 5,922 1 Yes Monthly Constant 2,000 Uniform Rate 120%
Canon
Canton 14,300 1 No Monthly Constant 2,000 Uniform Rate
Carlton
Carnesville 736 1 Yes Monthly By Meter Size 0 Uniform Rate 114%
Carroll County Water Authority 44,700 1 No Monthly By Meter Size 1,496 Uniform Rate
Carrollton 24,310 1 No Monthly Constant 2,244 Uniform Rate 120%
Cartersville 24,830 1 No Monthly By Meter Size 0 Uniform Rate 190%
Catoosa Utility District Authority
Cave Spring 4,180 1 No Monthly Constant 2,000 Uniform Rate
Cedartown 9,750 1 No Monthly By Meter Size 3,740 Decreasing Block 2 187,000 148%
Centerville 9,940 1 Yes Monthly Constant 2,000 Uniform Rate
Chatsworth Water Works Commission 29,617 1 No Monthly Constant 500 Uniform Rate 119%
Chattooga County
Chattooga County - Cloudland
Chattooga County - Gore Subligna
Cherokee County Water and Sewerage Authority 145,528 1 No Monthly By Meter Size 2,000 Uniform Rate
Chester 1,777 1 Yes Monthly Constant 3,000 Uniform Rate
Chickamauga 4,150 1 Yes Monthly Constant 0 Increasing Block 2 5,000 133%
Clarkesville 5,785 1 No Monthly Constant 2,000 Uniform Rate 190%
Claxton 4,433 1 No Monthly Constant 3,000 Increasing Block 4 5,000 130%
Clay County
Clayton 7,225 1 Yes Monthly By Meter Size 2,000 Increasing Block 4 6,000 231%
Clayton - North Loop
Clayton County Water Authority 270,000 1 Yes Monthly By Meter Size 0 Increasing Block 2 3,000
Cleveland 3,640 1 Yes Monthly By Meter Size 2,000 Increasing Block 3 4,000 164%
Climax
Cobb County 533,000 1 Yes Monthly By Meter Size 0 Uniform Rate 103%
Cobbtown
Cochran 5,124 1 Yes Monthly Constant 1,000 Uniform Rate 143%
Coffee County
College Park 20,382 1 Yes Monthly Constant 0 Uniform Rate
Collins 780 1 No Monthly None 0 Non-Volumetric Flat Charge
Service Population is approximated and may not be actual.
Source: 1=EPA SDWIS 2017, 2=Census Population in 2016
Georgia Environmental Finance Authority
and Environmental Finance Center

Utility / Rate Structure
Different
than
Residential
Sewer Rate
Structure?
Billing Period
(Monthly,
Bimonthly,
Quarterly, Other)
Base Charge
Pricing
Monthly Gallons
Provided with
Base Charge
(Allowance)
Commercial Sewer Rate
Structure
Number
of
Blocks
First Block
Maximum
(Monthly
Gallons)
Outside/Inside
Bill Differential at
25,000 Gallons
Rate Table 9: 2017 Sewer Rate Structures for Commercial Customers
Service
Population
(Approx.)
Colquitt 1,895 1 No Monthly By Meter Size 0 Increasing Block 3 15,000
Columbia County 101,967 1 Yes Monthly By Meter Size 0 Uniform Rate
Columbus Water Works 229,000 1 Yes Monthly Constant 748 Decreasing Block 2 11,220
Comer 1,380 1 No Monthly Constant 1,500 Uniform Rate 225%
Commerce 6,819 1 No Monthly Constant 0 Uniform Rate 162%
Concord 741 1 No Monthly Constant 2,000 Uniform Rate 102%
Consolidated Utilities, Inc. - 0 No Monthly Constant 0 Increasing Block 3 5,000
Consolidated Utilities, Inc. - Coastal Water & Sewerage, LLC - 21
Centre - 0 No Monthly None 0 Non-Volumetric Flat Charge
Consolidated Utilities, Inc. - Coastal Water & Sewerage, LLC -
Cypress Lakes
Consolidated Utilities, Inc. - Coastal Water & Sewerage, LLC -
Little Neck Plantation
Consolidated Utilities, Inc. - Coastal Water & Sewerage, LLC -
Rebel Estates
Consolidated Utilities, Inc. - Coastal Water & Sewerage, LLC -
Ridgecrest, Park of Commerce, Millcreek - 0 No Monthly Constant 0 Increasing Block 2 5,000
Consolidated Utilities, Inc. - Coastal Water & Sewerage, LLC -
Sandy Woods, South Pointe, Southern Hills, White Bluff,
Mingledorff, Cottonvale
Consolidated Utilities, Inc. - Coastal Water Company - 0 No Monthly Constant 0 Increasing Block 2 5,000
Consolidated Utilities, Inc. - Coastal Water Company - Rate 2 - 0 No Monthly Constant 0 Increasing Block 2 5,000
Consolidated Utilities, Inc. - Golden Isles
Consolidated Utilities, Inc. - Whitemarsh Estates
Consolidated Utilities, Inc. - Woodlawn
Coolidge 692 1 Yes Monthly Constant 0 Uniform Rate 133%
Coosa Water Authority
Cordele 10,691 1 No Monthly Constant 0 Uniform Rate 178%
Cornelia 6,130 1 Yes Monthly Constant 2,000 Increasing Block 4 50,000 112%
Covington 20,379 1 No Monthly Constant 3,000 Uniform Rate
Coweta County Water and Sewer Authority 59,800 1 Yes Monthly Constant 0 Increasing Block 4 5,000
Crawford 1,170 1 No Monthly Constant 2,000 Increasing Block 2 10,000 157%
Crawford County
Crawfordville 582 1 No Monthly Constant 1,500 Increasing Block 3 5,000
Cumming 47,541 1 Yes Monthly Constant 0 Uniform Rate
Cusseta-Chattahoochee County
Service Population is approximated and may not be actual.
Source: 1=EPA SDWIS 2017, 2=Census Population in 2016
Georgia Environmental Finance Authority
and Environmental Finance Center

Utility / Rate Structure
Different
than
Residential
Sewer Rate
Structure?
Billing Period
(Monthly,
Bimonthly,
Quarterly, Other)
Base Charge
Pricing
Monthly Gallons
Provided with
Base Charge
(Allowance)
Commercial Sewer Rate
Structure
Number
of
Blocks
First Block
Maximum
(Monthly
Gallons)
Outside/Inside
Bill Differential at
25,000 Gallons
Rate Table 9: 2017 Sewer Rate Structures for Commercial Customers
Service
Population
(Approx.)
Cuthbert 2,613 1 No Monthly Constant 2,000 Increasing Block 2 5,000 105%
Dade County Water and Sewer Authority 36,400 1 Yes Monthly Constant 2,000 Uniform Rate
Dade County Water and Sewer Authority - Canyon Ridge 36,400 1 No Monthly None 0 Non-Volumetric Flat Charge
Dade County Water and Sewer Authority - Flintstone 36,400 1 No Monthly Constant 2,000 Uniform Rate
Dade County Water and Sewer Authority - Mountain (Pumped 2x) 36,400 1 Yes Monthly Constant 2,000 Uniform Rate
Dade County Water and Sewer Authority - Mountain (Pumped 3x) 36,400 1 No Monthly Constant 2,000 Uniform Rate
Dade County Water and Sewer Authority - North End - 0 No Monthly Constant 2,000 Uniform Rate
Dade County Water and Sewer Authority - South End 36,400 1 No Monthly Constant 2,000 Uniform Rate 113%
Dade County Water and Sewer Authority - Valley 36,400 1 Yes Monthly Constant 2,000 Uniform Rate
Dahlonega 4,120 1 No Monthly By Meter Size 0 Uniform Rate
Daisy
Dallas 7,556 1 Yes Monthly None 0 Increasing Block 4 6,000 123%
Damascus
Danielsville 1,092 1 No Monthly Constant 2,000 Increasing Block 3 6,000 163%
Danville
Darien 3,242 1 No Monthly Constant 0 Increasing Block 5 5,000 127%
Davisboro 1,535 1 Yes Monthly Constant 0 Uniform Rate
Dawson 4,836 1 Yes Monthly Constant 1,000 Uniform Rate
Dawsonville 2,424 1 Yes Monthly Constant 1,500 Increasing Block 3 5,000 116%
Decatur Consolidated Water Services, Inc. - Doublegate Phase VI
Decatur Consolidated Water Services, Inc. - Holly Isles
Decatur Consolidated Water Services, Inc. - Pebble Hill Estates
Decatur Consolidated Water Services, Inc. - Redrock Estates
Decatur Consolidated Water Services, Inc. - Riverbend Estates
Decatur Consolidated Water Services, Inc. - Woodcrest
Subdivision
Deepstep
Dekalb County 670,000 1 No Bi-monthly By Meter Size 0 Uniform Rate
Demorest 15,130 1 Yes Monthly Constant 2,000 Increasing Block 3 10,000 112%
Denton
Dexter 1,976 1 Yes Monthly Constant 2,000 Increasing Block 4 5,000 112%
Dillard 133 1 Yes Monthly None 0 Non-Volumetric Flat Charge
Doerun 967 1 No Monthly Constant 0 Increasing Block 6 2,000
Service Population is approximated and may not be actual.
Source: 1=EPA SDWIS 2017, 2=Census Population in 2016
Georgia Environmental Finance Authority
and Environmental Finance Center
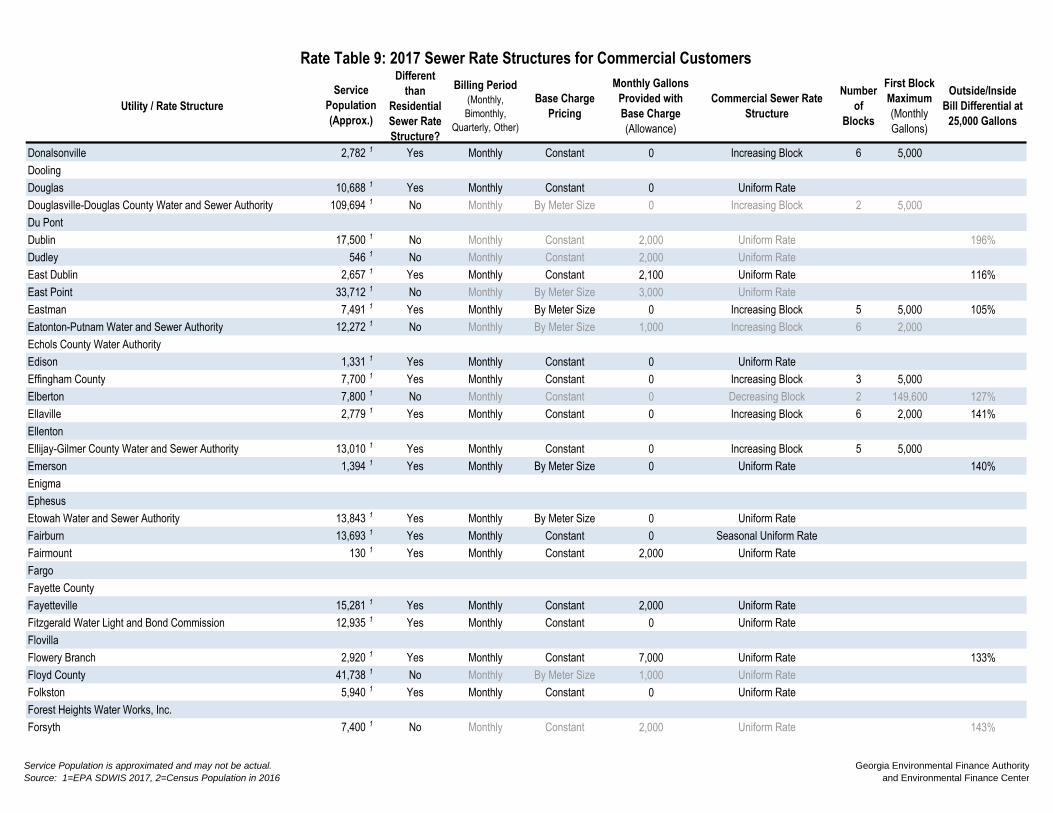
Utility / Rate Structure
Different
than
Residential
Sewer Rate
Structure?
Billing Period
(Monthly,
Bimonthly,
Quarterly, Other)
Base Charge
Pricing
Monthly Gallons
Provided with
Base Charge
(Allowance)
Commercial Sewer Rate
Structure
Number
of
Blocks
First Block
Maximum
(Monthly
Gallons)
Outside/Inside
Bill Differential at
25,000 Gallons
Rate Table 9: 2017 Sewer Rate Structures for Commercial Customers
Service
Population
(Approx.)
Donalsonville 2,782 1 Yes Monthly Constant 0 Increasing Block 6 5,000
Dooling
Douglas 10,688 1 Yes Monthly Constant 0 Uniform Rate
Douglasville-Douglas County Water and Sewer Authority 109,694 1 No Monthly By Meter Size 0 Increasing Block 2 5,000
Du Pont
Dublin 17,500 1 No Monthly Constant 2,000 Uniform Rate 196%
Dudley 546 1 No Monthly Constant 2,000 Uniform Rate
East Dublin 2,657 1 Yes Monthly Constant 2,100 Uniform Rate 116%
East Point 33,712 1 No Monthly By Meter Size 3,000 Uniform Rate
Eastman 7,491 1 Yes Monthly By Meter Size 0 Increasing Block 5 5,000 105%
Eatonton-Putnam Water and Sewer Authority 12,272 1 No Monthly By Meter Size 1,000 Increasing Block 6 2,000
Echols County Water Authority
Edison 1,331 1 Yes Monthly Constant 0 Uniform Rate
Effingham County 7,700 1 Yes Monthly Constant 0 Increasing Block 3 5,000
Elberton 7,800 1 No Monthly Constant 0 Decreasing Block 2 149,600 127%
Ellaville 2,779 1 Yes Monthly Constant 0 Increasing Block 6 2,000 141%
Ellenton
Ellijay-Gilmer County Water and Sewer Authority 13,010 1 Yes Monthly Constant 0 Increasing Block 5 5,000
Emerson 1,394 1 Yes Monthly By Meter Size 0 Uniform Rate 140%
Enigma
Ephesus
Etowah Water and Sewer Authority 13,843 1 Yes Monthly By Meter Size 0 Uniform Rate
Fairburn 13,693 1 Yes Monthly Constant 0 Seasonal Uniform Rate
Fairmount 130 1 Yes Monthly Constant 2,000 Uniform Rate
Fargo
Fayette County
Fayetteville 15,281 1 Yes Monthly Constant 2,000 Uniform Rate
Fitzgerald Water Light and Bond Commission 12,935 1 Yes Monthly Constant 0 Uniform Rate
Flovilla
Flowery Branch 2,920 1 Yes Monthly Constant 7,000 Uniform Rate 133%
Floyd County 41,738 1 No Monthly By Meter Size 1,000 Uniform Rate
Folkston 5,940 1 Yes Monthly Constant 0 Uniform Rate
Forest Heights Water Works, Inc.
Forsyth 7,400 1 No Monthly Constant 2,000 Uniform Rate 143%
Service Population is approximated and may not be actual.
Source: 1=EPA SDWIS 2017, 2=Census Population in 2016
Georgia Environmental Finance Authority
and Environmental Finance Center

Utility / Rate Structure
Different
than
Residential
Sewer Rate
Structure?
Billing Period
(Monthly,
Bimonthly,
Quarterly, Other)
Base Charge
Pricing
Monthly Gallons
Provided with
Base Charge
(Allowance)
Commercial Sewer Rate
Structure
Number
of
Blocks
First Block
Maximum
(Monthly
Gallons)
Outside/Inside
Bill Differential at
25,000 Gallons
Rate Table 9: 2017 Sewer Rate Structures for Commercial Customers
Service
Population
(Approx.)
Forsyth County 138,368 1 Yes Monthly Constant 0 Uniform Rate
Fort Gaines 1,422 1 Yes Monthly Constant 0 Uniform Rate
Fort Oglethorpe 9,446 1 Yes Monthly Constant 2,000 Uniform Rate 130%
Fort Valley Utility Commission 17,645 1 No Monthly Constant 0 Increasing Block 3 4,488
Franklin County 2,764 1 No Monthly By Meter Size 2,000 Uniform Rate
Franklin Springs 997 1 No Monthly Constant 0 Uniform Rate
Fulton County 172,533 1 No Bi-monthly Constant 0 Uniform Rate
Funston
Gainesville 117,962 1 Yes Monthly Constant 0 Uniform Rate
Garden City 8,166 1 Yes Monthly Constant 0 Increasing Block 6 2,500 134%
Garfield
Gay
Georgetown-Quitman County Water, Sewer and Solid Waste
Authority 985 1 No Monthly Constant 2,000 Uniform Rate
Gibson 720 1 Yes Monthly Constant 3,000 Uniform Rate
Glennville 4,711 1 No Monthly By Meter Size 2,000 Increasing Block 4 5,000
Glenwood 1,012 1 No Monthly Constant 2,000 Uniform Rate
Gordon 2,340 1 No Monthly Constant 2,000 Uniform Rate
Graham
Grantville 1,508 1 Yes Monthly Constant 2,000 Uniform Rate
Greensboro 3,156 1 No Monthly Constant 3,000 Uniform Rate 114%
Greenville 1,880 1 No Monthly By Meter Size 0 Uniform Rate 115%
Griffin 23,643 1 No Monthly By Meter Size 2,000 Uniform Rate
Griffin - Spalding County
Grovetown 11,216 1 Yes Monthly Constant 3,000 Increasing Block 5 10,000 172%
Guyton 2,394 1 Yes Monthly Constant 5,000 Increasing Block 2 20,000
Gwinnett County 795,657 1 No Monthly Constant 0 Uniform Rate
Hahira 2,846 1 Yes Monthly Constant 3,000 Uniform Rate
Hall County 190,482 2 Yes Monthly By Meter Size 0 Uniform Rate
Hamilton 928 1 Yes Monthly By Meter Size 0 Uniform Rate
Hampton 7,305 1 No Monthly Constant 0 Increasing Block 3 6,000
Hancock County 900 1 No Monthly None 0 Non-Volumetric Flat Charge
Hapeville 5,385 1 No Monthly Constant 2,000 Increasing Block 3 9,900
Haralson County Water Authority
Harlem 5,356 1 No Monthly Constant 2,000 Increasing Block 2 20,000
Service Population is approximated and may not be actual.
Source: 1=EPA SDWIS 2017, 2=Census Population in 2016
Georgia Environmental Finance Authority
and Environmental Finance Center
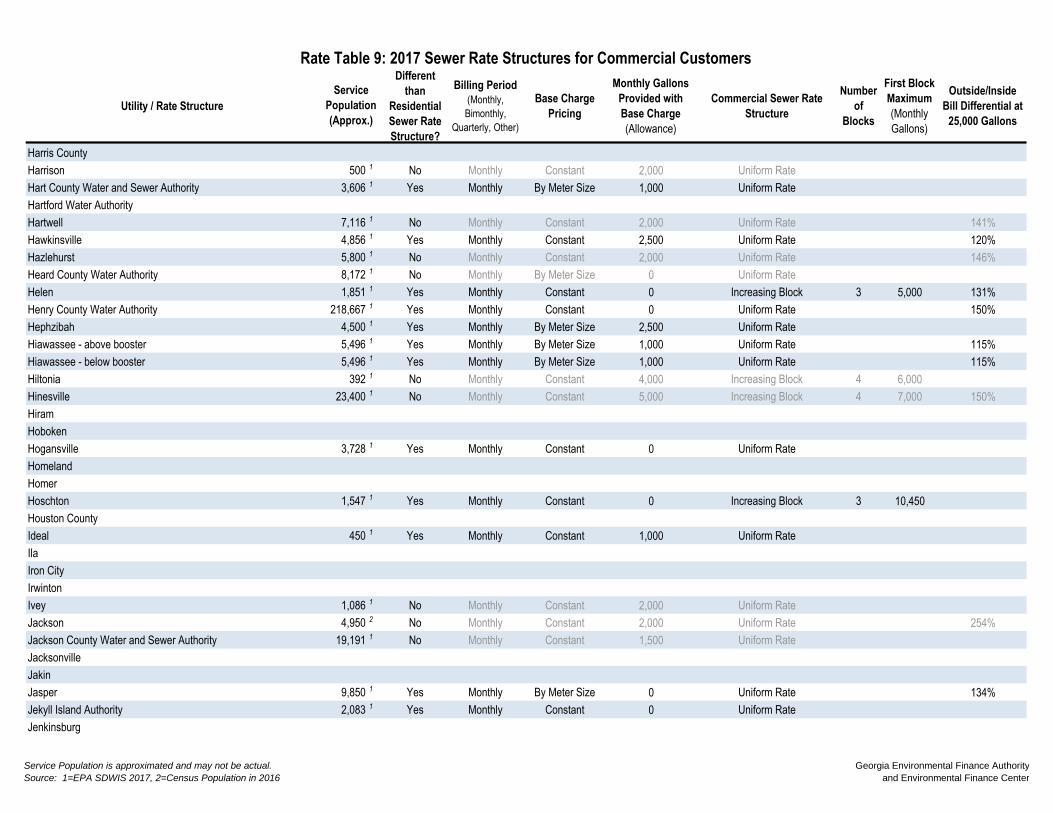
Utility / Rate Structure
Different
than
Residential
Sewer Rate
Structure?
Billing Period
(Monthly,
Bimonthly,
Quarterly, Other)
Base Charge
Pricing
Monthly Gallons
Provided with
Base Charge
(Allowance)
Commercial Sewer Rate
Structure
Number
of
Blocks
First Block
Maximum
(Monthly
Gallons)
Outside/Inside
Bill Differential at
25,000 Gallons
Rate Table 9: 2017 Sewer Rate Structures for Commercial Customers
Service
Population
(Approx.)
Harris County
Harrison 500 1 No Monthly Constant 2,000 Uniform Rate
Hart County Water and Sewer Authority 3,606 1 Yes Monthly By Meter Size 1,000 Uniform Rate
Hartford Water Authority
Hartwell 7,116 1 No Monthly Constant 2,000 Uniform Rate 141%
Hawkinsville 4,856 1 Yes Monthly Constant 2,500 Uniform Rate 120%
Hazlehurst 5,800 1 No Monthly Constant 2,000 Uniform Rate 146%
Heard County Water Authority 8,172 1 No Monthly By Meter Size 0 Uniform Rate
Helen 1,851 1 Yes Monthly Constant 0 Increasing Block 3 5,000 131%
Henry County Water Authority 218,667 1 Yes Monthly Constant 0 Uniform Rate 150%
Hephzibah 4,500 1 Yes Monthly By Meter Size 2,500 Uniform Rate
Hiawassee - above booster 5,496 1 Yes Monthly By Meter Size 1,000 Uniform Rate 115%
Hiawassee - below booster 5,496 1 Yes Monthly By Meter Size 1,000 Uniform Rate 115%
Hiltonia 392 1 No Monthly Constant 4,000 Increasing Block 4 6,000
Hinesville 23,400 1 No Monthly Constant 5,000 Increasing Block 4 7,000 150%
Hiram
Hoboken
Hogansville 3,728 1 Yes Monthly Constant 0 Uniform Rate
Homeland
Homer
Hoschton 1,547 1 Yes Monthly Constant 0 Increasing Block 3 10,450
Houston County
Ideal 450 1 Yes Monthly Constant 1,000 Uniform Rate
Ila
Iron City
Irwinton
Ivey 1,086 1 No Monthly Constant 2,000 Uniform Rate
Jackson 4,950 2 No Monthly Constant 2,000 Uniform Rate 254%
Jackson County Water and Sewer Authority 19,191 1 No Monthly Constant 1,500 Uniform Rate
Jacksonville
Jakin
Jasper 9,850 1 Yes Monthly By Meter Size 0 Uniform Rate 134%
Jekyll Island Authority 2,083 1 Yes Monthly Constant 0 Uniform Rate
Jenkinsburg
Service Population is approximated and may not be actual.
Source: 1=EPA SDWIS 2017, 2=Census Population in 2016
Georgia Environmental Finance Authority
and Environmental Finance Center

Utility / Rate Structure
Different
than
Residential
Sewer Rate
Structure?
Billing Period
(Monthly,
Bimonthly,
Quarterly, Other)
Base Charge
Pricing
Monthly Gallons
Provided with
Base Charge
(Allowance)
Commercial Sewer Rate
Structure
Number
of
Blocks
First Block
Maximum
(Monthly
Gallons)
Outside/Inside
Bill Differential at
25,000 Gallons
Rate Table 9: 2017 Sewer Rate Structures for Commercial Customers
Service
Population
(Approx.)
Jesup 10,200 1 Yes Monthly Constant 0 Increasing Block 4 2,000
Jones County 10,795 1 No Monthly Constant 0 Uniform Rate
Keysville 351 1 Yes Monthly Constant 2,000 Uniform Rate
Kingsland 18,697 1 Yes Monthly Constant 0 Increasing Block 2 6,000 145%
Kingston
Kite
LaFayette 18,177 1 No Monthly By Meter Size 0 Uniform Rate 150%
LaGrange 41,852 1 No Monthly None 0 Uniform Rate 150%
Lake Park
Lakeland 2,922 1 No Monthly Constant 1,000 Uniform Rate
Lavonia 8,008 1 Yes Monthly Constant 2,000 Uniform Rate 109%
Lawrenceville
Lee County Utility Authority 13,500 1 No Monthly Constant 0 Increasing Block 4 9,000
Leesburg 3,003 1 No Monthly Constant 0 Uniform Rate
Lenox 1,011 1 Yes Monthly Constant 0 Increasing Block 5 5,000 150%
Leslie
Lexington 796 1 No Monthly Constant 2,000 Increasing Block 2 10,000
Liberty County
Lincoln County 3,256 1 No Monthly Constant 1,500 Uniform Rate
Lincolnton 1,657 1 No Monthly By Meter Size 1,500 Uniform Rate
Locust Grove 5,648 1 No Monthly Constant 2,000 Increasing Block 2 10,000
Loganville 10,923 1 Yes Monthly Constant 2,000 Increasing Block 4 8,000
Lone Oak
Lookout Mountain 1,754 2 No Monthly By Meter Size 0 Uniform Rate
Louisville 2,575 1 Yes Monthly Constant 2,000 Uniform Rate with a Cap
Lowndes County 13,988 1 Yes Monthly Constant 3,000 Increasing Block 4 6,000
Ludowici 1,651 1 Yes Monthly Constant 0 Increasing Block 5 5,000
Lula 2,714 1 No Monthly Constant 0 Increasing Block 5 5,000
Lumber City 993 1 No Monthly Constant 4,000 Uniform Rate
Lumpkin
Lumpkin County Water and Sewer Authority 3,226 1 Yes Monthly By Meter Size 0 Uniform Rate
Luthersville
Lyerly 1,360 1 Yes Monthly Constant 2,500 Uniform Rate 125%
Lyons 4,100 1 No Monthly Constant 3,000 Increasing Block 2 10,000 200%
Service Population is approximated and may not be actual.
Source: 1=EPA SDWIS 2017, 2=Census Population in 2016
Georgia Environmental Finance Authority
and Environmental Finance Center
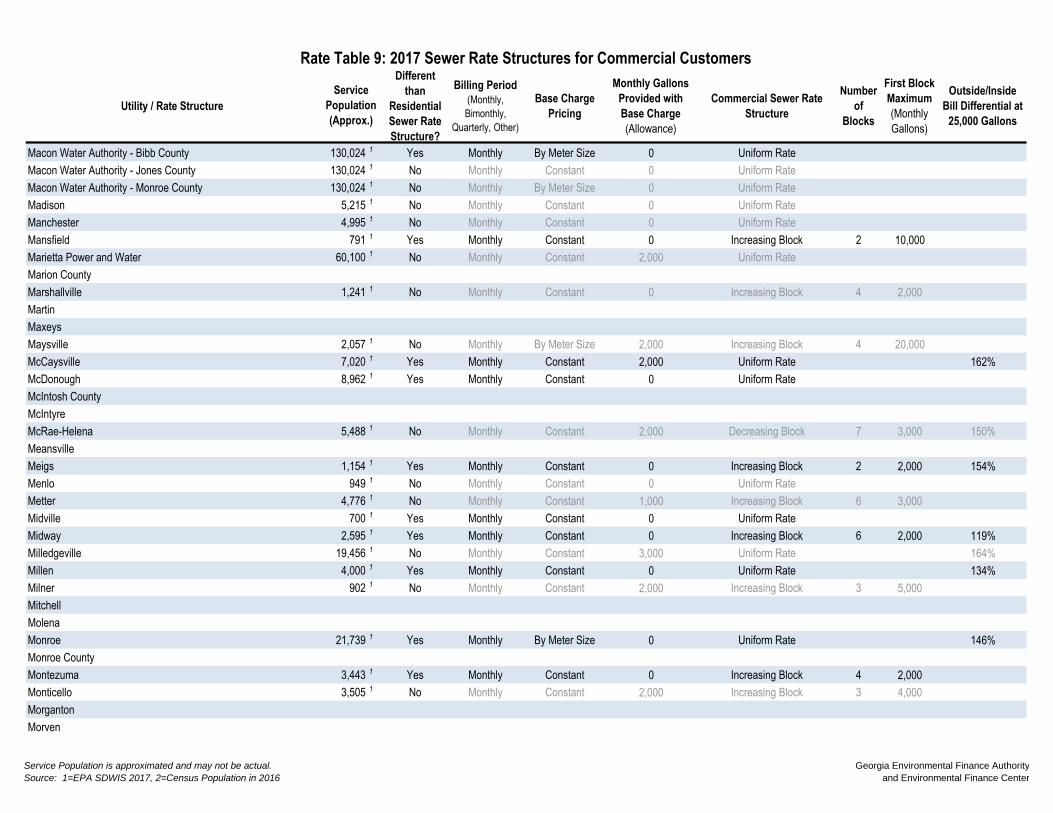
Utility / Rate Structure
Different
than
Residential
Sewer Rate
Structure?
Billing Period
(Monthly,
Bimonthly,
Quarterly, Other)
Base Charge
Pricing
Monthly Gallons
Provided with
Base Charge
(Allowance)
Commercial Sewer Rate
Structure
Number
of
Blocks
First Block
Maximum
(Monthly
Gallons)
Outside/Inside
Bill Differential at
25,000 Gallons
Rate Table 9: 2017 Sewer Rate Structures for Commercial Customers
Service
Population
(Approx.)
Macon Water Authority - Bibb County 130,024 1 Yes Monthly By Meter Size 0 Uniform Rate
Macon Water Authority - Jones County 130,024 1 No Monthly Constant 0 Uniform Rate
Macon Water Authority - Monroe County 130,024 1 No Monthly By Meter Size 0 Uniform Rate
Madison 5,215 1 No Monthly Constant 0 Uniform Rate
Manchester 4,995 1 No Monthly Constant 0 Uniform Rate
Mansfield 791 1 Yes Monthly Constant 0 Increasing Block 2 10,000
Marietta Power and Water 60,100 1 No Monthly Constant 2,000 Uniform Rate
Marion County
Marshallville 1,241 1 No Monthly Constant 0 Increasing Block 4 2,000
Martin
Maxeys
Maysville 2,057 1 No Monthly By Meter Size 2,000 Increasing Block 4 20,000
McCaysville 7,020 1 Yes Monthly Constant 2,000 Uniform Rate 162%
McDonough 8,962 1 Yes Monthly Constant 0 Uniform Rate
McIntosh County
McIntyre
McRae-Helena 5,488 1 No Monthly Constant 2,000 Decreasing Block 7 3,000 150%
Meansville
Meigs 1,154 1 Yes Monthly Constant 0 Increasing Block 2 2,000 154%
Menlo 949 1 No Monthly Constant 0 Uniform Rate
Metter 4,776 1 No Monthly Constant 1,000 Increasing Block 6 3,000
Midville 700 1 Yes Monthly Constant 0 Uniform Rate
Midway 2,595 1 Yes Monthly Constant 0 Increasing Block 6 2,000 119%
Milledgeville 19,456 1 No Monthly Constant 3,000 Uniform Rate 164%
Millen 4,000 1 Yes Monthly Constant 0 Uniform Rate 134%
Milner 902 1 No Monthly Constant 2,000 Increasing Block 3 5,000
Mitchell
Molena
Monroe 21,739 1 Yes Monthly By Meter Size 0 Uniform Rate 146%
Monroe County
Montezuma 3,443 1 Yes Monthly Constant 0 Increasing Block 4 2,000
Monticello 3,505 1 No Monthly Constant 2,000 Increasing Block 3 4,000
Morganton
Morven
Service Population is approximated and may not be actual.
Source: 1=EPA SDWIS 2017, 2=Census Population in 2016
Georgia Environmental Finance Authority
and Environmental Finance Center

Utility / Rate Structure
Different
than
Residential
Sewer Rate
Structure?
Billing Period
(Monthly,
Bimonthly,
Quarterly, Other)
Base Charge
Pricing
Monthly Gallons
Provided with
Base Charge
(Allowance)
Commercial Sewer Rate
Structure
Number
of
Blocks
First Block
Maximum
(Monthly
Gallons)
Outside/Inside
Bill Differential at
25,000 Gallons
Rate Table 9: 2017 Sewer Rate Structures for Commercial Customers
Service
Population
(Approx.)
Moultrie 15,634 1 Yes Monthly Constant 2,000 Uniform Rate
Mount Airy
Mount Zion
Mountain Park 798 1 No Monthly Constant 1,000 Uniform Rate
MSO Water Systems, Inc.
MSO Water Systems, Inc. - Briarcrest
MSO Water Systems, Inc. - English Oaks
Nahunta 1,074 1 Yes Monthly Constant 0 Increasing Block 4 2,000
Nashville 4,896 1 No Monthly Constant 0 Increasing Block 4 3,000
Newborn
Newington 227 1 No Monthly Constant 2,000 Increasing Block 4 5,000
Newnan Utilities 34,000 1 Yes Monthly Constant 0 Uniform Rate
Newton
Newton County Water and Sewer Authority 62,384 1 No Monthly Constant 1,000 Uniform Rate
Nicholls 2,745 1 Yes Monthly Constant 0 Increasing Block 5 2,000
Nicholson Water Authority
Norman Park 1,173 1 Yes Monthly Constant 0 Increasing Block 6 2,000 146%
Norwood 364 1 No Monthly By Meter Size 2,000 Decreasing Block 3 5,000
Notla Water Authority
Oakwood - Flowery Branch 4,098 2 Yes Monthly Constant 7,000 Uniform Rate
Oakwood - Gainesville 4,098 2 No Monthly None 0 Uniform Rate
Ochlocknee 789 1 No Monthly Constant 1,000 Uniform Rate
Ocilla 2,540 1 Yes Monthly Constant 2,000 Uniform Rate 121%
Oconee
Oconee County 19,279 1 Yes Monthly Constant 1,000 Uniform Rate
Odum 645 1 No Monthly Constant 1,000 Increasing Block 5 5,000
Oxford 2,214 1 No Monthly Constant 3,000 Uniform Rate
Palmetto 3,965 1 No Monthly Constant 2,000 Uniform Rate
Parrott
Patterson 972 1 Yes Monthly Constant 0 Increasing Block 6 3,000 137%
Paulding County 113,204 1 Yes Monthly Constant 0 Uniform Rate
Pavo
Peachtree City Water and Sewerage Authority 34,988 2 Yes Monthly Constant 0 Uniform Rate
Pearson 2,000 2 Yes Monthly Constant 0 Increasing Block 4 2,000
Service Population is approximated and may not be actual.
Source: 1=EPA SDWIS 2017, 2=Census Population in 2016
Georgia Environmental Finance Authority
and Environmental Finance Center

Utility / Rate Structure
Different
than
Residential
Sewer Rate
Structure?
Billing Period
(Monthly,
Bimonthly,
Quarterly, Other)
Base Charge
Pricing
Monthly Gallons
Provided with
Base Charge
(Allowance)
Commercial Sewer Rate
Structure
Number
of
Blocks
First Block
Maximum
(Monthly
Gallons)
Outside/Inside
Bill Differential at
25,000 Gallons
Rate Table 9: 2017 Sewer Rate Structures for Commercial Customers
Service
Population
(Approx.)
Pelham 3,601 1 No Monthly Constant 1,000 Uniform Rate 130%
Pembroke 2,571 1 Yes Monthly By Meter Size 500 Increasing/Decreasing Block 6 2,000
Perkins Water Authority
Pickens County Water Authority
Piedmont Water Co. - Lake Oconee - 0 Yes Monthly Constant 3,000 Increasing Block 4 12,000
Pike County Water and Sewer Authority
Pine Mountain 1,697 1 No Monthly Constant 1,000 Uniform Rate 102%
Pinehurst 460 1 Yes Monthly Constant 2,000 Uniform Rate
Pineview
Pitts
Plains 892 1 Yes Monthly Constant 1,000 Increasing Block 5 5,000 125%
Polk County Water Authority 24,061 1 No Monthly Constant 2,000 Increasing/Decreasing Block 4 7,000
Polk County Water Authority - Vinson Mountain
Pooler 21,187 1 Yes Monthly Constant 0 Increasing Block 2 5,000
Port Wentworth 4,160 1 Yes Monthly Constant 0 Uniform Rate 141%
Portal 879 1 No Monthly Constant 2,000 Increasing Block 2 50,000
Poulan
Powder Springs 14,000 1 Yes Monthly Constant 0 Increasing Block 3 2,000
Pulaski
Quitman 4,942 1 No Monthly Constant 0 Increasing Block 3 2,000
Rabun County Water and Sewer Authority - 0 Yes Monthly Constant 2,000 Uniform Rate
Randolph County Water Authority
Ray City 845 1 Yes Monthly Constant 0 Uniform Rate 143%
Register
Remerton 1,479 1 No Monthly Constant 0 Uniform Rate
Rentz 310 1 Yes Monthly Constant 2,000 Uniform Rate
Reynolds 1,373 1 Yes Monthly Constant 2,000 Uniform Rate 150%
Rhine
Riceboro 1,131 1 No Monthly Constant 2,000 Uniform Rate
Richland 1,323 1 No Monthly None 0 Non-Volumetric Flat Charge
Richmond Hill 11,258 1 Yes Monthly Constant 0 Uniform Rate 150%
Riddleville
Rincon 9,880 1 Yes Monthly Constant 3,000 Increasing Block 4 9,000 122%
Ringgold 2,743 1 No Monthly By Meter Size 2,000 Uniform Rate
Service Population is approximated and may not be actual.
Source: 1=EPA SDWIS 2017, 2=Census Population in 2016
Georgia Environmental Finance Authority
and Environmental Finance Center

Utility / Rate Structure
Different
than
Residential
Sewer Rate
Structure?
Billing Period
(Monthly,
Bimonthly,
Quarterly, Other)
Base Charge
Pricing
Monthly Gallons
Provided with
Base Charge
(Allowance)
Commercial Sewer Rate
Structure
Number
of
Blocks
First Block
Maximum
(Monthly
Gallons)
Outside/Inside
Bill Differential at
25,000 Gallons
Rate Table 9: 2017 Sewer Rate Structures for Commercial Customers
Service
Population
(Approx.)
Ringgold - Dalton - 0 No Monthly By Meter Size 0 Uniform Rate
Ringgold - Meadows - 0 No Monthly Constant 0 Uniform Rate
Roberta 1,615 1 Yes Monthly Constant 0 Increasing Block 3 40,000
Rochelle 1,581 1 No Monthly Constant 0 Uniform Rate 103%
Rockdale County Water and Sewer Authority 72,621 1 No Monthly By Meter Size 0 Uniform Rate
Rockmart 6,500 1 No Monthly Constant 2,000 Increasing Block 5 10,000 150%
Rocky Ford
Rome - Zone 1 45,586 1 No Monthly By Meter Size 748 Uniform Rate
Rome - Zone 2 45,586 1 No Monthly By Meter Size 748 Uniform Rate 165%
Rome - Zone 3 45,586 1 No Monthly Constant 0 Uniform Rate
Rome - Zone 4 45,586 1 No Monthly By Meter Size 748 Uniform Rate 136%
Roopville
Roswell 14,300 1 No Bi-monthly Constant 0 Uniform Rate
Royston 2,800 1 Yes Monthly By Meter Size 0 Uniform Rate
Rutledge 918 1 No Monthly Constant 2,000 Increasing Block 3 6,000
Saint Marys 17,270 1 No Monthly Constant 0 Increasing Block 2 6,000
Sale City
Sandersville 6,100 1 No Monthly Constant 2,000 Uniform Rate 136%
Sardis 999 1 Yes Monthly By Meter Size 0 Uniform Rate
Sasser
Satilla Regional Water and Sewer Authority 14,311 1 No Monthly By Meter Size 1,496 Uniform Rate
Savannah 215,566 1 Yes Bi-monthly Constant 0 Increasing Block 2 5,610 150%
Schley County
Scotland 356 1 No Monthly None 0 Non-Volumetric Flat Charge
Screven 840 1 No Monthly Constant 2,000 Increasing Block 5 5,000
Senoia 3,466 1 No Monthly Constant 1,000 Uniform Rate
Shady Dale
Shellman 1,115 1 Yes Monthly None 0 Non-Volumetric Flat Charge
Shiloh
Siloam
Sky Lake POA, Inc.
Sky Valley
Smithville 647 1 No Monthly None 0 Non-Volumetric Flat Charge
Smyrna 35,000 1 Yes Monthly By Meter Size 0 Uniform Rate
Service Population is approximated and may not be actual.
Source: 1=EPA SDWIS 2017, 2=Census Population in 2016
Georgia Environmental Finance Authority
and Environmental Finance Center

Utility / Rate Structure
Different
than
Residential
Sewer Rate
Structure?
Billing Period
(Monthly,
Bimonthly,
Quarterly, Other)
Base Charge
Pricing
Monthly Gallons
Provided with
Base Charge
(Allowance)
Commercial Sewer Rate
Structure
Number
of
Blocks
First Block
Maximum
(Monthly
Gallons)
Outside/Inside
Bill Differential at
25,000 Gallons
Rate Table 9: 2017 Sewer Rate Structures for Commercial Customers
Service
Population
(Approx.)
Social Circle 4,235 1 No Monthly Constant 2,000 Uniform Rate 150%
Soperton 2,470 1 Yes Monthly Constant 2,000 Increasing Block 3 25,000 190%
Spalding County 40,430 1 No Monthly Constant 2,000 Uniform Rate
Sparks 1,823 1 No Monthly None 0 Non-Volumetric Flat Charge
Springfield 3,100 1 No Monthly Constant 2,000 Uniform Rate 138%
Statesboro 36,846 1 Yes Monthly Constant 0 Increasing Block 3 9,000 150%
Statham 3,986 1 Yes Monthly Constant 2,000 Increasing Block 3 3,000
Stewart County Water and Sewer Authority
Stillmore 615 1 No Monthly Constant 2,000 Increasing Block 3 5,000
Stockbridge 6,500 1 Yes Monthly By Meter Size 0 Increasing Block 2 10,000
Summerville 11,651 1 No Monthly Constant 3,000 Decreasing Block 2 50,000 132%
Sumner
Surrency
Suwanee
Sylvania 2,960 1 No Monthly Constant 0 Increasing Block 4 3,000 148%
Sylvester 12,886 1 Yes Monthly Constant 0 Increasing/Decreasing Block 5 5,000
Talbot County
Talbotton 738 1 Yes Monthly Constant 2,000 Uniform Rate
Tallapoosa 4,030 1 Yes Monthly Constant 0 Increasing/Decreasing Block 5 2,000 148%
Tarrytown
Taylor County Water and Sewer Authority 91 1 No Monthly Constant 5,000 Uniform Rate
Temple 4,250 1 Yes Monthly Constant 0 Increasing Block 4 25,000
Tennille 1,802 1 No Monthly Constant 0 Increasing Block 5 2,000 140%
Thomaston 10,510 1 No Monthly Constant 0 Uniform Rate
Thomasville 23,577 1 Yes Monthly Constant 16,500 Decreasing Block 8 100,000 132%
Thomson-McDuffie County Water and Sewer Commission 17,717 1 Yes Monthly Constant 0 Uniform Rate
Thunderbolt 2,668 1 No Monthly Constant 0 Uniform at One Block's Rate 2 20,000
Tifton 24,871 1 No Monthly By Meter Size 0 Uniform Rate 143%
Tignall 754 1 Yes Monthly By Meter Size 2,000 Increasing Block 3 5,000
Toccoa 24,960 1 No Monthly Constant 2,000 Uniform Rate
Toomsboro
Towns County Water and Sewer Authority
Trenton 2,091 2 Yes Monthly Constant 3,000 Decreasing Block 2 21,000 150%
Trion 2,400 1 Yes Monthly Constant 5,000 Uniform Rate
Service Population is approximated and may not be actual.
Source: 1=EPA SDWIS 2017, 2=Census Population in 2016
Georgia Environmental Finance Authority
and Environmental Finance Center
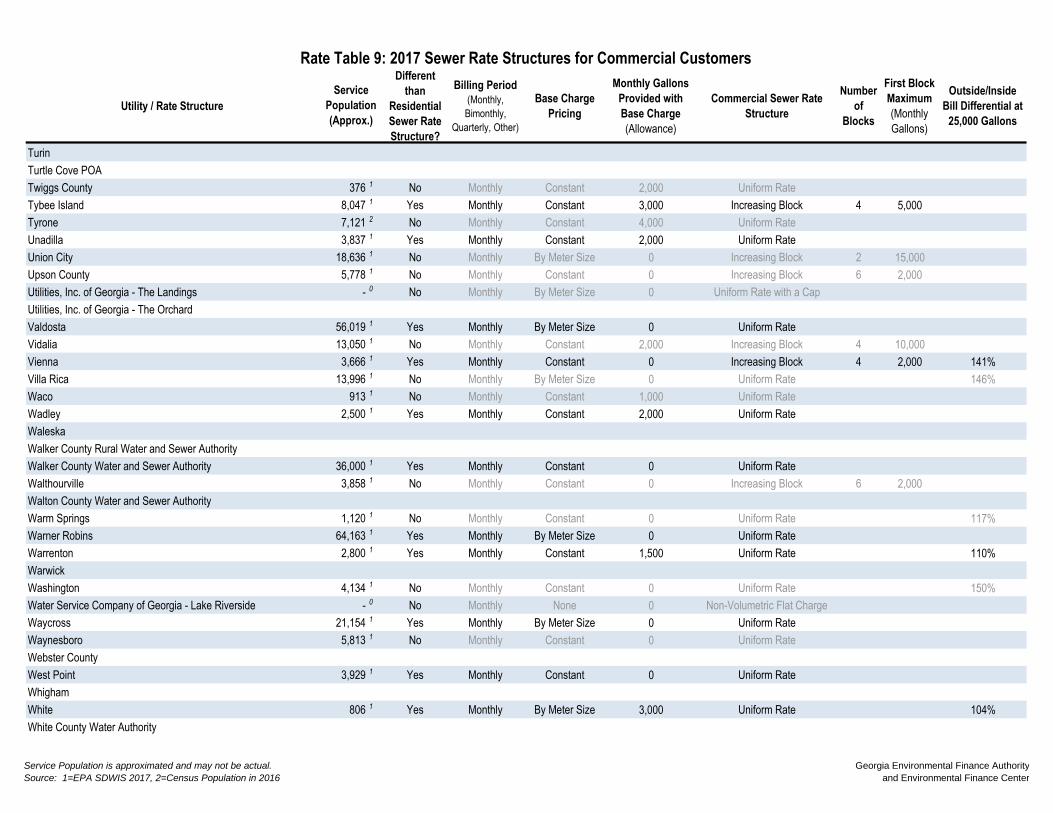
Utility / Rate Structure
Different
than
Residential
Sewer Rate
Structure?
Billing Period
(Monthly,
Bimonthly,
Quarterly, Other)
Base Charge
Pricing
Monthly Gallons
Provided with
Base Charge
(Allowance)
Commercial Sewer Rate
Structure
Number
of
Blocks
First Block
Maximum
(Monthly
Gallons)
Outside/Inside
Bill Differential at
25,000 Gallons
Rate Table 9: 2017 Sewer Rate Structures for Commercial Customers
Service
Population
(Approx.)
Turin
Turtle Cove POA
Twiggs County 376 1 No Monthly Constant 2,000 Uniform Rate
Tybee Island 8,047 1 Yes Monthly Constant 3,000 Increasing Block 4 5,000
Tyrone 7,121 2 No Monthly Constant 4,000 Uniform Rate
Unadilla 3,837 1 Yes Monthly Constant 2,000 Uniform Rate
Union City 18,636 1 No Monthly By Meter Size 0 Increasing Block 2 15,000
Upson County 5,778 1 No Monthly Constant 0 Increasing Block 6 2,000
Utilities, Inc. of Georgia - The Landings - 0 No Monthly By Meter Size 0 Uniform Rate with a Cap
Utilities, Inc. of Georgia - The Orchard
Valdosta 56,019 1 Yes Monthly By Meter Size 0 Uniform Rate
Vidalia 13,050 1 No Monthly Constant 2,000 Increasing Block 4 10,000
Vienna 3,666 1 Yes Monthly Constant 0 Increasing Block 4 2,000 141%
Villa Rica 13,996 1 No Monthly By Meter Size 0 Uniform Rate 146%
Waco 913 1 No Monthly Constant 1,000 Uniform Rate
Wadley 2,500 1 Yes Monthly Constant 2,000 Uniform Rate
Waleska
Walker County Rural Water and Sewer Authority
Walker County Water and Sewer Authority 36,000 1 Yes Monthly Constant 0 Uniform Rate
Walthourville 3,858 1 No Monthly Constant 0 Increasing Block 6 2,000
Walton County Water and Sewer Authority
Warm Springs 1,120 1 No Monthly Constant 0 Uniform Rate 117%
Warner Robins 64,163 1 Yes Monthly By Meter Size 0 Uniform Rate
Warrenton 2,800 1 Yes Monthly Constant 1,500 Uniform Rate 110%
Warwick
Washington 4,134 1 No Monthly Constant 0 Uniform Rate 150%
Water Service Company of Georgia - Lake Riverside - 0 No Monthly None 0 Non-Volumetric Flat Charge
Waycross 21,154 1 Yes Monthly By Meter Size 0 Uniform Rate
Waynesboro 5,813 1 No Monthly Constant 0 Uniform Rate
Webster County
West Point 3,929 1 Yes Monthly Constant 0 Uniform Rate
Whigham
White 806 1 Yes Monthly By Meter Size 3,000 Uniform Rate 104%
White County Water Authority
Service Population is approximated and may not be actual.
Source: 1=EPA SDWIS 2017, 2=Census Population in 2016
Georgia Environmental Finance Authority
and Environmental Finance Center

Utility / Rate Structure
Different
than
Residential
Sewer Rate
Structure?
Billing Period
(Monthly,
Bimonthly,
Quarterly, Other)
Base Charge
Pricing
Monthly Gallons
Provided with
Base Charge
(Allowance)
Commercial Sewer Rate
Structure
Number
of
Blocks
First Block
Maximum
(Monthly
Gallons)
Outside/Inside
Bill Differential at
25,000 Gallons
Rate Table 9: 2017 Sewer Rate Structures for Commercial Customers
Service
Population
(Approx.)
White Plains
Whitesburg
Willacoochee 1,940 1 Yes Monthly Constant 3,000 Uniform Rate
Williamson
Winder 32,971 1 No Monthly Constant 0 Uniform Rate with a Cap 138%
Woodbine 1,508 1 Yes Monthly Constant 0 Increasing Block 3 10,000
Woodbury 961 1 No Monthly Constant 0 Uniform Rate 123%
Woodstock 10,070 1 No Monthly Constant 0 Increasing Block 2 10,000
Wrens 2,375 1 Yes Monthly By Meter Size 1,000 Uniform Rate 130%
Service Population is approximated and may not be actual.
Source: 1=EPA SDWIS 2017, 2=Census Population in 2016
Georgia Environmental Finance Authority
and Environmental Finance Center

Compare with caution. High rates may be justified and necessary to protect public health.
Inside Outside Inside Outside Inside Outside Inside Outside Inside Outside Inside Outside Inside Outside
Adel 5,311 1 1.33 $25.40 $28.67 $77.72 $159.47 $322.97 $813.47 $1,630.97
Adrian (no wastewater bills)
Ailey 527 1 0.92 $15.00 $31.00 $61.00 $111.00 $211.00 $511.00 $1,011.00
Alamo 3,457 1 1.00 $11.00 $21.00 $39.75 $71.00 $133.50 $321.00 $633.50
Albany 87,029 1 1.21 $9.71 $5.83 $39.91 $36.03 $85.21 $81.33 $160.71 $156.83 $311.71 $307.83 $764.71 $760.83 $1,519.71 $1,515.83
Alcovy Shores Water Authority (no wastewater bills)
Allentown (no wastewater bills)
Alma 4,700 1 1.09 $7.00 $14.00 $26.55 $53.10 $67.80 $135.60 $137.80 $275.60 $277.80 $555.60 $697.80 $1,395.60 $1,397.80 $2,795.60
Alston (no wastewater bills)
Alto (no wastewater bills)
Americus 16,255 1 1.17 $12.50 $25.00 $51.94 $103.88 $111.10 $222.19 $209.69 $419.39 $406.89 $813.77 $998.46 $1,996.93 $1,984.43 $3,968.85
Andersonville 400 1 $9.00 $33.00 $78.00 $153.00 $303.00 $753.00 $1,503.00
Arabi (no wastewater bills)
Argyle (no wastewater bills)
Arlington 1,243 1 0.86 $71.56 $137.54 $242.69 $417.94 $789.44 $1,903.94 $3,761.44
Arnoldsville (no wastewater bills)
Ashburn 4,272 1 1.36 $23.05 $44.80 $79.30 $136.80 $251.80 $596.80 $1,171.80
Athens-Clarke County 120,266 1 1.72 $8.30 $69.60 $161.55 $314.80 $621.30 $1,540.80 $3,073.30
Atlanta 650,000 1 1.44 $6.56 $3.45 $192.32 $58.53 $506.96 $141.15 $1,031.36 $278.85 $2,080.15 $554.25 $5,226.54 $1,380.46 $10,470.53 $2,757.46
Attapulgus (no wastewater bills)
Auburn 6,904 1 1.64 $15.90 $51.66 $118.71 $230.46 $453.96 $1,124.46 $2,241.96
Augusta 204,000 1 1.08 $31.59 $66.49 $118.84 $206.09 $380.59 $917.63 $1,820.42
Austell 7,774 1 1.74 $59.10 $61.70 $147.75 $154.25 $295.50 $308.50 $591.00 $617.00 $1,477.50 $1,542.50 $2,955.00 $3,085.00
Avera (no wastewater bills)
Baconton 985 1 $45.57 $56.25 $73.57 $98.15 $115.57 $161.00 $185.57 $265.75 $325.57 $475.25 $745.57 $1,103.75 $1,445.57 $2,151.25
Bainbridge 13,546 1 1.05 $12.62 $32.32 $61.87 $111.12 $209.62 $505.12 $997.62
Baldwin 4,160 1 $15.50 $17.80 $79.63 $85.00 $206.38 $213.25 $417.63 $427.00 $840.13 $854.50 $2,107.63 $2,137.00 $4,220.13 $4,274.50
Baldwin County 21,840 1 1.19 $19.00 $57.75 $144.50 $298.25 $633.25 $1,638.25 $3,313.25
Ball Ground 2,470 1 0.86 $16.50 $67.50 $144.00 $271.50 $526.50 $1,291.50 $2,566.50
Banks County 6,453 1 $37.10 $111.02 $258.72 $514.22 $1,025.22 $2,558.22 $5,113.22
Barnesville 6,755 1 1.35 $16.60 $63.00 $171.85 $340.60 $678.10 $1,690.60 $3,378.10
Barrow County Water and Sewer Authority 14,043 1 1.20 $15.90 $51.66 $118.71 $230.46 $453.96 $1,124.46 $2,241.96
Bartow 286 1 0.83 $30.00 $40.40 $59.90 $92.40 $157.40 $352.40 $677.40
Bartow County 50,162 1 1.15 $6.49 $60.09 $140.49 $274.49 $542.49 $1,356.23 $2,712.46
Barwick (no wastewater bills)
Baxley 4,737 2 0.91 $12.40 $18.60 $41.20 $61.80 $95.20 $142.80 $185.20 $277.80 $365.20 $547.80 $905.20 $1,357.80 $1,805.20 $2,707.80
Bent Tree 0 $13.20 $13.20 $13.20 $13.20 $13.20 $13.20 $13.20
50,000 Gallons
(6,684 cf)
5/8" or 3/4" Meter
100,000 Gallons
(13,369 cf)
5/8" or 3/4" Meter
250,000 Gallons
(33,422 cf)
1" Meter
500,000 Gallons
(66,845 cf)
1.5" or 2" Meter
Operating
Ratio
(FY2016)
Rate Table 10: 2017 Commercial Monthly-Equivalent Sewer Bills at Various Consumption Levels (Includes Base Charges)
Utility / Rate Structure
Service
Population
(Approx.)
Zero Gallons
(0 cf)
5/8" or 3/4" Meter
10,000 Gallons
(1,337 cf)
5/8" or 3/4" Meter
25,000 Gallons
(3,342 cf)
5/8" or 3/4" Meter
Service Population is approximated and may not be actual.
Source: 1=EPA SDWIS 2017, 2=Census Population in 2016 *Based on data from FY2015 or earlierGeorgia Environmental Finance Authority
and Environmental Finance Center
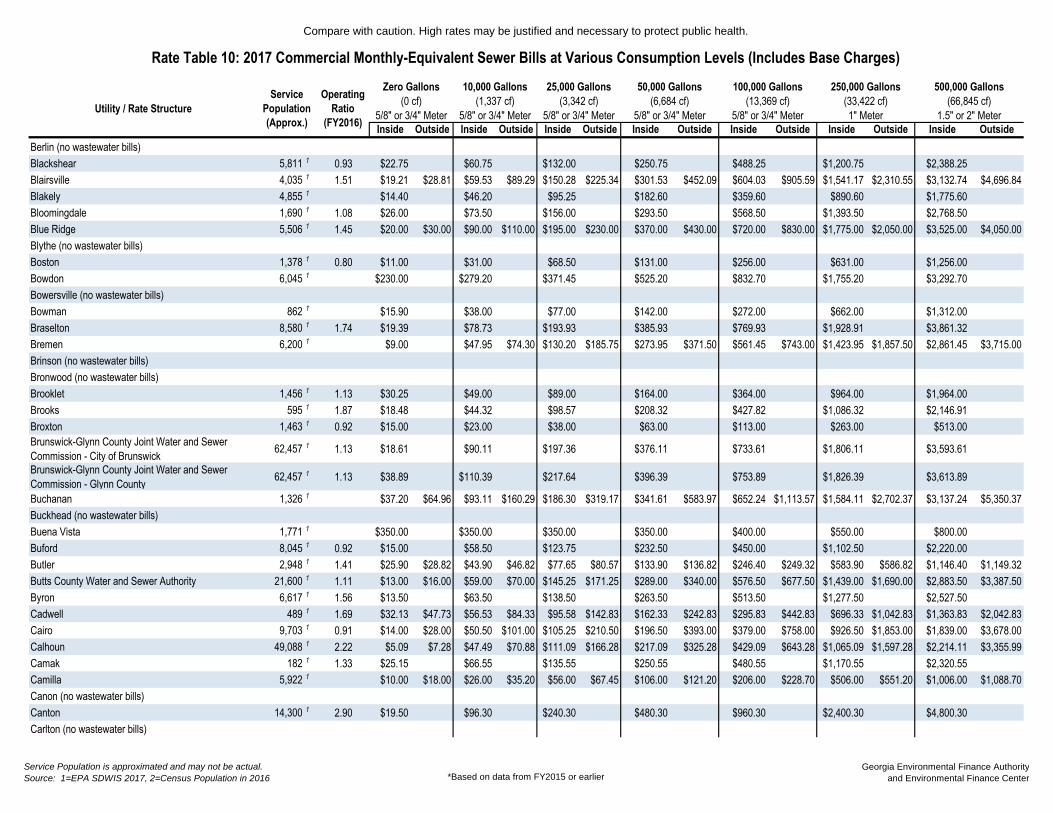
Compare with caution. High rates may be justified and necessary to protect public health.
Inside Outside Inside Outside Inside Outside Inside Outside Inside Outside Inside Outside Inside Outside
50,000 Gallons
(6,684 cf)
5/8" or 3/4" Meter
100,000 Gallons
(13,369 cf)
5/8" or 3/4" Meter
250,000 Gallons
(33,422 cf)
1" Meter
500,000 Gallons
(66,845 cf)
1.5" or 2" Meter
Operating
Ratio
(FY2016)
Rate Table 10: 2017 Commercial Monthly-Equivalent Sewer Bills at Various Consumption Levels (Includes Base Charges)
Utility / Rate Structure
Service
Population
(Approx.)
Zero Gallons
(0 cf)
5/8" or 3/4" Meter
10,000 Gallons
(1,337 cf)
5/8" or 3/4" Meter
25,000 Gallons
(3,342 cf)
5/8" or 3/4" Meter
Berlin (no wastewater bills)
Blackshear 5,811 1 0.93 $22.75 $60.75 $132.00 $250.75 $488.25 $1,200.75 $2,388.25
Blairsville 4,035 1 1.51 $19.21 $28.81 $59.53 $89.29 $150.28 $225.34 $301.53 $452.09 $604.03 $905.59 $1,541.17 $2,310.55 $3,132.74 $4,696.84
Blakely 4,855 1 $14.40 $46.20 $95.25 $182.60 $359.60 $890.60 $1,775.60
Bloomingdale 1,690 1 1.08 $26.00 $73.50 $156.00 $293.50 $568.50 $1,393.50 $2,768.50
Blue Ridge 5,506 1 1.45 $20.00 $30.00 $90.00 $110.00 $195.00 $230.00 $370.00 $430.00 $720.00 $830.00 $1,775.00 $2,050.00 $3,525.00 $4,050.00
Blythe (no wastewater bills)
Boston 1,378 1 0.80 $11.00 $31.00 $68.50 $131.00 $256.00 $631.00 $1,256.00
Bowdon 6,045 1 $230.00 $279.20 $371.45 $525.20 $832.70 $1,755.20 $3,292.70
Bowersville (no wastewater bills)
Bowman 862 1 $15.90 $38.00 $77.00 $142.00 $272.00 $662.00 $1,312.00
Braselton 8,580 1 1.74 $19.39 $78.73 $193.93 $385.93 $769.93 $1,928.91 $3,861.32
Bremen 6,200 1 $9.00 $47.95 $74.30 $130.20 $185.75 $273.95 $371.50 $561.45 $743.00 $1,423.95 $1,857.50 $2,861.45 $3,715.00
Brinson (no wastewater bills)
Bronwood (no wastewater bills)
Brooklet 1,456 1 1.13 $30.25 $49.00 $89.00 $164.00 $364.00 $964.00 $1,964.00
Brooks 595 1 1.87 $18.48 $44.32 $98.57 $208.32 $427.82 $1,086.32 $2,146.91
Broxton 1,463 1 0.92 $15.00 $23.00 $38.00 $63.00 $113.00 $263.00 $513.00
Brunswick-Glynn County Joint Water and Sewer
Commission - City of Brunswick 62,457 1 1.13 $18.61 $90.11 $197.36 $376.11 $733.61 $1,806.11 $3,593.61
Brunswick-Glynn County Joint Water and Sewer
Commission - Glynn County 62,457 1 1.13 $38.89 $110.39 $217.64 $396.39 $753.89 $1,826.39 $3,613.89
Buchanan 1,326 1 $37.20 $64.96 $93.11 $160.29 $186.30 $319.17 $341.61 $583.97 $652.24 $1,113.57 $1,584.11 $2,702.37 $3,137.24 $5,350.37
Buckhead (no wastewater bills)
Buena Vista 1,771 1 $350.00 $350.00 $350.00 $350.00 $400.00 $550.00 $800.00
Buford 8,045 1 0.92 $15.00 $58.50 $123.75 $232.50 $450.00 $1,102.50 $2,220.00
Butler 2,948 1 1.41 $25.90 $28.82 $43.90 $46.82 $77.65 $80.57 $133.90 $136.82 $246.40 $249.32 $583.90 $586.82 $1,146.40 $1,149.32
Butts County Water and Sewer Authority 21,600 1 1.11 $13.00 $16.00 $59.00 $70.00 $145.25 $171.25 $289.00 $340.00 $576.50 $677.50 $1,439.00 $1,690.00 $2,883.50 $3,387.50
Byron 6,617 1 1.56 $13.50 $63.50 $138.50 $263.50 $513.50 $1,277.50 $2,527.50
Cadwell 489 1 1.69 $32.13 $47.73 $56.53 $84.33 $95.58 $142.83 $162.33 $242.83 $295.83 $442.83 $696.33 $1,042.83 $1,363.83 $2,042.83
Cairo 9,703 1 0.91 $14.00 $28.00 $50.50 $101.00 $105.25 $210.50 $196.50 $393.00 $379.00 $758.00 $926.50 $1,853.00 $1,839.00 $3,678.00
Calhoun 49,088 1 2.22 $5.09 $7.28 $47.49 $70.88 $111.09 $166.28 $217.09 $325.28 $429.09 $643.28 $1,065.09 $1,597.28 $2,214.11 $3,355.99
Camak 182 1 1.33 $25.15 $66.55 $135.55 $250.55 $480.55 $1,170.55 $2,320.55
Camilla 5,922 1 $10.00 $18.00 $26.00 $35.20 $56.00 $67.45 $106.00 $121.20 $206.00 $228.70 $506.00 $551.20 $1,006.00 $1,088.70
Canon (no wastewater bills)
Canton 14,300 1 2.90 $19.50 $96.30 $240.30 $480.30 $960.30 $2,400.30 $4,800.30
Carlton (no wastewater bills)
Service Population is approximated and may not be actual.
Source: 1=EPA SDWIS 2017, 2=Census Population in 2016 *Based on data from FY2015 or earlierGeorgia Environmental Finance Authority
and Environmental Finance Center

Compare with caution. High rates may be justified and necessary to protect public health.
Inside Outside Inside Outside Inside Outside Inside Outside Inside Outside Inside Outside Inside Outside
50,000 Gallons
(6,684 cf)
5/8" or 3/4" Meter
100,000 Gallons
(13,369 cf)
5/8" or 3/4" Meter
250,000 Gallons
(33,422 cf)
1" Meter
500,000 Gallons
(66,845 cf)
1.5" or 2" Meter
Operating
Ratio
(FY2016)
Rate Table 10: 2017 Commercial Monthly-Equivalent Sewer Bills at Various Consumption Levels (Includes Base Charges)
Utility / Rate Structure
Service
Population
(Approx.)
Zero Gallons
(0 cf)
5/8" or 3/4" Meter
10,000 Gallons
(1,337 cf)
5/8" or 3/4" Meter
25,000 Gallons
(3,342 cf)
5/8" or 3/4" Meter
Carnesville 736 1 $6.25 $8.44 $57.50 $66.56 $134.38 $153.75 $262.50 $299.06 $518.75 $589.69 $1,290.63 $1,465.63 $2,575.00 $2,931.25
Carroll County Water Authority 44,700 1 1.41 $16.86 $64.38 $148.21 $287.91 $567.32 $1,405.56 $2,802.62
Carrollton 24,310 1 1.48 $4.15 $4.98 $41.27 $49.53 $113.06 $135.67 $232.71 $279.26 $472.02 $566.42 $1,189.93 $1,427.92 $2,386.46 $2,863.75
Cartersville 24,830 1 2.65 $8.79 $8.79 $35.39 $62.40 $75.30 $142.81 $141.81 $276.84 $274.83 $544.89 $685.63 $1,360.76 $1,371.23 $2,721.50
Catoosa Utility District Authority (no wastewater bills)
Cave Spring 4,180 1 1.33 $14.40 $62.48 $152.63 $302.88 $603.38 $1,504.88 $3,007.38
Cedartown 9,750 1 1.03 $18.90 $26.40 $47.02 $68.58 $114.40 $169.65 $226.70 $338.10 $451.30 $675.00 $1,089.72 $1,632.63 $2,072.34 $3,106.56
Centerville 9,940 1 1.11 $14.92 $27.16 $50.11 $88.36 $164.86 $394.36 $776.86
Chatsworth Water Works Commission 29,617 1 0.98 $10.00 $18.00 $46.58 $59.33 $104.33 $124.58 $200.58 $233.33 $393.08 $450.83 $970.58 $1,103.33 $1,933.08 $2,190.83
Chattooga County (no wastewater bills)
Chattooga County - Cloudland (no wastewater bills)
Chattooga County - Gore Subligna (no wastewater
bills)
Cherokee County Water and Sewerage Authority 145,528 1 1.23 $12.60 $68.20 $172.45 $346.20 $693.70 $1,736.20 $3,473.70
Chester 1,777 1 1.35 $4.50 $15.00 $37.50 $75.00 $150.00 $375.00 $750.00
Chickamauga 4,150 1 1.19 $12.06 $17.06 $40.06 $55.06 $89.56 $119.56 $172.06 $227.06 $337.06 $442.06 $832.06 $1,087.06 $1,657.06 $2,162.06
Clarkesville 5,785 1 1.21 $16.50 $30.50 $58.34 $110.18 $136.79 $259.58 $267.54 $508.58 $529.04 $1,006.58 $1,313.54 $2,500.58 $2,621.04 $4,990.58
Claxton 4,433 1 0.85 $14.20 $24.55 $41.15 $57.80 $101.15 $131.30 $201.15 $253.80 $401.15 $498.80 $1,001.15 $1,233.80 $2,001.15 $2,458.80
Clay County (no wastewater bills)
Clayton 7,225 1 $20.25 $28.48 $64.03 $255.12 $158.53 $365.52 $316.03 $549.52 $631.03 $917.52 $1,595.61 $2,021.52 $3,287.96 $3,861.52
Clayton - North Loop (no wastewater bills)
Clayton County Water Authority 270,000 1 1.35 $10.73 $63.61 $153.91 $304.41 $605.41 $1,511.99 $3,045.78
Cleveland 3,640 1 1.10 $30.80 $54.38 $59.04 $99.20 $112.98 $184.79 $202.88 $327.44 $382.68 $612.74 $934.15 $1,491.97 $1,860.98 $2,957.24
Climax (no wastewater bills)
Cobb County 533,000 1 1.51 $3.50 $3.50 $56.00 $57.60 $134.75 $138.75 $266.00 $274.00 $528.50 $544.50 $1,320.00 $1,360.00 $2,638.00 $2,718.00
Cobbtown (no wastewater bills)
Cochran 5,124 1 1.21 $15.00 $22.50 $42.00 $60.75 $87.00 $124.50 $162.00 $230.75 $312.00 $443.25 $762.00 $1,080.75 $1,512.00 $2,143.25
Coffee County (no wastewater bills)
College Park 20,382 1 $13.45 $70.05 $154.95 $296.45 $579.45 $1,428.45 $2,843.45
Collins 780 1 0.76 $26.00 $26.00 $26.00 $26.00 $26.00 $26.00 $26.00
Colquitt 1,895 1 0.99 $24.50 $52.00 $103.25 $209.50 $422.00 $1,082.00 $2,144.50
Columbia County 101,967 1 1.99 $23.37 $49.07 $87.62 $151.87 $280.37 $665.87 $1,337.58
Columbus Water Works 229,000 1 $3.33 $43.28 $94.42 $177.64 $344.09 $843.42 $1,675.64
Comer 1,380 1 0.96 $11.00 $24.75 $49.25 $110.81 $116.75 $262.69 $229.25 $515.81 $454.25 $1,022.06 $1,129.25 $2,540.81 $2,254.25 $5,072.06
Commerce 6,819 1 1.01 $4.00 $7.00 $66.00 $107.00 $159.00 $257.00 $314.00 $507.00 $624.00 $1,007.00 $1,554.00 $2,507.00 $3,104.00 $5,007.00
Concord 741 1 0.80 $17.00 $19.00 $47.80 $49.80 $105.55 $107.55 $201.80 $203.80 $394.30 $396.30 $971.80 $973.80 $1,934.30 $1,936.30
Consolidated Utilities, Inc. 0 $16.00 $65.00 $173.00 $353.00 $713.00 $1,793.00 $3,593.00
Service Population is approximated and may not be actual.
Source: 1=EPA SDWIS 2017, 2=Census Population in 2016 *Based on data from FY2015 or earlierGeorgia Environmental Finance Authority
and Environmental Finance Center
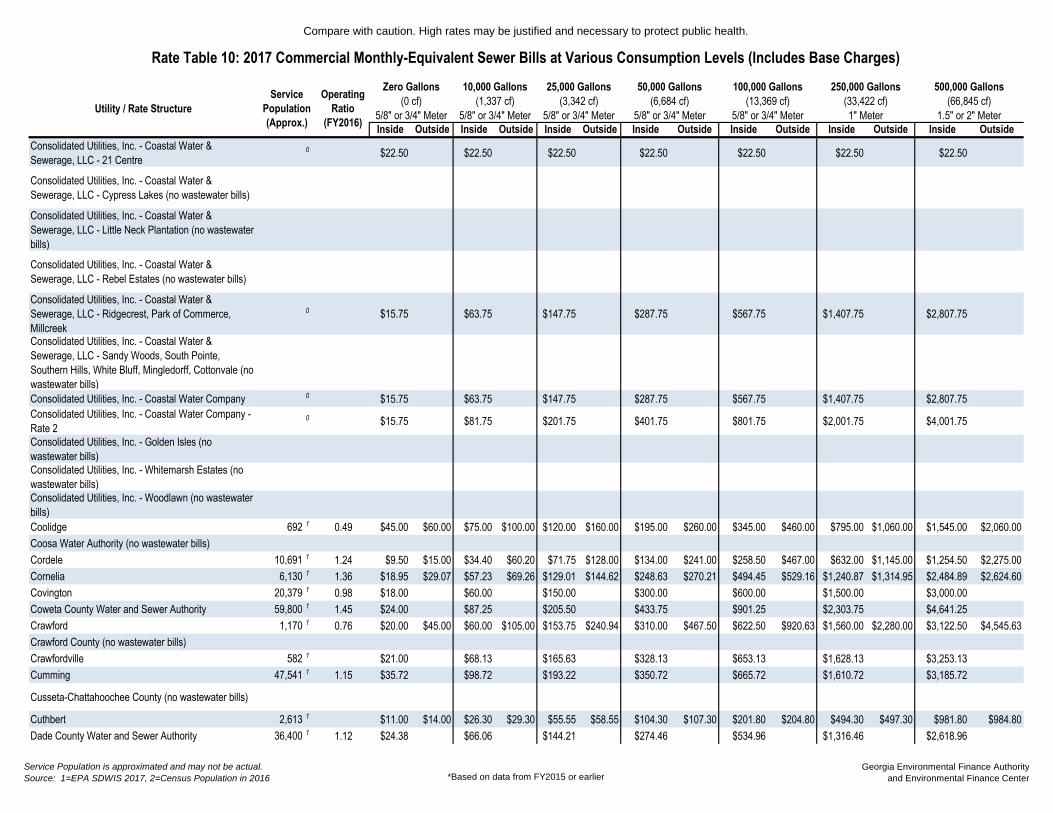
Compare with caution. High rates may be justified and necessary to protect public health.
Inside Outside Inside Outside Inside Outside Inside Outside Inside Outside Inside Outside Inside Outside
50,000 Gallons
(6,684 cf)
5/8" or 3/4" Meter
100,000 Gallons
(13,369 cf)
5/8" or 3/4" Meter
250,000 Gallons
(33,422 cf)
1" Meter
500,000 Gallons
(66,845 cf)
1.5" or 2" Meter
Operating
Ratio
(FY2016)
Rate Table 10: 2017 Commercial Monthly-Equivalent Sewer Bills at Various Consumption Levels (Includes Base Charges)
Utility / Rate Structure
Service
Population
(Approx.)
Zero Gallons
(0 cf)
5/8" or 3/4" Meter
10,000 Gallons
(1,337 cf)
5/8" or 3/4" Meter
25,000 Gallons
(3,342 cf)
5/8" or 3/4" Meter
Consolidated Utilities, Inc. - Coastal Water &
Sewerage, LLC - 21 Centre 0 $22.50 $22.50 $22.50 $22.50 $22.50 $22.50 $22.50
Consolidated Utilities, Inc. - Coastal Water &
Sewerage, LLC - Cypress Lakes (no wastewater bills)
Consolidated Utilities, Inc. - Coastal Water &
Sewerage, LLC - Little Neck Plantation (no wastewater
bills)
Consolidated Utilities, Inc. - Coastal Water &
Sewerage, LLC - Rebel Estates (no wastewater bills)
Consolidated Utilities, Inc. - Coastal Water &
Sewerage, LLC - Ridgecrest, Park of Commerce,
Millcreek
0 $15.75 $63.75 $147.75 $287.75 $567.75 $1,407.75 $2,807.75
Consolidated Utilities, Inc. - Coastal Water &
Sewerage, LLC - Sandy Woods, South Pointe,
Southern Hills, White Bluff, Mingledorff, Cottonvale (no
wastewater bills)
Consolidated Utilities, Inc. - Coastal Water Company 0 $15.75 $63.75 $147.75 $287.75 $567.75 $1,407.75 $2,807.75
Consolidated Utilities, Inc. - Coastal Water Company -
Rate 2 0 $15.75 $81.75 $201.75 $401.75 $801.75 $2,001.75 $4,001.75
Consolidated Utilities, Inc. - Golden Isles (no
wastewater bills)
Consolidated Utilities, Inc. - Whitemarsh Estates (no
wastewater bills)
Consolidated Utilities, Inc. - Woodlawn (no wastewater
bills)
Coolidge 692 1 0.49 $45.00 $60.00 $75.00 $100.00 $120.00 $160.00 $195.00 $260.00 $345.00 $460.00 $795.00 $1,060.00 $1,545.00 $2,060.00
Coosa Water Authority (no wastewater bills)
Cordele 10,691 1 1.24 $9.50 $15.00 $34.40 $60.20 $71.75 $128.00 $134.00 $241.00 $258.50 $467.00 $632.00 $1,145.00 $1,254.50 $2,275.00
Cornelia 6,130 1 1.36 $18.95 $29.07 $57.23 $69.26 $129.01 $144.62 $248.63 $270.21 $494.45 $529.16 $1,240.87 $1,314.95 $2,484.89 $2,624.60
Covington 20,379 1 0.98 $18.00 $60.00 $150.00 $300.00 $600.00 $1,500.00 $3,000.00
Coweta County Water and Sewer Authority 59,800 1 1.45 $24.00 $87.25 $205.50 $433.75 $901.25 $2,303.75 $4,641.25
Crawford 1,170 1 0.76 $20.00 $45.00 $60.00 $105.00 $153.75 $240.94 $310.00 $467.50 $622.50 $920.63 $1,560.00 $2,280.00 $3,122.50 $4,545.63
Crawford County (no wastewater bills)
Crawfordville 582 1 $21.00 $68.13 $165.63 $328.13 $653.13 $1,628.13 $3,253.13
Cumming 47,541 1 1.15 $35.72 $98.72 $193.22 $350.72 $665.72 $1,610.72 $3,185.72
Cusseta-Chattahoochee County (no wastewater bills)
Cuthbert 2,613 1 $11.00 $14.00 $26.30 $29.30 $55.55 $58.55 $104.30 $107.30 $201.80 $204.80 $494.30 $497.30 $981.80 $984.80
Dade County Water and Sewer Authority 36,400 1 1.12 $24.38 $66.06 $144.21 $274.46 $534.96 $1,316.46 $2,618.96
Service Population is approximated and may not be actual.
Source: 1=EPA SDWIS 2017, 2=Census Population in 2016 *Based on data from FY2015 or earlierGeorgia Environmental Finance Authority
and Environmental Finance Center
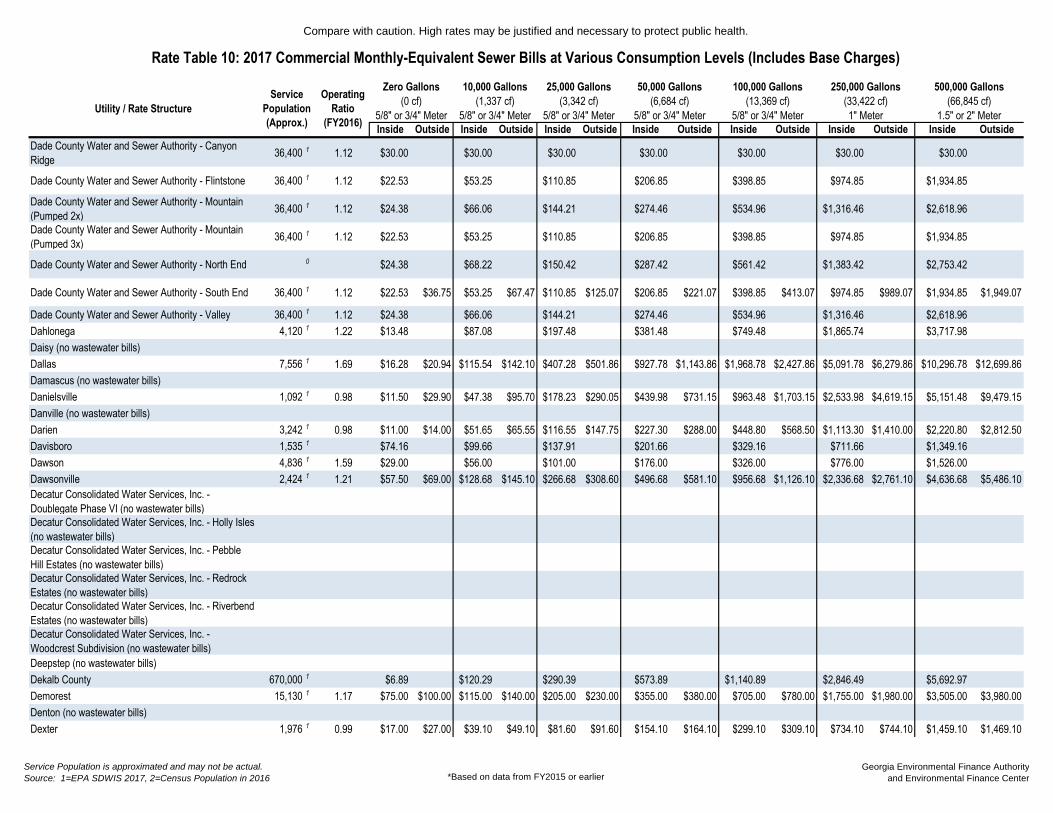
Compare with caution. High rates may be justified and necessary to protect public health.
Inside Outside Inside Outside Inside Outside Inside Outside Inside Outside Inside Outside Inside Outside
50,000 Gallons
(6,684 cf)
5/8" or 3/4" Meter
100,000 Gallons
(13,369 cf)
5/8" or 3/4" Meter
250,000 Gallons
(33,422 cf)
1" Meter
500,000 Gallons
(66,845 cf)
1.5" or 2" Meter
Operating
Ratio
(FY2016)
Rate Table 10: 2017 Commercial Monthly-Equivalent Sewer Bills at Various Consumption Levels (Includes Base Charges)
Utility / Rate Structure
Service
Population
(Approx.)
Zero Gallons
(0 cf)
5/8" or 3/4" Meter
10,000 Gallons
(1,337 cf)
5/8" or 3/4" Meter
25,000 Gallons
(3,342 cf)
5/8" or 3/4" Meter
Dade County Water and Sewer Authority - Canyon
Ridge 36,400 1 1.12 $30.00 $30.00 $30.00 $30.00 $30.00 $30.00 $30.00
Dade County Water and Sewer Authority - Flintstone 36,400 1 1.12 $22.53 $53.25 $110.85 $206.85 $398.85 $974.85 $1,934.85
Dade County Water and Sewer Authority - Mountain
(Pumped 2x) 36,400 1 1.12 $24.38 $66.06 $144.21 $274.46 $534.96 $1,316.46 $2,618.96
Dade County Water and Sewer Authority - Mountain
(Pumped 3x) 36,400 1 1.12 $22.53 $53.25 $110.85 $206.85 $398.85 $974.85 $1,934.85
Dade County Water and Sewer Authority - North End 0 $24.38 $68.22 $150.42 $287.42 $561.42 $1,383.42 $2,753.42
Dade County Water and Sewer Authority - South End 36,400 1 1.12 $22.53 $36.75 $53.25 $67.47 $110.85 $125.07 $206.85 $221.07 $398.85 $413.07 $974.85 $989.07 $1,934.85 $1,949.07
Dade County Water and Sewer Authority - Valley 36,400 1 1.12 $24.38 $66.06 $144.21 $274.46 $534.96 $1,316.46 $2,618.96
Dahlonega 4,120 1 1.22 $13.48 $87.08 $197.48 $381.48 $749.48 $1,865.74 $3,717.98
Daisy (no wastewater bills)
Dallas 7,556 1 1.69 $16.28 $20.94 $115.54 $142.10 $407.28 $501.86 $927.78 $1,143.86 $1,968.78 $2,427.86 $5,091.78 $6,279.86 $10,296.78 $12,699.86
Damascus (no wastewater bills)
Danielsville 1,092 1 0.98 $11.50 $29.90 $47.38 $95.70 $178.23 $290.05 $439.98 $731.15 $963.48 $1,703.15 $2,533.98 $4,619.15 $5,151.48 $9,479.15
Danville (no wastewater bills)
Darien 3,242 1 0.98 $11.00 $14.00 $51.65 $65.55 $116.55 $147.75 $227.30 $288.00 $448.80 $568.50 $1,113.30 $1,410.00 $2,220.80 $2,812.50
Davisboro 1,535 1 $74.16 $99.66 $137.91 $201.66 $329.16 $711.66 $1,349.16
Dawson 4,836 1 1.59 $29.00 $56.00 $101.00 $176.00 $326.00 $776.00 $1,526.00
Dawsonville 2,424 1 1.21 $57.50 $69.00 $128.68 $145.10 $266.68 $308.60 $496.68 $581.10 $956.68 $1,126.10 $2,336.68 $2,761.10 $4,636.68 $5,486.10
Decatur Consolidated Water Services, Inc. -
Doublegate Phase VI (no wastewater bills)
Decatur Consolidated Water Services, Inc. - Holly Isles
(no wastewater bills)
Decatur Consolidated Water Services, Inc. - Pebble
Hill Estates (no wastewater bills)
Decatur Consolidated Water Services, Inc. - Redrock
Estates (no wastewater bills)
Decatur Consolidated Water Services, Inc. - Riverbend
Estates (no wastewater bills)
Decatur Consolidated Water Services, Inc. -
Woodcrest Subdivision (no wastewater bills)
Deepstep (no wastewater bills)
Dekalb County 670,000 1 $6.89 $120.29 $290.39 $573.89 $1,140.89 $2,846.49 $5,692.97
Demorest 15,130 1 1.17 $75.00 $100.00 $115.00 $140.00 $205.00 $230.00 $355.00 $380.00 $705.00 $780.00 $1,755.00 $1,980.00 $3,505.00 $3,980.00
Denton (no wastewater bills)
Dexter 1,976 1 0.99 $17.00 $27.00 $39.10 $49.10 $81.60 $91.60 $154.10 $164.10 $299.10 $309.10 $734.10 $744.10 $1,459.10 $1,469.10
Service Population is approximated and may not be actual.
Source: 1=EPA SDWIS 2017, 2=Census Population in 2016 *Based on data from FY2015 or earlierGeorgia Environmental Finance Authority
and Environmental Finance Center

Compare with caution. High rates may be justified and necessary to protect public health.
Inside Outside Inside Outside Inside Outside Inside Outside Inside Outside Inside Outside Inside Outside
50,000 Gallons
(6,684 cf)
5/8" or 3/4" Meter
100,000 Gallons
(13,369 cf)
5/8" or 3/4" Meter
250,000 Gallons
(33,422 cf)
1" Meter
500,000 Gallons
(66,845 cf)
1.5" or 2" Meter
Operating
Ratio
(FY2016)
Rate Table 10: 2017 Commercial Monthly-Equivalent Sewer Bills at Various Consumption Levels (Includes Base Charges)
Utility / Rate Structure
Service
Population
(Approx.)
Zero Gallons
(0 cf)
5/8" or 3/4" Meter
10,000 Gallons
(1,337 cf)
5/8" or 3/4" Meter
25,000 Gallons
(3,342 cf)
5/8" or 3/4" Meter
Dillard 133 1 0.67 $55.00 $55.00 $55.00 $55.00 $55.00 $55.00 $55.00
Doerun 967 1 1.03 $11.00 $50.72 $121.02 $243.52 $505.02 $1,289.52 $2,597.02
Donalsonville 2,782 1 1.12 $42.60 $73.30 $124.30 $215.30 $397.30 $943.30 $1,853.30
Dooling (no wastewater bills)
Douglas 10,688 1 1.24 $16.70 $72.10 $155.20 $293.70 $570.70 $1,401.70 $2,786.70
Douglasville-Douglas County Water and Sewer
Authority 109,694 1 1.14 $6.04 $77.16 $192.12 $383.72 $766.92 $1,910.77 $3,821.56
Du Pont (no wastewater bills)
Dublin 17,500 1 1.09 $9.50 $15.20 $40.30 $76.80 $98.05 $192.30 $194.30 $384.80 $386.80 $769.80 $964.30 $1,924.80 $1,926.80 $3,849.80
Dudley 546 1 1.46 $25.89 $39.97 $66.37 $110.37 $198.37 $462.37 $902.37
East Dublin 2,657 1 0.65 $23.00 $28.00 $69.85 $81.72 $158.80 $183.72 $307.05 $353.72 $603.55 $693.72 $1,493.05 $1,713.72 $2,975.55 $3,413.72
East Point 33,712 1 $23.55 $64.01 $150.71 $295.21 $584.21 $1,460.53 $2,921.05
Eastman 7,491 1 0.87 $25.00 $31.70 $67.50 $74.20 $142.50 $149.20 $280.00 $286.70 $567.50 $574.20 $1,497.50 $1,504.20 $3,042.50 $3,049.20
Eatonton-Putnam Water and Sewer Authority 12,272 1 1.19 $34.01 $100.01 $234.16 $469.91 $977.41 $2,499.91 $5,037.60
Echols County Water Authority (no wastewater bills)
Edison 1,331 1 0.87 $16.00 $29.50 $49.75 $83.50 $151.00 $353.50 $691.00
Effingham County 7,700 1 0.99 $60.00 $90.85 $142.75 $229.25 $402.25 $921.25 $1,786.25
Elberton 7,800 1 1.20 $7.39 $10.70 $39.32 $50.70 $87.22 $110.70 $185.66 $236.00 $345.32 $436.00 $826.94 $849.42 $1,517.28 $1,656.24
Ellaville 2,779 1 1.22 $38.40 $47.76 $66.23 $89.51 $113.68 $160.71 $194.93 $282.71 $363.93 $536.21 $870.93 $1,296.71 $1,715.93 $2,564.21
Ellenton (no wastewater bills)
Ellijay-Gilmer County Water and Sewer Authority 13,010 1 1.15 $10.50 $53.20 $119.20 $234.45 $464.95 $1,177.45 $2,409.45
Emerson 1,394 1 0.72 $31.25 $43.74 $75.05 $105.04 $140.75 $196.99 $250.25 $350.24 $469.25 $656.74 $1,137.06 $1,591.39 $2,274.12 $3,182.77
Enigma (no wastewater bills)
Ephesus (no wastewater bills)
Etowah Water and Sewer Authority 13,843 1 1.23 $25.50 $117.00 $254.25 $483.00 $940.50 $2,342.50 $4,750.00
Fairburn 13,693 1 1.35 $17.70 $95.10 $211.20 $404.70 $791.70 $1,952.70 $3,887.70
Fairmount 130 1 1.01 $32.50 $51.62 $87.47 $147.22 $266.72 $625.22 $1,222.72
Fargo (no wastewater bills)
Fayette County (no wastewater bills)
Fayetteville 15,281 1 $32.10 $58.26 $107.31 $189.06 $352.56 $843.06 $1,660.56
Fitzgerald Water Light and Bond Commission 12,935 1 1.05 $8.00 $26.50 $54.25 $100.50 $193.00 $470.50 $933.00
Flovilla (no wastewater bills)
Flowery Branch 2,920 1 1.40 $33.57 $44.58 $47.97 $63.69 $119.97 $159.24 $239.97 $318.49 $479.97 $636.99 $1,199.97 $1,592.49 $2,399.97 $3,184.99
Floyd County 41,738 1 1.96 $21.10 $98.86 $228.46 $444.46 $876.46 $2,183.33 $4,362.77
Folkston 5,940 1 1.14 $17.65 $46.15 $88.90 $160.15 $302.65 $730.15 $1,442.65
Forest Heights Water Works, Inc. (no wastewater bills)
Service Population is approximated and may not be actual.
Source: 1=EPA SDWIS 2017, 2=Census Population in 2016 *Based on data from FY2015 or earlierGeorgia Environmental Finance Authority
and Environmental Finance Center

Compare with caution. High rates may be justified and necessary to protect public health.
Inside Outside Inside Outside Inside Outside Inside Outside Inside Outside Inside Outside Inside Outside
50,000 Gallons
(6,684 cf)
5/8" or 3/4" Meter
100,000 Gallons
(13,369 cf)
5/8" or 3/4" Meter
250,000 Gallons
(33,422 cf)
1" Meter
500,000 Gallons
(66,845 cf)
1.5" or 2" Meter
Operating
Ratio
(FY2016)
Rate Table 10: 2017 Commercial Monthly-Equivalent Sewer Bills at Various Consumption Levels (Includes Base Charges)
Utility / Rate Structure
Service
Population
(Approx.)
Zero Gallons
(0 cf)
5/8" or 3/4" Meter
10,000 Gallons
(1,337 cf)
5/8" or 3/4" Meter
25,000 Gallons
(3,342 cf)
5/8" or 3/4" Meter
Forsyth 7,400 1 1.14 $15.54 $23.01 $46.18 $66.63 $103.63 $148.43 $199.38 $284.75 $390.88 $557.40 $965.38 $1,375.35 $1,922.88 $2,738.60
Forsyth County 138,368 1 1.52 $20.00 $68.40 $141.00 $262.00 $504.00 $1,230.00 $2,440.00
Fort Gaines 1,422 1 1.29 $13.50 $33.50 $63.50 $113.50 $213.50 $513.50 $1,013.50
Fort Oglethorpe 9,446 1 1.25 $24.30 $31.59 $100.38 $130.47 $243.03 $315.87 $480.78 $624.87 $956.28 $1,242.87 $2,382.78 $3,096.87 $4,760.28 $6,186.87
Fort Valley Utility Commission 17,645 1 0.85 $12.30 $66.23 $160.08 $316.49 $629.33 $1,567.83 $3,132.00
Franklin County 2,764 1 0.96 $21.00 $61.00 $136.00 $261.00 $511.00 $1,279.00 $2,574.00
Franklin Springs 997 1 0.95 $7.00 $52.00 $119.50 $232.00 $457.00 $1,132.00 $2,257.00
Fulton County 172,533 1 1.76 $3.63 $61.53 $148.38 $293.13 $582.63 $1,451.13 $2,898.63
Funston (no wastewater bills)
Gainesville 117,962 1 1.65 $3.09 $101.88 $250.08 $497.07 $991.05 $2,473.00 $4,942.92
Garden City 8,166 1 1.11 $68.30 $78.38 $90.70 $111.98 $146.15 $195.18 $255.65 $359.43 $474.65 $687.93 $1,131.65 $1,673.43 $2,226.65 $3,315.93
Garfield (no wastewater bills)
Gay (no wastewater bills)
Georgetown-Quitman County Water, Sewer and Solid
Waste Authority 985 1 0.88 $25.00 $55.00 $111.25 $205.00 $392.50 $955.00 $1,892.50
Gibson 720 1 0.89 $20.00 $34.00 $64.00 $114.00 $214.00 $514.00 $1,014.00
Glennville 4,711 1 1.00 $15.00 $31.50 $72.75 $141.50 $279.00 $724.50 $1,412.00
Glenwood 1,012 1 0.62 $20.00 $36.00 $66.00 $116.00 $216.00 $516.00 $1,016.00
Gordon 2,340 1 0.62 $6.83 $19.47 $43.17 $82.67 $161.67 $398.67 $793.67
Graham (no wastewater bills)
Grantville 1,508 1 $30.00 $108.00 $254.25 $498.00 $985.50 $2,448.00 $4,885.50
Greensboro 3,156 1 1.67 $25.40 $28.96 $84.69 $96.51 $211.74 $241.26 $423.49 $482.51 $846.99 $965.01 $2,117.49 $2,412.51 $4,234.99 $4,825.01
Greenville 1,880 1 0.68 $15.00 $18.50 $72.00 $83.70 $157.50 $181.50 $300.00 $344.50 $585.00 $670.50 $1,447.50 $1,654.00 $2,875.00 $3,295.00
Griffin 23,643 1 1.03 $17.58 $81.98 $202.73 $403.98 $806.48 $2,017.07 $4,048.12
Griffin - Spalding County (no wastewater bills)
Grovetown 11,216 1 $20.10 $34.65 $67.00 $115.50 $168.50 $289.75 $339.50 $582.00 $687.00 $1,172.00 $1,729.50 $2,942.00 $3,467.00 $5,892.00
Guyton 2,394 1 2.31 $38.82 $57.97 $117.87 $225.87 $441.87 $1,089.87 $2,169.87
Gwinnett County 795,657 1 1.56 $5.00 $84.80 $204.50 $404.00 $803.00 $2,000.00 $3,995.00
Hahira 2,846 1 0.86 $27.06 $66.05 $149.60 $288.85 $567.35 $1,402.85 $2,795.35
Hall County 190,482 2 1.02 $12.00 $110.80 $258.99 $505.98 $999.97 $2,496.92 $4,991.84
Hamilton 928 1 1.52 $40.00 $85.00 $152.50 $265.00 $490.00 $1,225.00 $2,450.00
Hampton 7,305 1 1.11 $9.25 $101.04 $301.57 $635.80 $1,304.25 $3,309.60 $6,651.85
Hancock County 900 1 0.35 $28.00 $28.00 $28.00 $28.00 $28.00 $28.00 $28.00
Hapeville 5,385 1 1.39 $12.24 $74.48 $206.91 $431.66 $881.16 $2,229.66 $4,477.16
Haralson County Water Authority (no wastewater bills)
Harlem 5,356 1 1.01 $13.93 $44.25 $107.80 $236.05 $492.55 $1,262.05 $2,544.55
Service Population is approximated and may not be actual.
Source: 1=EPA SDWIS 2017, 2=Census Population in 2016 *Based on data from FY2015 or earlierGeorgia Environmental Finance Authority
and Environmental Finance Center

Compare with caution. High rates may be justified and necessary to protect public health.
Inside Outside Inside Outside Inside Outside Inside Outside Inside Outside Inside Outside Inside Outside
50,000 Gallons
(6,684 cf)
5/8" or 3/4" Meter
100,000 Gallons
(13,369 cf)
5/8" or 3/4" Meter
250,000 Gallons
(33,422 cf)
1" Meter
500,000 Gallons
(66,845 cf)
1.5" or 2" Meter
Operating
Ratio
(FY2016)
Rate Table 10: 2017 Commercial Monthly-Equivalent Sewer Bills at Various Consumption Levels (Includes Base Charges)
Utility / Rate Structure
Service
Population
(Approx.)
Zero Gallons
(0 cf)
5/8" or 3/4" Meter
10,000 Gallons
(1,337 cf)
5/8" or 3/4" Meter
25,000 Gallons
(3,342 cf)
5/8" or 3/4" Meter
Harris County (no wastewater bills)
Harrison 500 1 0.44 $10.00 $31.60 $72.10 $139.60 $274.60 $679.60 $1,354.60
Hart County Water and Sewer Authority 3,606 1 1.10 $19.00 $68.50 $151.00 $288.50 $563.50 $1,396.50 $2,799.50
Hartford Water Authority (no wastewater bills)
Hartwell 7,116 1 1.13 $11.67 $17.23 $44.71 $63.55 $106.66 $150.40 $209.91 $295.15 $416.41 $584.65 $1,035.91 $1,453.15 $2,068.41 $2,900.65
Hawkinsville 4,856 1 1.12 $16.50 $33.00 $39.00 $55.50 $84.00 $100.50 $159.00 $175.50 $309.00 $325.50 $759.00 $775.50 $1,509.00 $1,525.50
Hazlehurst 5,800 1 1.09 $15.50 $23.00 $35.50 $51.96 $73.00 $106.26 $135.50 $196.76 $260.50 $377.76 $635.50 $920.76 $1,260.50 $1,825.76
Heard County Water Authority 8,172 1 0.85 $13.95 $63.95 $138.95 $263.95 $513.95 $1,277.90 $2,555.80
Helen 1,851 1 0.87 $59.44 $72.40 $93.44 $118.55 $153.34 $201.25 $258.59 $347.25 $469.09 $639.25 $1,100.59 $1,515.25 $2,153.09 $2,975.25
Henry County Water Authority 218,667 1 0.88 $13.01 $19.52 $81.21 $121.82 $183.51 $275.27 $354.01 $531.02 $695.01 $1,042.52 $1,718.01 $2,577.02 $3,423.01 $5,134.52
Hephzibah 4,500 1 0.84 $15.00 $22.50 $37.50 $62.50 $112.50 $262.50 $522.50
Hiawassee - above booster 5,496 1 1.04 $66.35 $76.30 $123.05 $141.10 $217.55 $249.10 $375.05 $429.10 $690.05 $789.10 $1,668.22 $1,907.25 $3,364.85 $3,847.12
Hiawassee - below booster 5,496 1 1.04 $66.35 $76.30 $123.05 $141.10 $217.55 $249.10 $375.05 $429.10 $690.05 $789.10 $1,668.22 $1,907.25 $3,364.85 $3,847.12
Hiltonia 392 1 1.12 $12.50 $27.50 $72.50 $147.50 $297.50 $747.50 $1,497.50
Hinesville 23,400 1 0.89 $13.71 $20.57 $25.01 $37.52 $65.56 $98.37 $143.31 $215.12 $298.81 $448.62 $765.31 $1,149.12 $1,542.81 $2,316.62
Hiram (no wastewater bills)
Hoboken (no wastewater bills)
Hogansville 3,728 1 0.74 $30.00 $105.00 $217.50 $405.00 $780.00 $1,425.00 $2,800.00
Homeland (no wastewater bills)
Homer (no wastewater bills)
Hoschton 1,547 1 0.90 $36.61 $168.41 $387.35 $753.35 $1,485.35 $3,681.35 $8,073.85
Houston County (no wastewater bills)
Ideal 450 1 0.91 $20.93 $41.09 $74.69 $130.69 $242.69 $578.69 $1,138.69
Ila (no wastewater bills)
Iron City (no wastewater bills)
Irwinton (no wastewater bills)
Ivey 1,086 1 $28.00 $56.00 $108.50 $196.00 $371.00 $896.00 $1,771.00
Jackson 4,950 2 1.26 $12.00 $14.00 $35.76 $80.08 $80.31 $203.98 $154.56 $410.48 $303.06 $823.48 $748.56 $2,062.48 $1,491.06 $4,127.48
Jackson County Water and Sewer Authority 19,191 1 1.20 $19.08 $89.38 $213.43 $420.18 $833.68 $2,074.18 $4,141.68
Jacksonville (no wastewater bills)
Jakin (no wastewater bills)
Jasper 9,850 1 1.08 $20.00 $20.00 $41.50 $51.50 $73.75 $98.75 $127.50 $177.50 $235.00 $335.00 $567.50 $817.50 $1,115.00 $1,615.00
Jekyll Island Authority 2,083 1 $16.56 $54.06 $110.31 $204.06 $391.56 $954.06 $1,891.56
Jenkinsburg (no wastewater bills)
Jesup 10,200 1 0.99 $43.60 $74.60 $127.25 $215.00 $390.50 $917.00 $1,794.50
Jones County 10,795 1 0.86 $18.00 $64.60 $134.50 $251.00 $484.00 $1,183.00 $2,348.00
Keysville 351 1 0.92 $22.00 $51.52 $106.87 $199.12 $383.62 $937.12 $1,859.62
Service Population is approximated and may not be actual.
Source: 1=EPA SDWIS 2017, 2=Census Population in 2016 *Based on data from FY2015 or earlierGeorgia Environmental Finance Authority
and Environmental Finance Center

Compare with caution. High rates may be justified and necessary to protect public health.
Inside Outside Inside Outside Inside Outside Inside Outside Inside Outside Inside Outside Inside Outside
50,000 Gallons
(6,684 cf)
5/8" or 3/4" Meter
100,000 Gallons
(13,369 cf)
5/8" or 3/4" Meter
250,000 Gallons
(33,422 cf)
1" Meter
500,000 Gallons
(66,845 cf)
1.5" or 2" Meter
Operating
Ratio
(FY2016)
Rate Table 10: 2017 Commercial Monthly-Equivalent Sewer Bills at Various Consumption Levels (Includes Base Charges)
Utility / Rate Structure
Service
Population
(Approx.)
Zero Gallons
(0 cf)
5/8" or 3/4" Meter
10,000 Gallons
(1,337 cf)
5/8" or 3/4" Meter
25,000 Gallons
(3,342 cf)
5/8" or 3/4" Meter
Kingsland 18,697 1 1.36 $14.21 $19.38 $38.61 $55.78 $78.36 $113.53 $144.61 $209.78 $277.11 $402.28 $674.61 $979.78 $1,337.11 $1,942.28
Kingston (no wastewater bills)
Kite (no wastewater bills)
LaFayette 18,177 1 1.67 $8.40 $12.60 $37.20 $55.80 $80.40 $120.60 $152.40 $228.60 $296.40 $444.60 $730.50 $1,095.75 $1,461.00 $2,191.50
Lagrange 41,852 1 1.06 $51.00 $76.57 $127.50 $191.42 $255.00 $382.84 $510.00 $765.68 $1,275.00 $1,914.20 $2,550.00 $3,828.40
Lake Park (no wastewater bills)
Lakeland 2,922 1 0.16 $10.00 $30.25 $64.00 $120.25 $232.75 $570.25 $1,132.75
Lavonia 8,008 1 0.89 $14.50 $15.50 $62.50 $67.90 $152.50 $166.15 $302.50 $329.90 $602.50 $657.40 $1,502.50 $1,639.90 $3,002.50 $3,277.40
Lawrenceville (no wastewater bills)
Lee County Utility Authority 13,500 1 1.19 $19.00 $42.00 $83.25 $152.00 $314.50 $877.00 $1,814.50
Leesburg 3,003 1 0.70 $12.00 $37.00 $74.50 $137.00 $262.00 $637.00 $1,262.00
Lenox 1,011 1 0.81 $46.28 $69.44 $88.53 $132.84 $171.48 $257.14 $325.98 $488.64 $634.98 $951.64 $1,561.98 $2,340.64 $3,106.98 $4,655.64
Leslie (no wastewater bills)
Lexington 796 1 0.67 $20.00 $60.00 $153.75 $310.00 $622.50 $1,560.00 $3,122.50
Liberty County (no wastewater bills)
Lincoln County 3,256 1 1.27 $29.02 $87.76 $191.41 $364.16 $709.66 $1,746.16 $3,473.66
Lincolnton 1,657 1 1.14 $19.50 $60.73 $133.48 $254.73 $497.23 $1,235.73 $2,465.23
Locust Grove 5,648 1 $15.39 $85.31 $253.31 $533.31 $1,093.31 $2,773.31 $5,573.31
Loganville 10,923 1 1.11 $28.48 $90.06 $260.39 $588.64 $1,245.14 $3,214.64 $6,497.14
Lone Oak (no wastewater bills)
Lookout Mountain 1,754 2 1.43 $11.10 $74.87 $170.53 $329.95 $648.80 $1,621.45 $3,242.50
Louisville 2,575 1 1.18 $20.00 $20.00 $50.00 $50.00 $106.25 $106.25 $200.00 $200.00 $387.50 $387.50 $477.50 $950.00 $477.50 $1,392.50
Lowndes County 13,988 1 1.33 $23.49 $57.14 $154.89 $322.14 $656.64 $1,660.14 $3,332.64
Ludowici 1,651 1 0.86 $25.00 $52.05 $101.25 $189.50 $366.00 $895.50 $1,778.00
Lula 2,714 1 0.76 $13.75 $78.15 $186.30 $374.80 $751.80 $1,882.80 $3,767.80
Lumber City 993 1 $19.25 $31.25 $61.25 $111.25 $211.25 $511.25 $1,011.25
Lumpkin (no wastewater bills)
Lumpkin County Water and Sewer Authority 3,226 1 1.30 $43.00 $128.00 $255.50 $468.00 $893.00 $2,168.00 $4,346.00
Luthersville (no wastewater bills)
Lyerly 1,360 1 1.54 $30.00 $40.00 $62.63 $80.13 $127.88 $160.38 $236.63 $294.13 $454.13 $561.63 $1,106.63 $1,364.13 $2,194.13 $2,701.63
Lyons 4,100 1 0.90 $10.00 $20.00 $24.70 $49.40 $64.00 $128.00 $129.50 $259.00 $260.50 $521.00 $653.50 $1,307.00 $1,308.50 $2,617.00
Macon Water Authority - Bibb County 130,024 1 1.10 $9.00 $43.22 $94.56 $180.12 $351.25 $866.29 $1,728.59
Macon Water Authority - Jones County 130,024 1 1.10 $18.00 $64.60 $134.50 $251.00 $484.00 $1,183.00 $2,348.00
Macon Water Authority - Monroe County 130,024 1 1.10 $10.00 $53.05 $117.62 $225.24 $440.48 $1,088.87 $1,622.67
Madison 5,215 1 1.65 $4.60 $67.60 $162.10 $319.60 $634.60 $1,579.60 $3,154.60
Manchester 4,995 1 1.08 $15.00 $63.20 $135.50 $256.00 $497.00 $1,220.00 $2,425.00
Mansfield 791 1 0.71 $24.00 $58.50 $149.85 $302.10 $606.60 $1,520.10 $3,042.60
Service Population is approximated and may not be actual.
Source: 1=EPA SDWIS 2017, 2=Census Population in 2016 *Based on data from FY2015 or earlierGeorgia Environmental Finance Authority
and Environmental Finance Center
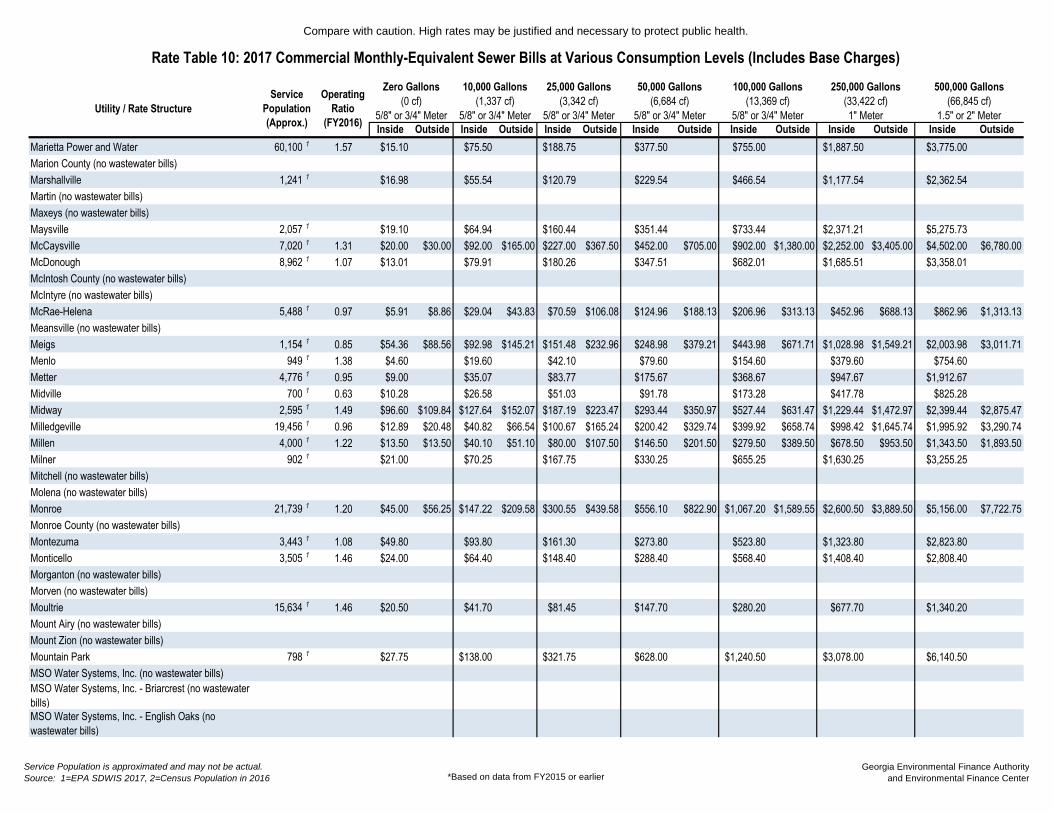
Compare with caution. High rates may be justified and necessary to protect public health.
Inside Outside Inside Outside Inside Outside Inside Outside Inside Outside Inside Outside Inside Outside
50,000 Gallons
(6,684 cf)
5/8" or 3/4" Meter
100,000 Gallons
(13,369 cf)
5/8" or 3/4" Meter
250,000 Gallons
(33,422 cf)
1" Meter
500,000 Gallons
(66,845 cf)
1.5" or 2" Meter
Operating
Ratio
(FY2016)
Rate Table 10: 2017 Commercial Monthly-Equivalent Sewer Bills at Various Consumption Levels (Includes Base Charges)
Utility / Rate Structure
Service
Population
(Approx.)
Zero Gallons
(0 cf)
5/8" or 3/4" Meter
10,000 Gallons
(1,337 cf)
5/8" or 3/4" Meter
25,000 Gallons
(3,342 cf)
5/8" or 3/4" Meter
Marietta Power and Water 60,100 1 1.57 $15.10 $75.50 $188.75 $377.50 $755.00 $1,887.50 $3,775.00
Marion County (no wastewater bills)
Marshallville 1,241 1 $16.98 $55.54 $120.79 $229.54 $466.54 $1,177.54 $2,362.54
Martin (no wastewater bills)
Maxeys (no wastewater bills)
Maysville 2,057 1 $19.10 $64.94 $160.44 $351.44 $733.44 $2,371.21 $5,275.73
McCaysville 7,020 1 1.31 $20.00 $30.00 $92.00 $165.00 $227.00 $367.50 $452.00 $705.00 $902.00 $1,380.00 $2,252.00 $3,405.00 $4,502.00 $6,780.00
McDonough 8,962 1 1.07 $13.01 $79.91 $180.26 $347.51 $682.01 $1,685.51 $3,358.01
McIntosh County (no wastewater bills)
McIntyre (no wastewater bills)
McRae-Helena 5,488 1 0.97 $5.91 $8.86 $29.04 $43.83 $70.59 $106.08 $124.96 $188.13 $206.96 $313.13 $452.96 $688.13 $862.96 $1,313.13
Meansville (no wastewater bills)
Meigs 1,154 1 0.85 $54.36 $88.56 $92.98 $145.21 $151.48 $232.96 $248.98 $379.21 $443.98 $671.71 $1,028.98 $1,549.21 $2,003.98 $3,011.71
Menlo 949 1 1.38 $4.60 $19.60 $42.10 $79.60 $154.60 $379.60 $754.60
Metter 4,776 1 0.95 $9.00 $35.07 $83.77 $175.67 $368.67 $947.67 $1,912.67
Midville 700 1 0.63 $10.28 $26.58 $51.03 $91.78 $173.28 $417.78 $825.28
Midway 2,595 1 1.49 $96.60 $109.84 $127.64 $152.07 $187.19 $223.47 $293.44 $350.97 $527.44 $631.47 $1,229.44 $1,472.97 $2,399.44 $2,875.47
Milledgeville 19,456 1 0.96 $12.89 $20.48 $40.82 $66.54 $100.67 $165.24 $200.42 $329.74 $399.92 $658.74 $998.42 $1,645.74 $1,995.92 $3,290.74
Millen 4,000 1 1.22 $13.50 $13.50 $40.10 $51.10 $80.00 $107.50 $146.50 $201.50 $279.50 $389.50 $678.50 $953.50 $1,343.50 $1,893.50
Milner 902 1 $21.00 $70.25 $167.75 $330.25 $655.25 $1,630.25 $3,255.25
Mitchell (no wastewater bills)
Molena (no wastewater bills)
Monroe 21,739 1 1.20 $45.00 $56.25 $147.22 $209.58 $300.55 $439.58 $556.10 $822.90 $1,067.20 $1,589.55 $2,600.50 $3,889.50 $5,156.00 $7,722.75
Monroe County (no wastewater bills)
Montezuma 3,443 1 1.08 $49.80 $93.80 $161.30 $273.80 $523.80 $1,323.80 $2,823.80
Monticello 3,505 1 1.46 $24.00 $64.40 $148.40 $288.40 $568.40 $1,408.40 $2,808.40
Morganton (no wastewater bills)
Morven (no wastewater bills)
Moultrie 15,634 1 1.46 $20.50 $41.70 $81.45 $147.70 $280.20 $677.70 $1,340.20
Mount Airy (no wastewater bills)
Mount Zion (no wastewater bills)
Mountain Park 798 1 $27.75 $138.00 $321.75 $628.00 $1,240.50 $3,078.00 $6,140.50
MSO Water Systems, Inc. (no wastewater bills)
MSO Water Systems, Inc. - Briarcrest (no wastewater
bills)
MSO Water Systems, Inc. - English Oaks (no
wastewater bills)
Service Population is approximated and may not be actual.
Source: 1=EPA SDWIS 2017, 2=Census Population in 2016 *Based on data from FY2015 or earlierGeorgia Environmental Finance Authority
and Environmental Finance Center

Compare with caution. High rates may be justified and necessary to protect public health.
Inside Outside Inside Outside Inside Outside Inside Outside Inside Outside Inside Outside Inside Outside
50,000 Gallons
(6,684 cf)
5/8" or 3/4" Meter
100,000 Gallons
(13,369 cf)
5/8" or 3/4" Meter
250,000 Gallons
(33,422 cf)
1" Meter
500,000 Gallons
(66,845 cf)
1.5" or 2" Meter
Operating
Ratio
(FY2016)
Rate Table 10: 2017 Commercial Monthly-Equivalent Sewer Bills at Various Consumption Levels (Includes Base Charges)
Utility / Rate Structure
Service
Population
(Approx.)
Zero Gallons
(0 cf)
5/8" or 3/4" Meter
10,000 Gallons
(1,337 cf)
5/8" or 3/4" Meter
25,000 Gallons
(3,342 cf)
5/8" or 3/4" Meter
Nahunta 1,074 1 1.25 $55.60 $88.00 $139.00 $229.00 $439.00 $1,069.00 $2,119.00
Nashville 4,896 1 1.32 $16.50 $43.19 $91.94 $173.19 $335.69 $823.19 $1,635.69
Newborn (no wastewater bills)
Newington 227 1 0.74 $17.00 $29.85 $59.85 $109.85 $209.85 $509.85 $1,009.85
Newnan Utilities 34,000 1 $13.00 $90.00 $205.50 $398.00 $783.00 $1,938.00 $3,863.00
Newton (no wastewater bills)
Newton County Water and Sewer Authority 62,384 1 1.31 $12.25 $76.24 $182.89 $360.64 $716.14 $1,782.64 $3,560.14
Nicholls 2,745 1 1.09 $36.72 $51.58 $76.43 $119.18 $208.18 $475.18 $920.18
Nicholson Water Authority (no wastewater bills)
Norman Park 1,173 1 0.96 $57.04 $78.32 $102.24 $146.12 $184.24 $269.12 $334.24 $494.12 $670.24 $998.12 $1,678.24 $2,510.12 $3,358.24 $5,030.12
Norwood 364 1 $18.00 $32.10 $47.10 $72.10 $122.10 $284.10 $534.10
Notla Water Authority (no wastewater bills)
Oakwood - Flowery Branch 4,098 2 0.96 $64.46 $127.50 $318.75 $637.50 $1,275.00 $3,187.50 $6,375.00
Oakwood - Gainesville 4,098 2 0.96 $127.54 $318.85 $637.70 $1,275.40 $3,188.50 $6,377.01
Ochlocknee 789 1 0.54 $20.00 $29.00 $44.00 $69.00 $119.00 $269.00 $519.00
Ocilla 2,540 1 1.01 $12.75 $22.75 $24.75 $34.75 $47.25 $57.25 $84.75 $94.75 $159.75 $169.75 $384.75 $394.75 $759.75 $769.75
Oconee (no wastewater bills)
Oconee County 19,279 1 2.44 $39.78 $87.66 $167.46 $300.46 $566.46 $1,364.46 $2,694.46
Odum 645 1 0.68 $13.50 $30.50 $63.50 $121.00 $236.00 $581.00 $1,156.00
Oxford 2,214 1 1.35 $21.68 $72.29 $180.74 $361.49 $722.99 $1,807.49 $3,614.99
Palmetto 3,965 1 $14.65 $93.85 $242.35 $489.85 $984.85 $2,469.85 $4,944.85
Parrott (no wastewater bills)
Patterson 972 1 0.85 $81.24 $100.20 $112.52 $147.02 $170.17 $233.57 $271.92 $386.32 $509.42 $742.82 $1,221.92 $1,812.32 $2,409.42 $3,594.82
Paulding County 113,204 1 1.04 $5.50 $80.00 $191.75 $378.00 $750.50 $1,868.00 $3,730.50
Pavo (no wastewater bills)
Peachtree City Water and Sewerage Authority 34,988 2 2.84 $26.00 $87.50 $179.75 $333.50 $641.00 $1,563.50 $3,101.00
Pearson 2,000 2 1.14 $57.80 $123.25 $225.70 $396.45 $761.95 $1,858.45 $3,685.95
Pelham 3,601 1 1.70 $19.00 $24.70 $41.05 $53.41 $77.80 $101.26 $139.05 $181.01 $261.55 $340.51 $629.05 $819.01 $1,241.55 $1,616.51
Pembroke 2,571 1 0.83 $41.50 $64.70 $104.30 $174.30 $314.30 $764.30 $1,489.30
Perkins Water Authority (no wastewater bills)
Pickens County Water Authority (no wastewater bills)
Piedmont Water Co. - Lake Oconee 0 $40.50 $114.00 $287.00 $587.00 $1,212.00 $3,087.00 $6,212.00
Pike County Water and Sewer Authority (no
wastewater bills)
Pine Mountain 1,697 1 0.83 $12.00 $15.00 $53.40 $56.40 $122.40 $125.40 $237.40 $240.40 $467.40 $470.40 $1,157.40 $1,160.40 $2,307.40 $2,310.40
Pinehurst 460 1 2.29 $11.67 $28.71 $60.66 $113.91 $220.41 $539.91 $1,072.41
Service Population is approximated and may not be actual.
Source: 1=EPA SDWIS 2017, 2=Census Population in 2016 *Based on data from FY2015 or earlierGeorgia Environmental Finance Authority
and Environmental Finance Center

Compare with caution. High rates may be justified and necessary to protect public health.
Inside Outside Inside Outside Inside Outside Inside Outside Inside Outside Inside Outside Inside Outside
50,000 Gallons
(6,684 cf)
5/8" or 3/4" Meter
100,000 Gallons
(13,369 cf)
5/8" or 3/4" Meter
250,000 Gallons
(33,422 cf)
1" Meter
500,000 Gallons
(66,845 cf)
1.5" or 2" Meter
Operating
Ratio
(FY2016)
Rate Table 10: 2017 Commercial Monthly-Equivalent Sewer Bills at Various Consumption Levels (Includes Base Charges)
Utility / Rate Structure
Service
Population
(Approx.)
Zero Gallons
(0 cf)
5/8" or 3/4" Meter
10,000 Gallons
(1,337 cf)
5/8" or 3/4" Meter
25,000 Gallons
(3,342 cf)
5/8" or 3/4" Meter
Pineview (no wastewater bills)
Pitts (no wastewater bills)
Plains 892 1 0.65 $61.80 $77.28 $87.45 $109.38 $133.40 $166.88 $212.15 $265.38 $369.65 $462.38 $842.15 $1,053.38 $1,629.65 $2,038.38
Polk County Water Authority 24,061 1 0.94 $18.45 $81.94 $203.40 $413.02 $832.27 $2,090.02 $4,186.27
Polk County Water Authority - Vinson Mountain (no
wastewater bills)
Pooler 21,187 1 1.09 $41.17 $74.97 $128.37 $217.37 $395.37 $929.37 $1,819.37
Port Wentworth 4,160 1 1.20 $33.08 $42.28 $82.68 $113.67 $157.08 $220.76 $281.07 $399.23 $529.07 $756.18 $1,273.05 $1,827.04 $2,513.03 $3,611.80
Portal 879 1 0.80 $19.00 $47.00 $99.50 $187.00 $387.00 $987.00 $1,987.00
Poulan (no wastewater bills)
Powder Springs 14,000 1 1.16 $29.76 $99.74 $208.49 $389.74 $752.24 $1,839.74 $3,652.24
Pulaski (no wastewater bills)
Quitman 4,942 1 0.98 $5.86 $46.66 $111.16 $218.66 $433.66 $1,078.66 $2,153.66
Rabun County Water and Sewer Authority 0 0.77 $18.00 $70.00 $167.50 $330.00 $655.00 $1,630.00 $3,255.00
Randolph County Water Authority (no wastewater bills)
Ray City 845 1 1.05 $45.08 $57.88 $79.48 $109.48 $131.08 $186.88 $217.08 $315.88 $389.08 $573.88 $905.08 $1,347.88 $1,765.08 $2,637.88
Register (no wastewater bills)
Remerton 1,479 1 0.94 $8.25 $38.25 $83.25 $158.25 $308.25 $758.25 $1,508.25
Rentz 310 1 1.64 $23.50 $39.50 $69.50 $119.50 $219.50 $519.50 $1,019.50
Reynolds 1,373 1 0.68 $25.00 $37.00 $55.40 $82.60 $112.40 $168.10 $207.40 $310.60 $397.40 $595.60 $967.40 $1,450.60 $1,917.40 $2,875.60
Rhine (no wastewater bills)
Riceboro 1,131 1 0.68 $15.00 $27.00 $49.50 $87.00 $162.00 $387.00 $762.00
Richland 1,323 1 0.62 $15.00 $15.00 $15.00 $15.00 $15.00 $15.00 $15.00
Richmond Hill 11,258 1 1.52 $23.50 $35.25 $61.50 $92.25 $118.50 $177.75 $213.50 $320.25 $403.50 $605.25 $973.50 $1,460.25 $1,923.50 $2,885.25
Riddleville (no wastewater bills)
Rincon 9,880 1 1.94 $28.00 $41.00 $55.00 $71.75 $130.00 $158.00 $262.50 $310.50 $537.50 $635.50 $1,362.50 $1,610.50 $2,737.50 $3,235.50
Ringgold 2,743 1 1.05 $15.30 $45.78 $102.93 $198.18 $388.68 $960.14 $1,912.61
Ringgold - Dalton 0 $23.22 $74.02 $150.22 $277.22 $531.22 $1,331.26 $2,687.13
Ringgold - Meadows 0 $21.53 $96.73 $209.53 $397.53 $773.53 $1,901.53 $3,781.53
Roberta 1,615 1 0.86 $17.99 $55.49 $111.74 $214.89 $486.89 $1,377.89 $2,862.89
Rochelle 1,581 1 1.33 $14.50 $16.50 $34.50 $36.50 $64.50 $66.50 $114.50 $116.50 $214.50 $216.50 $514.50 $516.50 $1,014.50 $1,016.50
Rockdale County Water and Sewer Authority 72,621 1 $14.63 $77.03 $170.63 $326.63 $638.63 $1,591.35 $3,180.88
Rockmart 6,500 1 1.39 $13.27 $19.90 $66.31 $99.42 $170.86 $255.87 $353.36 $529.62 $787.11 $1,179.87 $2,120.61 $3,177.87 $4,343.11 $6,507.87
Rocky Ford (no wastewater bills)
Rome - Zone 1 45,586 1 1.54 $13.07 $62.42 $142.44 $275.79 $542.50 $1,349.48 $2,696.42
Rome - Zone 2 45,586 1 1.54 $13.07 $18.15 $62.42 $104.78 $142.44 $234.73 $275.79 $451.31 $542.50 $884.46 $1,349.48 $2,193.76 $2,696.42 $4,376.79
Service Population is approximated and may not be actual.
Source: 1=EPA SDWIS 2017, 2=Census Population in 2016 *Based on data from FY2015 or earlierGeorgia Environmental Finance Authority
and Environmental Finance Center

Compare with caution. High rates may be justified and necessary to protect public health.
Inside Outside Inside Outside Inside Outside Inside Outside Inside Outside Inside Outside Inside Outside
50,000 Gallons
(6,684 cf)
5/8" or 3/4" Meter
100,000 Gallons
(13,369 cf)
5/8" or 3/4" Meter
250,000 Gallons
(33,422 cf)
1" Meter
500,000 Gallons
(66,845 cf)
1.5" or 2" Meter
Operating
Ratio
(FY2016)
Rate Table 10: 2017 Commercial Monthly-Equivalent Sewer Bills at Various Consumption Levels (Includes Base Charges)
Utility / Rate Structure
Service
Population
(Approx.)
Zero Gallons
(0 cf)
5/8" or 3/4" Meter
10,000 Gallons
(1,337 cf)
5/8" or 3/4" Meter
25,000 Gallons
(3,342 cf)
5/8" or 3/4" Meter
Rome - Zone 3 45,586 1 1.54 $18.15 $104.78 $234.73 $451.31 $884.46 $2,183.93 $4,349.70
Rome - Zone 4 45,586 1 1.54 $18.15 $21.10 $98.30 $136.61 $228.25 $309.87 $444.83 $598.64 $877.98 $1,176.18 $2,187.28 $2,919.67 $4,370.31 $5,826.81
Roopville (no wastewater bills)
Roswell 14,300 1 1.33 $3.45 $58.55 $141.20 $278.95 $554.45 $1,380.95 $2,758.45
Royston 2,800 1 0.94 $10.45 $40.45 $85.45 $160.45 $310.45 $760.45 $1,513.75
Rutledge 918 1 1.63 $14.00 $47.00 $118.25 $237.00 $474.50 $1,187.00 $2,374.50
Saint Marys 17,270 1 0.93 $20.45 $50.73 $99.93 $181.93 $345.93 $837.93 $1,657.93
Sale City (no wastewater bills)
Sandersville 6,100 1 2.55 $18.00 $18.00 $33.60 $41.44 $62.85 $85.39 $111.60 $158.64 $209.10 $305.14 $501.60 $744.64 $989.10 $1,477.14
Sardis 999 1 0.99 $17.69 $157.69 $367.69 $717.69 $1,417.69 $3,517.69 $7,017.69
Sasser (no wastewater bills)
Satilla Regional Water and Sewer Authority 14,311 1 1.40 $30.00 $73.20 $149.41 $276.41 $530.42 $1,292.45 $2,581.51
Savannah 215,566 1 1.22 $4.40 $6.60 $51.68 $77.46 $126.88 $190.16 $252.22 $377.99 $502.89 $753.66 $1,254.89 $1,880.67 $2,508.23 $3,759.01
Schley County (no wastewater bills)
Scotland 356 1 $13.00 $13.00 $13.00 $13.00 $13.00 $13.00 $13.00
Screven 840 1 $15.00 $34.25 $74.75 $144.75 $284.75 $704.75 $1,404.75
Senoia 3,466 1 1.18 $20.57 $64.13 $136.73 $257.73 $499.73 $1,225.73 $2,435.73
Shady Dale (no wastewater bills)
Shellman 1,115 1 0.74 $11.50 $11.50 $11.50 $11.50 $11.50 $11.50 $11.50
Shiloh (no wastewater bills)
Siloam (no wastewater bills)
Sky Lake POA, Inc. (no wastewater bills)
Sky Valley (no wastewater bills)
Smithville 647 1 0.42 $17.00 $17.00 $17.00 $17.00 $17.00 $17.00 $17.00
Smyrna 35,000 1 1.19 $15.18 $87.68 $196.43 $377.68 $740.18 $1,834.74 $3,673.43
Social Circle 4,235 1 1.51 $19.40 $29.15 $83.32 $125.07 $203.17 $304.92 $402.92 $604.67 $802.42 $1,204.17 $2,000.92 $3,002.67 $3,998.42 $6,000.17
Soperton 2,470 1 1.02 $25.00 $50.00 $25.00 $62.00 $44.50 $84.50 $94.50 $134.50 $194.50 $234.50 $682.00 $722.00 $1,494.50 $1,534.50
Spalding County 40,430 1 1.20 $16.98 $79.22 $195.92 $390.42 $779.42 $1,946.42 $3,891.42
Sparks 1,823 1 1.14 $20.75 $20.75 $20.75 $20.75 $20.75 $20.75 $20.75
Springfield 3,100 1 1.15 $15.60 $31.20 $40.56 $62.40 $87.36 $120.90 $165.36 $218.40 $321.36 $413.40 $789.36 $998.40 $1,569.36 $1,973.40
Statesboro 36,846 1 1.27 $8.50 $12.75 $39.10 $58.85 $86.95 $130.25 $168.20 $251.50 $330.70 $494.00 $818.20 $1,221.50 $1,630.70 $2,434.00
Statham 3,986 1 $24.64 $65.51 $142.76 $271.51 $529.01 $1,301.51 $2,589.01
Stewart County Water and Sewer Authority (no
wastewater bills)
Stillmore 615 1 $17.50 $41.15 $108.65 $221.15 $446.15 $1,121.15 $2,246.15
Stockbridge 6,500 1 1.09 $6.00 $79.70 $212.45 $433.70 $876.20 $2,204.70 $4,422.20
Summerville 11,651 1 1.22 $17.37 $22.93 $48.59 $64.23 $115.49 $152.72 $226.99 $300.21 $441.47 $583.68 $1,084.89 $1,434.11 $2,157.27 $2,851.48
Service Population is approximated and may not be actual.
Source: 1=EPA SDWIS 2017, 2=Census Population in 2016 *Based on data from FY2015 or earlierGeorgia Environmental Finance Authority
and Environmental Finance Center
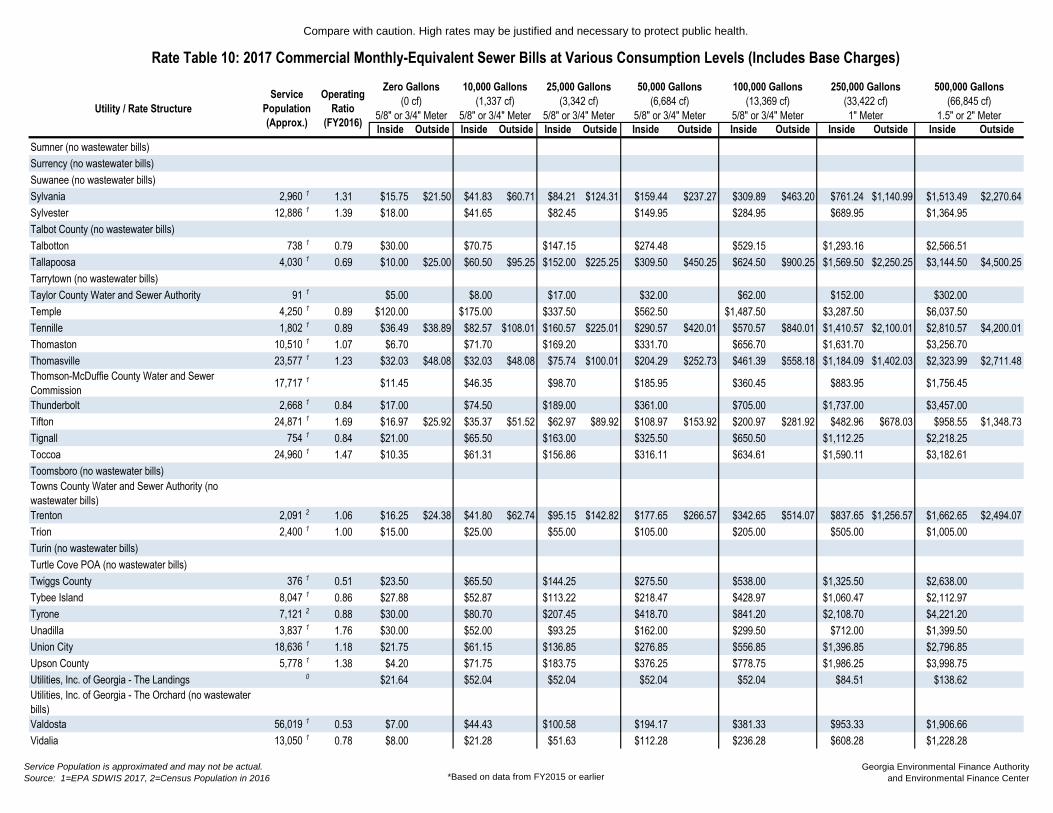
Compare with caution. High rates may be justified and necessary to protect public health.
Inside Outside Inside Outside Inside Outside Inside Outside Inside Outside Inside Outside Inside Outside
50,000 Gallons
(6,684 cf)
5/8" or 3/4" Meter
100,000 Gallons
(13,369 cf)
5/8" or 3/4" Meter
250,000 Gallons
(33,422 cf)
1" Meter
500,000 Gallons
(66,845 cf)
1.5" or 2" Meter
Operating
Ratio
(FY2016)
Rate Table 10: 2017 Commercial Monthly-Equivalent Sewer Bills at Various Consumption Levels (Includes Base Charges)
Utility / Rate Structure
Service
Population
(Approx.)
Zero Gallons
(0 cf)
5/8" or 3/4" Meter
10,000 Gallons
(1,337 cf)
5/8" or 3/4" Meter
25,000 Gallons
(3,342 cf)
5/8" or 3/4" Meter
Sumner (no wastewater bills)
Surrency (no wastewater bills)
Suwanee (no wastewater bills)
Sylvania 2,960 1 1.31 $15.75 $21.50 $41.83 $60.71 $84.21 $124.31 $159.44 $237.27 $309.89 $463.20 $761.24 $1,140.99 $1,513.49 $2,270.64
Sylvester 12,886 1 1.39 $18.00 $41.65 $82.45 $149.95 $284.95 $689.95 $1,364.95
Talbot County (no wastewater bills)
Talbotton 738 1 0.79 $30.00 $70.75 $147.15 $274.48 $529.15 $1,293.16 $2,566.51
Tallapoosa 4,030 1 0.69 $10.00 $25.00 $60.50 $95.25 $152.00 $225.25 $309.50 $450.25 $624.50 $900.25 $1,569.50 $2,250.25 $3,144.50 $4,500.25
Tarrytown (no wastewater bills)
Taylor County Water and Sewer Authority 91 1 $5.00 $8.00 $17.00 $32.00 $62.00 $152.00 $302.00
Temple 4,250 1 0.89 $120.00 $175.00 $337.50 $562.50 $1,487.50 $3,287.50 $6,037.50
Tennille 1,802 1 0.89 $36.49 $38.89 $82.57 $108.01 $160.57 $225.01 $290.57 $420.01 $570.57 $840.01 $1,410.57 $2,100.01 $2,810.57 $4,200.01
Thomaston 10,510 1 1.07 $6.70 $71.70 $169.20 $331.70 $656.70 $1,631.70 $3,256.70
Thomasville 23,577 1 1.23 $32.03 $48.08 $32.03 $48.08 $75.74 $100.01 $204.29 $252.73 $461.39 $558.18 $1,184.09 $1,402.03 $2,323.99 $2,711.48
Thomson-McDuffie County Water and Sewer
Commission 17,717 1 $11.45 $46.35 $98.70 $185.95 $360.45 $883.95 $1,756.45
Thunderbolt 2,668 1 0.84 $17.00 $74.50 $189.00 $361.00 $705.00 $1,737.00 $3,457.00
Tifton 24,871 1 1.69 $16.97 $25.92 $35.37 $51.52 $62.97 $89.92 $108.97 $153.92 $200.97 $281.92 $482.96 $678.03 $958.55 $1,348.73
Tignall 754 1 0.84 $21.00 $65.50 $163.00 $325.50 $650.50 $1,112.25 $2,218.25
Toccoa 24,960 1 1.47 $10.35 $61.31 $156.86 $316.11 $634.61 $1,590.11 $3,182.61
Toomsboro (no wastewater bills)
Towns County Water and Sewer Authority (no
wastewater bills)
Trenton 2,091 2 1.06 $16.25 $24.38 $41.80 $62.74 $95.15 $142.82 $177.65 $266.57 $342.65 $514.07 $837.65 $1,256.57 $1,662.65 $2,494.07
Trion 2,400 1 1.00 $15.00 $25.00 $55.00 $105.00 $205.00 $505.00 $1,005.00
Turin (no wastewater bills)
Turtle Cove POA (no wastewater bills)
Twiggs County 376 1 0.51 $23.50 $65.50 $144.25 $275.50 $538.00 $1,325.50 $2,638.00
Tybee Island 8,047 1 0.86 $27.88 $52.87 $113.22 $218.47 $428.97 $1,060.47 $2,112.97
Tyrone 7,121 2 0.88 $30.00 $80.70 $207.45 $418.70 $841.20 $2,108.70 $4,221.20
Unadilla 3,837 1 1.76 $30.00 $52.00 $93.25 $162.00 $299.50 $712.00 $1,399.50
Union City 18,636 1 1.18 $21.75 $61.15 $136.85 $276.85 $556.85 $1,396.85 $2,796.85
Upson County 5,778 1 1.38 $4.20 $71.75 $183.75 $376.25 $778.75 $1,986.25 $3,998.75
Utilities, Inc. of Georgia - The Landings 0 $21.64 $52.04 $52.04 $52.04 $52.04 $84.51 $138.62
Utilities, Inc. of Georgia - The Orchard (no wastewater
bills)
Valdosta 56,019 1 0.53 $7.00 $44.43 $100.58 $194.17 $381.33 $953.33 $1,906.66
Vidalia 13,050 1 0.78 $8.00 $21.28 $51.63 $112.28 $236.28 $608.28 $1,228.28
Service Population is approximated and may not be actual.
Source: 1=EPA SDWIS 2017, 2=Census Population in 2016 *Based on data from FY2015 or earlierGeorgia Environmental Finance Authority
and Environmental Finance Center
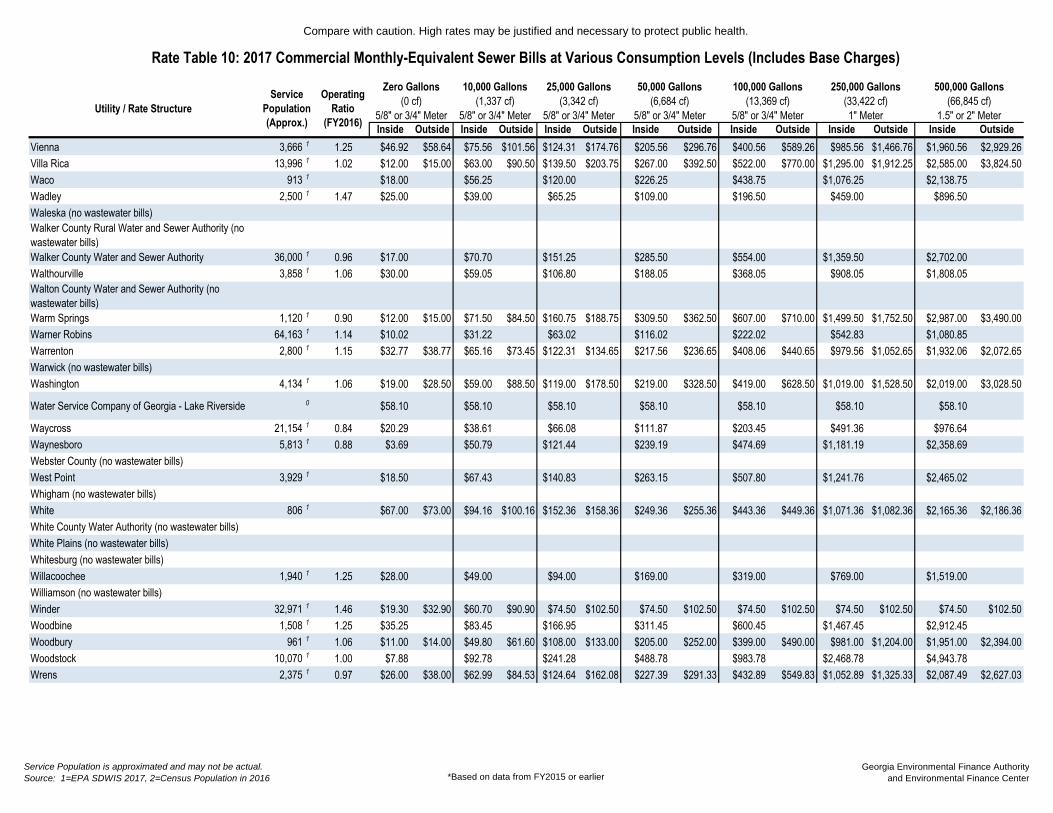
Compare with caution. High rates may be justified and necessary to protect public health.
Inside Outside Inside Outside Inside Outside Inside Outside Inside Outside Inside Outside Inside Outside
50,000 Gallons
(6,684 cf)
5/8" or 3/4" Meter
100,000 Gallons
(13,369 cf)
5/8" or 3/4" Meter
250,000 Gallons
(33,422 cf)
1" Meter
500,000 Gallons
(66,845 cf)
1.5" or 2" Meter
Operating
Ratio
(FY2016)
Rate Table 10: 2017 Commercial Monthly-Equivalent Sewer Bills at Various Consumption Levels (Includes Base Charges)
Utility / Rate Structure
Service
Population
(Approx.)
Zero Gallons
(0 cf)
5/8" or 3/4" Meter
10,000 Gallons
(1,337 cf)
5/8" or 3/4" Meter
25,000 Gallons
(3,342 cf)
5/8" or 3/4" Meter
Vienna 3,666 1 1.25 $46.92 $58.64 $75.56 $101.56 $124.31 $174.76 $205.56 $296.76 $400.56 $589.26 $985.56 $1,466.76 $1,960.56 $2,929.26
Villa Rica 13,996 1 1.02 $12.00 $15.00 $63.00 $90.50 $139.50 $203.75 $267.00 $392.50 $522.00 $770.00 $1,295.00 $1,912.25 $2,585.00 $3,824.50
Waco 913 1 $18.00 $56.25 $120.00 $226.25 $438.75 $1,076.25 $2,138.75
Wadley 2,500 1 1.47 $25.00 $39.00 $65.25 $109.00 $196.50 $459.00 $896.50
Waleska (no wastewater bills)
Walker County Rural Water and Sewer Authority (no
wastewater bills)
Walker County Water and Sewer Authority 36,000 1 0.96 $17.00 $70.70 $151.25 $285.50 $554.00 $1,359.50 $2,702.00
Walthourville 3,858 1 1.06 $30.00 $59.05 $106.80 $188.05 $368.05 $908.05 $1,808.05
Walton County Water and Sewer Authority (no
wastewater bills)
Warm Springs 1,120 1 0.90 $12.00 $15.00 $71.50 $84.50 $160.75 $188.75 $309.50 $362.50 $607.00 $710.00 $1,499.50 $1,752.50 $2,987.00 $3,490.00
Warner Robins 64,163 1 1.14 $10.02 $31.22 $63.02 $116.02 $222.02 $542.83 $1,080.85
Warrenton 2,800 1 1.15 $32.77 $38.77 $65.16 $73.45 $122.31 $134.65 $217.56 $236.65 $408.06 $440.65 $979.56 $1,052.65 $1,932.06 $2,072.65
Warwick (no wastewater bills)
Washington 4,134 1 1.06 $19.00 $28.50 $59.00 $88.50 $119.00 $178.50 $219.00 $328.50 $419.00 $628.50 $1,019.00 $1,528.50 $2,019.00 $3,028.50
Water Service Company of Georgia - Lake Riverside 0 $58.10 $58.10 $58.10 $58.10 $58.10 $58.10 $58.10
Waycross 21,154 1 0.84 $20.29 $38.61 $66.08 $111.87 $203.45 $491.36 $976.64
Waynesboro 5,813 1 0.88 $3.69 $50.79 $121.44 $239.19 $474.69 $1,181.19 $2,358.69
Webster County (no wastewater bills)
West Point 3,929 1 $18.50 $67.43 $140.83 $263.15 $507.80 $1,241.76 $2,465.02
Whigham (no wastewater bills)
White 806 1 $67.00 $73.00 $94.16 $100.16 $152.36 $158.36 $249.36 $255.36 $443.36 $449.36 $1,071.36 $1,082.36 $2,165.36 $2,186.36
White County Water Authority (no wastewater bills)
White Plains (no wastewater bills)
Whitesburg (no wastewater bills)
Willacoochee 1,940 1 1.25 $28.00 $49.00 $94.00 $169.00 $319.00 $769.00 $1,519.00
Williamson (no wastewater bills)
Winder 32,971 1 1.46 $19.30 $32.90 $60.70 $90.90 $74.50 $102.50 $74.50 $102.50 $74.50 $102.50 $74.50 $102.50 $74.50 $102.50
Woodbine 1,508 1 1.25 $35.25 $83.45 $166.95 $311.45 $600.45 $1,467.45 $2,912.45
Woodbury 961 1 1.06 $11.00 $14.00 $49.80 $61.60 $108.00 $133.00 $205.00 $252.00 $399.00 $490.00 $981.00 $1,204.00 $1,951.00 $2,394.00
Woodstock 10,070 1 1.00 $7.88 $92.78 $241.28 $488.78 $983.78 $2,468.78 $4,943.78
Wrens 2,375 1 0.97 $26.00 $38.00 $62.99 $84.53 $124.64 $162.08 $227.39 $291.33 $432.89 $549.83 $1,052.89 $1,325.33 $2,087.49 $2,627.03
Service Population is approximated and may not be actual.
Source: 1=EPA SDWIS 2017, 2=Census Population in 2016 *Based on data from FY2015 or earlierGeorgia Environmental Finance Authority
and Environmental Finance Center