table of contents yasi assessments...draft 2013-2014 nys annual probation state aid plan and...
TRANSCRIPT

DRAFT 2013-2014 NYS Annual Probation State Aid Plan and Application
Appendix A: 2013-2014 Probation Analysis and Planning File
TABLE of CONTENTS
Juvenile Probation Table 1 2012 YASI Assessments Table 2 2011 Juvenile Workload Volume Table 3 2011 Juvenile Adjustment Rates Table 4 2011 Juvenile Probation Supervision Cases Closed Table 5 2010 Detention Admissions and Care Days Table 6 2011 Detention Admissions and Care Days Table 7 2010-2011 JD Custody Table 8 2010-2011 Local District of Social Services Custody PINS Youth in Care Adult Probation Table 9 2012 Unsentenced Local Jail Population Table 10 2012 COMPAS Assessments and Reviews Completed by Probation Departments Table 11 2012 New Probationers Received Table 12 2012 Probation Arrests and Total Arrests By County Table 13 2012 Violations of Probation Filed Table 14 2012 Probationers Re-Sentenced for a Violation of Probation Table 15 2012 Adult Supervision Outcomes Table 16 Probationer Felony Re-Arrests within One, Two,and Three Years of Being Sentenced: 2007 - 2011 Table 17 Probation Cases Past Maximum Expiration Date

CountyInitial
AssessmentReassessment Case Closure
Total YASI
Assessments
Completed
Albany 526 621 432 1,579
Allegany 82 40 2 124
Broome 278 149 87 514
Cattaraugus 55 22 0 77
Cayuga 144 2 0 146
Chautauqua 201 81 96 378
Chemung 295 371 242 908
Chenango 46 11 40 97
Clinton 137 53 76 266
Columbia 96 220 68 384
Cortland 55 2 0 57
Delaware 41 28 37 106
Dutchess 461 924 90 1,475
Erie 827 728 195 1,750
Essex 31 8 13 52
Franklin 111 196 58 365
Fulton 57 1 0 58
Genesee 93 9 1 103
Greene 60 0 0 60
Hamilton 1 0 0 1
Herkimer 87 19 0 106
Jefferson 164 145 137 446
Lewis 6 0 0 6
Livingston 102 3 0 105
Madison 57 61 33 151
Monroe 1,000 356 652 2,008
Montgomery 39 22 27 88
Nassau 1,317 356 206 1,879
Niagara 349 245 261 855
Oneida 212 33 21 266
Onondaga 421 199 11 631
Ontario 146 73 111 330
Orange 294 402 251 947
Orleans 129 59 115 303
Oswego 100 127 96 323
Otsego 74 69 74 217
Putnam 48 33 22 103
Rensselaer 241 551 246 1,038
Rockland 36 23 22 81
Saratoga 203 175 156 534
Schenectady 241 313 190 744
Schoharie 51 36 0 87
Schuyler 39 33 22 94
Seneca 4 4 1 9
St Lawrence 155 154 136 445
Steuben 97 12 3 112
Suffolk 442 755 33 1,230
Sullivan 37 4 1 42
Tioga 54 57 27 138
Tompkins 180 97 165 442
Ulster 272 247 153 672
Warren 128 56 90 274
Washington 103 17 6 126
Wayne 71 10 24 105
Westchester 445 284 145 874
Wyoming 37 8 2 47
Yates 27 84 8 119
Non-NYC Total 11,005 8,588 4,884 24,477
Bronx 0 0 0 0
Kings 0 0 0 0
New York 0 0 0 0
Queens 0 0 0 0
Richmond 0 0 0 0
NYC Total 0 0 0 0
Total 11,005 8,588 4,884 24,477
Source: YASI Database 2/2013
2012 YASI Assessments
RFA Table #1

County
PINS
Intake
Opened
PINS
Investigations
Opened
PINS
Supervison
Cases
Opened
JD Intake
Opened
JD
Investigations
Opened
JD
Supervison
Cases
Opened
Albany 292 40 31 618 106 90
Allegany 53 5 0 37 6 1
Broome 108 20 10 376 102 54
Cattaraugus 150 5 14 149 28 78
Cayuga 0 8 1 82 21 11
Chautauqua 86 4 11 154 11 18
Chemung N/A 30 13 144 72 37
Chenango N/A 0 0 50 12 6
Clinton N/A 1 2 95 4 11
Columbia 89 23 20 66 10 9
Cortland 74 24 8 48 10 2
Delaware N/A 0 7 15 1 5
Dutchess 53 44 33 162 85 68
Erie 42 0 57 920 342 312
Essex 24 8 8 22 5 8
Franklin 116 12 35 20 7 40
Fulton N/A 0 11 55 5 10
Genesee 93 23 31 33 19 36
Greene 37 7 32 58 2 32
Hamilton 0 0 0 0 0 0
Herkimer 15 1 7 3 0 18
Jefferson N/A 0 0 47 1 27
Lewis N/A 0 5 16 3 4
Livingston 71 6 7 63 21 14
Madison N/A 5 2 78 11 11
Monroe 1,044 151 128 761 207 169
Montgomery N/A 5 26 68 15 90
Nassau N/A 37 22 630 151 148
Niagara 231 15 6 316 56 54
Oneida 365 109 90 322 88 91
Onondaga 209 16 17 607 44 53
Ontario 36 2 9 95 30 32
Orange 208 22 21 291 154 235
Orleans 92 12 10 62 5 8
Oswego N/A 18 16 176 25 18
Otsego 19 0 11 28 1 16
Putnam 113 9 8 35 3 9
Rensselaer 269 67 61 70 24 21
Rockland 154 63 29 125 52 35
St Lawrence 165 13 17 74 31 28
Saratoga 112 5 6 84 21 17
Schenectady 156 18 20 247 27 28
Schoharie 24 4 5 31 4 0
Schuyler N/A 2 7 14 5 6
Seneca 28 4 6 23 18 21
Steuben 180 4 28 93 28 103
Suffolk 224 54 84 388 185 192
Sullivan N/A 7 7 79 14 11
Tioga N/A 4 3 57 7 23
Tompkins 173 3 23 87 40 25
Ulster 177 46 36 173 50 55
Warren 60 0 2 54 4 4
Washington N/A 0 10 62 6 3
Wayne 47 15 9 122 49 17
Westchester 1,015 135 72 497 184 224
Wyoming 40 9 12 20 9 9
Yates N/A 4 2 11 20 31
Non-NYC Total 6,444 1,119 1,148 9,013 2,441 2,678
Bronx N/A 0 5 3,685 651 609
Kings N/A 0 5 3,340 367 385
New York N/A 8 1 1,690 509 293
Queens N/A 1 0 2,415 562 494
Richmond N/A 18 2 639 175 148
NYC Total N/A 27 13 11,769 2,264 1,929
Statewide Total 6,444 1,146 1,161 20,782 4,705 4,607
Source: PWS 2/2013
N/A: Not applicable. These county probation departments do not handle PINS intake cases.
2011 Juvenile Workload Volume
RFA Table #2

County JD Cases Closed % JD Adjusted
Albany 588 50%
Allegany 28 57%
Broome 378 43%
Cattaraugus 160 51%
Cayuga 81 44%
Chautauqua 145 86%
Chemung 154 30%
Chenango 47 62%
Clinton 39 92%
Columbia 73 45%
Cortland 43 56%
Delaware 26 50%
Dutchess 145 37%
Erie 1,212 48%
Essex 39 28%
Franklin 14 71%
Fulton 57 35%
Genesee 30 17%
Greene 57 32%
Hamilton 0 0%
Herkimer 54 78%
Jefferson 121 31%
Lewis 13 54%
Livingston 51 45%
Madison 47 66%
Monroe 743 46%
Montgomery 61 25%
Nassau 631 55%
Niagara 284 58%
Oneida 325 53%
Onondaga 688 47%
Ontario 118 74%
Orange 266 21%
Orleans 39 44%
Oswego 145 47%
Otsego 22 64%
Putnam 30 40%
Rensselaer 134 32%
Rockland 118 48%
Saratoga 98 72%
Schenectady 93 49%
Schoharie 183 40%
Schuyler 57 67%
Seneca 15 33%
St Lawrence 82 20%
Steuben 77 39%
Suffolk 425 15%
Sullivan 80 31%
Tioga 59 63%
Tompkins 79 28%
Ulster 183 37%
Warren 72 65%
Washington 65 51%
Wayne 116 53%
Westchester 459 33%
Wyoming 21 48%
Yates 10 10%
Non-NYC Total 9,380 45%
Bronx 3,882 43%
Kings 3,359 36%
New York 1,694 25%
Queens 2,427 35%
Richmond 669 37%
NYC Total 12,031 37%
Statewide Total 21,411 40%
Source: PWS 2/2013
Calculated: 2011 Adjusted/2011 Total Closed
2011 Juvenile Adjustment Rates
RFA Table #3

County
Total PINS
Cases
Closed
% Positive
Outcome*
% Negative
Outcome**
Total JD
Cases
Closed
% Positive
Outcome*
% Negative
Outcome**
Albany 18 72% 28% 20 60% 40%
Allegany 0 0% 0% 0 0% 0%
Broome 34 74% 26% 73 88% 12%
Cattaraugus 10 40% 60% 58 29% 71%
Cayuga 1 0% 100% 6 100% 0%
Chautauqua 2 50% 50% 17 47% 53%
Chemung 8 63% 38% 19 68% 32%
Chenango 2 100% 0% 7 43% 57%
Clinton 2 0% 100% 4 75% 25%
Columbia 19 63% 37% 9 56% 44%
Cortland 17 94% 6% 10 100% 0%
Delaware 5 80% 20% 2 100% 0%
Dutchess 23 74% 26% 60 75% 25%
Erie 25 28% 72% 201 63% 37%
Essex 2 0% 100% 6 50% 50%
Franklin 6 33% 67% 7 57% 43%
Fulton 23 43% 57% 6 83% 17%
Genesee 12 50% 50% 16 56% 44%
Greene 25 60% 40% 34 74% 26%
Hamilton 0 0% 0% 0 0% 0%
Herkimer 8 88% 13% 15 87% 13%
Jefferson 0 0% 0% 27 93% 7%
Lewis 2 0% 100% 2 50% 50%
Livingston 7 86% 14% 10 80% 20%
Madison 3 0% 100% 9 89% 11%
Monroe 125 64% 36% 159 72% 28%
Montgomery 9 67% 33% 16 81% 19%
Nassau 16 38% 63% 127 70% 30%
Niagara 9 78% 22% 52 87% 13%
Oneida 58 76% 24% 43 81% 19%
Onondaga 11 91% 9% 79 77% 23%
Ontario 6 83% 17% 24 67% 33%
Orange 14 71% 29% 94 70% 30%
Orleans 3 33% 67% 6 83% 17%
Oswego 22 95% 5% 18 78% 22%
Otsego 2 50% 50% 1 0% 100%
Putnam 3 67% 33% 7 71% 29%
Rensselaer 67 76% 24% 22 77% 23%
Rockland 30 60% 40% 47 68% 32%
St Lawrence 10 50% 50% 12 75% 25%
Saratoga 7 86% 14% 17 82% 18%
Schenectady 17 59% 41% 40 63% 38%
Schoharie 3 100% 0% 1 0% 100%
Schuyler 4 25% 75% 3 67% 33%
Seneca 4 25% 75% 11 64% 36%
Steuben 14 57% 43% 25 68% 32%
Suffolk 89 83% 17% 223 64% 36%
Sullivan 3 100% 0% 9 78% 22%
Tioga 3 67% 33% 6 67% 33%
Tompkins 31 71% 29% 29 79% 21%
Ulster 21 81% 19% 36 58% 42%
Warren 4 75% 25% 1 100% 0%
Washington 22 91% 9% 7 86% 14%
Wayne 2 50% 50% 16 69% 31%
Westchester 56 79% 21% 160 89% 11%
Wyoming 13 54% 46% 6 100% 0%
Yates 1 100% 0% 9 78% 22%
Non-NYC Total 933 69% 31% 1,924 76% 24%
Bronx 4 100% 0% 542 76% 24%
Kings 15 80% 20% 473 78% 22%
New York 2 100% 0% 298 73% 27%
Queens 0 0% 0% 488 69% 31%
Richmond 0 0% 0% 151 71% 29%
NYC Total 21 86% 14% 1,952 75% 25%
Statewide Total 954 69% 31% 3,876 73% 27%
Source: PWS 2/2013
2011 Juvenile Probation Supervision Cases Closed
RFA Table #4

2010 JD/JO PINS*
# % # % # %
New York State 8,411 79.0% 2,242 21.0% 10,653 100.0% 216,007 51,165
New York City 5,084 93.4% 357 6.6% 5,441 100.0% 154,928 23,310
Rest of State 3,327 63.8% 1,885 36.2% 5,212 100.0% 61,079 27,855
ALBANY 257 64.4% 142 35.6% 399 100.0% 4,804 2,410
ALLEGANY 4 100.0% - 0.0% 4 100.0% 42 .
BROOME 64 63.4% 37 36.6% 101 100.0% 3,855 1,521
CATTARAUGUS 27 81.8% 6 18.2% 33 100.0% 624 101
CAYUGA 16 84.2% 3 15.8% 19 100.0% 229 55
CHAUTAUQUA 16 100.0% - 0.0% 16 100.0% 314 .
CHEMUNG 52 68.4% 24 31.6% 76 100.0% 640 243
CHENANGO 1 100.0% - 0.0% 1 100.0% 45 .
CLINTON 1 33.3% 2 66.7% 3 100.0% 91 39
COLUMBIA 12 40.0% 18 60.0% 30 100.0% 192 101
CORTLAND 2 11.8% 15 88.2% 17 100.0% 70 485
DELAWARE - 0.0% 1 100.0% 1 100.0% . 7
DUTCHESS 112 65.1% 60 34.9% 172 100.0% 4,085 1,228
ERIE 490 59.5% 333 40.5% 823 100.0% 8,692 4,309
ESSEX 1 100.0% - 0.0% 1 100.0% 2 .
FRANKLIN 1 100.0% - 0.0% 1 100.0% 119 .
FULTON 2 50.0% 2 50.0% 4 100.0% 30 21
GENESEE 6 75.0% 2 25.0% 8 100.0% 60 25
GREENE 3 27.3% 8 72.7% 11 100.0% 31 116
HAMILTON - - - - - - . .
HERKIMER 7 24.1% 22 75.9% 29 100.0% 132 502
JEFFERSON 22 95.7% 1 4.3% 23 100.0% 420 13
LEWIS 4 80.0% 1 20.0% 5 100.0% 79 13
LIVINGSTON 5 83.3% 1 16.7% 6 100.0% 68 7
MADISON 2 18.2% 9 81.8% 11 100.0% 73 133
MONROE 644 59.4% 441 40.6% 1,085 100.0% 8,501 5,958
MONTGOMERY 14 63.6% 8 36.4% 22 100.0% 260 68
NASSAU 361 90.7% 37 9.3% 398 100.0% 3,137 415
NIAGARA 37 62.7% 22 37.3% 59 100.0% 743 385
ONEIDA 101 44.5% 126 55.5% 227 100.0% 2,420 2,028
ONONDAGA 136 82.4% 29 17.6% 165 100.0% 3,765 279
ONTARIO 36 72.0% 14 28.0% 50 100.0% 646 194
ORANGE 77 63.6% 44 36.4% 121 100.0% 3,072 663
ORLEANS 4 100.0% - 0.0% 4 100.0% 17 .
OSWEGO 10 66.7% 5 33.3% 15 100.0% 118 50
OTSEGO 4 50.0% 4 50.0% 8 100.0% 60 66
PUTNAM 2 28.6% 5 71.4% 7 100.0% 37 68
RENSSELAER 46 51.7% 43 48.3% 89 100.0% 719 574
ROCKLAND 30 73.2% 11 26.8% 41 100.0% 359 87
ST. LAWRENCE 14 66.7% 7 33.3% 21 100.0% 203 72
SARATOGA 31 75.6% 10 24.4% 41 100.0% 265 127
SCHENECTADY 124 60.5% 81 39.5% 205 100.0% 1,904 1,082
SCHOHARIE 1 14.3% 6 85.7% 7 100.0% 2 118
SCHUYLER - 0.0% 5 100.0% 5 100.0% 38 27
SENECA 9 90.0% 1 10.0% 10 100.0% 160 7
STEUBEN 39 72.2% 15 27.8% 54 100.0% 806 215
SUFFOLK 192 73.3% 70 26.7% 262 100.0% 2,309 786
SULLIVAN 9 56.3% 7 43.8% 16 100.0% 162 57
TIOGA 1 50.0% 1 50.0% 2 100.0% 13 8
TOMPKINS 20 62.5% 12 37.5% 32 100.0% 358 102
ULSTER 12 66.7% 6 33.3% 18 100.0% 205 48
WARREN 15 75.0% 5 25.0% 20 100.0% 130 66
WASHINGTON 9 90.0% 1 10.0% 10 100.0% 17 3
WAYNE 21 72.4% 8 27.6% 29 100.0% 507 130
WESTCHESTER 218 56.2% 170 43.8% 388 100.0% 5,438 2,808
WYOMING 2 40.0% 3 60.0% 5 100.0% 4 14
YATES 1 50.0% 1 50.0% 2 100.0% 7 21
*PINS care days for NYC is based on estimates from claims for payment submitted to OCFS.
Prepared by OCFS Bureau of Research, Evaluation and Performance Analytics
Care Days
Note: Admissions are based on ontinuous detention stays of youth and a youth could have been in detention multiple times
during the calendar year.
Detention Admissions and Care Days in 2010:
Juvenile Delinquents/Offenders (JD/JO) vs. Persons in Need of Supervision (PINS) Distribution in County
RFA Table #5
JD/JO PINS Total
2/11/13

2011 JD/JO PINS*
# % # % # %
New York State 7,755 79.6% 1,983 20.4% 9,738 100.0% 174,103 46,138
New York City 4,767 94.9% 258 5.1% 5,025 100.0% 120,143 22,374
Rest of State 2,988 63.4% 1,725 36.6% 4,713 100.0% 53,960 23,764
ALBANY 201 65.0% 108 35.0% 309 100.0% 3,447 1,292
ALLEGANY 1 33.3% 2 66.7% 3 100.0% 5 30
BROOME 53 66.3% 27 33.8% 80 100.0% 2,698 936
CATTARAUGUS 30 68.2% 14 31.8% 44 100.0% 1,124 321
CAYUGA 16 80.0% 4 20.0% 20 100.0% 308 49
CHAUTAUQUA 17 89.5% 2 10.5% 19 100.0% 236 6
CHEMUNG 87 70.2% 37 29.8% 124 100.0% 1,306 250
CHENANGO 7 87.5% 1 12.5% 8 100.0% 187 16
CLINTON 1 50.0% 1 50.0% 2 100.0% 2 3
COLUMBIA 4 44.4% 5 55.6% 9 100.0% 57 46
CORTLAND 4 20.0% 16 80.0% 20 100.0% 54 335
DELAWARE - - - - - - . .
DUTCHESS 101 68.2% 47 31.8% 148 100.0% 3,947 702
ERIE 573 62.6% 342 37.4% 915 100.0% 9,362 4,602
ESSEX 1 100.0% - 0.0% 1 100.0% 3 .
FRANKLIN 2 100.0% - 0.0% 2 100.0% 269 .
FULTON 4 80.0% 1 20.0% 5 100.0% 33 1
GENESEE 3 37.5% 5 62.5% 8 100.0% 16 24
GREENE 5 27.8% 13 72.2% 18 100.0% 28 159
HAMILTON - - - - - - . .
HERKIMER 6 26.1% 17 73.9% 23 100.0% 95 195
JEFFERSON 17 100.0% - 0.0% 17 100.0% 227 .
LEWIS 2 50.0% 2 50.0% 4 100.0% 16 55
LIVINGSTON 11 78.6% 3 21.4% 14 100.0% 204 7
MADISON 3 33.3% 6 66.7% 9 100.0% 11 113
MONROE 485 56.6% 372 43.4% 857 100.0% 7,198 4,213
MONTGOMERY 9 81.8% 2 18.2% 11 100.0% 144 21
NASSAU 289 90.9% 29 9.1% 318 100.0% 3,373 444
NIAGARA 38 66.7% 19 33.3% 57 100.0% 990 298
ONEIDA 69 41.8% 96 58.2% 165 100.0% 1,326 1,330
ONONDAGA 98 76.6% 30 23.4% 128 100.0% 2,857 551
ONTARIO 24 72.7% 9 27.3% 33 100.0% 473 122
ORANGE 81 64.8% 44 35.2% 125 100.0% 1,489 736
ORLEANS 4 100.0% - 0.0% 4 100.0% 109 .
OSWEGO 11 73.3% 4 26.7% 15 100.0% 215 36
OTSEGO - 0.0% 2 100.0% 2 100.0% . 14
PUTNAM 4 66.7% 2 33.3% 6 100.0% 14 35
RENSSELAER 34 47.9% 37 52.1% 71 100.0% 433 632
ROCKLAND 20 57.1% 15 42.9% 35 100.0% 317 200
ST. LAWRENCE 6 54.5% 5 45.5% 11 100.0% 108 36
SARATOGA 18 60.0% 12 40.0% 30 100.0% 190 169
SCHENECTADY 96 68.1% 45 31.9% 141 100.0% 1,798 504
SCHOHARIE 3 50.0% 3 50.0% 6 100.0% 33 80
SCHUYLER 9 90.0% 1 10.0% 10 100.0% 69 4
SENECA 10 62.5% 6 37.5% 16 100.0% 139 105
STEUBEN 29 69.0% 13 31.0% 42 100.0% 652 204
SUFFOLK 162 67.5% 78 32.5% 240 100.0% 2,090 943
SULLIVAN 12 63.2% 7 36.8% 19 100.0% 431 83
TIOGA 2 28.6% 5 71.4% 7 100.0% 56 132
TOMPKINS 22 50.0% 22 50.0% 44 100.0% 147 151
ULSTER 15 68.2% 7 31.8% 22 100.0% 107 91
WARREN 5 55.6% 4 44.4% 9 100.0% 21 22
WASHINGTON 2 40.0% 3 60.0% 5 100.0% 15 19
WAYNE 32 78.0% 9 22.0% 41 100.0% 688 123
WESTCHESTER 245 57.0% 185 43.0% 430 100.0% 4,723 3,278
WYOMING 3 33.3% 6 66.7% 9 100.0% 14 46
YATES 2 100.0% - 0.0% 2 100.0% 106 .
*PINS care days for NYC is based on estimates from claims for payment submitted to OCFS.
Prepared by OCFS Bureau of Research, Evaluation and Performance Analytics
Care Days
Note: Admissions are based on ontinuous detention stays of youth and a youth could have been in detention multiple times
during the calendar year.
Detention Admissions and Care Days in 2011:
Juvenile Delinquents/Offenders (JD/JO) vs. Persons in Need of Supervision (PINS) Distribution in County
RFA Table #6
JD/JO PINS Total

Total Total
# % # % # % # # % # % # % #
ALBANY 41 91.1% 2 4.4% 2 4.4% 45 24 85.7% 4 14.3% - 0.0% 28
ALLEGANY 1 100.0% - 0.0% - 0.0% 1 1 100.0% - 0.0% - 0.0% 1
BROOME 18 85.7% 3 14.3% - 0.0% 21 18 85.7% 3 14.3% - 0.0% 21
CATTARAUGUS 5 71.4% 2 28.6% - 0.0% 7 3 60.0% 2 40.0% - 0.0% 5
CAYUGA 6 66.7% 3 33.3% - 0.0% 9 6 85.7% 1 14.3% - 0.0% 7
CHAUTAUQUA 6 60.0% 3 30.0% 1 10.0% 10 4 66.7% 1 16.7% 1 16.7% 6
CHEMUNG 6 85.7% - 0.0% 1 14.3% 7 19 95.0% - 0.0% 1 5.0% 20
CHENANGO 1 100.0% - 0.0% - 0.0% 1 3 100.0% - 0.0% - 0.0% 3
CLINTON 4 80.0% 1 20.0% - 0.0% 5 2 100.0% - 0.0% - 0.0% 2
COLUMBIA 4 80.0% 1 20.0% - 0.0% 5 1 50.0% 1 50.0% - 0.0% 2
CORTLAND 1 50.0% 1 50.0% - 0.0% 2 1 50.0% 1 50.0% - 0.0% 2
DELAWARE 0 0 0 2 100.0% - 0.0% - 0.0% 2
DUTCHESS 19 67.9% 9 32.1% - 0.0% 28 17 54.8% 14 45.2% - 0.0% 31
ERIE 48 92.3% 4 7.7% - 0.0% 52 43 87.8% 6 12.2% - 0.0% 49
ESSEX 12 92.3% 1 7.7% - 0.0% 13 1 100.0% - 0.0% - 0.0% 1
FRANKLIN 1 100.0% - 0.0% - 0.0% 1 6 75.0% - 0.0% 2 25.0% 8
FULTON 0 0 0 1 100.0% - 0.0% - 0.0% 1
GENESEE 7 77.8% 2 22.2% - 0.0% 9 7 100.0% - 0.0% - 0.0% 7
GREENE 1 50.0% 1 50.0% - 0.0% 2 2 100.0% - 0.0% - 0.0% 2
HAMILTON 0 0 0 0 0 0
HERKIMER 1 50.0% 1 50.0% - 0.0% 2 0 0 0
JEFFERSON 6 46.2% 4 30.8% 3 23.1% 13 0 0 0
LEWIS 2 100.0% - 0.0% - 0.0% 2 - 0.0% 1 100.0% - 0.0% 1
LIVINGSTON 0 0 0 1 100.0% - 0.0% - 0.0% 1
MADISON 1 100.0% - 0.0% - 0.0% 1 0 0 0
MONROE 13 24.1% 15 27.8% 26 48.1% 54 11 19.3% 14 24.6% 32 56.1% 57
MONTGOMERY 4 80.0% - 0.0% 1 20.0% 5 2 66.7% - 0.0% 1 33.3% 3
NASSAU 62 50.4% 8 6.5% 53 43.1% 123 60 51.7% 7 6.0% 49 42.2% 116
NIAGARA 4 19.0% 11 52.4% 6 28.6% 21 - 0.0% 5 83.3% 1 16.7% 6
ONEIDA - 0.0% 21 100.0% - 0.0% 21 3 18.8% 13 81.3% - 0.0% 16
ONONDAGA 13 59.1% 1 4.5% 8 36.4% 22 15 83.3% 2 11.1% 1 5.6% 18
ONTARIO 3 100.0% - 0.0% - 0.0% 3 7 87.5% - 0.0% 1 12.5% 8
ORANGE - 0.0% 14 93.3% 1 6.7% 15 - 0.0% 5 100.0% - 0.0% 5
ORLEANS 1 100.0% - 0.0% - 0.0% 1 1 100.0% - 0.0% - 0.0% 1
OSWEGO 4 100.0% - 0.0% - 0.0% 4 3 75.0% 1 25.0% - 0.0% 4
OTSEGO 1 100.0% - 0.0% - 0.0% 1 0 0 0
PUTNAM 0 0 0 1 100.0% - 0.0% - 0.0% 1
RENSSELAER 3 75.0% 1 25.0% - 0.0% 4 0 0 0
ROCKLAND 12 92.3% - 0.0% 1 7.7% 13 9 90.0% 1 10.0% - 0.0% 10
ST LAWRENCE 5 55.6% 3 33.3% 1 11.1% 9 6 75.0% 2 25.0% - 0.0% 8
SARATOGA 16 94.1% 1 5.9% - 0.0% 17 6 66.7% 3 33.3% - 0.0% 9
SCHENECTADY 5 83.3% 1 16.7% - 0.0% 6 9 75.0% 3 25.0% - 0.0% 12
SCHOHARIE 0 0 0 0 0 0
SCHUYLER 0 0 0 0 0 0
SENECA 1 20.0% 2 40.0% 2 40.0% 5 - 0.0% 2 33.3% 4 66.7% 6
STEUBEN 12 92.3% 1 7.7% - 0.0% 13 10 76.9% 2 15.4% 1 7.7% 13
SUFFOLK 18 13.6% 12 9.1% 102 77.3% 132 18 20.7% 6 6.9% 63 72.4% 87
SULLIVAN 0 0 0 - 0.0% 2 100.0% - 0.0% 2
TIOGA 2 100.0% - 0.0% - 0.0% 2 1 100.0% - 0.0% - 0.0% 1
TOMPKINS 3 60.0% 2 40.0% - 0.0% 5 5 100.0% - 0.0% - 0.0% 5
ULSTER 2 66.7% 1 33.3% - 0.0% 3 8 88.9% 1 11.1% - 0.0% 9
WARREN 2 100.0% - 0.0% - 0.0% 2 1 100.0% - 0.0% - 0.0% 1
WASHINGTON 0 0 0 0 0 0
WAYNE 3 33.3% 3 33.3% 3 33.3% 9 6 54.5% 1 9.1% 4 36.4% 11
WESTCHESTER 35 81.4% 4 9.3% 4 9.3% 43 36 66.7% 15 27.8% 3 5.6% 54
WYOMING 0 0 0 0 0 0
YATES 3 100.0% - 0.0% - 0.0% 3 7 100.0% - 0.0% - 0.0% 7
NYC 27 4.2% 135 20.9% 485 75.0% 647 47 8.4% 151 27.1% 360 64.5% 558
Statewide Total 445 31.3% 277 19.5% 700 49.2% 1,422 434 35.3% 272 22.1% 524 42.6% 1,230
Distribution of JDs Admitted to LDSS Custody, OCFS Custody in Voluntaries
and OCFS Custody in OCFS Operated Facilities 2010-2011
RFA Table #7
Prepared by OCFS Bureau of Research, Evaluation and Performance Analytics
2011
Sources: OCFS Juvenile Justice Information Systems (JJIS) database and Children and Youth Services Review (CCRS) database. Number of JDs in LDSS custody is estimated using legal codes in CCRS.
Note: If a youth was in both JJIS (OCFS custody) and CCRS as LDSS Custody, it was assumed that the youth was only in OCFS custody during the year. This impacts a very small number of youth.
2010
LDSS JD OCFS FAC JD OCFS VA JD LDSS JD OCFS FAC JD OCFS VA JD

2010 2011
ALBANY 17 11
ALLEGANY 6 5
BROOME 20 13
CATTARAUGUS 6 3
CAYUGA 5 6
CHAUTAUQUA 1 3
CHEMUNG 1 -
CHENANGO 3 1
CLINTON 3 4
COLUMBIA 6 3
CORTLAND 5 1
DELAWARE -
DUTCHESS 20 8
ERIE 33 22
ESSEX 2 2
FRANKLIN 2 -
FULTON 20 13
GENESEE 2 1
GREENE 13 8
HAMILTON
HERKIMER 11 10
JEFFERSON - -
LEWIS 2 2
LIVINGSTON - -
MADISON 5 4
MONROE 69 58
MONTGOMERY 4 3
NASSAU 32 28
NIAGARA 13 13
ONEIDA - -
ONONDAGA 3 2
ONTARIO 2 1
ORANGE 2 1
ORLEANS -
OSWEGO 3 1
OTSEGO 1 -
PUTNAM 2 1
RENSSELAER 2 1
ROCKLAND 2 4
ST LAWRENCE 10 7
SARATOGA 11 10
SCHENECTADY 11 9
SCHOHARIE 4 3
SCHUYLER 1
SENECA 1
STEUBEN 2 3
SUFFOLK 32 23
SULLIVAN - -
TIOGA 1 3
TOMPKINS 9 6
ULSTER 7 11
WARREN 1
WASHINGTON - 2
WAYNE 1 3
WESTCHESTER 54 64
WYOMING 7 10
YATES - 2
ST REGIS 1
New York City 66 51
New York State 536 441
Rest of State 470 390
LDSS PINS In Care December 31
Note: This is based on legal codes in Child Care Review Service (CCRS) and is
dependent on the accuracy of data entry.
Prepared by OCFS Bureau of Research, Evaluation and Performance
Analytics
Local District of Social Services Custody PINS Youth in Care on
December 31 from 2010 to 2011
RFA Table #8

Total
Average
Daily Census
# Unsentenced
(ADC)
% of
Total ADC
Unsentenced
Rate per
1,000 Arrests*
Albany 622 455 73.2% 51
Allegany 135 44 32.6% 38
Broome 501 340 67.9% 62
Cattaraugus 118 62 52.5% 32
Cayuga 190 92 48.4% 52
Chautauqua 287 171 59.6% 48
Chemung 189 101 53.4% 37
Chenango 84 43 51.2% 37
Clinton 209 91 43.5% 43
Columbia 90 80 88.9% 64
Cortland 68 45 66.2% 30
Delaware 64 36 56.3% 35
Dutchess 446 171 38.3% 30
Erie 1,326 778 58.7% 29
Essex 66 38 57.6% 54
Franklin 114 66 57.9% 45
Fulton 82 73 89.0% 59
Genesee 91 43 47.3% 30
Greene 70 34 48.6% 27
Hamilton 4 2 50.0% 20
Herkimer 70 21 30.0% 16
Jefferson 158 103 65.2% 35
Lewis 28 16 57.1% 41
Livingston 104 66 63.5% 55
Madison 96 43 44.8% 33
Monroe 1,342 774 57.7% 42
Montgomery 131 77 58.8% 65
Nassau 1,416 1,146 80.9% 64
Niagara 451 213 47.2% 39
Oneida 424 253 59.7% 42
Onondaga 1,112 599 53.9% 52
Ontario 198 105 53.0% 48
Orange 590 284 48.1% 33
Orleans 75 45 60.0% 49
Oswego 187 91 48.7% 29
Otsego 77 50 64.9% 31
Putnam 101 87 86.1% 59
Rensselaer 309 215 69.6% 59
Rockland 240 179 74.6% 44
Saratoga 156 86 55.1% 23
Schenectady 314 216 68.8% 47
Schoharie 26 0 0.0% 0
Schuyler 22 9 40.9% 23
Seneca 77 40 51.9% 47
St Lawrence 156 102 65.4% 38
Steuben 190 99 52.1% 51
Suffolk 1,662 1,024 61.6% 40
Sullivan 156 106 67.9% 45
Tioga 80 31 38.8% 43
Tompkins 90 48 53.3% 27
Ulster 324 216 66.7% 46
Warren 133 90 67.7% 45
Washington 94 70 74.5% 56
Wayne 108 56 51.9% 33
Westchester 1,454 771 53.0% 46
Wyoming 63 37 58.7% 45
Yates 49 24 49.0% 54
Non-NYC 17,020 10,157 59.7% 43
NYC** 11,388 NA NA
Statewide 28,408 NA NA
Unsentenced Local Jail Population: 2012
* Unsentenced inmate per 1,000 county arrests
** NYC DOC Custody as of 12/31/12
RFA Table #9
Pretrial
Initial NY
COMPAS*
Reclassifi-
cations Grand Total
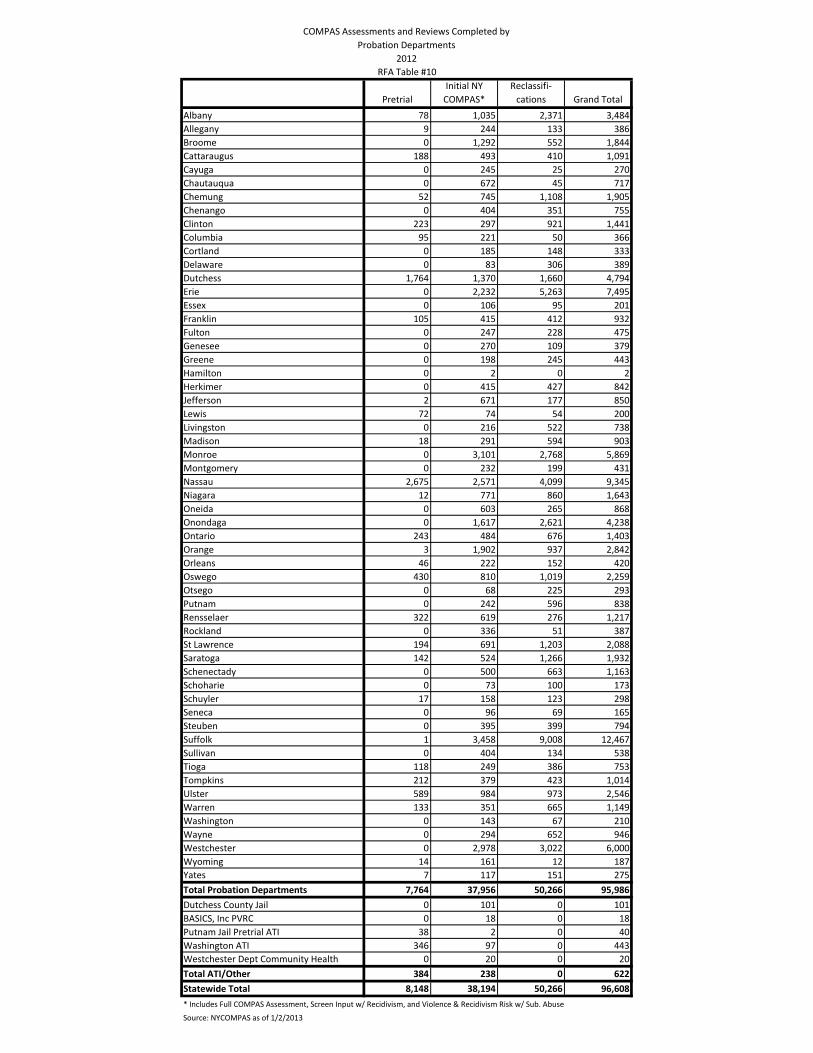
Albany 78 1,035 2,371 3,484
Allegany 9 244 133 386
Broome 0 1,292 552 1,844
Cattaraugus 188 493 410 1,091
Cayuga 0 245 25 270
Chautauqua 0 672 45 717
Chemung 52 745 1,108 1,905
Chenango 0 404 351 755
Clinton 223 297 921 1,441
Columbia 95 221 50 366
Cortland 0 185 148 333
Delaware 0 83 306 389
Dutchess 1,764 1,370 1,660 4,794
Erie 0 2,232 5,263 7,495
Essex 0 106 95 201
Franklin 105 415 412 932
Fulton 0 247 228 475
Genesee 0 270 109 379
Greene 0 198 245 443
Hamilton 0 2 0 2
Herkimer 0 415 427 842
Jefferson 2 671 177 850
Lewis 72 74 54 200
Livingston 0 216 522 738
Madison 18 291 594 903
Monroe 0 3,101 2,768 5,869
Montgomery 0 232 199 431
Nassau 2,675 2,571 4,099 9,345
Niagara 12 771 860 1,643
Oneida 0 603 265 868
Onondaga 0 1,617 2,621 4,238
Ontario 243 484 676 1,403
Orange 3 1,902 937 2,842
Orleans 46 222 152 420
Oswego 430 810 1,019 2,259
Otsego 0 68 225 293
Putnam 0 242 596 838
Rensselaer 322 619 276 1,217
Rockland 0 336 51 387
St Lawrence 194 691 1,203 2,088
Saratoga 142 524 1,266 1,932
Schenectady 0 500 663 1,163
Schoharie 0 73 100 173
Schuyler 17 158 123 298
Seneca 0 96 69 165
Steuben 0 395 399 794
Suffolk 1 3,458 9,008 12,467
Sullivan 0 404 134 538
Tioga 118 249 386 753
Tompkins 212 379 423 1,014
Ulster 589 984 973 2,546
Warren 133 351 665 1,149
Washington 0 143 67 210
Wayne 0 294 652 946
Westchester 0 2,978 3,022 6,000
Wyoming 14 161 12 187
Yates 7 117 151 275
Total Probation Departments 7,764 37,956 50,266 95,986
Dutchess County Jail 0 101 0 101
BASICS, Inc PVRC 0 18 0 18
Putnam Jail Pretrial ATI 38 2 0 40
Washington ATI 346 97 0 443
Westchester Dept Community Health 0 20 0 20
Total ATI/Other 384 238 0 622
Statewide Total 8,148 38,194 50,266 96,608
* Includes Full COMPAS Assessment, Screen Input w/ Recidivism, and Violence & Recidivism Risk w/ Sub. Abuse
Source: NYCOMPAS as of 1/2/2013
COMPAS Assessments and Reviews Completed by
Probation Departments
2012
RFA Table #10

Sentenced
Misdemeanors
Sentenced
Felonies
Interim
Supervision Other Total
ALBANY 561 302 5 11 879
ALLEGANY 97 49 6 0 152
BROOME 422 314 80 11 827
CATTARAUGUS 140 108 15 5 268
CAYUGA 115 54 0 1 170
CHAUTAUQUA 205 91 340 2 638
CHEMUNG 195 124 2 6 327
CHENANGO 101 65 13 1 180
CLINTON 198 111 10 2 321
COLUMBIA 86 26 0 2 114
CORTLAND 140 54 0 9 203
DELAWARE 67 24 0 4 95
DUTCHESS 543 177 112 6 838
ERIE 732 662 8 32 1,434
ESSEX 74 36 3 0 113
FRANKLIN 122 80 3 2 207
FULTON 84 32 2 2 120
GENESEE 120 58 10 2 190
GREENE 146 52 0 5 203
HAMILTON 11 2 0 0 13
HERKIMER 66 57 9 2 134
JEFFERSON 247 153 1 5 406
LEWIS 44 19 1 1 65
LIVINGSTON 100 74 1 0 175
MADISON 109 43 19 2 173
MONROE 1,473 581 114 15 2,183
MONTGOMERY 49 55 17 0 121
NASSAU 1,338 382 8 44 1,772
NIAGARA 276 108 102 6 492
ONEIDA 350 192 0 10 552
ONONDAGA 1,177 439 24 7 1,647
ONTARIO 225 142 79 2 448
ORANGE 402 268 56 29 755
ORLEANS 79 26 0 0 105
OSWEGO 310 104 3 4 421
OTSEGO 46 22 2 4 74
PUTNAM 118 53 4 2 177
RENSSELAER 263 87 1 9 360
ROCKLAND 167 202 0 23 392
ST LAWRENCE 119 142 48 4 313
SARATOGA 290 136 12 6 444
SCHENECTADY 286 158 4 7 455
SCHOHARIE 58 20 4 0 82
SCHUYLER 31 18 0 1 50
SENECA 54 39 2 0 95
STEUBEN 123 137 19 0 279
SUFFOLK 2,499 862 1,224 48 4,633
SULLIVAN 142 91 11 9 253
TIOGA 67 50 3 7 127
TOMPKINS 158 65 26 4 253
ULSTER 262 95 125 7 489
WARREN 155 75 59 0 289
WASHINGTON 150 35 0 5 190
WAYNE 114 108 20 5 247
WESTCHESTER 1,253 487 100 56 1,896
WYOMING 72 44 82 1 199
YATES 44 21 8 3 76
UNKNOWN 0 0 0 0 0
Non-NYC Total 16,875 8,011 2,797 431 28,114
BRONX 724 859 87 120 1,790
KINGS 571 752 86 218 1,627
NEW YORK 408 764 61 336 1,569
QUEENS 705 622 63 93 1,483
RICHMOND 153 170 25 25 373
NYC Total 2,561 3,167 322 792 6,842
Statewide Total 19,436 11,178 3,119 1,223 34,956
Source: NYS OPCA IPRS 2/4/2013
New Probationers Received: 2012
RFA Table #11

Total 2012
Adult Arrests
Total Arrests of
Probationers
Probation Arrests
as % of Total
Arrests
Total Felony
Arrests
Felony Arrests of
Probationers
Probation Arrests
as % of Felony
Arrests
Total
Misdemeanor
Arrests
Misdemeanor
Arrests of
Probationers
Probation Arrests
as % of Misd
Arrests
Albany 8,895 602 6.8% 2,763 270 9.8% 6,132 332 5.4%
Allegany 1,156 75 6.5% 363 33 9.1% 793 42 5.3%
Bronx 78,637 3,276 4.2% 19,246 1,061 5.5% 59,391 2,215 3.7%
Broome 5,445 463 8.5% 1,659 152 9.2% 3,786 311 8.2%
Cattaraugus 1,944 157 8.1% 532 47 8.8% 1,412 110 7.8%
Cayuga 1,772 139 7.8% 560 53 9.5% 1,212 86 7.1%
Chautauqua 3,589 265 7.4% 948 83 8.8% 2,641 182 6.9%
Chemung 2,721 180 6.6% 584 47 8.0% 2,137 133 6.2%
Chenango 1,166 83 7.1% 264 22 8.3% 902 61 6.8%
Clinton 2,110 177 8.4% 653 68 10.4% 1,457 109 7.5%
Columbia 1,243 96 7.7% 358 32 8.9% 885 64 7.2%
Cortland 1,517 142 9.4% 398 57 14.3% 1,119 85 7.6%
Delaware 1,027 36 3.5% 261 20 7.7% 766 16 2.1%
Dutchess 5,632 398 7.1% 1,559 175 11.2% 4,073 223 5.5%
Erie 27,246 1,269 4.7% 8,053 513 6.4% 19,193 756 3.9%
Essex 699 60 8.6% 222 23 10.4% 477 37 7.8%
Franklin 1,455 118 8.1% 432 32 7.4% 1,023 86 8.4%
Fulton 1,240 53 4.3% 357 14 3.9% 883 39 4.4%
Genesee 1,416 105 7.4% 382 34 8.9% 1,034 71 6.9%
Greene 1,273 100 7.9% 381 38 10.0% 892 62 7.0%
Hamilton 102 0 0.0% 32 0 0.0% 70 0 0.0%
Herkimer 1,310 87 6.6% 334 29 8.7% 976 58 5.9%
Jefferson 2,944 268 9.1% 746 90 12.1% 2,198 178 8.1%
Kings 92,371 2,751 3.0% 27,584 1,022 3.7% 64,787 1,729 2.7%
Lewis 394 36 9.1% 102 12 11.8% 292 24 8.2%
Livingston 1,205 85 7.1% 328 40 12.2% 877 45 5.1%
Madison 1,316 60 4.6% 262 16 6.1% 1,054 44 4.2%
Monroe 18,334 1,516 8.3% 4,925 537 10.9% 13,409 979 7.3%
Montgomery 1,177 67 5.7% 338 21 6.2% 839 46 5.5%
Nassau 17,815 992 5.6% 5,869 471 8.0% 11,946 521 4.4%
New York 85,478 2,563 3.0% 19,811 869 4.4% 65,667 1,694 2.6%
Niagara 5,474 306 5.6% 1,567 112 7.1% 3,907 194 5.0%
Oneida 5,997 316 5.3% 1,376 93 6.8% 4,621 223 4.8%
Onondaga 11,490 893 7.8% 3,995 376 9.4% 7,495 517 6.9%
Ontario 2,198 176 8.0% 631 80 12.7% 1,567 96 6.1%
Orange 8,630 487 5.6% 2,210 156 7.1% 6,420 331 5.2%
Orleans 915 57 6.2% 283 19 6.7% 632 38 6.0%
Oswego 3,173 225 7.1% 993 72 7.3% 2,180 153 7.0%
Otsego 1,624 47 2.9% 429 21 4.9% 1,195 26 2.2%
Putnam 1,475 71 4.8% 370 28 7.6% 1,105 43 3.9%
Queens 56,910 1,796 3.2% 17,939 746 4.2% 38,971 1,050 2.7%
Rensselaer 3,620 297 8.2% 1,232 130 10.6% 2,388 167 7.0%
Richmond 11,423 457 4.0% 3,400 166 4.9% 8,023 291 3.6%
Rockland 4,084 223 5.5% 1,307 96 7.3% 2,777 127 4.6%
St. Lawrence 2,679 173 6.5% 713 58 8.1% 1,966 115 5.8%
Saratoga 3,673 247 6.7% 964 86 8.9% 2,709 161 5.9%
Schenectady 4,579 350 7.6% 1,391 129 9.3% 3,188 221 6.9%
Schoharie 552 34 6.2% 148 11 7.4% 404 23 5.7%
Schuyler 392 31 7.9% 75 3 4.0% 317 28 8.8%
Seneca 850 72 8.5% 274 21 7.7% 576 51 8.9%
Steuben 1,926 171 8.9% 651 69 10.6% 1,275 102 8.0%
Suffolk 25,657 1,701 6.6% 5,999 548 9.1% 19,658 1,153 5.9%
Sullivan 2,333 118 5.1% 686 40 5.8% 1,647 78 4.7%
Tioga 713 40 5.6% 175 17 9.7% 538 23 4.3%
Tompkins 1,760 142 8.1% 386 39 10.1% 1,374 103 7.5%
Ulster 4,656 266 5.7% 1,190 93 7.8% 3,466 173 5.0%
Warren 1,989 130 6.5% 506 46 9.1% 1,483 84 5.7%
Washington 1,250 92 7.4% 357 30 8.4% 893 62 6.9%
Wayne 1,684 134 8.0% 492 54 11.0% 1,192 80 6.7%
Westchester 16,877 1,161 6.9% 5,066 468 9.2% 11,811 693 5.9%
Wyoming 826 57 6.9% 271 24 8.9% 555 33 5.9%
Yates 444 47 10.6% 124 15 12.1% 320 32 10.0%
Non-NYC Totals 237,663 15,693 6.6% 67,526 5,863 8.7% 170,137 9,830 5.8%
NYC Totals 324,819 10,843 3.3% 87,980 3,864 4.4% 236,839 6,979 2.9%
Statewide Totals 562,482 26,536 4.7% 155,506 9,727 6.3% 406,976 16,809 4.1%
Data as of January 28, 2013
2012 Probation Arrests and Total Arrests By County
RFA Table #12
County
Total Arrests Felony Arrests Misdemeanors Arrests

New
Conviction
New
Arrest Absconded
Other
Technical
Violation
Albany 3,611 24 187 70 151 432 12.0%
Allegany 582 1 20 0 23 44 7.6%
Broome 2,449 6 65 36 56 163 6.7%
Cattaraugus 948 3 89 15 51 158 16.7%
Cayuga 808 0 30 5 7 42 5.2%
Chautauqua 2,293 6 50 19 32 107 4.7%
Chemung 1,318 5 77 23 117 222 16.8%
Chenango 535 3 27 8 34 72 13.5%
Clinton 1,169 0 31 10 57 98 8.4%
Columbia 638 17 6 5 34 62 9.7%
Cortland 750 2 10 6 13 31 4.1%
Delaware 332 0 10 2 54 66 19.9%
Dutchess 3,195 11 105 43 93 252 7.9%
Erie 6,565 48 468 98 442 1,056 16.1%
Essex 575 5 4 2 55 66 11.5%
Franklin 809 0 1 0 3 4 0.5%
Fulton 477 2 35 5 31 73 15.3%
Genesee 761 15 62 7 74 158 20.8%
Greene 709 0 37 6 50 93 13.1%
Hamilton 36 0 1 0 1 2 5.6%
Herkimer 533 3 42 10 18 73 13.7%
Jefferson 1,527 10 106 33 71 220 14.4%
Lewis 289 1 8 5 13 27 9.3%
Livingston 768 9 42 10 37 98 12.8%
Madison 484 20 0 3 71 94 19.4%
Monroe 8,663 12 795 217 605 1,629 18.8%
Montgomery 553 3 40 10 30 83 15.0%
Nassau 10,020 17 103 29 123 272 2.7%
Niagara 1,953 6 44 19 175 244 12.5%
Oneida 2,409 20 38 12 70 140 5.8%
Onondaga 4,849 15 422 15 236 688 14.2%
Ontario 1,542 6 56 10 71 143 9.3%
Orange 3,808 5 140 44 155 344 9.0%
Orleans 371 2 9 3 35 49 13.2%
Oswego 1,311 6 55 22 120 203 15.5%
Otsego 310 0 14 4 30 48 15.5%
Putnam 737 1 14 1 22 38 5.2%
Rensselaer 1,727 3 27 29 75 134 7.8%
Rockland 1,756 2 17 2 14 35 2.0%
St Lawrence 1,255 4 81 11 100 196 15.6%
Saratoga 1,618 11 65 29 81 186 11.5%
Schenectady 1,646 7 59 11 29 106 6.4%
Schoharie 348 0 28 2 36 66 19.0%
Schuyler 232 3 7 13 9 32 13.8%
Seneca 386 3 22 1 39 65 16.8%
Steuben 1,160 1 63 10 87 161 13.9%
Suffolk 18,044 62 1,039 198 768 2,067 11.5%
Sullivan 1,098 5 33 17 95 150 13.7%
Tioga 527 9 21 4 58 92 17.5%
Tompkins 925 0 33 33 72 138 14.9%
Ulster 1,823 4 124 14 80 222 12.2%
Warren 888 1 39 20 58 118 13.3%
Washington 854 3 2 1 16 22 2.6%
Wayne 1,063 2 38 10 51 101 9.5%
Westchester 9,027 110 740 133 1 984 10.9%
Wyoming 542 1 29 5 31 66 12.2%
Yates 330 21 2 1 23 47 14.2%
Non-NYC Total 113,936 536 5,712 1,351 4,983 12,582 11.0%
Bronx 12,132 31 179 61 65 336 2.8%
Kings 12,615 93 264 65 75 497 3.9%
New York 11,606 38 120 35 71 264 2.3%
Queens 10,292 63 158 46 86 353 3.4%
Richmond 2,010 9 31 11 18 69 3.4%
NYC Total 48,655 234 752 218 315 1,519 3.1%
Statewide Total 162,591 770 6,464 1,569 5,298 14,101 8.7%
Includes all interim and standard probation cases that were setenced, discharged, or open in 2012
Source: NYS OPCA IPRS as of 2/4/2013
Violations of Probation Filed: 2012
RFA Table #13
Total Probation
Cases*
Most Serious Reason for Violation
Total Cases with
Violations Filed
% of Cases with
Violations FiledCounty

N
% of Total
Re-Sentenced N
% of Total
Re-Sentenced N
% of Total
Re-Sentenced
Albany 133 71.1% 26 13.9% 28 15.0% 187 3,589 5.2%Allegany 16 64.0% 7 28.0% 2 8.0% 25 552 4.5%Broome 112 73.2% 23 15.0% 18 11.8% 153 2,286 6.7%Cattaraugus 49 62.8% 18 23.1% 11 14.1% 78 872 8.9%Cayuga 35 43.2% 30 37.0% 16 19.8% 81 806 10.0%Chautauqua 79 56.0% 17 12.1% 45 31.9% 141 1,408 10.0%Chemung 95 79.2% 9 7.5% 16 13.3% 120 1,308 9.2%Chenango 28 68.3% 7 17.1% 6 14.6% 41 500 8.2%Clinton 58 58.6% 33 33.3% 8 8.1% 99 1,137 8.7%Columbia 16 61.5% 5 19.2% 5 19.2% 26 635 4.1%Cortland 17 53.1% 12 37.5% 3 9.4% 32 746 4.3%Delaware 7 46.7% 7 46.7% 1 6.7% 15 329 4.6%Dutchess 81 54.7% 49 33.1% 18 12.2% 148 2,925 5.1%Erie 447 72.8% 71 11.6% 96 15.6% 614 6,536 9.4%Essex 9 56.3% 7 43.8% 0 0.0% 16 552 2.9%Franklin 14 43.8% 14 43.8% 4 12.5% 32 794 4.0%Fulton 28 62.2% 5 11.1% 12 26.7% 45 470 9.6%Genesee 50 65.8% 19 25.0% 7 9.2% 76 720 10.6%Greene 13 46.4% 11 39.3% 4 14.3% 28 707 4.0%Hamilton 0 NA 0 NA 0 NA 0 35 0.0%Herkimer 12 35.3% 18 52.9% 4 11.8% 34 517 6.6%Jefferson 83 55.3% 28 18.7% 39 26.0% 150 1,520 9.9%Lewis 7 63.6% 3 27.3% 1 9.1% 11 276 4.0%Livingston 12 21.1% 24 42.1% 21 36.8% 57 757 7.5%Madison 28 68.3% 9 22.0% 4 9.8% 41 443 9.3%Monroe 626 78.0% 48 6.0% 129 16.1% 803 8,339 9.6%Montgomery 14 51.9% 11 40.7% 2 7.4% 27 469 5.8%Nassau 296 76.1% 29 7.5% 64 16.5% 389 9,983 3.9%Niagara 57 69.5% 18 22.0% 7 8.5% 82 1,732 4.7%Oneida 94 57.7% 46 28.2% 23 14.1% 163 2,407 6.8%Onondaga 425 81.1% 42 8.0% 57 10.9% 524 4,796 10.9%Ontario 75 64.7% 23 19.8% 18 15.5% 116 1,355 8.6%Orange 102 66.7% 33 21.6% 18 11.8% 153 3,607 4.2%Orleans 12 57.1% 8 38.1% 1 4.8% 21 371 5.7%Oswego 78 67.2% 29 25.0% 9 7.8% 116 1,306 8.9%Otsego 14 48.3% 8 27.6% 7 24.1% 29 297 9.8%Putnam 0 NA 0 NA 0 NA 0 729 0.0%Rensselaer 63 65.6% 18 18.8% 15 15.6% 96 1,700 5.6%Rockland 59 76.6% 8 10.4% 10 13.0% 77 1,741 4.4%St. Lawrence 39 45.3% 38 44.2% 9 10.5% 86 1,049 8.2%Saratoga 55 63.2% 19 21.8% 13 14.9% 87 1,551 5.6%Schenectady 23 39.0% 4 6.8% 32 54.2% 59 1,632 3.6%Schoharie 0 0.0% 6 75.0% 2 25.0% 8 337 2.4%Schuyler 5 50.0% 4 40.0% 1 10.0% 10 231 4.3%Seneca 30 76.9% 4 10.3% 5 12.8% 39 381 10.2%Steuben 24 40.0% 27 45.0% 9 15.0% 60 1,114 5.4%Suffolk 919 82.8% 31 2.8% 160 14.4% 1,110 15,192 7.3%Sullivan 16 43.2% 18 48.6% 3 8.1% 37 1,073 3.4%Tioga 35 71.4% 9 18.4% 5 10.2% 49 512 9.6%Tompkins 60 75.0% 11 13.8% 9 11.3% 80 837 9.6%Ulster 41 66.1% 17 27.4% 4 6.5% 62 1,453 4.3%Warren 12 36.4% 11 33.3% 10 30.3% 33 743 4.4%Washington 7 16.7% 28 66.7% 7 16.7% 42 843 5.0%Wayne 42 54.5% 12 15.6% 23 29.9% 77 1,002 7.7%Westchester 430 79.6% 22 4.1% 88 16.3% 540 8,558 6.3%Wyoming 10 58.8% 6 35.3% 1 5.9% 17 357 4.8%Yates 0 0.0% 8 61.5% 5 38.5% 13 311 4.2%
Non-NYC Total 5,092 70.2% 1,048 14.4% 1,115 15.4% 7,255 106,428 6.8%Bronx 168 87.0% 14 7.3% 11 5.7% 193 11,702 1.6%Kings 227 73.2% 54 17.4% 29 9.4% 310 12,256 2.5%New York 305 84.3% 43 11.9% 14 3.9% 362 11,110 3.3%Queens 200 61.3% 111 34.0% 15 4.6% 326 10,087 3.2%Richmond 63 85.1% 6 8.1% 5 6.8% 74 1,915 3.9%
NYC Total 963 76.1% 228 18.0% 74 5.8% 1,265 47,070 2.7%
Statewide Toal 6,055 71.1% 1,276 15.0% 1,189 14.0% 8,520 153,498 5.6%
*Includes standard probation cases that were setenced, discharged, or open in 2012
Probationers Re-Sentenced for a Violation of Probation: 2012
RFA Table #14
Source: DCJS, Computerized Criminal History system (1/2013) and IPRS (2/2013).
Jail Prison Other
Total Offenders
Re-Sentenced
Total
Probationers*Re-Sentence
Rate

Number
Closed
% of Total
Closed
Number
Closed
% of Total
Closed
Number
Positive
% of Total
Closed
Number
Negative
% of Total
Closed
Albany 850 100 12% 387 46% 487 57% 363 43%
Allegany 173 86 50% 37 21% 123 71% 50 29%
Broome 631 218 35% 109 17% 327 52% 304 48%
Cattaraugus 231 67 29% 67 29% 134 58% 97 42%
Cayuga 185 58 31% 34 18% 92 50% 93 50%
Chautauqua 589 141 24% 279 47% 420 71% 169 29%
Chemung 383 71 19% 118 31% 189 49% 194 51%
Chenango 118 12 10% 52 44% 64 54% 54 46%
Clinton 353 61 17% 143 41% 204 58% 149 42%
Columbia 116 13 11% 52 45% 65 56% 51 44%
Cortland 182 40 22% 88 48% 128 70% 54 30%
Delaware 83 13 16% 25 30% 38 46% 45 54%
Dutchess 814 161 20% 352 43% 513 63% 301 37%
Erie 1,777 711 40% 299 17% 1,010 57% 767 43%
Essex 124 19 15% 58 47% 77 62% 47 38%
Franklin 209 54 26% 68 33% 122 58% 87 42%
Fulton 125 14 11% 58 46% 72 58% 53 42%
Genesee 220 16 7% 79 36% 95 43% 125 57%
Greene 178 27 15% 89 50% 116 65% 62 35%
Hamilton 10 4 40% 4 40% 8 80% 2 20%
Herkimer 137 39 28% 44 32% 83 61% 54 39%
Jefferson 432 196 45% 61 14% 257 59% 175 41%
Lewis 70 29 41% 25 36% 54 77% 16 23%
Livingston 187 34 18% 76 41% 110 59% 77 41%
Madison 154 64 42% 21 14% 85 55% 69 45%
Monroe 2,292 610 27% 637 28% 1,247 54% 1,045 46%
Montgomery 141 52 37% 42 30% 94 67% 47 33%
Nassau 2,136 566 26% 1,214 57% 1,780 83% 356 17%
Niagara 500 108 22% 198 40% 306 61% 194 39%
Oneida 586 179 31% 235 40% 414 71% 172 29%
Onondaga 1,355 491 36% 256 19% 747 55% 608 45%
Ontario 393 116 30% 94 24% 210 53% 183 47%
Orange 836 88 11% 493 59% 581 69% 255 31%
Orleans 112 22 20% 35 31% 57 51% 55 49%
Oswego 353 123 35% 68 19% 191 54% 162 46%
Otsego 89 16 18% 34 38% 50 56% 39 44%
Putnam 169 23 14% 98 58% 121 72% 48 28%
Rensselaer 411 54 13% 220 54% 274 67% 137 33%
Rockland 395 122 31% 186 47% 308 78% 87 22%
St Lawrence 333 42 13% 135 41% 177 53% 156 47%
Saratoga 505 228 45% 86 17% 314 62% 191 38%
Schenectady 422 117 28% 158 37% 275 65% 147 35%
Schoharie 78 20 26% 26 33% 46 59% 32 41%
Schuyler 67 34 51% 11 16% 45 67% 22 33%
Seneca 116 42 36% 26 22% 68 59% 48 41%
Steuben 298 82 28% 86 29% 168 56% 130 44%
Suffolk 5,025 1,630 32% 1,992 40% 3,622 72% 1,403 28%
Sullivan 281 108 38% 75 27% 183 65% 98 35%
Tioga 165 37 22% 52 32% 89 54% 76 46%
Tompkins 255 64 25% 98 38% 162 64% 93 36%
Ulster 514 153 30% 158 31% 311 61% 203 39%
Warren 284 147 52% 40 14% 187 66% 97 34%
Washington 243 43 18% 115 47% 158 65% 85 35%
Wayne 276 82 30% 89 32% 171 62% 105 38%
Westchester 1,884 227 12% 1,030 55% 1,257 67% 627 33%
Wyoming 153 49 32% 34 22% 83 54% 70 46%
Yates 76 7 9% 29 38% 36 47% 40 53%
Unknown 0 0 0% 0 0% 0 0% 0 0%
Non-NYC Total 29,074 7,930 27% 10,675 37% 18,605 64% 10,469 36%
Bronx 1,734 271 16% 1,153 66% 1,424 82% 310 18%
Kings 2,116 649 31% 1,042 49% 1,691 80% 425 20%
New York 1,162 280 24% 557 48% 837 72% 325 28%
Queens 1,548 176 11% 1,053 68% 1,229 79% 319 21%
Richmond 419 32 8% 299 71% 331 79% 88 21%
NYC Total 6,979 1,408 20% 4,104 59% 5,512 79% 1,467 21%
Statewide Total 36,053 9,338 26% 14,779 41% 24,117 67% 11,936 33%
* Excludes "Death" or "Other" case closings
** Negative Outcome defined as the following closing types: Revoked for technical violation, Revoked due to new conviction,
Early discharge due to new sentence, Referred for further court action, and Resentence to incarceration.
Source: NYS OPCA IPRS as of 2/4/13
Adult Supervision Outcomes: 2012 Closures
RFA Table #15
Positive Outcome
Negative Outcome**
Total Probationer
Outcomes*
Total PositiveMaximum ExpirationEarly Discharge
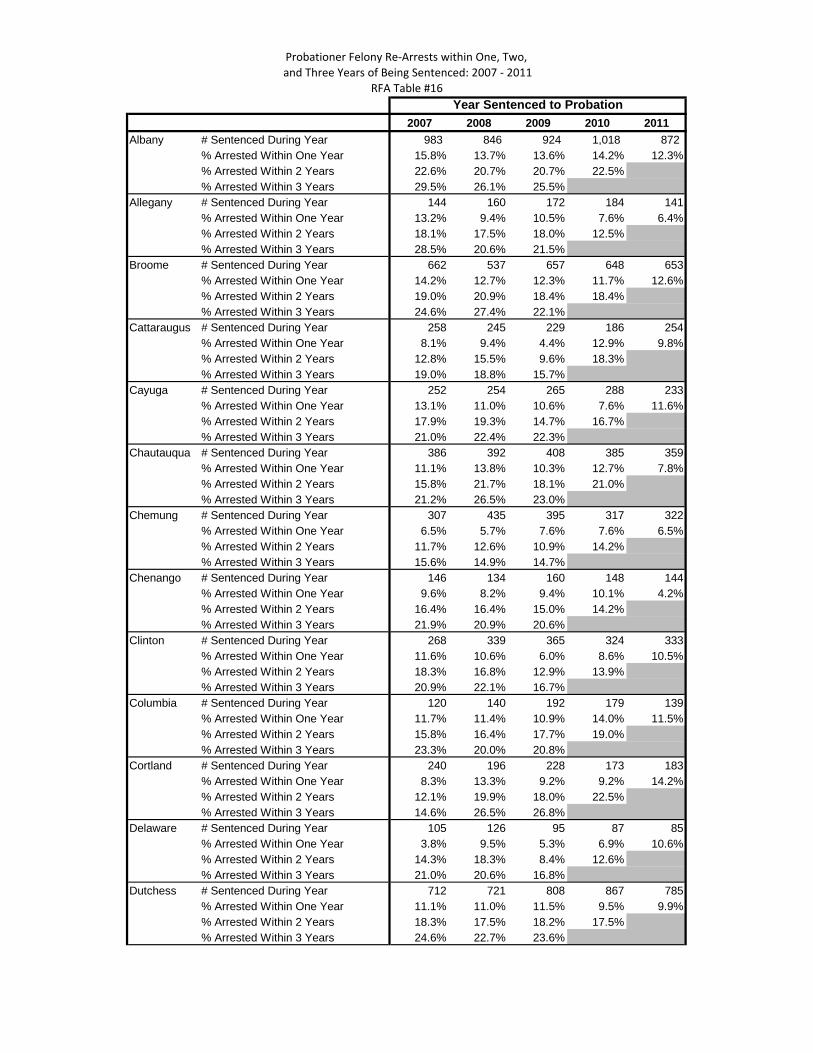
2007 2008 2009 2010 2011
Albany # Sentenced During Year 983 846 924 1,018 872
% Arrested Within One Year 15.8% 13.7% 13.6% 14.2% 12.3%
% Arrested Within 2 Years 22.6% 20.7% 20.7% 22.5%
% Arrested Within 3 Years 29.5% 26.1% 25.5%
Allegany # Sentenced During Year 144 160 172 184 141
% Arrested Within One Year 13.2% 9.4% 10.5% 7.6% 6.4%
% Arrested Within 2 Years 18.1% 17.5% 18.0% 12.5%
% Arrested Within 3 Years 28.5% 20.6% 21.5%
Broome # Sentenced During Year 662 537 657 648 653
% Arrested Within One Year 14.2% 12.7% 12.3% 11.7% 12.6%
% Arrested Within 2 Years 19.0% 20.9% 18.4% 18.4%
% Arrested Within 3 Years 24.6% 27.4% 22.1%
Cattaraugus # Sentenced During Year 258 245 229 186 254
% Arrested Within One Year 8.1% 9.4% 4.4% 12.9% 9.8%
% Arrested Within 2 Years 12.8% 15.5% 9.6% 18.3%
% Arrested Within 3 Years 19.0% 18.8% 15.7%
Cayuga # Sentenced During Year 252 254 265 288 233
% Arrested Within One Year 13.1% 11.0% 10.6% 7.6% 11.6%
% Arrested Within 2 Years 17.9% 19.3% 14.7% 16.7%
% Arrested Within 3 Years 21.0% 22.4% 22.3%
Chautauqua # Sentenced During Year 386 392 408 385 359
% Arrested Within One Year 11.1% 13.8% 10.3% 12.7% 7.8%
% Arrested Within 2 Years 15.8% 21.7% 18.1% 21.0%
% Arrested Within 3 Years 21.2% 26.5% 23.0%
Chemung # Sentenced During Year 307 435 395 317 322
% Arrested Within One Year 6.5% 5.7% 7.6% 7.6% 6.5%
% Arrested Within 2 Years 11.7% 12.6% 10.9% 14.2%
% Arrested Within 3 Years 15.6% 14.9% 14.7%
Chenango # Sentenced During Year 146 134 160 148 144
% Arrested Within One Year 9.6% 8.2% 9.4% 10.1% 4.2%
% Arrested Within 2 Years 16.4% 16.4% 15.0% 14.2%
% Arrested Within 3 Years 21.9% 20.9% 20.6%
Clinton # Sentenced During Year 268 339 365 324 333
% Arrested Within One Year 11.6% 10.6% 6.0% 8.6% 10.5%
% Arrested Within 2 Years 18.3% 16.8% 12.9% 13.9%
% Arrested Within 3 Years 20.9% 22.1% 16.7%
Columbia # Sentenced During Year 120 140 192 179 139
% Arrested Within One Year 11.7% 11.4% 10.9% 14.0% 11.5%
% Arrested Within 2 Years 15.8% 16.4% 17.7% 19.0%
% Arrested Within 3 Years 23.3% 20.0% 20.8%
Cortland # Sentenced During Year 240 196 228 173 183
% Arrested Within One Year 8.3% 13.3% 9.2% 9.2% 14.2%
% Arrested Within 2 Years 12.1% 19.9% 18.0% 22.5%
% Arrested Within 3 Years 14.6% 26.5% 26.8%
Delaware # Sentenced During Year 105 126 95 87 85
% Arrested Within One Year 3.8% 9.5% 5.3% 6.9% 10.6%
% Arrested Within 2 Years 14.3% 18.3% 8.4% 12.6%
% Arrested Within 3 Years 21.0% 20.6% 16.8%
Dutchess # Sentenced During Year 712 721 808 867 785
% Arrested Within One Year 11.1% 11.0% 11.5% 9.5% 9.9%
% Arrested Within 2 Years 18.3% 17.5% 18.2% 17.5%
% Arrested Within 3 Years 24.6% 22.7% 23.6%
Probationer Felony Re-Arrests within One, Two,
RFA Table #16
Year Sentenced to Probation
and Three Years of Being Sentenced: 2007 - 2011

2007 2008 2009 2010 2011
Year Sentenced to Probation
Erie # Sentenced During Year 1,786 1,787 2,015 1,980 1,803
% Arrested Within One Year 13.4% 14.5% 15.2% 12.4% 12.8%
% Arrested Within 2 Years 21.7% 23.7% 23.1% 20.9%
% Arrested Within 3 Years 27.3% 29.1% 29.4%
Essex # Sentenced During Year 153 166 132 146 158
% Arrested Within One Year 4.6% 7.8% 14.4% 8.2% 7.6%
% Arrested Within 2 Years 13.7% 10.8% 18.2% 17.1%
% Arrested Within 3 Years 19.0% 13.3% 22.7%
Franklin # Sentenced During Year 273 299 256 192 218
% Arrested Within One Year 10.6% 13.0% 15.6% 7.8% 11.5%
% Arrested Within 2 Years 17.2% 20.4% 22.7% 13.0%
% Arrested Within 3 Years 22.7% 25.8% 28.1%
Fulton # Sentenced During Year 122 104 136 118 129
% Arrested Within One Year 7.4% 7.7% 11.8% 6.8% 4.7%
% Arrested Within 2 Years 13.9% 10.6% 17.6% 14.4%
% Arrested Within 3 Years 18.9% 15.4% 22.1%
Genesee # Sentenced During Year 176 243 235 185 201
% Arrested Within One Year 9.1% 10.7% 12.3% 10.8% 16.4%
% Arrested Within 2 Years 13.1% 14.8% 18.3% 18.9%
% Arrested Within 3 Years 18.2% 18.5% 23.0%
Greene # Sentenced During Year 160 150 201 181 218
% Arrested Within One Year 14.4% 10.7% 10.4% 13.3% 7.8%
% Arrested Within 2 Years 20.6% 17.3% 14.9% 18.8%
% Arrested Within 3 Years 25.6% 23.3% 17.9%
Hamilton # Sentenced During Year 5 8 4 6 9
% Arrested Within One Year 0.0% 0.0% 0.0% 0.0% 0.0%
% Arrested Within 2 Years 0.0% 0.0% 0.0% 0.0%
% Arrested Within 3 Years 0.0% 0.0% 0.0%
Herkimer # Sentenced During Year 161 177 143 120 149
% Arrested Within One Year 10.6% 7.9% 6.3% 9.2% 11.4%
% Arrested Within 2 Years 15.5% 14.1% 12.6% 14.2%
% Arrested Within 3 Years 19.3% 16.4% 15.4%
Jefferson # Sentenced During Year 363 372 429 563 491
% Arrested Within One Year 11.6% 9.7% 11.7% 13.9% 15.1%
% Arrested Within 2 Years 17.9% 15.9% 16.8% 20.2%
% Arrested Within 3 Years 21.8% 22.8% 21.0%
Lewis # Sentenced During Year 82 60 59 62 65
% Arrested Within One Year 12.2% 6.7% 10.2% 4.8% 7.7%
% Arrested Within 2 Years 18.3% 13.3% 11.9% 11.3%
% Arrested Within 3 Years 31.7% 20.0% 18.6%
Livingston # Sentenced During Year 211 220 213 184 171
% Arrested Within One Year 8.1% 6.4% 8.9% 7.1% 7.6%
% Arrested Within 2 Years 12.8% 11.4% 11.7% 12.0%
% Arrested Within 3 Years 16.1% 16.8% 16.0%
Madison # Sentenced During Year 172 195 183 162 152
% Arrested Within One Year 12.8% 11.8% 10.9% 4.9% 5.3%
% Arrested Within 2 Years 17.4% 14.4% 16.4% 11.7%
% Arrested Within 3 Years 19.8% 20.5% 23.0%
Monroe # Sentenced During Year 2,405 2,697 2,637 2,325 2,229
% Arrested Within One Year 12.2% 11.2% 12.5% 14.1% 13.3%
% Arrested Within 2 Years 19.4% 18.1% 20.6% 21.8%
% Arrested Within 3 Years 24.8% 24.6% 26.1%
Montgomery # Sentenced During Year 110 83 111 108 120
% Arrested Within One Year 13.6% 4.8% 10.8% 13.0% 5.0%
% Arrested Within 2 Years 19.1% 6.0% 14.4% 18.5%
% Arrested Within 3 Years 27.3% 7.2% 18.9%

2007 2008 2009 2010 2011
Year Sentenced to Probation
Nassau # Sentenced During Year 2,559 2,565 2,604 2,538 2,126
% Arrested Within One Year 9.9% 8.7% 9.2% 8.0% 8.9%
% Arrested Within 2 Years 15.2% 13.9% 14.4% 12.2%
% Arrested Within 3 Years 19.8% 17.4% 18.3%
Niagara # Sentenced During Year 572 526 604 487 451
% Arrested Within One Year 11.2% 12.5% 8.3% 12.9% 6.9%
% Arrested Within 2 Years 18.7% 19.2% 16.6% 17.0%
% Arrested Within 3 Years 24.3% 23.4% 22.7%
Oneida # Sentenced During Year 729 696 708 662 601
% Arrested Within One Year 8.0% 9.9% 8.3% 9.1% 9.2%
% Arrested Within 2 Years 14.8% 14.4% 14.5% 14.5%
% Arrested Within 3 Years 18.4% 18.4% 18.2%
Onondaga # Sentenced During Year 1,471 1,505 1,465 1,476 1,592
% Arrested Within One Year 14.7% 14.0% 15.5% 15.0% 14.2%
% Arrested Within 2 Years 23.5% 21.9% 23.2% 24.3%
% Arrested Within 3 Years 30.6% 27.8% 29.0%
Ontario # Sentenced During Year 334 353 408 385 337
% Arrested Within One Year 9.9% 6.8% 8.6% 8.3% 10.1%
% Arrested Within 2 Years 15.0% 13.9% 13.5% 11.2%
% Arrested Within 3 Years 19.8% 17.0% 18.6%
Orange # Sentenced During Year 942 833 788 791 827
% Arrested Within One Year 10.6% 10.0% 10.0% 12.1% 8.7%
% Arrested Within 2 Years 16.9% 16.1% 16.0% 17.8%
% Arrested Within 3 Years 21.7% 20.2% 21.7%
Orleans # Sentenced During Year 118 164 139 118 95
% Arrested Within One Year 11.9% 12.8% 5.8% 4.2% 9.5%
% Arrested Within 2 Years 18.6% 22.0% 12.2% 16.1%
% Arrested Within 3 Years 26.3% 25.6% 19.4%
Oswego # Sentenced During Year 346 345 327 349 420
% Arrested Within One Year 11.3% 12.2% 11.9% 11.2% 13.6%
% Arrested Within 2 Years 17.6% 20.3% 16.5% 19.8%
% Arrested Within 3 Years 20.8% 23.8% 23.5%
Otsego # Sentenced During Year 83 92 125 90 79
% Arrested Within One Year 10.8% 9.8% 12.0% 5.6% 12.7%
% Arrested Within 2 Years 21.7% 16.3% 19.2% 15.6%
% Arrested Within 3 Years 25.3% 21.7% 26.4%
Putnam # Sentenced During Year 192 213 180 186 164
% Arrested Within One Year 10.4% 12.7% 5.0% 7.5% 3.7%
% Arrested Within 2 Years 16.1% 17.8% 12.2% 18.3%
% Arrested Within 3 Years 20.8% 23.0% 15.6%
Rensselaer # Sentenced During Year 592 524 470 432 410
% Arrested Within One Year 14.2% 14.5% 13.4% 12.7% 13.4%
% Arrested Within 2 Years 22.0% 25.2% 19.8% 18.8%
% Arrested Within 3 Years 26.7% 30.7% 27.2%
Rockland # Sentenced During Year 441 408 389 359 391
% Arrested Within One Year 10.2% 11.0% 10.5% 10.9% 9.2%
% Arrested Within 2 Years 18.6% 18.1% 19.3% 18.7%
% Arrested Within 3 Years 22.9% 21.8% 22.4%
St. Lawrence # Sentenced During Year 334 302 272 256 264
% Arrested Within One Year 7.8% 13.9% 14.7% 7.4% 9.5%
% Arrested Within 2 Years 15.3% 23.2% 21.0% 13.7%
% Arrested Within 3 Years 22.2% 28.1% 26.1%
Saratoga # Sentenced During Year 463 463 458 462 405
% Arrested Within One Year 12.7% 10.4% 10.3% 10.6% 10.6%
% Arrested Within 2 Years 18.8% 17.3% 16.2% 16.2%
% Arrested Within 3 Years 24.8% 24.6% 21.0%

2007 2008 2009 2010 2011
Year Sentenced to Probation
Schenectady # Sentenced During Year 497 423 407 445 414
% Arrested Within One Year 11.3% 10.6% 11.5% 12.8% 11.8%
% Arrested Within 2 Years 16.9% 18.4% 17.0% 19.1%
% Arrested Within 3 Years 21.7% 23.4% 21.9%
Schoharie # Sentenced During Year 48 75 67 78 98
% Arrested Within One Year 4.2% 5.3% 3.0% 2.6% 12.2%
% Arrested Within 2 Years 12.5% 13.3% 10.4% 9.0%
% Arrested Within 3 Years 18.8% 14.7% 13.4%
Schuyler # Sentenced During Year 78 76 74 68 83
% Arrested Within One Year 10.3% 7.9% 2.7% 7.4% 2.4%
% Arrested Within 2 Years 12.8% 10.5% 5.4% 11.8%
% Arrested Within 3 Years 19.2% 13.2% 6.8%
Seneca # Sentenced During Year 117 159 124 119 121
% Arrested Within One Year 7.7% 7.5% 8.1% 6.7% 9.9%
% Arrested Within 2 Years 12.8% 12.6% 12.1% 12.6%
% Arrested Within 3 Years 18.8% 17.0% 20.2%
Steuben # Sentenced During Year 337 374 298 314 287
% Arrested Within One Year 10.4% 6.4% 11.1% 8.9% 10.1%
% Arrested Within 2 Years 15.4% 13.6% 16.8% 17.5%
% Arrested Within 3 Years 19.6% 17.6% 20.5%
Suffolk # Sentenced During Year 4,538 4,199 4,050 4,220 3,904
% Arrested Within One Year 8.7% 10.3% 8.9% 8.9% 8.4%
% Arrested Within 2 Years 14.2% 15.6% 14.5% 14.0%
% Arrested Within 3 Years 19.3% 19.3% 18.7%
Sullivan # Sentenced During Year 349 271 272 234 284
% Arrested Within One Year 9.2% 8.5% 8.8% 8.5% 7.0%
% Arrested Within 2 Years 13.8% 12.9% 13.2% 14.1%
% Arrested Within 3 Years 18.6% 18.1% 18.4%
Tioga # Sentenced During Year 145 137 141 150 127
% Arrested Within One Year 11.0% 8.0% 7.8% 7.3% 7.9%
% Arrested Within 2 Years 12.4% 16.8% 11.3% 14.7%
% Arrested Within 3 Years 18.6% 18.2% 15.6%
Tompkins # Sentenced During Year 263 243 251 239 211
% Arrested Within One Year 8.7% 12.8% 13.9% 12.6% 11.8%
% Arrested Within 2 Years 14.1% 18.9% 20.7% 18.0%
% Arrested Within 3 Years 17.1% 23.0% 23.9%
Ulster # Sentenced During Year 390 438 480 431 395
% Arrested Within One Year 9.5% 12.6% 11.5% 12.1% 11.1%
% Arrested Within 2 Years 15.9% 23.3% 17.3% 18.1%
%t Arrested Within 3 Years 21.5% 31.1% 22.7%
Warren # Sentenced During Year 256 224 296 223 230
% Arrested Within One Year 12.5% 16.1% 11.5% 6.3% 8.7%
% Arrested Within 2 Years 16.8% 21.9% 16.6% 10.3%
% Arrested Within 3 Years 21.9% 23.2% 19.9%
Washington # Sentenced During Year 203 226 250 231 238
% Arrested Within One Year 10.3% 12.8% 10.4% 12.6% 8.4%
% Arrested Within 2 Years 17.7% 20.8% 16.8% 15.6%
% Arrested Within 3 Years 25.1% 26.1% 18.4%
Wayne # Sentenced During Year 266 303 290 274 292
% Arrested Within One Year 13.9% 10.9% 10.7% 7.7% 9.2%
% Arrested Within 2 Years 21.4% 17.5% 17.2% 15.3%
% Arrested Within 3 Years 28.9% 21.1% 24.8%
Westchester # Sentenced During Year 2,335 2,113 2,047 1,998 1,931
% Arrested Within One Year 11.8% 11.5% 14.5% 14.4% 14.2%
% Arrested Within 2 Years 18.3% 18.6% 21.7% 22.3%
% Arrested Within 3 Years 23.2% 22.2% 27.1%

2007 2008 2009 2010 2011
Year Sentenced to Probation
Wyoming # Sentenced During Year 107 105 121 99 126
% Arrested Within One Year 6.5% 5.7% 10.7% 12.1% 8.7%
% Arrested Within 2 Years 13.1% 10.5% 14.9% 17.2%
% Arrested Within 3 Years 16.8% 16.2% 18.2%
Yates # Sentenced During Year 66 87 82 79 93
% Arrested Within One Year 9.1% 6.9% 15.9% 16.5% 5.4%
% Arrested Within 2 Years 13.6% 11.5% 22.0% 20.3%
% Arrested Within 3 Years 21.2% 16.1% 30.5%
Non-NYC # Sentenced During Year 31,269 30,969 31,348 30,571 29,333
% Arrested Within One Year 10.9% 10.8% 11.0% 10.8% 10.5%
% Arrested Within 2 Years 17.1% 17.4% 17.3% 17.2%
% Arrested Within 3 Years 22.3% 22.0% 22.3%
Bronx # Sentenced During Year 2,404 2,351 2,066 1,736 1,844
% Arrested Within One Year 18.6% 19.8% 18.4% 17.1% 18.3%
% Arrested Within 2 Years 27.4% 28.6% 28.9% 27.2%
% Arrested Within 3 Years 34.1% 34.4% 36.0%
Kings # Sentenced During Year 2,183 2,129 2,262 1,903 1,559
% Arrested Within One Year 18.7% 17.7% 16.7% 18.1% 18.2%
% Arrested Within 2 Years 28.1% 26.8% 26.6% 27.9%
% Arrested Within 3 Years 34.7% 33.3% 32.8%
New York # Sentenced During Year 1,397 1,382 1,364 1,537 1,490
% Arrested Within One Year 16.2% 14.3% 13.7% 15.2% 14.3%
% Arrested Within 2 Years 25.0% 23.4% 21.3% 22.2%
% Arrested Within 3 Years 30.9% 29.5% 27.1%
Queens # Sentenced During Year 2,199 1,889 1,717 1,463 1,358
% Arrested Within One Year 15.0% 13.4% 13.5% 15.4% 14.7%
% Arrested Within 2 Years 22.9% 20.2% 21.4% 23.9%
% Arrested Within 3 Years 28.1% 25.1% 26.8%
Richmond # Sentenced During Year 548 547 497 441 310
% Arrested Within One Year 18.4% 16.3% 19.9% 17.2% 17.7%
% Arrested Within 2 Years 28.8% 24.9% 28.0% 26.8%
% Arrested Within 3 Years 32.8% 30.5% 33.8%
NYC # Sentenced During Year 8,731 8,298 7,906 7,080 6,561
% Arrested Within One Year 17.3% 16.7% 16.1% 16.6% 16.6%
% Arrested Within 2 Years 26.1% 25.1% 25.3% 25.6%
% Arrested Within 3 Years 32.1% 30.9% 31.4%
# Sentenced During Year 40,000 39,267 39,254 37,651 35,894
% Arrested Within One Year 12.3% 12.1% 12.0% 11.9% 11.6%
% Arrested Within 2 Years 19.1% 19.1% 18.9% 18.8%
% Arrested Within 3 Years 24.5% 23.9% 24.1%
Source: NYS Computerized Criminal History system
Statewide
Total
Cases past
Maximum
Expiration
% Active Cases
past Maximum
Expiration
Cases past
Maximum
Expiration
% of Active
Cases past
Maximum
Expiration*
Cases with Open
Violation for
Absconding
% Active Cases
with Open
Violation for
Absconding
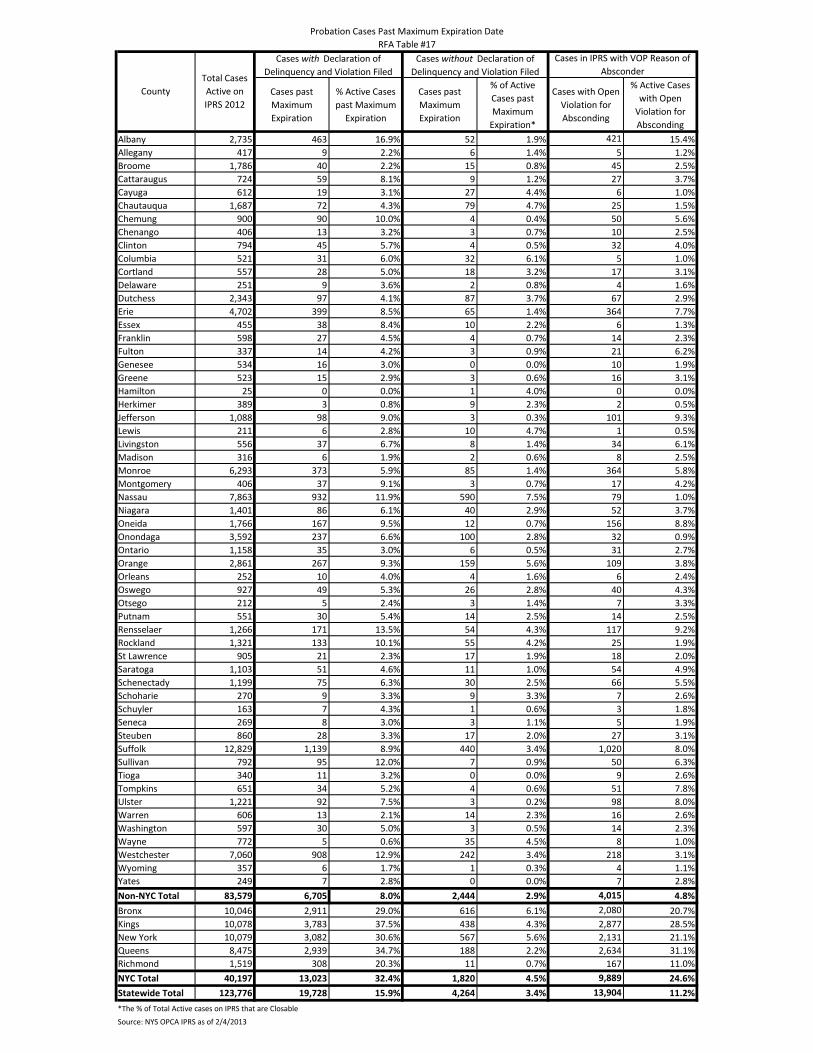
Albany 2,735 463 16.9% 52 1.9% 421 15.4%
Allegany 417 9 2.2% 6 1.4% 5 1.2%
Broome 1,786 40 2.2% 15 0.8% 45 2.5%
Cattaraugus 724 59 8.1% 9 1.2% 27 3.7%
Cayuga 612 19 3.1% 27 4.4% 6 1.0%
Chautauqua 1,687 72 4.3% 79 4.7% 25 1.5%
Chemung 900 90 10.0% 4 0.4% 50 5.6%
Chenango 406 13 3.2% 3 0.7% 10 2.5%
Clinton 794 45 5.7% 4 0.5% 32 4.0%
Columbia 521 31 6.0% 32 6.1% 5 1.0%
Cortland 557 28 5.0% 18 3.2% 17 3.1%
Delaware 251 9 3.6% 2 0.8% 4 1.6%
Dutchess 2,343 97 4.1% 87 3.7% 67 2.9%
Erie 4,702 399 8.5% 65 1.4% 364 7.7%
Essex 455 38 8.4% 10 2.2% 6 1.3%
Franklin 598 27 4.5% 4 0.7% 14 2.3%
Fulton 337 14 4.2% 3 0.9% 21 6.2%
Genesee 534 16 3.0% 0 0.0% 10 1.9%
Greene 523 15 2.9% 3 0.6% 16 3.1%
Hamilton 25 0 0.0% 1 4.0% 0 0.0%
Herkimer 389 3 0.8% 9 2.3% 2 0.5%
Jefferson 1,088 98 9.0% 3 0.3% 101 9.3%
Lewis 211 6 2.8% 10 4.7% 1 0.5%
Livingston 556 37 6.7% 8 1.4% 34 6.1%
Madison 316 6 1.9% 2 0.6% 8 2.5%
Monroe 6,293 373 5.9% 85 1.4% 364 5.8%
Montgomery 406 37 9.1% 3 0.7% 17 4.2%
Nassau 7,863 932 11.9% 590 7.5% 79 1.0%
Niagara 1,401 86 6.1% 40 2.9% 52 3.7%
Oneida 1,766 167 9.5% 12 0.7% 156 8.8%
Onondaga 3,592 237 6.6% 100 2.8% 32 0.9%
Ontario 1,158 35 3.0% 6 0.5% 31 2.7%
Orange 2,861 267 9.3% 159 5.6% 109 3.8%
Orleans 252 10 4.0% 4 1.6% 6 2.4%
Oswego 927 49 5.3% 26 2.8% 40 4.3%
Otsego 212 5 2.4% 3 1.4% 7 3.3%
Putnam 551 30 5.4% 14 2.5% 14 2.5%
Rensselaer 1,266 171 13.5% 54 4.3% 117 9.2%
Rockland 1,321 133 10.1% 55 4.2% 25 1.9%
St Lawrence 905 21 2.3% 17 1.9% 18 2.0%
Saratoga 1,103 51 4.6% 11 1.0% 54 4.9%
Schenectady 1,199 75 6.3% 30 2.5% 66 5.5%
Schoharie 270 9 3.3% 9 3.3% 7 2.6%
Schuyler 163 7 4.3% 1 0.6% 3 1.8%
Seneca 269 8 3.0% 3 1.1% 5 1.9%
Steuben 860 28 3.3% 17 2.0% 27 3.1%
Suffolk 12,829 1,139 8.9% 440 3.4% 1,020 8.0%
Sullivan 792 95 12.0% 7 0.9% 50 6.3%
Tioga 340 11 3.2% 0 0.0% 9 2.6%
Tompkins 651 34 5.2% 4 0.6% 51 7.8%
Ulster 1,221 92 7.5% 3 0.2% 98 8.0%
Warren 606 13 2.1% 14 2.3% 16 2.6%
Washington 597 30 5.0% 3 0.5% 14 2.3%
Wayne 772 5 0.6% 35 4.5% 8 1.0%
Westchester 7,060 908 12.9% 242 3.4% 218 3.1%
Wyoming 357 6 1.7% 1 0.3% 4 1.1%
Yates 249 7 2.8% 0 0.0% 7 2.8%
Non-NYC Total 83,579 6,705 8.0% 2,444 2.9% 4,015 4.8%
Bronx 10,046 2,911 29.0% 616 6.1% 2,080 20.7%
Kings 10,078 3,783 37.5% 438 4.3% 2,877 28.5%
New York 10,079 3,082 30.6% 567 5.6% 2,131 21.1%
Queens 8,475 2,939 34.7% 188 2.2% 2,634 31.1%
Richmond 1,519 308 20.3% 11 0.7% 167 11.0%
NYC Total 40,197 13,023 32.4% 1,820 4.5% 9,889 24.6%
Statewide Total 123,776 19,728 15.9% 4,264 3.4% 13,904 11.2%
*The % of Total Active cases on IPRS that are Closable
Source: NYS OPCA IPRS as of 2/4/2013
Probation Cases Past Maximum Expiration Date
RFA Table #17
Cases in IPRS with VOP Reason of
Absconder
Cases with Declaration of
Delinquency and Violation Filed
Cases without Declaration of
Delinquency and Violation FiledTotal Cases
Active on
IPRS 2012
County