table of contents -...
TRANSCRIPT

Table of Contents
Introduction
Chapter 1: Lessons on Getting ReadyDeveloping a Watch ListThe Watch List ConceptTime FramesYour Progress as a Trader
Chapter 2: Lessons on Some BasicsWhat Market Is That Again?Looking at the Big PictureA Guide to Protective Stop LossesTrading the First Half HourFundamental vs. TechnicalNews You Can Use?News and Your TradingAre You Still Investing?Reversal TimesThe All Important 200 Period Moving AverageMoving Averages, the Power of the 20 M.A.A Return to Some Basics
Chapter 3: Lessons on ManagingManaging a TradeDealing with DisasterAlternate Swing EntriesThe Reward to Risk RatioDo You Find Yourself Target Challenged?The Anatomy of an Entry
Chapter 4: Lessons on Psychology in Trading & PlanningThe Psychology of Fear

The Trading Plan - The Key to Your SuccessDisciplineSome of Your Best Qualities . . .The Need to be RightThe Ways Traders LearnUsing Public Fear as a Trading ToolAnalysis of a Losing Trade
Chapter 5: Technical LessonsSome Common MistakesWas That a Double Top?Support and ResistanceThat First PullbackRecognizing a Trend DayThe Perspective of Multiple Time FramesZoom, Zoom, ZoomDaily Pivot PointsFighting the TrendHow a Trend EndsThe Intraday TrendFinding an Intraday ReversalA Change in Trend, Part 1A Change in Trend, Part 2Trading Gaps, Part 1Trading Gaps, Part 2
Chapter 6: Chart Lessons on the MarketThe NASDAQ in ReviewA Look at the MarketA NASDAQ Update, Part 1A NASDAQ Update, Part 2The Volatility Index as a GuideCaution in the Market
Chapter 7: Lessons on Classic PatternsUsing Relative Strength as One of Your ToolsRelative Strength at Reversal TimeFailed Breakdown at Reversal TimeA Strategy Against the TrendPlaying a Climactic ReversalThe Lunch Time FadeThe Power of a Mortgage PlayFinding Unique PlaysQuality Breeds NicknamesWhen it all Comes Together
Conclusion
Appendix A: Analyzing Pristine Buy Set-ups
Appendix B: Glossary
Index
Recommended Reading


Copyright © 2007 Oliver L. Velez and Greg CapraPublished by John Wiley & Sons, Inc., Hoboken, New Jersey
Published simultaneously in CanadaNo part of this publication may be reproduced, stored in a retrieval
system, or transmitted in any form or by any means, electronic,mechanical, photocopying, recording, scanning, or otherwise, except aspermitted under Section 107 or 108 of the 1976 United States Copyright
Act, without either the prior written permission of the Publisher, orauthorization through payment of the appropriate per-copy fee to the
Copyright Clearance Center, 222 Rosewood Drive, Danvers, MA 01923,(978) 750-8400, fax (978) 646-8600, or on the web at
www.copyright.com. Requests to the Publisher for permission should beaddressed to the Permissions Department, John Wiley & Sons, Inc., 111River Street, Hoboken, NJ 07030, (201) 748-6011, fax (201) 748-6008,
or online at www.wiley.com/go/permissions.Limit of Liability/Disclaimer of Warranty: While the publisher and author
have used their best efforts in preparing this book, they make norepresentations or warranties with the respect to the accuracy or
completeness of the contents of this book and specifically disclaim anyimplied warranties of merchantability or fitness for a particular purpose.
No warranty may be created or extended by sales representatives orwritten sales materials. The advice and strategies contained herein may not
be suitable for your situation. You should consult with a professionalwhere appropriate. Neither the publisher nor the author shall be liable for
damages arising herefrom.For general information about our other products and services, please
contact our Customer Care Department within the United States at (800)762-2974, outside the United States at (317) 572-3993 or fax (317) 572-
4002.Wiley publishes in a variety of print and electronic formats and by print-on-demand. Some material included with standard print versions of this
book may not be included in e-books or in print-on-demand. If this bookrefers to media such as a CD or DVD that is not included in the version
you purchased, you may download this material at

http://booksupport.wiley.com. For more information about Wileyproducts, visit www.wiley.com.
Library of Congress Cataloging-in-Publication Data:

This book is dedicated to my lovely, ever patientwife, Brenda, and my six amazing children,Victoria, Jonathan, Rebecca, Oliver, Jr., and
the twins, Megan and Morgan.

Preface
One measure of writing for traders and investors (as perhaps with writingfor all others), is the ah ha! factor—a sentence or thought that provokes afeeling of enlightenment or deep understanding with the reader. Our hopeis for numerous ah ha! moments to occur in these pages.
Trading is a somewhat difficult subject to write about. As you learn andassimilate certain truths, these truths often can and should change for youlater. What seemed quite profound to you at one time might seem a yearlater to be obvious—and no longer worthy of being mentioned. What hashappened is that you have moved beyond this particular truth to a newertruth, a higher truth. In such fashion, the growing trader keeps movingbeyond his own knowledge, outdating it.
At the same time, to someone new to the game of trading, these are stillnew truths, capable of changing one’s thinking and approach, so in thatsense, one is wrong not to include them. The bottom line is that a trader’sapproach continuously changes and evolves. Aside from the very newestbeginners, and the most experienced traders, almost everyone in themarket is at a different level of knowledge.
While I can’t honestly say that Strategies for Profiting on Every Tradewas written as a companion volume to my earlier book, Tools and Tacticsof the Master Day Trader (McGraw Hill 2000), the reader of that earlierwork will undoubtedly see a continuation of some of the ideas expressedin that book. Tools and Tactics dealt more with the psychology of thetrader—his emotions, motivations, and frustrations—Strategies forProfiting focuses more on the game or activity itself.
This book is designed to address the needs of both income and wealthproducing traders. There is a strong tendency to separate these two stylesof trading into completely independent skill sets and approaches. But it isour view that not only can they not be split, but any attempt to do sowould result in automatically curtailing your progress as a trader. In thesame way that it is commonly understood that both your left and yourright hand play equally crucial roles in everyday life, so do incometrading and wealth trading play equally important roles in the daily livesof most successful traders. In other words, one should never chose

whether the income producing style of trading is better than the wealthgenerating style, or visa-versa. Rather one should look to become adept atboth styles. This book will teach you just how to accomplish that.
In chapter 1, Lessons on Getting Ready, you’ll be guided in how atrader should prepare for each day and week. How you start will largelydetermine how you end in this business. I have witnessed far too manytraders sloppily enter each week and each day without a plan and withouta proper list of stocks to watch. This will not be you, after this chapter isassimilated.
In chapter 2, “Lessons on Some Basics,” you will learn some verycrucial things, such as how to deal with the all-important first hour oftrading. Not many traders know that the pent up demand or accumulatedsupply built up overnight often make the first hour of trading the mostvolatile. The first 30-minutes of trading in particular are very tricky.You’ll learn how to deal with this all important time period and turn itinto opportunity. Did you know there are nine other times during eachday of which every trader should be acutely aware? These nine reversaltimes, as we like to refer to them, offer some unique opportunities forwatchful traders. You’ll also be taught how to deal with the vagaries ofnews and how it can affect your stocks for the positive and negative.
Chapter 3 deals with two of the most crucial aspects of proper trading,trade management and money management. The correct management ofyour position always hinges on several things: a favorable risk/rewardratio, a proper entry, and an intelligently selected price target. Each aspectof a properly executed trade will be reviewed in detail in this chapter.
The psychological aspect of trading represents 85 percent of the game,in my opinion. As market participants, we don’t really trade stocks,options, bonds, futures, currencies or any other financial instrument, forthat matter. In reality, we trade people, the people who own those things Ijust listed. For any of the above items to move, people have to make buyand sell decisions, and the peoples’ buy and sell decisions are incited byemotions, namely greed and fear. In chapter 4, we talk about how a traderis to cope with these two dominant emotions and how he can use them forprofitability. We also delve into the challenge of always needing to beright and explain how the loss of trades can be turned to your best

advantage.Chapters 5, 6 and 7, get to the meat and potatoes of our trading method.
We’ll delve deeply into the many chart patterns that we rely on everysingle day in the market. You’ll learn about several highly reliable tradingevents that happen over and over again, the same way each time. We’llshow you how you can turn these events into consistent profits. In thesesections, we’ll equip you with many of the same trading techniques thatwe’ve taught to major Wall Street firms and some of the country’s toptraders.
Lao-tzu said, “a journey of a thousand miles must begin with a singlestep.” It is our belief that the book you now hold in your hands can be thesingle step that launches your journey to profitability. So read each lessoncarefully, take notes, and be sure to keep a journal of the ah-ha! momentsthat strike you. I have always taught that it takes only the mastery of twoor three reliable strategies to do extraordinarily well in the market. Inthese pages, you will find far, far more than that. Use them well!
Oliver Velez
It was quite a privilege when Oliver Velez approached me to help writeStrategies for Profiting on Every Trade for his worldwide following. Yousee, Oliver Velez has been my mentor since I began trading. But as muchas it was a privilege, I knew it would also be a challenge because I wasabout to undertake a monumental task.
Many of these lessons have been taught to students worldwide over aspan of 4 years. These lessons contain powerful information that goes farbeyond the basics you may find in many introductory trading books.Looking back, though it was an incredible amount of work putting thisvast amount of information together, I am very proud of the task that wecompleted.
Paul Lange

Introduction
Getting Started, Part 1So, you want to know something more about trading. Or is it online stockbuying? Or is it day trading? Or is it investing? Well, let’s get a few termsstraight.
First, we consider ‘investing’ something that is no longer a term thatshould be applied to the stock market. Invest in real estate, bonds, orgold, but not stocks. It implies a ‘long term buy and hold with your eyesclosed approach’ that should no longer be used in the stock market. Mostof today’s large cap companies are in technology. These companies aresubject to having their main product replaced by a new technology veryeasily. Long ago, it would have taken years for any company to start up anew car company and overtake General Motors. Today, anyone cancreate software in their garage that can revolutionize how something isdone and consequently put a competitor out of business. Take the case ofIomega. The current technology at the time was storing information on1.44 Meg disks. Iomega came out with a system to store 100 Megs on adisk, and got contracts to put their drive on every major computer.Sounds like a company you can buy and hold forever, doesn’t it? It is,until someone discovers that the same information can go on a CD andhave it cost much less. Then Iomega is gone, unless it has other productsto sell. In today’s marketplace companies must change or become extinct.
So if investing is out, what do we do? You hear stories about all of the‘day traders’. You look around you and you don’t see many. You maynot even know any besides yourself and those you met at a seminar.Unfortunately, the term ‘day trading’ is often misused by the media.There is a large group of people who we call ‘online investors’. These arethe folks who use their computers in place of their telephones to callplaces like E-Trade, Schwab, etc. and place their orders. They typicallyare managing their savings or IRA money, and are untrained. They wereplentiful during the bull run of the 90’s, and often were wrongly called‘day traders.’ It did not matter because they made money during the bullmarket no matter what they did.
We consider ourselves day traders, or traders, but this does not includethe much larger group of online traders mentioned above. We think of
day traders as people who spend a good part of the day with the market;those who are trained to manage positions that may last from severalminutes to several months. Though we believe that ‘investing’ is a deadterm, we do use many time frames to hold stocks, the longest of which isa ‘core’ position. While a core position may last for months, it differsfrom investing because there is an exact exit strategy planned for a coreposition. We also use a ‘swing’ time frame. This is one that may last fromtwo to five days. We also use tactics that would have us holding a stockovernight one time, or exiting the same day, or sometimes exiting part ofa position only minutes after entry.
So if you are going to day trade, how do you buy stocks? If you aretrading only a few trades a week, and limiting yourself to swing and coretrades, it is fine to use one of the online brokers. The time it takes to haveyour order filled is not very fast, but for occasional long-term trades, it isacceptable. If you are going to be trading more often, or trading in andout the same day, you will want to use a direct access broker. This is abroker who lets you see all of the market participants, where they arebuying, and where they are selling. You then place your own order viayour web browser and many of these orders will have instant executions.By instant I mean within a fraction of a second.
So, you know what you want to do and have selected a broker. Nowyou need a computer and an Internet connection. Again, for occasionalswing and core trading, any machine that can access the Internet will do.If you are going to be active intraday, you will need to have somethingbetter. You will need a powerful, top of the line computer and a fastInternet connection. Dial up access is no longer a realistic option. Youneed to be looking for DSL, Broadband, FIOS, Cable, Satellite, or T1-3.Depending on where you trade, you will have to evaluate which of theseoptions is available and most effective for your money. You will need aworking knowledge of computers because your time with the computerwill be extensive whether or not you wish it to be.
Now you are ready to trade, right? Well, no, not really. The biggestdistinction I made earlier was that day traders are educated in tradingstrategies and disciplines. This will be the focus of the next lesson, how tostart out trading when you have no education or experience in trading. Iwill discuss how to build that education as you go, without using up all of

your capital.

Getting Started, Part 2In the last lesson, I discussed some basic things you need to review if youare going to start some form of trading. I would like to expand on thosethings and discuss in which time frames you may be interested in trading.Also, I will discuss how to get an education for varying costs andconstraints.
Previously, I discussed the concept of time frames. Time is an importanttopic and is the next item you need to consider before you begin trading.The concepts of trading can be used to help people who are looking tobetter manage their IRAs. They can also be used for people trying tobuild wealth by swing trading investment money, and for people trying toproduce income by trading on an intraday basis.
If you are going to be active in the markets, I recommend that youmaintain two separate accounts for trading. These two accounts will havedifferent goals. One account should be a wealth building account for coreand swing positions. Core positions are positions based on weekly chartsand can last from weeks to months. They have stop losses and entrypoints like any other trade. Targets may be set as an objective or left to anexit based on raised stops as the stock moves up (or lowered stops asstocks move down in the case of a short). Swing positions are based ondaily charts and can last from two to five days. This wealth buildingaccount is important for capturing the major moves in the market. Theseare moves that may elude the trader who goes home flat every night.Gaps and large extended moves will benefit the swing and core trader, butoften will only aggravate the intraday trader.
The second account should be income producing and should consist ofday trades (ranging from minutes to all day), and guerilla trades. Guerillatrades are a special Pristine tactic. They are designed to capture fast movesin the market in one to two days. These strategies help maintain incomeflow even at times when the market may be moving sideways and notgenerating income in the wealth building account.
Once you decide on your time frame, you are ready to begin—nottrading, but learning! Trading is one of the most challenging endeavors inwhich you can participate. Unfortunately, most traders will spend more
time getting educated in the television market before buying a televisionthan they will spend getting educated in trading concepts before buying astock. Most traders do not feel the need to get educated in trading. Mosttraders also fail.
No one would try to be a doctor or a lawyer without the properschooling. Yet for some reason, new traders believe that this is an easy toconquer profession. In fact, some of the smartest and most successfulpeople often have the most difficult time trading. Also, continuoussuccess, in other endeavors before trading often translates tooverconfidence and stubbornness while trading: this is a bad combination.You must be able to admit when you are wrong and move on quickly.Successful people often are perfectionists—a quality not suited fortrading. Good traders don’t insist on being right—they aim to makemoney.
Do you know right now, which strategies you want to play in thismarket? In this month? In this week? Today? Do you know whichstrategies you want to play at different times of the day? Do you knowhow to handle all of the market maker (a firm ready to buy and sell aparticular stock on a regular and continuous basis at a publicly quotedprice) tricks? Do you know how to handle reversal times? You see, themarket is designed to extract money quickly from the unknowing. It is agame where very many supply much money to the very few. On whichside of this equation have you been?
You need to develop a trading plan that outlines your total business planwhen it comes to how you want to trade. You need to outline thestrategies you want to use, and when you want to use them. You need tooutline money management rules. How much will you risk on that scalp?How much on that core trade? How much can you afford to lose in oneday? You need to understand trading and all the concepts it involves. Thisis the single most important step to successful trading. Yet, the vastmajority of new traders do not have a plan.
Everyone has a different level of money and time they can devote tolearning. That is fine: there are different ways to approach education.Some want to improve their core trading to help the returns of their IRAswhile they work full time at their jobs. Some have come into some money
and want to make their living trading the markets full time. Most traderslose too much in the beginning that cannot be regained by the time theydecide to get an education. Don’t let this happen to you.
There are many opportunities to learn trading on many different timehorizons and cost levels. Remember, you will pay for your education oneway or another. Some traders lose more money in a week than it wouldtake to get a good start on an education. Don’t be one of those peoplewho think, “When I make enough money trading to pay for a seminar, Iwill take it then . . . .” Think of the logic in that statement. The trainingmust come first.

Getting Started, Part 3Okay, you caught me. If you read the first two lessons, it was clear thatthe intent was to have part one and part two. However, if SylvesterStallone can make 6 Rocky movies, I can write a third beginner’s lesson.Though they had a great deal of information, the lessons really onlyguided new people up to the day they start trading—not really a goodtime to leave them hanging.
Once you have made all the decisions discussed in the first two lessonsand received an education to the level you feel you need to begin trading,the moment of truth arrives. I would like to make sure you have a fewtools in your belt when you begin trading. First of all, there is a steeplearning curve in trading. I urge you to start by paper trading. Get used toyour trading software. Understand the plays. Begin to pick your favoritesand really develop your trading plan. At this point, it is likely just a shell.Know how to get in and out of trades. The odds are that you will lose inthe beginning. You are learning to apply what you have learned. You willmake mistakes. So, do you want to have all this learning cost you realmoney or paper money?
How long should you paper trade? Until you are good at it. Reallygood. I have never met someone who admitted losing money papertrading. Set up criteria that you must pass to advance. You can use thecriteria of making a certain number of points a day or possibly a certainnumber of days in a row of winning points, or x trades in a row without aloser. The criteria are not as important as following what you pick. Whenyou are ready, move up to a small amount of risk. Start with about$50.00. You will notice the difference. Just the official beginning of yourtrading record and the pressure of real executions will really play withyour head. Don’t worry about making money yet: you will not, becauseof commissions. Worry about making money before commissions.Increase the risk amount slowly, and only upon passing the criteria youhave set for yourself.
A word of warning: it is at this time that traders feel the pain of somesmall losses. Their first instinct is to increase their share size to recovertheir losses. The irony is obvious when you read this, but maybe not if it

happens to you. Don’t increase your share size until you trade well atyour current level. It is always harder to trade with more shares.
During this process, you should be developing a trading plan. One thatoutlines the types of plays you will look for. It should restrict you fromtrading certain times and plays that you do not want to trade. It shouldoutline money management rules for you, for handling both winning andlosing days. It should set up your share size rules, and it should dictatewhat kind of record keeping, analysis, and continuing education youpursue.
Pay attention to the analysis part and make plans to follow up on all ofyour trades. Most traders spend 90 percent of their time trading, 10percent on preparation, and 0 percent on follow up. This is a very bigmistake. Traders should spend as much time following up on trades asthey do trading. That does not mean that the time from 9:00 to 4:30 mustbe counted as trading time. Your plan may call for you to trade only thefirst and last hour. The time in between could be used to review themorning trades and prepare for the next day, paper trade new ideas, etc.You should spend considerable time printing charts of the trades youmake, evaluating them, and learning from any mistakes. Good tradersunderstand that the money lost when making a bad trade can be aninvestment in a process that works to eliminate mistakes and improvetrading.
Good traders also understand that the market is always right, and thebest we can do is play the odds. Be flexible and remember that even thebest trades can be stopped out.

Chapter One
Lessons on Getting Ready
Developing a Watch ListThere are many different styles of trading, and different traders preparefor the market in different ways. Most traders who do more than microscalping start off the day with some kind of watch list. This list and itspreparation will vary greatly. Here are some ideas of different ways toprepare for the next day.
To prepare for the next day, you will want to look at daily charts afterthe market closes. If you are swing trading, you live off of the dailycharts. If core trading, you live off of the daily and weekly charts. Even ifyou are intraday only, you will put the odds more in your favor if youhave multiple time frames all going in your direction. In other words,even if you were trading intraday, would you want the stock you areplaying long to be a short set up on the daily? Of course not. Start with alist of long stocks to play long, even if intraday. If you trade from a smalluniverse of favorites, at least categorize each trend as up, down, orsideways.
The first list that is the easiest to develop is of favorite stocks that youplay every day. This list may include as few as 4 or 5 stocks, or up to 30or 40. The number does not matter: the point is that the list consists of ahandful of stocks that the trader knows very well. Many traders aresuccessful doing this. There is a big advantage because they are familiarwith every stock on their list. It is likely that they all trade well, are heavyvolume, and easy to get in and out of without much slippage (payingmore than the strike price to get into a long position because of the bid-ask spread or small volume on the offer). There is also a bigdisadvantage. You will miss many strategies that day. Your small list willnot often have a mortgage play, or a nice bullish gap surprise.
Another easy list alternative is to have someone else do most of thework for you. For example, there are Pristine chat rooms and Pristine

ESP™, Pristine’s real-time scanning tool, that provide end of day lists ofstocks. Any of these methods simply involve you looking at the picks andfollowing the ones that meet your trading plan requirements. This is all inaddition to the scans that are far too numerous to mention here. Thesescans are used to find set-ups for the next day on daily and weekly charts,as well as real-time intraday scanning with alerts. Using Pristine ESP™alone will give you more play suggestions in whatever time frame you arein than you will ever likely need. A sample of a few of the many scans inPristine ESP™ are shown in figure 1-1. It is opened to show the swingtrader scans from the daily chart.
Figure 1-1 Pristine ESP

The third type of list would be one that you generate yourself based onthe patterns you want to find. It involves scanning stocks one by one untilyou find a pattern that matches a strategy you want to watch the next day.This method is what the rest of this lesson will focus on.
To review a list of stocks to produce a watch list for the next day, youneed to have a list of stocks to review. There are about 9,000 stocks and itwould not be an easy task to look at 9,000 stocks every night. So we needto have a master list of stocks that we will look at to pick our watch list.We call this our “universe of stocks.” There are two different ways to

create your universe of stocks.First, you can create a universe of stocks by compiling several indices
you like to follow. If you like tech, maybe you start with the NASDAQ100 and then add the Semi Conductor Index (there will be some overlapin many indices so your total will be less than the sum of the two indices).Maybe add the Dow, and then perhaps a few stocks you like to play, soyou can add those. You may end up with 100-500 stocks in youruniverse.
Second, you can create a universe of stocks by starting with the entiremarket and then using software to scan and eliminate certain criteria. Forexample, if you just use two criteria such as stocks that do over onemillion shares a day and whose price is over $4.00, you will be down toabout 400-600 total stocks, of which 200-300 will be NASDAQ stocks.
The second way, scanning, has both advantages and disadvantages. Byscanning stocks to obtain your universe, you will have a different listevery day. Some new stocks will join as their volume meets therequirements, some will leave as they slow up in volume. So scanningwill allow you to automatically see the up and coming stocks. This is alsothe disadvantage because as you will have stocks entering your list thatyou have never seen before. Playing these often results in problems if youdo not study them first.
Once you have your universe, it is simply a matter of scanning throughthe list every night to look for the set ups you like. Once you have someexperience, you should only look at each stock for a second. If the patterndoes not jump off the page at you, it is not likely to be a good one.
If you want a simple way, which takes minimal time, to manage yourwatch list if you are swing trading, try the following: on the weekend,review your list and look for the stocks that are defined as uptrends anddowntrends. For an uptrend, look for stocks that have higher highs andhigher lows, and have rising 20-and 40-period moving averages. For thebest trends, look for the 20 to be above the 40 and keep a smooth,consistent distance apart. For downtrends, look for the reverse. Put thesein two lists with those names. Then, every night, just look through theuptrend list for stocks that have 3-5 days down (3-5 lower highs,preferably 20-20 bars). Look through the downtrend list for 3-5 higher

lows. You will then have a watch list that has the first two importantcomponents of a successful trade: a trend and a pullback.
Now that you have your list, the next lesson is about using it.
The Watch List ConceptThere seems to be much confusion among new traders regarding watchlists, analyzing and entering plays. Let’s review a few basic concepts.
We have already talked about how to develop a watch list. The issuenow is what to do with the watch list. We put stocks on a watch listbecause they have formed a pattern that we recognize. They have formeda visual picture that matches a pattern we have trained our eyes to detect.This pattern is part of a strategy that we have been taught. However, thestrategy has another part to it, which is when to enter the trade. The entryis almost always set to a place the stock will have a hard time crossing, ora line in the sand, so to speak.
For example, the strategy may be to play a Pristine Buy Set-up (or PBS,see Appendix A) from the daily chart over the prior day’s high. The firststep is to find a candidate by scanning many charts and finding a pictureof a PBS that has an uptrend, a 3-5 day pullback, etc. Then, the stockgoes on a watch list for the next day.
Now, here is where the problem comes in. This play should be enteredlong over the prior day’s high. Many feel that if this is on a long watchlist, it is to be played long. So, why not buy it at open and get a cheaperprice? Nothing could be further from the truth. If the entry is over 32.00,let me describe how you should read the play. This stock has been fallingfor the last five days. It has not been able to trade over the prior day’shigh in five days. It has encountered selling, and that selling will likelycontinue. This stock is likely to fall for several more days. However, if itcan trade over yesterday’s high, I will play it long because it is showingthe strength that may change this trend. Not just because it traded overyesterday’s high, but because it did so after meeting all the criteria.
When read like that, it will stop you from thinking the wrong way.Overcoming that resistance is what makes the play work. The bigger theresistance, the stronger the stock must be to get through. It is no wonderthat one trader looks at a chart and due to the resistance, sees a short.Another looks and if it breaks the resistance, sees the opportunity for along. This is quite logical, and how you must think when you trade.
Near to this topic is the question of what plays to take. Once we meet all

ten criteria for a PBS (see Appendix A), are all trades then the same? Arethey all automatic buys? Do these things exist in a vacuum?
Let’s say you like to fish. You have discovered an incredible lure. Thelure catches fish better than anything anyone else has tried. (This is yourstrategy in trading talk). Now let’s say you want to take your son ordaughter fishing for the first time. You want to catch as many fish aspossible this day. Would it matter to you if the tide was in or out? If itwas 95 degrees or 40 degrees? Morning or night? From boat or shore?You may have the best lure in town, but you still look to other things toget the best fishing day. Right?
Trading is no different. Good strategies give you the set-ups and theedge you want. Many other things will improve the odds. Whenfollowing a trading plan—are the futures with you or not? Did the stockgap up? Is it extended at entry? Is the risk worth the reward? Does thedirection you are playing intraday match with the long-term direction? Allthese things involve the study of proper entries, market internals, andexperience. If you track the plays you take and make it a rule to reviewand evaluate, it will help you pick the best plays with better consistency.

Time FramesThe subject of time frames really involves both technical andpsychological discussions. Talking about the technicals of time frames isimportant. Many people get confused about why a stock can look shorton a 5–minute chart, long on a 15, short on a daily and long on a weekly.The best entries, of course, will have as many time frames aligned aspossible. I would like to step back and discuss the bigger issues of timeframes.
You may recall an earlier discussion about having an income producingand a wealth account. What is the difference? Income producing refers toan account that seeks to take money out of the market every day byexecuting day trades and guerrilla trades. These trades are designed to beexited the same day or one day and one night. Wealth producing refers toan account that seeks to take bigger gains out of stock movements byusing swing and core trading tactics. These trades may last three to fivedays for a swing and weeks to months for short-and long-term cores.Some may also have a separate long-term account for an IRA or collegefund.
Notice that the term “investment” is missing. I believe this term to beextinct. One can no longer close his eyes on a trade and hope that it worksout. All trades have an exit point. Things can change so quickly today, astechnology advances, and no company is safe from competition.
It is important to keep your income producing and wealth buildingaccounts separate. The goals of each are different. It is difficult to holdswing positions in your day trading account. In order to let profits run,you should not overmanage the position. This will likely happen if youare looking at the position all day in your day trading account.
It is also important that you use the accounts at the proper time. Daytrades occur every day, so do guerrilla tactics. Most every day, someswing trades occur due to the various sectors we look at. Core trades maynot occur all the time. You should enter those only at the appropriatetimes based on weekly charts. Setting up these accounts properly is yourkey to capitalizing on market moves. Let me explain this strategy.
I had previously presented a special lecture discussing core trades and
looking at some possible stocks to consider for long-term core holdings.The purpose was to be prepared to enter some long core trades so you didnot have to scramble if the market suddenly looked bullish. I focusedonly on beaten up techs that held some support area on a weekly chart.The point was to make intelligent good-odds entries.
I identified market action that led us to be bullish for the first time in along time. I picked one core position one week, DELL, and another thenext week, YHOO. There was a list of 12 stocks we discussed as possibleentries at any time, but entries may depend on individual situations. Theremay be different needs based on the age, available cash, and so forth.
The point of the story is this: while the market had a strong move up thefirst week, the first day of this move is difficult to capture in a day tradingaccount. In this market, it is not wise to hold long position day trades allday. On most days, this leads to giving back most or all of gains. Thismeans that only partial profits are captured in a day trading (incomeproducing) account. But, this is the purpose of the day trading account.Those who participated and took core positions or even swing positionshad something working for them the whole time. There was no need topush the day trading account. It allows for clear thinking in the daytrading account because you know you are already participating in themove to the wealth building account.
Using accounts properly and clearly identifying the type of trade youare entering, along with the appropriate stop and target, is key to trading.

Your Progress as a TraderOne of the most difficult things for a new trader to measure is his ownprogress. Many of you may feel like you are making substantial progress,but your accounts may not show it yet . . . This is normal.
But how do you know where you stand? Here are some observations Ihave made of the levels many new traders have passed on their way tobecoming successful traders.
You may be someone, who has had some great successes, only to giveit all back quickly. Trying desperately for those successes to return, yougot frustrated and lost money. You just could not seem to find the grooveyou once had. You increased your share size and started keeping moreovernights to get the home run to get you back to even. Eventually, youraccount started draining and you needed that home run more than ever.Of course, it never came.
Or you may be at the next stage. You are in a trading room. Maybe youhave had a seminar or two. You see the plays. You see the strategies. Youare excited because you see the trades work right in front of you. It’s notlike reading about someone’s past conquests in a book, you are seeing thestrategies in play, but you are having one of several problems. You justcan’t pull the trigger on a play. You might be trying, but are always just alittle too late, so you either chase it to your detriment or you miss the play.Or, you seem to always pick the loser. You pick it first and then are gunshy the rest of the day. Or you might get the winner and sell it fast only towatch the room go on to hold it for a big winner. This is a commonphase. You have to ask, how did some of the others get beyond this, whyor how did they get in the play?
Alternatively, you may fall into another category. You are really startingto feel good. You are getting in the plays and starting to hold somewinners. You are developing a real sense for getting out of the losers justin the nick of time. You are starting to grow your account. But, just then,you find a mistake comes along. It takes you back to where you were.Hmmmm, you say, you won’t do that again. You don’t. But, low andbehold, another mistake comes along—a different one, but with the sameresult. However, you are getting smarter now and you keep eliminating

those mistakes. If you do, you are one of the ones who make it to the nextstep. If not, you spend a long time in this phase trying to rid yourself ofmistakes, but just can’t do it. Eventually you will, but it becomes a racebetween getting these final touches down and making your account last.
Finally, those who make it get a feeling of calm in the morning. Whileyou always have enjoyed trading, it is now relaxing rather than nerveracking. You look back on all those rules you learned and realized theywere all that was needed. You just needed to know how to follow them.You just needed to really get it right the second time. Experience hascome in and developed your sense of art for trading. Where all thetechnical analysis in the world tells you a stock will hold at this supportlevel, you get a sense that it will not, so you are ready to get out quickly,and it saves you. You take a loss on a good trade in stride and take theplay again the next time it comes up because it was a good play.
How long does it take to get through this process? Many time estimateshave been given. I believe my experience is typical of many. My feelingof calm came over me after about 9 to 11 months of trading full time. It ishard to say; everyone is different. So what do you do to get through thesesteps? Well, if you are here reading this, you are already through the firststep. You are getting training in a system and a discipline. It won’tguarantee success, but it will almost guarantee failure if you don’t get thehelp, or at least ensure a long learning period that takes lots of capital.
If you are in the second phase, where you just can’t get involved ormake the plays work for you, you need to do several things. Attend atrading seminar to learn the basics in a classroom fashion. Follow anonline trading room closely and absorb what is being done. Watch for awhile, paper trade, and finally trade small shares. Start with risk amountsof $50, then move to $100, $150, $250, etc., only upon successfultrading at each new level of risk. Learn and build confidence withoutburning through cash.
Develop a trading plan and play only the stocks that fall into your plan.When you play them, make up your mind to play them. Get in first, sellin stages where you have determined to, and follow your stops. You mustbe able to trust yourself first. You must track your trades, using a strategytracking spreadsheet. Eliminate mistakes; track all the data regarding your

trades and follow a plan.If you pick losing plays all the time and just can’t figure out why,
consider that it may not be bad luck. Perhaps you have a mindset forpicking what you consider to be the safest play at a calmer time of daythat is easier to enter. But consider also, maybe things are not as theyseem. Is this really safer, once the market is quiet, once people are lettingyou buy the stock? Think about it. You may be attracting plays that aredestined to lose. Many plays that require early entries during hecticmarket times admittedly are anything but calming but can be among themost successful.
I always want to promote reducing risk as much as possible in trading,though some of you may be too far on the other extreme. Recognizetrading has inherent risks and some of them cannot be eliminated. Afamous entrepreneur once said: “Not many people will pay to see a highwire act where the tight rope is only one foot off the ground. . . . why?Because there is no risk, and without risk, there can be no reward. . . .”
If you have made it to the next stage, have realized some rewards, andare doing well but just can’t get the account up due to a few problems,consider this analogy taken from the great American sport of baseball.Consider a batter that hits .333 for any season can name his price inbaseball. Anyone who does this year after year will be Hall of Famematerial and be among the highest paid athletes on the planet. Considerthat a batter who hits .250 will be sent back to the minors that year unlesshe has a great glove, or is a pitcher. Now consider this. The differencebetween .333 and .250 is one hit in three times at bat versus one hit infour times at bat. That means that for every 12 times at bat, the superstargets one more hit than the minor leaguer. Consider how many hits oftenare the result of a ball passing just inches from a defender’s glove, adefender who could have been playing one step out of place. Considerhow many outs were the result of hitting a line drive shot that happenedto be right in a defenders glove, one who never even saw the ball coming.
What is the point? Just this. Sometimes you are very close to beingsuccessful, but that 1 in 12 hit is eluding you. If you had a few bad trades,maybe you have eliminated them. Maybe you were very close to notbeing in those trades. You just need to fine tune, don’t lose focus, and let

your senses develop. The plans and rules keep you in the game while youare learning and keep you in for the long term.
Remember that a seminar, or any kind of instruction, no matter howexcellent, is only information. The process of taking that information andtranslating it to a workable system demands hard work, experience, anddiscipline on your part. Most people do not understand this, and of thosewho do understand, few are actually willing to commit the hard work. Ofthose, even fewer have the needed discipline.
The hardest thing for me, of course, is to try to communicate all of thisto you. This is not an easy profession. Many of those who learned totrade in the late 1990s are gone. Many fooled themselves. They mistooklearning a difficult profession with just riding a bull market. They couldbe sloppy and it would not matter. It was just a matter of time before thestock came back. Many traders never even knew how to short. Whywould they? The market will never go down.
Since then we have experienced a record fall, a substantial move up, andlots of sideways action. Only those who are well educated have playedthese moves correctly. Those learning now are getting all the tools, all thetactics, and waging battle at a time that will benefit them for the rest oftheir lives.
Chapter 2
Lessons on Some Basics
What Market Is That Again?The market is full of terms like the Spoos, the futures, the Dow, the e-minis, the HOLDRS, the cash market. If you are new to trading, hearingall these terms may be enough to make your head spin. All you wanted toknow was how the market was doing. What do all these terms mean?
Well, let’s start from the top. The “market” generally means the wholestock market. There are three main exchanges that trade the vast majorityof all stocks. They are the New York Stock Exchange (NYSE), theNASDAQ Stock Exchange, and the American Stock Exchange (AMEX).While the numbers change, the NASDAQ currently is the largest withabout 3,300 stocks trading. The NYSE is next with about 2,700, and theAMEX last with about 800.
However, it is more common to view the market through the eyes of anindex. This is a list of the larger key stocks that are thought to berepresentative of the market itself. Some indices you might have heard ofare the S&P 500, the NASDAQ 100, and the Dow Industrials (Dow).
The S&P 500 is widely regarded as the best single gauge of the U.S.equities market. It is a representative sample of 500 leading companies inleading industries of the U.S. economy. Although the S&P 500 focuseson the large-cap segment of the market, with over 80 percent coverage ofU.S. equities, it is also an ideal proxy for the total market. To view theactual price and chart of the S&P 500, you put in the symbol for the cashindex. For example, on Realtick, that symbol is $INX.X.
The NASDAQ-100 index includes 100 of the largest domestic andinternational non-financial companies listed on the NASDAQ stockmarket based on market capitalization. Index reflects companies acrossmajor industry groups including computer hardware and software,telecommunications, retail/wholesale trade, and biotechnology. To view

the actual price and chart of the NASDAQ 100, you put in the symbol forthe cash index. For example, on Realtick that symbol is $NDX.X.
The Dow is an index of only 30 stocks, thought to be a cross section ofour entire market. It often is used as the representative of the U.S. marketglobally. It is maintained and reviewed by editors of The Wall StreetJournal. For the sake of continuity, composition changes are rare andgenerally occur only after corporate acquisitions or other dramatic shiftsin a component’s core business. To view the actual price and chart of theDow, you put in the symbol for the cash index. For example, on Realtick,that symbol is $DJI.
Note that there can be overlap. Intel Corporation (INTC), for example,is in the NASDAQ 100, S&P 500, and the Dow.
There are also HOLDRS and ETFs, which often are confused.HOLDRS (spelled correctly even though it is pronounced as ‘holders’) isan acronym for Holding Company Depositary Receipts and are servicemarks of Merrill Lynch & Co., Inc. They are securities that represent aninvestor’s ownership in the common stock or American DepositaryReceipts of specified companies in a particular industry, sector, or group.In other words, they are traded like a single stock but in most casesrepresent ownership in several stocks in a sector. Common HOLDRStraders use BBH for the Biotech sector and HHH for the Internet sector.
ETF is an acronym for Exchange Traded Fund. Each ETF is a basket ofsecurities designed to track an index (stock or bond, stock industry sector,or international stock), yet trades like a single stock. There are more than120 ETFs, and the most commonly used are the QQQ, SPY, and DIA.These are the ETFs for the NASDAQ 100, S&P 500, and DowIndustrials.
In addition to the above, there are also futures. A futures contract is anobligation to receive or deliver a commodity or financial instrumentsometime in the future, but at a price that’s agreed upon today. Peoplecommonly think of futures in corn and pork bellies. But futures have alsobeen developed for financial markets. As you might guess, there arefutures for the NASDAQ 100, S&P 500, and the Dow. To view, thesemust be permissioned to receive futures quotes (talk to your broker).Symbols on Realtick during this timeframe were /NDM4, /SPM4, and

/ZDU4, respectively (the S&P Futures is the one that carries the nickname‘Spoos’). Note, the last two characters ‘M4’ represent the month and yearof the future and change every quarter.
The most popular financial futures contracts were set up as new tradinginstruments by reducing their size. This set up is a series of productsknown as the e-minis. They are available for the NASDAQ 100, S&P500, and the Dow. Their symbols are /NQM4, /ESM4, and /YMM4respectively. They are popular due to the reduced size and requirements.
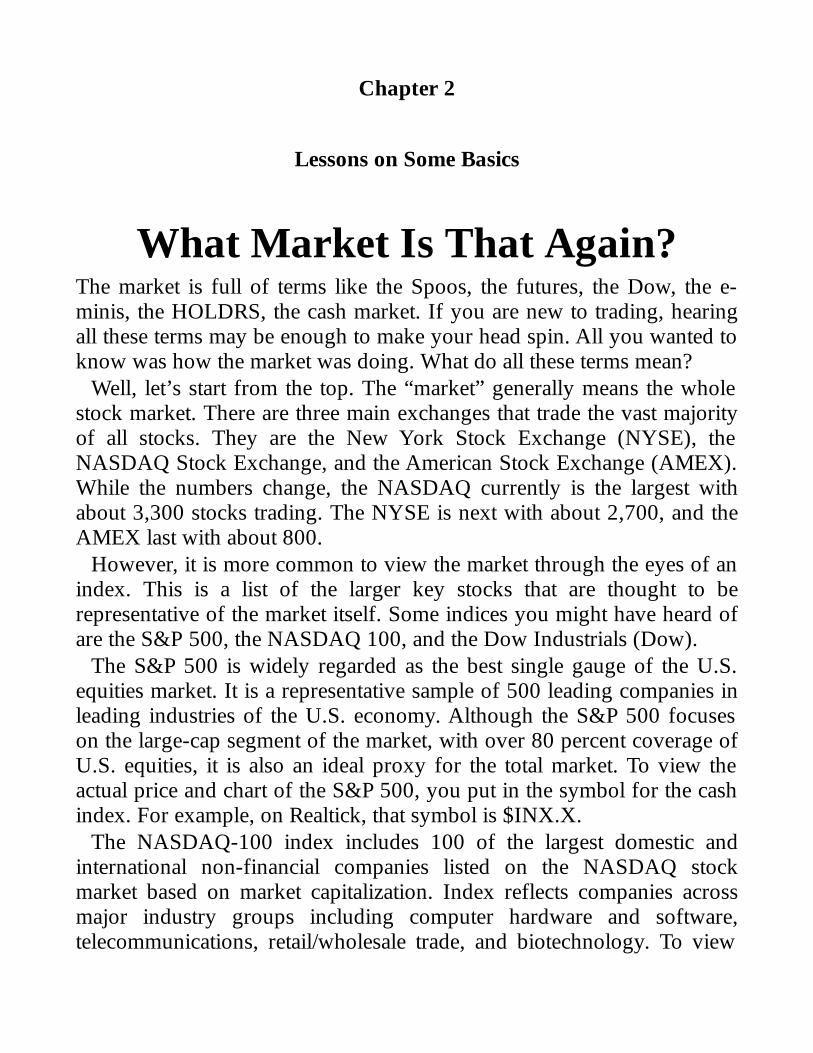
So, how many ways could you view the S&P 500? Well, there is thecash index ($INX.X), the Exchange Traded Fund (SPY), the future(/SPM4), the E-mini future (/ESM4). Is there any difference in the chartpatterns? Well, they are all tied to the same underlying instrument, theprice action of the S&P 500. So, at the end of the day, the chart patternsall will be similar. However, depending on what is happening in themarket, the intraday price action may vary slightly as one of these maybegin to move ahead of the others. Figure 2-1 shows four different waysto view the S&P.
Figure 2-1To view charts in color go to: www.traderslibrary.com/TLEcorner
So when you hear someone say ‘the market,’ they likely are referring towhatever they last discussed, or they may be just using the term in ageneric way to describe the action of all stocks. There often will be verydifferent patterns when you compare the NASDAQ to the S&P 500, orany other individual sector. Sometimes they will look similar. However,whatever instrument you use to view the S&P 500, be it the cash index,the ETF, the futures (‘Spoos’) or the E-minis, they will look similar at theend of the day because they are all viewing the same instrument, thatsame basket of 500 stocks.
I hope this helps to clarify some of the terms and gives you a better ideaof what you want to be looking at.

Looking at the Big PictureI have often said that no one knows with any certainty the long-termdirection or duration of the stock market. The longer the time frame, theless certainty there is. Even on a day-to-day basis, there is no certainty.We often look to certain patterns to reproduce themselves, but newsevents, earnings, company announcements, upgrades, and downgradesalways make anticipation of market moves a risky business. If you thinkthe stock market will always go up, look at the last few years. Years ofprofits can be taken away in 18 months. What if it takes 40 years to returnto those levels? At that time, they can once again say that the trend isalways up, but will that be meaningful to you? Look at Japan over the last20 years. Nothing can be taken for granted.
So why do we study the pattern? What can we gain if all the study in theworld still falls short of any kind of certainty? There are very validreasons to keep an eye on the direction of the market and individualstocks.
First of all, while even the short term (three to five day) outlook cannotbe predicted, certain patterns do give us the low risk entries to strategieswe use. Take for example a market or a stock that has been in an uptrend(we can always define and find the trend by looking at charts and thehistory of prior price action) and pulls back for a few days to an area ofsupport. Then on that day, it gets the strength to close over its open price.Whether you play the market or a particular stock that shows the samepattern (and many will), this often draws a line in the sand where we canplay strategies, knowing that the current day’s low is the support uponwhich we are relying. That will be the stop for the play. The target usuallywill be far larger than the stop, as it looks to challenge or exceed priorhighs when in a trend. Patterns often do repeat, like on the chart in figure2-2, a daily chart for Zimmer Holdings.
Figure 2-2: Zimmer Holdings (ZMH)To view charts in color go to: www.traderslibrary.com/TLEcorner
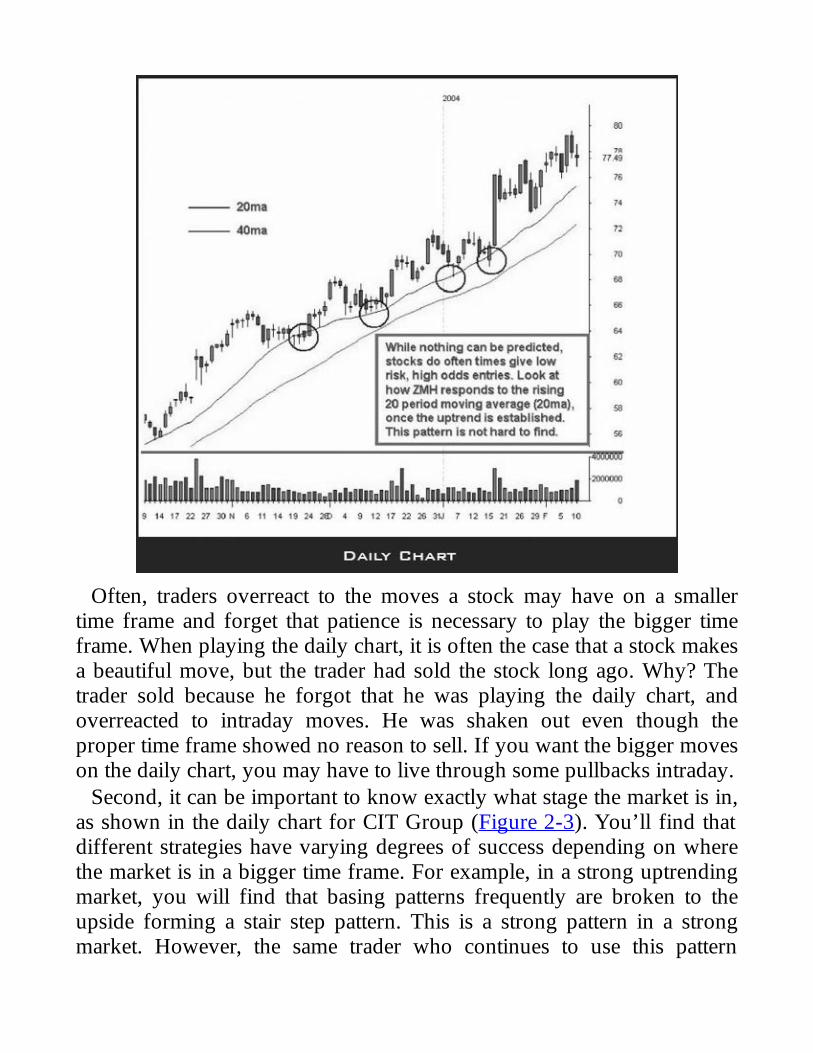
Often, traders overreact to the moves a stock may have on a smallertime frame and forget that patience is necessary to play the bigger timeframe. When playing the daily chart, it is often the case that a stock makesa beautiful move, but the trader had sold the stock long ago. Why? Thetrader sold because he forgot that he was playing the daily chart, andoverreacted to intraday moves. He was shaken out even though theproper time frame showed no reason to sell. If you want the bigger moveson the daily chart, you may have to live through some pullbacks intraday.
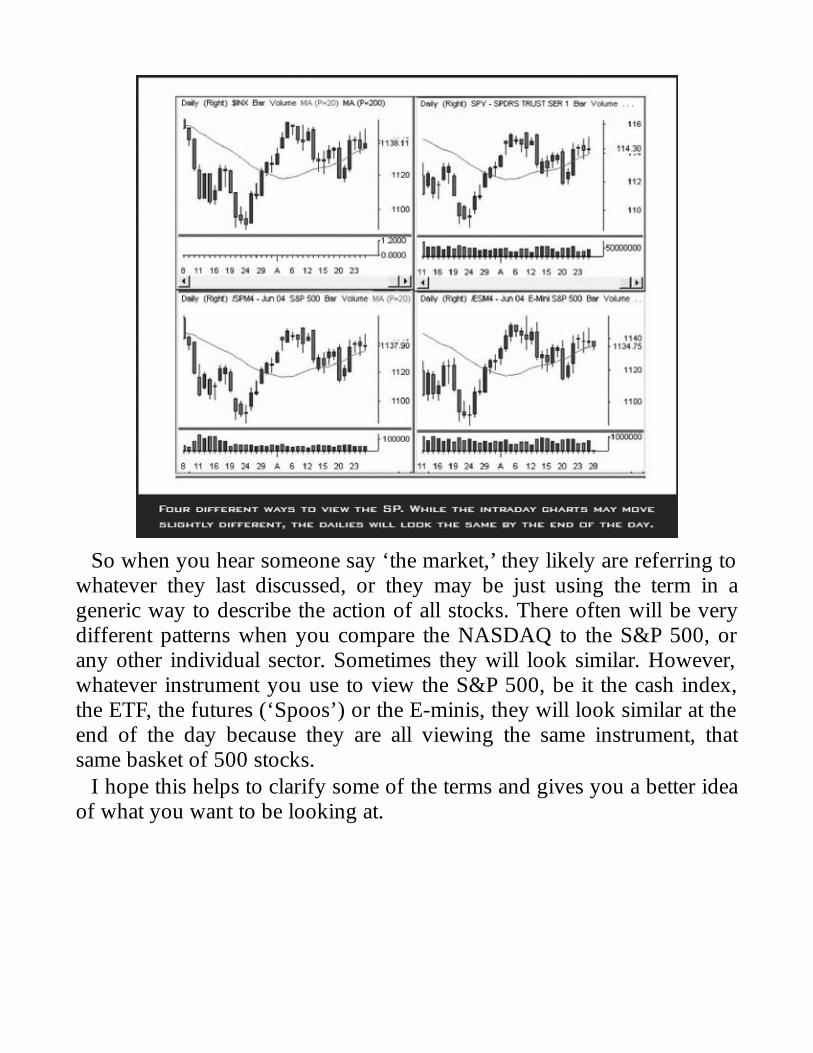
Second, it can be important to know exactly what stage the market is in,as shown in the daily chart for CIT Group (Figure 2-3). You’ll find thatdifferent strategies have varying degrees of success depending on wherethe market is in a bigger time frame. For example, in a strong uptrendingmarket, you will find that basing patterns frequently are broken to theupside forming a stair step pattern. This is a strong pattern in a strongmarket. However, the same trader who continues to use this pattern

without recognizing that the market has now lost momentum and is in abasing phase will not have the same success. Traders will find thatbreakouts do not carry as far or they start to fail and become losses.
Figure 2-3: CIT GROUP (CIT)To view charts in color go to: www.traderslibrary.com/TLEcorner
Let me provide a real life example. At a recent mentorship, a studentarrived who had been very successful over the prior six months, but washaving great trouble the last few weeks. He was a good student who had agood trading plan and liked to play basing stocks. He had a great feelingof success after playing basing stocks in a market that was movingstrongly in one direction. He became a little complacent and did notcontinue to track his results and strategies. He did not notice that hisfavorite play was no longer providing profits. When asked, he felt that hisbasic strategy was still his most successful, even over the prior fewweeks. Looking deeper, it was revealed that this was not an accurate

statement based on his trading record. He felt it to be true, because heremembered only the success of that strategy. Many of us do this.
How could the trader have avoided this? He needs to understand hisstrategy and know when it is best suited for the current market. Second,he should keep an eye on major trends in the market and any change intrend to reevaluate the strategies that he is currently using to avoid theproblem. Also, if he continues to track his results and strategies, he’llnotice the change in success rates of the different strategies he uses as themarket changes. I don’t mean just long or short. I mean which particularstrategy to be used when you are long and how aggressive to be with thetargets. Is it appropriate to go for new highs or 40 percent retracements?Is it best not to trade that time frame at all based on the strategies in yourtrading plan?
So how does a new trader begin to understand the basics of the currentmarket trend? Let me give you a few guidelines that hold true at anyexperience level. Moving averages are always a good guide forestablishing the current trend. Are the 20ma and 40ma rising or falling? Isthe price above or below the 200ma? Is the 20ma above the 40ma? Arewe in a pattern of higher highs and higher lows or are they starting toeven off, showing the potential for a base to form? Are the Wide RangeBars (WRBs) green or red, and do they hold their moves or are theyreversed?
Many traders like to be market gurus and make bold predictionsregarding the market. I think it is a wiser choice to follow a plan, playproven strategies, and always keep a close eye on what the market hasdone to help you determine your best course of action in the future. Haveseparate accounts for wealth building (swing and core positions) and forincome producing (day trading and guerrilla positions) so you can cash inon the bigger moves.

A Guide to Protective Stop LossesProtective stop losses. You have read about them. You have been lecturedabout them. You still don’t use them properly. What do you do? Thepurpose of this lesson is to go into more detail and say more than just“you must use them.” I will try to explain why you may not be usingthem properly, and give suggestions for new ways to use them.
Let’s get a few facts out first. Fact number one: most traders do notmake it in the long term, especially those who do not get training. Factnumber two: most traders who fail do so due to not following their stops.Fact number three: your goal is to get to the point where you follow stopslike a reflex, just like you would jump out of the way of a speeding car.There is no in between. Either you follow them or you don’t. I will offersuggestions to reach this goal, but they are not substitutes for this goal.You must accept that you have a flaw and that it needs to be fixed.
What is a stop loss? It is a line in the sand, right? A spot which ischosen to represent the maximum loss on a trade? Not completely. Mostpeople don’t realize that the stop loss comes from the chart. Dependingon the play, some may have tight stops and some may be wide. Youreally need to know the stop first, so you can play the right number ofshares so your maximum loss on a trade is within the limits you have setin your trading plan You can’t change the stop because that would violatethe integrity of the play. You can adjust your share size to make thepotential loss within your limits. You can pass on the play if it does not fitinto your plan. You may not realize it, but this is the first step infollowing your stop. Have a trade and share size you can live with.
Consider trader Jane. Once upon a time she bought a stock as it brokeout from an all-afternoon long base. Her stop was below the low of thebase. The stock started up, and then pulled back to the base. Then thestock fell below the base, then below the stop. In disbelief, Jane just froze.This was a perfect set up; it just couldn’t fail! Now the stock reallyplummets. She can’t sell now; obviously, it can’t go any lower. Shedoesn’t want to sell at the low of the day. So she hangs on. The stockstarts to come back. It rallies back to the base, then back above. It turnsout to be a big winner.
This is a problem for Jane. In my book Tools and Tactics for the MasterDay Trader, I call this “winning the wrong way.” It does not matter howmany times Jane now loses money by violating her stops. She will alwaysremember this one winner. That is the way the mind works, it rememberswhat it wants. In the Pristine Method® trading room, we are big onteaching the tracking of trades and printing charts and identifyingmistakes. By doing this you would know that, most of the time, violatinga stop results in more losses. Jane may go on violating stops because sheremembers only that one time—the one time her loser became a winner.
Consider trader John. Maybe you can relate to his story. He goes longon a stock. It never goes quite right. The futures start slipping. His stockhits his stop. He does not sell it because he feels he is an experiencedtrader and his stock deserves a little more room. After all, his stock isholding up well, it is just the futures that have slipped. If they come back,surely his stock will do well. If he sells now, it is likely to come shootingback. And because he is in the trade, it is worth a little more investment togive it a chance. Does this sound familiar? The stock does not come backmuch, and John starts looking at his stop. He realizes that his stop wasawfully tight, and just a little bit lower is a major area of support. So hemakes that his new stop. Of course, that stop comes close, and he nowlooks and realizes that the low of the day is not far below, and that will besolid support. That will be the final stop.
Of course, as that stop gets violated, John starts thinking that he can’tsell it now: it can’t get any lower, and it is due to bounce. Besides, thedaily chart has support in this area. Finally, in some truly sad situations,John may start looking up the fundamentals of the company. He hastaken a scalp off of a five-minute chart and now has an investment. Howdid this happen? Does any of this sound familiar? Looking back, thatoriginal stop was not such a bad idea.
So what do we do? First, as we have discussed previously, have atrading plan. You need to have outlined how many shares you can tradewith a stop loss at a certain point. This strategy ensures that you aretrading with a share size that allows you to take a loss when needed.
Second, have your plan and all of your rules in writing. Your planshould be very specific. It should be written as a promise to yourself.
Your mind responds differently to the written word. It truly does. Youmust write and review your rules and keep a top 10 list every week. Ifyour rule is simply to always follow stops, but it is not working, try this:
1. I will sell all of my position at my written stop loss every time.2. If I am too foolish to do the above, I promise I will sell half of myposition.3. I will then sell the back half of my position at the next support levelthat is violated.4. If I am too foolish to do the above, I will sell the last half at the lowof the day.5. If I am too foolish to do the above, I will sell the last half at the endof the day.6. If I am too foolish to do the above, I will quit trading.
By selling half, it lets you get into the habit of doing what is right, whileappeasing the terrible place in your mind that does not want to be a loser.You will find it easier to sell half. Once you sell half, your mind will startthinking properly again. If you cannot get rid of the back half, you mustsell by the end of the day. Never hold a loser overnight. That is a careerstopper.
In summary, have a trading plan. Define what you are allowed to loseon a trade. Define what your share size can be on a trade. Define whatyour goals are so your subconscious knows what being a loser is. If youare three for seven in winning trades but you made money, are you aloser? Write your rules and learn to follow them. Sell half for now if youcan’t sell it all. You must get to the point where stops are automatic andreflexive. Finally, never, never take home a loser.
Always remember, that there are many people who held positions from$250.00 all the way to $10.00 or lower over the last three years. Didpeople intend to do this? Did they use plays with $240.00 stops? Ofcourse not. Most of them entered a day trade with a tight stop, and did nothonor the stop when it hit. Once that happens, it becomes harder andharder to sell at any level. This is why we call the stop an ‘insurancepolicy.’ Do not ever let this happen to you. If the market falls for the next12 months, where will you be exiting your swings? Are you sure aboutthat?

Trading the First Half HourA large number of the questions I receive often revolve around tradingthe first 30 minutes of the day. This only stands to reason as the openinghalf hour usually provides plenty of volatility. The large amount ofvolume that comes during this period means that a trader must be veryorganized and have his system functioning properly. This time periodoften provides major moves for many stocks. Depending on the day, themajority of the move and volume may come to the stock during thisopening half-hour. The purpose of this lesson is to provide you withsome basic information to help you get organized during this time.
The open can be very profitable if played correctly. This is whereguerrilla tactics and other strategies that utilize gaps in the opening ofstocks come into play. A few things need to be understood first. First, theopen often has very little to do with the rest of the day. Overnight, ordersare being filled, market makers are positioning to capitalize on themorning, and trading during this time can be very whippy. It usually is ariskier time to enter longer-term positions. So the first rule is to stick tostrategies that are designed for the opening, such as guerrilla tactics, gapstrategies, and intraday tactics.
Understand that the saying “amatures open the market and professionalsclose the market” has some truth to it. It often is riskier using swing typeentries that occur during the first 30 minutes. Using support andresistance (see Chapter 5) and the ten o’clock Reversal Time (discussedlater on page 59) can be the source of many good plays. Don’t be on thewrong side of these.
The second important rule is to be very organized. Traders often askhow it is possible to follow so many stocks during the opening minutesand still make intelligent plays. The truth is that though there may bemany stocks on your watch list, many stocks on the gap list, and manystocks in the news, you simply cannot follow all of these during theopening minutes. Pick your favorites from your watch list and from thegap list. If you are going to play early, focus hard on just a few. Decideahead of time what the stock must do for you to take a play. Don’t chaseanything you miss during the opening.
One tip to help you follow multiple stocks is to have an area set up onyour page with several 5- or 2- minute charts. Or, you could also set upan opening page that consists largely of 5- or 2- minute charts. Thesecharts are very helpful in determining at a glance how all the stocks inwhich you have an interest are acting. However, you will still have to pickyour favorites to watch during the opening minutes. If you ever had thefeeling of constantly flipping from one stock to the next and always beingbehind the play and never making a good entry, this may be yourproblem. You will be much better off if you pick a few favorites andfollow them for the exact entry that you are seeking.
The third rule is to make sure that your system is working properly andcan handle the high volume demands of the opening minutes. Manypeople who have a hard time entering plays during the open do not evenrealize that they may be behind and seeing ghosts on their screen. Hereare a few tips. Understand what is the most reliable source of data on yoursystem. For example, if you’re using Realtick, a time and sales window ora chart usually will show the most accurate data. Next comes the LevelOne screen, which is the top part of your Level Two screen. The slowestand the least accurate will be the Level Two screen itself. So if there is aconflict between any of these prices, understand that trading may be veryrisky.
If you are having serious speed problems in the morning, considersetting up a page just to handle the opening minutes. This page shouldcontain minimal items. Use just what you need to view a few stocks andmake a trade if needed. You could have just one Level Two screen, a timeand sales window, and a handful of 2- or 5-minute charts, including achart of the futures and the TRIN (the trader’s index). Set this page toopen automatically. In case of a lock up, you will go to this page onrestart, rather than the page that caused the lock up.
If you have access to more than one computer, consider using yourfastest computer for trading and dedicate it to your trading software. Ifyou have access to more than one high-speed Internet connection,consider dedicating your fastest connection directly to your tradingcomputer. You can network any other computers to your secondaryInternet connection.

Many people ask if they should even try to trade the first 30 minutesbecause of the evil market makers and the volatile moves. If you are atrader, the answer is that anything can be profitable if you understandhow it trades. The first 30 minutes can be the best time of the day.
Fundamental vs. TechnicalEver since the first mathematician plotted some sort of graph thatcompared price to time, there has been a debate about whether pricepatterns or the basics of the underlying security are better predictors ofprice movement.
Investors who believe that fundamentals are the primary reason to buyand sell stock are relying on the underlying economics of the businessitself, the industry, and the economy as a whole. They look to things likethe balance sheet of the company, earnings reports, and raw materialsupply. They look at the experience and depth of the company’smanagement. They look at economists’ outlook for the industry. Theylook at the prime rate and if the government is likely to cut rates. Theytend to hold for a longer term, primarily because the things on which theyare basing their decisions do not change overnight. Most fundamentalistswould agree that they would not buy AMZN in the morning and sell it inthe afternoon based on fundamental reasons.
Traders who believe that technical analysis is the primary reason to buyand sell stocks are relying on three beliefs. Technical traders, ortechnicians, believe that the price is a total reflection of all forces in themarket, and this includes all economic and fundamental information.They believe that prices move in trends and are repetitive, sometimes in apredictable way. They believe that people’s emotions are a large drivingforce in prices, and these patterns can be seen in charts. Technicians willhold stocks for a variety of time periods, from a small part of the day toweeks or months. However, they do not believe in the buy and holdphilosophy.
I have given you a quick summary of both approaches. However, I amnot going to deceive you. I am going to show you why I believe thetechnical approach to be the superior one. When I started, I went throughthis same dilemma, as I am sure many of you have, believing that onlyfundamentals are the way to buy and sell stocks. Later, I believed thatonly technical analysis was the way to go. Usually, when dilemmas likethis hit, we land somewhere in the middle. However, for me this is not thecase. I believe technical analysis is the best and only buy and sell

indicator.Notice above that I used the term “investor” for the fundamentalist, and
the term “trader” for the technician. This is a reflection of the longer-termoutlook you must have when using fundamentals. Due to the manychanging things in the market place, we believe that the concept of ‘buyand hold’ no longer is valid. There are several reasons, but consider thefollowing. Years ago the major companies were more industrial. Theyhad big plants that required big start-up costs. No one could open acompetitor to General Motors overnight. It took huge resources. Today,many of the biggest companies are high tech, producing computers,related devices, and software. This technology changes quickly andalmost anyone can enter the field with a good idea and some creativity. Itis the concept that two kids in a garage can bring a company to its knees
Was there money to be made in Internet companies in the 1990’s?There were stocks that literally went from one dollar to hundreds in somecases. They did this on no earnings, no earnings predictions for next year,and on borrowed money. No fundamentalist could justify purchases inmost of these. Yet technicians had a field day.
Even if you do believe that fundamentals should figure into theequation, how do you handle the realization that we really don’t knowwhat the fundamentals are? The Enron debacle has opened the eyes ofmany investors to what has always been the case. Companies can twistthings any way they like. What information can you believe?
Despite belief to the contrary, it is the technical trader who has less riskthan the fundamental investor. In all things, we can be more certain ofwhat will happen tomorrow than we can of what will happen next year.Technical traders sell losing positions as part of their philosophy.Fundamental investors hold under the belief that all is well until thefundamentals that were the basis for their entry change. It brings up aninteresting question that many fundamentalists have a hard timeanswering. Just when do you enter a stock based on fundamentals? Whendo you take profit? When do you cut your losses and move on? Theanswers to these questions usually are random numbers, or they simplydo not exist.
I believe in making decisions from charts. My core trades, which are

designed to last weeks to months, may be long term, but still get theirprimary buy and sell signals from charts. You will find that fundamentalinformation usually is reflected in price changes in the stock before it isreported as a fundamental change. It is not that technicians believe thatfundamentals are wrong; it is simply that we believe they already are builtinto the charts.

News You Can Use?So, you have decided to be a day trader. What is the first step (and oftenlast) for the new day traders? Why, turn on CNBC and wait for the news,of course (don’t deny it, you have been there). Then when you hear thelate breaking real-time news, you buy good news (or sell short bad news)in an attempt to beat the other 8 million listeners. Sound like a winningplan?
After realizing that this is a hit or miss approach, you decide to fire upthe real real-time news service. Of course, at this point, it hasn’t dawnedon you. It is not just the fact that you are not really beating anyone to thenews. You begin to realize that even if you do have the news first, whatdo you do with it?
Have you ever heard of a stock gapping up big on fantastic earnings,then selling off for two weeks? We have all seen it: good news reacted toin a negative way and bad news reacted to in a positive way. Or, goodnews reacted to in such a positive way that the stock gaps so far you arenot sure what to do. How do you make sense of all this?
First of all, you may just want to turn off the news. Yes, that is correct.You can track the stocks that are in the news for your watch list if youlike. However, you can skip the part about researching the news. Thisdoes not sit well with many traders. They believe it is their job to researchthese things. The truth is that you cannot. We play people’s reactions tothe news, not our personal view of what the news is. We do this bylooking at charts.
Next are some examples. Two of them resulted in plays. Look at whathappened compared to the news. These three were picked because they allsolicited a strong view from many traders, even by email. “Did you knowthat xyz had bad news today and you are playing it long?!”
Below is a chart of McDonalds (Figure 2-4). The day in question isDecember 24, 2003. You may remember the mad cow scare that day. Allfast food restaurants gapped down, and the overwhelming consensus was(even CNBC told me this) that this scare is the end of the Americanhamburger. It would be a no-brainer to short these stocks, as they arecertain to fall more.

Figure 2-4: MCDONALDS CORP. (MCD)To view charts in color go to: www.traderslibrary.com/TLEcorner
Well, if they are certain to fall more, why didn’t they open at that lowerprice? You see, there are no gifts. The news was out and was digested (nopun intended) by the public. What the stock does after that is not afunction of good or bad news. It opens at equilibrium—and then themove can be in either direction. This chart pattern (without any concernfor the news) was bearish, but it did not form a pattern that we recognizeas a trade. No play was made, though there were possibilities for intradayplays once the trend was set. Notice how long the bad news continued tohurt the stock. Why did it go up? Who knows? Well, there were manycommentators and analysts who told us the answer after the close. One ofthe stories was that the shock sent beef prices tumbling, which wouldreduce the operating costs of fast food restaurants. Now why didn’t Ithink of that?
Next, a daily chart for Marathon Oil (Figure 2-5): here, there was littlechance for failure.
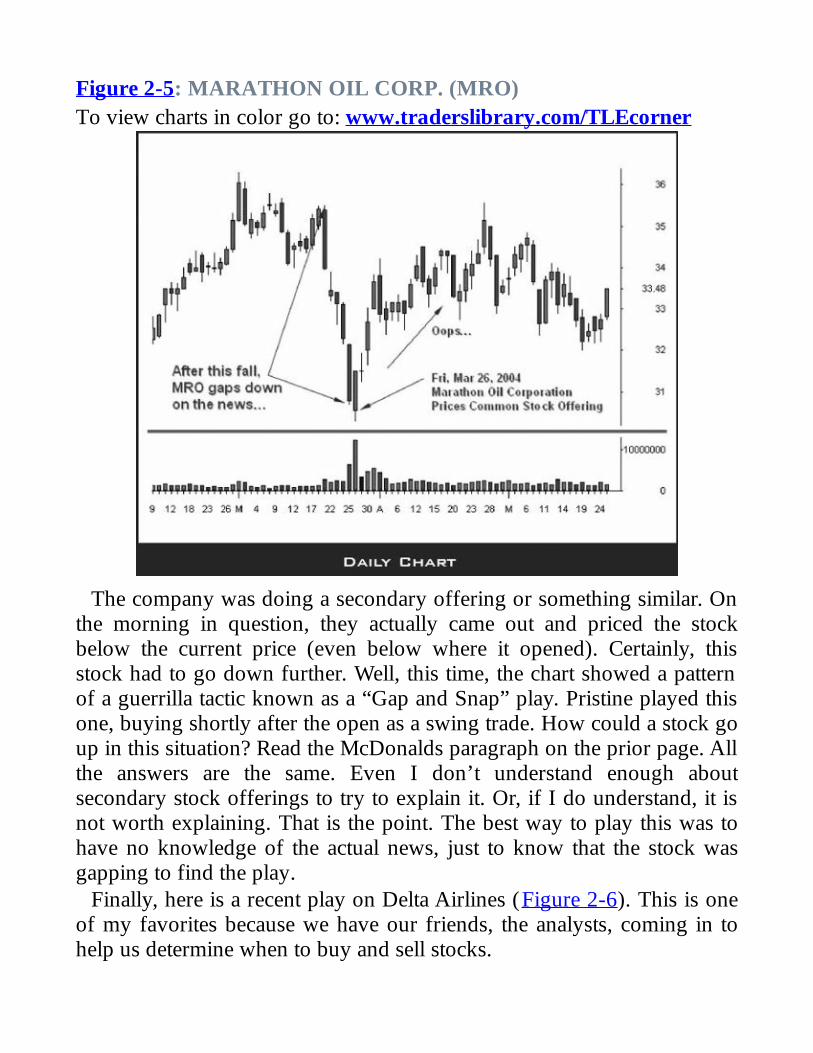
Figure 2-5: MARATHON OIL CORP. (MRO)To view charts in color go to: www.traderslibrary.com/TLEcorner
The company was doing a secondary offering or something similar. Onthe morning in question, they actually came out and priced the stockbelow the current price (even below where it opened). Certainly, thisstock had to go down further. Well, this time, the chart showed a patternof a guerrilla tactic known as a “Gap and Snap” play. Pristine played thisone, buying shortly after the open as a swing trade. How could a stock goup in this situation? Read the McDonalds paragraph on the prior page. Allthe answers are the same. Even I don’t understand enough aboutsecondary stock offerings to try to explain it. Or, if I do understand, it isnot worth explaining. That is the point. The best way to play this was tohave no knowledge of the actual news, just to know that the stock wasgapping to find the play.
Finally, here is a recent play on Delta Airlines (Figure 2-6). This is oneof my favorites because we have our friends, the analysts, coming in tohelp us determine when to buy and sell stocks.

Figure 2-6: DELTA AIRLINES INC. (DAL)To view charts in color go to: www.traderslibrary.com/TLEcorner
On May 10, the big news posted that Delta may have to file forbankruptcy. Is the stock worthless? Or is it worth asset value? That day,the stock did not go below $4.53. On the next day, we have a revision ofDelta Airlines’ outlook to negative. The day after that, Moody’s decides itmay cut Delta’s ratings. The stock talks bankruptcy, and then analystsdowngrade it. Do we need to pay analysts for this keen information andinsight? Note the stock has never traded under the low set on May 10, theday the news of bankruptcy was released. Notice the volume that came inon that day. Notice that this volume came in after the stock alreadydropped 66 percent in four months. Now, Mr. Analyst, you aredowngrading the stock? Where were you during this huge fall? Waitingfor the company to tell us they are in trouble? This stock was played as aswing long by Pristine on May 12 at $4.67.
Note the last news item on May 20. DAL gets upgraded. Most swingtraders come home to find the stock upgraded, and at $6.02. This means it

has rallied 33 percent off of the lows.News will move stocks. It can be a means of finding stocks to watch
and see if any technical patterns form. Do not get caught up in the gameof trying to make trades based on your analyses of the news. For moreinformation on how news is used in trading, see the following lesson.
News and Your TradingAs we’ve discussed, news is always a controversial topic. Good tradersmay disagree about the extent to which they use news in their trading.Fundamental traders may use news heavily. Purely technical traders maynot use it at all.
I want to walk you through a little exercise I do at my Mentorships. Iusually ask how many people have real-time news. Typically about halfthe students raise their hands. I then tell them they are wrong, whichusually gets funny looks. I then explain that the only real time newsoccurs in a closed office, when the accountant tells the CEO that they arein trouble. Everything after that is old news. By the time the appropriatepeople in the company are told, memos are typed, plans are made,families and friends are told, a press release is put together, and damagecontrol people are brought in . . . well, you get the idea.
We see this every day in the chart. A stock drops for two days, or hascrashed during the last hour of trading. News is then released the nextmorning. Were those all just good traders getting out? Well, if they usecharts, the likely answer is, “yes.” In the beginning, people who haveheard something are getting out.
There is no doubt that news moves stocks and markets. Earnings,interest rate adjustments, sentiment numbers, acquisitions, and CEOsleaving all make for moves. The question is, can you profit by playing thenews after it is released?
Try the following exercise. Let’s say you are sitting at your tradingcomputer after hours when company XYZ is going to release earnings.You have a super news service that will get you the earnings numbersubstantially before CNBC gives it. Let’s say it is even early enough tomake a trade. You want to go long or short depending on the earnings.Ready? Earnings are up 25 percent over last year, the biggest increaseever for company XYZ. So what button do you hit, Buy or Short? Buy,you say? What if earnings were expected to be up by 40 percent? Thiswould be built into the price, and 25 percent may be a disappointment.
Many of you realized that already. So let’s say you are there again,ready to trade the announcement. This time you are armed with
knowledge that expectations were for 22 percent, and they did 25 percent,so they beat the number. Now do you buy? If you buy now, what if I toldyou there was a whisper number, an expectation that is not as published,but built into the price by the analysts? Does your buy still sound like abuy?
So you were aware of that. Let’s get the facts you want to hear. Theexpectations are for 18 cents, the whisper number is for 21 cents, andnow the earnings come out at 25 cents. Now it must be a buy, right? Well,maybe not. What if the daily chart showed a strong 8-day rally into theannouncement? There may not be news good enough to stem the tide ofsellers. This is a typical buy the rumor and sell the news scenario.
What if a stock gaps up $3.00 in the morning on good news? Let’sforget the role of market makers for a minute and their need to exaggerategaps. Just consider a stock’s value, if there is such a term. If it is up on$3.00 on real good news, should it head higher or lower? The truth is thatit is neutral (if you ignore market makers). After all, the news has beendigested by all that are going to buy or sell it, and all the bids and offersare placed, the stock has opened $3.00 to the plus. This is the equilibriumpoint—the spot where all buyers and sellers at that moment have decidedthe stock could open. Could there be buyers waiting to buy on a dip?Could there be sellers waiting to sell on a rally? Of course. However, wedo not know which—that is the issue.
There are appropriate uses of news. If a stock is gapping up, it is goodto know if it was acquired for cash. It won’t be moving much if it was. Itis also good to know if an analyst upgrade moved a stock that alreadywas up substantially. They often have other motives for talking up astock; so, it is nice, but not necessary to know. Scalpers can play the rushinto news for small moves if the news is timely. Some traders havelearned to fade news, letting good news run a stock up, and shorting thefall. However, the trader is playing the chart for a scalp set-up. The realvalue of news is that it can serve as a big watch list. Start to follow itbecause it made the news, but play it based on the chart patterns that youhave learned to play. Technicals can confirm the news you hear.
Remember, as traders, we don’t trade stocks, we trade people. We don’ttrade news; we trade the reaction to news. Keep this in perspective and

follow your trading rules.

Are You Still Investing?Are you still investing? Should you be? Well, it may just be our choice ofwords, but we believe the term “investing” is no longer a valid term.Now, don’t get me wrong. We firmly believe in being diversified overdifferent times, and that includes the longer term. We have core positionsthat theoretically could last forever. What is the difference between a longterm core position and investing? Simple. Our core trades always will bemanaged and sold if they do not maintain certain criteria on the periodchosen. Most people look at investing as a commitment for life, or simplyhave no plans on how to manage. (Right now, do you know what youwould sell for profit or take a loss on any of your investments?). We callinvesting the “Rip Van Winkle” play. Go to sleep for 20 years and whenyou wake up, hope all is well.
Depending on how active you are, you may hold for weeks to monthstaking trades based on the weekly chart or, just for several days based onthe daily chart. It is not unlikely for a stock to be up 20 percent for theyear, and actually make a 20 percent or more move several times on thedaily charts. Rally, then pull back. Look at the daily chart for Yahoo(Figure 2-7), over just a few months. This is not an unusual occurrence.
Figure 2-7: YAHOO! INC. (YHOO)To view charts in color go to: www.traderslibrary.com/TLEcorner

You can see that a nearly perfect bullish move has been erased. Evenwith the best of all entries, all gains are gone. A safer entry, such asbuying the breakout rather than the Pristine Buy Set-up (see Appendix A)on the daily chart would mean that you are now losing money.
By using the daily chart to enter and exit, you would be in and out onthe way up, and out at the top. You would also be making money on thelast couple drops on the way down. You may have lost on one long playat the top, but you would have preserved all of the moves on prior plays.
The first reason for not investing is due to a simple fact. The market andtechnology have changed. Many years ago, the market was capitalized inmanufacturing, steel, cars, etc. It was a safe bet to buy GM shares for thegrandkids. It is hard to put GM out of business. It takes much money andtime and resources like big factories, etc. What about today? Thecapitalization is in services and high technology. Is there a difference?Yes. As we’ve said, today, two kids in a garage can bring a company toits knees.
Second, the world has become increasingly unpredictable with thecontinued threat of terrorism, wars around the globe, and a nuclear threat.These things can turn the market quickly and for long periods. We have

recently seen the affect of this. Volatile markets are here to stay.Third, it was cost prohibitive to trade years ago. Commissions were as
high as $500.00, and some actually higher. The spreads (differencebetween the bid and ask, or the amount you would pay if you bought andsold at market) were usually 3/8ths or in today’s numbers, 37 cents, andas high as several dollars on high priced thin stocks. And how did youbuy a stock on the move? If you had to call your broker (the only optionback then), you would not participate on a quick move up; you wouldend up buying at the end. For that matter, how would you even knowthere was a quick move up? Intraday charts have only been around arelatively short time.
Today, commissions are almost free, $7.00-19.00 compared to $500.00.The ‘spreads’ are now down to a penny in many cases. Real-timeexecutions with direct access platforms mean that you can buy a stock theexact second you want it, in most cases. No calls to the broker. Comparethe difference. If you wanted to day trade 1,000 shares of INTC yearsago, and you made a mistake and wanted to get out immediately, thatmistake would have cost you $1,375.00 or so. Two commissions and1,000 shares multiplied by a spread of 37.5 cents. That is quite a ‘mistake.Today it may cost you only $35.00. That would come from twocommissions at $12.50 and 1,000 shares at a one-cent spread. Looking atit another way, years ago, that 1,000 shares of INTC would have to move1.37 cents just to break even! Day-trading, even swing trading, was notan option.
We have options today that were not available. Becoming a self-directedtrader can be very satisfying even if your only goal is to mange your IRAbetter. The alternative is you can continue to trust your ‘broker’.

Reversal TimesAnytime I am talking to a group of people that are not Pristine traders, Iwill ask how many of them are familiar with intraday reversal times. Iestimate less than 10% of the people raise their hand on average, andthose that do are only familiar because they remember reading about themin Tools and Tactics for the Master Day Trader . When I tell the groupthat I consider trading intraday without being intimately familiar withreversal times a ‘huge disadvantage’, most people get interested.
Reversal times are times during the trading day that the market is likelyto stall or reverse the most recent pattern. They can occur because of theway Wall Street functions, and market maker or specialist activity. Forexample, at 3:00 PM EST, the bond market closes. The remaining hour ofthe stock market may take a direction based on the finality of havingbonds closed.
Another example is during the first five minutes of the trading day,from 9:30-9:35 AM, EST. During this time the public’s orders to buy andsell ‘at market’ are being handled by market makers and specialists. It isnot unusual to see big swings in a stock’s price during the first 5 minutes.A high or low may be set in the stock’s price that lasts for most or evenall of the trading day.
Yet another example is the beginning and ending of lunch. The reasonis as simple as the fact that the market makers and specialists go to lunch,leaving junior people in charge to watch things while they are gone. Notonly does this lead to reversal times going into and out of lunch, but alsoa phenomenon known as the ‘doldrums’, where you will find on mostdays, breakouts and breakdowns will fail during the lunch doldrums.
The list of times that should be watched are as follows, all EasternStandard Time (EST): 9:35, 9:50-10:10, 10:25-10:35, 11:15, 12:00, 1:30,2:15, 3:00, 3:30. Of these, the major ones to watch are 9:50-10:10, 11:15,1:30, 2:15 and 3:00. See figure 2-8 for an example of a 5-minute chart ofKLAC.
Figure 2-8: KLAC-TENCOR (KLAC)To view charts in color go to: www.traderslibrary.com/TLEcorner

Notice the areas identified on the chart. The 9:35 reversal time (RT) setsthe low of the day. The Pristine Sell Set-up (see Appendix A) that occursat 10:00 sets a high of the day that lasts until 2:15. It is not uncommon fortraders to purchase during the first 5 minutes and sell into the 10:00 RT.Notice that the ‘lunchtime doldrums’ delivers a ‘false’ breakdown, whichis expected. That leads to a slow rally that challenges the high of the day.The pullback from that rally, now out of the doldrums, sets up a PristineBuy Set-up at 2:15 RT. This leads to a powerful break out, and a newhigh of the day. Naturally, that rally ends at 3:00 RT, which marks thehigh of the day. The high of the day, the low of the day, the two nextbiggest pivots, and the best buy set up all happened at reversal times.
I did not look long or hard to find this chart. Check it out for yourself.Pull up your favorite charts or the market itself and notice the times listedabove. It is not that every reversal time will have a major market move,but notice the major pivots, highs and lows in a stock’s price every dayand you will be amazed how often these major moves happen at or withinone five-minute bar of a reversal time. Just notice how often a 10:30reversal time has set the high or low of the day in the recent market. Theimportance of the various times may change some in different marketenvironments, but if you time your strategies with key reversal times, they

will be all the more effective.

The All Important 200 PeriodMoving Average
Trading is a world of probabilities. There are few things that traders cancount on to happen for sure. We accept that and follow rules that keep uswhere the probabilities lie in our favor.
If there was one thing that I had to pick as an example of a rule thatfollows those probabilities more than ever, it would be the 200 periodmoving average and its power to stop the strongest of rallies, support afast falling stock, and propel stocks to new highs or lows once crossed, ifyou know what to look for.
To appreciate how common these occurrences are, you must appreciatethe research that went into finding the accompanying graphs . . . NONE.Often, in writing a book like this, the author may look hard trying to findthe perfect example. These stocks were picked from a play log over thelast week, and three weeks back for the MSFT chart, because it was a playthat stuck out in my mind.
For the intraday trader, the staples we live by are the 20 and 200 periodmoving averages on the 5- and 15-minute chart. These are the ‘Big 4’.The king of these is the 200 on the 15- minute chart. At Pristine, we havegiven it the pet name of “Hoss” (from “Bonanza” fame, for those of youwho are over 40 or watch PAX TV).
Take a look at the 15-minute chart of IWOV (Figure 2-9), which coversa 2-day trading period.
Figure 2-9: IWOVTo view charts in color go to: www.traderslibrary.com/TLEcorner

Note that on these days, this stock could have been played long byeither one of two strategies. First, the pullback to support a reversal time,10:00 (EDT), or the 30 minute high. Either way, if you were looking fora target to sell all or half of your shares, it was not hard to find. Rule 1: Ifyou are long on a stock that is rallying a distance into the 200 MA on the15-minute chart, exit some or all of your shares (depending on yourstrategy and time frame) at the 200 MA. Notice also that this chart bringsout an important concept. Any moving average of importance must be

thought of as an area of support or resistance, not an exact number. It islike a rubber band, not a glass plate. The fact that this moving averagewas “punctured” is not as important as realizing that this general area willbe one the stock must deal with. Only upon a successful retest and a movehigher after the stall, should you consider the moving average to haveyielded.
All of the charting techniques we use work on all time frames and on allstocks, indices, futures, etc. Take a look at the Semiconductor SectorIndex over the last two weeks (Figure 2-10).
Figure 2-10: SEMI CONDUCTOR SECTOR INDEXTo view charts in color go to: www.traderslibrary.com/TLEcorner
Notice that on May 10 the index took out the prior day’s high duringthe first 15 minutes of trading. A sign of power. The astute trader wouldrealize, however, that the combination of a powerful run, right into the200 MA on the 15-minute chart, occurring at reversal time (9:50 - 10:00),was destined to be halted even though it was free and clear of the priorday’s high. While the halt of a rally is common, what happens thendepends on many things. In this case, the stock takes four days torecover.
Notice on May 15, this index makes a late day breakout and rallies hardfor one hour. This is the first time that this index has traded over its 30-

minute high since it encountered the “200-15” three days earlier. Again,stopped cold by our friend. Since astute traders know that the NASDAQindex rarely goes very far without the Semis, those traders involved inNASDAQ stocks were taking profits on the longs both times the Semishit the 200-15.
So, never play a stock to break over the 200-15? No, that is not the rule.Any good swing trade will usually involve crossing ‘Hoss’. It just maytake some time to do it. Intraday traders will usually be out of a stockwhen it hits ‘Hoss’. There are times when stocks can be watched to see itthey break through this mighty average. Notice on the Semi Conductorchart, after attacking and failing to break through on May 15, the indexpulls back to a support level, the base from which it broke out two hoursprior. This base holds and the next day the index is knocking on the dooragain. It took four days the first time, now only about four hours thistime. The index is stronger and now the third time is the charm. Noticewhat happens when it does break through. There is no doubt about it, andit puts on an incredible rally. You will find this to be true quite often. Thisis an example of attacking the 200-15 three times with a shorter time,before attacking every time.
Let’s go back and look at the first chart of IWOV with a few more daysadded (Figure 2-11). Are you curious about what happened to this stockafter failing to break “Hoss” after two attempts?
Figure 2-11: IWOVTo view charts in color go to: www.traderslibrary.com/TLEcorner
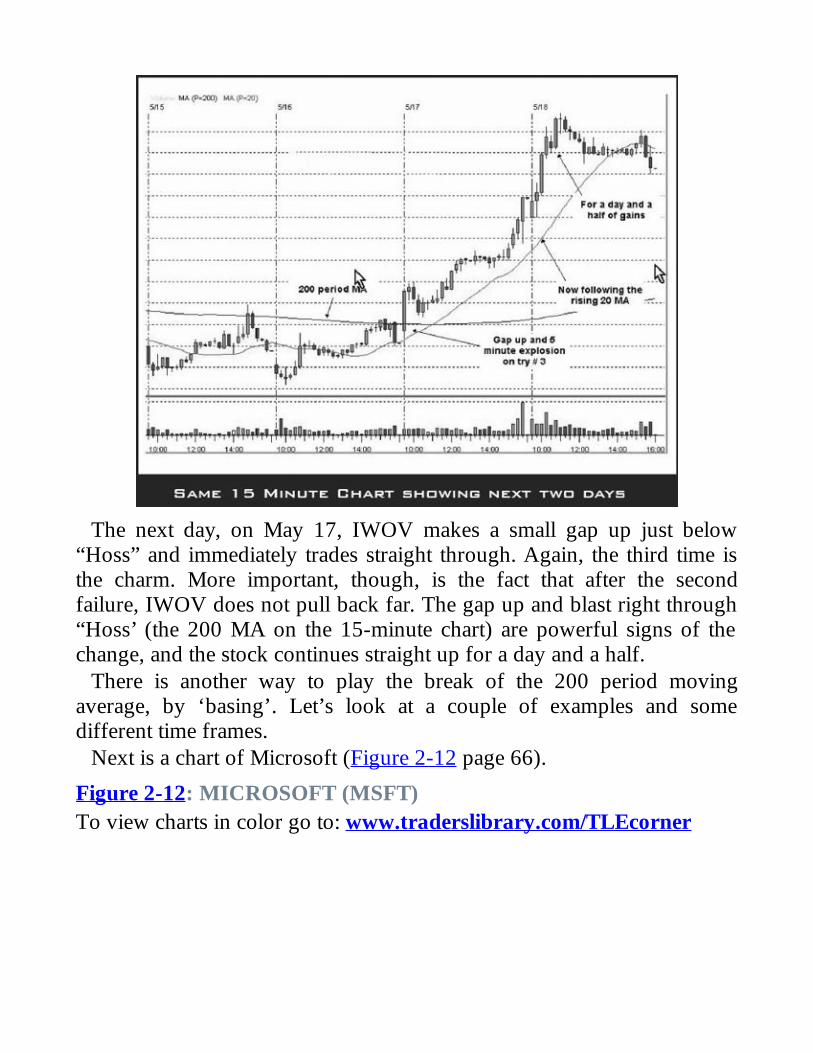
The next day, on May 17, IWOV makes a small gap up just below“Hoss” and immediately trades straight through. Again, the third time isthe charm. More important, though, is the fact that after the secondfailure, IWOV does not pull back far. The gap up and blast right through“Hoss’ (the 200 MA on the 15-minute chart) are powerful signs of thechange, and the stock continues straight up for a day and a half.
There is another way to play the break of the 200 period movingaverage, by ‘basing’. Let’s look at a couple of examples and somedifferent time frames.
Next is a chart of Microsoft (Figure 2-12 page 66).
Figure 2-12: MICROSOFT (MSFT)To view charts in color go to: www.traderslibrary.com/TLEcorner
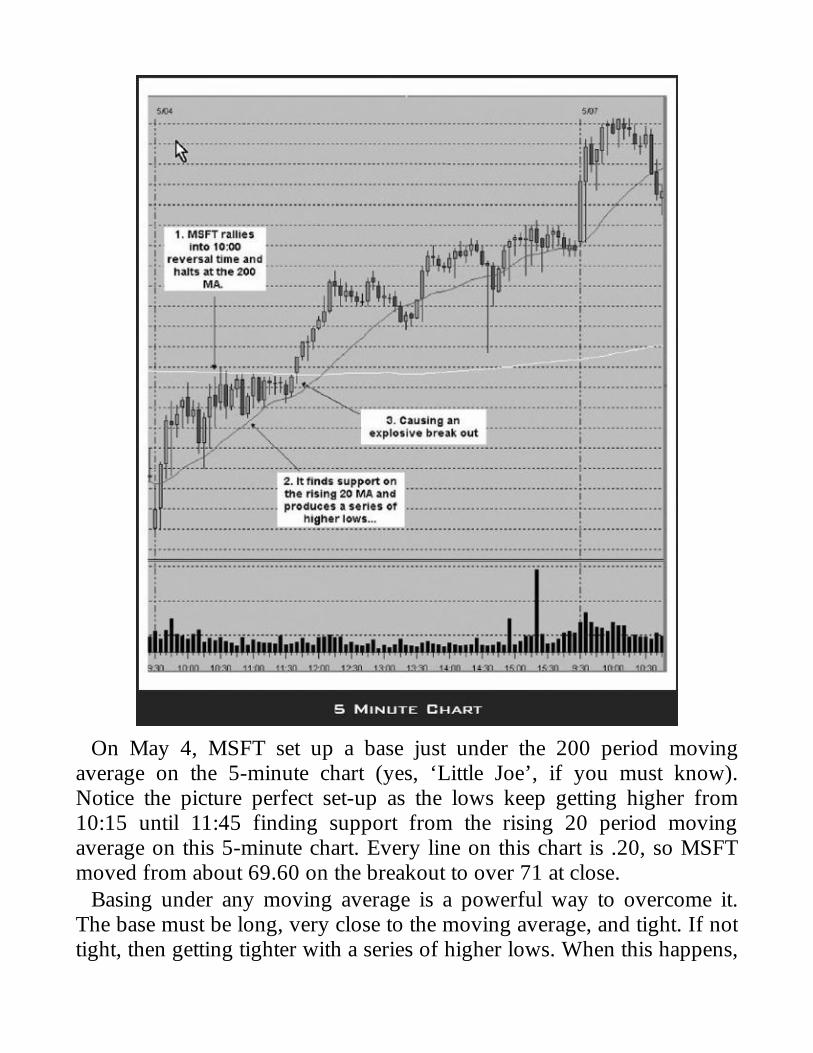
On May 4, MSFT set up a base just under the 200 period movingaverage on the 5-minute chart (yes, ‘Little Joe’, if you must know).Notice the picture perfect set-up as the lows keep getting higher from10:15 until 11:45 finding support from the rising 20 period movingaverage on this 5-minute chart. Every line on this chart is .20, so MSFTmoved from about 69.60 on the breakout to over 71 at close.
Basing under any moving average is a powerful way to overcome it.The base must be long, very close to the moving average, and tight. If nottight, then getting tighter with a series of higher lows. When this happens,

the break above the moving average is usually a very powerful thing.What was once bad is now good. Yes, all of the above is true, in reverse,for shorts. No, we don’t have any nicknames for the 20 period movingaverages on the 5-and 15-minute charts.
We would be incomplete talking about the 200 period moving averageif we did not include a daily chart with a 200 moving average. Let’s takea look at one more example (Figure 2-13).
Figure 2-13: GETo view charts in color go to: www.traderslibrary.com/TLEcorner
We only need to look back a couple days to May 17 and to the stock,the all-important General Electric (GE). This stock had been basing for 13days just under the 200 period moving average on the daily chart. Thebase was also at the round number, 50. Once the break occurred, thestock was under way. These breaks often take stocks on short term rallies,moving to new areas of the chart.
In summary, the 200 period moving average should be on all of yourcharts. It serves the same function on all time frames. A rally stopper, abig supporter, and often a new trend setter. I hope these examples help

show why sometimes resistance is resistance and, at other times, it is thebeginning of a new leg up.
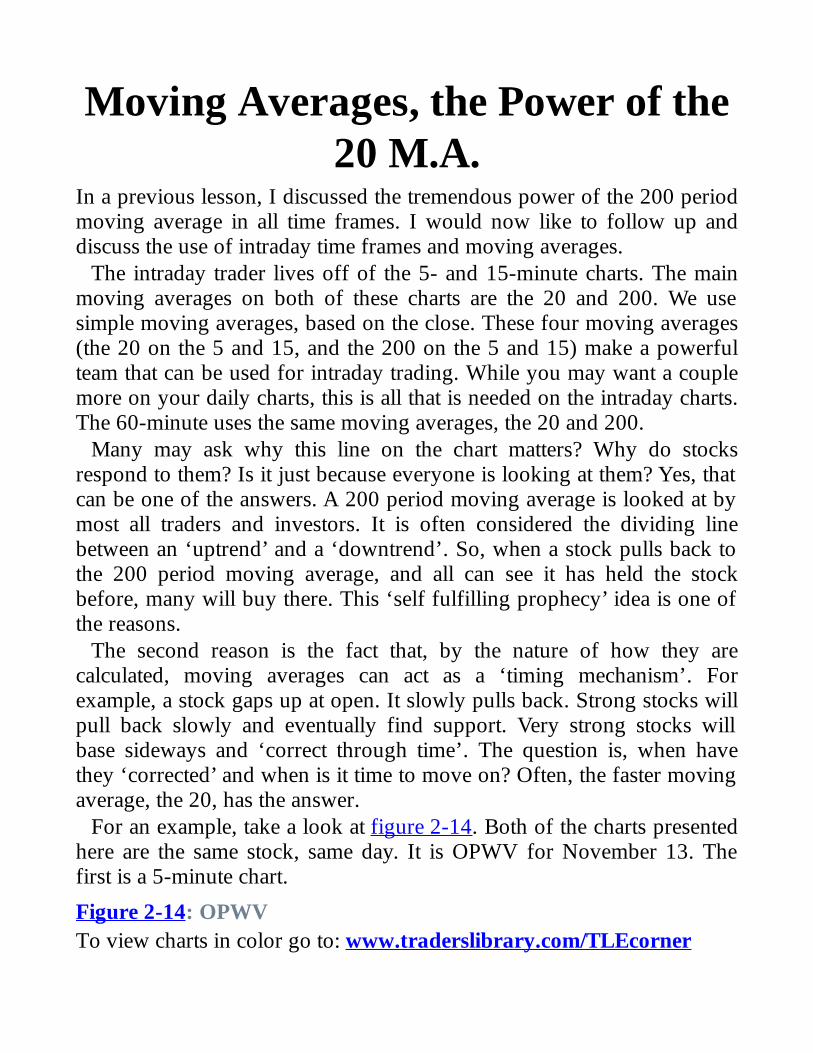
Moving Averages, the Power of the20 M.A.
In a previous lesson, I discussed the tremendous power of the 200 periodmoving average in all time frames. I would now like to follow up anddiscuss the use of intraday time frames and moving averages.
The intraday trader lives off of the 5- and 15-minute charts. The mainmoving averages on both of these charts are the 20 and 200. We usesimple moving averages, based on the close. These four moving averages(the 20 on the 5 and 15, and the 200 on the 5 and 15) make a powerfulteam that can be used for intraday trading. While you may want a couplemore on your daily charts, this is all that is needed on the intraday charts.The 60-minute uses the same moving averages, the 20 and 200.
Many may ask why this line on the chart matters? Why do stocksrespond to them? Is it just because everyone is looking at them? Yes, thatcan be one of the answers. A 200 period moving average is looked at bymost all traders and investors. It is often considered the dividing linebetween an ‘uptrend’ and a ‘downtrend’. So, when a stock pulls back tothe 200 period moving average, and all can see it has held the stockbefore, many will buy there. This ‘self fulfilling prophecy’ idea is one ofthe reasons.
The second reason is the fact that, by the nature of how they arecalculated, moving averages can act as a ‘timing mechanism’. Forexample, a stock gaps up at open. It slowly pulls back. Strong stocks willpull back slowly and eventually find support. Very strong stocks willbase sideways and ‘correct through time’. The question is, when havethey ‘corrected’ and when is it time to move on? Often, the faster movingaverage, the 20, has the answer.
For an example, take a look at figure 2-14. Both of the charts presentedhere are the same stock, same day. It is OPWV for November 13. Thefirst is a 5-minute chart.
Figure 2-14: OPWVTo view charts in color go to: www.traderslibrary.com/TLEcorner
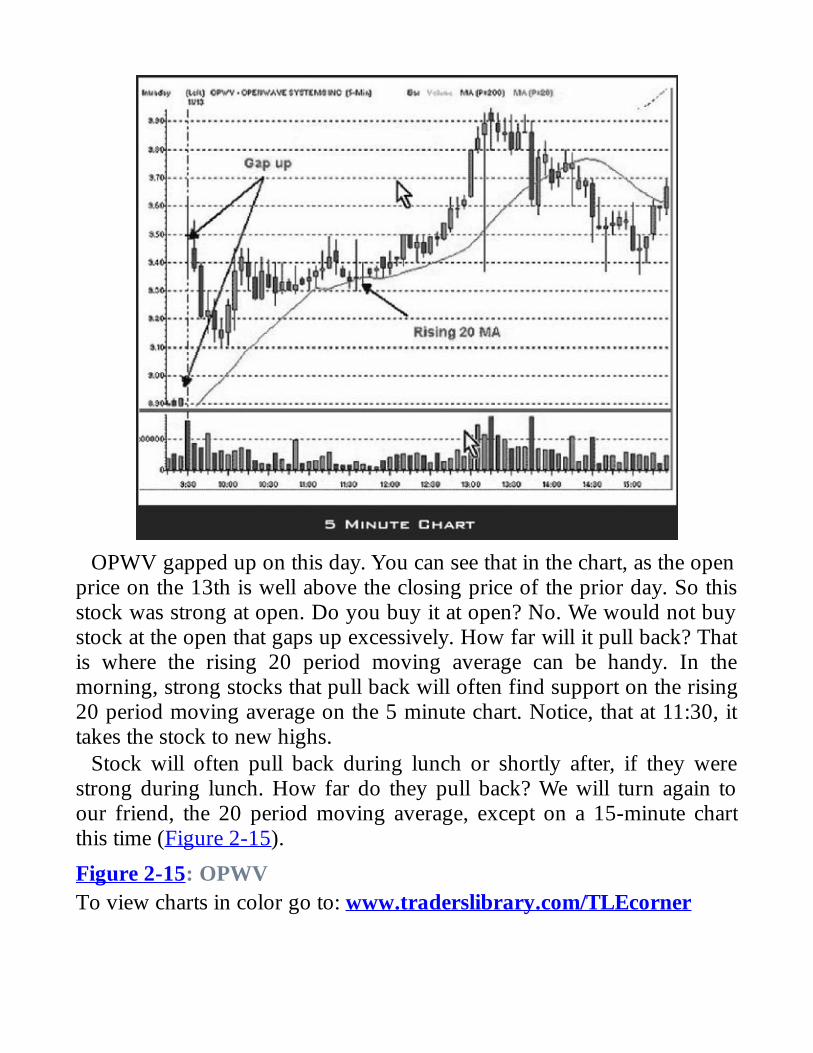
OPWV gapped up on this day. You can see that in the chart, as the openprice on the 13th is well above the closing price of the prior day. So thisstock was strong at open. Do you buy it at open? No. We would not buystock at the open that gaps up excessively. How far will it pull back? Thatis where the rising 20 period moving average can be handy. In themorning, strong stocks that pull back will often find support on the rising20 period moving average on the 5 minute chart. Notice, that at 11:30, ittakes the stock to new highs.
Stock will often pull back during lunch or shortly after, if they werestrong during lunch. How far do they pull back? We will turn again toour friend, the 20 period moving average, except on a 15-minute chartthis time (Figure 2-15).
Figure 2-15: OPWVTo view charts in color go to: www.traderslibrary.com/TLEcorner
Notice this is the same stock, same day. Look again at the first chart, the5-minute. We can see at 3:10 that the stock found support, but howwould you know? Well, look at the chart above. You can see that it wasthe 20 on the 15 that was the support. In the afternoon, strong stocks thatpull back will often find support on the rising 20 period moving averageon the 15-minute chart. Note that this pushed the stock to new highs andcontinues into the next day.
A few points to make. First, it is not hard to find these examples. Ilooked at my plays from yesterday and the second one I checked wasOPWV. You will find examples of these, many times and both in thesame day, like here.
Second, notice on the 15-minute chart that at 3:10 the price did gobelow the moving average, forming a ‘tail’. This is natural. Remember,moving averages are not like pieces of glass that will break if touched.They are more like rubber bands. They are areas to be watched. Amoving average is not the ‘entry’. It tells you to watch for the entry.
Third, notice how multiple time frames come into play. For even better

direction on longer term plays like day trades or even swings, look for thesame moving averages on the 60- minute, or hourly, chart.
I hope this has provided you with some insight on how intraday chartsand moving averages can help your trading.
A Return to Some BasicsIt is a common and true cliché in many fields. Look at successful footballdynasties. The ones that last beyond a one-season wonder always haveone thing in common. They became successful by returning to basics.Nothing could be truer in the world of trading.
In trading, it is often the basics that elude many traders. They get sowrapped up in so many fancy indicators and techniques that they ignorethe necessary elements that they first learned by being so critical. This isespecially true in the current market. Knowing both the macro and microstages of the current market, and what strategies and targets would beapplicable for that market, should be a part of every trader’s daily routine.
Many get so involved looking for specific patterns in only one timeframe that they do not even consider that the pattern may be best leftalone this week. Many do not even know or understand the concept oflooking at multiple time frames. This concept requires that to get the oddsin your favor, you want to have both the ‘macro’ time frame and the‘micro’ time frame pointing in the same direction.
Having a plan of what you want to do every day is critical. Assessingyour money management and deciding how much should be risked inuncertain environments in both long and short-term accounts is crucial tosuccessful trading.
How do you try to increase your odds in taking plays? Look for the bestentries on plays that focus on the current environment. Below is anexample of a trade from the stock ‘MRK’, which was posted as a buy at53.10 January 28, 2003. It was sold on the gap up on January 30, 2003 at55.75 (Figure 2-16).
Figure 2-16: MEREK & Co TRADE (MRK)To view charts in color go to: www.traderslibrary.com/TLEcorner
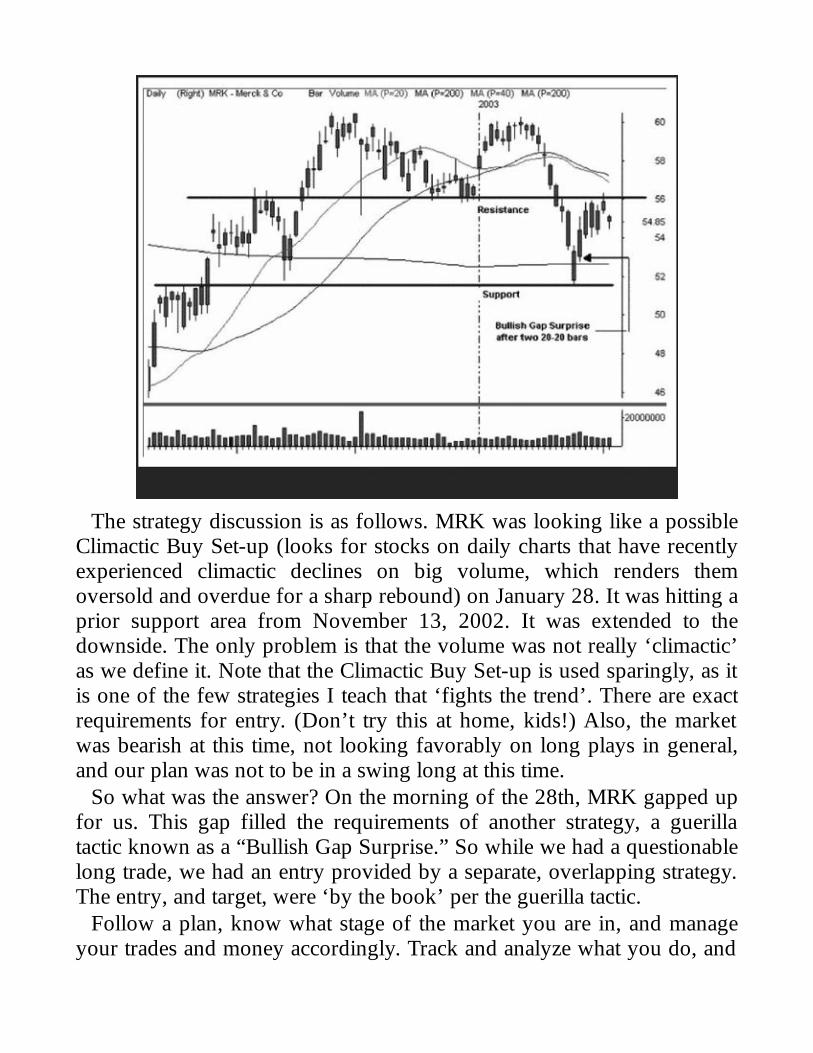
The strategy discussion is as follows. MRK was looking like a possibleClimactic Buy Set-up (looks for stocks on daily charts that have recentlyexperienced climactic declines on big volume, which renders themoversold and overdue for a sharp rebound) on January 28. It was hitting aprior support area from November 13, 2002. It was extended to thedownside. The only problem is that the volume was not really ‘climactic’as we define it. Note that the Climactic Buy Set-up is used sparingly, as itis one of the few strategies I teach that ‘fights the trend’. There are exactrequirements for entry. (Don’t try this at home, kids!) Also, the marketwas bearish at this time, not looking favorably on long plays in general,and our plan was not to be in a swing long at this time.
So what was the answer? On the morning of the 28th, MRK gapped upfor us. This gap filled the requirements of another strategy, a guerillatactic known as a “Bullish Gap Surprise.” So while we had a questionablelong trade, we had an entry provided by a separate, overlapping strategy.The entry, and target, were ‘by the book’ per the guerilla tactic.
Follow a plan, know what stage of the market you are in, and manageyour trades and money accordingly. Track and analyze what you do, and

remember to always return to the basics.

Chapter 3
Lessons on Managing
Managing a TradeThe title of this lesson really encompasses many topics. I want to focus onthe criteria here that determine your profit-to-loss ratio and share size.While this is not the first step in picking a trade, it is the most important.
Let’s look at the whole process. You are scanning charts for trades. Youshould be looking for pictures of your favorite strategies. Once you find apicture that matches a strategy in your trading plan, you want to ensurethat elements such as futures timing and relative strength are in placebefore you make the trade. All these topics are important and worthy ofdiscussion. For now, I want to focus first on determining if the trade isworthy based on the trades expectancy (the potential gain versus thepotential loss) and how to determine share size.
Once you have a trade in mind, the chart can help you determine wherethe logical stop loss point and the potential target would be. These thingscome from the chart and are fixed. They cannot be moved aboutrandomly. They are dictated by the rules of your strategy. Therefore, youwant to make sure that the ratio of potential profit to potential loss isfavorable. It may vary with the strategy, but you want at least a one-to-one ratio or, preferably, a two-to-one. Sometimes, you can find muchgreater ratios.
Let’s take an example. You find a Pristine Buy Set-up (see AppendixA) on a daily chart. You like the picture. Following the rules of thestrategy, you would seek to buy over yesterday’s high. Let’s see what theexpectancy would be. The stop would be under yesterday’s low. Lets sayyesterday’s bar was not very narrow. The resulting stop may be $2.00. Ifthe stock was not in a Stage 2 uptrend, your target may be limited to a 40percent retracement from the recent high to the current pull back area.Let’s say that number ends up being $1.50. You would be risking $2.00to make $1.50 (expectancy 1.5/2 = .75). This is not a good idea unless
you had a history of being almost 100 percent successful with this trade.This is why narrow range days are good on Pristine Buy Set-ups and
why Stage 2 uptrends also are good. In a better set up, you may find atarget of $3.00, and if the prior day had a range of only $1.00, the stopwould be only $1.00. This would be a $1.00 risk for a possible $3.00reward, based on the chart and the strategy for the stop and target. That isa three-to-one expectancy and a much better ratio.
If you do not like the trade, you may pass. You may not change thetarget or stop at random just to make the expectancy number work. Manynew traders make that mistake. The expectancy is built into the chart.
What is a good expectancy? It may vary depending on your style oftrading. It will also vary with the chance of success on a particular play.For example a micro scalper (someone who trades large shares for 10cent profits) may go with a one-to-one expectancy because he is right 80percent of the time. Many longer-term traders are successful only 40percent of the time because the expectancy is three or more to one on longterm plays. For example, they go for $12.00 while risking $3.00, forexample.
Once you know the expectancy is good, you may decide to enter thetrade. In that case, you must decide on the number of shares. Manypeople play a fixed number of shares. Many vary the size with the priceof the stock. These are not good formulas if you want to maximize thechances of making money in the long term. I suggest you decide on thenumber of shares by keeping the risk the same on each trade. To do this,you need to know your stop loss and the maximum amount of loss youare willing to take on a trade. This maximum loss number derives fromyour Trading Plan. Simply play the number of shares that allow a stop tohit your fixed, predetermined maximum loss amount. If you want to keepany one loss to $300, and the stop loss on this trade is 50 cents, then youneed to play 600 shares. A 50-cent loss on 600 shares would be $300.This brings every trade to an equal footing no trades are riskier except forthe stock volatility and the difficulty of getting out at the stop number.
These ideas should be part of every decision to enter a trade. Note thatunder this method, you cannot even enter a trade until you determine thestop, because you would not even know how many shares to play. Now,

once you’ve entered the trade, then you must decide how long to hold it.

Dealing with DisasterHolding trades overnight has certain benefits and risks. I consider itnecessary for a trading plan to have a Wealth Building Account for swingand core trades, which would all be overnight holds. So, following yourtrading plan and playing the proper share size are very important. If youare careful, over time the benefits should outweigh the risks. However, nomatter how careful you are, you will have a morning where a positionyou have is gapping open against you.
Remember, there are no stops overnight. Let us say you are long onXYZ at $30.00 and, at 7:00 AM EST the next morning, company XYZmakes some announcements. Let us say they are going to miss their nextearnings number, the CEO just resigned, and they suspect they haveaccounting problems.
There is a good chance (about 99.99 percent) that when trading startsthe next morning at 8:00 A.M. EST (pre-market trading starts with ECNsat this time) that your stock will be trading much lower. Let’s say at 8:00it starts trading at $26.00. From 8:00-9:30 it ranges from $26.00 –$25.00. Then at 9:00 it opens at 25.10. It will not matter that you have astop in place at $28.50. During pre-market, stops are not in effect. Then,when the market opens, your stop will be filled (if it is GTC-good tillcancelled-or if you re-entered it at open) at the best price at the time—$25.10—not your desired price of $28.50.
So, how do you handle these disaster situations? Here are some tips tobetter manage these situations in the best way over the long term.
First, do not panic. Easy to say, but hard to do unless you have astrategy in place.
Second, ignore the pre-market trading. From 8:00 until 9:30, onlyECNs are trading; some stocks don’t trade at all. If your stock is gappingdown like this, it will likely be trading, but trading erratically.
Third, when the market opens officially at 9:30 EST, do nothing forfive minutes. That’s right, just watch it. After five minutes, mark off thelow and put a stop for half your shares—$.05-.10 under that 5-minutelow.
Fourth, let it trade for 30 minutes. Then put a stop for the other half of

your shares–$.05-.10 under that 30-minute low. At this point, if the stockdid not violate the 5-minute low, you will still have all your shares, halfwith a stop under the 5-minute low, half under the 30-minute low.
You will often find you still have all of your shares, or at least half.Often, after a large gap, the opening half hour puts in the lows for theupcoming days. If your shares do stop, usually you are risking arelatively small amount extra.
From there, you can treat the trade as a swing with a one-day trailingstop, or the stock may rebound to prior levels and you can follow yourprior plan. While the example given was for a gap down on a longposition, the same rules hold true for gapping up on a short position. Use5- and 30-minute highs as stops.
Such a disaster plan will help you minimize the losses over the longterm.

Alternate Swing EntriesSwing trading refers to taking trades that traders intend to hold for two tofive days. Their intent is to capture the meat or a move in a short periodof time. It is not unusual to capture in a few days the same percentagegain that the stock might make all year long. Stocks frequently rally, andthen give back all their gains, leaving the longe-term investor withnothing to show for the move, or even a loss.
We typically look to the daily chart to find patterns that would allow forlow risk entries. Sometimes, we can use an hourly chart. We tend to seekstocks that are in strong trends, staying in or breaking out of bases(consolidations) or occasionally extremely over bought/oversold.
Once we find a favorable pattern, the usual entry involves buying thestock over the prior day’s high, or shorting under the prior day’s low.This is because the prior day’s high or low involves a resistance orsupport area, and breaking this area is a sign of strength or weakness thata trader wants to see before taking a trade. It is the line in the sand thatmust be crossed. This entry criterion often will keep you out of trades thatnever perform and will increase the success rate of those trades that areentered.
For someone who is trading part time, this may be the only option. If atrader works another job full time or is occupied during trading hourstrades can be entered by placing buy and sell stop orders with a broker,and calling to adjust the buy and sell stops once the trade is entered.However, if you sit with the market all day, there are other entries thatyou can use. Some are necessary alternatives that come into play when thestock gaps. Some are used to enhance the possible reward-to-risk ratio
First is the situation that happens when a stock gaps up excessively.Because a large gap up may bring in selling, purchasing the stockimmediately just because it is over the entry price (yesterday’s high of theday) may be unwise. You may be buying the high of the day. There maybe a better entry later. I consider any gap of 50 cents or more (on averagepriced stocks) above the proposed entry (or prior day’s high, whicheveris higher) as excessive and the entry invalid. However, you may still havea play. As long as the stock does not rally hard for the first 30 minutes,
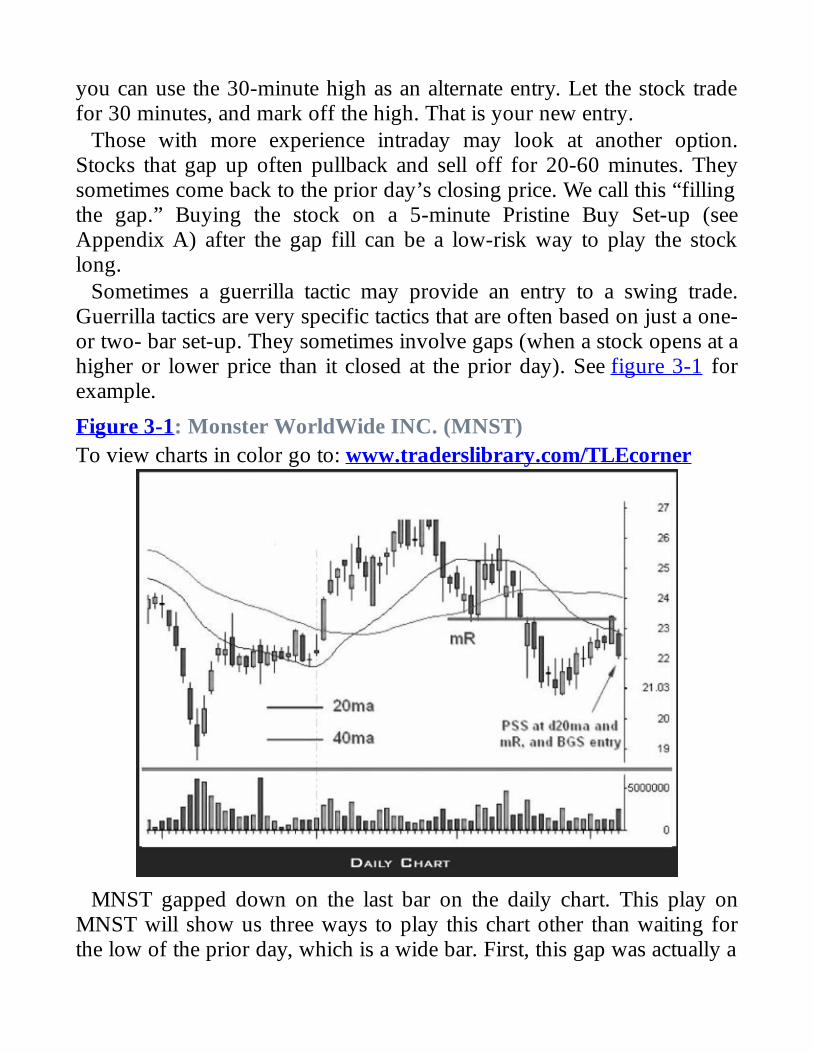
you can use the 30-minute high as an alternate entry. Let the stock tradefor 30 minutes, and mark off the high. That is your new entry.
Those with more experience intraday may look at another option.Stocks that gap up often pullback and sell off for 20-60 minutes. Theysometimes come back to the prior day’s closing price. We call this “fillingthe gap.” Buying the stock on a 5-minute Pristine Buy Set-up (seeAppendix A) after the gap fill can be a low-risk way to play the stocklong.
Sometimes a guerrilla tactic may provide an entry to a swing trade.Guerrilla tactics are very specific tactics that are often based on just a one-or two- bar set-up. They sometimes involve gaps (when a stock opens at ahigher or lower price than it closed at the prior day). See figure 3-1 forexample.
Figure 3-1: Monster WorldWide INC. (MNST)To view charts in color go to: www.traderslibrary.com/TLEcorner
MNST gapped down on the last bar on the daily chart. This play onMNST will show us three ways to play this chart other than waiting forthe low of the prior day, which is a wide bar. First, this gap was actually a
bearish gap surprise; the entry is either an immediate entry or a 5-minutelow, which would have you in very early. While the holding time for theguerrilla tactic is shorter, the trade eventually does trade under the priorday’s low and a swing portion of the position could then be held. Thisentry would be the earliest of them all.
If you did not play that entry, there is another alternative. Sometimes,the prior day’s high is so far away that waiting for this entry will causethe stop to be so wide that the reward-to-risk ratio becomes too low totake the trade. If the stock is otherwise in the area we want to play, wewill look at a 30-minute entry as being an alternative, even if the stockdoes not gap up. This is because it takes a good measure of strength totrade over the high of the day after 30 minutes. While this entry is not asreliable as the prior day’s high, when you consider the increased reward-to risk aspects, it is an excellent alternative.
Sometimes intraday analysis and patterns can give you a similar entry,other than the 30-minute high. For example, if a bullish base sets up, butis under the high of the day, you can use it as a substitute entry. At thispoint, the swing entry is almost anticipatory, and you will want to see thereal entry hit to stay with the position as a swing. Your reward-to-risk canbe greatly enhanced on these plays, which will make up for the fact thatthe entries are not as reliable.
As an example, look at the hourly chart that formed on MNST, below(Figure 3-2). This shows the day after the last in the daily chart shownabove. Here, we are waiting until after the play dropped a bit (or, if youmay not have seen this chart until the bearish entry bar formed). So howdo we get in the next day? This stock looks lower because this is apowerful pattern. Using the current stop provided by the wide bar, thereward–to-risk would be hard to justify. So we can look intraday.
Figure 3-2: MONSTER WORLDWIDE INC. (MNST)To view charts in color go to: www.traderslibrary.com/TLEcorner

Here, four higher lows formed on the hourly chart into the declining20-period moving average (d20ma), as the stock retraced some of thedrop it had the day before. You can short the hourly Pristine Sell Set-upthat formed where the arrow is. This gives a much tighter stop becausethe stop is placed over the high of that small red bar (arrow). The targetthen reverts to the daily chart.
In summary, you need to choose an entry and management style that fitsyour personality and schedule. You should also monitor what you docarefully. It is not uncommon for intraday traders to over manageperfectly good swing positions that are better left alone. Understand alsothat whenever you alter the stop from the daily chart to increase the riskreward, there is a trade-off. The play is more likely to stop, whichdecreases its overall success rate.
The Reward to Risk RatioYou have found a trade that meets the criteria that the strategy requires.What determines if you take the trade? What if there are dozens of thesetrades that you can find every hour that meet the criteria, but you are ableto trade only four, or two, or one? How do you determine the best one?
One of the things you will do is try to find the best examples of qualityin the trade you take. Naturally, all trades that meet your minimum criteriaare not the same. The reward-to-risk ratio is another thing you can look atto determine if you take any particular trade. The reward-to-risk ratio, or“RR” is the amount to be made from the entry to the target, compared tothe amount to be lost from the entry to the stop.
Many traders will demand that the possible RR for a trade be a certainnumber, like three-to-one (going for a three dollar target with a one dollarstop), or maybe even much higher. Certainly you would not risk a dollarto make a dollar.
There is a tradeoff in the RR you pick. Very simply, though the highRR trades sound, and often are, the best, they have the lowest odds ofbeing obtained. So while going for three-to-one sounds better than one-to-one, if you get only the three-to-one trade right one in four times, youare losing money. If you get the one-to-one trade right two out of threetimes, you are making money. Naturally, the one-to-one trade will beeasier to achieve. So you need to analyze every trade based on the RRpresented, and the likelihood that you will achieve that RR consistently.You can determine your odds by tracking your results on a trade over aperiod of time to see how successful you are.
Let’s take a look at a sample trade. Below are the daily charts of CRDNand the intraday 5-minute chart for the last day on the daily chart (Figure3-3). On the last day on the chart, CRDN gapped up.
Figure 3-3: CERADYNE INC. (CRDN)To view charts in color go to: www.traderslibrary.com/TLEcorner

The play is set up properly, and would call for an entry eitherimmediately or over the 5-minute high, with a stop under yesterday’slow. This is the recommended entry and stop. The recommendedmanagement sets up certain odds for the play, and may be desirablebecause it is the best way to manage this trade, or perhaps it is best if it isgoing to be entered or managed while at work. Sometimes intradaytraders find alternate methods of entering and managing the trade.
Whenever you stray from recommended strategies, the odds startchanging. However, if managed properly, the outcome can be moreprofitable. Lets examine the odds of changing the stop from yesterday’slow, to today’s low (today’s low is 33.95). We will use the 5-minute highfor entry. Study the tables in figures 3-4 and 3-5.
Figure 3-4: Scenario 1, By the Book, Yest LOD stop

Figure 3-5: Scenario 2, By the Book, Today LOD stop
In all of these scenarios, we will keep the target the same. The goal hereis to compare entries and RR options. Notice that for every successfultrade, the option using today’s LOD (low of day) stop makes almosttwice as much money. This is based on share sizing so that all trades havethe same risked dollars. (If you use a constant share size, then the losswould be almost half, so the same concept applies.) What this is saying isthat though the odds of this trade stopping out are more likely using thetighter stop, it could stop out almost twice as much and still yield the sameamount of money. So determine if your trades hold the stop at least halfas much using the tight stop. If yes, then it is the better option.
Let’s look at changing the entry criteria (Figure 3-6). A trader may say

that waiting for the 30-minute high will make the trade at higher odds ofsuccess. While this may be true, the RR could change so much at the 30-minute high that it may not make sense.
Figure 3-6: Scenario 3, 30 minute high, Yest LOD STOP
In this case, the 30-minute high is not that far away, so the profit doesnot change much. It is lower, and the question is, will this entry produceenough success to make up for the lower dollars made every time?
Now let’s take a look at entering by combining this with another tactic(Figure 3-7). Lets buy the Pristine Buy Set-up (see Appendix A) on thepullback to support at reversal time.
Figure 3-7: CERADYNE INC. (CRDN)To view charts in color go to: www.traderslibrary.com/TLEcorner
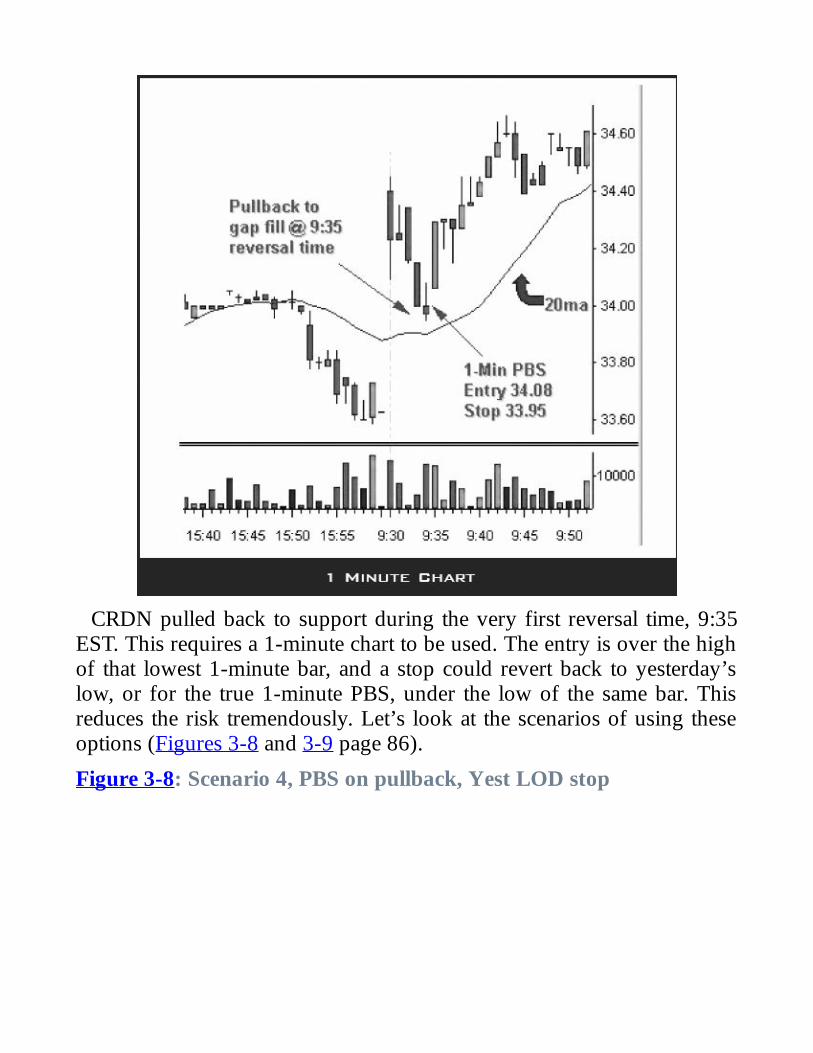
CRDN pulled back to support during the very first reversal time, 9:35EST. This requires a 1-minute chart to be used. The entry is over the highof that lowest 1-minute bar, and a stop could revert back to yesterday’slow, or for the true 1-minute PBS, under the low of the same bar. Thisreduces the risk tremendously. Let’s look at the scenarios of using theseoptions (Figures 3-8 and 3-9 page 86).
Figure 3-8: Scenario 4, PBS on pullback, Yest LOD stop

Figure 3-9: Scenario 5, PBS on pullback, 1 min PBS stop
Using the prior day’s low reduces this profit about the same as using the5-minute high with today’s LOD stop. This is just a coincidence. Takingthe 1-minute PBS with that earlier entry keeps the RR the same eventhough you are now using yesterday’s stop. The drawback is that usingthis entry is no guarantee that the stock will continue to move up. Manymore will stop out.
Last is the ultimate in RR—using the 1-minute entry and stop. This nowcreates 4 to 12 times the profit when the target is hit. The analysis mustnow be made: can the target be achieved often enough under these tightentries and stop criteria to produce more dollars on a regular basis?

Again, tracking your plays under different options will help you tocomplete this analysis for any tactic you choose to study.
Do You Find Yourself TargetChallenged?
One of the greatest challenges in trading comes from getting to targets. Itis one of the most difficult areas both from a technical perspective(finding the right areas on the charts) to a psychological perspective(staying with the trade while the stock achieves that target).
Psychologically, this is perhaps the most difficult area because you maynot even know you have the problem. If you don’t take stops, you seeand feel the pain immediately. You may fix it, or may not, but you knowwhat you have to deal with and you cannot avoid it. If you do a poor jobreaching targets, you may not notice the problem. You may even feel youare doing well because you feel like you have a lot of winners. The onlyproblem is that you have a handful of losers that wipe out all the smallgains. Without tracking and evaluating the statistics on your trades, youmay never realize the importance of this issue. This is where most peoplestand. Let’s take a look at which issues to consider when setting targets.
Unless you are breaking to new highs, you will always encounter somelevels of resistance. The question is, at which point will the supplyovercome the demand? You need to examine the quality of the trend andthe quality of the current breakout. Next, you have to look at the qualityof the resistance you are encountering.
First, consider the quality of the trend—or the price pattern beingplayed. Different price patterns leading into the play will have differentpower to drive the stock. Strong uptrends and downtrends are always nicehere because they will go through the first areas of supply and demand.After all, an uptrend is a series of higher highs and higher lows. Longbases and wide range bars also help provide the momentum to continueprices through congested areas.
Second, the type of breakout that happens can help fuel the stock in theshort term to overcome areas of supply and demand. Here, stocks thatcreate shocking or surprising moves can fuel a stock through supply ordemand areas. Examples are, stocks that gap out of long bases orprofessional gaps that go against the current trend.
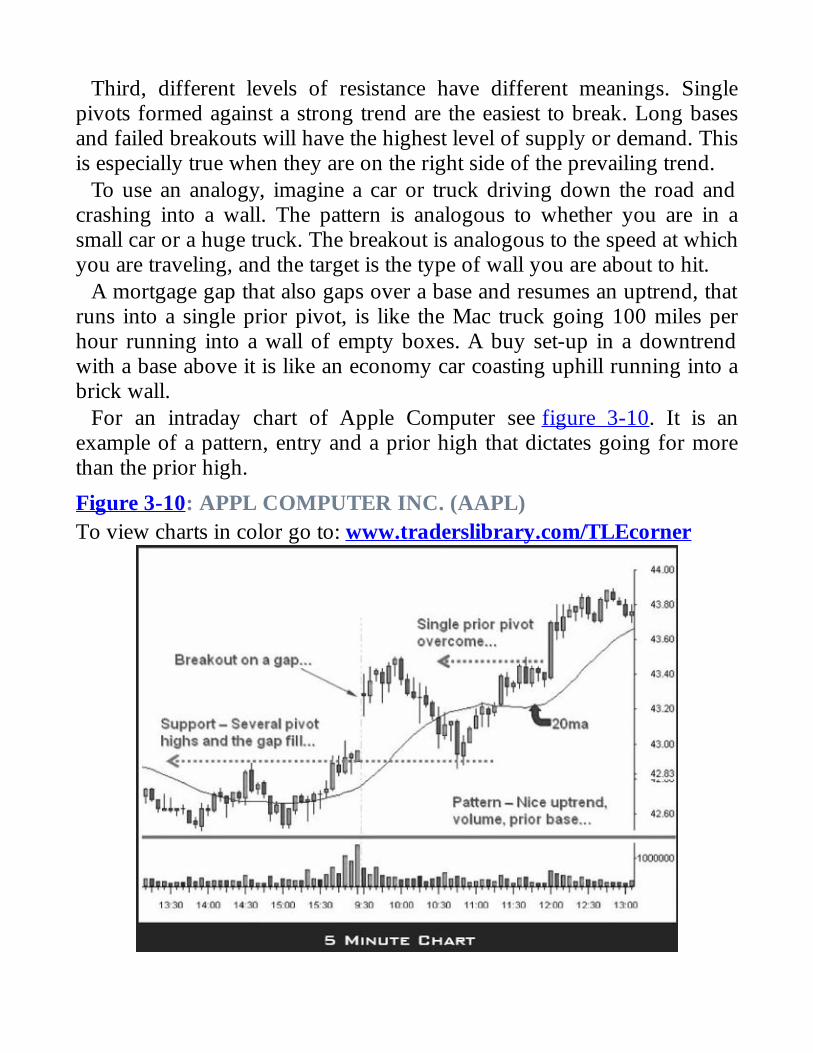
Third, different levels of resistance have different meanings. Singlepivots formed against a strong trend are the easiest to break. Long basesand failed breakouts will have the highest level of supply or demand. Thisis especially true when they are on the right side of the prevailing trend.
To use an analogy, imagine a car or truck driving down the road andcrashing into a wall. The pattern is analogous to whether you are in asmall car or a huge truck. The breakout is analogous to the speed at whichyou are traveling, and the target is the type of wall you are about to hit.
A mortgage gap that also gaps over a base and resumes an uptrend, thatruns into a single prior pivot, is like the Mac truck going 100 miles perhour running into a wall of empty boxes. A buy set-up in a downtrendwith a base above it is like an economy car coasting uphill running into abrick wall.
For an intraday chart of Apple Computer see figure 3-10. It is anexample of a pattern, entry and a prior high that dictates going for morethan the prior high.
Figure 3-10: APPL COMPUTER INC. (AAPL)To view charts in color go to: www.traderslibrary.com/TLEcorner

Here we have a nice uptrend, a gap up, and prior high that left littlesupply behind. AAPL stalls at the prior high before going much higher.Selling some into the prior high and holding some for higher prices (nexttarget is not visible on the 5-minute chart) is the key.
Next is a play from the weekly chart of Albertsons (Figure 3-11 page90).
Figure 3-11: ALBERSTON’S INC. (ABS)To view charts in color go to: www.traderslibrary.com/TLEcorner
Here we have the momentum (big truck) of a downtrend and failedbullish bars. We have the entry triggered (speed) of a long base breakingdown. Will this develop enough momentum to get beyond the first target?(see chart, “Which is target?”). To keep the analogy going, here the Mactruck, going 100 miles an hour, should get through the wall of cardboard.The real target of course is the lower one.
By the way, despite all the analysis, you will find hitting any singletarget a difficult goal. The best traders use this information to arrive attwo, three or more logical exit points and sell incrementally.

To enter a trade is just as important as the exit. See the next lesson formore.

The Anatomy of an EntryPreviously I discussed the importance of exiting a trade at the right time.Getting out of a stock when you need to is the hallmark of a good trader,as is letting profits run on good trades. However, a proper entry isessential, and in many ways, the hardest part of the trade. Knowing whento play a stock or leave it alone is one issue. Here, we will talk about theexact entry into a stock once you have decided it should be in play, basedon the chart pattern and the market action.
Once you have decided a stock should be played based on a certainstrategy, you then need to enter the stock based on the strike price that thestrategy dictates. However, it is not always easy. There are many rulesthat an astute trader should use beyond just buying above or below acertain price. We will look at many of the considerations a trader mustmake when looking to enter a stock properly. As an example, refer to thenext chart below (Figure 3-12). This is a 5-minute chart of EFDS for May25, 2001. The stock closed on the 24th at 24.11 and the high of the dayon the 24th was 21.50. It opened on the 25th at 21.68. Assume thePristine Buy Set-up was a good one, so we will be looking for an entryover the prior day’s high. That is the correct “entry” for the “strategy” onthe daily chart. Sounds easy? Let’s take a look.
Figure 3-12: EFunds Corp (EFDS)To view charts in color go to: www.traderslibrary.com/TLEcorner

There are numbers on this chart representing six areas of interest. Whereshould this stock have been entered? Study the chart and pick an answerbefore proceeding.
Let’s take a look. Bar #1 is the first 5-minute bar. The stock has gappedup 57 cents from the prior days close of 21.11 and over the strike price of21.50. It is over the strike price, so do we buy here? Well first you mustconsider the gap. A gap of 5/8 or over (62.5 cents) would make the playinvalid as this would be considered an excessive gap, and make the playunwise due to being extended. This is a good rule of thumb. Here the gapis less than 62 cents, so this rule came close but does not apply. However,an astute trader would not have bought EFDS here. Why? The spirit ofthe rule is to stop you from buying a stock that may be falling. This stockopened on its high and immediately traded down. An astute trader willalways buy on the way up, even if it is a 30-second high that is beingtaken out. Since this stock never ticked up, and traded straight down for 5minutes, an astute trader would not enter here, and would wait for a 5-minute high at this point.
Bar #2 is the pullback into the 10:00 reversal time. A pullback tosupport at reversal is not an ‘entry’ for a Pristine Buy Set-up on the daily.We are looking for yesterday’s high. However, even if you were lookingto anticipate an early entry, pullbacks to support at reversal time areintended to take advantage of pullbacks in uptrending stocks; this stock is

downtrending at 10:00. No entry available here.Bar #3 is a new low, clearly in a downtrend on the 5-minute chart.
Astute traders do not ‘guess’ on an entry off the bottom. This turns out tobe the low of the day, but there is no entry available here off the chart.
Bar #4 is where the stock takes out the day’s high. This is where mosttraders feel the appropriate entry lies. Since this stock ‘gapped’ up thenpulled back, the 30-minute high can be used for a valid entry. Normallythis price point would be the entry, which is the high of the day at thistime of 21.68. As you may be sensing though, this is not going to be theentry for the astute trader. Why? Look how hard the stock ran to get tothe day’s high. It went from the low of the day to the high of the day in30 minutes, covering almost a full point, a good move for a $21.00 stock.More time than not, this entry will be unwise. You want to attack the highfrom a close by base, or from a series of higher highs and higher lowsthat bring you close to the high to attack it from close range. Imagine themarathon runner that does the 23 miles and then you ask the runner toenter another race. He needs a rest. At this point you need to let it go andwait for a new attack on the day’s high, or a pullback for proper entry.
Bar #5 occurs next, and it’s the bar that takes out the newly formed highof the day. There was no pullback to speak of so the bar becomes the nextpossible entry. Is this valid? Once again, you must pass. Why? Lunchtime doldrums. 12:45 to be exact. Most breakouts during lunch fail; as arule, you should not be playing breakouts during lunch time.
So, we now have to wait to come out of lunch, and again look for apullback or a new high. Bar #6 is the bar that finally takes out the high ofthe day at 2:40 over $2.80. Here, finally is the proper entry.
Notice that all of the other entries would have gotten you in earlier, butmore times than not, the entry would have led to a stop out. Remember,missed money is better than lost money. Having the patience to wait forthe proper entry is key to keeping you on the right side of the trade.
Chapter 4
Lessons on Psychology in Trading & Planning
The Psychology of FearYou had a trade in mind all morning. You found a perfect Pristine BuySet-up (see Appendix A) on the daily chart last night. You followed itduring pre-market. It opened just below yesterday’s high (your buypoint) and slowly crept its way up right to that strike price. Duringreversal time it based sideways and did not give up an inch. Now, as thefutures just start to turn up at 10:10, your stock starts to pick up involume. The prints are going off at the offer and those offers aredisappearing. When they are gone, that means it is time to buy! Youwatch them all disappear. Then you decide you better watch a little more‘just to make sure’. It pulls back a little, and you are thinking, “I’m glad Iwaited.” Then it surges up and starts really moving. You try to buy at theoffer, but it moved too fast. You don’t chase it, and now it is gone. Itturns out to be a great play. What went wrong?
Later that day you decide to buy a stock over 35.35, stop under 35, andtarget 35.9. You get in the stock properly at 35.39 and it moves up to35.55. You debate if you should be taking profits now or waiting for thetarget. The stock starts pulling back too fast to take profits. You are nowconcerned as the stock has pulled back to your entry. You finally get outat 35.30 for a small loss. It wasn’t at the stop, but it did not feel good tobe negative in the position after being up 20 cents. The stock now ralliesto the target, without you. Another trade missed and a small loss taken.Does this sound like something that happens to you?
What you are experiencing are the different effects of fear. As you maybe aware, psychological aspects make up 85 percent of the tradingequation. Fear is one of the aspects. Ideally, we would all be“emotionless” traders; no fear, no greed, just pure discipline. While thismay be a worthy goal, not many can take the leap to this level justbecause I say you need to. While most people cannot eliminate fear, there

are some things you can do to keep it in check. That is the purpose of thislesson. Here are some suggestions:
1. First, fear’s greatest enemy is a well laid plan. Have a trading planthat clearly spells out what strategies you will play, how many sharesyou will play, how much money you are willing to lose on a singletrade. There are many aspects to this plan and they will be the topic ofthe next lesson.2. Next, plan out the individual trade. When you see a trade that fitsinto your plan, study the play to find the proper stop loss and target.Play the proper share size so a stop out does not violate yourmaximum loss per trade. Make your decisions before the trade hitswhile you have a clear level head. Follow the plan without question.You must execute the planned trades.3. The next step may be the most important. Let your plan go to work.Let the play finish. Unless something changes about the trade, let itcome to its natural conclusion, either the target or the stop. Thinkabout it. You have planned a trade while you had a clear head. Youbelieve the trade is worth your hard earned money. Give it a chance tofinish.4. There are some reasons to end the trade early. Perhaps there hasbeen a change in market environment. For example, you might belong in your play and the futures just took out key support. Or maybeyou planned on reaching the target by reversal time and it is almost atthe target with reversal time now here. However, these are theminority. The vast majority you should leave the play alone. Do notbe jiggled out by your Level 2 screen. The chart pattern is by far moreimportant.5. If you are still so nervous that you can’t handle it, try this next. Sellhalf the position at the reduced target. Get used to taking partial profitsand this will let you have confidence letting the back half hit thetarget. This will also likely put you in a ‘no lose’ situation with thetrade, giving you some patience. Good traders sell incrementally, onthe way up, all of the time.6. If that does not help, you need to cut back on your share size (orfind a trade with a smaller stop), so the size of the potential loss does

not trigger your “pain factor.”7. If these things prove helpful, you will start building the confidenceneeded to stay with the trades.
Remember, a well laid plan and confidence are the enemies of fear. Thinkof yourself as two people. First as a “planner” who develops good trades.Second, as an “executioner” whose job it is to execute the plans that havebeen laid out. Don’t empower the “executioner” to second guess the“planner.”

The Trading Plan - The Key toYour Success
There is an old cliché that says, “If you fail to plan, you will plan to fail.”While this saying is true of many things in life, there is no area where itholds truer than in trading,
Previously, in this book, I have referred to a common element called a‘trading plan’. Explaining a trading plan is not that difficult. Explainingwhy you must have one is always a challenge, because most traders donot have one. While they all agree it is a good idea, they never seem totake the time to write one.
Do you know which strategy is your best morning strategy? Do youhave exact criteria written that explains that strategy, including what thestock must look like on the daily, where it must open, and what thefutures must be doing for you to take that trade? Can you right now findin writing how much is the maximum amount you are willing to lose onany one trade? Do you have a daily goal to hit financially? What do youdo when you hit that goal? How much are you allowed to lose before youquit? What do you do after three winning trades? Five winning trades?
Most people just go through the day ‘drifting.’ Any amount of moneymade is never enough. Any loss does not stop the need to ‘get back’.Most trades are the result of chasing someone else’s idea, not following astrict strategy. If you answered yes to all of the questions above, nicegoing. If not, let me try to convince you.
The mind responds better to things that are written. It activates adifferent physical part of the brain when we write or type something. It isnecessary to write. We would all like to be “emotionless traders.” Theclosest you can come to that is to separate yourself into two people. Thefirst should be the planner. This person writes a trading plan, puts thatplan into effect by finding trades during the day, takes those trades anddevelops entries, stops, and targets and puts them in writing. Then asecond person is the ‘executioner’ and has no power to change things.This person’s only job is to carry out the plan. If you are able to findsuccessful trades consistently, but you are not making money, find out
why. It is likely because the executioner in you has taken over theplanner. He has taken you out of trades before the target or stop, to yourdetriment. Or, he has ignored stops, thinking he knows better.
You should have at least four parts to your trading plan. The first partshould be a very simple chart of what you would consider to be yourmaximum lot size on any trade for any given price of stock. You mayhave a maximum for $30-40 stocks, and a higher maximum for $20-30stocks. Spell it all out. This is not necessarily your trade lot size, just amaximum you would never go over.
Next, you need to define some financial things. How much are youwilling to lose on a trade? How much are you willing to lose in a daybefore quitting or before quitting for the morning? What is your goal perday? Per week? What do you do when you hit it? Quit? Or, do you trailstop your day’s profits just like you would with a good stock? Theanswers you choose are not as important as having the discipline tofollow them.
In this section, you should also have the calculation for your lot size pertrade. You should look to risk a constant amount of money per trade.This means you need to look at the stop on a proposed trade, andcalculate the share size needed to ensure a stop does not violate themaximum amount you are willing to lose on a trade.
In the third section, you will need to spell out the strategies that you willuse throughout the day. If you are new, pick one or two of your favorites.Spell out the exact requirements of the stock that you will be watchingand detail what your entry will be based on. What will the market have tobe doing for you to take the trade? What time of day is this tradeacceptable? Pass on all trades that do not fit the criteria. Try tracking yourtrade results by strategy for a while to see which ones truly work best foryou. You may be surprised that the results may be different than whatyou now think.
Last, have a section for your own goals as a trader. Continuingeducation is important to us all. Do you want to learn options tosupplement your trading? Do you want to take another seminar? Do youhave a list of good books you would like to read? Need some relaxationclasses?

You will find that having a trading plan and following it will improveyour results almost immediately. It will keep you calmer and less stressed.It is a business plan for your trading business. Don’t trade without it.
DisciplineTo have a trading plan, you must be disciplined. This next lesson willexpand upon the psychological topic of discipline. Unlike many of thepast lessons, it will not be long. It will not have a clean-cut list of thingsyou need to do. There will not be a simple plan that is ready to execute.There are no nicely labeled charts to tell you what to do. Discipline is amore illusive topic. Yet, if there were one lesson that you should frameand put above your computer, this would be the one.
For trading purposes, discipline can be simply defined as your ability tofollow your trading plan.
Just like many past lessons, here is a reference to a trading plan. It is asimple concept. You need to define what you want to trade. You need todefine when you want to trade it. You need to decide how to trade andmanage it. You need to decide how to handle your account when you aremaking money (do you keep a trail stop on profits?). You need to handleyour account when bad days come along (do you have a stop loss everyday?).
Once you have this, a couple of rules are helpful. Do not change youplan during the trading day. Commit to only making changes when themarket is closed. Otherwise, there is no plan at all. For at least one month,read your plan every morning before you trade. Then read everyweekend. Get one of those little free applications that open programs foryou at certain times of the day. Have it open your trading plan at 9:25AM, just before you trade.
The best way to enforce discipline is just by awareness. Keep records ofyour trades. On every trade, include an answer to the simple question,“Was this trade part of my trading plan?” Yes or no. There is no inbetween. Be aware that the undisciplined traders are almost guaranteed tofail. Ask every day if you are keeping the discipline or are you just takingtrades at random that look good at the moment? You can’t fix somethingif you do not know it is broken. You must first be aware that you have adiscipline problem.
If disipline is your problem, there is an absolute answer for you. Itcomes from a famous shoe manufacturer. The answer is this: JUST DO

IT. There is no alternative.Now that you have read this, here is a question: Does this lesson get
added to the long list of things you have read but not acted on or makeyou sit up and make changes about how you trade for the better? If yourproblems are apparent after reading this, make the change. Make abusiness (trading) plan, and monitor the plan and your progress.
In summary, psychological issues make up 85 percent of the tradingequation. Discipline is the essence of all of the psychological issues. Itpermeates throughout the whole process. All the rules and procedures andplans do not matter if they are not followed. There is little doubt that forthose who seek an education in trading, that failure rarely comes fromwriting the wrong plan. Failure comes from not writing a plan at all, ornot following the one that is written.
I would like to close with my second favorite quote: “I just wait untilthere is money lying in the corner and all I have to do is go over there andpick it up. I do nothing in the meantime. In essence, by not wanting totrade, I have inadvertently transformed myself into a master of patience.By forcing myself to wait until there was a trade that appeared socompelling that I could not stand the thought of not taking it, I had vastlyimproved the odds. . . .” - James Rodgers.
Some of Your Best Qualities . . .I ended the last lesson with my second favorite quote. I thought youwould like to know my favorite. Naturally, that is what this lesson will beabout.
First, let’s discuss the title, which is a bit deceiving. “Some of your bestqualities may be hurting you.” Yes, it is true. Trading is unique in manyways. It is not by accident that many of the people who are drawn totrading are successful people from other walks of life. After all, to tradeyou need some free capital. Many obtain this from running or sellingsuccessful businesses, or from high paying professions. The problem isthat trading is unique from most other businesses.
Most of your previous successes in life will likely not be able to helpyou in trading. The things you have learned are often not transferable.Worse than that, they may be harmful. Take the successful doctor. Everytime his stop hits, he decides to add more shares. Why? To the skilledtrader, this is a crime. To the doctor, this is a way of life; it is bred into hissystem. What is he thinking? He is thinking about ‘saving the patient’. Heis taught that the object of his attention must be saved at all costs, at allmeasures. To trade, he has to adopt the philosophy of ‘killing the patientat the first signs of ill health’. This appalls him at some level.
Consider the skilled lawyer. He is taught to make a case and anargument for any possible situation. As his stock begins to fall, he cancome up with dozens of ways to justify the position. He is skilled atmaking the case and does so for the stock as it begins to fall. ‘They justhad good news, the fundamentals are excellent, this is just a shake out,and the market makers are playing games’. He will use a thousanddifferent arguments to stay with a loser.
Consider any successful businessman. Often in the beginning, successcame by simply working harder. Putting in more hours, taking on morepersonally. Doing what ever it takes. Unfortunately, trading harder is noteven a working concept. Consider the accountant. The accountant is aperfectionist with numbers. The thought of having red ink on a trade canbe hard to take. It forms the need to not take small stops, hoping that theledger can show all winners today.

Consider even the professional athlete. Losing is not an option.Unfortunately, in trading, losing is mandatory. Losing the right way iswhat matters, small amounts on appropriate trades. Once a trade hasstopped, it is a loss and the trader moves on. The trader knows that whatmatters is the process that delivers winners over a period of time, not whathappens on one trade. To the athlete, losing is not acceptable. It must beavoided at all costs and at all levels.
So what is helpful? Learning the whole process of trading. Learningfrom those who have been through it, or having the ability to learn andadapt quickly as you go. Having the mindset of having a plan, being ableto adjust that plan, and carrying out the plan until the results are reached.Then constantly evaluating the process, eliminating mistakes and beingmindful of the need to change and be flexible. There is a quote I havealways liked and is, in fact, my favorite. I find its application to trading tobe unique.
“Nothing in this world can take the place of persistence. Talent will not;nothing is more common than unsuccessful people with talent. Geniuswill not; unrewarded genius is almost a proverb. Education will not; theworld is full of educated derelicts. Persistence and determination alone areomnipotent. The slogan ‘press on’ has solved and always will solve theproblems of the human race.” -Calvin Coolidge
I find this to be a good warning to all. Many talents you have may notdirectly contribute to your trading. An open mind, coupled withpersistence and determination in your goal are keys to successful trading.

The Need to be RightIf you are in the early stages of learning to trade, you will become acompilation of all those you learned from. You will become your ownunique breed of trader. We all come to the table with certain expectationsand beliefs and with some emotional baggage. We all learn from reading,studying websites, and other traders, some informally, some by payingfor education in the form of trading rooms, seminars and mentors. Everytime you learn something, it adds to your experience as a trader.Eventually you become the sum of all you have learned. Even if you havea mentor you have tried to emulate, you will never be like your mentor.You will be unique.
While no two traders are identical, most successful traders do sharesome common characteristics. Most have learned the value of a tradingplan. Most have learned the need for stops. Most have learned aboutdiscipline. However, it takes a long time to understand the subject of thislesson; the need to be right.
The topic is a simple one. Yet it eludes many traders. It seems onlyobvious that if we want to be successful, we need to be right in ourunderlying assumptions. If we want to trade stocks, we should focus onbeing right about the direction stocks are going. Correct? Well, not really.
Most traders focus too much on their need to be right. This can bedetrimental and needs to be addressed. The truth is that we are dealing inthe stock market. There is not a system, method or pattern that canproduce accurate results all the time. If there were, it would be known toall. All would be using it. Ironically, if this was the case, when everyonestarted using the system, it could no longer work. A ‘catch-22’ of sorts,but it just goes to show that it is obvious that there will never be a perfectsystem or indicator.
The best we can do is to study each situation, collect the evidence, andmake a high probability decision at the proper moment. What is ofprimary importance is how the situation is handled when the trader isright, and how the situation is handled when the trader is wrong. What isthe most common reason traders fail? The answer is not following stops.What is another top reason traders fail? The answer is not letting winners
run.Not following a stop is an example of handling the situation improperly
when a trader is wrong about the trade. Not letting a trade hit a target is anexample of handling the situation improperly when a trader is right aboutthe trade. What good is being right if you don’t get paid for it? From thebeginning, good traders assume that the trade may go bust. They knowhow much money they have risked and when they will get out. They willanalyze other options, such as profiting from the stock, which is nowmoving ‘against the odds’.
Good traders also know how to balance being right and being timely. Iknow of an advisory service that is taking credit for having predicted thefall of the Dow. The only problem is that they began that prediction whenthe Dow hit 6000. Quite a hollow victory. Waiting for too muchinformation may make you right more often, but to what avail? It is likethe trader that finally decides the NASDAQ is going higher intraday,because it broke the high of the day. The only problem is that theNASDAQ rallied 30 points to come back to break the high of the day, itis so extended, there is no room left for profit. The trader may be right,but his late decision awards him no money.
Yes, we need to be right a fair amount when we trade. However, if youraverage winner is three times your average loser, you only need to beright 25 percent of the time to be breaking even gross. Accept that this isnot an exact science, and never will be. We are reading people’semotions. Accept that you will be wrong a certain amount of the time andshould accept that graciously. Focus on how you handle your winner andloser. Make timely, high probability decisions when you have sufficientevidence, and do so consistently and objectively.
The Ways Traders LearnThe general concept presented here regarding the four steps of learning isnot new. It is a concept that has been helpful in understanding the stageswe go through in learning. I find it very useful as it applies to learning theart of trading.
The first step is where everyone starts out when learning a new skill liketrading. It is called “unconscious incompetence” and it is the mostdangerous time. This is the stage where the person who wants to trade hasno knowledge of the subject (incompetent), and ever worse, they do noteven know what it is they do not know (unconscious). This can lead toquick failure, as frustration comes easily. Have you ever tried learningnew software, and after struggling for a while finally gave in and took acourse or read a book about the software? Once you know how muchthere is to learn, you see the need for education and the frustration ends.Unfortunately for many new traders, they never leave the first step. Theyfeel that trading is easy and never seek education. They usually quit early,either out of money or feeling frustrated.
The second step is an important one. It is called “consciousincompetence.” It doesn’t sound much better; but it is a big step. Here thetrader comes to the realization that they need help. They realize that whilethey may be very educated and successful in past endeavors, it is nothelping in the quest to make money trading. Rather than continueunsuccessfully, they turn to someone for help. They finally know thatthey don’t know what to do. The time it takes to become conscious oftheir incompetence may vary from a couple days to never.
The third step is the long journey and the most time consuming. It is thequest to become “consciously competent.” This is the step where the skillsare learned to succeed at the task. For the trader, this is the process oflearning strategies, money management, discipline, psychology and all thelittle ins-and-outs of the market. This is the time when they learn to besuccessful. The time frame here is hard to determine. For some it can berather quick. For most, even successful traders, it is a process that neverstops.
Note, that while success can be enjoyed at this stage, it is happening at a

conscious level. That means that every thing that is done needs to beplanned, reviewed, and evaluated. Being “consciously competent” meansthat in order to be competent, you must consciously think about theprocess at every step. This is why so many fail even when they reach thislevel. Once success has been had, many turn off the conscious thinking.They then have problems and begin to think that their successes were justluck. This is where the psychological aspects of trading really come in.Here is where those who have the ability to stick to what they havelearned, to stick to their plans and to follow up to make sure, really dowell.
The next step is the one of true mastery. It is “unconsciouscompetence.” It is performing the skill as a pure habit. It is your body andnerves reacting without consulting your brain. Examples are most easilyfound in professional athletes. Tiger Woods is ‘unconsciously competent’at golf. He does not address the ball and start thinking, “Now, let’s see,my right hand goes here . . .” Can one get to this level in trading? It ispossible. Very few are. It would require the engrained discipline to neverbe distracted from your plan. It would mean no matter what trade camealong, if it did not meet criteria you have set for yourself, it would not beconsidered. It would mean that when a trade hit a predefined level, itwould be exited without thought or hesitation.
The good news is that you do not have to be at the fourth level to besuccessful. Many traders may be at the third level their whole career andbe just fine. They will only do well however, if they remember that theyare at the third level, and that conscious thinking in the form of planning,discipline and follow up are needed every day.

Using Public Fear as a TradingTool
A part of conscious thinking would be to ask yourself whether a pullbackin the market on daily charts is buyable. A long line of bulls all want to bethe first one in on the move up. A long line of bears want to know if it istime to cover or is this just a ‘technical’ bounce.
I have spent a great deal of time and energy using technical analysis tohelp determine these issues. Many lessons in this book have discussedthis. However, many questions often remain. Is this a quality pullback? Isthis really support here? Is the uptrend still in place, or has it beendegraded? Trying to determine on a daily or weekly chart when apullback is buyable is not always an easy task. There are many details thatwe look to in technical analysis that help make a case either way. I want totouch on one detail that not all traders are familiar with. The use of publicfear to measure the realism of a pullback.
This involves the use of measuring the public’s view of the market as itis measured by the open interest in puts. Puts are options contracts that goup in value when the underlying security (the NASDAQ market, forexample) goes down. The theory is that when much of the general publicare buying puts, the market is ready to go up. Some people may considerthis ‘reverse psychology’ or ‘the public is always wrong’. Think of it thisway. If everyone is bearish, as shown by buying puts, who is left to sellstock? If no one is bearish, as shown by a very low volume of puts beingbought, then there are still many holding stocks that will likely be sold inthe future if the market comes down more. Or at the very least, they arenot going to be new buyers.
There are two measures that help you get a handle on this. One is thePut-Call Ratio (PCRATIO on Real Tick), and the other is the VolatilityIndex ($VIX.X on Real Tick). Below are charts of the NASDAQ indexFigure 4-1), and the VIX (Figure 4-2) and the PC Ratio (Figure 4-3).
Figure 4-1: COMPXTo view charts in color go to: www.traderslibrary.com/TLEcorner

Figure 4-2: CBOE Volatility index
Figure 4-3: CBOETo view charts in color go to: www.traderslibrary.com/TLEcorner

The top chart is the NASDAQ index. The question here is, can thePristine Buy Set-up (see Appendix A) that happened at 2 (Febuary 8) bebought long term? It is a nice looking set-up. The pullback on the weeklychart is 50 percent from the September lows to the January high. We havefilled that gap to some support as shown by 1. We have a changing of theguard and the move did provide four partial days of upside. A playablerally, but would you be long in core positions here? We were not becauseof the next two charts.
The Volatility index moves inverse to the market. It can be used toconfirm moves in the market. Notice the rally that ended on Febuary 8(matching the pullback in the NASDAQ on Febuary 8) did not take outprior highs, as shown by the arrows. Note that the corresponding days inthe NASDAQ did produce lower lows that should have been confirmedby higher highs in the Volatility index. This is telling us that there was notmuch fear in this pullback, that the average investor was still hanging onto stocks, and was not short the market. This is not a good combination tomake a buyable long term rally. Note that prior highs from Novemberwere well into the 30’s.
The next chart does not graph well as the PC ratio usually stays in atight range; however, I did want to show that a PC ratio over one isgenerally considered to be getting high enough to show fear amongstinvestors and show a high level of shorting in the market. Notice that
during the Febuary 8 pullback, the PC ratio could not close over the .7-.8area on average.
Overall, the pullback came in the NASDAQ and as it approached a keylevel, most investors simply were not selling. They were bullish; therewas still much stock to sell. Due more to a lack of buyers and lowvolume, the pullback did not bring about selling. That means there areless investors needing to buy stock; they already own it.
Another tool to consider in trading is the losing trade. To analyze thesetypes of trades, see the following lesson.

Analysis of a Losing TradeMany traders spend much time discussing why a trade worked after thefact. How obvious it was once the chart is drawn. I will tell you that alltrades do not work out, I don’t even expect them to. It is the very natureof trading that trades will fail. As traders, we are just trying to get theodds in our favor with every analysis. Trading is all about getting theodds in your favor. Then, it is how you handle the winners, and how youhandle the losers. To always try to improve the odds, we analyze alltrades after they are closed, especially the losers to see what, if anything,can be learned.
That being said, I want to share with you an after the trade analysis of alosing trade. The trade was on AT&T Corp. (T) and was intended as aswing trade, with the back half being held as a core trade.
Next is a daily chart of AT&T Corp (Figure 4-4). The following was therationale for the long position:
Figure 4-4: AT&T CORP. (T)To view charts in color go to: www.traderslibrary.com/TLEcorner

1. T had been in a nice uptrend (not shown) since May of this year.This pullback began in October and came down to a major supportarea from July. This gave us reason to look at the daily chart to find aplayable set-up.2. While the daily chart did not offer a clean set-up for entry, aninteresting pattern did form: large volume in mid-October, after fallingfor a month, large bottoming tails in the area of November 1, and avery nice consolidation in mid-November after the bounce off thelows.3. While this stock was in a downtrend for the last three months on thedaily chart, we were looking for the stock to transition from StageOne to Stage Two because we were in the weekly support area. Thetest would be the mid-November base. If the downtrend were tocontinue, this base should be resolved to the downside.4. The base broke out with a Wide Range Bar (WRB) to the upside.After a four-day consolidation staying in the upper third of the WRB,we played T on the next break out, on December 1 at 19.87. Theswing target was just under 21.00, the mid-October high. The stopwas under 19.62. We were using a ‘core’ stop mentality and keepingthe stop in place until the daily chart put in a higher low.
The trade went well for four days. It rallied two-thirds of the way to thetarget before stalling. We expected the pullback to put in a higher lowthen proceed to the target. The morning of December 11 looked likethings were on target. Then T sold off for all-day and closed just abovethe stop. The next day, T gapped down, and we used ‘disaster rules’ tomanage the exit, which turned out to be more than the stop. Most dailycharts do not show this gap down (the above does not), due to thefrequent problem with listed stocks showing ‘bad ticks’ before they open,but T did gap down on the 12th.
Now for the important question: Was there anything to be learned fromthe set-up of the trade, or the management?
1. A closer look at the weekly chart (Figure 4-5) gives us a chance tosee if multiple time frames were coordinated. We especially want tolook at the next bigger time frame to make sure it does not conflictwith the trade. There were some small signs that this weekly uptrend

may not have held that support. The WRB at the end of Septemberwas the biggest red bar on the weekly uptrend. This does not mean theuptrend was over, but it is a clue, and that is what we are looking for;to see if there were enough clues to learn to handle a trade like thisbetter.
Figure 4-5: AT&T CORP. (T)To view charts in color go to: www.traderslibrary.com/TLEcorner
2. Note the bar labeled A. This is highlighted because that top tail hitas a weekly Pristine Buy Set-up (see Appendix A) in an area thatwould have maintained the weekly uptrend. This is the area thatshould have held up. The next bar was another fairly wide bar thatactually went a little below support. The stock did bounce from thearea of support, but a really strong stock may not have pulled backthat far.3. As far as trade management, a review is needed to see if one’scurrent money management rules were followed, and if they were, toevaluate if there should be changes made. If you find that a rule isconsistently not doing its job, you might consider changing the rule to
improve future performance. The issue here is should a trade beallowed to go negative after getting that close to a target. As a coretrade, the plan was to not raise the stop until a daily pivot pointformed.4. An issue could be raised that the stock was held when it closed justabove the stop the day prior to the trade stopping. The gap down thenext morning turned the trade negative.
Here is a summary of what was learned;1. This trade was a core trade, but the weekly chart was only glancedat and not studied. The daily chart had a very nice set-up, but perhapsthe time frame should have stayed swing with smaller targets untilmore could be learned from the weekly.2. The management of the trade was not a mistake, as it followed theplan outlined for this type of trade. However, perhaps a change in theplan should be made for a holding that closes just above the stop on abearish bar, as T did the day before it stopped.
Printing out charts and summarizing all the trades you do should be apart of your regular routine, first to make sure you followed your tradingplan, and second, to see if consistent issues arise that would make youchange your plan.

Chapter 5
Technical Lessons
Some Common MistakesI’d like to think that traders who have read this book so far have learnedat least one concept that can help them improve their trading. Sometimesthe lessons are big concepts; sometimes they are small points. Some aretechnically oriented and some are psychologically oriented. Today Iwould like to focus on what I feel are the two most common mistakestraders make.
The categorization that they are the most common mistakes is subjectiveon my part. It comes from running the Pristine Method® Trading Roomand dealing with the many interesting questions traders ask. I feel that ifall traders were aware of these two issues, it would immediately help theirtrading.
The first one is a simple concept, but so common that it takes first placein my mind as the most deadly mistake. The mistake is this: Traders wantto short strong stocks (or buy weak ones) without any particular strategyother than the stock appears over extended.
Trading does involve some subjectivity. It is hard to eliminate.However, the more you can limit this and stay objective, the better offyour trading will be. Calling a stock ‘extended’ without any objectivecriteria is difficult. It is difficult to do even with objective criteria. Thetruth is that most traders would be better served by staying with the trend.Going against the trend has serious limitations. Experienced traders willlook at the relationship of the price to moving averages, how the volumeis entering the stock, and often ‘zoom down’ to refine an entry. Evenafter all this, these are low odds trades.
Why are traders so drawn to these since there are so many drawbacks?Simple. The home-run. Somewhere, somehow, sometime the trader saw,read about, or perhaps actually shorted a stock at its high, and caught a
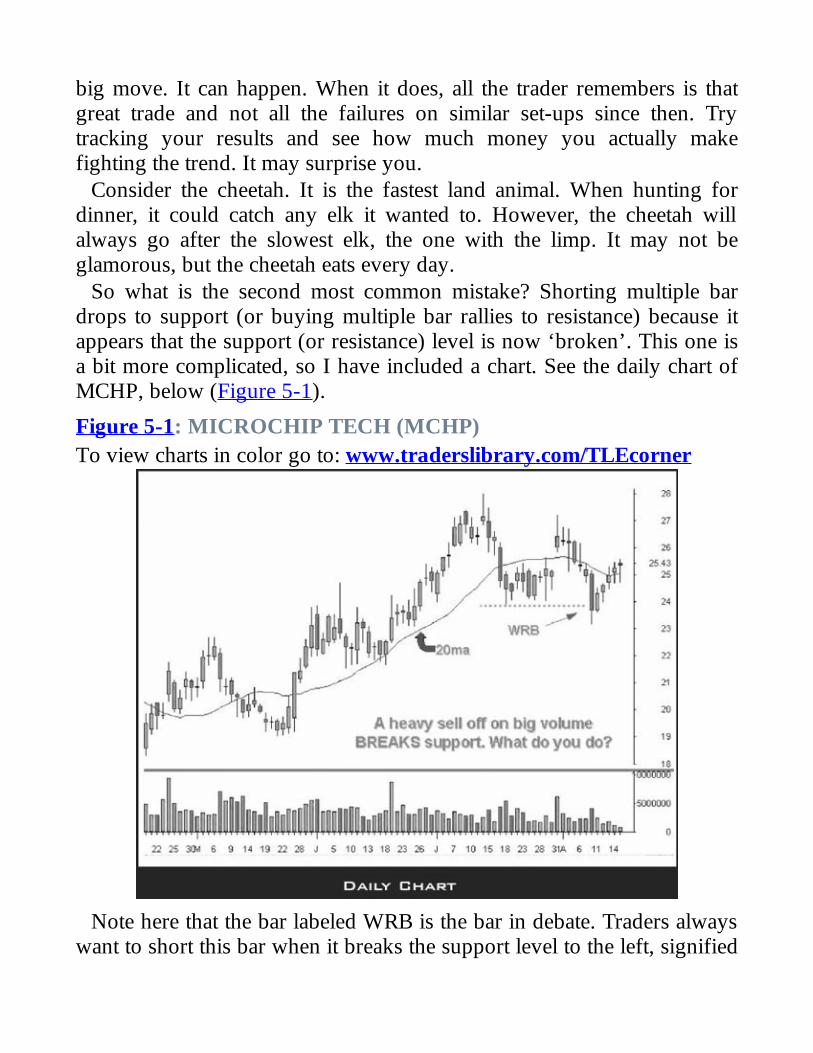
big move. It can happen. When it does, all the trader remembers is thatgreat trade and not all the failures on similar set-ups since then. Trytracking your results and see how much money you actually makefighting the trend. It may surprise you.
Consider the cheetah. It is the fastest land animal. When hunting fordinner, it could catch any elk it wanted to. However, the cheetah willalways go after the slowest elk, the one with the limp. It may not beglamorous, but the cheetah eats every day.
So what is the second most common mistake? Shorting multiple bardrops to support (or buying multiple bar rallies to resistance) because itappears that the support (or resistance) level is now ‘broken’. This one isa bit more complicated, so I have included a chart. See the daily chart ofMCHP, below (Figure 5-1).
Figure 5-1: MICROCHIP TECH (MCHP)To view charts in color go to: www.traderslibrary.com/TLEcorner
Note here that the bar labeled WRB is the bar in debate. Traders alwayswant to short this bar when it breaks the support level to the left, signified
by the green dots.First of all, support areas (this applies to resistance as well) are concepts,
not exact numbers. They are ‘rubber bands’ not glass plates. How youapproach the support is more important than if you ‘break’ the magicnumber. Notice that the WRB is the sixth day down when it begins. ThenMCHP falls more than it has on any day on this chart. Now do you wantto short this stock? The smart trades were short much earlier, and as thestock loses momentum to the downside, these traders are ready to cover.Add to that, the trader who mistakenly does short this on the last day, andyou get this result; lots of people who need to buy this stock, driving theprice up.
Now, no one is saying that this stock is not damaged on the long side.No one is saying that it may not be a nice short after a small weak rally. Itis, however, a very low odds play as a short when it goes below the priorlows on the daily. Good traders will not only avoid this, but profit fromthe move to the long side.
Track your trades and see if this makes an improvement to your bottomline.

Was That a Double Top?You do not have to be trading long before the term “double top” or“double bottom” is heard. What constitutes a double top/bottom and canthis be used in your trading?
Like all of trading, and all of technical analysis, nothing is written instone in terms of what direction a stock will go. As traders, all we try todo is to put the odds in our favor whenever we can. With that in mind,let’s take a look at some issues to consider when you think you see adouble top forming. Also keep in mind that this discussion, like mostdiscussions of charts, applies to all time frames. You can use thisinformation on a 5-minute chart for intraday plays or on a daily for swingand core plays.
Let’s talk about double bottoms. This discussion will apply equally aswell to double tops if you change the appropriate wording (high insteadof low, etc.) Any time a stock approaches the area of a prior low, it is apotential double bottom. Any prior low offers some support and is likelyto cause the stock to at least hesitate the decline. It may then hold as asideways consolidation (base). Or it may rally, but only to later return tothe low (dare I say, a ‘triple’ bottom?) Or, it may produce a substantialrally, challenging prior highs. Or, it may rally so strong that the bottombecomes a major low for a long time to come. The question becomes;which of these possibilities is likely to happen? Do you play the doublebottom long for a scalp, long for a long trade, or dare I say, anticipate theshort by shorting the rally from the potential double bottom?
Here is the checklist of things you will want to examine to determinehow your stock will react to a potential double bottom. The list lookslong, but after a while many of these things will be second nature to you.
1. What was the prior trend of the stock? If the stock is in adowntrend, it is more likely that the double bottom will not hold (or adouble top will hold). This means that a stock that is in a downtrend islikely to continue the downtrend and most prior lows will be ignored,or produce small bounces that are likely to be shortable bounces. Ifthe stock is in an uptrend, and the stock is pulling back to a prior low,it is more likely the double bottom will hold (double top would fail)
and the uptrend will continue.2. What is the relative strength compared to the market in general, orthe sector the stock is in? Let’s take an intraday example. Let’s sayyou use the NASDAQ futures contract to represent the market. Let’ssay your stock is in an uptrend and has pulled back to a potentialdouble bottom. Let’s say the futures continue trading lower and takeout the days low. Your stock continues holding. If the futures getbullish, it is more likely that the stock will move off the bottom andproduce a strong double bottom and potential bullish move. Take thereverse example and it will be even clearer. Let’s say the same stock issitting on a potential double bottom while the futures are rallying hard.The futures rally into a resistance area and your stock barely movesoff the bottom. It is weak and not likely to hold the bottom when thefutures pullback.3. Where are the major moving averages? Identifying a 200 periodmoving average is a good way to help confirm the trend of the stock.Above the 200 confirms a strong stock, below confirms weak, whichcan help in determining the answer to question #1. Using the 20period moving average (MA) can help you determine when a stockhas moved too far in one direction. A ‘return’ to the 20 MA canindicate that the prior trend is now ready to resume. For example, astrong stock that has just pulled back to a prior low is more likely tohold as a double bottom if it is now meeting the rising 20 MA. Apotential double bottom that hits the rising 20 MA is a goodcombination for the stock to continue up. Conversely, a stock thatrallies up to the 20 MA and then quickly returns to the prior low is notas likely to hold as a double bottom.4. What is the measured amount of the last bounce compared to priormoves? Picture a stock on the daily chart that has been basing(consolidating) for days. It breaks down and falls 8 points, puts in alow, and then bounces 2 points. It then rolls over and goes back tochallenge the low. Another potential double bottom. This stock wouldnot be as likely to hold. It would be more likely to head lower. Why?After an 8 point drop, a 2 point ‘bounce’ is only a 25% retracement.That is not a sign of strength, even weak stocks should be able to

retrace 30-40% of the last move. Stronger stocks will do over 50%.Naturally some will do 100%. What if a stock does not even bounce,and simply ‘bases’ along the low or a prior low? It is likely theweakest sign of all. However you must look at the other criteria aswell.
For example, a stock is in a downtrend on a 5-minute chart. It is belowits 200 MA. On the last move, it dropped 2 points without much relief. Itis well below the 20 MA at this point and begins to move up. It rallies ahalf point into the declining 20 MA and rolls over and returns to the priorlow. It does all this while the futures have been relatively strong, apotential double bottom. This is one that is not likely to hold. I have usedthe above criteria to create a scenario that is least likely to produce abullish bounce. It is most likely to be a short, not a long.
On the other hand, picture a stock that has been in an uptrend on the 5-minute chart. It is above its 200 MA. The stock moves up in the morningand sets up a sideways base. It moves up another half point, and thenreturns to the base. As it returns to the base (potential double bottom), itmeets the rising 20 MA. All this happens while the futures have beenpulling back hard from an early uptrend. When the futures find theirfooting, this stock is the most likely to act bullishly off of the doublebottom.
All of the above comments apply equally as well for double tops, if youchange the appropriate wording. For example, picture a stock that hasbeen in a downtrend on the 5- minute chart. It is below its 200 MA. Thestock moves down in the morning and sets up a sideways base. It movesdown a half point, and then returns to the base. As it returns to the base(potential double top), it meets the falling 20 MA. All this happens whilethe futures have been rallying hard from an early downtrend. When thefutures resume selling off, this stock is the most likely to act bearishly offof the double top.
Let’s take a look at how these concepts apply on some real charts(Figures 5-2 and 5-3).
Figure 5-2: MICROSOFT CORPTo view charts in color go to: www.traderslibrary.com/TLEcorner

Figure 5-3: NASDAQ ICOTo view charts in color go to: www.traderslibrary.com/TLEcorner

Notice in the example below that on August 14, Microsoft (Figure 5-2)opened neutral and started a small downtrend on the 5-minute chart. Thisdowntrend was a continuation of the prior days downtrend. At 11:00 AMthe stock made a new low for the day and sound support at 65.2. Noticethe stock made not a double, not a triple, but a quadruple bottom over thenext 2 hours (points A, B, C, D). Many would say that a quadruplebottom must be a sign of strength! Take a look at the guidelines above, itwas not hard to predict that MSFT would head lower (that is to say, thedouble or multiple bottom failed) for the following reasons.
First, the stock was in a downtrend going into this time period. Since theopening, MSFT formed lower highs and lower lows. The trend is likely tocontinue. Second, compare the chart from 11:00 until 2:00 with theNASDAQ futures (Figure 5-3). Notice that the futures during this timeperiod had higher lows and broke to the upside at 12:45. During this timeperiod, MSFT did nothing bullish. When the futures returned to theiroriginal base, MSFT quickly broke down. Third, notice the declining 20MA on the MSFT chart. It is in red. It held as an almost perfectdowntrend line, containing every bounce by MSFT during this time
period. Finally, notice the bounces off of the bottom every time, shownby numbers 1, 2, 3, and 4. Notice the first bounce, from A to 1 went fromabout 65.2 to 65.55. That is .35, and the original fall was from about 66.1to 65.2. The retracement stayed well under half of the original fall.
Apply these same steps to see if you can predict the outcome of thesuccessful double top from E to F. A successful double top has a bearishoutcome, just like a failed double bottom has a bearish outcome. First, thestock was in a downtrend again. Second, the futures action was nothelpful in this case. The futures actually weakened so much that itcontributed to the fall of MSFT the next morning. Relative strength wasstrong and could have led to a break out if the futures would have heldbetter. However, check the third item; the powerful 200 period movingaverage (in white) came up on top of the prices, (that is to say the pricefell below the powerful 200 MA), which was an important item in thedouble top holding. Fourth, notice the bounce from E to 6. It was a 100percent retracement of the move going into point E, from 5 to E. Thismeans that the top is strong and the next challenge of the top is likely tofail.
Knowing about double tops and bottoms will help support your tradingplan.
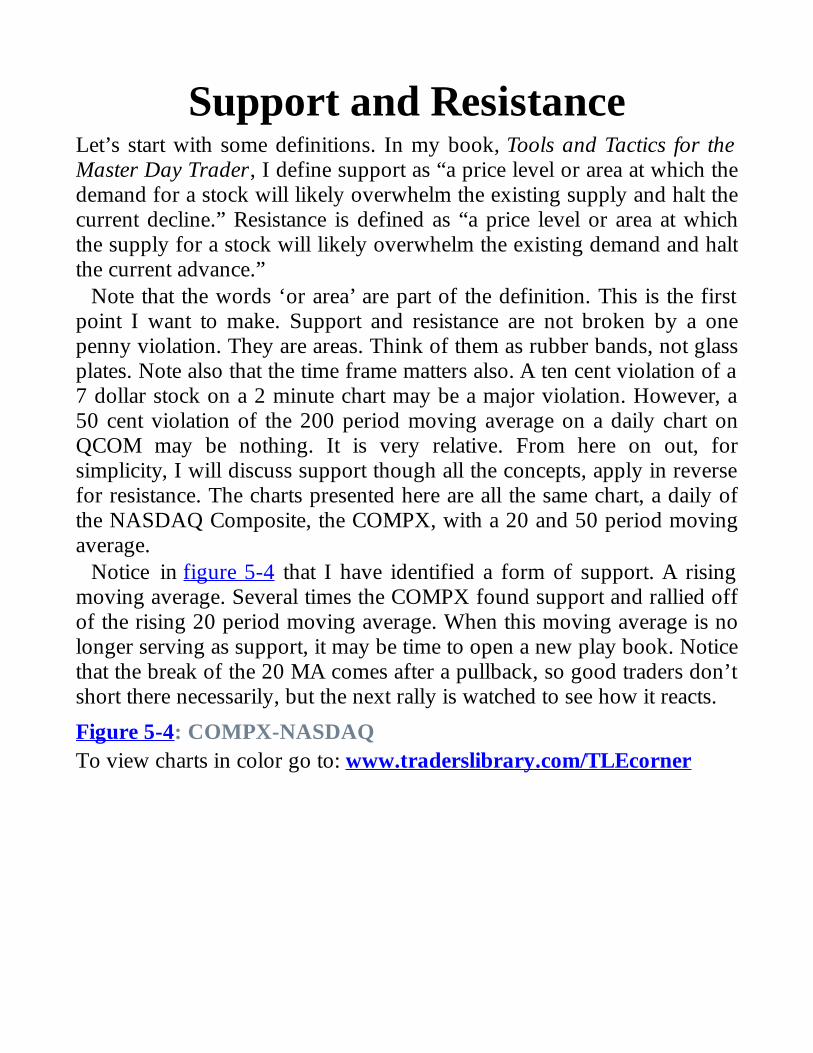
Support and ResistanceLet’s start with some definitions. In my book, Tools and Tactics for theMaster Day Trader, I define support as “a price level or area at which thedemand for a stock will likely overwhelm the existing supply and halt thecurrent decline.” Resistance is defined as “a price level or area at whichthe supply for a stock will likely overwhelm the existing demand and haltthe current advance.”
Note that the words ‘or area’ are part of the definition. This is the firstpoint I want to make. Support and resistance are not broken by a onepenny violation. They are areas. Think of them as rubber bands, not glassplates. Note also that the time frame matters also. A ten cent violation of a7 dollar stock on a 2 minute chart may be a major violation. However, a50 cent violation of the 200 period moving average on a daily chart onQCOM may be nothing. It is very relative. From here on out, forsimplicity, I will discuss support though all the concepts, apply in reversefor resistance. The charts presented here are all the same chart, a daily ofthe NASDAQ Composite, the COMPX, with a 20 and 50 period movingaverage.
Notice in figure 5-4 that I have identified a form of support. A risingmoving average. Several times the COMPX found support and rallied offof the rising 20 period moving average. When this moving average is nolonger serving as support, it may be time to open a new play book. Noticethat the break of the 20 MA comes after a pullback, so good traders don’tshort there necessarily, but the next rally is watched to see how it reacts.
Figure 5-4: COMPX-NASDAQTo view charts in color go to: www.traderslibrary.com/TLEcorner
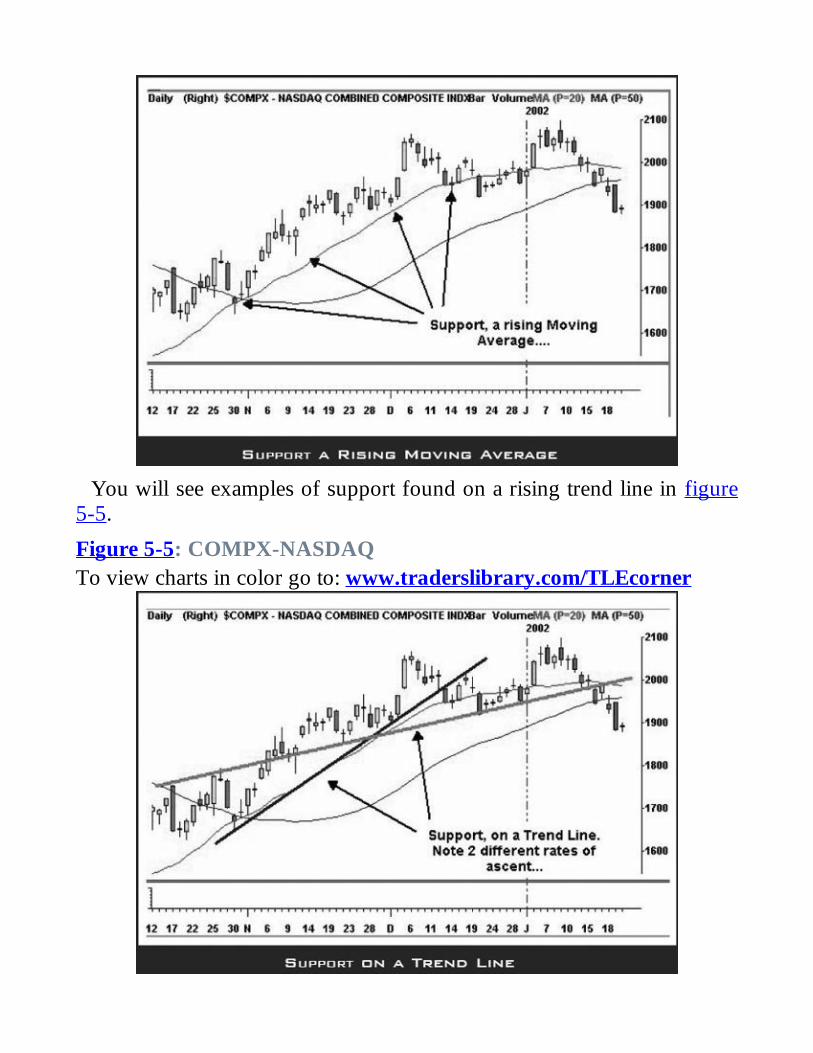
You will see examples of support found on a rising trend line in figure5-5.
Figure 5-5: COMPX-NASDAQTo view charts in color go to: www.traderslibrary.com/TLEcorner
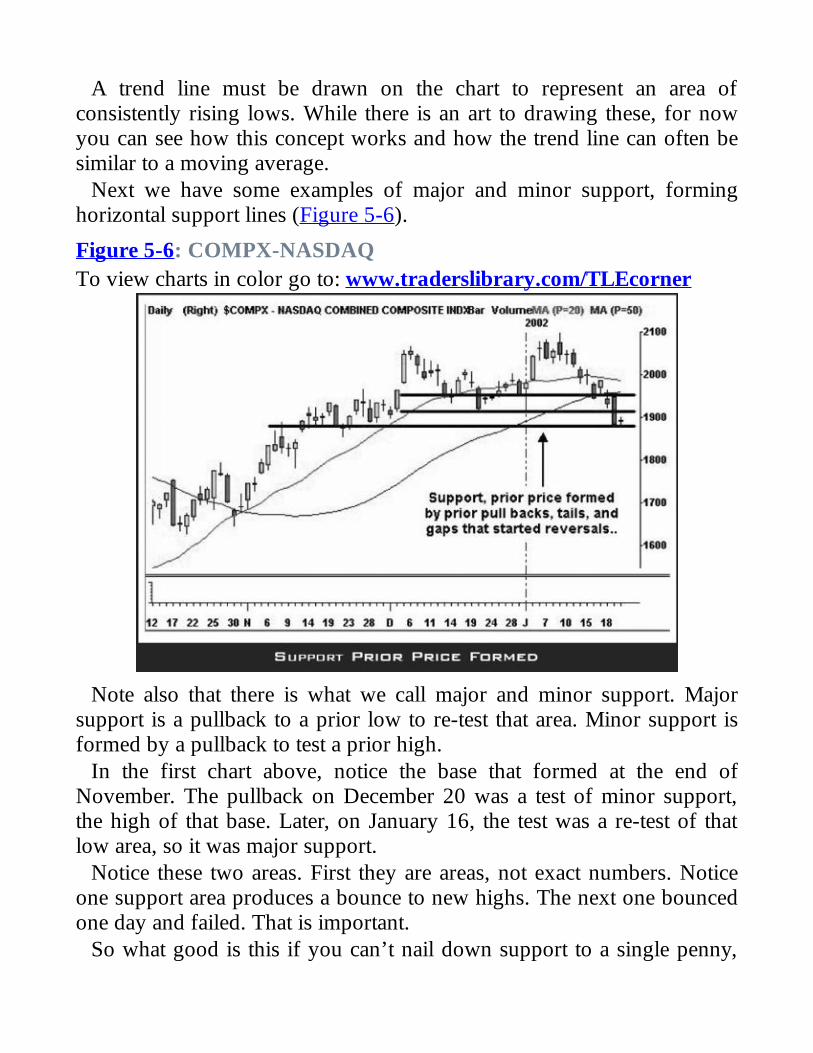
A trend line must be drawn on the chart to represent an area ofconsistently rising lows. While there is an art to drawing these, for nowyou can see how this concept works and how the trend line can often besimilar to a moving average.
Next we have some examples of major and minor support, forminghorizontal support lines (Figure 5-6).
Figure 5-6: COMPX-NASDAQTo view charts in color go to: www.traderslibrary.com/TLEcorner
Note also that there is what we call major and minor support. Majorsupport is a pullback to a prior low to re-test that area. Minor support isformed by a pullback to test a prior high.
In the first chart above, notice the base that formed at the end ofNovember. The pullback on December 20 was a test of minor support,the high of that base. Later, on January 16, the test was a re-test of thatlow area, so it was major support.
Notice these two areas. First they are areas, not exact numbers. Noticeone support area produces a bounce to new highs. The next one bouncedone day and failed. That is important.
So what good is this if you can’t nail down support to a single penny,

and if sometimes they fail? Isn’t trading supposed to be fool proof? Well,it is when we get in an area of support than we open up our playbook ofbullish strategies and wait for those strategies entries to hit. That is whywe teach strategies, and why they all have specific entries and stops andtargets.
We take the plays that have good entries and proper stops. This lets thetrades that work give good results, and the ones that don’t have smalllosses. The reverse is of course for resistance and bearish plays. It tellsyou the time and area that you should look in order to use the strategiesthat you have learned to trust.

That First PullbackThis will be a very simple yet powerful lesson. It is one you can beginusing immediately. You may have heard of this concept but perhaps arenot aware of the simple power it holds. It is a concept taught throughoutPristine. In the seminar, we go into great detail about handling the stagesof the market. After that, we discuss the advanced topic of how to handlethe transitions that occur to lead from one stage into another.Understanding the transitions can lead to the highest degree of marketmastery. While there is much to comprehend in this area, I would like toshow you two examples of how to handle a transition from a sidewaysconsolidation to an uptrend.
These are both examples of using what we refer to as ‘buy pointnumber two’. This is the safest (though not always the best) buy point.Let’s take a look at the 5-minute chart of Novavax Inc. (NVAX), ( Figure5-7).
Figure 5-7: NOVAVAX INC. (NVAX)To view charts in color go to: www.traderslibrary.com/TLEcorner

NVAX has a potential buy set-up on the daily chart. We were lookingto buy over the prior days high, as shown by the red line. While I decidedthis pattern on the daily was strong enough to play over the prior day’shigh, I had some concerns about this entry because: 1.) the daily chartwas not perfect on the pullback and 2.) the play was hitting in-betweenreversal times. I am a big believer in reversal times. This play hit a coupleminutes after 9:45 AM. The answer for those wanting to be moreconservative was to wait for the first pullback and analyze how it looks.
The pullback came at 10:20 AM and was a very nice Pristine Buy Set-up (see Appendix A) on the 5-minute chart. It had a bottoming tail (BT),formed at minor support (MS), the green line at the rising 20-periodmoving average (20ma), had the proper retracement form where the rallybegan (40/60), happened at reversal time (RT) and had relative strength tothe market (RS). Also, by playing this buy set-up, the stop could be usedunder the bottoming tail, providing a tight stop. Those who took thatmove aggressive entry over the high of the day had the option of addingon this pullback and raising the stop to the same bottoming tail.
So, if the aggressive entry worked in this case, why all the fuss about
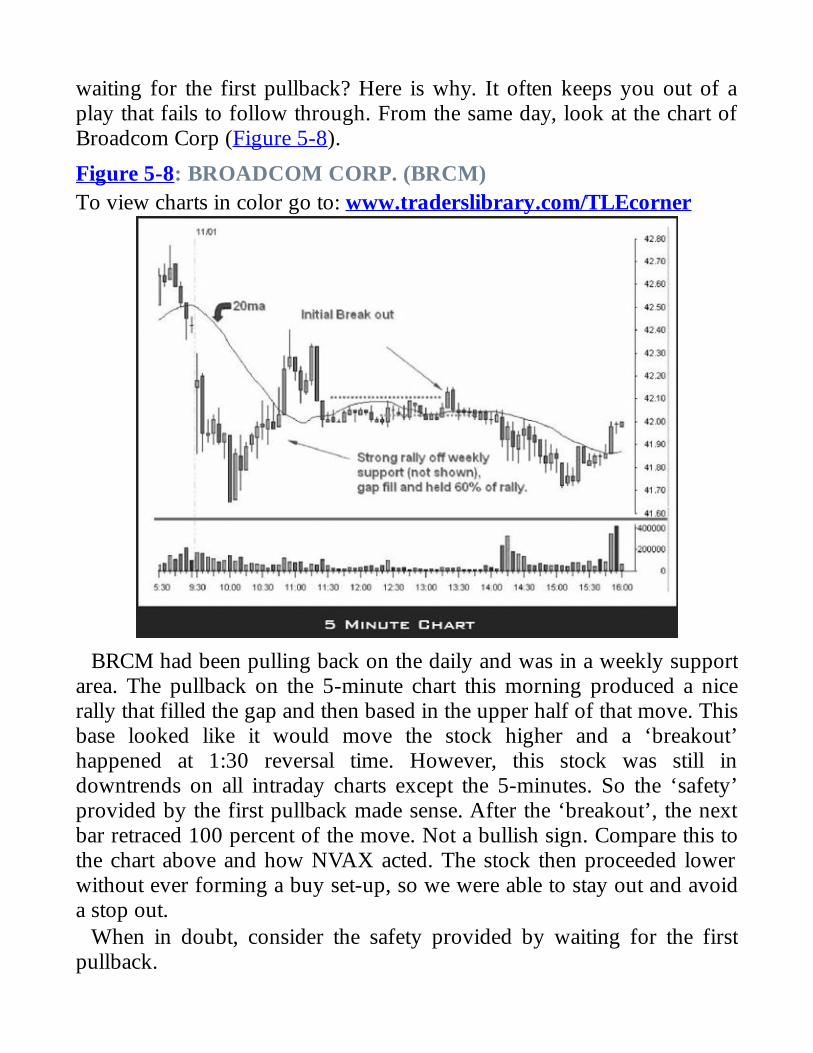
waiting for the first pullback? Here is why. It often keeps you out of aplay that fails to follow through. From the same day, look at the chart ofBroadcom Corp (Figure 5-8).
Figure 5-8: BROADCOM CORP. (BRCM)To view charts in color go to: www.traderslibrary.com/TLEcorner
BRCM had been pulling back on the daily and was in a weekly supportarea. The pullback on the 5-minute chart this morning produced a nicerally that filled the gap and then based in the upper half of that move. Thisbase looked like it would move the stock higher and a ‘breakout’happened at 1:30 reversal time. However, this stock was still indowntrends on all intraday charts except the 5-minutes. So the ‘safety’provided by the first pullback made sense. After the ‘breakout’, the nextbar retraced 100 percent of the move. Not a bullish sign. Compare this tothe chart above and how NVAX acted. The stock then proceeded lowerwithout ever forming a buy set-up, so we were able to stay out and avoida stop out.
When in doubt, consider the safety provided by waiting for the firstpullback.
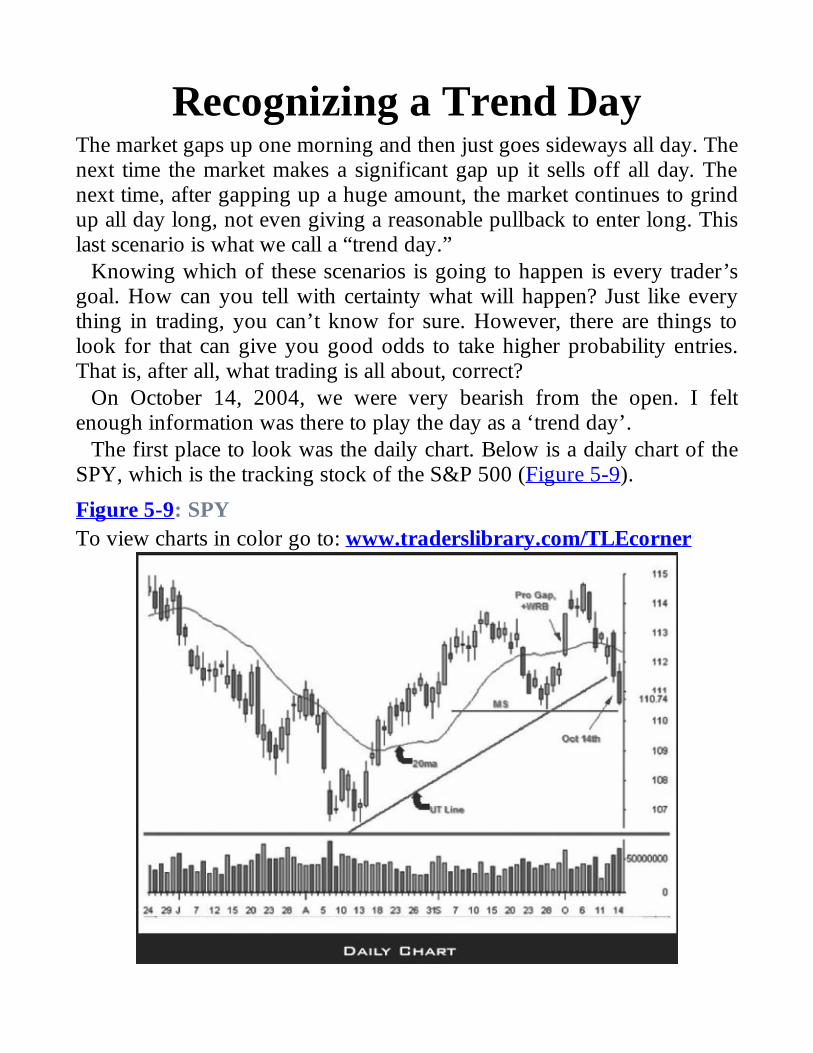
Recognizing a Trend DayThe market gaps up one morning and then just goes sideways all day. Thenext time the market makes a significant gap up it sells off all day. Thenext time, after gapping up a huge amount, the market continues to grindup all day long, not even giving a reasonable pullback to enter long. Thislast scenario is what we call a “trend day.”
Knowing which of these scenarios is going to happen is every trader’sgoal. How can you tell with certainty what will happen? Just like everything in trading, you can’t know for sure. However, there are things tolook for that can give you good odds to take higher probability entries.That is, after all, what trading is all about, correct?
On October 14, 2004, we were very bearish from the open. I feltenough information was there to play the day as a ‘trend day’.
The first place to look was the daily chart. Below is a daily chart of theSPY, which is the tracking stock of the S&P 500 (Figure 5-9).
Figure 5-9: SPYTo view charts in color go to: www.traderslibrary.com/TLEcorner
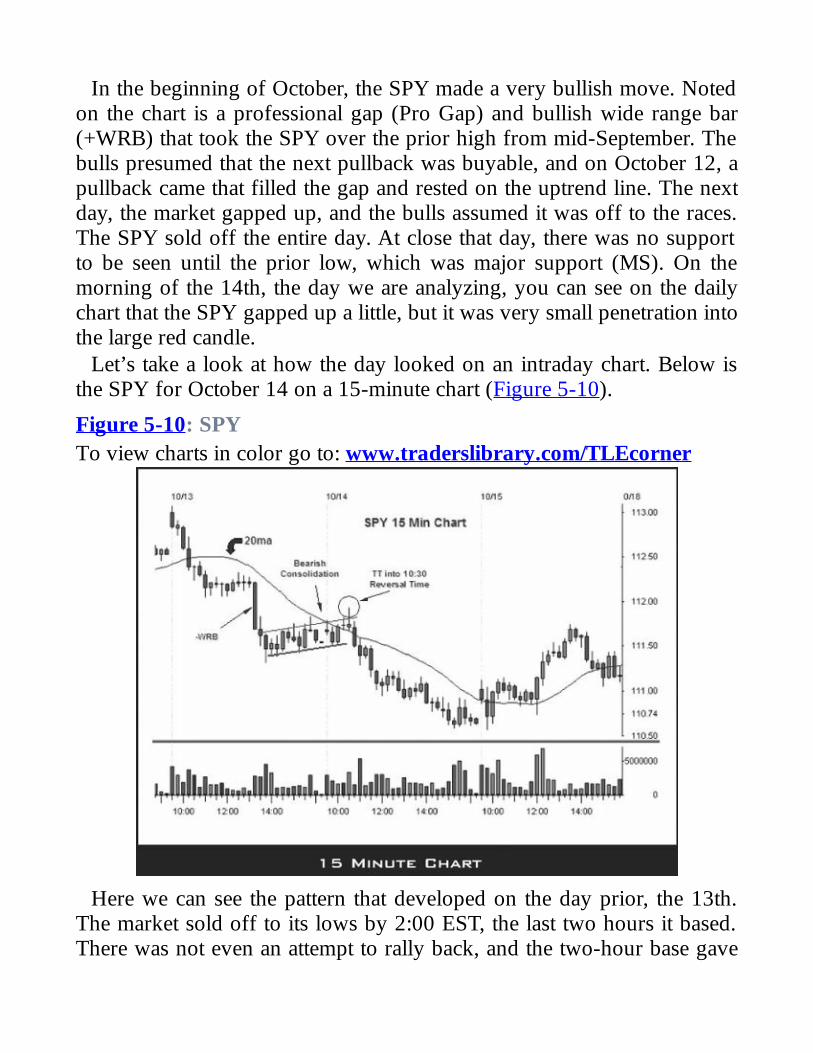
In the beginning of October, the SPY made a very bullish move. Notedon the chart is a professional gap (Pro Gap) and bullish wide range bar(+WRB) that took the SPY over the prior high from mid-September. Thebulls presumed that the next pullback was buyable, and on October 12, apullback came that filled the gap and rested on the uptrend line. The nextday, the market gapped up, and the bulls assumed it was off to the races.The SPY sold off the entire day. At close that day, there was no supportto be seen until the prior low, which was major support (MS). On themorning of the 14th, the day we are analyzing, you can see on the dailychart that the SPY gapped up a little, but it was very small penetration intothe large red candle.
Let’s take a look at how the day looked on an intraday chart. Below isthe SPY for October 14 on a 15-minute chart (Figure 5-10).
Figure 5-10: SPYTo view charts in color go to: www.traderslibrary.com/TLEcorner
Here we can see the pattern that developed on the day prior, the 13th.The market sold off to its lows by 2:00 EST, the last two hours it based.There was not even an attempt to rally back, and the two-hour base gave
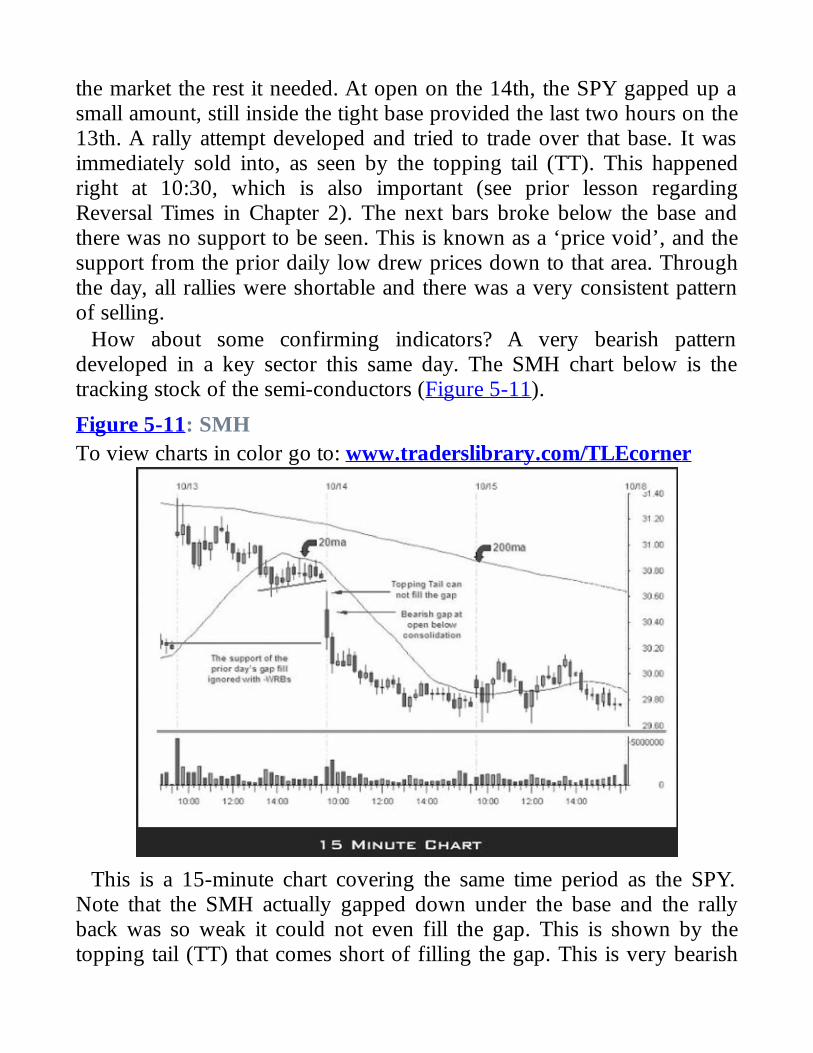
the market the rest it needed. At open on the 14th, the SPY gapped up asmall amount, still inside the tight base provided the last two hours on the13th. A rally attempt developed and tried to trade over that base. It wasimmediately sold into, as seen by the topping tail (TT). This happenedright at 10:30, which is also important (see prior lesson regardingReversal Times in Chapter 2). The next bars broke below the base andthere was no support to be seen. This is known as a ‘price void’, and thesupport from the prior daily low drew prices down to that area. Throughthe day, all rallies were shortable and there was a very consistent patternof selling.
How about some confirming indicators? A very bearish patterndeveloped in a key sector this same day. The SMH chart below is thetracking stock of the semi-conductors (Figure 5-11).
Figure 5-11: SMHTo view charts in color go to: www.traderslibrary.com/TLEcorner
This is a 15-minute chart covering the same time period as the SPY.Note that the SMH actually gapped down under the base and the rallyback was so weak it could not even fill the gap. This is shown by thetopping tail (TT) that comes short of filling the gap. This is very bearish
and the SMH is a key sector to watch. The SMH led the market downthroughout the year and also led the September rally. The SMH is alwayskey to the NASDAQ and therefore, to the broader market. It is hard tomount a rally without the semi-conductors.
Also, not shown here, is the TRIN for that day. The TRIN is a measureof selling pressure and we use it as a market internal to measure thestrength of the market. It is charted inversely, so a move up is bearish.The TRIN moved up during the first bar, to over 1.0, which is bearish,and held an uptrend or sideways base all day. This confirmed sellingpressure.
While the average day is filled with many turns and surprises, a carefulreview of multiple timeframes, gap analysis, and market internals can helpget the odds in your favor. Recognizing a ‘trend day’ when it occurs isone way to do that. Another way is to pay attention to multiple timeframes, which are discussed in the next lesson.

The Perspective of Multiple TimeFrames
The concept of handling multiple time frames is a very important topic fortraders to learn. It is necessary for all traders to understand this idea, as itaffects trading at all levels.
All the charts presented in this lesson are to analyze the market onemorning as seen through the NASDAQ 100 Trust (QQQQ). We arelooking at the implications of a morning breakdown and the expectedfollow through for the morning and the rest of the day.
From what we can see in this chart (Figure 5-12), the 10:00 declinebroke today’s low of the day and some support from the end ofyesterday. Is this as short as a scalp? Based on what is seen on this chart,some support has been broken. It is not enough to see ‘some’ supportbroken. We need to see more of this chart or the chart of the next highertime frame (5-minute, 15-minute) to analyze the trend and other supportlevels. While in a sense, there may be enough here to justify a ‘micro-scalp’, how does the trader know if this is a micro-scalp, half-day trade,day trade, or even more? A key to remember is that a ‘scalp’ is a timeframe, not a strategy. I will often hear traders try to justify an ill-conceived play by hiding behind the rationalization that it is a scalp. Abad trade taken for a shorter period of time is still a bad trade.
Figure 5-12: NASDAQ 100 TR UNIT (QQQQ)To view charts in color go to: www.traderslibrary.com/TLEcorner
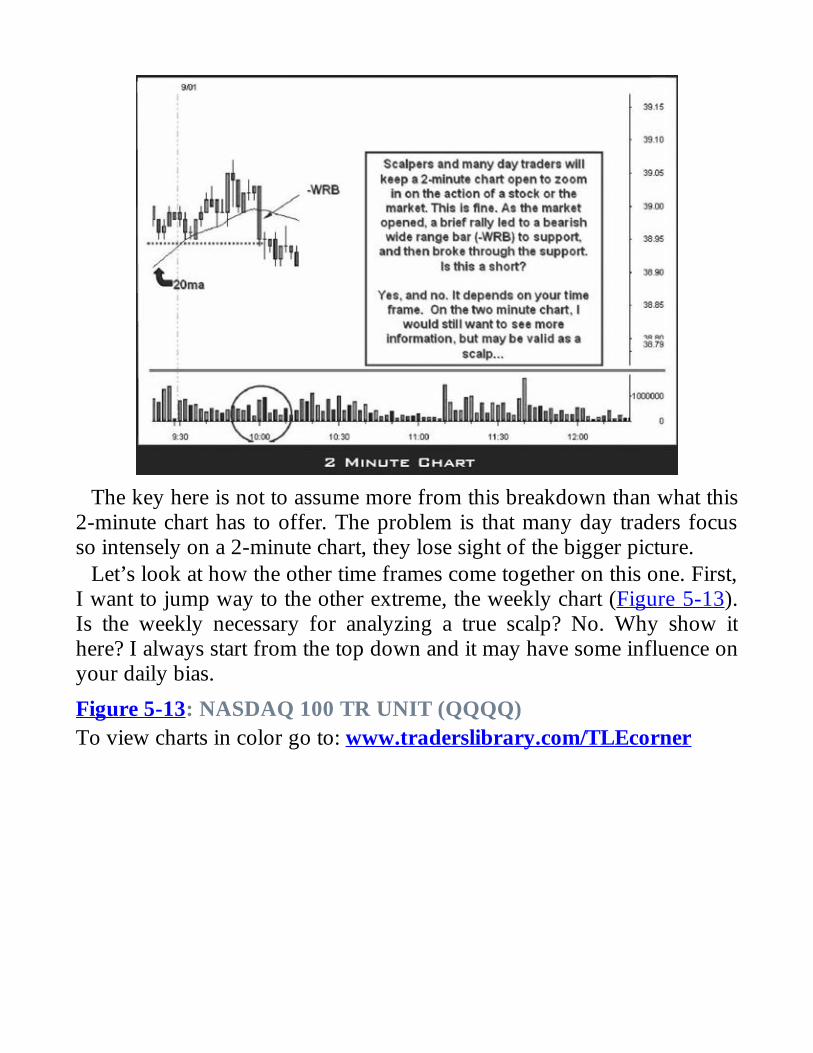
The key here is not to assume more from this breakdown than what this2-minute chart has to offer. The problem is that many day traders focusso intensely on a 2-minute chart, they lose sight of the bigger picture.
Let’s look at how the other time frames come together on this one. First,I want to jump way to the other extreme, the weekly chart (Figure 5-13).Is the weekly necessary for analyzing a true scalp? No. Why show ithere? I always start from the top down and it may have some influence onyour daily bias.
Figure 5-13: NASDAQ 100 TR UNIT (QQQQ)To view charts in color go to: www.traderslibrary.com/TLEcorner
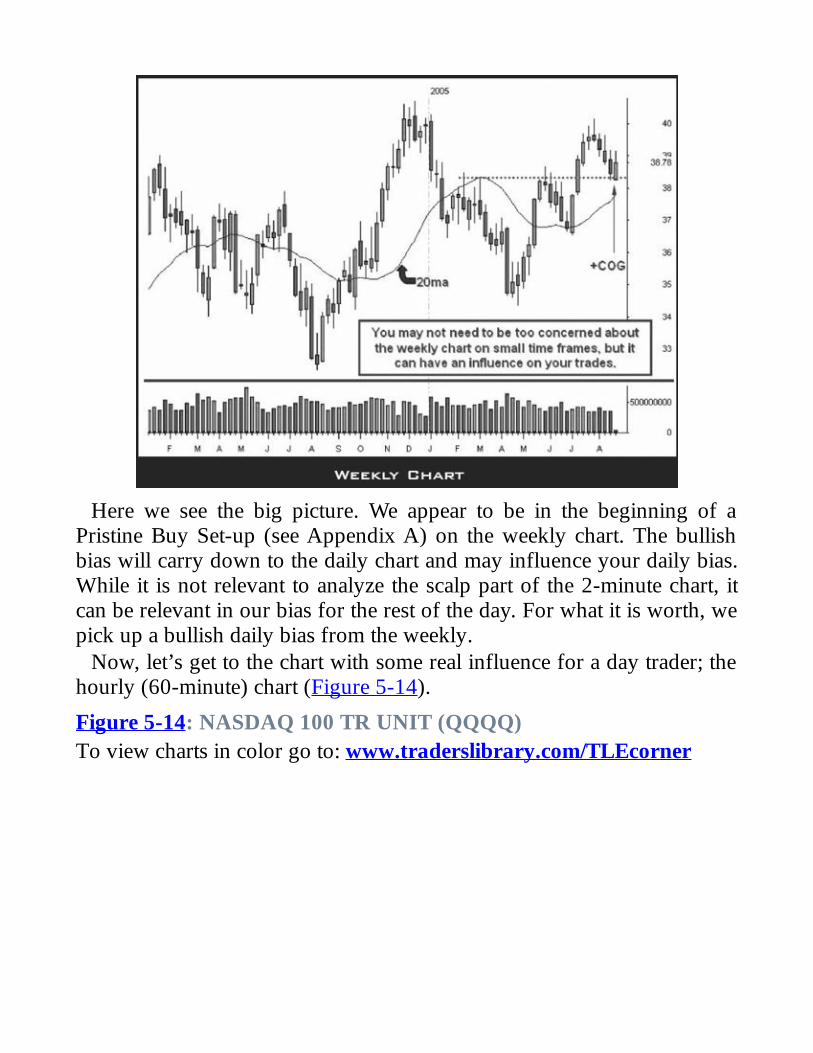
Here we see the big picture. We appear to be in the beginning of aPristine Buy Set-up (see Appendix A) on the weekly chart. The bullishbias will carry down to the daily chart and may influence your daily bias.While it is not relevant to analyze the scalp part of the 2-minute chart, itcan be relevant in our bias for the rest of the day. For what it is worth, wepick up a bullish daily bias from the weekly.
Now, let’s get to the chart with some real influence for a day trader; thehourly (60-minute) chart (Figure 5-14).
Figure 5-14: NASDAQ 100 TR UNIT (QQQQ)To view charts in color go to: www.traderslibrary.com/TLEcorner

Here we pick up some key information. When day trading, you do notwant to be against the hourly trend for long. Until 8/30/05, the hourly hadbeen in a downtrend for quite a while. We see for the most part, lowerpivot highs, lower pivot lows, trend lines pointing down, and pricestaying under the declining 20 period moving average (d20ma) most ofthe time. On 8/30/05 that higher low led to a series of higher highs (HH)and higher lows (HL) and a rally above the d20ma. The consolidation thatformed on 9/01/05, which is the day in question, was bullish. This gaveus a bias of wanting to be on the long side for the day, but the hourlychart is doing little to help us see a possible ‘entry’ to that long side. So,enter the 15-minute chart (Figure 5-15).
Figure 5-15: NASDAQ 100 TR UNIT (QQQQ)To view charts in color go to: www.traderslibrary.com/TLEcorner

Here, things begin to come clear. We enter this chart knowing that thebigger time frames will keep us with a bullish bias. Now we haveactionable areas. We can see that the original 2-minute breakdown thatbegan has enough room to fall to be an acceptable scalp, due to theextended move on the hourly and 15-minute charts. We also see a cleartarget area, the minor support offered by the ‘triple topping tail’ highs on8/31/05. As we hit this area, a very clean 15-minute Pristine Buy Set-up(PBS) forms right at a 10:30 reversal time. The PBS is at minor support,with bottoming tails, right around a 50% retracement and right at ther20ma. This rally takes us to a new daily high and our job it done.
In summary, the original 2-minute breakdown was acceptable as a shortscalp only because we had enough of a support area broken and there wasan extended move up that left a clear void of demand and the nextsupport area was far enough away to justify the play. The real play for theday trader was patience in waiting for reversal time, and a clean set-up ina clear demand area.
Zoom, Zoom, Zoom“Zoom” is short for zooming down. It is a term we use that refers togoing down one timeframe to find an alternate entry to a play. Forexample, on a daily chart swing trade you go down to the hourly chart tofind an entry. This alternate entry could be one that occurs after the largertime frame (daily in this case) entry hits, and you are playing the firstpullback. It can also be used before the larger time frame hits. In this caseit would be called ‘anticipatory’ because you are entering before the realplay even hits.
There are advantages and disadvantages in doing this. (Isn’t that alwaysthe case?) In general, anytime you go down a time frame for an entry,you are looking to improve the reward-to-risk one way or another. Thedisadvantage is that you may enter a play early (when anticipating) thatnever should have been entered, so you suffer a stop that you would nothave, had you waited. Or, when playing the first pullback, you may missthe play entirely, as the stock may never pullback.
Which is best? Well, it depends. It revolves around your intentions andstyle. Many people often zoom down too much and miss the play, to theirdetriment. If they wait for the first pullback, it never comes or they can’tfind the entry. If they anticipate, they stop out on their smaller time frame,but the play succeeds on the bigger one, the one they should have beenplaying.
If your trading plan requires you to be involved in serious swing trades,it is usually best to play them by the book. It will also revolve aroundhow you feel about having to enter the same trade 2-3 times whenstopped out at the first attempts. Some people can’t do that from apsychological point of view, some accounts can’t afford the extracommissions. This is sometimes required when zooming down. Somepeople take the attitude that ‘legging’ into a swing trade during the dayand holding it if it is doing well is the way to go. Here, a zoomed downentry is the answer.
Here is an example of a ‘triple zoom’. Why would you do this? It maybe used as just a great way to align multiple time frames. As in theexample below, perhaps you are not even interested in the swing trade.

But what better day trade is there than one that is in a swing trade mode?See the daily chart of Portable Player, Inc. (Figure 5-16). It was set up
as a possible swing trade on the last day shown. It had some positiveattributes as a swing. The daily was in a pretty nice stage two. It was at therising 20 period moving average. It had just broken to new highs on thelast rally. Some of you may notice some possible problems. It retracedwell over 50% of the last rally. It negated all of a powerful breakout bar.Swing tradable? Well, if you’re not sure, let’s see if we can ‘test’ an entryto see how it plays out. Notice the topping tail that formed on the last barof this daily chart? Not all topping tails are bad things. When I see atopping tail develop, I want to see how it forms.
Figure 5-16: PORTABLE PLAYER INC. (PLAY)To view charts in color go to: www.traderslibrary.com/TLEcorner
Next is the hourly chart for the same time period (Figure 5-17). Notethat here we see that topping tail on the daily, as a nice rally and bullishpullback. The retracement is well under 50% because the real movestarted the prior day. It sat above the newly rising 20 period movingaverage. The pullback was controlled. The Pristine Buy-Set-up (seeAppendix A) that formed hit on the gap up in the morning, but after the
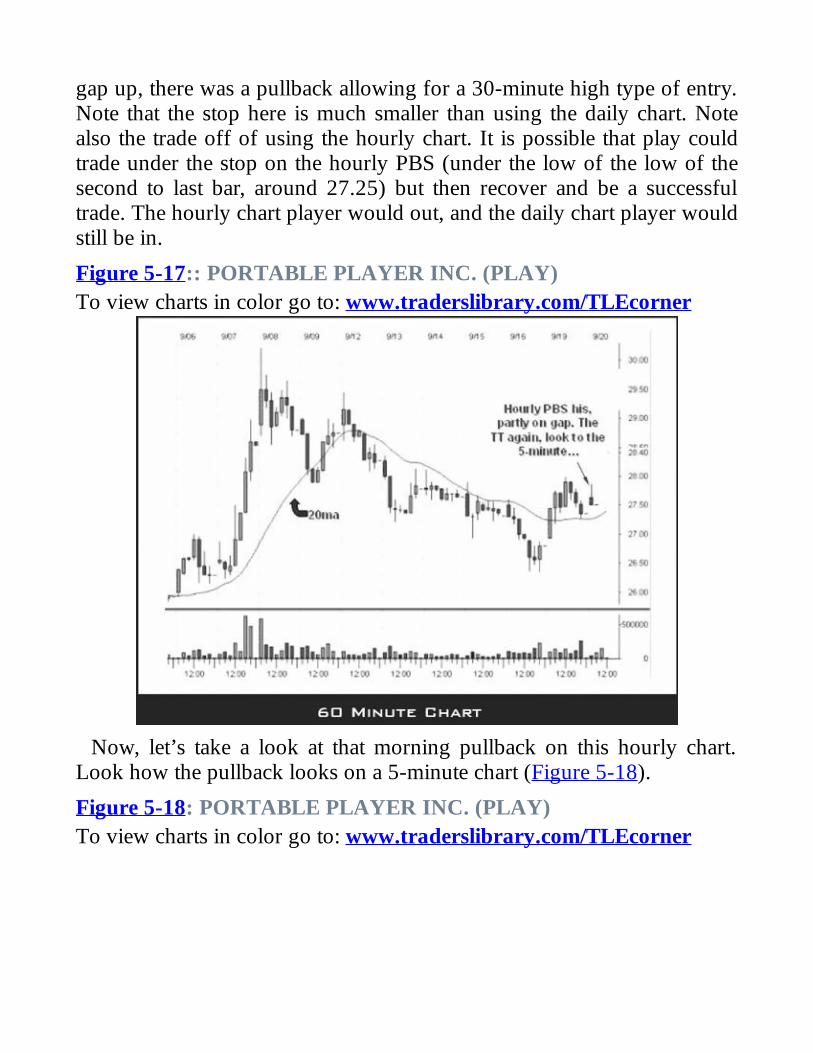
gap up, there was a pullback allowing for a 30-minute high type of entry.Note that the stop here is much smaller than using the daily chart. Notealso the trade off of using the hourly chart. It is possible that play couldtrade under the stop on the hourly PBS (under the low of the low of thesecond to last bar, around 27.25) but then recover and be a successfultrade. The hourly chart player would out, and the daily chart player wouldstill be in.
Figure 5-17:: PORTABLE PLAYER INC. (PLAY)To view charts in color go to: www.traderslibrary.com/TLEcorner
Now, let’s take a look at that morning pullback on this hourly chart.Look how the pullback looks on a 5-minute chart (Figure 5-18).
Figure 5-18: PORTABLE PLAYER INC. (PLAY)To view charts in color go to: www.traderslibrary.com/TLEcorner

On the 5-minute chart, you can see how the hourly topping tail formed.A quick move up for one 5-minute bar (a common sight, remember 9:35is a reversal time) and then a nice pullback to fill the gap, and a 5-minutePristine Buy Set-up (PBS) right at 10:00 reversal time. The stop on thisplay is about $.15 - $.20. Yes, we are looking at playing a nice 5-minutePBS that is happening on the pullback of a nice hourly PBS that ishappening on the pullback of a nice daily PBS! Is the application real?Yes, very. As I mentioned, there are two uses. First, as a scalper, a five-minute PBS that has the other time frames behind it can help drive theplay. You can see the reaction on the 5-minute chart. Second, whilezooming down twice may be a bit much for the swing trader, I would belying if I said this wasn’t done. You can play a large lot size with the tightstop of this play, and sell two lots intraday for profit, keeping the numberof shares appropriate for you to hold as a swing. Then, if the swing tradedoes not work, you are more than likely profitable on the whole trade.
Daily Pivot PointsWhen you look back at daily charts of stocks or indices, they will alwayshave certain things in common. Most stocks will spend the majority oftheir time trading in a sloppy, non-directional pattern. You will alwaysfind some trends, and you will always find key areas on the chart that setsignificant highs or lows that last for weeks or months. This lesson isabout finding those key areas and capitalizing on them.
When stocks are in a nice trend, a consistent pattern develops. These arethe ones that we like to trade the most. They have a clean uptrend, or aclean downtrend, or even a clean sideways trend. After all, there are onlythree ways a stock can trend, correct? By clean, I mean that the bars onthe chart tend to follow support and resistance lines (major, minor, or atrend line), they respect moving averages in a consistent way, andcontinue in the same direction for long periods of time. The bars do notoverlap, nor are there spaces between them (both of these caused bygaps).
What happens when the stock breaks tradition? Changes trend? Fallsabruptly then reverses? Many of the patterns we know become worthless.Is all lost? No. I teach concepts regarding guerrilla tactics, and conceptsregarding Wide Range Bars, Gaps, and failed expectations that can help.These concepts can help you do what most say cannot be done. That is, topick short term to medium term tops and bottoms with amazing accuracy.Let’s take a look at the chart below (Figure 5-19).
Figure 5-19: MICROCHIP TECHNOLOGIES (MCHP)To view charts in color go to: www.traderslibrary.com/TLEcorner

Generally speaking, the MCHP daily chart is in an uptrend, as shown byhigher highs and higher lows. Since we are in an uptrend, I simplyidentified the long-term bottoms that were formed. These are arrows A,B, and C. Were these areas playable? Let’s take a look.
Arrow A is a guerrilla tactic I teach. It is called a Bullish 20-20 play.The key to the formation is that last big red bar just before the arrow. Thestock had six lower highs, and then had the largest sell-off (red) bar inrecent history. This is a Wide Range Bar (WRB) or a 20/20 Bar (meaningless than 20% tails), which sets up the play. This happens on increasedvolume. The stock opened flat the next day and the strategy is to go longover the high of the day after 30-minutes of trading. This sets a low thathas not been violated to date. Besides being a viable trade, this was a highvolume guerrilla tactic that changed the short-term direction of the dailychart.
Let’s look at arrow B. This is a guerrilla tactic I called a Minor BullishMortgage Play. The pullback going into B is starting to look bearish. Wewere not able to stay above the moving averages, and the pullbackchallenges the prior low. Going into B, we have 4 lower highs (6 out of 7also). Then a WRB forms again (not as big as some, which is why this islabeled ‘minor’). Then the stock gaps open at or above the high of the

prior days bar. Note that MCHP closed at the bottom of that red bar, thenopens the next day near the top. The stock sets a higher low, which hasnot been violated to date.
Next we have arrow C, another guerilla tactic known as a Bullish Gapand Snap Play. Again, five days down followed by a Bearish (red) WRB.This time the stock gaps down, setting up the long entry as the stockpenetrates the low of the prior day (or sometimes a 5-minute high if it is aGap and Snap Plus Play). Again, MCHP sets a higher low, which has notbeen violated to date. Look at the increased volume at the low. Onceagain, a high volume guerrilla tactic that changed the short-term directionof the daily chart.
There are so many other points to be made. Look at the tops.Remember, the general trend is up, so we are not looking for major chartchanging reversal at the top. However, notice how all the pullbacks startwith a Topping Tail after a multiple bar run. These are the four circles.Notice the WRB breakout that is never challenged. There are many othervaluable clues. One of them, staying with the trend, is discussed in thenext lesson.
Fighting the TrendYou will hear many famous quotes while learning to trade. None will bemore enduring than “The trend is your friend.” All successful tradersknow to stay with the trend 92% of the time. That 8%, when a traderfights the trend, is only on a climactic set-up. The climactic set-up has avery firm set of rules that must be followed to play and one of the rules isthat a retracement target is used, not a ‘new high or low.’
This article is not about the climactic set-up. Rather than explain astrategy that you should only use eight percent of the time, I would like toexplain why you should stay with the trend 92% of the time.
First, is the concept that trends tend to stay in place until a shockingoccurrence happens or the bigger time frame comes into conflict. Thesecond reason is just a matter of simple math. Since we are not trying tocatch the absolute highs and lows, we are trying to take the meat out ofany move, that easy part in the middle. If a stock moves twice the distanceon the up moves than on the down moves, isn’t it easier to take a part outof the up move? Let’s take a look at a typical uptrending chart, (Figure 5-20).
Figure 5-20: MERQ INTERACTIVETo view charts in color go to: www.traderslibrary.com/TLEcorner

This is an example of a nice uptrend. Once the uptrend is under way,notice the size of the move up, which is shown as the distance from A toC in both cases shown on the chart. Compare this to the size of the movedown, which is the distance from C to B. Notice that the move up is abouttwice the move down. This is not an accident. Remember, in a niceuptrend, we like to see pullbacks end in the area of a 50 percentretracement.
So, the odds are twice as good to catch a move up, since the range ofmotion is twice as large on a move up, correct? Actually, there are evenmore reasons to favor the trend. Think about it. If you are using a smallertarget, your reward to risk ratio will also be smaller. This is due to the factthat the ‘stop’ cannot be decreased. Let’s say you wanted to short the redbar at the arrow labeled 1. Your target is going to be half or less of themove up, yet you must still use the high of that daily bar if you are usingthe daily chart. So, you have a low odds play, with the reward-to-riskratio only half of what it is on the long side. Convinced yet?
Well, what if you say that you will change the stop based on intradaycharts so you can get a better risk reward? Well, here is the other catch.When playing with the trend, long in this case, the moves are usually

fluid and true. When playing against the trend, short in this case, themoves are often very whippy. Look at the charts below and see whathappens when you try to keep a tight stop on the play.
Let’s say you try to keep your stop tighter. Next is the 5-minute chartfor 11/03 (Figure 5-21), which is that first red bar on the daily chart. Thestock falls hard on the initial move to point A. A logical spot to placeyour stop later if working on the 5-minute chart is at the point B. Notice,this gets stopped out when the stock rallies to C. Even though the dailycontinued down, it was hard to manage if you did not use the wide dailystop.
Figure 5-21: MERQ INTERACTIVE - 11/03To view charts in color go to: www.traderslibrary.com/TLEcorner
Try the next day, November 4 (Figure 5-22), if you saw the red bar onthe daily chart the night before. Again, the stock falls hard to point A, andif you want a tighter stop than the daily chart, your only real choice is thebase at B. Again, the rally trades over that stop, and continues muchhigher. Even though the daily chart did continue down.
Figure 5-22: MERQ INTERACTIVE - 11/04

To view charts in color go to: www.traderslibrary.com/TLEcorner
The bottom line is that it’s against the odds to go against the trend, it hasa smaller potential target and the trade is harder to manage. Good tradersknow that the trend is truly your friend.

How a Trend EndsAs I’ve said, the trend is your friend. Traders should trade with the trendthe vast majority of the time unless you understand and know what toexpect. The number one mistake most traders make is trying to ‘guess’when the trend will end. However, all trends do end. Understanding thesigns to look for is one of the keys to successful trading. It is called a‘transition’, and it will help you to know: 1.) when to exit current playsthat are with the trend, 2.) when to stand aside, and 3.) when the odds arewith you to play the new trend.
Take a look at the daily chart of AES Corporation ( Figure 5-23). Thereare so many concepts on this chart, it could be the subject of severallessons. Today, I want to focus on the numbers 1-9, and the end of thistrend.
Figure 5-23: AES CORP. (AES)To view charts in color go to: www.traderslibrary.com/TLEcorner
On the left side of the chart, AES is in a beautiful uptrend we like to callStage 2. There are many issues to look at on this chart, but our focus here
is how this trend ends. Suffice it to say, we have higher highs and lows,and are above rising moving averages. One thing to note is that this is avery strong uptrend. The uptrend line (UTL) is very steep and the price isstaying above the rising 20 period moving average (r20ma) even onpullbacks.
After a long strong rally, a topping tail forms at 2. The issue to look atas the stock starts pulling back is how far and fast it pulls back. Notice thepullback to 3. Note the size of the red bars. They are the biggest on thechart at that time. Notice the bottom tails fail every day. Notice that it doesnot hold until it trades under the prior low pivot 1. This fall breaks theuptrend line, but that is not hard to do. Steep rallies like this create steepuptrend lines, which can break without meaning much. Note after theUTL breaks, then the last pivot also does not hold. That lower lowtechnically ‘breaks’ the uptrend.
So where does the stock go from here at point 3? There is a simpleconcept from here. The bounce can be played long, but we do not expectto make new highs. We look for a retracement target long, (partial moveto prior high) or just stand aside. Point 4 is what is key. It is a retest andfailure (to break to a new high) forming a lower low pivot. Aggressivetraders can short this as the top of a newly forming base, or as thebeginning of a new downtrend.
Note the clear confirmation at point 5. After a four bar pullback, insteadof threatening a rally, the stock gaps down. This stock has been strongprior to this and also had a four-day move down. Add to that the fact thatit gapped right to the support of the last pivot 3, the gap brings in buying.However, again, the rally makes another lower high 6. As the stock brokeout to 6, it came out of a small base, giving a very bullish look to themove up. However, the big picture of this stock has changed. Rallies arebeing used for big sellers to unload stock, and the failure of that green barleading up to 6 is another sign of the stocks new trend.
That last sign of weakness brings in a steady pattern of selling. We arenow continuing the downtrend that has already shown two or threeentries. Now the stock just ‘bleeds’ for two weeks. Notice there is almostno buying. As the stock breaks below the major support area of pivots 3and 6, a bottoming tail forms. The stock was quite over sold at that point,

and it is not a good time to initiate new shorts. Watch the rally, and lookto short the rally if the set-up is good. The rally was weak, and the nextbreakdown produces bearish wide range bars at point 9. Notice thebearish wide bars come after a long fall already occurred, and on bigvolume. This will likely end the move down for now. Notice also that weare right back to the base that started the break out.
Traders had several entries both long and short. Investors, even with aperfect entry (and I wouldn’t assume that) are back to break even at best.Charts are the footprints of big money. Charts are the only thing in themarket that does not lie. Learn to understand charts, and you’ll learn howa trend ends.

The Intraday TrendMany trader’s like to play the intraday time frame for scalps or short daytrades. Often these traders get very involved with 1, 2, and 5-minutecharts, and rarely look to anything bigger. This can be a mistake, as manydecisions must be made in light of the bigger time frame. They may notlook to the bigger time frame, because the daily chart is too slow to showtrends, or is often trendless. What is the answer? Look to a larger intradaytime frame such as a 30, 60, or 180-minute chart to gain insights on yourintraday bias.
Below is a 180-minute chart (Figure 5-24) of the tracking stock for theNASDAQ 100, the QQQQ. The chart pictured covers about 14 days oftrading.
Figure 5-24: NASDAQ 100 TRUST (QQQQ)To view charts in color go to: www.traderslibrary.com/TLEcorner
Coming into the left side of the chart, on May 20, we are in an uptrend.We are above a rising 20-period simple moving average, and making“higher highs” and “higher lows.” When we talk about making “higherlows” we are referring to the “pivots” that form, the “V” bottoms. They

are the bars that set a low, and then have a certain number of bars withhigher lows on each side. When we talk about “higher highs” we arereferring to the “pivots” that form, the “V” tops. They are the bars that seta high, and then have a certain number of bars with lower highs on eachside.
The purpose of analyzing the trend of a chart like this is to give us abias to the direction of the intraday chart. When this chart is in anuptrend, intraday traders should favor going long on pullbacks. Basesshould be favored to break to the upside if all else is equal. When thischart stops the uptrend, it must be analyzed to see if it is going to gosideways, switch to a downtrend, or resume its former uptrend. Thereverse is true for a downtrend. The best plays come while this chart is ina pure trend (either up or down).
Another good rule to follow on a chart like this is to stop playing thecurrent trend when the price gets extended far from the 20 period movingaverage. This is a visual concept, but you might look at a minimumguideline of about 2 percent of the stock price.
On the chart above, the 1 represents the heart of the uptrend that is inplace. The wide green bar at 2 shows the uptrend is still in place, but notethat the next pivot high, 3, is barely a higher high. We are still in anuptrend, but it is a warning. Notice the next pullback, 4, makes an equallow, not a higher low. The uptrend has weakened, and when 5 puts in alower pivot high, we can now begin playing this as a downtrend. A seriesof lower highs and lower lows follows and continues a nice downtrend allthe way to 6.
Notice the rally off of 6 continues up strong until it trades over the priorpivot highs, a sign that the downtrend is over. The next pullback sets up abase, with a series of bars with similar highs and lows, between 7 and 8.This is congestion, confusion, and time to go easy on the intraday tradesas there is no clear trend. Note the wide range red bar, 9. This is igniting anew move down and we can assume a downtrend will resume. Thisdowntrend results in a “parabolic” drop, and by the time we approach 11,we are quite extended from the 20 period moving average. This shows itis now time to cover and relax.
Does it look easy now? Sure it does, we have the advantage of

hindsight. This chart was not hand chosen; it is simply the chart of themarket over the last 14 days. This works on any set of days you wish tolook at. If you do not have a system for forming a market bias for yourday trades, consider incorporating the intraday trend.
Finding an Intraday ReversalThe hourly chart (or anything from a 30-minute to a 180-minute chart) isan amazing chart. As a swing trader, many entries can be taken from thischart. By zooming down to the hourly chart, you can find support andresistance areas for refined entries and targets which can be used toincrease probabilities and to improve the reward-to-risk on a play. Also,in tight or basing markets, the hourly chart can be used directly to swingtrade. This will develop tighter stops and use smaller targets. That isexactly what is needed in a narrow market.
What about for the intraday trader? As mentioned above, the hourly canprovide entry signals that can be used for day trades. Also, the 60-minutechart is key to helping us determine the intraday trend.
Additionally, it can help you find reversal points. By using the hourlychart as a guide, and then zooming down to a smaller time frame, you canfind low risk entries to catch reversals intraday. The next chart is anhourly chart of the QQQQ (NASDAQ 100 Trust, tracking stock). Itshows the ‘NASDAQ Market’ over an 11-day period. We are focusingon the last two days, 8/10 and 8/11 (Figure 5-25).
Figure 5-25: NASDAQ 100 TRUST (QQQQ)To view charts in color go to: www.traderslibrary.com/TLEcorner

This was a choppy period in the market, in the beginning of the summerdoldrums. One fact that we know at this time, there was a high degree offailure in breakouts and breakdowns. Look at the move from 1 to 2. Itwas a parabolic drop that actually broke the support to the left. However,this happened after a six bar drop. This is not the time to short. It is betterto wait for the next rally. Also, that rally may provide a tradable bounceto play long. We want to examine how to zoom down, to play thisclimactic move down for a bounce long. Naturally we could look for abuy set-up on the hourly chart. The problem is that the last bar is a widebar, which will require a wide stop. Since the target is a ‘retracementtarget’, small, we cannot afford a wide stop. So let’s look for a strategyon a smaller time frame.
Next we have the five minute chart of the two days in question (Figure5-26). Let’s run through the numbers posted on this chart and analyzehow this pattern works.
Figure 5-26: NASDAQ 100 TRUST (QQQQ)To view charts in color go to: www.traderslibrary.com/TLEcorner
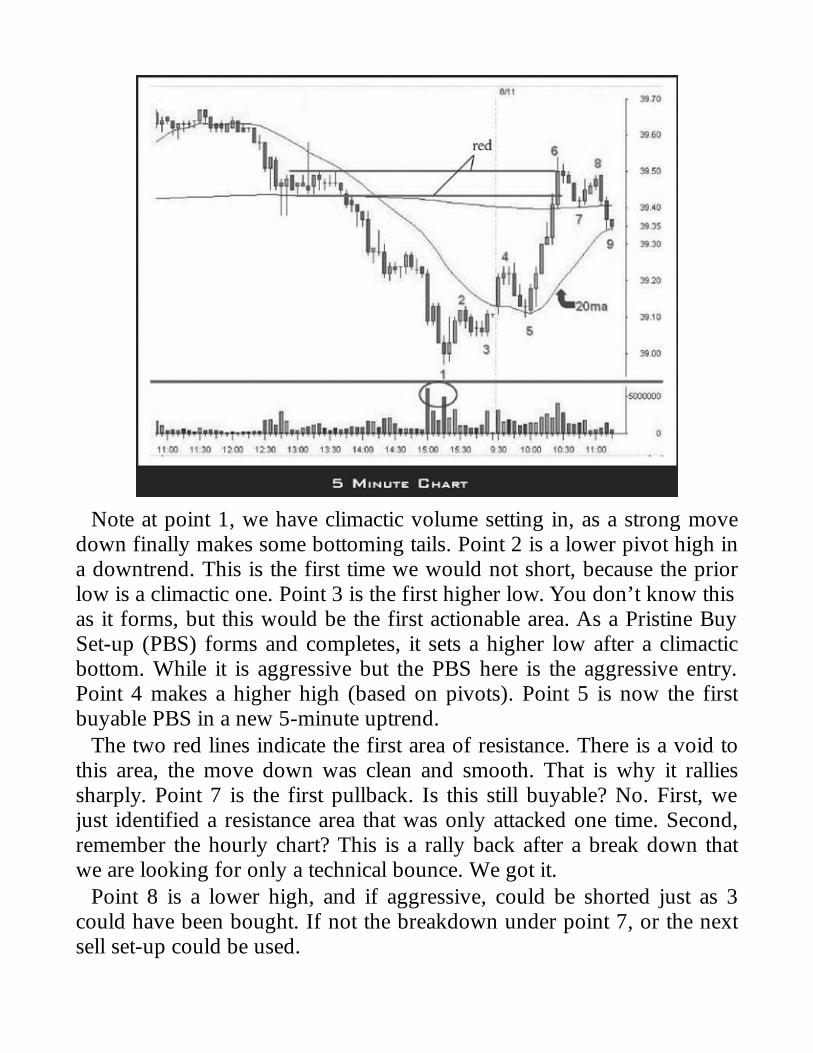
Note at point 1, we have climactic volume setting in, as a strong movedown finally makes some bottoming tails. Point 2 is a lower pivot high ina downtrend. This is the first time we would not short, because the priorlow is a climactic one. Point 3 is the first higher low. You don’t know thisas it forms, but this would be the first actionable area. As a Pristine BuySet-up (PBS) forms and completes, it sets a higher low after a climacticbottom. While it is aggressive but the PBS here is the aggressive entry.Point 4 makes a higher high (based on pivots). Point 5 is now the firstbuyable PBS in a new 5-minute uptrend.
The two red lines indicate the first area of resistance. There is a void tothis area, the move down was clean and smooth. That is why it ralliessharply. Point 7 is the first pullback. Is this still buyable? No. First, wejust identified a resistance area that was only attacked one time. Second,remember the hourly chart? This is a rally back after a break down thatwe are looking for only a technical bounce. We got it.
Point 8 is a lower high, and if aggressive, could be shorted just as 3could have been bought. If not the breakdown under point 7, or the nextsell set-up could be used.

This is a common pattern we use to find an intraday change of trend. Tofind out more about in changes in trends, see the next two lessons.
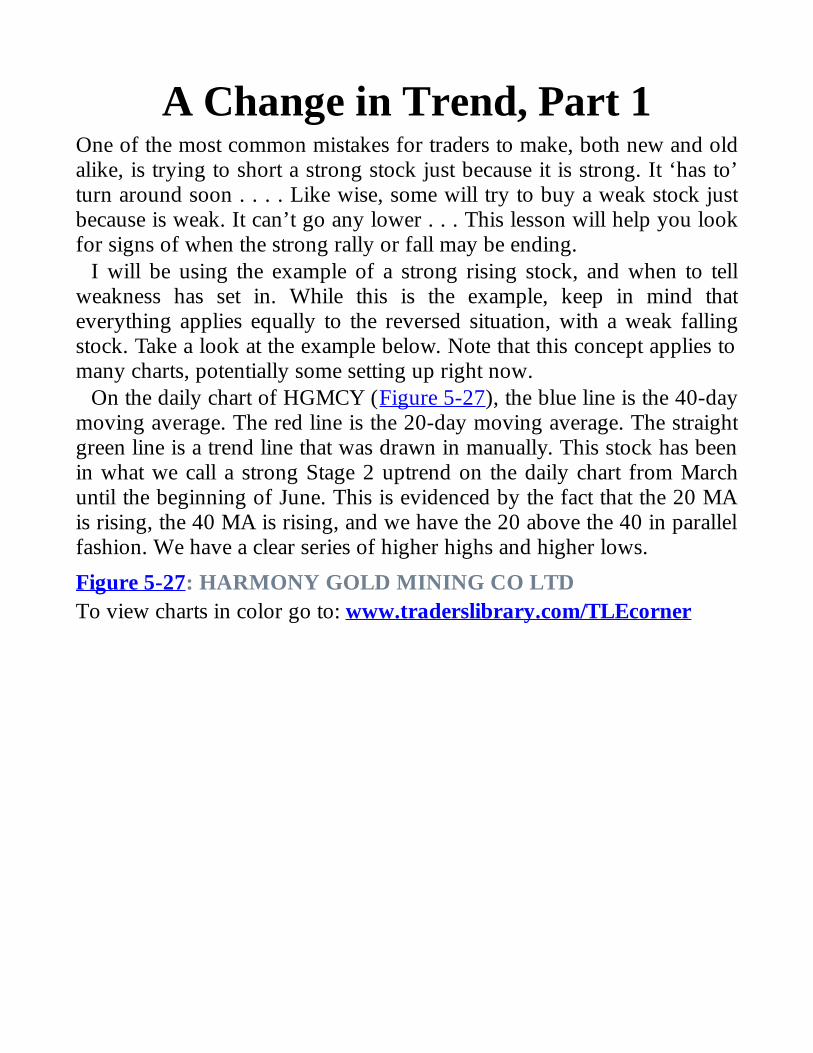
A Change in Trend, Part 1One of the most common mistakes for traders to make, both new and oldalike, is trying to short a strong stock just because it is strong. It ‘has to’turn around soon . . . . Like wise, some will try to buy a weak stock justbecause is weak. It can’t go any lower . . . This lesson will help you lookfor signs of when the strong rally or fall may be ending.
I will be using the example of a strong rising stock, and when to tellweakness has set in. While this is the example, keep in mind thateverything applies equally to the reversed situation, with a weak fallingstock. Take a look at the example below. Note that this concept applies tomany charts, potentially some setting up right now.
On the daily chart of HGMCY (Figure 5-27), the blue line is the 40-daymoving average. The red line is the 20-day moving average. The straightgreen line is a trend line that was drawn in manually. This stock has beenin what we call a strong Stage 2 uptrend on the daily chart from Marchuntil the beginning of June. This is evidenced by the fact that the 20 MAis rising, the 40 MA is rising, and we have the 20 above the 40 in parallelfashion. We have a clear series of higher highs and higher lows.
Figure 5-27: HARMONY GOLD MINING CO LTDTo view charts in color go to: www.traderslibrary.com/TLEcorner
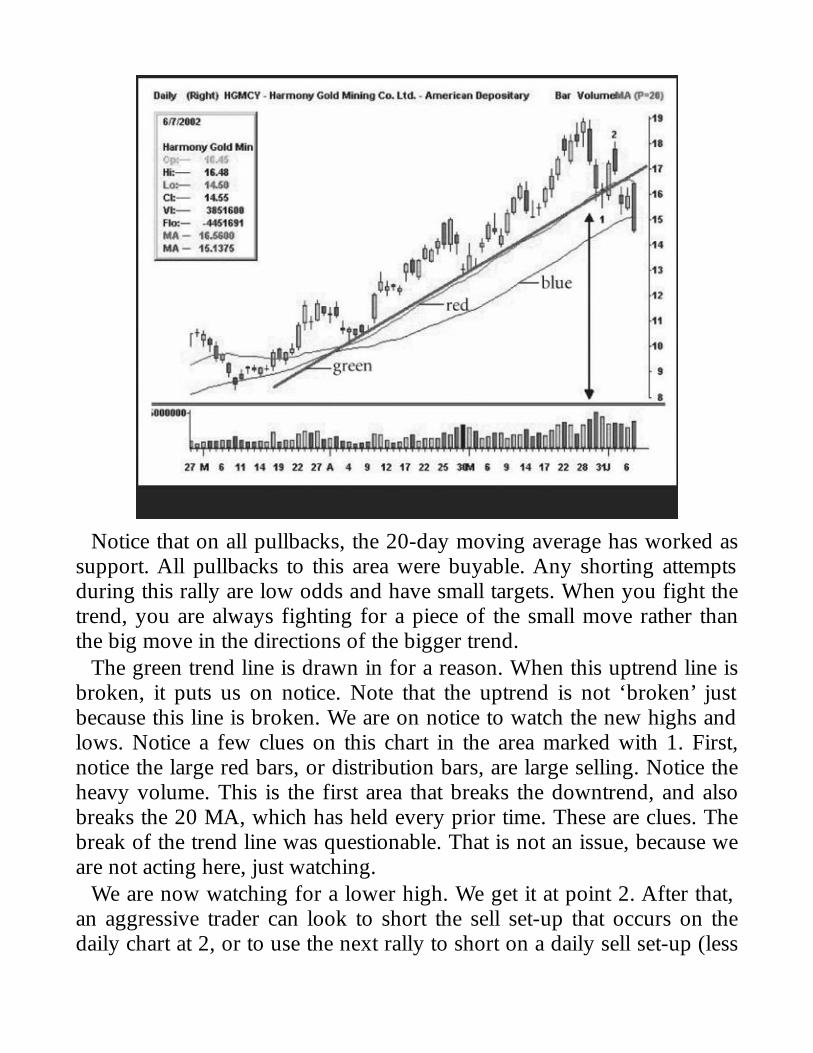
Notice that on all pullbacks, the 20-day moving average has worked assupport. All pullbacks to this area were buyable. Any shorting attemptsduring this rally are low odds and have small targets. When you fight thetrend, you are always fighting for a piece of the small move rather thanthe big move in the directions of the bigger trend.
The green trend line is drawn in for a reason. When this uptrend line isbroken, it puts us on notice. Note that the uptrend is not ‘broken’ justbecause this line is broken. We are on notice to watch the new highs andlows. Notice a few clues on this chart in the area marked with 1. First,notice the large red bars, or distribution bars, are large selling. Notice theheavy volume. This is the first area that breaks the downtrend, and alsobreaks the 20 MA, which has held every prior time. These are clues. Thebreak of the trend line was questionable. That is not an issue, because weare not acting here, just watching.
We are now watching for a lower high. We get it at point 2. After that,an aggressive trader can look to short the sell set-up that occurs on thedaily chart at 2, or to use the next rally to short on a daily sell set-up (less

aggressive).For more strategies concerning changes in trends, read on.

A Change in Trend, Part 2In the last lesson, I reviewed how to help identify a change in trend froma strong uptrend to a base, or possibly a downtrend. We tried to findways to avoid the common mistake of ‘shorting a strong stock’ justbecause it has rallied too much. I now will attack the other side, which isthe most common problem of all; trying to ‘catch the falling knife’. In myview, the number one problem for traders is buying a stock because itcan’t go any lower. While we can never be sure when lows are reached,you can follow a strategy that keeps you safe and puts the odds in yourfavor.
This concept works on any time frame. To show this, in the previouslesson, we used a daily chart in a strong uptrend. I am now using a weakstock on a 5-minute chart for a scalp long. This is technically known asidentifying the transition from Stage 4 to Stage 1.
Next is a chart of AAPL, Apple Computer, a 5-minute intraday chart(Figure 5-28). The red moving average is the 20 period and the blue isthe 40 period. The pink angled line is the downtrend line drawn in, andthe pink horizontal line shows the base that formed after the drop.
Figure 5-28: APPLE COMPUTER (AAPL)To view charts in color go to: www.traderslibrary.com/TLEcorner
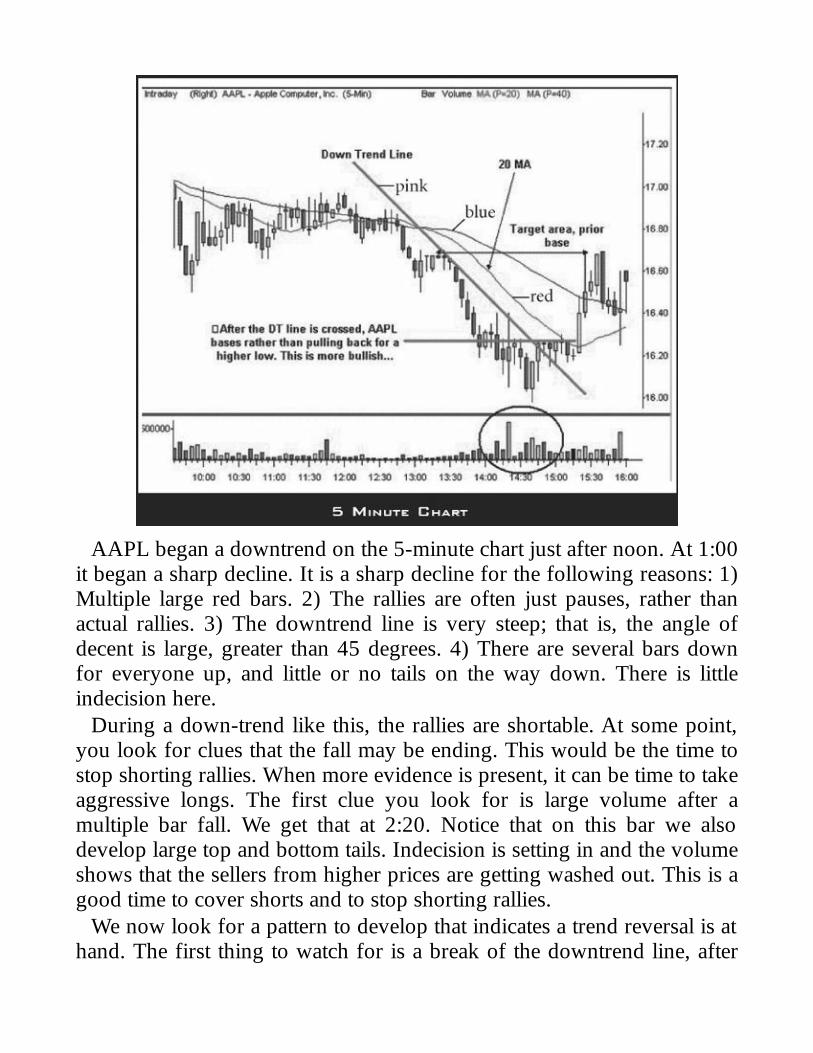
AAPL began a downtrend on the 5-minute chart just after noon. At 1:00it began a sharp decline. It is a sharp decline for the following reasons: 1)Multiple large red bars. 2) The rallies are often just pauses, rather thanactual rallies. 3) The downtrend line is very steep; that is, the angle ofdecent is large, greater than 45 degrees. 4) There are several bars downfor everyone up, and little or no tails on the way down. There is littleindecision here.
During a down-trend like this, the rallies are shortable. At some point,you look for clues that the fall may be ending. This would be the time tostop shorting rallies. When more evidence is present, it can be time to takeaggressive longs. The first clue you look for is large volume after amultiple bar fall. We get that at 2:20. Notice that on this bar we alsodevelop large top and bottom tails. Indecision is setting in and the volumeshows that the sellers from higher prices are getting washed out. This is agood time to cover shorts and to stop shorting rallies.
We now look for a pattern to develop that indicates a trend reversal is athand. The first thing to watch for is a break of the downtrend line, after

the large volume has set in. We get that as the pink downtrend line iscrossed at 2:45. This is just a ‘heads up’ to look for more information.We now look for a higher low to be put in. An aggressive trader wouldbuy the higher low on a set-up on the 5-minute chart. The alternative is towait for the rally high (at 2:45) to be broken. In this case, we get a morebullish scenario. Rather than pulling back for a higher low, the stockbases sideways, a sign of even greater strength. The play is now to buythe stock over this base that has just formed. For a play like this, the targetis a retracement target. We look for less than a 50% retracement of the fallthat occurred, or to the first area of minor resistance, such as a base thatwas previously support.
Remember, to be successful in trading, always look out for the changesin trends
Trading Gaps, Part 1Gaps are a category all unto themselves. I will discuss gaps in two parts.We will look at what they are, why they happen and what the conceptsare. In the next lesson, we will look at some chart examples.
A gap is a term used to describe the condition when a stock opens at asignificantly higher or lower price than it closed the prior day. It refers tothe gap that is left in the daily chart. It is the empty space fromyesterday’s close to today’s open. However, gaps can also gap into theprior days trading range, making it less obvious on a daily chart. Gapscan be either up or down. They can happen to all stocks, listed orNASDAQ.
The gap is measured from the prior day’s 4:00 PM closing price to thecurrent day’s 9:30 AM opening price. All times are Eastern StandardTime. The post market activity and pre-market activity do not affect thegap for our purposes. Stocks can trade after market hours through ECNs(Electronic Communication Networks) until 8:00 PM and pre-marketstarting at 8:00 AM, but this is currently not considered normal markethours. Many stocks may gap a small amount every day, but our focus ongapping stocks is on those that are gapping significantly.
For example, stock XYZ closes at 4:00 PM at 37. It trades in aftermarket hours up to 38. The next day at 8:00 AM, it starts trading at 38.5and trades up to 39.5. By 9:30, the stock is all the way back down to37.10. The gap as we measure it is only 10 cents. All of the post-marketand pre-market trades do not matter in looking at whether a stock isgapping, though you may want to be aware of those trades whenplanning a strategy. The stock traded, and people made and lost money,but the gap is not affected (Figure 5-29).
Figure 5-29: Large Gap Leaving a Price VoidTo view charts in color go to: www.traderslibrary.com/TLEcorner

What causes gaps? Usually it is news driven. Individual stocks can gapup or down due to news such as earnings reports, earnings pre-announcements, analyst’s upgrades and downgrades, rumors, messageboard posts, CNBC, key people in the company commenting orbuying/selling the company stock.
Groups of stocks or the whole market may gap up or down due tovarious economic reports, news on the economy, political news, or majorworld events (like the large gap down from the 9-11 incident). This newscan cause many individual issues to gap with the market. Many big namestocks move very closely with the market. Some may be in the sectorsthat are most affected by the news.
Whatever the exact reason, gaps are the result of some kind of eventhappening while the market is closed. The result is either buying orselling pressure at open the next day that will make the stock open at adifferent price than where it closed. Why are they important? This suddenmove by a stock, the sudden change in demand, is often the beginning ora major move. There are swing trading strategies that capitalize on
entering after a gap, and guerrilla tactics that capitalize on one or two daymoves after a gap.
Some concepts and general rules about gaps. First, we generally neverbuy a large gap up at the open. Generally, we never sell short a large gapdown at the open. When Market makers have the chance, they will oftenexaggerate the gap. Also, large gaps are already extended, making theplay risky. We tend to fade the gap initially, if played at all. Fading meansto play the stock to come back in to where it was. Fading a large gap upwould be to go short the stock as it trades down after a large gap up.However, this is a general rule and we must look to the stock we will betrading.
In general, you must keep in mind that the stock is opening at a pricethat thousands of people have decided it should be trading at afterdigesting whatever news occurred. You cannot look at the news anddecide the stock is overvalued or undervalued. That defies the basicconcept of technical analysis. Keep your mind open to the fact, thatregardless of any gap, for any reason, a stock can still move in eitherdirection. Gaps do not have to be filled, but often are.
After the initial move, the charts must be looked at along with theamount of the gap, and the share price of the stock. The daily chart, theextension of moves, support and resistance levels, and relative strength allcome into play. Small gap downs that gap under support can be watchedfor short entries. Large gap downs that gap above support can be watchedfor long entries. What is large or small and what is resistance is all amatter of chart reading and interpretation.
The concept of gaps is a very difficult one for most traders, even thosewith considerable experience. They are a strategy all by themselves andare part of many other strategies I teach. Study gaps all you can. Studythem when they happen. Learn the strategies and get familiar with them.We will look at a few examples in the next lesson. While this cannot serveto fully educate you on the topic, it can get you started thinking correctlyabout a big part of the trading day, the opening.

Trading Gaps, Part 2In the last lesson, I started a discussion about gaps. I talked about whatthey are, how they form, and why they form. While there are manystrategies involving gaps, let’s look at a few examples here.
As a rule, we like to buy strength and sell, or sell short weakness. Thisis the preferred play. There are exceptions. Next is an example of a stockthat had a bullish pattern and looked poised to move higher (Figure 5-30). In this case, the bullishness is what sets up the short, as traders aretrapped by the large gap down.
Figure 5-30: TIVO INC. (TIVO)To view charts in color go to: www.traderslibrary.com/TLEcorner
This stock gapped below an entire bullish WRB just as it looked like itwas set to break out of a consolidation. While the gap makes the stockappear extended to the downside, remember this gap is a vacuum thathappened when the market was closed and traders were not trading. Itwas likely news-driven and those long in the stock have no opportunity to
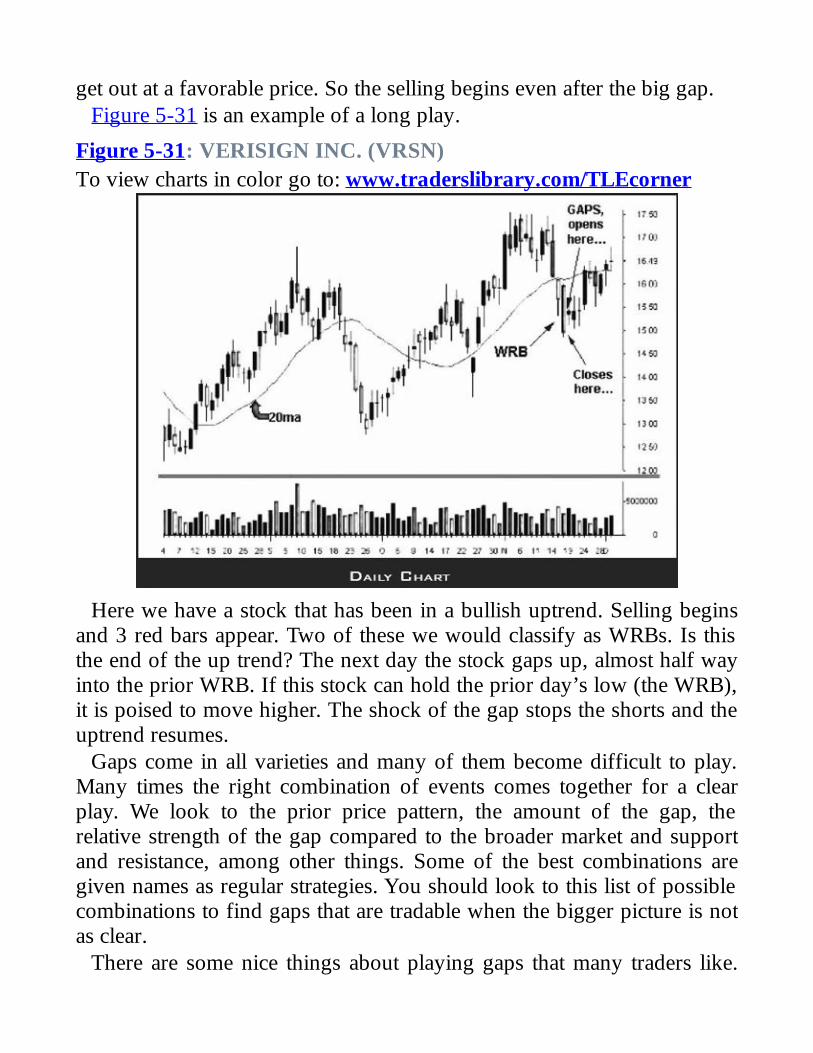
get out at a favorable price. So the selling begins even after the big gap.Figure 5-31 is an example of a long play.
Figure 5-31: VERISIGN INC. (VRSN)To view charts in color go to: www.traderslibrary.com/TLEcorner
Here we have a stock that has been in a bullish uptrend. Selling beginsand 3 red bars appear. Two of these we would classify as WRBs. Is thisthe end of the up trend? The next day the stock gaps up, almost half wayinto the prior WRB. If this stock can hold the prior day’s low (the WRB),it is poised to move higher. The shock of the gap stops the shorts and theuptrend resumes.
Gaps come in all varieties and many of them become difficult to play.Many times the right combination of events comes together for a clearplay. We look to the prior price pattern, the amount of the gap, therelative strength of the gap compared to the broader market and supportand resistance, among other things. Some of the best combinations aregiven names as regular strategies. You should look to this list of possiblecombinations to find gaps that are tradable when the bigger picture is notas clear.
There are some nice things about playing gaps that many traders like.

Sometimes, you can have tight stops (or can pass on the ones where youdo not), and you usually get some results fairly quickly. Often, reversaltime (10:00 AM) brings some results.
This is a sampling of some of the many strategies we use with gaps.This, along with the last lesson, will provide a firm foundation as youcontinue to expand your trading knowledge.
Chapter 6
Chart Lessons on the Market
The NASDAQ in ReviewMost every day I am asked, “Where do you think the market is goingtomorrow?” It is the most common question that all traders want to ask.Well, the answer is always something like, “It is definitely going up,unless it heads down!”
While the answer always gets a laugh, I do go on to give my bestinterpretation of the current direction. However the truth is that no oneknows where the market will be tomorrow, in a week, in a month, or in ayear. The further away, the less likely one is to know market direction.For example, I may be able to give some insight into where the marketmay be tomorrow much better than I can predict where we may be in ayear. With political events, economic issues, interest rates, companiesgiving earnings warnings, upgrades and downgrades, it becomesimpossible to predict the future. One of the reasons I like to trade isbecause trading is not dependent on the question, “Where is the marketgoing?” Traders look for opportunities each day, regardless of direction,and are willing to change course in a minute, if needed.
There is much to be gained by having a good understanding of likelypossibilities of where the market may be heading, based on the charts. Iwill always try to develop scenarios of what may happen over the nextfew days. This is all that is really relevant if you day and swing trade.This understanding can be very useful, while not fool proof.
Look at the chart below. It is the NASDAQ Composite Index fromsome April lows (Figure 6-1). There is a 20 MA (red) and a 50 MA(blue).
Figure 6-1: NASDAQTo view charts in color go to: www.traderslibrary.com/TLEcorner

April was the month the NASDAQ rallied hard, and has been in atrading range ever since. This range was playable. Would you have beenable to navigate through the last three months? The following charts areall the same exact chart of the NASDAQ, with various points and trendlines added along the way.
In figure 6-2, I have added letters A and B at two consolidation areas.Letters C to G and numbers 1 to 6 represent key high and low points.
Figure 6-2: NASDAQTo view charts in color go to: www.traderslibrary.com/TLEcorner

Look at consolidation area A. It started with a large green bar on 4/5that came after a large gap opened right off the recent low. At the time,we discussed that this was to be watched, but at the time it was no morethan a small rally in the middle of a downtrend. However, the 3-dayconsolidation and subsequent gap up on April 10 started to get ourattention. Notice the gap up the next day, (first bar in the 4-dayconsolidation at B) did sell off but only a small amount. Normally, a gapup after the previous day’s up that sold off would sell off in a big way.Instead it held its gains.
Notice also that this gap to consolidation B took it above its downtrendline, which is drawn in pink. While this 4 day consolidation went on, themarket did not make any attempt to pull back. It was during this time thatwe looked to be bullish for a bounce.
You see that the bounce came as the market rallied up to point 1 asshown on the next chart (Figure 6-3).
Figure 6-3: NASDAQTo view charts in color go to: www.traderslibrary.com/TLEcorner
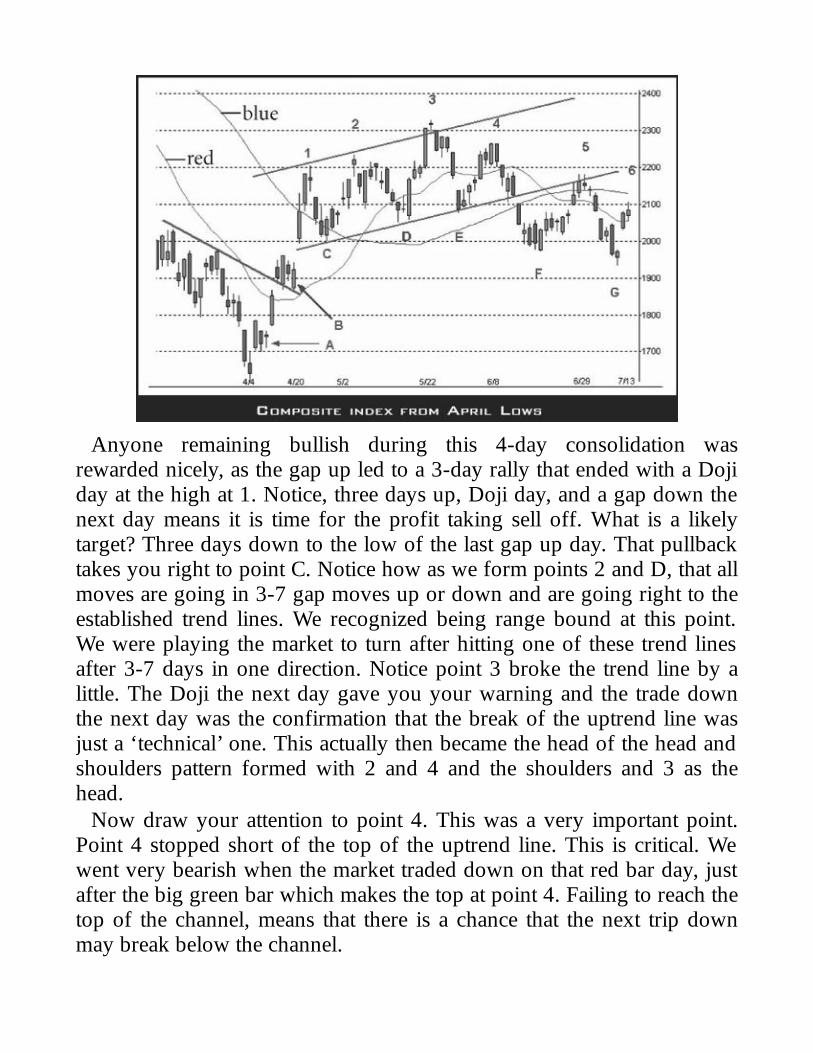
Anyone remaining bullish during this 4-day consolidation wasrewarded nicely, as the gap up led to a 3-day rally that ended with a Dojiday at the high at 1. Notice, three days up, Doji day, and a gap down thenext day means it is time for the profit taking sell off. What is a likelytarget? Three days down to the low of the last gap up day. That pullbacktakes you right to point C. Notice how as we form points 2 and D, that allmoves are going in 3-7 gap moves up or down and are going right to theestablished trend lines. We recognized being range bound at this point.We were playing the market to turn after hitting one of these trend linesafter 3-7 days in one direction. Notice point 3 broke the trend line by alittle. The Doji the next day gave you your warning and the trade downthe next day was the confirmation that the break of the uptrend line wasjust a ‘technical’ one. This actually then became the head of the head andshoulders pattern formed with 2 and 4 and the shoulders and 3 as thehead.
Now draw your attention to point 4. This was a very important point.Point 4 stopped short of the top of the uptrend line. This is critical. Wewent very bearish when the market traded down on that red bar day, justafter the big green bar which makes the top at point 4. Failing to reach thetop of the channel, means that there is a chance that the next trip downmay break below the channel.

Now, draw your attention to the final chart below (Figure 6-4).
Figure 6-4: NASDAQTo view charts in color go to: www.traderslibrary.com/TLEcorner
While 4 failed to make a higher high, F went on to make a lower low.This is an indication of a change in trend. This makes point 3 theinflection or pivot point. We now start a series of lower lows and lowerhighs. Notice again, the high points which are numbers 3 through 6 andthe lows, letters E through G, form very nice trend lines and all have threeto seven bars up or down (with one exception).
At the time, we are showing signs of not making it to the top of thetrend line. If this becomes true, be careful of the next low H, as it will bein question to hold.
The bottom line is to be flexible, find opportunities, and try to preparefor the turning points that the charts provide.
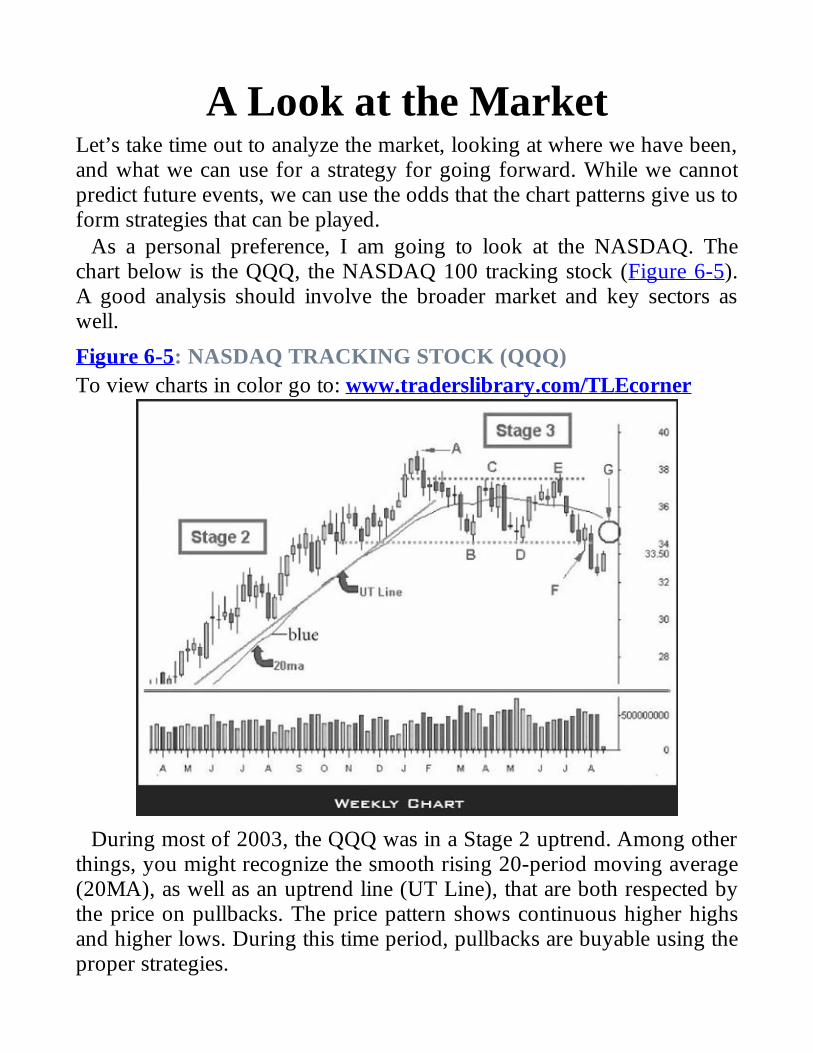
A Look at the MarketLet’s take time out to analyze the market, looking at where we have been,and what we can use for a strategy for going forward. While we cannotpredict future events, we can use the odds that the chart patterns give us toform strategies that can be played.
As a personal preference, I am going to look at the NASDAQ. Thechart below is the QQQ, the NASDAQ 100 tracking stock (Figure 6-5).A good analysis should involve the broader market and key sectors aswell.
Figure 6-5: NASDAQ TRACKING STOCK (QQQ)To view charts in color go to: www.traderslibrary.com/TLEcorner
During most of 2003, the QQQ was in a Stage 2 uptrend. Among otherthings, you might recognize the smooth rising 20-period moving average(20MA), as well as an uptrend line (UT Line), that are both respected bythe price on pullbacks. The price pattern shows continuous higher highsand higher lows. During this time period, pullbacks are buyable using theproper strategies.
At the point labeled A, we have just set new highs on a powerful move.Halfway in between A and B, when we stall at the 20MA, we are still inStage 2. After stalling for a few bars, we break below the 20MA and theUT line. This gives us a ‘heads up’ to be cautious, but we are still in Stage2.
At the point when we reach B, we have a buy set-form. It is playable asa long but we no longer expect a new high on the next rally. Why? First,the trend line break, and second, the fact that the last pullback came all theway down to major support (the green line at point B). We do not knowthis for sure, but the chart is telling us that, odds are, it is unlikely to moveto new highs in the same fluid manner as we have in the past year. As weroll over at point C, we now have an official ‘equal low’ and ‘lowerhigh’, and the uptrend is now officially over. This now looks like it hascompleted a transition to a base. At this point we cannot tell if it is abullish base that is just resting before a new move up, or a bearish basethat may signal an upcoming Stage 4. Points D and E make a perfectconfirmation of the base, and the sideways trend continues.
As soon as you recognize that the uptrend is over, it is time to adjuststrategies. Swing trades from the daily will be different, and it is time tomove up stops on long-term bullish positions. New strategies areintroduced that play the base until it breaks.
Point F starts off like just another pullback to the major support of thebase. The green bar was a bounce that appeared quite playable on thedaily charts (this is a weekly). It was not wrong to play this as a long, atleast on the daily charts. However, the market often speaks loudest whenit speaks in failures. Here is the time where the base does not hold. It isnear August 1, and this base was playable all year long. Now the failureto hold this base means a break down and likely transition into Stage 4,the downtrend.
How do you handle the move? The odds-on strategy is to short the rallythat comes back to the base, as identified by the circle at G. Nowunderstand that it requires a strategy and set-up to short—you do not do itblindly at a certain price point. If this sets up properly but fails to followthrough to the down side, this failure and the bullishness to stop-out thatset-up will likely be an indication to be long. Again, a failure of a good

pattern speaks the loudest.If you want to follow the forward-looking analysis of this lessons, be
sure to understand the strategies involved, and the fact that we play odds.When the odds don’t play out, we use protective stops.

A NASDAQ Update, Part 1I would like to take another lesson to review some basic charting, how weapply it to the market, and how you can and cannot benefit from it. Thechart I will be reviewing is the daily chart of the NASDAQ (Figure 6-6).The lower line is the 20 period moving average, the upper is the 50period moving average.
Figure 6-6: COMPX-NASDAQTo view charts in color go to: www.traderslibrary.com/TLEcorner
There was a steep decline that happened over the prior month. Thissteep fall was after a long move down by the NASDAQ. The gap down,green bar, and then gap up is what is known as an island reversal. It isoften a bottom formation after a prior move to the downside. Note thatafter the island reversal, the next seven days are rather tight and do not

challenge the low area. The one day that came close developed a long tail,showing that the buyers were now strong in this area. It was stated that amove above that wedge would likely rally to fill the gap in the chart in the1700 level.
Here is another chart of the NASDAQ (Figure 6-7). Let’s review whathas happened and how it was played. Point A is the green bar thathappened the day after the last chart was posted.
Figure 6-7: COMPX-NASDAQTo view charts in color go to: www.traderslibrary.com/TLEcorner
Now, let’s talk about how to play this. It is difficult to play the first dayup when this starts. If you are prepared and aggressive, entering longsover 30 minute highs is a good strategy. We already had DELL and onthis day we added YHOO at 10.15. The issue now becomes; will thesegains hold or will selling step in as it has in the past? So, we monitor thenext day’s point B. The more that chart pulls back in price, the weaker themarket is and the less likely to be able to keep gains and continue themove up. If the market pulls back more than 50 percent of that move up,it is suspect. Notice the market moved sideways. It corrected through

time, not through price. This is the most bullish scenario. The sellersnever outnumbered the buyers, even after the move up. So we prepare foranother move up.
Focus on point C, the large green bar at the end of the 5-day base. Thisbar is known as a “bullish engulfing bar.” It opens below the prior day’slow, and closes above the prior day’s high. It almost does this for theentire 5-day base.
Now, area D starts the process over again. Mark off the high of bar Dand the low of bar C. Monitor the percent of pullback to gauge the sellingpressure and strength. This move takes us to the original target, filling thegap to the 1700 area. As of this moment, the set up looks bullish again. Agap up or move up again into the 50 period moving average would be agood time to sell swing positions that were acquired during this time.Cores are an individual situation that could range from long term holds, toselling part positions, to taking protective measures such as selling calls orbuying puts to hedge.
Nothing is certain in charting or technical analysis. There is no magicindicator or moving average. It is just a matter of combining several toolswith common sense to try to get the odds in your favor. Then, use goodmoney management, and have a lot of patience and discipline.

A NASDAQ Update, Part 2The NASDAQ composite has set up an interesting scenario over the lastweek. The charts that follow are of the QQQ, which is the NASDAQ 100Ttrust, commonly used to trade the NASDAQ 100 and mirrors its pattern.There are several issues that will be discussed in this lesson, includingtrend analysis, multiple time frame resolution, low volume holidaymoves, head and shoulders patterns, and pattern failure.
Below is a weekly chart of the QQQ (Figure 6-8). It is always best tostart with the larger time frame and work your way down. The weeklyQQQ had been in a downtrend for over two years. As of October, it set anew low, which was just another in a long series of new lows (markedL1). The rally that ensued in October and November was differentbecause it rallied above a prior major pivot high (H1). This puts theweekly downtrend in question and requires a close to see if the nextpullback puts in a higher low (marked ‘?’).
Figure 6-8: QQQTo view charts in color go to: www.traderslibrary.com/TLEcorner
To take a closer look at this pullback on the weekly, we zoom in bylooking at the daily chart (Figure 6-9) to see how this pullback on theweekly looks on the daily, to get clues as to where a possible entry maybe found.

Figure 6-9: QQQ - 12/31/02To view charts in color go to: www.traderslibrary.com/TLEcorner
Above is a daily chart of the QQQ with the moving averages removedto focus on the price bars. Support and resistance lines have been added.Line A is the high from the beginning of November, and an area that themarket should have held during the December pullback if a stronguptrend were going to stay in place. Line B is the bottom of the base thatformed in December, and the minor support formed by the base from lateOctober. Line C is the support area from the last major pivot from beforethe December base. Notice that the high of the base on the December 12spikes up to Line A, at the prior high formed at the beginning ofNovember. This has formed what many labeled a potential ‘head andshoulders’ formation over the months of November and December. Notealso that the ‘right shoulder’ has a lengthy base. Trading below this basewould be considered very bearish and may even be consideredanticipatorily ‘breaking’ the neckline of the head and shoulders pattern.Most would not really consider the neckline broken until Line C wasviolated.
However, regardless of any head and shoulders formation, the fact thatthe market traded below the December base is bearish. A base like thatsets up an area of supply that should be difficult to trade through. So, isthis a bearish outlook at this point? Well, one more consideration, this
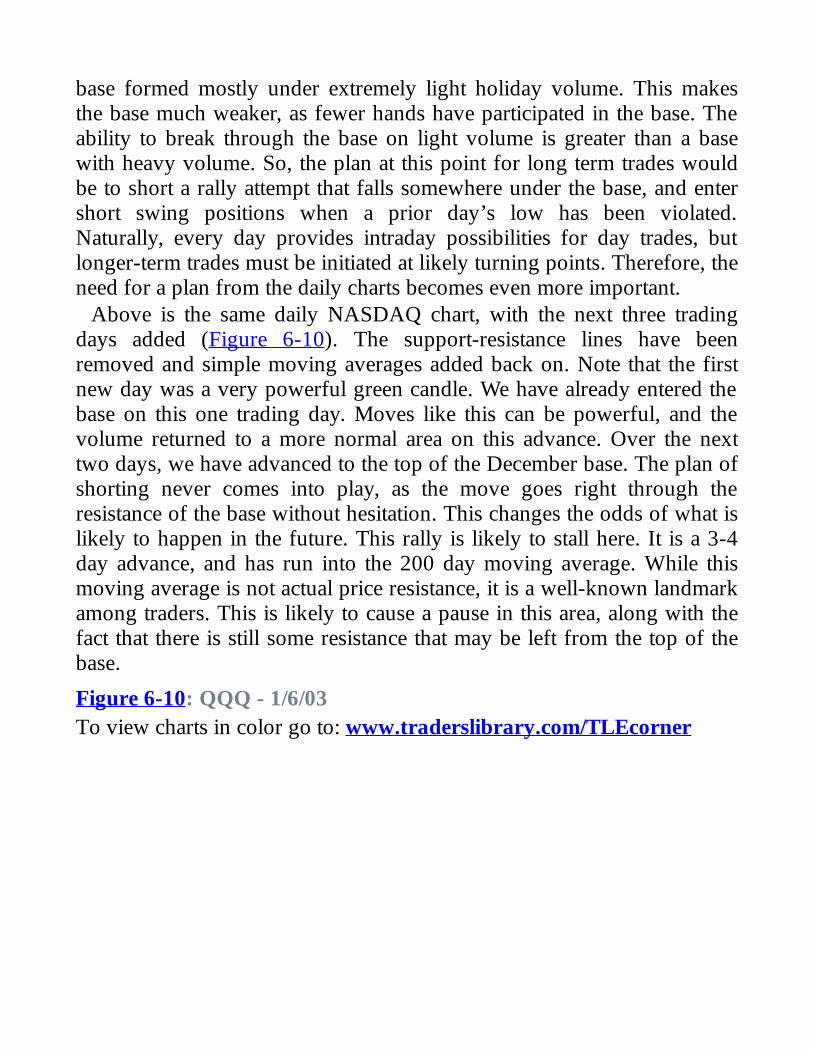
base formed mostly under extremely light holiday volume. This makesthe base much weaker, as fewer hands have participated in the base. Theability to break through the base on light volume is greater than a basewith heavy volume. So, the plan at this point for long term trades wouldbe to short a rally attempt that falls somewhere under the base, and entershort swing positions when a prior day’s low has been violated.Naturally, every day provides intraday possibilities for day trades, butlonger-term trades must be initiated at likely turning points. Therefore, theneed for a plan from the daily charts becomes even more important.
Above is the same daily NASDAQ chart, with the next three tradingdays added (Figure 6-10). The support-resistance lines have beenremoved and simple moving averages added back on. Note that the firstnew day was a very powerful green candle. We have already entered thebase on this one trading day. Moves like this can be powerful, and thevolume returned to a more normal area on this advance. Over the nexttwo days, we have advanced to the top of the December base. The plan ofshorting never comes into play, as the move goes right through theresistance of the base without hesitation. This changes the odds of what islikely to happen in the future. This rally is likely to stall here. It is a 3-4day advance, and has run into the 200 day moving average. While thismoving average is not actual price resistance, it is a well-known landmarkamong traders. This is likely to cause a pause in this area, along with thefact that there is still some resistance that may be left from the top of thebase.
Figure 6-10: QQQ - 1/6/03To view charts in color go to: www.traderslibrary.com/TLEcorner

The current plan is to monitor this upcoming pullback. If it is mild, andstays in the upper part of the 4-day advance, or simply bases sideways,the odds will favor long term positions and the completion of the weeklyPristine Buy Set-up (see Appendix A) in a bullish way. Now that theweekly Pristine Buy Set-up has hit, we will look to the daily charts for anentry possibility for swing and core positions. There may be added fuel tothe rally, as many may have considered this a complete head andshoulders pattern, and this rally may have caught several shorts off guard.Trading under the lows of the last two weeks would likely bring aboutweakness that would lead to a test of the NASDAQ lows.
Analysis of the NASDAQ charts can provide background knowledgefor future trades and, ultimately, trading success.
The Volatility Index as a GuideThe Market Volatility Index (VIX, symbol VIX.X on Realtick) isprovided by the Chicago Board of Options Exchange (CBOE) and usedas a guide to indicate the level of anxiety or complacency of the market. Itdoes this by measuring how much people are willing to pay to buyoptions on the S&P 100 futures (OEX).
The price of an option is made of several components. However,options do trade independently and have their own supply and demandfactors just like any instrument would. All of the components of theoption price (such as the price of the underlying issue and the time toexpiration) can be determined except for one. That one component is thevolatility, or the ‘excess’ amount people are willing to pay for the option.
While it does measure the volatility of both call and put options, it isprimarily the put options that bring on the higher levels of volatility thatare being measured. The reason for this is simple. Most people arefocused on owning stocks or being long on the market. To protectportfolios, investors will buy puts to hedge against market declines. Whileputs could be bought on most individual stocks, it is easier and more costefficient to buy them on the ‘market’ in general. Options on the S&P 100futures are very liquid and the most common way to protect longportfolios. Also, speculators who want to participate in market declinesmay buy the ‘OEX Puts’ to profit.
How does it work? It is a type of contrarian indicator. When ‘everyone’wants OEX Puts, the fear in the market is great and ‘everyone’ causesdemand to go up. The price of the options go up which is reflected as the‘volatility’ component of the price of the option. This is what is measuredby the VIX. Once everyone has taken protective downside measures, thequestion becomes; who is left to sell stocks? This is known as a washoutof sellers. Like any indicator, it cannot be used by itself to predict marketaction. It is an excellent tool for looking for extreme readings to helpconfirm other indications of a market turn.
Like any chart, we can look at the VIX to determine trend, support andresistance levels, and relationship to moving averages, on all time frames.The most practical use is to help confirm longer-term turning points in the

market. Look at the next chart (Figure 6-11).
Figure 6-11: VIX (TOP); NAS (BOTTOM)To view charts in color go to: www.traderslibrary.com/TLEcorner
As a reference, the VIX peaked out at 57.3 during the September 11,2001 crisis period. Note that it was not until late July 2002 that werevisited that area. This was the first time the NASDAQ made any attemptto hold from the decline of 2002. The VIX was an excellent guide towatch during 2002, as the fall in the NASDAQ, even when it challengedthe September 2001 lows, did not bring about a confirming rise in theVIX.
In October 2002, when the NASDAQ put in its bottom, it was wellanticipated by the VIX, as the VIX hit resistance from its previous high.At this point, for the VIX to go any higher would have been challenging
the October 2001 crisis levels. There was a great deal of ‘anxiety’ in theNASDAQ at this time. The predictive value it had in late November 2002,actually turned and started heading up well before the NASDAQ headeddown.
While no tool can predict market action, the VIX does an excellent jobmeasuring the useful components of anxiety and complacency. Use it as aguide to help you confirm possible turning points in the market.

Caution in the MarketTrading is all about playing the probabilities. It is looking at a stockthrough multiple time frames and determining if there are odds that thestock is more likely to move in one direction or another. It is also aboutfinding these areas, or focal points and reacting to them properly, whetherthe expected outcome plays out or if the unexpected happens.
Right now there are several things coming together in the broadermarket that give us reason to use caution. When I say the broader market,I am referring to the S&P 500. It can be viewed as the SPY (the S&PDepository Receipts) or the S&P Futures. We at times may look at theNASDAQ separately. These two will often mirror each other; sometimes,they will deviate.
First, let’s take a look at the bigger picture. We have experienced astrong uptrend in the daily and weekly market charts, and we haveadvocated buying all pullbacks during this stage. This is what is doneuntil the charts give us clues that momentum may be ending. The fact thatmomentum may be ending is what we want to look at.
Look at the daily chart of the SPY (Figure 6-12).
Figure 6-12: S&P DEP RECEIPTS (SPY)To view charts in color go to: www.traderslibrary.com/TLEcorner
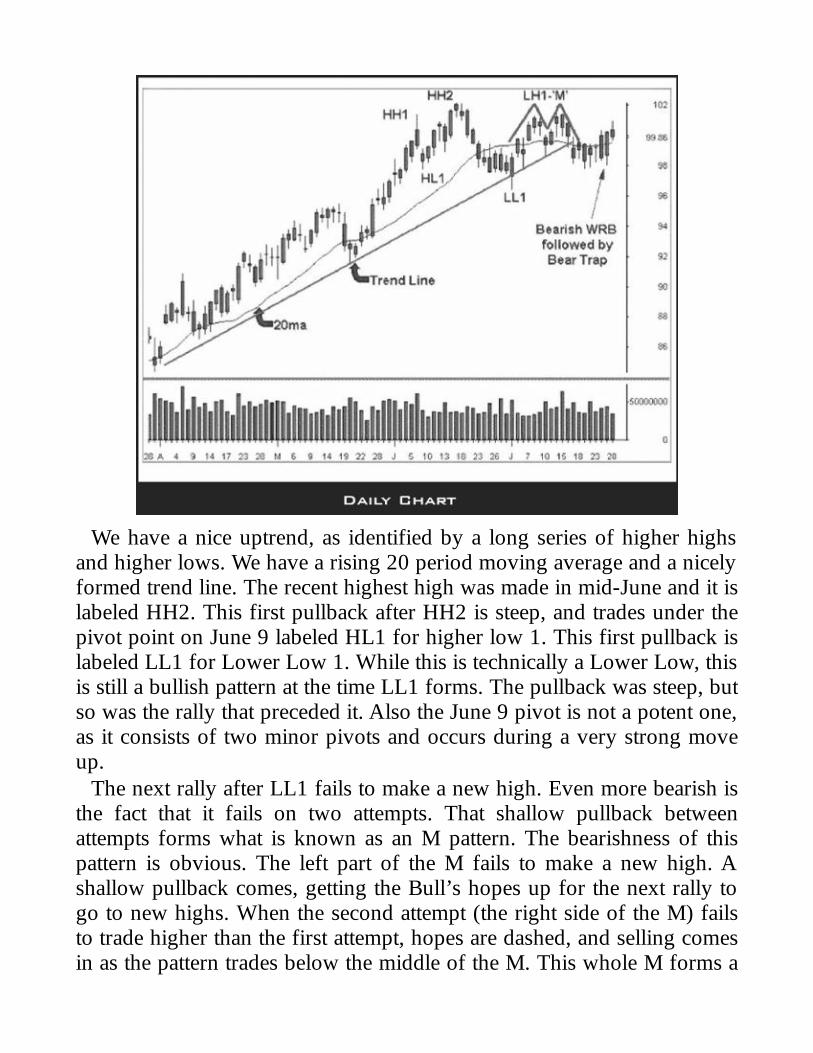
We have a nice uptrend, as identified by a long series of higher highsand higher lows. We have a rising 20 period moving average and a nicelyformed trend line. The recent highest high was made in mid-June and it islabeled HH2. This first pullback after HH2 is steep, and trades under thepivot point on June 9 labeled HL1 for higher low 1. This first pullback islabeled LL1 for Lower Low 1. While this is technically a Lower Low, thisis still a bullish pattern at the time LL1 forms. The pullback was steep, butso was the rally that preceded it. Also the June 9 pivot is not a potent one,as it consists of two minor pivots and occurs during a very strong moveup.
The next rally after LL1 fails to make a new high. Even more bearish isthe fact that it fails on two attempts. That shallow pullback betweenattempts forms what is known as an M pattern. The bearishness of thispattern is obvious. The left part of the M fails to make a new high. Ashallow pullback comes, getting the Bull’s hopes up for the next rally togo to new highs. When the second attempt (the right side of the M) failsto trade higher than the first attempt, hopes are dashed, and selling comesin as the pattern trades below the middle of the M. This whole M forms a
lower high, breaking the pattern of the uptrend.The pullback has not made a new low (under LL1). What has occurred
is likely a transition from the Bullish Stage 2 to a sideways consolidationknow as Stage 3. Of course we can never be sure until after that fact;however as traders, playing the probabilities is what we do.
Use this with some other information. At the time of this writing we hadan extended rally on the weekly charts without any real correction. Wewere entering the time known as the “summer doldrums.” August is oftena light volume month with little follow through in price action. August,September, and October are statistically the most bearish months,according to the Traders Almanac.
How do you use this information during the summer months? I wouldsay it is a time to watch the daily charts and expect things to be rangebound until we break out of this area. Expect less movement, that is, lessof a target on trades. Reduce trading, and lighten up on shares. Usecaution. Take that vacation you have been waiting for.

Chapter 7
Lessons on Classic Patterns
Using Relative Strength as One ofYour Tools
Every day I like to have five tools, or weapons, if you will, at mydisposal. First is a watch list, created from the daily charts the nightbefore, for swing trades and the best trends for intraday trades. Second, Ihave the gap list from the morning, used largely for guerrilla tradingtactics. Third, I have a list of favorite stocks to review, stocks that arehigh volume and easy to trade. Fourth, I have intraday scanning devices,such as Pristine ESP™. Fifth, I have a page set up in my Real Tickplatform that shows the different indices, and a page set up for eachindex.
Two of these lists can be very helpful in determining a stock’s relativestrength. When a stock has relative strength, it means that the stock isacting stronger than the market in general, or stronger than the index it isin. An index can also have relative strength compared to the market. Forexample, on a down day in the market, the Semi Conductor index may bedown the same percentage as the market as measured by either theNASDAQ or the S&P 500. The charts may also look similar. But theRetail Index may be up on the day, with a chart that shows intradayuptrend. This would then be a case of the Retail Index showing greatrelative strength. Perhaps Wal-Mart is up more than the rest of the RetailIndex and is breaking out. It would have good relative strength comparedto the Retail Index and great relative strength compared to the S&P 500.All the same is true, in reverse, for relative weakness.
One of these lists shows stocks that are at the top 10 percent and bottom10 percent of the day’s trading range. Picture a market that is in anuptrend on daily charts, but in the middle of a pullback in the middle ofthe morning. The trend is up, but we are pulling back 50 percent of the

days trading range to an area of support. Looking at stocks that are closeto the days high (top 10 percent of the day’s trading range) will give a listof stocks that have a good chance of moving up if the market holds onthe pullback and continues up. Playing these stocks on appropriate set-ups would mean playing stocks that are relatively strong. Playing the onesthat also have good chart set-ups would mean taking advantage of morethan one strategy; this can make for a very good play. The same is true inreverse for finding relative weakness.
Next, check your Real Tick page on market indices and look for thestrongest index. Look at daily and 15-minute chart patterns, and look at %gain on a watch list. Find the strong sectors and weak sectors. Then turnto a page that has a list of stocks in that sector. Look at them in a watchlist and in 5-minute charts. Look for patterns that defy the current marketor sector chart.
The following page shows charts of the NASDAQ futures fromDecember 11 (Figures 7-1 and 7-2). The market was looking strong allday after a Fed announcement, but very suddenly got hit hard in theafternoon.
Figure 7-1: INTRADAYTo view charts in color go to: www.traderslibrary.com/TLEcorner
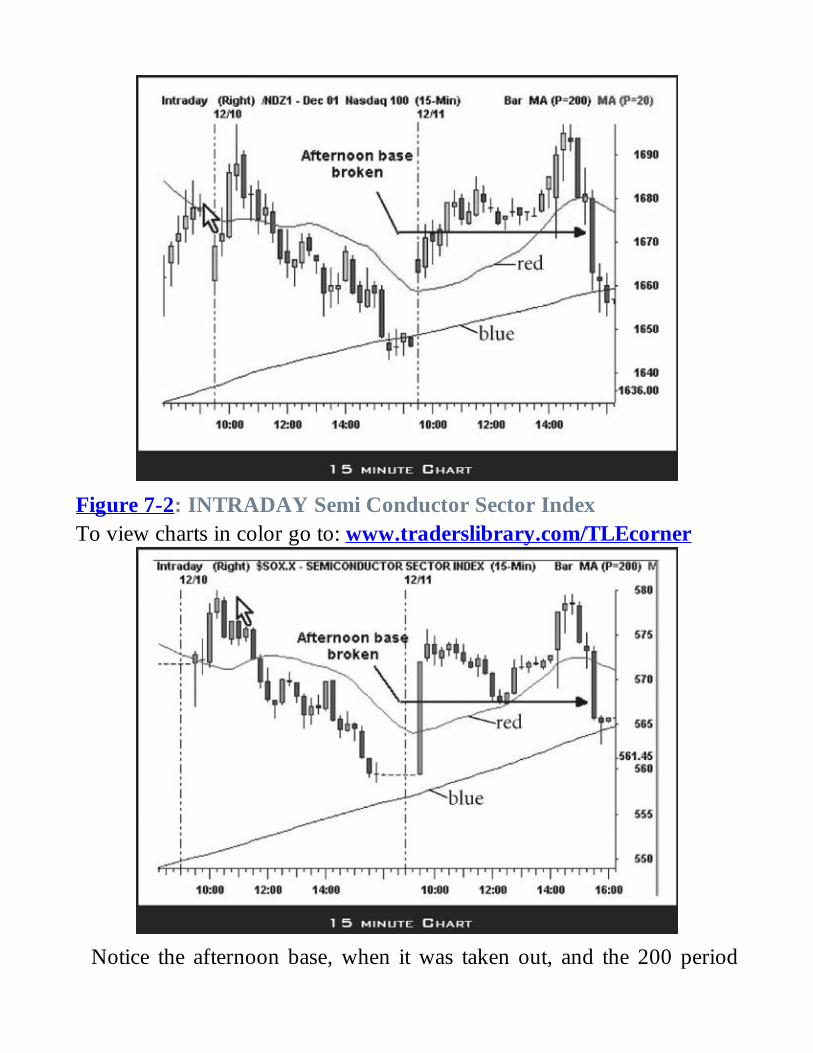
Figure 7-2: INTRADAY Semi Conductor Sector IndexTo view charts in color go to: www.traderslibrary.com/TLEcorner
Notice the afternoon base, when it was taken out, and the 200 period

moving average in blue.The Semi Conductors held the afternoon base for a long time while the
market dropped (Figure 7-2). Turning to a Real Tick page with all of theSemi Conductor components on it revealed many 5-minute charts thatlooked the same as the market; except one; SANM, shown in Figure 7-3.
Figure 7-3: INTRADAY SANM CORPTo view charts in color go to: www.traderslibrary.com/TLEcorner
This chart defied the market. An example of what we call an “afternoonjammin’ session.” The stock was being bought. As the market finallystabilized at the 200 period moving average on the 15-minute chart, as ifoften does, look what SANM did, breaking out of the base.
I have shown you two methods of using relative strength to help you inyour trading. Relative strength is often strong enough to base someintraday trades on but, when combined with proper chart set-ups, it canbe very powerful.
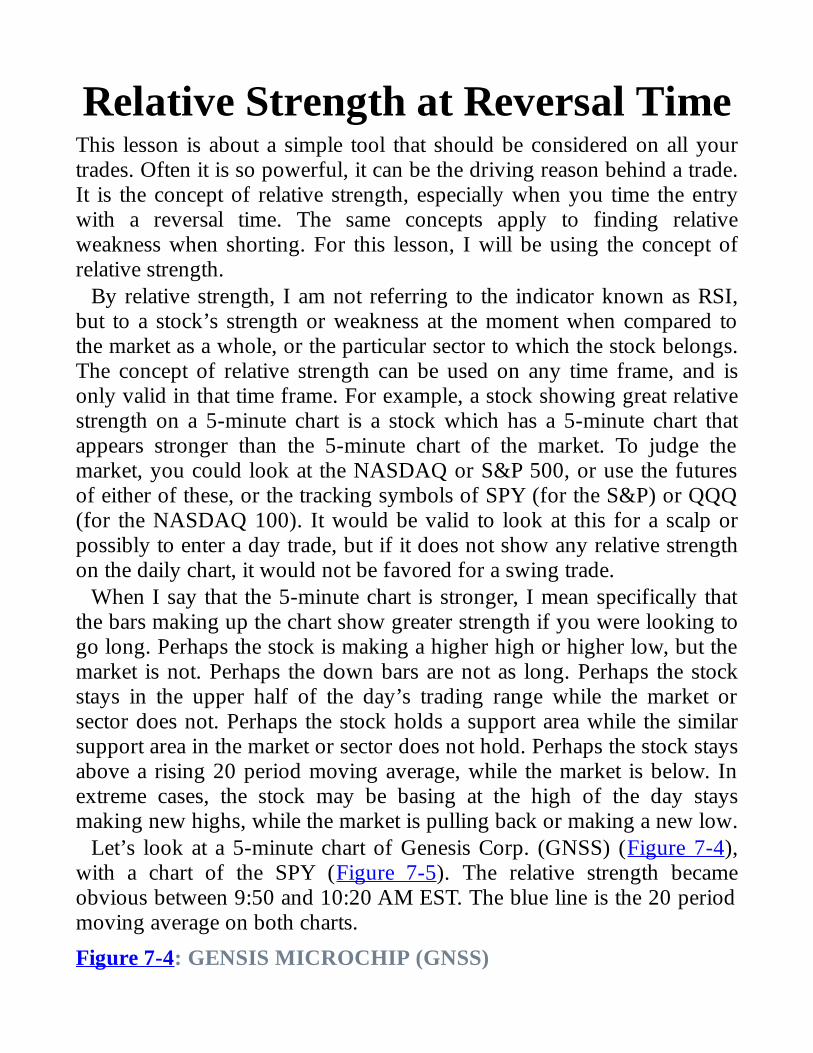
Relative Strength at Reversal TimeThis lesson is about a simple tool that should be considered on all yourtrades. Often it is so powerful, it can be the driving reason behind a trade.It is the concept of relative strength, especially when you time the entrywith a reversal time. The same concepts apply to finding relativeweakness when shorting. For this lesson, I will be using the concept ofrelative strength.
By relative strength, I am not referring to the indicator known as RSI,but to a stock’s strength or weakness at the moment when compared tothe market as a whole, or the particular sector to which the stock belongs.The concept of relative strength can be used on any time frame, and isonly valid in that time frame. For example, a stock showing great relativestrength on a 5-minute chart is a stock which has a 5-minute chart thatappears stronger than the 5-minute chart of the market. To judge themarket, you could look at the NASDAQ or S&P 500, or use the futuresof either of these, or the tracking symbols of SPY (for the S&P) or QQQ(for the NASDAQ 100). It would be valid to look at this for a scalp orpossibly to enter a day trade, but if it does not show any relative strengthon the daily chart, it would not be favored for a swing trade.
When I say that the 5-minute chart is stronger, I mean specifically thatthe bars making up the chart show greater strength if you were looking togo long. Perhaps the stock is making a higher high or higher low, but themarket is not. Perhaps the down bars are not as long. Perhaps the stockstays in the upper half of the day’s trading range while the market orsector does not. Perhaps the stock holds a support area while the similarsupport area in the market or sector does not hold. Perhaps the stock staysabove a rising 20 period moving average, while the market is below. Inextreme cases, the stock may be basing at the high of the day staysmaking new highs, while the market is pulling back or making a new low.
Let’s look at a 5-minute chart of Genesis Corp. (GNSS) (Figure 7-4),with a chart of the SPY (Figure 7-5). The relative strength becameobvious between 9:50 and 10:20 AM EST. The blue line is the 20 periodmoving average on both charts.
Figure 7-4: GENSIS MICROCHIP (GNSS)

To view charts in color go to: www.traderslibrary.com/TLEcorner
Figure 7-5: S&P DEPOSITORY RCPTS (SPY)To view charts in color go to: www.traderslibrary.com/TLEcorner

Notice the arrows labeled A and B. These point to the 4 th and 8th baron both 5-minute charts. At 9:50 the SPY was drifting lower and GNSShad three WRBs up on the 5-minute chart. The plan was to watch thepullback, since we identified a strong stock.
The end of the first reversal time (9:50-10:10) brought a new low in theSPY, and a higher low in GNSS, at Minor Support, at the rising 20 periodmoving average. The 5-minute Pristine Buy Set-up (see Appendix A) wasplayed, based on this set-up. The markets were generally in uptrends atthis time, though this is not evident by the 5-minute chart.
At 10:30, GNSS had tested the high of the day, which was the firsttarget. Now the decision to hold half for bigger gains became easy, as theSPY recovered and was challenging new highs for the day (Figure 7-5).If the stock was strong without the market helping, it should do evenbetter with the market. The back half was held into the next day. Also ofnote in making this decision was the daily chart. It was showing a nice 1-2-3 continuation play.
When trading you want as many factors on your side as possible. Whilethis stock showed up with nice relative strength, it was also being watched

due to the bullish daily set-up as discussed above. At the time of entry, wehad a 5-minute PBS, at mS, at the r20ma, with a NRB and COG andcommitted volume on the first move up. Relative strength (or weaknesswhen shorting) should be one of the factors you use to help you inassessing trades.
Failed Breakdown at ReversalTime
In the previous lesson, we looked at a ‘relative strength at reversal timeplay.’ This play is on the other end of the relative strength scale. What setup this play is the weakness going into reversal time.
I am sure you noticed that both of these plays refer to reversal time.Does that give you the impression that it is an important topic? It should.Reversal times are certain times of the day that we know stocks are mostlikely to change their patterns. This may be from down to up, or may justbe from down to sideways. A sideways base may break down or breakout. The key times we focus on are 9:35, 9:50-10:10, 10:25-10:35,11:00-11:15, 12:00, 1:30, 2:15-2:30, 3:00, and 3:30. Note these are allEastern Standard Time (market opens at 9:30). Try this. Print out intradaycharts of the market, or your favorite stocks. Circle the major areas on thechart. Circle the highs, lows, and major reversals. You will be amazed athow often they line up within one 5-minute bar of the above times. Thisis especially true for the time periods around 10:00, 10:30, and enteringand leaving lunch.
Figure 7-6 is a 5-minute chart of Marvell Technology Group.
Figure 7-6: MARVELL TECHNOLOGY (MRVL)To view charts in color go to: www.traderslibrary.com/TLEcorner
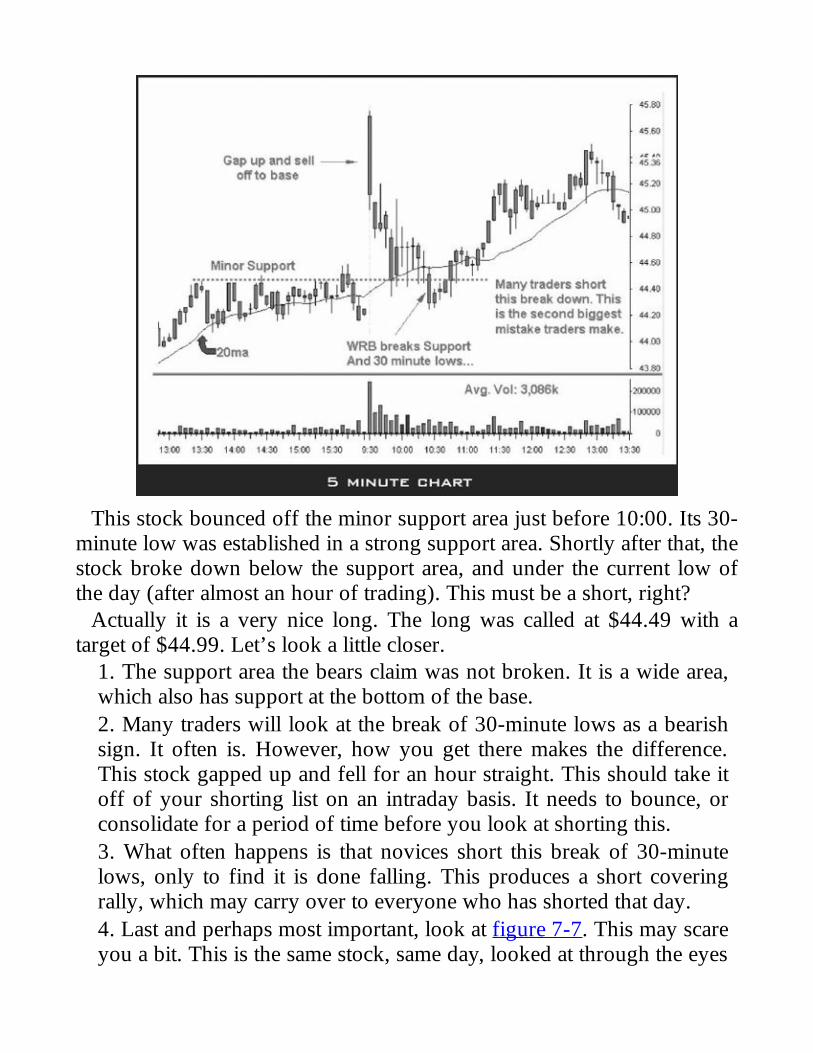
This stock bounced off the minor support area just before 10:00. Its 30-minute low was established in a strong support area. Shortly after that, thestock broke down below the support area, and under the current low ofthe day (after almost an hour of trading). This must be a short, right?
Actually it is a very nice long. The long was called at $44.49 with atarget of $44.99. Let’s look a little closer.
1. The support area the bears claim was not broken. It is a wide area,which also has support at the bottom of the base.2. Many traders will look at the break of 30-minute lows as a bearishsign. It often is. However, how you get there makes the difference.This stock gapped up and fell for an hour straight. This should take itoff of your shorting list on an intraday basis. It needs to bounce, orconsolidate for a period of time before you look at shorting this.3. What often happens is that novices short this break of 30-minutelows, only to find it is done falling. This produces a short coveringrally, which may carry over to everyone who has shorted that day.4. Last and perhaps most important, look at figure 7-7. This may scareyou a bit. This is the same stock, same day, looked at through the eyes

of a 15-minute chart. Using Multiple Time Frames to analyze everytrade is a concept I spend a good deal of time on. Does this look like ashort?
Figure 7-7: MARVELL TECHNOLOGY (MRVL)To view charts in color go to: www.traderslibrary.com/TLEcorner
Let’s spend some more time on Figure 7-7. Note it is in an uptrend. Wehave parallel rising 20 and 40 period moving averages (r20/40ma). Nowit appears obvious it bounced off a nice support area. Looking back, it iseasy to peg this as a long. A stock that gapped up, filled the gap, did a 15-minute Pristine Buy Set-up (see Appendix A) and continued higher.
Maybe now, you look back at the first chart and deny you ever wouldhave shorted that pattern. Perhaps you would not have. Actually, traderstry to short this set-up so much, it is the second most common mistakethey make. Be aware that you can take advantage of other people’smistakes by playing this long at the right time. Watch for your reversaltimes—they can make your trading all the more successfull.

A Strategy Against the TrendBy now, you know that I am a big fan of the saying, ‘The trend is yourfriend’. We teach that 92% of your trades should be with the trend of themajor stage. Buy quality pullbacks and consolidation breakouts in stronguptrends. Sell short rallies and consolidation breakdowns in downtrends.
However there are a few strategies that go against the trend. Theclimactic set-ups can be used to try to capture the quick bounce from anoverdone situation. We also seem to go against the trend on transitionsbetween stages, on the Minor Time Frame when the Major Time Framehas come into a buyable area. For example, you feel like you are buying a15-minute downtrend when you buy a pullback on the daily chart. Youare in fact playing the pullback on the daily chart that is in an uptrend.
Here is another play that goes against the trend. It is a favorite of mine,but they are hard to find. It is called an ‘anticipatory breakdown of ahigh-of-the-day base, when the market is falling apart’. Sorry, no cutename for that one. The name states the whole strategy. Figure 7-8 is the15-minute chart of NVDA and of the QQQ (the tracking stock for theNASDAQ 100) being used to represent the market since NVDA is aNASDAQ stock. They are aligned vertically, so you can compare relativestrengths and weaknesses at a glance. You should consider doing this onyour charts.
Figure 7-8: NVDA (TOP) & QQQ (BOTTOM)To view charts in color go to: www.traderslibrary.com/TLEcorner
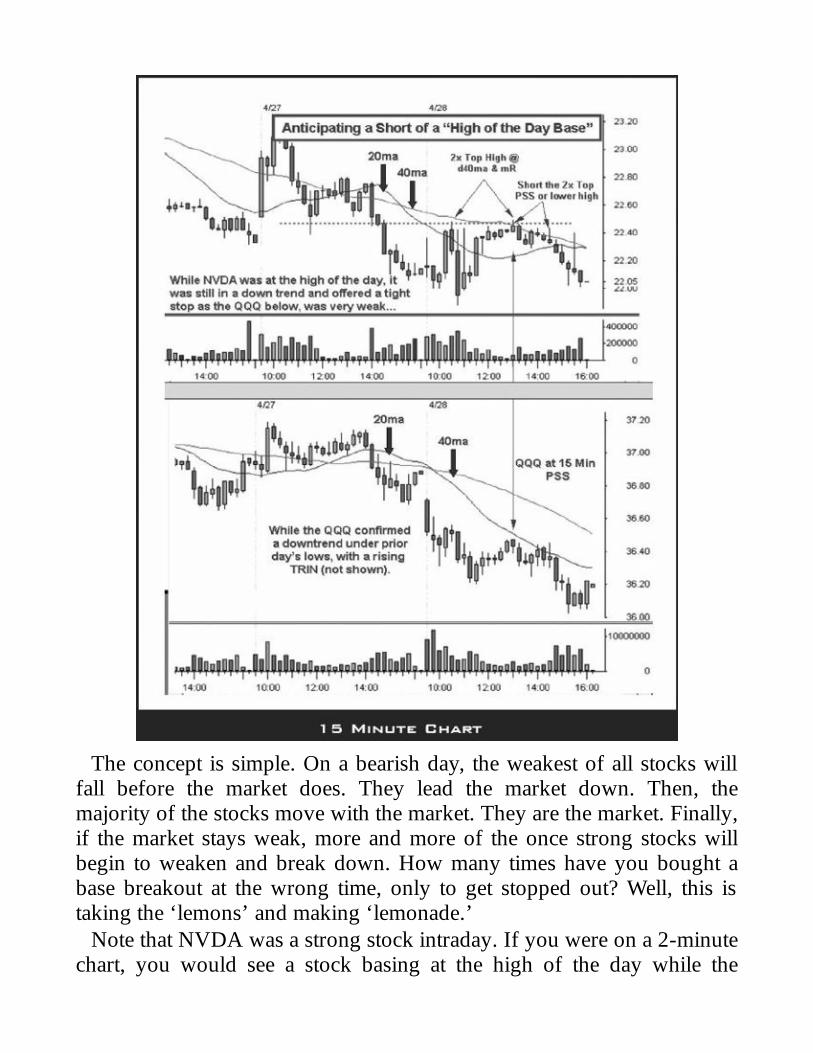
The concept is simple. On a bearish day, the weakest of all stocks willfall before the market does. They lead the market down. Then, themajority of the stocks move with the market. They are the market. Finally,if the market stays weak, more and more of the once strong stocks willbegin to weaken and break down. How many times have you bought abase breakout at the wrong time, only to get stopped out? Well, this istaking the ‘lemons’ and making ‘lemonade.’
Note that NVDA was a strong stock intraday. If you were on a 2-minutechart, you would see a stock basing at the high of the day while the
market was falling. Note, however that on the 15-minute chart shown,NVDA is still in a downtrend at the time. The QQQ rally during lunch(arrow) could not make NVDA break above the base in any significantway. As the market completes a Pristine Sell Set-up (see Appendix A)into the Declining 20-Period Moving Average, NVDA pulls off a doubletop high. The market is in an all out downtrend, and NVDA could notshow the strength it needed during the market rally.
So at the first sign of not breaking out, we short sell as early as possible.In this case, below the green bar that forms the double top (2x) high.Aggressive? Yes. Does it always work? No. Why is it attractive? Look atthe stop. Often this is done with a five to ten cent stop, making the dropvery worthwhile.
If you are going to go against the trend, you need an edge. They arelower odds trades by nature. The edge here consists of three things. First,the bigger time of NVDA was not bullish. Second, never fight the marketunless your stock is unique for some reason; the market here was bearishall day. Third, the tight stop allows for some failures, yet still makes this asuccessful strategy.

Playing a Climactic ReversalI would like to use this Lesson to review a trade strategy that can be ahelpful tool in your trader’s toolbox. It is also frequently misplayed andmisunderstood. It is the “climactic buy” or “climactic sell” set-up.
This is one of the few strategies we have for playing a stock against theexisting trend of the time frame you are playing. You should focus themajority of your plays on playing with the existing trend.
This play involves a stock getting extended a great distance in onedirection and needing to correct. This can happen on any chart. We aregoing to take a look at an intraday Climactic Buy Set-up (CBS) on the 15-minute chart of Cephalon (Figure 7-9).
Figure 7-9: CEPHALON INC. (CEPH)To view charts in color go to: www.traderslibrary.com/TLEcorner
All of the following items made this an interesting play (note thecorresponding numbers on the chart):
1. The stock had 5 lower highs on this time frame. This can includethe prior day.2. The distance from the declining 20 period moving average became
extended.3. The stock formed a reversal bar, a “changing of the guard’ in thiscase.4. An increase in volume came in at the low of the drop.5. This happened at a reversal time, 10:00 AM EST.
The entry would be based on trading above a prior bar’s high, once allthe above are set-up properly. In this case, the entry would be over$45.94 with a stop under the low of the day at $45.00. For a target, welook for a “retracement” target. We look for about a 50% retracement ofthe fall, and find a resistance point to use in that general area. Often thedeclining 20 period moving average is in this area and can be used. Thatarea in this case would be $46.50.
While this target was hit, the problem here is the risk reward.Sometimes, the reversal bar gets large and makes the stop wider and thetarget smaller. Often times, traders will ‘zoom down’ to a smaller timeframe to find an entry. Note this is only acceptable when the bigger timeframe (the 15-minute in this case) has properly set up. Look at the 2-minute chart below, for the same time period (Figure 7-10).
Figure 7-10: CEPHALON INC. (CEPH)To view charts in color go to: www.traderslibrary.com/TLEcorner
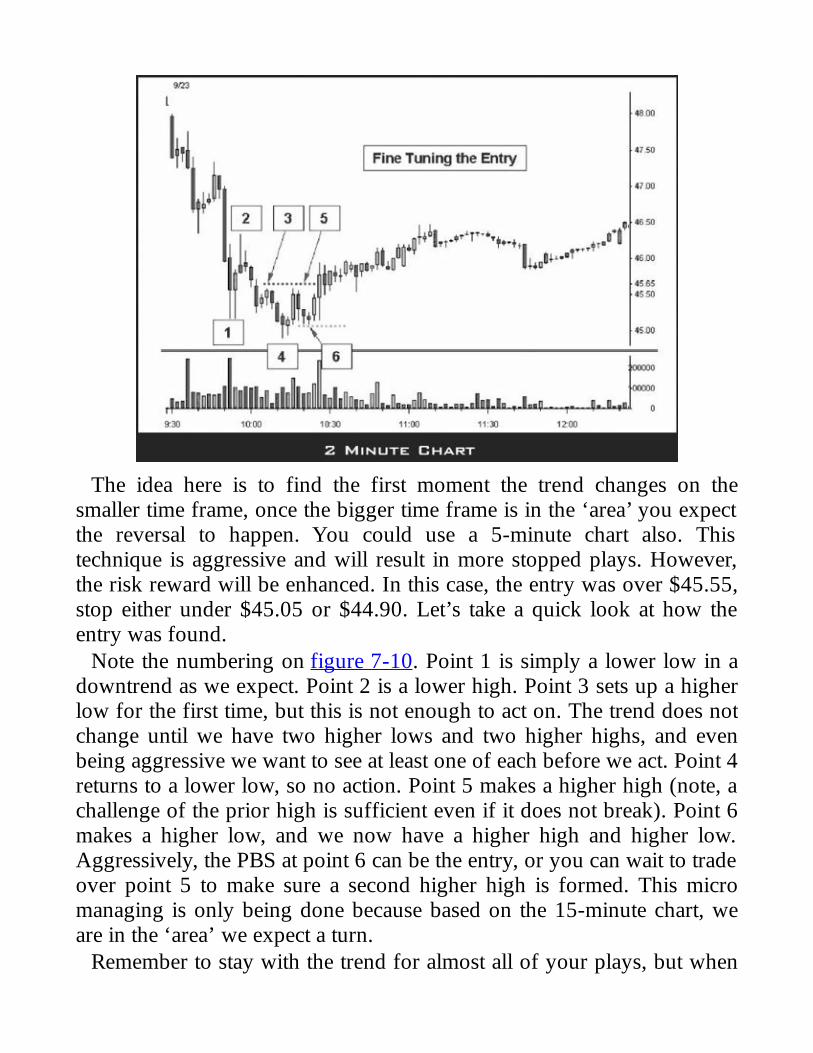
The idea here is to find the first moment the trend changes on thesmaller time frame, once the bigger time frame is in the ‘area’ you expectthe reversal to happen. You could use a 5-minute chart also. Thistechnique is aggressive and will result in more stopped plays. However,the risk reward will be enhanced. In this case, the entry was over $45.55,stop either under $45.05 or $44.90. Let’s take a quick look at how theentry was found.
Note the numbering on figure 7-10. Point 1 is simply a lower low in adowntrend as we expect. Point 2 is a lower high. Point 3 sets up a higherlow for the first time, but this is not enough to act on. The trend does notchange until we have two higher lows and two higher highs, and evenbeing aggressive we want to see at least one of each before we act. Point 4returns to a lower low, so no action. Point 5 makes a higher high (note, achallenge of the prior high is sufficient even if it does not break). Point 6makes a higher low, and we now have a higher high and higher low.Aggressively, the PBS at point 6 can be the entry, or you can wait to tradeover point 5 to make sure a second higher high is formed. This micromanaging is only being done because based on the 15-minute chart, weare in the ‘area’ we expect a turn.
Remember to stay with the trend for almost all of your plays, but when

you find a set-up similar to this one, use it as a guide to capture profits.
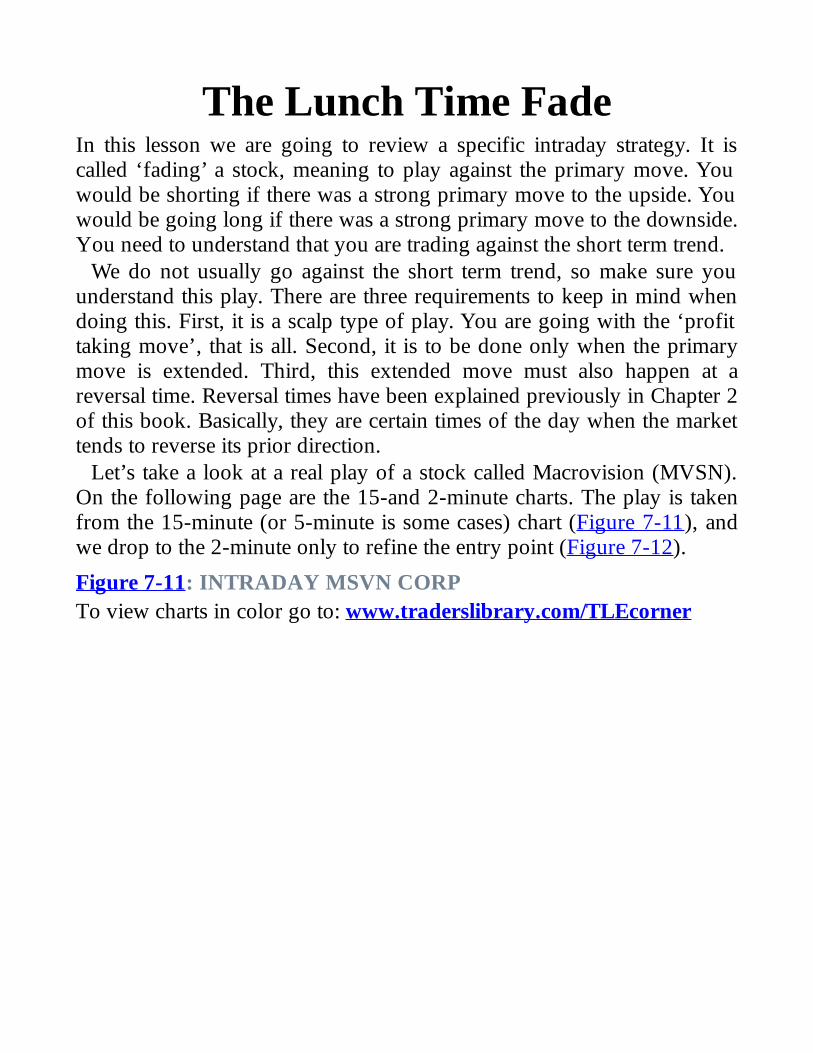
The Lunch Time FadeIn this lesson we are going to review a specific intraday strategy. It iscalled ‘fading’ a stock, meaning to play against the primary move. Youwould be shorting if there was a strong primary move to the upside. Youwould be going long if there was a strong primary move to the downside.You need to understand that you are trading against the short term trend.
We do not usually go against the short term trend, so make sure youunderstand this play. There are three requirements to keep in mind whendoing this. First, it is a scalp type of play. You are going with the ‘profittaking move’, that is all. Second, it is to be done only when the primarymove is extended. Third, this extended move must also happen at areversal time. Reversal times have been explained previously in Chapter 2of this book. Basically, they are certain times of the day when the markettends to reverse its prior direction.
Let’s take a look at a real play of a stock called Macrovision (MVSN).On the following page are the 15-and 2-minute charts. The play is takenfrom the 15-minute (or 5-minute is some cases) chart (Figure 7-11), andwe drop to the 2-minute only to refine the entry point (Figure 7-12).
Figure 7-11: INTRADAY MSVN CORPTo view charts in color go to: www.traderslibrary.com/TLEcorner
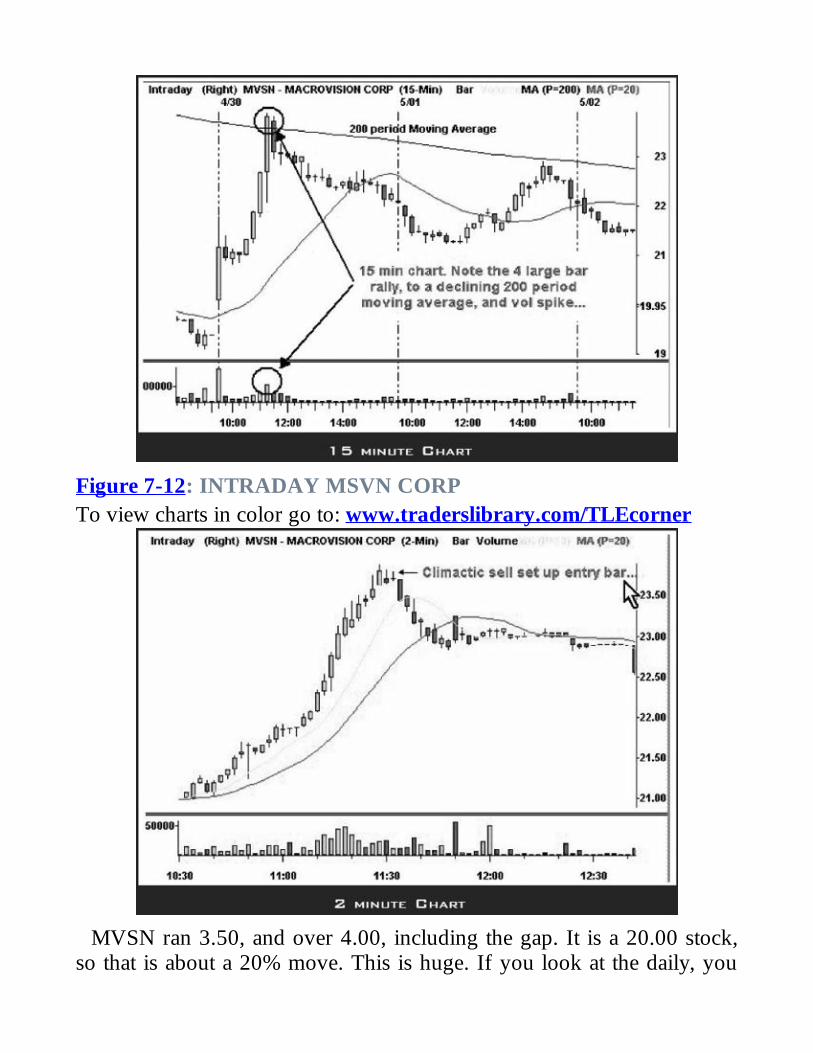
Figure 7-12: INTRADAY MSVN CORPTo view charts in color go to: www.traderslibrary.com/TLEcorner
MVSN ran 3.50, and over 4.00, including the gap. It is a 20.00 stock,so that is about a 20% move. This is huge. If you look at the daily, you
will see this is as big as the bars get. The stock rallies at open, then pausesfor an hour. This pause, after the morning run, is playable long over the30-minute high. Notice that the run lasts an hour, and produces four largegreen bars. On the last green bar, the volume spikes. This is a sign oflarge turn-over—the last of the buyers getting in, and getting in very late.This ‘exhausts’ the supply of buyers. It also runs into the 200 periodmoving average, a very powerful stopping point for extended stocks. Allof these factors make the stock ‘extended’. Notice this all happens at12:00 PM, the beginning of lunch and a reversal time in itself.
Once you have identified the play, we turn to a shorter time frame chartto refine the entry. Playing under the 15-minute bar would get you invery late as a scalp. So in this example, we turn to a 2-minute chart. In thearea we are looking at, there are several 2-minute bars with higher highs,and then a red bar with a topping tail. The next bar has a higher low, anda topping tail. The arrow is pointing at this last bar. Trading under this baris the entry to the play, and the stop is the high of the entry bar or thehigh of the rally. This is known as a Climactic Sell Set-up (see previoussection). For a target, you can do several things. The rising 20 periodmoving average on the 15-minute chart is often supported and is a goodarea to look at. You can also take all or half profits when a 15-minute bartrades above a prior 15-minute bar. You can also look to a prior base thatmay serve as support and a target.
So, the next time you’re considering a stock to play, don’t forget thelunchtime fade.

The Power of a Mortgage PlayOn the second day of our Trading the Pristine Method® seminar, studentslearn a set of strategies called guerrilla tactics. One of the tactics that istaught in detail is known as a ‘Mortgage Play’. It can be either ‘Bullish’or ‘Bearish’, as is the case with all strategies. It involves a ‘shock’ that isdelivered to a stock when it gaps a large distance to the other side of a‘20/20 bar’. A bar that is exceptionally wide and has very little ‘shadow’or ‘tail’ is known as a 20/20 bar.
If you look back at charts, you will find that quality high volumeguerrilla tactics often change the nature of the daily chart for a long timeto come. They often set a low or a high that lasts for a long time, andoften produce a strong move from that area.
As with most things, there is a trade-off. With the good comes the bad.While a Mortgage Play can produce dramatic moves, the downside is theentry. The move can be very whippy and the safe stop that the playrequires on the daily chart is the other side of the 20/20 bar. This can be along way and therefore requires holding for a big target. Refer to a chartof CPRT from December 1, 2004 (Figure 7-13). To play the stock fromthe daily chart, the stop called for would be under the prior day’s low.This is at the arrow marked 1. The entry is immediate.
Figure 7-13: CPRT Bullish Mortgage GapTo view charts in color go to: www.traderslibrary.com/TLEcorner

Does this mean that only core traders (traders that hold positions forweeks or even months) need apply? Other risk-reward parameters can beused, but they have their pluses and minuses.
One option is to play the stock assuming it will move in one direction. Itis not uncommon for the stock to open and quickly run hard in thedesired direction. The problem can be that between pre-market and theopening minutes, it can move enough to make even an early entry seemlate. Aggressive intraday traders may set the stop to the low of the currentday at the time of entry. This is very aggressive and will lead to an aboveaverage number of stop outs, but can provide an incredible reward-to-riskratio when successful. This is what was done in the PMTR for this play.The entry was the one-minute high, with the stop at the 1 minute low (lowof day at the time of entry), which is at the arrow marked 2. The firsttarget was easily taken on day one in this case, as the risk-reward justifiedthe play.
Figure 7-14 shows the same stock two weeks later. A second target wastaken on the rally the next day. The third target was taken on thesecondary break-out on the daily chart, the last green bar shown. I wouldnot be surprised to see this stock run much more, and a core positioncould also be held.

Figure 7-14: CPRT Bullish Mortgage Gap 2 weeks laterTo view charts in color go to: www.traderslibrary.com/TLEcorner
There is another way to play this strategy. It is to use the ‘power’ of theMortgage Gap but to play the stock on an intraday basis, looking for apullback and a set-up on a 5- or 15-minute chart. The advantage is a tightstop, similar to the last option, but played at a safer time, with lesslikelihood of a stop out. The disadvantage is that you may never get thispullback. You may just miss the play. Figure 7-15 is the 5-minute chart ofCPRT for December 1, the day of the Mortgage Gap.
Figure 7-15: CPRT - on day of entryTo view charts in color go to: www.traderslibrary.com/TLEcorner

As you can see, at 10:00 Reversal time, CPRT pulled back and formedits first 5-minute Pristine Buy Set-up (see Appendix A). The intradayentry had a very tight stop afforded by the small green bar. This stop wasnot only tight, but also held as the stop for the remainder of the play.
Play early with a quick entry and tight stop? Play early with a 5-minuteentry and the wide stop from the prior day? Wait and play the firstintraday set-up? It is never an easy call. Some traders will look to play outtwo of the options. For example, try the most aggressive entry, and if itstops, replay on the first PBS intraday. The guerrilla tactics are powerfultactics and experienced traders can benefit on multiple time frames.

Finding Unique PlaysYou may have seen explanations why the swing trading environment canbe tough. I have written extensively about the need to recognize whendaily charts become choppy, as a large battle will result in the areabetween bulls and bears. The next logical question is: What does a traderdo until the daily charts become more fluid? If you are with the marketsall day, the obvious answer is to be very selective with any swing trades,and to focus more resources on intraday plays. Day trades, scalps,guerrilla tactics, and using hourly charts for swing trading are all viableoptions.
If you cannot be with the market during the day, a couple of theseoptions may still be available to you. Swing trading from hourly chartscan be managed in a similar way to how you manage swing trading now.Also, there are many guerrilla plays that often are partially played outduring the first hour of trading. If you can be with the market the firsthour of the day, you may find the management of a guerrilla trade easy tohandle. It is often the case that half the position is exited during the firsthour, and a realistic raised stop can often be left on for the day. Calling into check on the play late in the trading day may be all that is needed insome cases.
Another nice quality about guerrilla plays is that some of the plays aregenerated in part by gaps that occur in the morning. This is good becausethese gapped plays are often what we call, “on their own page.” They donot necessarily follow the broader market. On many trendless or whipsawdays, this can be a blessing. The next chart is the daily chart of SapientCorp. (Figure 7-16). We are focusing on the last day, the green bar. Thischart was captured midday so it was not the closing chart.
Figure 7-16: SAPIENT CORP. (SAPE)To view charts in color go to: www.traderslibrary.com/TLEcorner
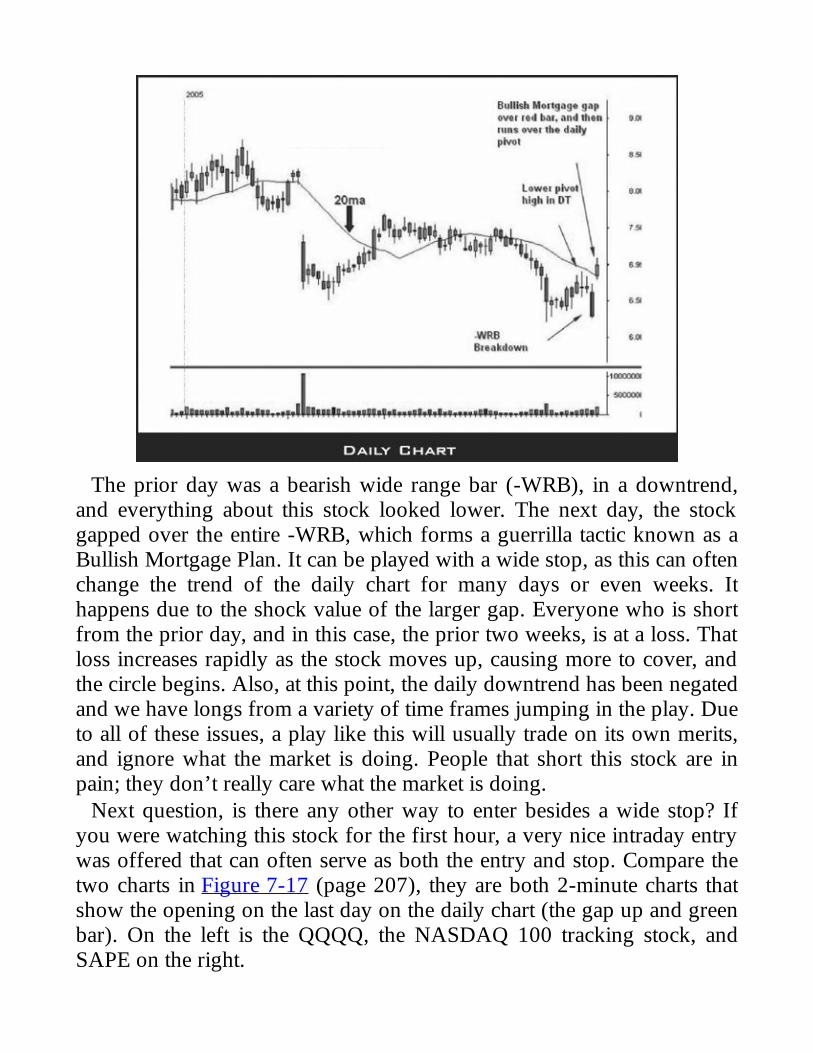
The prior day was a bearish wide range bar (-WRB), in a downtrend,and everything about this stock looked lower. The next day, the stockgapped over the entire -WRB, which forms a guerrilla tactic known as aBullish Mortgage Plan. It can be played with a wide stop, as this can oftenchange the trend of the daily chart for many days or even weeks. Ithappens due to the shock value of the larger gap. Everyone who is shortfrom the prior day, and in this case, the prior two weeks, is at a loss. Thatloss increases rapidly as the stock moves up, causing more to cover, andthe circle begins. Also, at this point, the daily downtrend has been negatedand we have longs from a variety of time frames jumping in the play. Dueto all of these issues, a play like this will usually trade on its own merits,and ignore what the market is doing. People that short this stock are inpain; they don’t really care what the market is doing.
Next question, is there any other way to enter besides a wide stop? Ifyou were watching this stock for the first hour, a very nice intraday entrywas offered that can often serve as both the entry and stop. Compare thetwo charts in Figure 7-17 (page 207), they are both 2-minute charts thatshow the opening on the last day on the daily chart (the gap up and greenbar). On the left is the QQQQ, the NASDAQ 100 tracking stock, andSAPE on the right.

Figure 7-17: QQQ (LEFT) SAPE (RIGHT)To view charts in color go to: www.traderslibrary.com/TLEcorner
A tight base formed on SAPE into 10:00 reversal time. It pulled backonce at 9:45 and based near the high. It refused to fill the gap and basedat the high. Look at the relative strength. During this time the market (asviewed by the QQQQ) pulled back to fill a gap to a nice base in anuptrend. In other words, the market looked higher, but at its lows, SAPEwas basing at the high. This makes the base entry with a tight stop (underthe base or current low of day) a possible alternate entry.
As you can see, finding unique plays is not only possible, but can beprofitable as well.
Quality Breeds NicknamesIn recent articles, I have spent considerable time discussing the quality ofthe plays traders choose. This lesson will cover a few plays that have risenfrom taking a basic strategy, and adding some additional quality criteria.The result is a strategy that is more reliable and has earned the honor ofgetting its own nickname.
We are starting with a basing strategy. We will be looking on intradaycharts, the 5- and 15-minute charts. The strategy I am showing you willalso work on the 60, but rarely sets up on the daily. We will be lookingfor stocks that base, also known as consolidating, an area where the stockis resting, with a small range from high to low over several bars,preferably with very similar or even highs if looking to go long. Thehigher low is a plus. This gives it a sort of flat top. If looking long, wewould also like the stock to be over the open price, over yesterday’sclosing price, and in the upper part of today’s trading range. All thereverse is true if looking to short the stock. Figure 7-18 is an example ofHLYW on a 15-minute chart. There is only a 10 cent range in that base.
Figure 7-18: INTRADAY HOLLYWOOD ENTER CORPTo view charts in color go to: www.traderslibrary.com/TLEcorner
After a stock has consolidated, there is a good chance that there will be
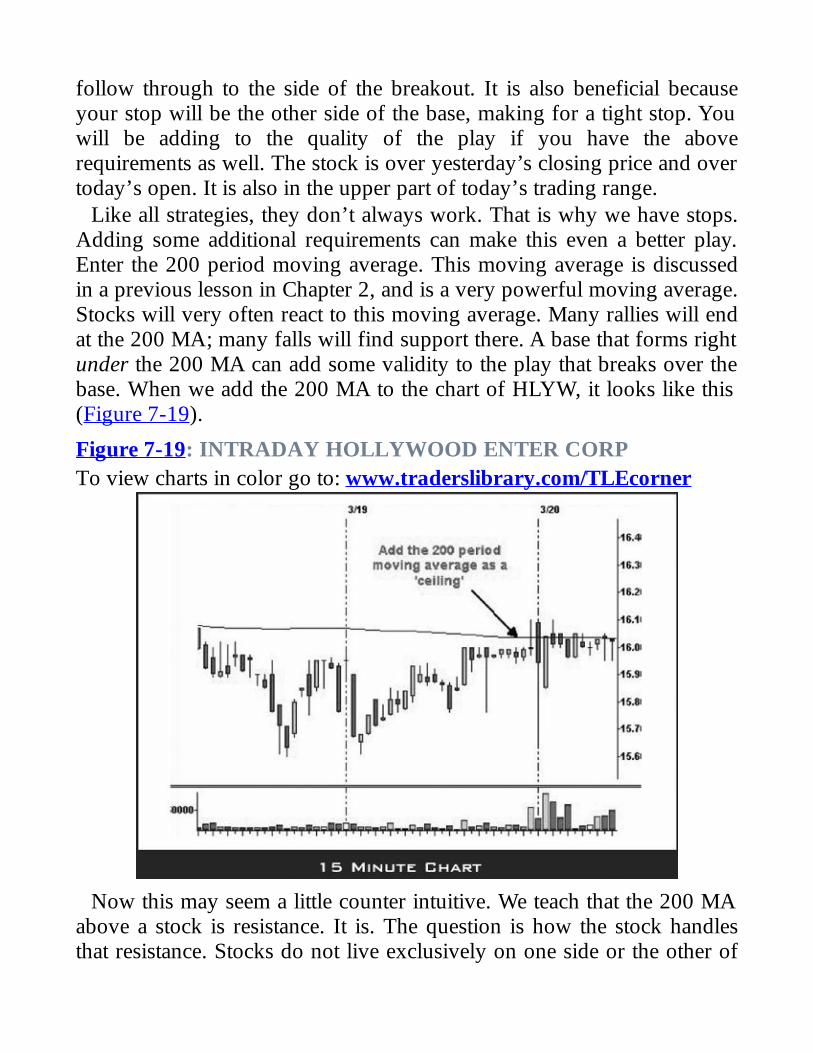
follow through to the side of the breakout. It is also beneficial becauseyour stop will be the other side of the base, making for a tight stop. Youwill be adding to the quality of the play if you have the aboverequirements as well. The stock is over yesterday’s closing price and overtoday’s open. It is also in the upper part of today’s trading range.
Like all strategies, they don’t always work. That is why we have stops.Adding some additional requirements can make this even a better play.Enter the 200 period moving average. This moving average is discussedin a previous lesson in Chapter 2, and is a very powerful moving average.Stocks will very often react to this moving average. Many rallies will endat the 200 MA; many falls will find support there. A base that forms rightunder the 200 MA can add some validity to the play that breaks over thebase. When we add the 200 MA to the chart of HLYW, it looks like this(Figure 7-19).
Figure 7-19: INTRADAY HOLLYWOOD ENTER CORPTo view charts in color go to: www.traderslibrary.com/TLEcorner
Now this may seem a little counter intuitive. We teach that the 200 MAabove a stock is resistance. It is. The question is how the stock handlesthat resistance. Stocks do not live exclusively on one side or the other of

the 200 MA. They do cross it. The thing to watch is how they cross.These are areas of opportunity. If a stock hits the 200 MA, pulls back,and then trades right back up to the 200 MA quickly, it is gainingstrength. If every pullback finds support at a higher and higher level, that200 has weakened to the point that it will give way. This resistance, whencrossed, becomes a springboard now that all recognize that this stockwants to live on the other side of this moving average. This additionalrequirement has made this play known as the “Elephant Walk” in thePristine Method® Trading Room.
Let’s add another requirement and come up with another name. Whenwill that price be likely to finally move over the base and 200 MA? Thosewho have studied what we teach know that any base is likely to moveonce enough time or price correction has happened to let the stock rest.This is measured in the afternoon by the 20 period moving average on the15-minute chart. This is shown in red (Figure 7-20 page 211).
Figure 7-20: INTRADAY HOLLYWOOD ENTER CORPTo view charts in color go to: www.traderslibrary.com/TLEcorner
This kicks off the play by hitting the price and eventually crossing the200 MA. Normally, the stronger moving average should win. The price is
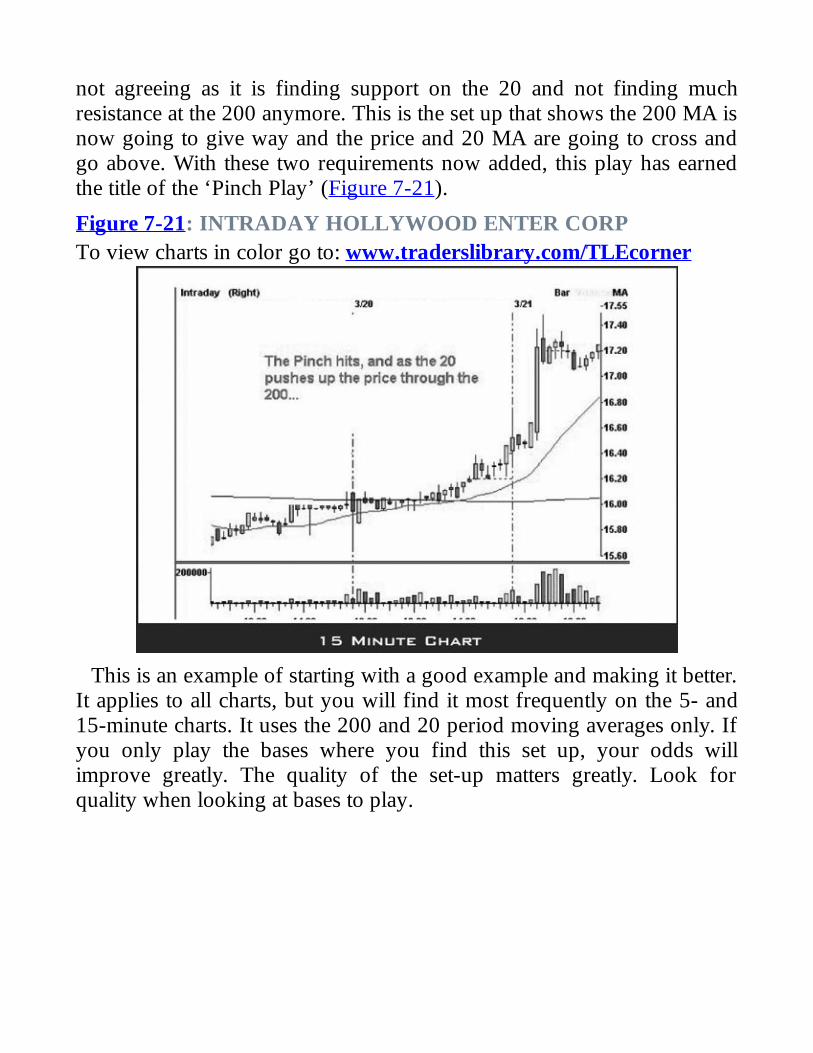
not agreeing as it is finding support on the 20 and not finding muchresistance at the 200 anymore. This is the set up that shows the 200 MA isnow going to give way and the price and 20 MA are going to cross andgo above. With these two requirements now added, this play has earnedthe title of the ‘Pinch Play’ (Figure 7-21).
Figure 7-21: INTRADAY HOLLYWOOD ENTER CORPTo view charts in color go to: www.traderslibrary.com/TLEcorner
This is an example of starting with a good example and making it better.It applies to all charts, but you will find it most frequently on the 5- and15-minute charts. It uses the 200 and 20 period moving averages only. Ifyou only play the bases where you find this set up, your odds willimprove greatly. The quality of the set-up matters greatly. Look forquality when looking at bases to play.

When it all Comes TogetherIn this lesson, we will examine a play where every detail could be thefocus of a separate lesson. The focus of this particular lesson is what canhappen when everything falls into place and multiple concepts converge.This brings buyers and sellers in extreme unbalance, and can have youanticipating the upcoming move.
The stock is Epicor Software Corp. Below is the daily chart, and ourfocus is the day of the gap up, July 20, 2005 (Figure 7-22 page 212).
Figure 7-22: EPICOR SOFTWARE CORP. (EPIC)To view charts in color go to: www.traderslibrary.com/TLEcorner
On this morning, this stock came to my attention because it was on thegap list. A big focus of my morning is reviewing the stocks that areshowing that they will be gapping up or down. These gaps can be thesource of many strategies I teach. Depending on many factors, the stockmay have a bullish or bearish bias once it begins trading. For EPIC, all ofthe following came together.
The prior day, EPIC closed with a bearish red bar, (labeled 1), whichhad closed under the lows of the last six days. This pattern has traders
leaning short into the close. The following day the stock opens (labeled 2)with a gap that not only clears the other side of the prior day’s red bar,but also clears the prior pivots on the daily chart (the red lines). Now, justclearing the prior day’s red bar created a minor bull mortgage play. Thisalone is enough to warrant a play.
The fact that we also cleared the pivots on the daily chart helped toconfirm a professional type gap. Also, the gap was not so far that it was‘off the chart.’ It just did enough to clear the resistance areas. While a gapof $1.20 on a $14.00 stock sounds excessive, gaps like this cannot bethought of as being extended. The reason is that no one has traded thestock in that void. When it opens pre-market, the stock trades at the gapprice, and any pent-up demand for the stock must pay the gap price. Noone has been able to buy it cheap, regardless of who wants it, they mustpay the high price.
What could be better? The only thing better would be if the market wasactually gapping down, and this day it was. This may sound backwards tosome of you, to want the market gapping down when going long. Thereare two reasons we want this. First, this shows the stock has relativestrength. The market is not causing the gap up. Second, much of this playis likely to play out in the first half hour. Even if the market heads lower,the chances of a market rally during the first half hour are good after agap down, regardless of whether the market heads lower later or not.
All these things put together mean we want to enter this stock quickly,as there is a good chance that if it moves in the direction we want, it maydo it right from the opening tick. There are many ways to play this. Ifplaying off the daily chart, a wide stop is used. Sometimes day tradersand scalpers will use the power of this move to justify a play with asmaller stop, or play both the day trade and the swing trade. Let’s take alook at how I played EPIC that morning (Figure 7-23).
Figure 7-23: EPICOR SOFTWARE CORP. (EPIC)To view charts in color go to: www.traderslibrary.com/TLEcorner

First, look at the 2-minute chart of EPIC (Figure 7-22) on the morningin question. You can see the end of the prior day ended with a sell off(labeled 1). The gap can be seen on the 2-minute chart, as EPIC opened atpoint 2. The entry could be immediate (make sure it is trading up) or youcould use a one or two-minute high. Our entry was $14.82, with a 20 centstop to the low of the day.
The rally and topping tail that formed at point 3 were used to exit a one-third lot as a scalp, at $15.15. The stock showed great strength as itcoasted sideways into 10:00 reversal time. As the stock moved up, thestop was lowered to the base that formed at point 4, to lock in profits. Oursecond target was taken as the stock stalled at 5, $15.44. The ultimate daytrading target was the $16.00 area, as that is where a weekly base formeda high (this is not shown here, refer to a weekly chart). Our last third wastaken at 15.94 as the stock formed the red bar to the left of 6, the ultimatetarget.
While this was played out as a day trade, it could have also been usedby swing traders as an entry, or a part of this position could have beensaved as swing. When mortgage type gaps come with volume and clearresistance areas, this often changes the daily chart for months to come.
It was difficult to find fault with this trade, and when things come

together like this, the play has good odds of working. They all don’twork out like this one, of course, but trading is about playing the oddsand, most importantly, learning your lessons.

Conclusion
In this book you’ll find answers to the majority of trading decisions thatwill confront you as you trade on a daily basis. You have been shownwhat to expect, what to look for, and where to find valuable tradinginformation. For the educated trader, well-laid plans are the key to tradingsuccess and this begins by studying the profession and paper-trading untilyou feel confident in your abilities to pick advantageous set-ups. Notice Ididn’t say pick winners, only recognize those situations that have highpercentage chances of success coupled with low-percentage chances ofloss. This is a controllable, not nerve-wracking—deductive, notpresumptive—trading style.
Let’s start with a review. Some things are common to all traders: Youought to be able to state your trading style and goals in a simple sentence.Why did you buy that stock? Your entry dictates your exit. Where is yourstop? Will you make many small profitable trades—and sacrifice profitsfor smaller losses—or look for larger gains with larger risks? Remember,it has to make sense on paper if it’s going to work for real. And finally,can you follow the trading plan that you’ve set up, and does it fit yourpersonality?
Strategies for Profiting on Every Trade presents trading techniquesunique to Pristine.com. As the market rises and falls, and reachestransition areas, there are ways to know whether the trend is likelybending or heading for the big plunge into no-man’s land. Whether youuse the system or incorporate key parts into your own trading, theconcepts will give you additional interpretive skills, as well as improveyour outlook and bottom line. The system’s key points are shown below.Check for yourself and see if you’re familiar with all of them.
1. Pattern recognition of a Level 2 trend.2. Time frames. Which one are you using and do multiple timeframes, particularly the larger ones, verify the direction of your trade?3. Stops and money management. If it’s high-risk, adjust the sharesize to keep losses at an acceptable level.4. Timing the market—yes it is possible. The most important reversaltimes are at 9:50 – 10:10, 11:15, 1:30, 2:15 and 3:00.5. Analysis of winning and losing trades. Did you sell your winning

stock too soon? If it went wrong, why? Did you hang on too long to alosing trade or perhaps you never should have entered in the firstplace?6. Market Direction. Ninety-eight percent of trades go with the overalltrend of the market. The Semis lead the indexes. Recognize strengthsand weaknesses in sectors and in stocks within the sectors.7. Know your own abilities and frame of mind. Are you a beginner or“unconsciously conscious,” quietly competent and in control?8. Recognize several key tradable chart patterns and concepts:Opening gaps, trend lines, 20- and 200-period moving averages,support and resistance, wide ranging bars, tops and tails, 20/20 bars,and pullbacks.9. Emergency management—What to do if your trade goes againstyou? How do you reset your stop-losses?
And finally don’t forget the most common mistakes:Don’t short strong stocks.Don’t short multiple bar drops to support (or vice-versa).
Most importantly, as I stress throughout Strategies for Profiting on EveryTrade, educate yourself, and set yourself up for success. While makingdecisions is largely intuitive, realize the competitive nature anduncertainty of the market. Examine yourself. Are you a high percentageplayer? Just like spotting that one chart pattern that will evolve into awinner, superior traders stand out in the universe of traders. May youcome out a winner and on the right side of all your trades.

Appendix A

Analyzing Pristine Buy Set-upsThe Pristine Buy Set-up is one of the strategies we use to help determinebuy set-ups. If you have taken the Trading the Pristine Method® seminar,you have undoubtedly learned all of the details and requirements of thePristine Buy Set-up (PBS), as well as many other buy and sell set-ups.
The problem is, I have never talked to anyone who took the seminarwho did not leave with their head spinning with information. By the timethey put this information to use, some of the concepts are forgotten, or atleast some details are fuzzy. This may lead to improper application of thestrategy. One of the most common questions I take in the PristineMethod® Trading Room deals with improperly applying the PBS. Thepurpose of this article is to focus on the proper application of the PristineBuy Set-ups (I will focus on “Buys” but this applies as well to the “Sell”equivalents). Also, all these tactics apply to all time frames, but I will bediscussing PBSs on daily charts with swing trading in mind.
The Pristine Buy Set-up in its most powerful form has all of thefollowing basic characteristics, the more, the better.
1. Stage 2 uptrend or at least a recent primary uptrend2. Three-to-five day pullback3. Narrow range day, or4. A nice tail with a narrow body5. Changing of the guard6. Climactic volume7. Previous major price support8. Moving average support, and9. Optional bonus—forming last two days of the month
There is not enough space in these lessons to review all of therequirements; however, many have been discussed in the previous lessonsof this book. Even if you are not that familiar with all of the requirements,you have probably been trying to apply these techniques, and this articlewill help eliminate some mistakes you may be encountering.
The problem comes in when traders start looking for the picture of thePBS. They look for the 3-5 down bars to identify a potential PBS. The
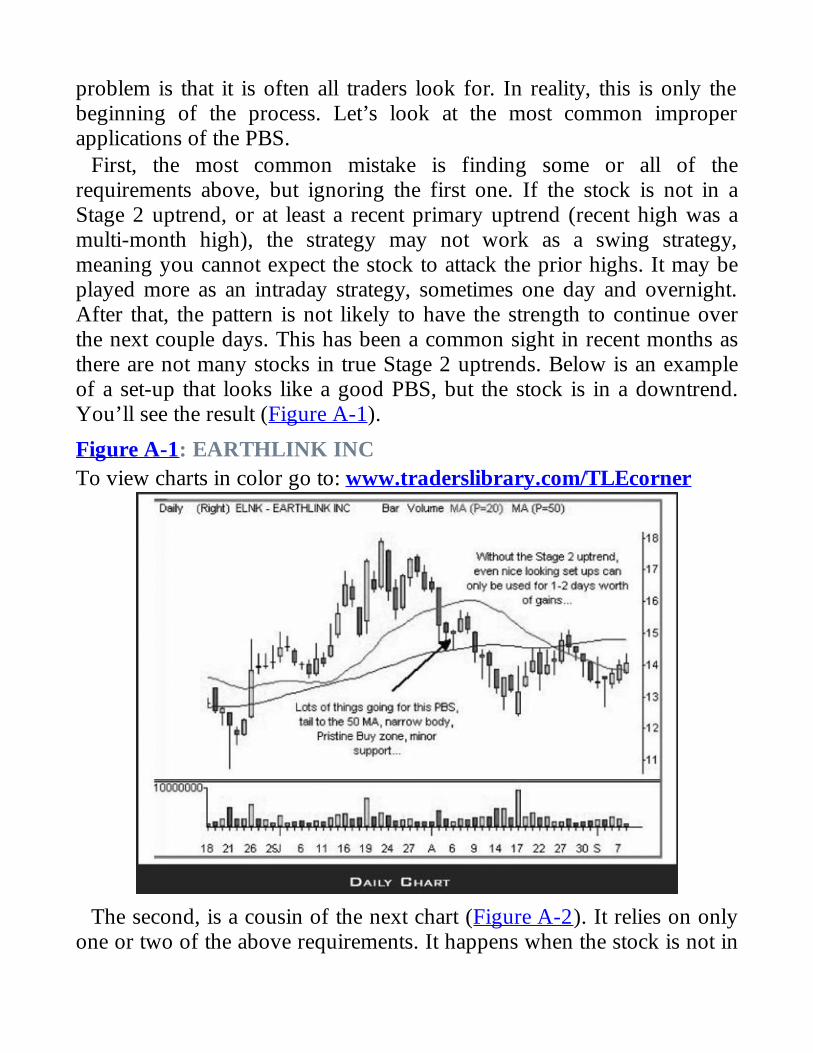
problem is that it is often all traders look for. In reality, this is only thebeginning of the process. Let’s look at the most common improperapplications of the PBS.
First, the most common mistake is finding some or all of therequirements above, but ignoring the first one. If the stock is not in aStage 2 uptrend, or at least a recent primary uptrend (recent high was amulti-month high), the strategy may not work as a swing strategy,meaning you cannot expect the stock to attack the prior highs. It may beplayed more as an intraday strategy, sometimes one day and overnight.After that, the pattern is not likely to have the strength to continue overthe next couple days. This has been a common sight in recent months asthere are not many stocks in true Stage 2 uptrends. Below is an exampleof a set-up that looks like a good PBS, but the stock is in a downtrend.You’ll see the result (Figure A-1).
Figure A-1: EARTHLINK INCTo view charts in color go to: www.traderslibrary.com/TLEcorner
The second, is a cousin of the next chart (Figure A-2). It relies on onlyone or two of the above requirements. It happens when the stock is not in

a primary uptrend, or when a series of lower lows and lower highs hasdeveloped. It takes more to turn the short-term trend back to up, sorelying on as many of the above requirements is important here. Themistake here is finding any 3-bar pullback and assuming that the patternwill hold. See RSTN below (Figure A-3). The pattern degrades from alltime highs and never forms a set up that involves more than two or threeof the criteria needed. The result is nothing more than 1-2 day bounces.
Figure A-2: EARTHLINKTo view charts in color go to: www.traderslibrary.com/TLEcorner
Figure A-3: RIVERSTONE NETWORKSTo view charts in color go to: www.traderslibrary.com/TLEcorner

The third mistake is rarely talked about. The quality of the 3-5 barpullback is very important. Ideally, the pullback should be 20-20 bars(little tails), no gaps, and all days have lower highs and lower lows. Whiletechnically, 3-5 lower highs is all that is required, you will find that theprettier the picture, the better the pattern. It is beyond the scope of thisarticle, but just remember that gaps and tails may be trapping additionaltraders that may kill any upcoming rally. Check TTWO, (Figure A-4 page223), which at the time was coming off all time highs, a strong sign. Aclean set-up never develops and the stock cannot do better than a two dayrally and a 50 percent retracement.
Figure A-4: TAKE TWO INTERACTIVE SOFTWARETo view charts in color go to: www.traderslibrary.com/TLEcorner
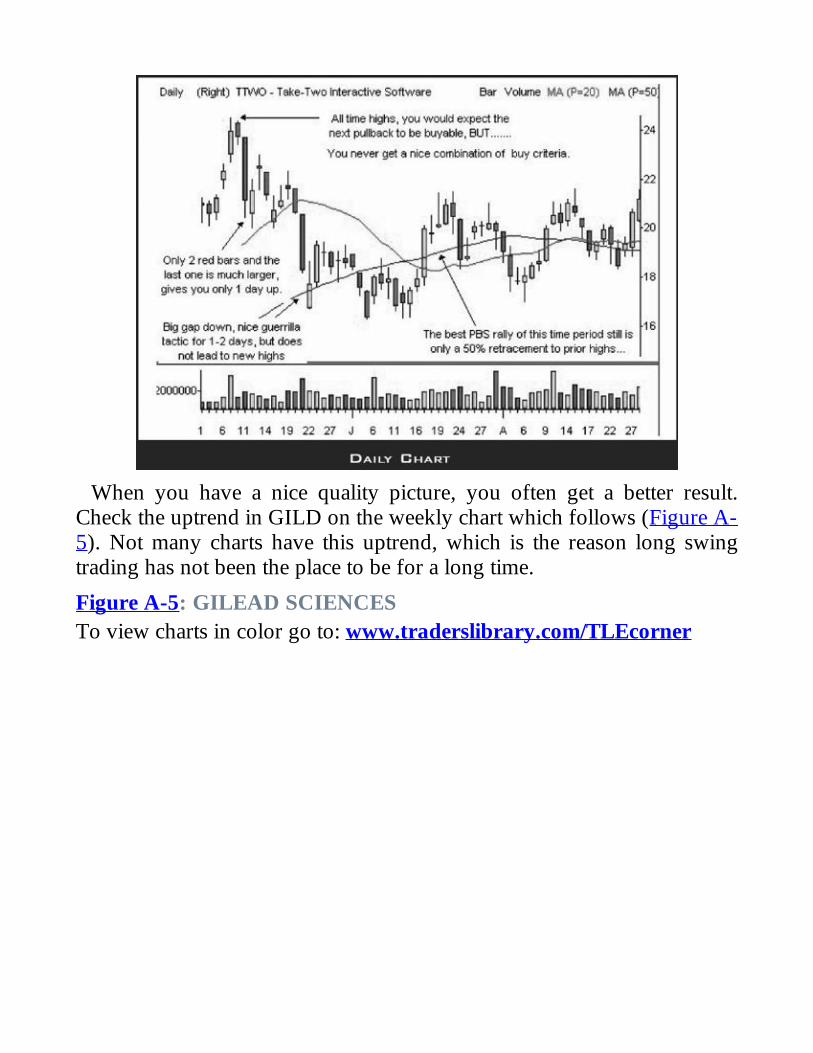
When you have a nice quality picture, you often get a better result.Check the uptrend in GILD on the weekly chart which follows (Figure A-5). Not many charts have this uptrend, which is the reason long swingtrading has not been the place to be for a long time.
Figure A-5: GILEAD SCIENCESTo view charts in color go to: www.traderslibrary.com/TLEcorner
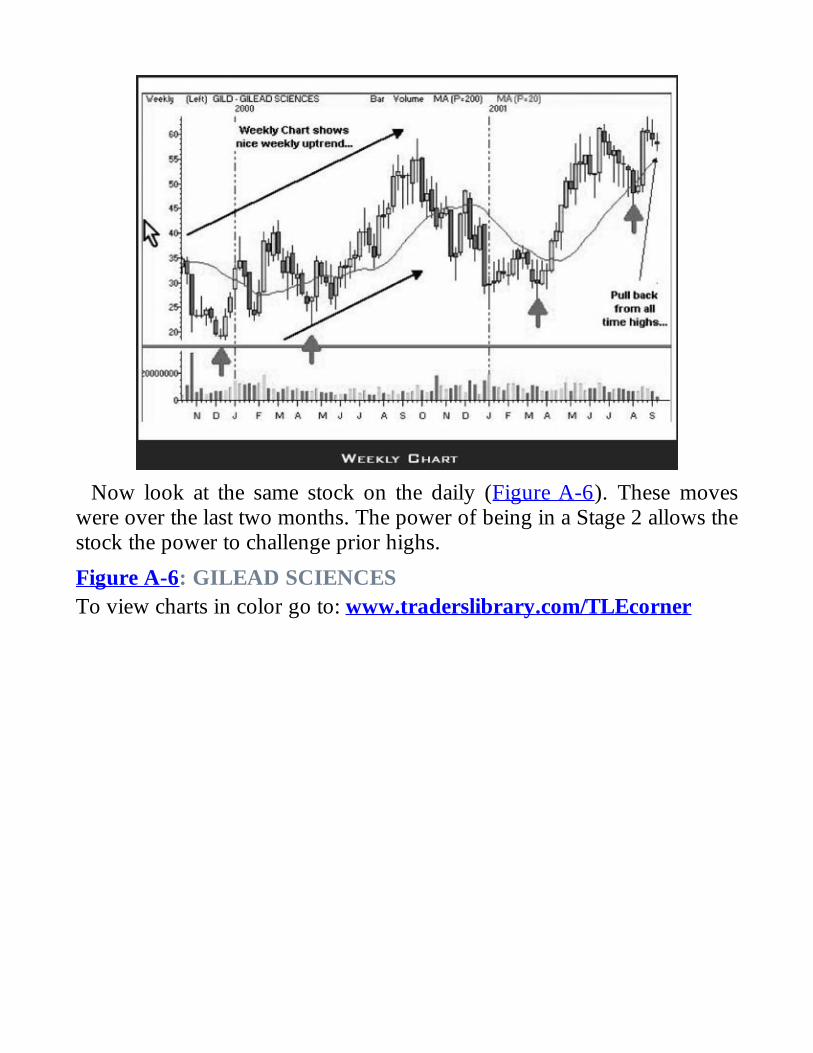
Now look at the same stock on the daily (Figure A-6). These moveswere over the last two months. The power of being in a Stage 2 allows thestock the power to challenge prior highs.
Figure A-6: GILEAD SCIENCESTo view charts in color go to: www.traderslibrary.com/TLEcorner

Remember, the targets (attacking previous highs) on a Pristine Buy Set-up only apply when you have a quality set-up. If you are not in a qualityStage 2 uptrend, you do not have a quality set-up. A play may still be athand, but the target will often be more along the lines of a guerrilla tacticor a one- to two- day rally. Remember also, many times a Pristine BuySet-up is also a trigger for a quality guerrilla tactic, so there may be someoverlap. This is why the target is often only a one- or two- day moveunless the PBS is of the proper quality to move the stock to new highs.Hopefully, you now have a better understanding of all that is the PBS.

Appendix B

GlossaryBasing When the price of a stock has little or no trend.Bear market A period of time when the prices of stocks are falling or areexpected to fall.Breakout When a stock moves through the stages of support andresistance, is followed by heavy trading and volatility in the market.Bottoming tail Points toward a low and is created by a stock dropping,then suddenly reversing to the upside.Bull market A period of time when the prices of stocks are rising,sometimes faster than they have in the past.Climactic Buy Set-up A type of trade that looks for stocks on dailycharts that have recently experienced climactic declines on big volume,which renders them oversold and overdue for a strong rebound.Core position The longest time frame to hold a stock, sometimes lastingfor months, where an exact exit strategy is planned.Core traders A trader who monitors weekly charts in order to holdpositions for weeks or months, securing even larger profits.Day traders A trader educated in trading strategies and disciplines.Spends a good part of the day with the market and is trained to managepositions that may last from several minutes to several months.Downtrend The downward movement of a stock price or the marketoverall; the opposite of an uptrend.ECN An acronym for Electronic Communication Network. It is a systemthat brings buyers and sellers together for trading online.ETF An acronym for Exchange Traded Fund. Each ETF is a basket ofsecurities that is designed to generally track an index (stock or bond,stock industry sector, or international stock), yet trades like a single stock.The most common are the QQQ, SPY, and DIA.Fading When fading a stock, you are playing against the primary move.Futures An obligation to receive or deliver a commodity or financialinstrument sometime in the future, but at a price that is agreed on today.Gap Describes the condition when a stock opens at a significantly higher
or lower price than its closing price on the day prior.Guerilla trades Tactics designed to capture fast moves in the market inone to two days.HOLDRS An acronym for Holding Company Depositary Receipts andare service marks of Merrill Lynch & Co., Inc. They are securities thatrepresent an investor’s ownership in the common stock or AmericanDepositary Receipts of specified companies in a particular industry,sector, or group.Income-Producing Account Refers to an account that looks to takemoney out of the market everyday by executing day trades and guerrillatrades. These trades are designed to be exited the same day or one dayand one night.Index A list of the larger, key stocks that are thought to be representativeof the market itself. Some indices are the S&P 500, the NASDAQ 100,and the Dow Industrials.Intraday Describes price movements within the day or over the course ofa single trading session.Market maker A trading firm that stands ready to buy or sell a particularstock on a regular and continuous basis at a publicly quoted price.Market Volatility Index (VIX) Provided by the Chicago Board ofOptions Exchange (CBOE) and is used as a guide to indicate the level ofanxiety or complacency of the market.Micro scalping A trading strategy that attempts to make many profits onsmall price changes.Mortgage play A shock that is delivered to a stock when it gaps a largedistance to the other side of a 20/20 bar, a bar that is exceptionally wideand has very little tail.Moving average Shows the average value of a stock’s price over a setperiod. Generally used to measure momentum and define areas ofpossible support and resistance.Pivot point The average of a stock’s high, low, and closing prices.Pristine Buy Set-up A strategy used to determine buy (and sell) set-ups,which has several specific characteristics to be successful (see Appendix
A).Protective stop A strategy that aims to limit potential losses to a desiredamount by using a stop-loss, or a point at which one will stop trading.Pullback A falling back of a price from its high.Relative strength Indicates when the stock is acting stronger than themarket in general or stronger than the index it is in. An index can alsohave relative strength compared to the market.Reward to Risk Ratio The amount to be made from the entry to thetarget, as compared to the amount to be lost from the entry to the stop.Resistance A price level or area in which the demand for a stock willlikely overwhelm the existing demand and halt the current advance.Reversal times Times during the trading day that the market is likely tostall or reverse the most recent pattern.Swing trades Taking trades with the intention of selling them after onlytwo to five days.Support A price level or area in which the demand for a stock will likelyoverwhelm the existing supply and halt the current decline.Topping tail Points toward a high and is formed by a move to the upside,which then gives way to a sharp decline.Trading plan Defines what one wants to trade, when one wants to tradeit, and how to trade and manage it.TRIN A measure of selling pressure; used as a market internal to measurethe strength of the market.Uptrend The upward movement of a stock price or the market overall;the opposite of a downtrend.Wide Range Bar (WRB) A price bar that is much larger than thepreceding price bars and therefore represents a trading period with highervolatility.Zooming down Going down one time frame to find an alternate entry toplay.

Index
20/20 Bar
Aaccounts
separation by goaltiming of use
American Stock Exchange (AMEX)analysis of tradesanticipatory breakdown of high-of-the-day base
Bbreakouts
entry andtype of
Bullish 20-20 playBullish Gap and Snap PlayBullish Mortgage PlanBullish Mortgage Play, Minor
Ccash indexcaution in marketCBOE (Chicago Board of Options Exchange)chart patterns. See also time frames
basing strategiesfailed breakdown at reversal timefinding unique playsindexes andintradaylunch time fademortgage playNASDAQ 100 tracking stock (QQQ)NASDAQ Composite IndexNASDAQ daily chart
news andfor opening half hourplaying climactic reversalrelative strengthrelative strength at reversal timestrategies going against trendsuccessful use of
Chicago Board of Options Exchange (CBOE)Climactic Buy Set-up
going against trendplaying climactic reversal
Climactic Sell Set-upcommissionscomputer equipmentconscious incompetenceconsciously competent tradingcore position
accounts forinvesting vs.stocks for long-term holding
Ddaily chartsday trading
account forcomputer equipment fordefinitionlearning aboutmeasuring progressonline trading vs.stock purchases
discipline in tradingdouble bottomdouble topDow Industrials index
Ee-miniseducation. See learning about tradingElephant WalkExchange Traded Fund (EFT)exit point
Ffading a stockfear
psychology ofpublic, as trading tool
filling the gapfirst half hour tradingfutures, definition
Ggap listgaps
causes ofdefinitionfillingmorning, guerrilla plays andNASDAQ Composite Indexstrategies for
guerrilla playsaccount forbullish mortgage planmanagement ofmorning gapped playsmortgage play
guerrilla tactics
HHOLDRS (Holding Company Depositary Receipts)
“Hoss” (moving average)hourly charts
Iincome producing accountsincompetence, conscious vs. unconsciousindexes
overviewways to view
individual retirement accounts (IRAs)Internet accessintraday trading
chart patterns and trendsfinding intraday reversalmortgage playmoving averages and
investingcore position vs.long term, vs. tradingas obsolete conceptstock fundamentals in
Llearning about trading
paper trading andprocess ofsteps in
losing trades
Mmanaging trades
alternate swing entriesdetermining share sizeentry, anatomy oflosing trades, analysis of

multiple time framesovernight trading disaster plansreaching targetsreward to risk ratiotrades expectancy
market. See stock marketmarket analysis
chart lessons forNASDAQ 100 tracking stock (QQQ)NASDAQ Composite IndexNASDAQ daily chartS&P 500Volatility Index
Minor Bullish Mortgage Playmistakes in tradingmortgage playmoving averages
5 minute chart15 minute charts20-period200 perioddeclining 20-periodintraday time framesmarket trends andrising, as supportas timing mechanisms
multiple bar drops, shorting
NNASDAQ 100 indexNASDAQ 100 tracking stock (QQQ)NASDAQ Composite IndexNASDAQ Stock ExchangeNew York Stock Exchange (NYSE)news
appropriate uses ofimpact on tradingmarket impact oftrading gaps and
next day, preparing for
Oobjectivity in tradingonline investors, day traders vs.opening minutes, trading onoptions contractsovernight trading, disaster plan for
Ppaper tradingpattern watch listPC (Put-Call) ratioPinch Playpivot points, dailyprice movementprice voidPristine Buy Set-up (PBS)
characteristicsmistakes inreversal timessuccess withzooming down and
Pristine chat roomsPristine ESP™Pristine Sell Set-upprofit-to-loss ratiopsychology of trading
discipline infear andlosing trades

need to be rightpersonal qualitiespullback in markettrading plan and
pullbacksentry andhandling market transitionspublic fear andtrend changes and
Put-Call Ratio (PC ratio)puts
QQQQ (NASDAQ 100 tracking stock)
Rrelative strength
definitionat reversal timeas trading tool
resistance. See also supportRetail Indexreversal times
climactic, trade strategy forfailed breakdown atintradayrelative strength at
reward to risk ratiodefinitionmanaging trades and
risk reductionrumors, trading and
Sshorting multiple bar drops
S&P Depository Receipts (SPY)S&P 500 index
market analysisways to view
S&P Futuresstock brokers, direct accessstock market. See also market analysis
caution indefinitionsstages oftrends and patternsvolatility of
stock prices, factors in movementstock purchases. See also tradingstocks
over extendeduniverse of
stop lossesdefinitionmanaging trades andmisuse oftrading plan and
strike pricesubjectivity in tradingsupport. See also resistance
as concept vs. numbersdefinitionmajor vs. minorrising moving averagerising trend line
swing positionswing trading
alternate entriesdaily charts and

definitionfrom hourly chartsmanaging watch listtime framezooming down and
Ttargets, achievingtechnical analysistechnology, rapid change andtime frames. See also chart patterns
intradaymarket trends andmultiple, handling ofrelative strength andfor stock tradingfor using accountszooming down
topping tailtrades expectancytrading. See also managing trades
analysis of tradescommissionscommon mistakesfirst half hourfundamental vs. technical approachimportance of basicslong term investments vs.need to be rightpaper trading, as learning experiencePristine system componentsrisk reductionstyle and goalstools for
trading plan

components ofdevelopment ofdiscipline andfear andpsychology ofstop losses andsuccess and
transitions, signs oftrends. See also chart patterns
clean patterns inending offightingintraday, trading andquality ofrecognizing trend dayrising line as supportshorting rallies and changes insigns for end of strong rally or falltime frames andtrading strategies going against
20/20 Bar
Uunconscious competenceunconscious incompetenceuniverse of stocks
VVolatility Index (VIX)
Wwashout of sellerswatch list
concept ofdevelopingfavorite stocks
managingpattern listPristinereading playsas trading tooluniverse of stocks
wealth building accountsweekly chartsWide Range Bar
Zzooming down
Trading Resource Guide

RECOMMENDED READING

SWING TRADINGby Oliver Velez
Oliver Velez, cofounder of Pristine.com and current CEO of VelezCapital Management, is renowned for his effective trading skills andspecialized knowledge in technical analysis. His educational seminars aresought after by traders and often attended multiple times to extract everypiece of wisdom from his presentations. Now, one of his most legendarysessions jumps from the screen into your hands in this coursebook ofVelez’s famed Swing Trading technique. With detailed text and a vivid 90min DVD, you’ll explore and master a highly profitable niche thatexploits the two- to five-day holding period—a method too brief for largeinstitutions, too lengthy for day traders, yet perfectly suited for individualinvestors with a mind towards success. In his captivating, high-energystyle, Velez shows you how to:
Spot opportunities using proven swing trading criteriaDefine periods of market uncertainty and make the right movesDiscover key set-ups and effectively use moving averagesRead charts successfully, especially Japanese Candle SticksWin by going against conventional trading wisdomUnderstand and profit from understanding market psychology
Item #BCOVx5278311- $49.95

5 TRADING TACTICS THATBEAT THE MARKET
by Oliver Velez
Finding profits in today’s markets can be overwhelming. Now, one of themost sought after educators in the industry, Oliver Velez, cuts through thenoise and hands you the five tactics that will get you to winning trades.From clearly seeing the trends in the chaos of market, to zeroing in onplays that are about to breakout and the key to significantly minimizinglosses—this course hands you 5 of the most effective weapons to beat themarkets.
Item #BCOVx5197571 - $99.00

TOOLS AND TACTICS FOR THEMASTER DAYTRADER:
BATTLE-TESTED TECHNIQUESFOR DAY, SWING, AND
POSITION TRADERS 1STEDITION
by Oliver Velez and Greg Capra
A no-nonsense, straight-shooting guide from the founder of Pristine.com,designed for active, self-directed traders. Provides potent tradingstrategies, technical skills, intuitive insights on discipline, psychology andwinning methods for capturing more winning trades, more often.
Item #BCOVx11221 - $55.00

MARKET WIZARDSby Jack D. Schwager
What fellow traders are saying about Market Wizards:“Market Wizards is one of the most fascinating books ever writtenabout Wall Street. A few of the “Wizards” are my friends—and JackSchwager has nailed their modus operandi on the head.”
- Martin W. Zweig, Ph.D., Editor The Zweig Forecast“It’s difficult enough to develop a method that works. It then takesexperience to believe what your method is telling you. But the toughesttask of all is turning analysis into money. If you don’t believe it, try it.These guys have it all: a method, the conviction and the discipline to actdecisively time after time, regardless of distractions and pressures. Theyare heroes of Wall Street, and Jack Schwager’s book brings theircharacters vividly to life.”
- Robert R. Prechter, Jr., Editor of The Elliott Wave TheoristItem #BCOVx4050480 - $17.95

JAPANESE CANDLESTICKCHARTING TECHNIQUES, 2ND
EDITIONby Steve Nison
This easy-to-read guide provides a clear understanding of JapaneseCandlestick Charting, an increasingly popular and dynamic approach tomarket analysis. Steve Nison, known around the world as the “Father ofCandlesticks, uses hundreds of examples that show how candlesticktechniques can be used in all of today’s markets. Traders will learn howcandlestick charting can be used to improve returns and help decreasemarket risk.
Item #BCOVx 17304 - $100.00
To get the current lowest price on any item listed Go towww.traderslibrary.com