table of contents - labourwork.alberta.ca/documents/occupational-fatalities-in-alberta.pdf · table...
TRANSCRIPT
Occupational Fatalities in Alberta 2001-2010 Fall 2011
T A B L E O F C O N T E N T S Highlights ...................................................................................................................................... 2
1. Provincial Summary................................................................................................................. 5
2. Occupational Fatalities by Major Industry Sector................................................................ 8
3. Occupational Fatalities by Industry ..................................................................................... 11
4. Demographics of Injured Workers ....................................................................................... 15
5. Occupational Fatalities by Type............................................................................................ 16
Motor Vehicle Incidents............................................................................................................. 20
Workplace Incidents .................................................................................................................. 25
Occupational Disease ................................................................................................................. 29
References ................................................................................................................................... 32
Appendix A: Terms, Definitions and Formulas....................................................................... 33
Contact Information................................................................................................................... 34
1
Occupational Fatalities in Alberta 2001-2010 Fall 2011
H I G H L I G H T S
From 2001 to 2010
• There were 1,302 occupational fatalities accepted by the Workers’ Compensation Board – Alberta (WCB) for compensation.
• The provincial fatality rate has decreased from 98 fatalities per million person-years worked in 2001 to 78 fatalities per million person-years in 2010. The average fatality rate over the last ten years was 85 fatalities per million person-years worked.
• There were 371 motor vehicle incident fatalities, 408 workplace incident fatalities and 523 occupational disease fatalities.
• The Construction and Construction Trade Services sector had the highest number of fatalities at 453. The Agriculture and Forestry sector had the highest fatality rate at 318 fatalities per million person-years worked.
• The Business, Personal and Professional Services sector had the lowest fatality rate at 18 per million person-years worked.
• Nearly two-thirds of motor vehicle incident fatalities were a result of highway incidents. The General Trucking Services industry had the highest number of accepted motor vehicle fatalities.
• About 18.1 percent of workplace incident fatalities were a result of being struck by an object. The Mobile Equipment Operations and General Trucking Services industries had the highest number of accepted workplace incident fatalities.
• The Industrial Construction industry had the highest number of accepted occupational disease fatalities.
In 2010
• There were 136 fatalities accepted by the WCB for compensation. Forty-three of the total fatalities were workplace incidents, 31 were motor vehicle incidents and 62 were a result of occupational diseases.
• The provincial fatality rate was 78 fatalities per million person-years worked. Removing occupational disease fatalities from the total produces a fatality rate of 42 fatalities per million person-years worked in 2010.
2
H I G H L I G H T S
Occupational Fatalities in Alberta 2001-2010 Fall 2011
Occupational Fatalities in Alberta The Ministry of Employment and Immigration prepares this annual report to provide analysis of workplace fatalities to meet the demand from industry and safety associations, labour organizations, employers and workers for incorporating this information into their strategic plans for enhancing workplace health and safety. This includes estimations of the risk at the provincial, industry sector and sub-sector level as well as general descriptions about the incidents and injured workers.
The Occupational Fatalities in Alberta report presents analysis of aggregate fatality data to allow for the tracking of workplace health and safety performance over time. This is important for evaluating past and present performance, and in providing strategic information for the direction of workplace health and safety policy. The analysis contained in this report provides a comprehensive picture of workplace fatalities in the province, allowing for a prevention focus to be made based on probabilities, rather than possibilities.
3
H I G H L I G H T S
Occupational Fatalities in Alberta 2001-2010 Fall 2011
A few notes about this report:
• A WCB accepted occupational fatality is defined as the death of a worker, resulting from a work-related incident or exposure, which has been accepted by the WCB for compensation. Some fatalities accepted in a particular year may actually have occurred in previous years, so the numbers of fatalities based on the year of acceptance are different from those based on the year of occurrence.
• The data used in this analysis were obtained from the WCB between the years 2001 and 2010.
• The person-years worked estimates in the Occupational Fatalities in Alberta 2001 to 2010 report have been provided by the WCB back to 2006, thus previous years’ Occupational Fatalities in Alberta reports’ person-years estimates and therefore rates will not be comparable.
• The fatality rate is calculated by dividing the number of accepted fatalities by the person-years worked estimate (workers covered by WCB) and multiplying the result by one million. The result is expressed as fatalities per million person-years worked. Fatalities that occur under the jurisdiction of the Government of Canada are excluded before the calculation of the provincial fatality rate.
• Estimates of year-to-year change for rates presented in this report are calculated using unrounded figures and may not match those produced from rounded figures. Percentages displayed in tables may also not sum to a hundred, due to rounding.
• Analyses by occupation group are based on the 2001 National Occupational Classification (NOC). The NOC 2001 provides a standardized framework reflecting the Canadian labour market. For further information please see http://www5.hrsdc.gc.ca/NOC.
• Occupational fatalities listed throughout this report are based on the Z795-03 Coding of Work Injury or Disease Information produced by the Canadian Standards Association (CSA) standards for categorizing occupational injury and disease. For further information see
http://www.shopcsa.ca/onlinestore/GetCatalogItemDetails.asp?mat=2416404.
• Terms, definitions and formulas used throughout this report are described in Appendix A.
3 4
Occupational Fatalities in Alberta 2001-2010 Fall 2011
1 S E C T I O N
PROVINCIAL SUMMARY
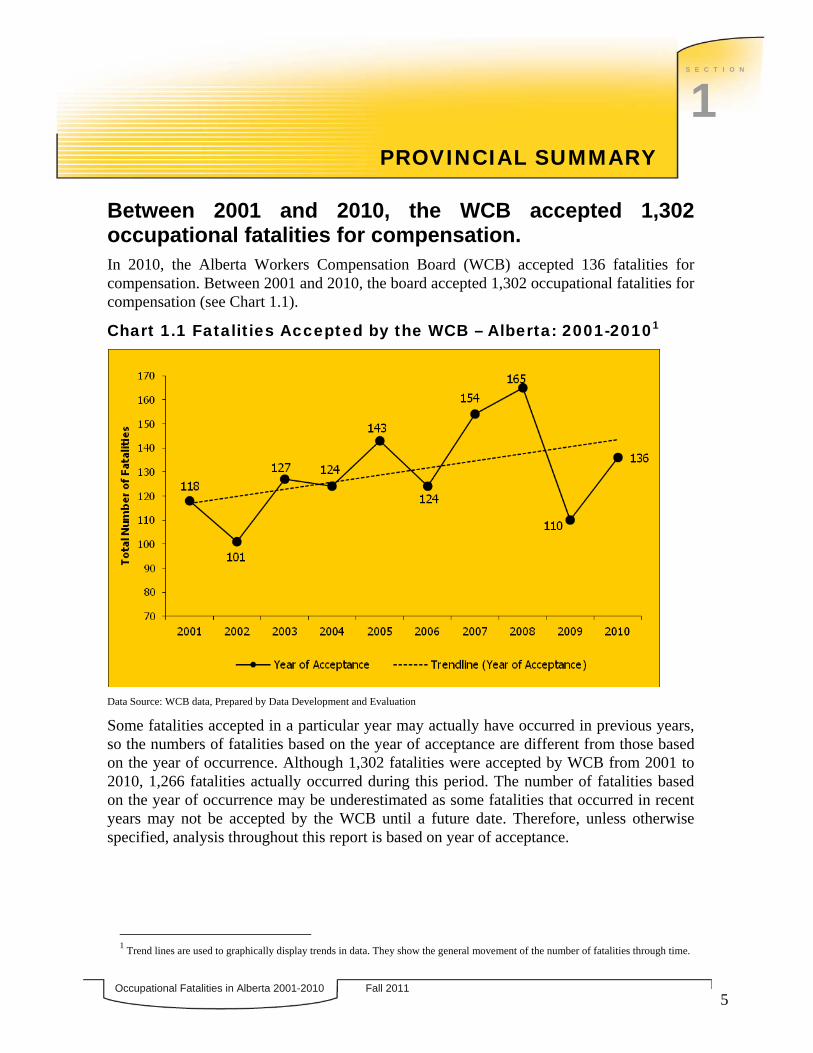
Between 2001 and 2010, the WCB accepted 1,302 occupational fatalities for compensation. In 2010, the Alberta Workers Compensation Board (WCB) accepted 136 fatalities for compensation. Between 2001 and 2010, the board accepted 1,302 occupational fatalities for compensation (see Chart 1.1).
Chart 1.1 Fatalities Accepted by the WCB – Alberta: 2001-20101
Data Source: WCB data, Prepared by Data Development and Evaluation
Some fatalities accepted in a particular year may actually have occurred in previous years, so the numbers of fatalities based on the year of acceptance are different from those based on the year of occurrence. Although 1,302 fatalities were accepted by WCB from 2001 to 2010, 1,266 fatalities actually occurred during this period. The number of fatalities based on the year of occurrence may be underestimated as some fatalities that occurred in recent years may not be accepted by the WCB until a future date. Therefore, unless otherwise specified, analysis throughout this report is based on year of acceptance.
1 Trend lines are used to graphically display trends in data. They show the general movement of the number of fatalities through time.
5

Occupational Fatalities in Alberta 2001-2010 Fall 2011
1 S E C T I O N
P R O V I N C I A L S U M M A R Y
The trend line in Chart 1.1 indicates that since 2001, there has been an upward movement in the number of fatalities. This does not take in to account however, the change in the number of people working in Alberta, which has increased by 46.7% in the last ten years.
The fatality rate provides an estimate of the number of fatalities in a particular year compared to the size of the working population in a particular year. It is calculated by dividing the number of accepted fatalities in the year by the number of estimated person-years worked2 (workers covered by the WCB). The result is then expressed as fatalities “per million person-years worked”. Since 2001, the person-years worked figures have grown from 1,178,582 to 1,729,355. Between 2001 and 2010, the provincial fatality rate decreased from a high of 101 fatalities per million person-years worked in 2003 to a low of 63 fatalities per million person-years in 2009. The trend line presented in Chart 1.2 shows that the number of fatalities, when compared with the working population, is slowly declining.
Chart 1.2 Provincial Fatality Rate3 – Alberta: 2001-2010
Data Source: WCB data, Prepared by Data Development and Evaluation
2 Person-years estimates have been provided by the WCB back to 2006. One person-year is equivalent to one full-time worker working for one year, and can be assumed to equal 2,000 hours worked. 3 Fatality rates are expressed as fatalities per million person-years worked. Fatalities occurring under Government of Canada jurisdiction are excluded from the calculation of the fatality rates.
6
Occupational Fatalities in Alberta 2001-2010 Fall 2011
1 S E C T I O N
P R O V I N C I A L S U M M A R Y
The provincial fatality rate also includes occupational disease fatalities, which are mostly diseases known to be primarily work-related such as asbestosis and coal workers’ pneumoconiosis. Occupational diseases are frequently diagnosed several years after the initial or crucial exposure to the toxic substance, and in such cases, it is difficult to determine when the fatal exposure occurred. The provincial fatality rate, therefore, should not be interpreted to reflect present worksite hazardous conditions or exposures. The fatality rate excluding occupational disease fatalities is presented in Chart 1.2 and follows a similar trend to the provincial fatality rate although fluctuates between a high of 64 fatalities per million person-years worked in 2003 and a low of 35 fatalities per million person-years worked in 2009.
7
Occupational Fatalities in Alberta 2001-2010 Fall 2011
2 S E C T I O N
OCCUPATIONAL FATALITIES BY MAJOR
INDUSTRY SECTOR
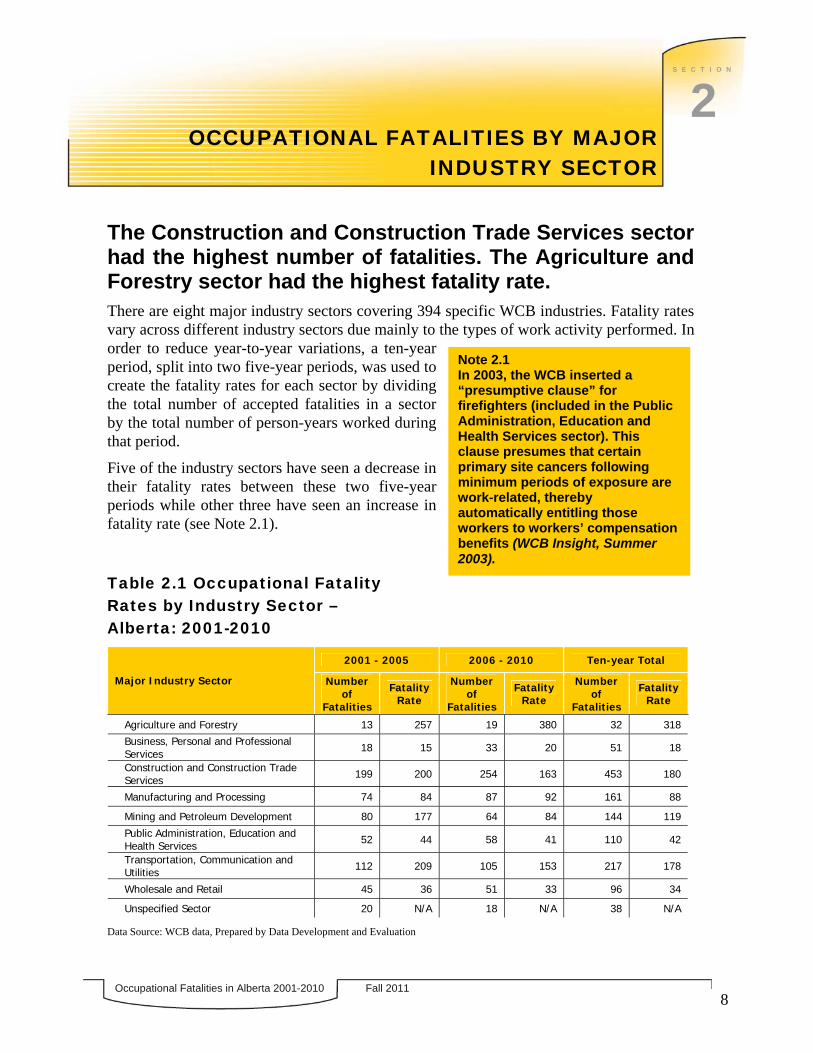
The Construction and Construction Trade Services sector had the highest number of fatalities. The Agriculture and Forestry sector had the highest fatality rate. There are eight major industry sectors covering 394 specific WCB industries. Fatality rates vary across different industry sectors due mainly to the types of work activity performed. In order to reduce year-to-year variations, a ten-year period, split into two five-year periods, was used to create the fatality rates for each sector by dividing the total number of accepted fatalities in a sector by the total number of person-years worked during that period.
Five of the industry sectors have seen a decrease in their fatality rates between these two five-year periods while other three have seen an increase in fatality rate (see Note 2.1).
Table 2.1 Occupational Fatality Rates by Industry Sector – Alberta: 2001-2010
2001 - 2005 2006 - 2010 Ten-year Total
Major Industry Sector Number of
Fatalities
Fatality Rate
Number of
Fatalities
Fatality Rate
Number of
Fatalities
Fatality Rate
Agriculture and Forestry 13 257 19 380 32 318
Business, Personal and Professional Services 18 15 33 20 51 18
Construction and Construction Trade Services 199 200 254 163 453 180
Manufacturing and Processing 74 84 87 92 161 88
Mining and Petroleum Development 80 177 64 84 144 119
Public Administration, Education and Health Services 52 44 58 41 110 42
Transportation, Communication and Utilities 112 209 105 153 217 178
Wholesale and Retail 45 36 51 33 96 34
Unspecified Sector 20 N/A 18 N/A 38 N/A
Data Source: WCB data, Prepared by Data Development and Evaluation
8
Note 2.1 In 2003, the WCB inserted a “presumptive clause” for firefighters (included in the Public Administration, Education and Health Services sector). This clause presumes that certain primary site cancers following minimum periods of exposure are work-related, thereby automatically entitling those workers to workers’ compensation benefits (WCB Insight, Summer 2003).
Occupational Fatalities in Alberta 2001-2010 Fall 2011
2 S E C T I O N
O C C U P A T I O N A L F A T A L I T I E S B Y M A J O R I N D U S T R Y S E C T O R
The Construction and Construction Trade Services sector accounted for almost a third of all of occupational fatalities over the last ten years (see Table 2.1 and Note 2.2). In 2010, it accounted for 43.3 percent of fatalities compared to 18.4 percent of the total person-years worked in the province (see Table 2.2).4 The Agriculture and Forestry sector had the highest fatality rate at 318 fatalities per million person-years worked. This was 3.7 times the average provincial rate over the last ten years, 85 fatalities per million person-years worked. However, caution must be used in considering the fatality rate for Agriculture and Forestry. Most of the industries in this sector do not have workers’ compensation coverage. The person-years and accepted fatalities reflect only those with coverage and therefore underestimate the true number. Between 2001 and 2010, the WCB accepted 32 fatalities in the Agriculture and Forestry sector. The number reported in the Alberta Farm Fatalities Statistics for this period is 181.5 This number includes all fatality incidents on farm sites. Reported fatality rates are more representative for sectors where the majority of the industries have workers’ compensation coverage.
As measured over the last ten years, the average provincial fatality rate was 85 per million person-years worked. The Agriculture and Forestry sector, the Construction and Construction Trade Services sector, the Transportation, Communication and Utilities sector, the Manufacturing and Processing sector and the Mining and Petroleum Development sector had occupational fatality rates higher than the provincial average rate. The Business, Personal and Professional Services sector, the Public Administration, Education and Health Services sector and the Wholesale and Retail sector had rates lower than the provincial rate (see Table 2.1).
4 For further information on person-years comparison by sector see the Occupational Injuries and Diseases in Alberta 2010 Summary publication (http://www.employment.alberta.ca/SFW/129.html). 5 For comprehensive statistics relating to fatalities occurring on Alberta’s farms, visit the Agriculture, Food and Rural Development website at http://www1.agric.gov.ab.ca/$department/deptdocs.nsf/all/aet5237
9
Note 2.2 The International Labour Organization (ILO) estimates that in industrialized countries, construction workers are three to four times more likely than other workers to die from accidents at work (ILO, World Day for Safety and Health at Work 2009 – Facts on safety and health at work issues, April 2009).
Occupational Fatalities in Alberta 2001-2010 Fall 2011
2 S E C T I O N
O C C U P A T I O N A L F A T A L I T I E S B Y M A J O R I N D U S T R Y S E C T O R
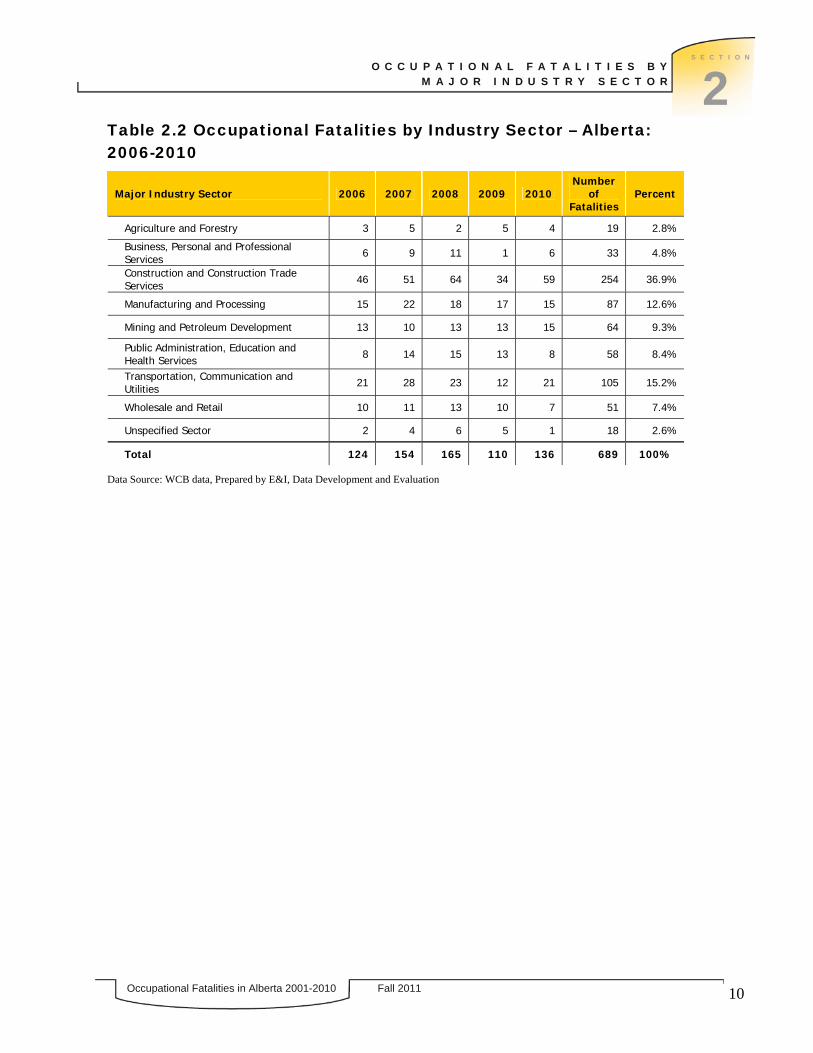
Table 2.2 Occupational Fatalities by Industry Sector – Alberta: 2006-2010
Major Industry Sector 2006 2007 2008 2009 2010 Number
of Fatalities
Percent
Agriculture and Forestry 3 5 2 5 4 19 2.8%
Business, Personal and Professional Services 6 9 11 1 6 33 4.8%
Construction and Construction Trade Services 46 51 64 34 59 254 36.9%
Manufacturing and Processing 15 22 18 17 15 87 12.6%
Mining and Petroleum Development 13 10 13 13 15 64 9.3%
Public Administration, Education and Health Services 8 14 15 13 8 58 8.4%
Transportation, Communication and Utilities 21 28 23 12 21 105 15.2%
Wholesale and Retail 10 11 13 10 7 51 7.4%
Unspecified Sector 2 4 6 5 1 18 2.6%
Total 124 154 165 110 136 689 100%
Data Source: WCB data, Prepared by E&I, Data Development and Evaluation
10

Occupational Fatalities in Alberta 2001-2010 Fall 2011
3 S E C T I O N
OCCUPATIONAL FATALITIES BY INDUSTRY
Seven WCB industries accounted for 32.4 percent of all occupational fatalities between 2001 and 2010. Seven specific industries had more than 26 fatalities between 2001 and 2010, accounting for 32.4 percent of all fatalities. The General Trucking Services industry had 127 fatalities, the highest of any single industry, followed by Industrial Construction with 80 fatalities (see Chart 3.1).
Chart 3.1 Fatalities Accepted by the WCB: Top Seven Industries – Alberta: 2001-2010
*Cities indicate many departments including administration, sanitation, health, engineering, maintenance, recreation, fire, police, transit etc. Ambulance services are included as part of the overall operations of a city. Data Source: WCB data, Prepared by Data Development and Evaluation
The fatalities in the General Trucking Services industry were predominantly motor vehicle incidents, accounting for 66.9 percent of all the fatalities in this industry (see Table 3.1).
11

Occupational Fatalities in Alberta 2001-2010 Fall 2011
3 S E C T I O N
O C C U P A T I O N A L F A T A L I T I E S B Y I N D U S T R Y
Table 3.1 General Trucking Services Industry Fatalities by Type – Alberta: 2001-2010
Year Motor Vehicle Incident
Workplace Incident
Occupational Disease
Total Number of Fatalities
2001 13 4 2 19
2002 7 8 2 17
2003 7 1 0 8
2004 14 1 0 15
2005 5 2 2 9
2006 7 1 1 9
2007 11 5 0 16
2008 7 5 1 13
2009 5 3 0 8
2010 9 3 1 13
Total 85 (66.9%) 33 (26.0%) 9 (7.1%) 127
Data Source: WCB data, Prepared by Data Development and Evaluation
Chart 3.2 General Trucking Services Fatality Rate – Alberta: 2001-2010
Data Source: WCB data, Prepared by E&I, Data Development and Evaluation
12
Occupational Fatalities in Alberta 2001-2010 Fall 2011
3 S E C T I O N
O C C U P A T I O N A L F A T A L I T I E S B Y I N D U S T R Y
Fatality rates for the General Trucking Services industry vary from year to year (see Chart 3.2), although the trendline displays a decline over this period.
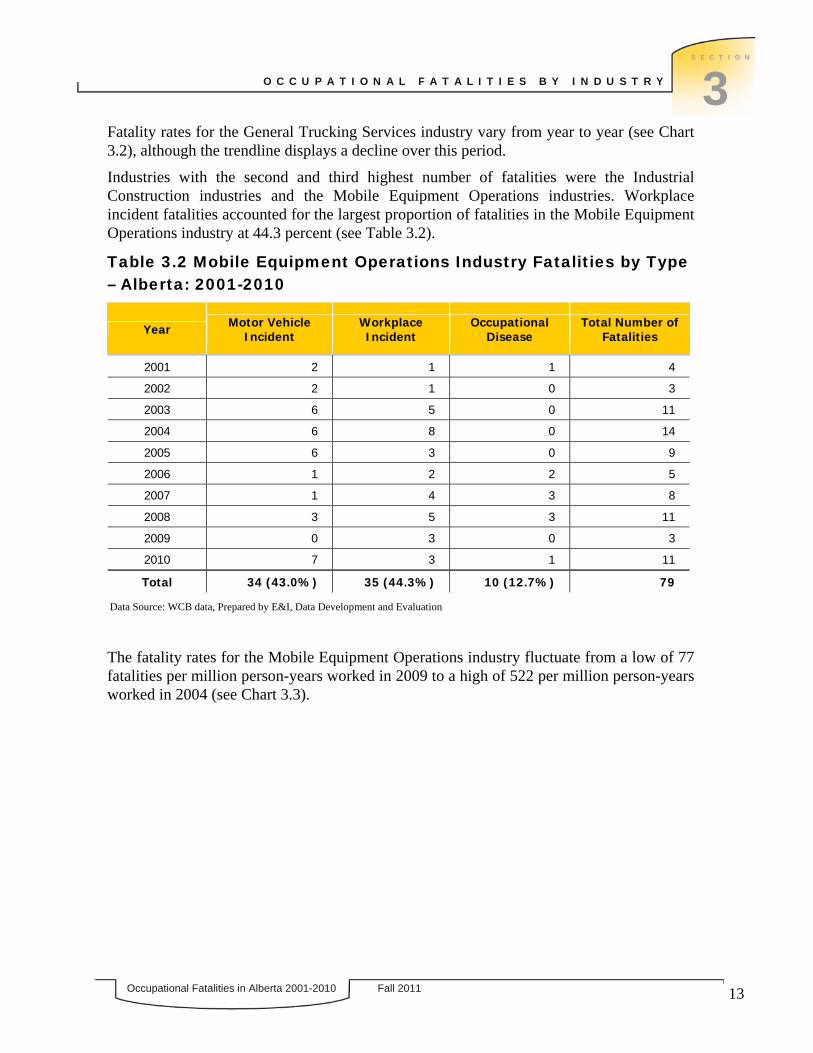
Industries with the second and third highest number of fatalities were the Industrial Construction industries and the Mobile Equipment Operations industries. Workplace incident fatalities accounted for the largest proportion of fatalities in the Mobile Equipment Operations industry at 44.3 percent (see Table 3.2).
Table 3.2 Mobile Equipment Operations Industry Fatalities by Type – Alberta: 2001-2010
Year Motor Vehicle Incident
Workplace Incident
Occupational Disease
Total Number ofFatalities
2001 2 1 1 4
2002 2 1 0 3
2003 6 5 0 11
2004 6 8 0 14
2005 6 3 0 9
2006 1 2 2 5
2007 1 4 3 8
2008 3 5 3 11
2009 0 3 0 3
2010 7 3 1 11
Total 34 (43.0%) 35 (44.3%) 10 (12.7%) 79
Data Source: WCB data, Prepared by E&I, Data Development and Evaluation
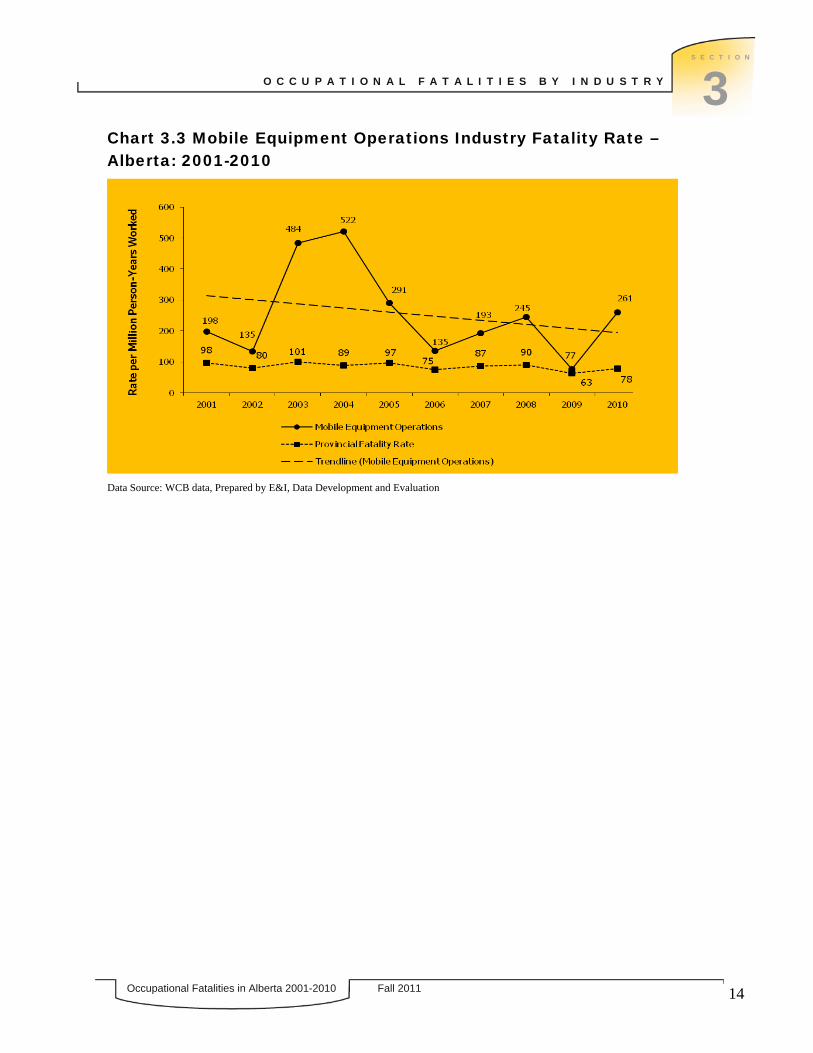
The fatality rates for the Mobile Equipment Operations industry fluctuate from a low of 77 fatalities per million person-years worked in 2009 to a high of 522 per million person-years worked in 2004 (see Chart 3.3).
13
Occupational Fatalities in Alberta 2001-2010 Fall 2011
3 S E C T I O N
O C C U P A T I O N A L F A T A L I T I E S B Y I N D U S T R Y
Chart 3.3 Mobile Equipment Operations Industry Fatality Rate – Alberta: 2001-2010
Data Source: WCB data, Prepared by E&I, Data Development and Evaluation
14
Occupational Fatalities in Alberta 2001-2010 Fall 2011
4 S E C T I O N
DEMOGRAPHICS OF INJURED WORKERS
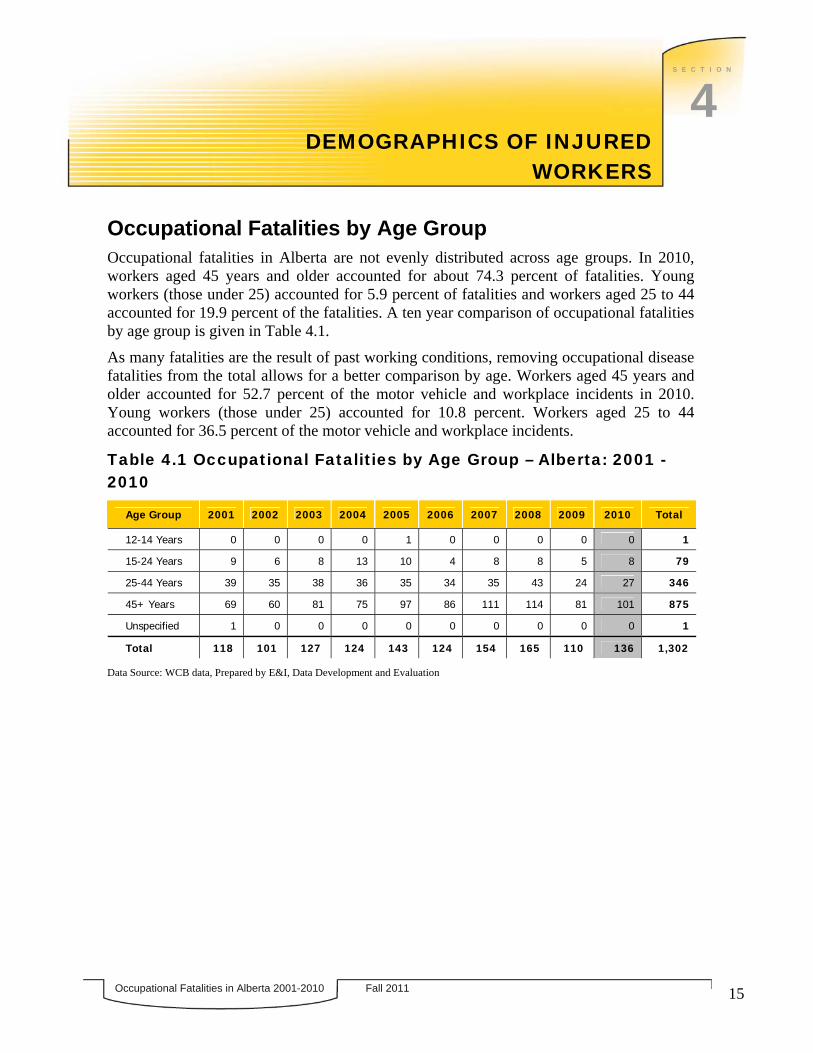
Occupational Fatalities by Age Group Occupational fatalities in Alberta are not evenly distributed across age groups. In 2010, workers aged 45 years and older accounted for about 74.3 percent of fatalities. Young workers (those under 25) accounted for 5.9 percent of fatalities and workers aged 25 to 44 accounted for 19.9 percent of the fatalities. A ten year comparison of occupational fatalities by age group is given in Table 4.1.
As many fatalities are the result of past working conditions, removing occupational disease fatalities from the total allows for a better comparison by age. Workers aged 45 years and older accounted for 52.7 percent of the motor vehicle and workplace incidents in 2010. Young workers (those under 25) accounted for 10.8 percent. Workers aged 25 to 44 accounted for 36.5 percent of the motor vehicle and workplace incidents.
Table 4.1 Occupational Fatalities by Age Group – Alberta: 2001 - 2010
Age Group 2001 2002 2003 2004 2005 2006 2007 2008 2009 2010 Total
12-14 Years 0 0 0 0 1 0 0 0 0 0 1
15-24 Years 9 6 8 13 10 4 8 8 5 8 79
25-44 Years 39 35 38 36 35 34 35 43 24 27 346
45+ Years 69 60 81 75 97 86 111 114 81 101 875
Unspecified 1 0 0 0 0 0 0 0 0 0 1
Total 118 101 127 124 143 124 154 165 110 136 1,302
Data Source: WCB data, Prepared by E&I, Data Development and Evaluation
15
Occupational Fatalities in Alberta 2001-2010 Fall 2011
5 S E C T I O N
OCCUPATIONAL FATALITIES BY TYPE
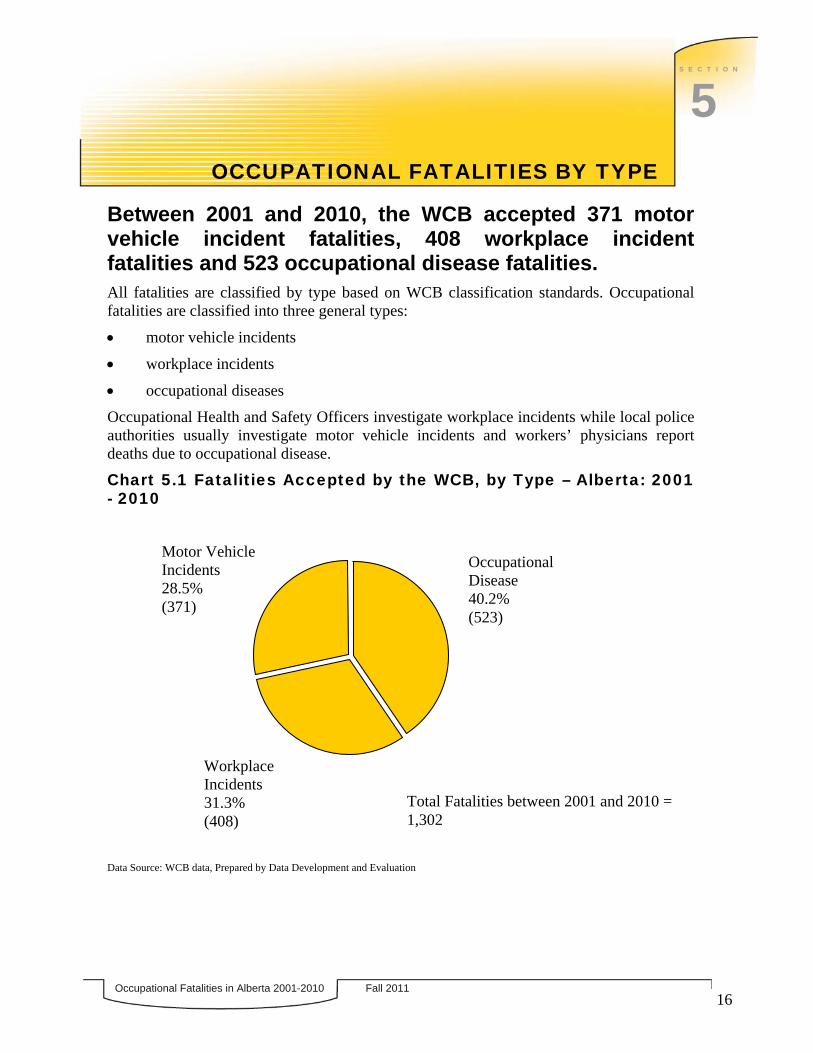
Between 2001 and 2010, the WCB accepted 371 motor vehicle incident fatalities, 408 workplace incident fatalities and 523 occupational disease fatalities. All fatalities are classified by type based on WCB classification standards. Occupational fatalities are classified into three general types:
• motor vehicle incidents
• workplace incidents
• occupational diseases
Occupational Health and Safety Officers investigate workplace incidents while local police authorities usually investigate motor vehicle incidents and workers’ physicians report deaths due to occupational disease.
Chart 5.1 Fatalities Accepted by the WCB, by Type – Alberta: 2001 - 2010
Data Source: WCB data, Prepared by Data Development and Evaluation
16
Occupational Disease 40.2% (523)
Workplace Incidents 31.3% (408)
Motor Vehicle Incidents 28.5% (371)
Total Fatalities between 2001 and 2010 = 1,302

Occupational Fatalities in Alberta 2001-2010 Fall 2011
5 S E C T I O N
O C C U P A T I O N A L F A T A L I T I E S B Y T Y P E
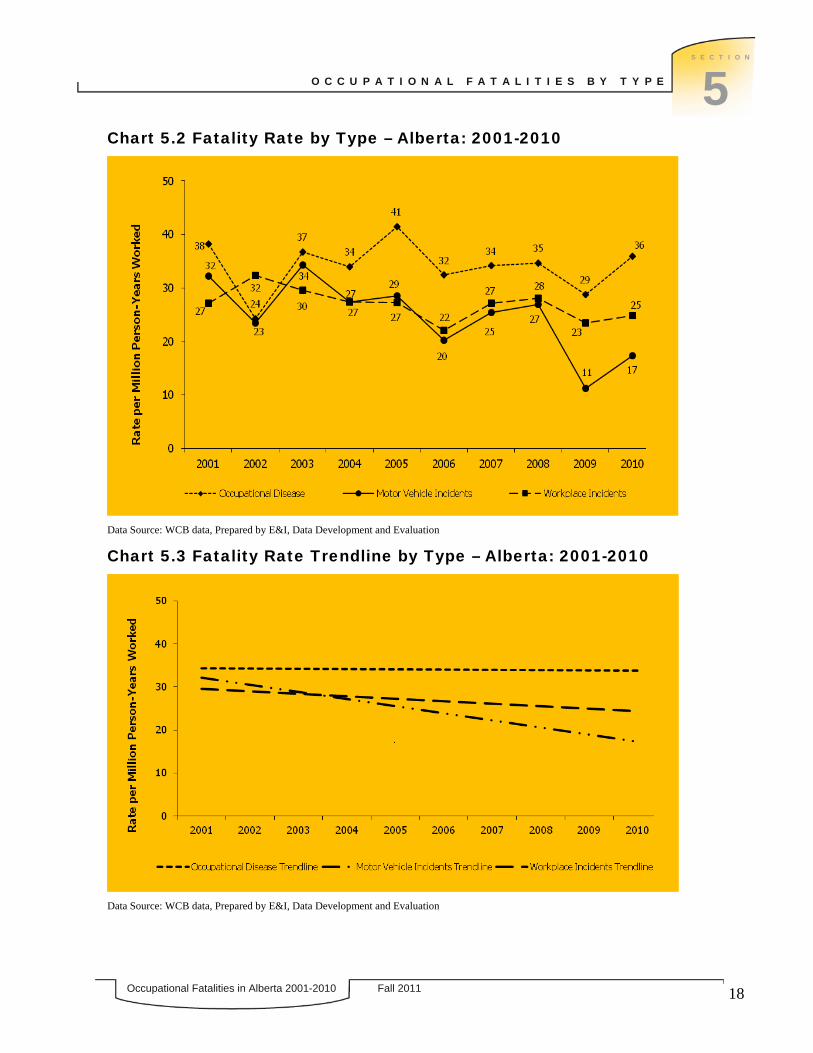
Ten-Year Trend Analysis by Type Table 5.1 displays the number of fatalities by type over the last ten years. There has been an increase in the number of occupational disease fatality claims. In 2001, occupational disease fatalities represented 38.1 percent of all accepted fatalities. In 2010, they represented 45.6 percent. The fatalities rates are shown in Charts 5.2 and 5.3 which plot the fatality rate by type using trendlines.
Table 5.1 Fatalities Accepted by the WCB, by Type – Alberta: 2001 - 2010
Year Motor
Vehicle Incidents
% Workplace Incidents % Occupational
Disease % Total Fatalities
2001 40 33.9% 33 28.0% 45 38.1% 118
2002 30 29.7% 40 39.6% 31 30.7% 101
2003 44 34.6% 37 29.1% 46 36.2% 127
2004 37 29.8% 38 30.6% 49 39.5% 124
2005 42 29.4% 40 28.0% 61 42.7% 143
2006 33 26.6% 37 29.8% 54 43.5% 124
2007 44 28.6% 47 30.5% 63 40.9% 154
2008 50 30.3% 52 31.5% 63 38.2% 165
2009 20 18.2% 41 37.3% 49 44.5% 110
2010 31 22.8% 43 31.6% 62 45.6% 136
Total 371 28.5% 408 31.3% 523 40.2% 1,302
Note: Data prior to 2002 do not include the latent fatality adjustment. Data Source: WCB data, Prepared by E&I, Data Development and Evaluation
17
Occupational Fatalities in Alberta 2001-2010 Fall 2011
5 S E C T I O N
O C C U P A T I O N A L F A T A L I T I E S B Y T Y P E
Chart 5.2 Fatality Rate by Type – Alberta: 2001-2010
Data Source: WCB data, Prepared by E&I, Data Development and Evaluation
Chart 5.3 Fatality Rate Trendline by Type – Alberta: 2001-2010
Data Source: WCB data, Prepared by E&I, Data Development and Evaluation
18
Occupational Fatalities in Alberta 2001-2010 Fall 2011
5 S E C T I O N
O C C U P A T I O N A L F A T A L I T I E S B Y T Y P E
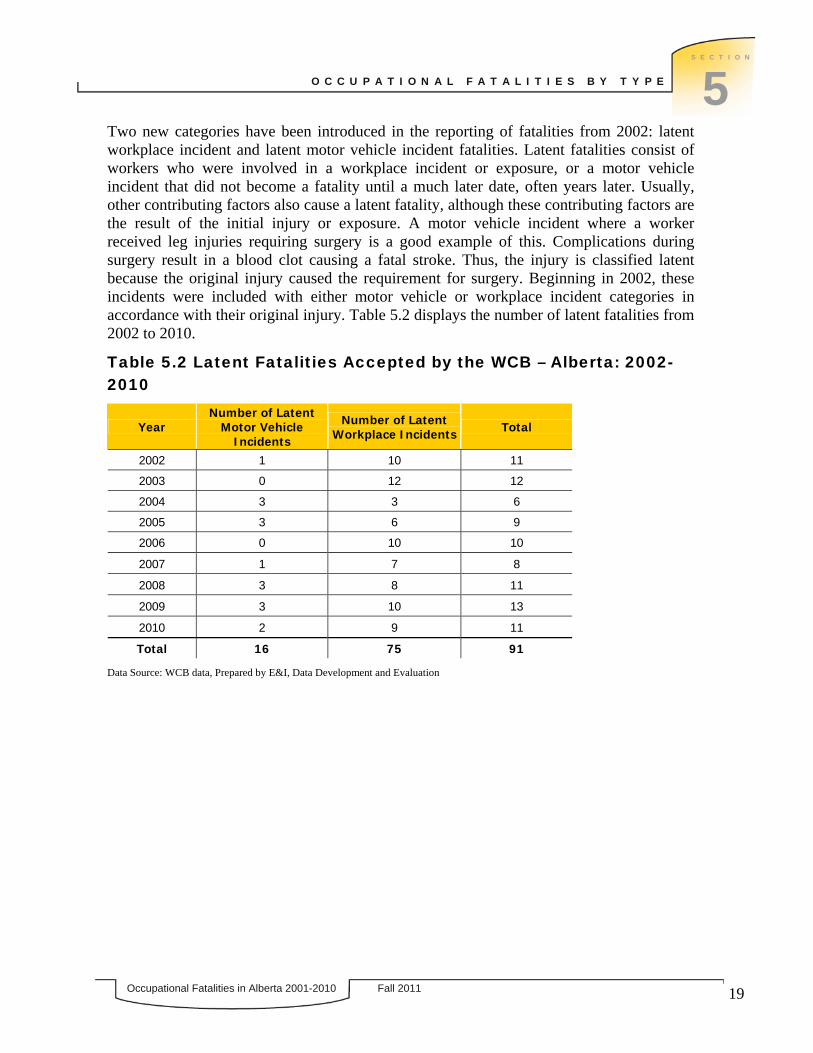
Two new categories have been introduced in the reporting of fatalities from 2002: latent workplace incident and latent motor vehicle incident fatalities. Latent fatalities consist of workers who were involved in a workplace incident or exposure, or a motor vehicle incident that did not become a fatality until a much later date, often years later. Usually, other contributing factors also cause a latent fatality, although these contributing factors are the result of the initial injury or exposure. A motor vehicle incident where a worker received leg injuries requiring surgery is a good example of this. Complications during surgery result in a blood clot causing a fatal stroke. Thus, the injury is classified latent because the original injury caused the requirement for surgery. Beginning in 2002, these incidents were included with either motor vehicle or workplace incident categories in accordance with their original injury. Table 5.2 displays the number of latent fatalities from 2002 to 2010.
Table 5.2 Latent Fatalities Accepted by the WCB – Alberta: 2002-2010
Year Number of Latent
Motor Vehicle Incidents
Number of Latent Workplace Incidents Total
2002 1 10 11
2003 0 12 12
2004 3 3 6
2005 3 6 9
2006 0 10 10
2007 1 7 8
2008 3 8 11
2009 3 10 13
2010 2 9 11
Total 16 75 91
Data Source: WCB data, Prepared by E&I, Data Development and Evaluation
19

Occupational Fatalities in Alberta 2001-2010 Fall 2011
5 S E C T I O N
O C C U P A T I O N A L F A T A L I T I E S B Y T Y P E
Motor Vehicle Incidents Motor vehicle incidents typically involve non-industrial vehicles operating on public roads, where the fatally injured worker was either the driver or the passenger. This type of occupational fatality includes aircraft, train, helicopter, and water vehicle incidents. Occupational fatalities involving industrial vehicles are classified as workplace incidents. Therefore, the number of motor vehicle incident fatalities may not fully reflect the occupational fatalities related to motor vehicles.
There were 193 fatalities accepted from 2001 to 2005 and 178 fatalities from 2006 to 2010 (see Table 5.3).
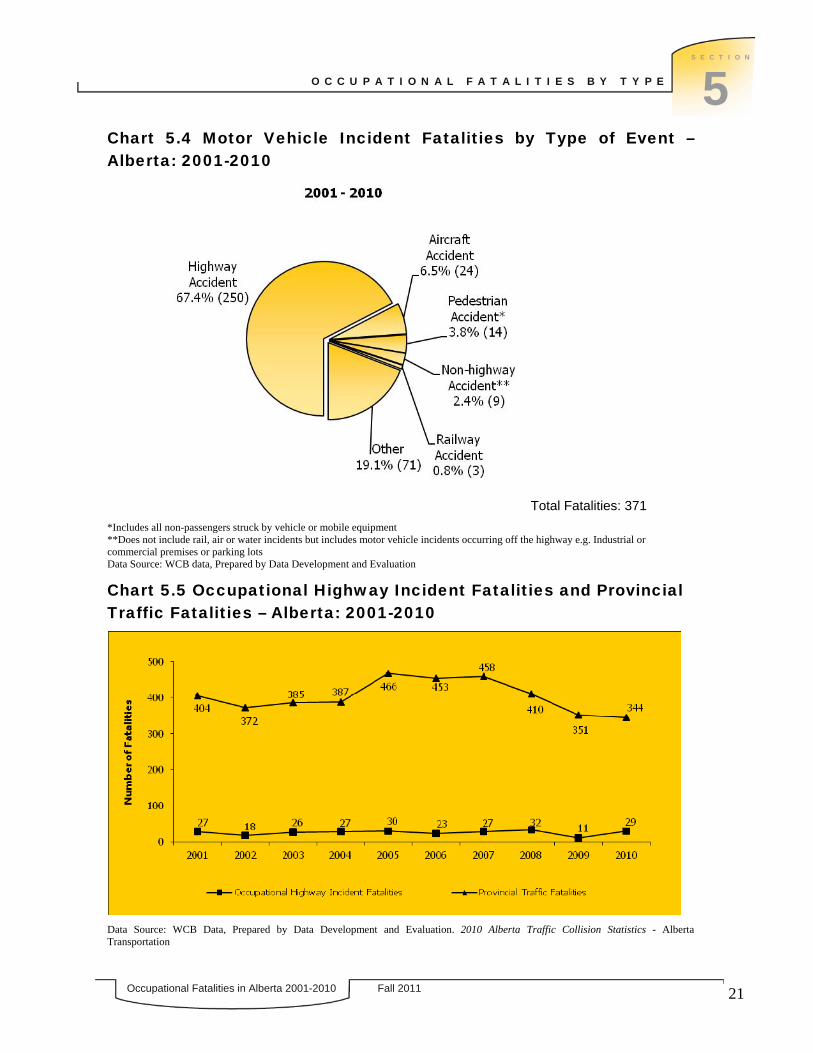
Table 5.3 Motor Vehicle Incident Fatalities by Type of Event – Alberta: 2001 - 2010
Type of Event or Exposure 2001-2005 2006-2010 Number of Fatalities Percent
Highway Incident 128 122 250 67.4%
Aircraft Incident 9 15 24 6.5%
Pedestrian Incident* 7 7 14 3.8%
Non-highway Incident** 5 4 9 2.4%
Railway Incident 3 0 3 0.8%
Other 41 30 71 19.1%
Total 193 178 371 100.0%
*Includes all non-passengers struck by vehicle or mobile equipment **Does not include rail, air or water incidents but includes motor vehicle incidents occurring off the highway e.g. Industrial or commercial premises or parking lots Data Source: WCB Data, Prepared by Data Development and Evaluation
Chart 5.4 summarizes motor vehicle incident by type of event. Of all motor vehicle fatalities over the last ten years highway incidents accounted for 67.4 percent. Railway incidents are the lowest motor vehicle incidents over the past ten years. Chart 5.5 compares occupational highway incident fatalities with provincial traffic fatalities.
20
Note 5.1 The 2010 Alberta Traffic Collision Statistics Report released information on 344 traffic fatalities in Alberta and 13,552 non-fatal injury collisions. Highlights of the report include: • Following too closely, running off
the road and left turn across path were the most frequently identified improper driver actions contributing to casualty collisions.
• 21.8 percent of drivers involved in fatal collisions had consumed alcohol prior to the crash.
Occupational Fatalities in Alberta 2001-2010 Fall 2011
5 S E C T I O N
O C C U P A T I O N A L F A T A L I T I E S B Y T Y P E
Chart 5.4 Motor Vehicle Incident Fatalities by Type of Event – Alberta: 2001-2010
Total Fatalities: 371
*Includes all non-passengers struck by vehicle or mobile equipment **Does not include rail, air or water incidents but includes motor vehicle incidents occurring off the highway e.g. Industrial or commercial premises or parking lots Data Source: WCB data, Prepared by Data Development and Evaluation
Chart 5.5 Occupational Highway Incident Fatalities and Provincial Traffic Fatalities – Alberta: 2001-2010
Data Source: WCB Data, Prepared by Data Development and Evaluation. 2010 Alberta Traffic Collision Statistics - Alberta Transportation
21
Occupational Fatalities in Alberta 2001-2010 Fall 2011
5 S E C T I O N
O C C U P A T I O N A L F A T A L I T I E S B Y T Y P E
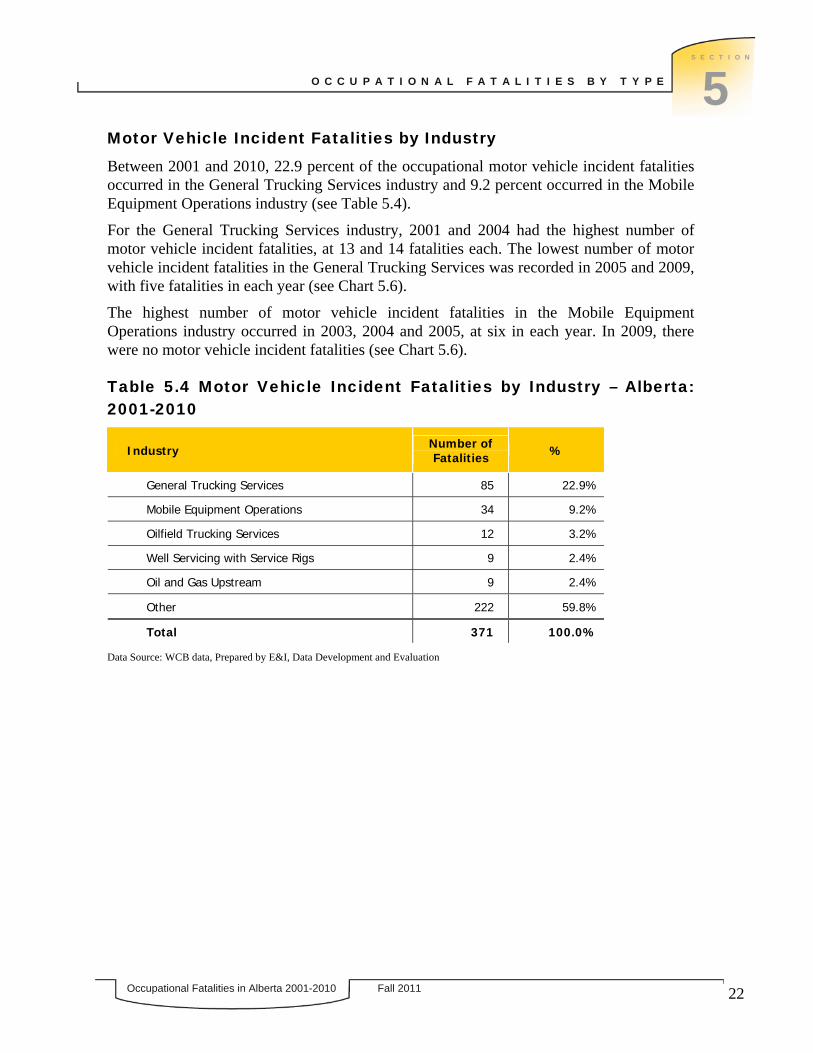
Motor Vehicle Incident Fatalities by Industry
Between 2001 and 2010, 22.9 percent of the occupational motor vehicle incident fatalities occurred in the General Trucking Services industry and 9.2 percent occurred in the Mobile Equipment Operations industry (see Table 5.4).
For the General Trucking Services industry, 2001 and 2004 had the highest number of motor vehicle incident fatalities, at 13 and 14 fatalities each. The lowest number of motor vehicle incident fatalities in the General Trucking Services was recorded in 2005 and 2009, with five fatalities in each year (see Chart 5.6).
The highest number of motor vehicle incident fatalities in the Mobile Equipment Operations industry occurred in 2003, 2004 and 2005, at six in each year. In 2009, there were no motor vehicle incident fatalities (see Chart 5.6).
Table 5.4 Motor Vehicle Incident Fatalities by Industry – Alberta: 2001-2010
Industry Number of Fatalities %
General Trucking Services 85 22.9%
Mobile Equipment Operations 34 9.2%
Oilfield Trucking Services 12 3.2%
Well Servicing with Service Rigs 9 2.4%
Oil and Gas Upstream 9 2.4%
Other 222 59.8%
Total 371 100.0%
Data Source: WCB data, Prepared by E&I, Data Development and Evaluation
22

Occupational Fatalities in Alberta 2001-2010 Fall 2011
5 S E C T I O N
O C C U P A T I O N A L F A T A L I T I E S B Y T Y P E
Chart 5.6 General Trucking Services and Mobile Equipment Operations Industries Motor Vehicle Incident Fatalities – Alberta: 2001-2010
Data Source: WCB data, Prepared by E&I, Data Development and Evaluation
Motor Vehicle Incident Fatalities by Age Group
Between 2001 and 2010, 49.1 percent of all motor vehicle incident fatalities in Alberta involved workers aged 25-44 years old. This age group accounted for 46.5 percent of those in employment6 in Alberta over that time period. Workers aged 45 years and older accounted for 41.0 percent of the fatalities and 36.3 percent of those in employment, while workers aged 15-24 years were involved in 10.0 percent of motor vehicle incident fatalities and accounted for 17.2 percent of those in employment. Table 5.5 provides details of the motor vehicle incident fatalities by age group from 2001 to 2010.
6 Statistics Canada Labour Force Survey (2010 Historical Review).
23

Occupational Fatalities in Alberta 2001-2010 Fall 2011
5 S E C T I O N
O C C U P A T I O N A L F A T A L I T I E S B Y T Y P E
Table 5.5 Motor Vehicle Incident Fatalities by Age Group – Alberta: 2001-2010
Age Group 2001 2002 2003 2004 2005 2006 2007 2008 2009 2010 Total
15-24 Years 7 2 6 5 3 2 4 3 2 3 37
25-44 Years 20 15 20 19 21 21 19 25 8 14 182
45 Years and Older 13 13 18 13 18 10 21 22 10 14 152
Total 40 30 44 37 42 33 44 50 20 31 371
Data Source: WCB data, Prepared by E&I, Data Development and Evaluation
Motor Vehicle Incident Fatalities by Occupation
Table 5.6 displays the eleven occupations that had four or more motor vehicle fatalities since 2001. Truck drivers accounted for 30.7 percent of all motor vehicle fatalities.
Table 5.6 Motor Vehicle Incident Fatalities by Occupation – Alberta: 2001-2010
Occupation Number of Fatalities
Truck Drivers 114
Air Pilots, Flight Engineers and Flying Instructors 9
Construction Trades Helpers and Labourers 9
Heavy Equipment Operators (Except Crane) 9
Oil and Gas Well Drilling Workers and Services Operators 7
Labourers in Chemical Products Processing and Utilities 7
Underground Mine Service and Support Workers 5
Contractors and Supervisors, Heavy Construction Equipment Crews 5
Taxi and Limousine Drivers and Chauffeurs 5
Firefighters 6
Other Labourers in Processing, Manufacturing and Utilities 4
Data Source: WCB data, Prepared by E&I, Data Development and Evaluation
24
Occupational Fatalities in Alberta 2001-2010 Fall 2011
5 S E C T I O N
O C C U P A T I O N A L F A T A L I T I E S B Y T Y P E
Workplace Incidents Workplace incidents consist of cases where the worker died at a worksite or as a result of injuries sustained at a worksite. Between 2001 and 2010, 31.3 percent or 408 of the total fatalities were workplace incidents. In 2010, there were 43 workplace incident fatalities, representing 31.6% of all fatalities (see Table 5.1).
Workplace Incident Fatalities by Type of Event
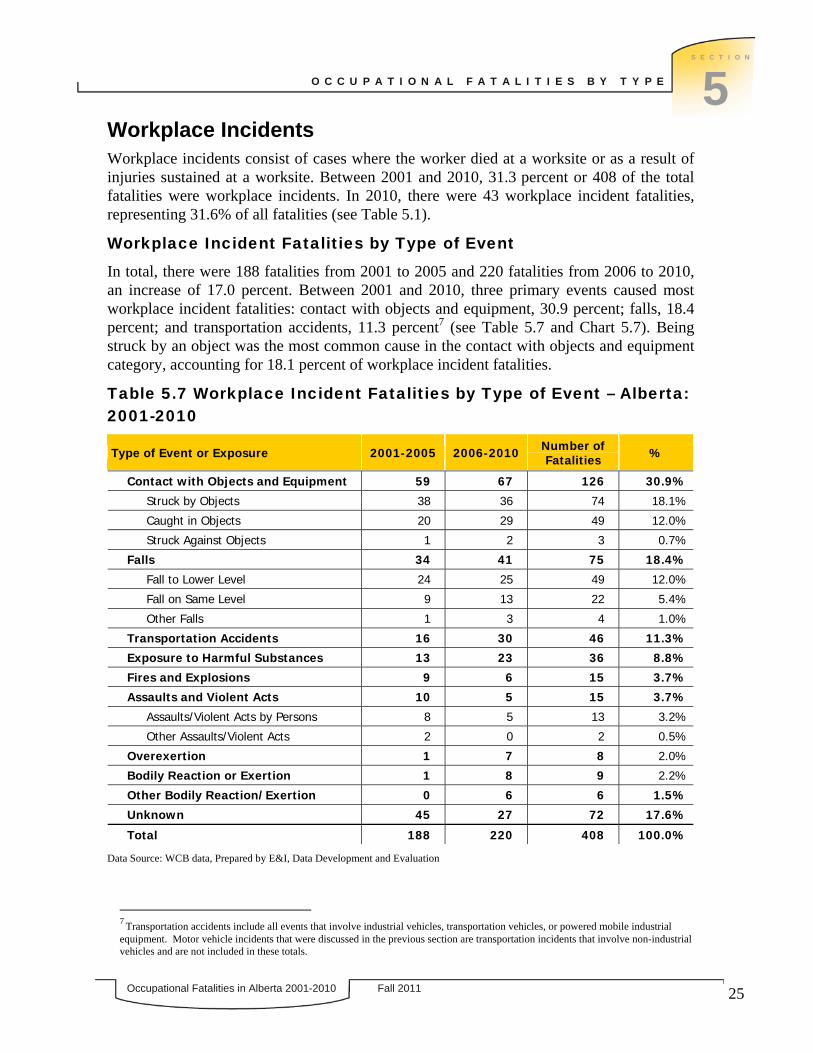
In total, there were 188 fatalities from 2001 to 2005 and 220 fatalities from 2006 to 2010, an increase of 17.0 percent. Between 2001 and 2010, three primary events caused most workplace incident fatalities: contact with objects and equipment, 30.9 percent; falls, 18.4 percent; and transportation accidents, 11.3 percent7 (see Table 5.7 and Chart 5.7). Being struck by an object was the most common cause in the contact with objects and equipment category, accounting for 18.1 percent of workplace incident fatalities.
Table 5.7 Workplace Incident Fatalities by Type of Event – Alberta: 2001-2010
Type of Event or Exposure 2001-2005 2006-2010 Number of Fatalities %
Contact with Objects and Equipment 59 67 126 30.9%
Struck by Objects 38 36 74 18.1%
Caught in Objects 20 29 49 12.0%
Struck Against Objects 1 2 3 0.7%
Falls 34 41 75 18.4%
Fall to Lower Level 24 25 49 12.0%
Fall on Same Level 9 13 22 5.4%
Other Falls 1 3 4 1.0%
Transportation Accidents 16 30 46 11.3%
Exposure to Harmful Substances 13 23 36 8.8%
Fires and Explosions 9 6 15 3.7%
Assaults and Violent Acts 10 5 15 3.7%
Assaults/Violent Acts by Persons 8 5 13 3.2%
Other Assaults/Violent Acts 2 0 2 0.5%
Overexertion 1 7 8 2.0%
Bodily Reaction or Exertion 1 8 9 2.2%
Other Bodily Reaction/Exertion 0 6 6 1.5%
Unknown 45 27 72 17.6%
Total 188 220 408 100.0%
Data Source: WCB data, Prepared by E&I, Data Development and Evaluation
7 Transportation accidents include all events that involve industrial vehicles, transportation vehicles, or powered mobile industrial equipment. Motor vehicle incidents that were discussed in the previous section are transportation incidents that involve non-industrial vehicles and are not included in these totals.
25
Occupational Fatalities in Alberta 2001-2010 Fall 2011
5 S E C T I O N
O C C U P A T I O N A L F A T A L I T I E S B Y T Y P E
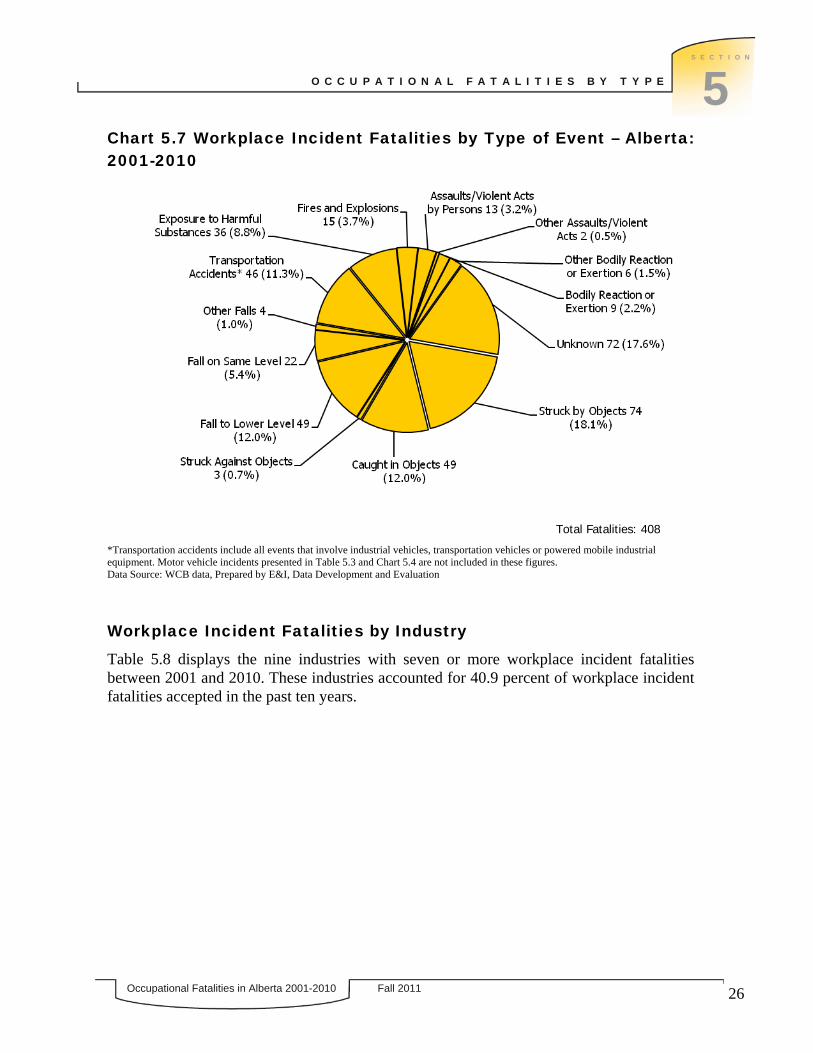
Chart 5.7 Workplace Incident Fatalities by Type of Event – Alberta: 2001-2010
Total Fatalities: 408
*Transportation accidents include all events that involve industrial vehicles, transportation vehicles or powered mobile industrial equipment. Motor vehicle incidents presented in Table 5.3 and Chart 5.4 are not included in these figures. Data Source: WCB data, Prepared by E&I, Data Development and Evaluation
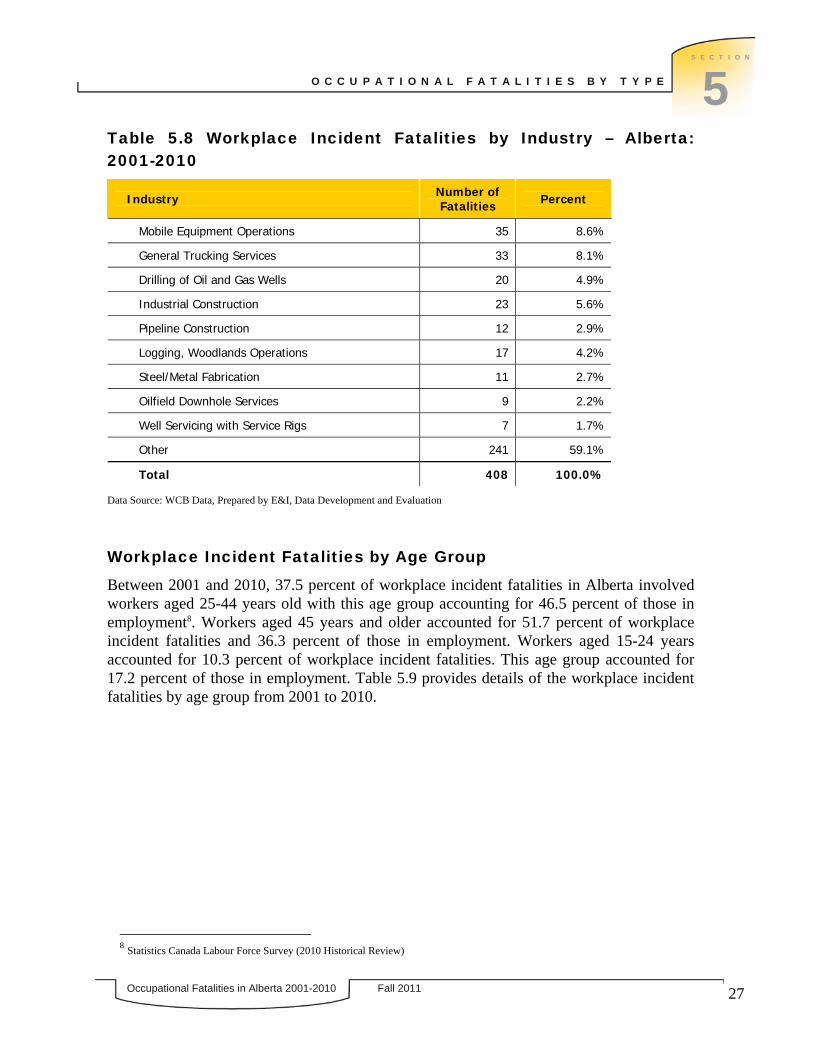
Workplace Incident Fatalities by Industry
Table 5.8 displays the nine industries with seven or more workplace incident fatalities between 2001 and 2010. These industries accounted for 40.9 percent of workplace incident fatalities accepted in the past ten years.
26
Occupational Fatalities in Alberta 2001-2010 Fall 2011
5 S E C T I O N
O C C U P A T I O N A L F A T A L I T I E S B Y T Y P E
Table 5.8 Workplace Incident Fatalities by Industry – Alberta: 2001-2010
Industry Number of Fatalities Percent
Mobile Equipment Operations 35 8.6%
General Trucking Services 33 8.1%
Drilling of Oil and Gas Wells 20 4.9%
Industrial Construction 23 5.6%
Pipeline Construction 12 2.9%
Logging, Woodlands Operations 17 4.2%
Steel/Metal Fabrication 11 2.7%
Oilfield Downhole Services 9 2.2%
Well Servicing with Service Rigs 7 1.7%
Other 241 59.1%
Total 408 100.0%
Data Source: WCB Data, Prepared by E&I, Data Development and Evaluation
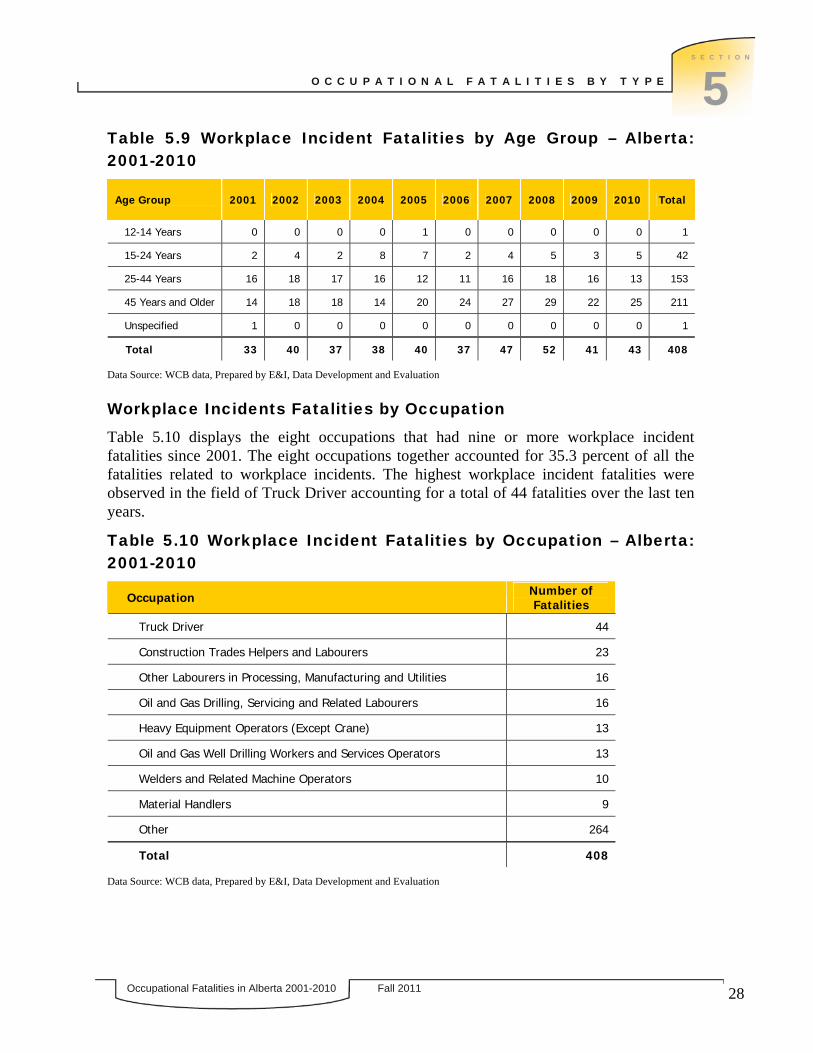
Workplace Incident Fatalities by Age Group
Between 2001 and 2010, 37.5 percent of workplace incident fatalities in Alberta involved workers aged 25-44 years old with this age group accounting for 46.5 percent of those in employment8. Workers aged 45 years and older accounted for 51.7 percent of workplace incident fatalities and 36.3 percent of those in employment. Workers aged 15-24 years accounted for 10.3 percent of workplace incident fatalities. This age group accounted for 17.2 percent of those in employment. Table 5.9 provides details of the workplace incident fatalities by age group from 2001 to 2010.
8 Statistics Canada Labour Force Survey (2010 Historical Review)
27
Occupational Fatalities in Alberta 2001-2010 Fall 2011
5 S E C T I O N
O C C U P A T I O N A L F A T A L I T I E S B Y T Y P E
Table 5.9 Workplace Incident Fatalities by Age Group – Alberta: 2001-2010
Age Group 2001 2002 2003 2004 2005 2006 2007 2008 2009 2010 Total
12-14 Years 0 0 0 0 1 0 0 0 0 0 1
15-24 Years 2 4 2 8 7 2 4 5 3 5 42
25-44 Years 16 18 17 16 12 11 16 18 16 13 153
45 Years and Older 14 18 18 14 20 24 27 29 22 25 211
Unspecified 1 0 0 0 0 0 0 0 0 0 1
Total 33 40 37 38 40 37 47 52 41 43 408
Data Source: WCB data, Prepared by E&I, Data Development and Evaluation
Workplace Incidents Fatalities by Occupation
Table 5.10 displays the eight occupations that had nine or more workplace incident fatalities since 2001. The eight occupations together accounted for 35.3 percent of all the fatalities related to workplace incidents. The highest workplace incident fatalities were observed in the field of Truck Driver accounting for a total of 44 fatalities over the last ten years.
Table 5.10 Workplace Incident Fatalities by Occupation – Alberta: 2001-2010
Occupation Number of Fatalities
Truck Driver 44
Construction Trades Helpers and Labourers 23
Other Labourers in Processing, Manufacturing and Utilities 16
Oil and Gas Drilling, Servicing and Related Labourers 16
Heavy Equipment Operators (Except Crane) 13
Oil and Gas Well Drilling Workers and Services Operators 13
Welders and Related Machine Operators 10
Material Handlers 9
Other 264
Total 408
Data Source: WCB data, Prepared by E&I, Data Development and Evaluation
28
Occupational Fatalities in Alberta 2001-2010 Fall 2011
5 S E C T I O N
O C C U P A T I O N A L F A T A L I T I E S B Y T Y P E
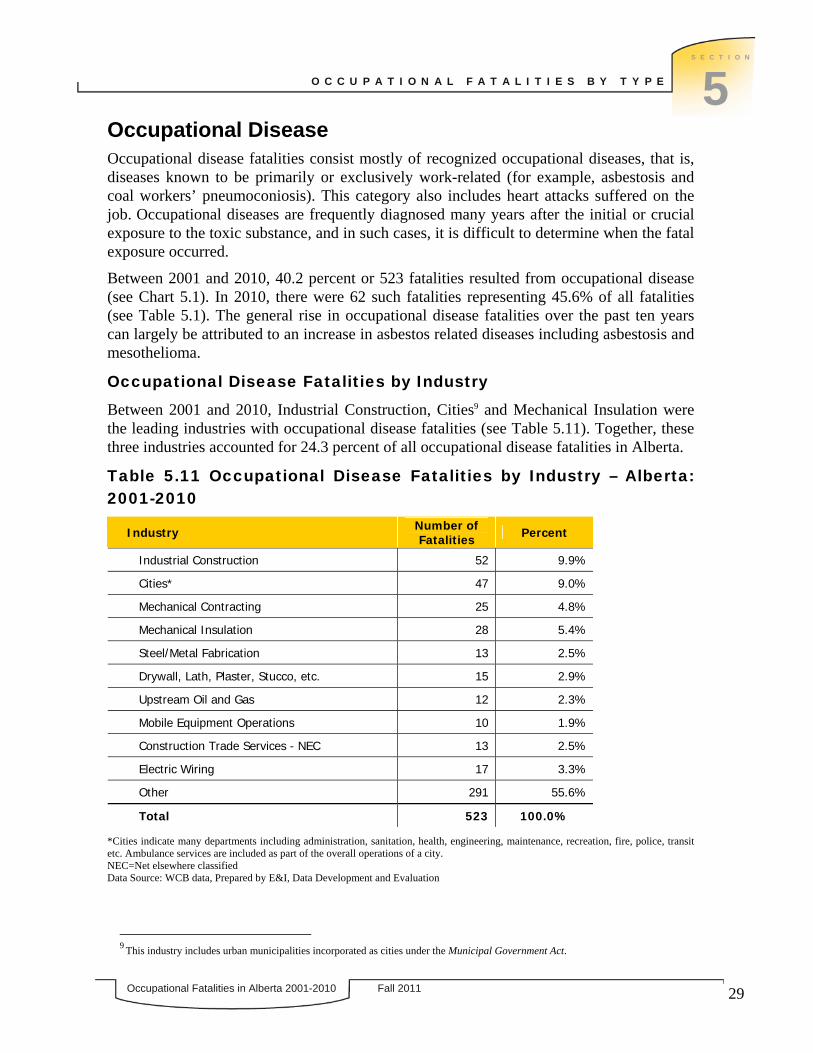
Occupational Disease Occupational disease fatalities consist mostly of recognized occupational diseases, that is, diseases known to be primarily or exclusively work-related (for example, asbestosis and coal workers’ pneumoconiosis). This category also includes heart attacks suffered on the job. Occupational diseases are frequently diagnosed many years after the initial or crucial exposure to the toxic substance, and in such cases, it is difficult to determine when the fatal exposure occurred.
Between 2001 and 2010, 40.2 percent or 523 fatalities resulted from occupational disease (see Chart 5.1). In 2010, there were 62 such fatalities representing 45.6% of all fatalities (see Table 5.1). The general rise in occupational disease fatalities over the past ten years can largely be attributed to an increase in asbestos related diseases including asbestosis and mesothelioma.
Occupational Disease Fatalities by Industry
Between 2001 and 2010, Industrial Construction, Cities9 and Mechanical Insulation were the leading industries with occupational disease fatalities (see Table 5.11). Together, these three industries accounted for 24.3 percent of all occupational disease fatalities in Alberta.
Table 5.11 Occupational Disease Fatalities by Industry – Alberta: 2001-2010
Industry Number of Fatalities Percent
Industrial Construction 52 9.9%
Cities* 47 9.0%
Mechanical Contracting 25 4.8%
Mechanical Insulation 28 5.4%
Steel/Metal Fabrication 13 2.5%
Drywall, Lath, Plaster, Stucco, etc. 15 2.9%
Upstream Oil and Gas 12 2.3%
Mobile Equipment Operations 10 1.9%
Construction Trade Services - NEC 13 2.5%
Electric Wiring 17 3.3%
Other 291 55.6%
Total 523 100.0%
*Cities indicate many departments including administration, sanitation, health, engineering, maintenance, recreation, fire, police, transit etc. Ambulance services are included as part of the overall operations of a city. NEC=Net elsewhere classified Data Source: WCB data, Prepared by E&I, Data Development and Evaluation
9 This industry includes urban municipalities incorporated as cities under the Municipal Government Act.
29
Occupational Fatalities in Alberta 2001-2010 Fall 2011
5 S E C T I O N
O C C U P A T I O N A L F A T A L I T I E S B Y T Y P E
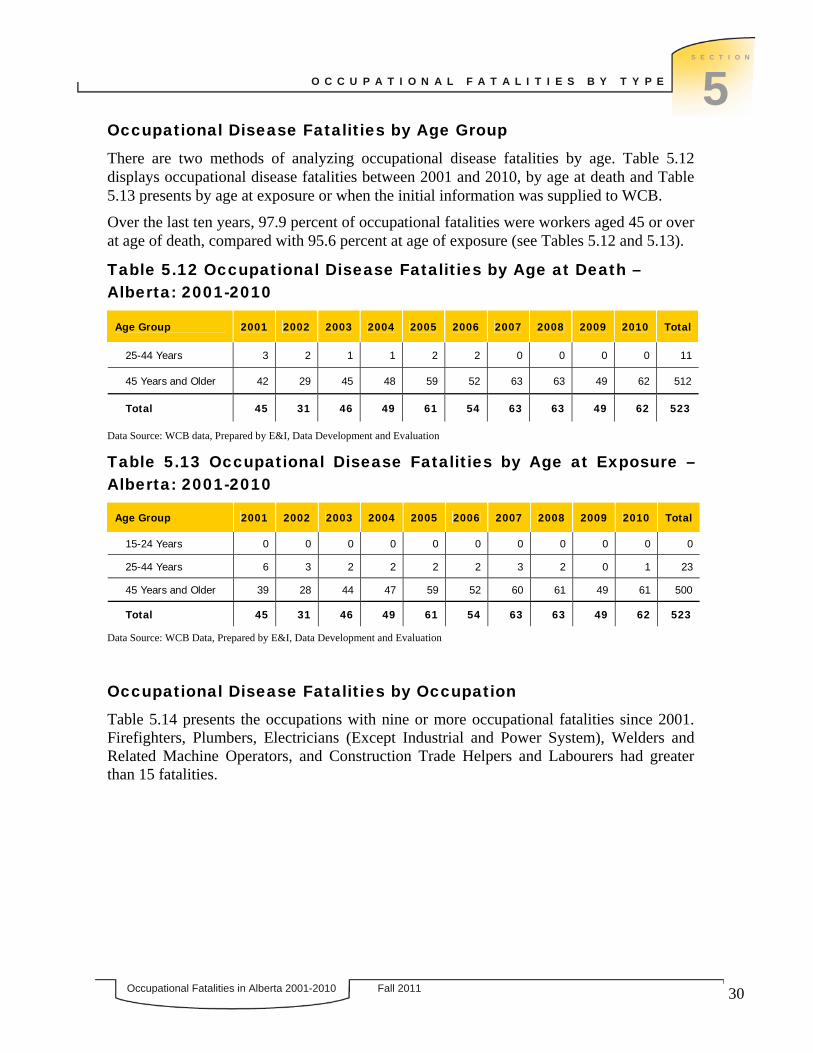
Occupational Disease Fatalities by Age Group
There are two methods of analyzing occupational disease fatalities by age. Table 5.12 displays occupational disease fatalities between 2001 and 2010, by age at death and Table 5.13 presents by age at exposure or when the initial information was supplied to WCB.
Over the last ten years, 97.9 percent of occupational fatalities were workers aged 45 or over at age of death, compared with 95.6 percent at age of exposure (see Tables 5.12 and 5.13).
Table 5.12 Occupational Disease Fatalities by Age at Death – Alberta: 2001-2010
Age Group 2001 2002 2003 2004 2005 2006 2007 2008 2009 2010 Total
25-44 Years 3 2 1 1 2 2 0 0 0 0 11
45 Years and Older 42 29 45 48 59 52 63 63 49 62 512
Total 45 31 46 49 61 54 63 63 49 62 523
Data Source: WCB data, Prepared by E&I, Data Development and Evaluation
Table 5.13 Occupational Disease Fatalities by Age at Exposure – Alberta: 2001-2010
Age Group 2001 2002 2003 2004 2005 2006 2007 2008 2009 2010 Total
15-24 Years 0 0 0 0 0 0 0 0 0 0 0
25-44 Years 6 3 2 2 2 2 3 2 0 1 23
45 Years and Older 39 28 44 47 59 52 60 61 49 61 500
Total 45 31 46 49 61 54 63 63 49 62 523
Data Source: WCB Data, Prepared by E&I, Data Development and Evaluation
Occupational Disease Fatalities by Occupation
Table 5.14 presents the occupations with nine or more occupational fatalities since 2001. Firefighters, Plumbers, Electricians (Except Industrial and Power System), Welders and Related Machine Operators, and Construction Trade Helpers and Labourers had greater than 15 fatalities.
30

Occupational Fatalities in Alberta 2001-2010 Fall 2011
5 S E C T I O N
O C C U P A T I O N A L F A T A L I T I E S B Y T Y P E
Table 5.14 Occupational Disease Fatalities by Occupation – Alberta: 2001-2010
Occupation Number of Fatalities
Firefighters 32
Plumbers 31
Electricians (Except Industrial and Power System) 21
Welders and Related Machine Operators 20
Construction Trades Helpers and Labourers 18
Carpenters 14
Insulators 14
Truck Drivers 11
Other Labourers in Processing, Manufacturing and Utilities 10
Sheet Metal Workers 9
Construction Millwrights and Industrial Mechanics (Except Textile) 9
Other 334
Data Source: WCB Data, Prepared by E&I, Data Development and Evaluation
31
Occupational Fatalities in Alberta 2001-2010 Fall 2011
REFERENCES
Agriculture and Rural Development. “2010 Alberta Farm Fatalities”, March 2011.
Alberta Employment and Immigration. “Occupational Injuries and Diseases in Alberta 2010 Summary.”
Alberta Transportation. “Alberta Traffic Collision Statistics: 2010.”
Canadian Standards Association. Z795-03: Coding of Work Injury or Disease Information, June 2003.
Statistics Canada. Labour Force Historical Review 2010.
32
Occupational Fatalities in Alberta 2001-2010 Fall 2011
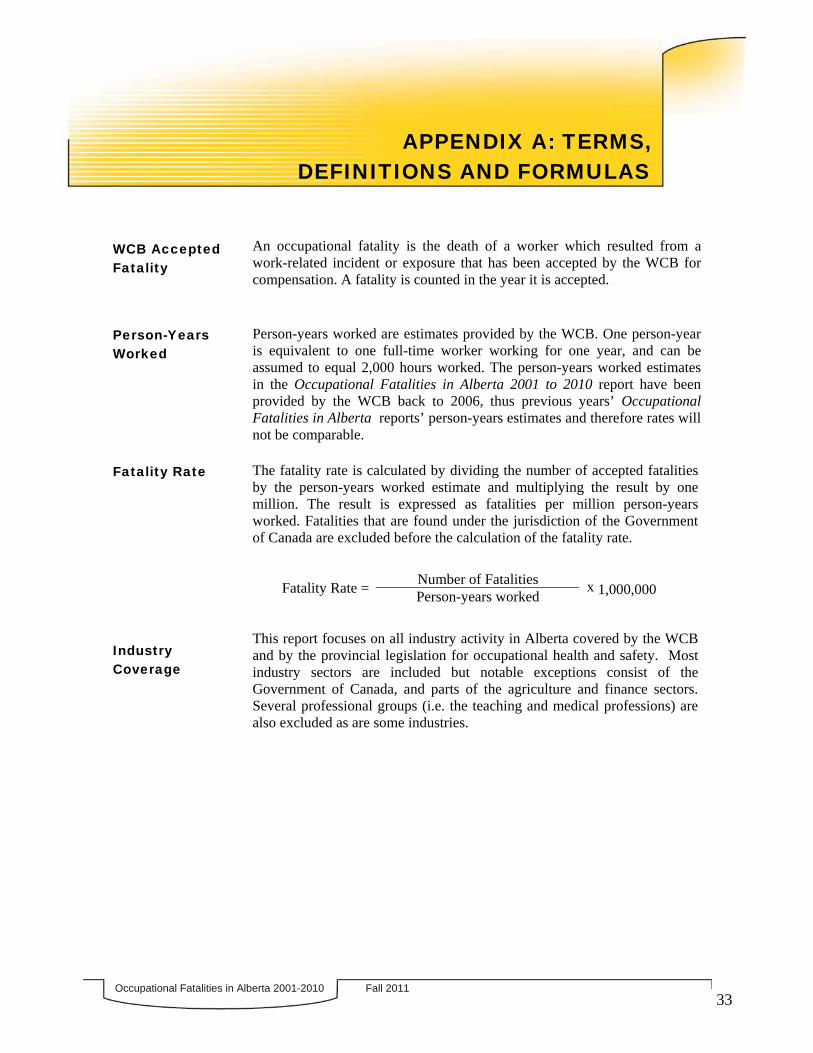
APPENDIX A: TERMS, DEFINITIONS AND FORMULAS
WCB Accepted Fatality
An occupational fatality is the death of a worker which resulted from a work-related incident or exposure that has been accepted by the WCB for compensation. A fatality is counted in the year it is accepted.
Person-Years Worked
Person-years worked are estimates provided by the WCB. One person-year is equivalent to one full-time worker working for one year, and can be assumed to equal 2,000 hours worked. The person-years worked estimates in the Occupational Fatalities in Alberta 2001 to 2010 report have been provided by the WCB back to 2006, thus previous years’ Occupational Fatalities in Alberta reports’ person-years estimates and therefore rates will not be comparable.
Fatality Rate The fatality rate is calculated by dividing the number of accepted fatalities by the person-years worked estimate and multiplying the result by one million. The result is expressed as fatalities per million person-years worked. Fatalities that are found under the jurisdiction of the Government of Canada are excluded before the calculation of the fatality rate.
Number of Fatalities Fatality Rate = Person-years worked
x 1,000,000
Industry Coverage
This report focuses on all industry activity in Alberta covered by the WCB and by the provincial legislation for occupational health and safety. Most industry sectors are included but notable exceptions consist of the Government of Canada, and parts of the agriculture and finance sectors. Several professional groups (i.e. the teaching and medical professions) are also excluded as are some industries.
33

Occupational Fatalities in Alberta 2001-2010 Fall 2011
CONTACT INFORMATION
For further information about the data presented in this report contact: Employment and Immigration Data Development and Evaluation 2nd Floor, 10808 – 99 Avenue Edmonton, Alberta T5K 0G5 Telephone: 780-427-8531, toll free by calling 310-0000 Fax: 780-422-5070 Email: [email protected]
Employment and Immigration:
www.employment.alberta.ca
Work Safe Alberta website:
www.worksafe.alberta.ca
Workplace Health and Safety Contact Centre:
Telephone: 780-415-8690, toll free by calling 1-866-415-8690
http://www.employment.alberta.ca/SFW/2874.html
Certificate of Recognition (COR) Program:
http://www.employment.alberta.ca/SFW/334.html
34