table of contents - navigator fund · table of contents fund summary ... typically, a rise in...
TRANSCRIPT


TABLE OF CONTENTS
FUND SUMMARY: NAVIGATOR TACTICAL FIXED INCOME FUND ............................ 1 FUND SUMMARY: NAVIGATOR DURATION NEUTRAL BOND FUND ........................ 6 FUND SUMMARY: NAVIGATOR EQUITY HEDGED FUND ........................................... 10 FUND SUMMARY: NAVIGATOR SENTRY MANAGED VOLATILITY FUND ................ 14 ADDITIONAL INFORMATION ABOUT PRINCIPAL INVESTMENT STRATEGIES AND RELATED RISKS ............................................................................. 18
Investment Objective ................................................................................................... 18 Principal Investment Strategies ................................................................................... 18 Principal Investment Risks ........................................................................................... 21 Temporary Investments ............................................................................................... 28 Portfolio Holdings Disclosure ....................................................................................... 28 Cybersecurity ............................................................................................................... 28
MANAGEMENT ............................................................................................................... 29 Investment Adviser ..................................................................................................... 29 Adviser Portfolio Managers .......................................................................................... 29
HOW SHARES ARE PRICED .......................................................................................... 32 HOW TO PURCHASE SHARES ...................................................................................... 33 HOW TO REDEEM SHARES ........................................................................................... 37 TAX STATUS, DIVIDENDS AND DISTRIBUTIONS ......................................................... 38 FREQUENT PURCHASES AND REDEMPTIONS OF FUND SHARES .......................... 39 DISTRIBUTION OF SHARES ........................................................................................... 40
Distributor .................................................................................................................... 40 Distribution (12b-1) and Shareholder Servicing Fees .................................................. 40 Additional Compensation to Financial Intermediaries .................................................. 40 Householding ............................................................................................................... 40
FINANCIAL HIGHLIGHTS ................................................................................................ 41 PRIVACY NOTICE ............................................................................................................ 53


1
FUND SUMMARY: NAVIGATOR TACTICAL FIXED INCOME FUND Investment Objective: The Fund’s investment objective is to seek total return with a secondary goal of current income. Fees and Expenses of the Fund: The following table describes the fees and expenses that you may pay if you buy and hold shares of the Fund. You may qualify for sales charge discounts on purchases of Class A shares if you and your family invest, or agree to invest in the future, at least $50,000 in the Fund. More information about these and other discounts is available from your financial professional and in How to Purchase Shares on page 33 of the Fund’s Prospectus and in Purchase, Redemption and Pricing of Shares on page 60 of the Statement of Additional Information.
Shareholder Fees
(fees paid directly from your investment) Class A Shares
Class C Shares
Class I Shares
Maximum Sales Charge (Load) Imposed on Purchases (as a % of offering price) 3.75% None None
Maximum Deferred Sales Charge (Load) (as a % of the lower of original purchase price or redemption proceeds)
None None None
Maximum Sales Charge (Load) Imposed on Reinvested Dividends and Other Distributions None None None
Redemption Fee None None None Annual Fund Operating Expenses (expenses that you pay each year as a percentage of the value of your investment)
Management Fees 0.85% 0.85% 0.85% Distribution and Service (12b-1) Fees 0.25% 1.00% 0.00% Other Expenses 0.14% 0.14% 0.14% Acquired Fund Fees and Expenses(1) 0.10% 0.10% 0.10% Total Annual Fund Operating Expenses 1.34% 2.09% 1.09%
(1) Acquired Fund Fees and Expenses are the indirect costs of investing in other investment companies. The operating expenses in this fee table will not correlate to the expense ratio in the Fund’s financial highlights because the financial statements include only the direct operating expenses incurred by the Fund.
Example: This Example is intended to help you compare the cost of investing in the Fund with the cost of investing in other mutual funds. The example assumes that you invest $10,000 in the Fund for the time periods indicated and then redeem all of your shares at the end of those periods. The example also assumes that your investment has a 5% return each year, you reinvest all dividends and capital gains distributions and that the Fund’s operating expenses remain the same. Although your actual costs may be higher or lower, based on these assumptions, your costs would be:
Class 1 Year 3 Years 5 Years 10 Years A $506 $784 $1,082 $1,927 C $212 $655 $1,124 $2,421 I $111 $347 $601 $1,329
Portfolio Turnover: The Fund pays transaction costs, such as commissions, when it buys and sells securities (or “turns over” its portfolio). A higher portfolio turnover may indicate higher transaction costs and may result in higher taxes when Fund shares are held in a taxable account. These costs, which are not reflected in annual fund operating expenses or in the Example, affect the Fund’s performance. During the most recent fiscal period, the Fund’s portfolio turnover rate was 278%. Principal Investment Strategies: In seeking to achieve its investment objective, the Fund will invest, under normal circumstances, at least 80% of its assets, defined as net assets plus the amount of any borrowings for investment purposes, in long and/or short positions in fixed income securities (“80% investment policy”). For purposes of the 80% investment policy, the Fund defines fixed income securities as including (i) bills, (ii) notes, (iii) structured notes, (iv) bonds, (v) preferred stocks, (vi) any other debt or debt-related securities of any maturities, whether issued by U.S. or non-U.S. governments, agencies or instrumentalities thereof or corporate entities, and having fixed, variable, floating or inverse floating rates, (vii) fixed income derivatives including options, financial futures, options on futures and swaps, and (viii) underlying funds (defined below) that invest primarily in fixed income securities, or (ix) other evidences of indebtedness. The Fund may invest in debt securities of any maturity or credit quality, including those rated below investment grade (“high yield securities”). Below investment grade debt

2
securities are those rated below Baa3 by Moody’s Investors Service or equivalently by another nationally recognized statistical rating organization (NRSRO). The Fund may invest in underlying funds such as mutual funds (including money market funds), exchange traded funds (“ETFs”) and inverse ETFs (collectively, “Underlying Funds”)). The Fund may also purchase or write (sell) credit default swaps (“CDS”) or credit default swap indexes (“CDX”), which are credit derivatives used to hedge credit risk and/or take a position on a basket of credit entities. Unlike a credit default swap, which is an over the counter derivative, a CDX may be exchange traded, or sold over the counter. Each CDX is designed to track a basket of credit entities, which may be standard or customized. This means that it may be more liquid than a credit default swap, and it may be cheaper to hedge the Fund’s portfolio with a CDX than it would be to buy many single name credit default swaps to achieve a similar effect. The Fund may also purchase or sell total return swaps or invest in inverse ETFs to hedge its long positions. The Fund’s strategy is primarily driven by a modeling process which measures the relative strength or momentum of various fixed income assets classes against one another. Using this momentum-based strategy, the Fund will tactically shift its holdings and asset allocations accordingly. The adviser’s process uses relative strength models to determine the Fund’s allocation among high yield securities, intermediate to long-term Treasuries, and T-bills. That analysis assists the adviser to determine the preferred asset class, which in turn drives the individual security selection. Thus, when the high yield asset class is favored, the Fund will invest in other high yield mutual funds, ETFs, individual high yield securities, preferred stocks, and synthetic high yield investments. Conversely, when the favored asset class is Treasuries, the adviser will sell and/or hedge the Fund’s high yield exposure by short-selling common stocks, entering into puts or put spreads on individual stocks or equity indices, futures, selected to replicate the credit component of high yield corporate bonds and increase the Fund’s exposure to Treasuries through bonds, notes, money market funds which invest primarily in T-bills, ETFs and synthetic investments designed to do so. Principal Investment Risks: As with all mutual funds, there is the risk that you could lose money through your investment in the Fund. The Fund is not intended to be a complete investment program. Many factors affect the Fund’s net asset value and performance.
• Credit Default Swap Risk – Credit default swaps (“CDS”), a type of derivative instrument, involve special risks and may result in losses to the Fund. CDS are typically two-party financial contracts that transfer credit exposure between the two parties. Under a typical CDS, one party (the “seller”) receives pre-determined periodic payments from the other party (the “buyer”). The seller agrees to make compensating specific payments to the buyer if a negative credit event occurs, such as the bankruptcy or default by the issuer of the underlying debt instrument. The use of CDS involves investment techniques and risks different from those associated with ordinary portfolio security transactions, such as potentially heightened counterparty, concentration and exposure risks. CDS may in some cases be illiquid, and they increase credit risk since the Fund has exposure to the issuer of the referenced obligation and either the counterparty to the credit default swap or, if it is a cleared transaction, the brokerage firm through which the trade was cleared and the clearing organization that is the counterparty to that trade. In addition, for cleared trades, the brokerage firm would impose margin requirements and would be able to require termination of those trades in certain circumstances. Certain CDS will be required to be traded on a regulated execution facility or contract market that makes them available for trading. The transition to trading these swaps on such a facility or contract market may not result in swaps being easier to trade or value and may present certain execution risks if such a facility or contract market does not operate properly. Swaps may be difficult to unwind or terminate.
• CDX Risk – A CDX is subject to the risks of the underlying credit default swap obligations, which include risks such as concentration risk and counterparty risk. Concentration risk refers to the certain large institutional buyers may take large positions in credit default swaps, and the failure of such a buyer could materially adversely affect the credit default swap market as a whole. Counterparty risk refers to the risk that the counterparty to the swap will default on its obligation to pay.
• Credit Risk – The issuer of a fixed income security may not be able to make interest or principal payments when due. Generally, the lower the credit rating of a security, the greater the risk is that the issuer will default on its obligation.
• Derivatives Risk – The Fund may execute an investment strategy or hedge by entering into derivative contracts such as futures, options and swaps, which can be riskier than traditional investments because they may involve leverage, be illiquid, suffer counterparty default and limit gains. Equity market-related swap contracts (including total return swaps and CDS) and options involve leverage risk, tracking risk and counterparty default risk. Option positions may expire worthless exposing the Fund to potentially significant losses. There is a risk that adverse price movements in a swap instrument can result in a loss substantially greater than the Fund’s initial investment in that instrument (in some cases, the potential loss is unlimited).

3
• Equity Securities Risk – Common and preferred stocks are susceptible to general stock market fluctuations and to volatile increases and decreases in value as market confidence in and perceptions of their issuers change. Warrants and rights may expire worthless if the price of a common stock is below the conversion price of the warrant or right. Convertible bonds may decline in value if the price of a common stock falls below the conversion price. Investor perceptions are based on various and unpredictable factors including expectations regarding government, economic, monetary and fiscal policies; inflation and interest rates; economic expansion or contraction and global or regional political, economic and banking crises.
• Fixed Income Risk – The value of the Fund’s investments in fixed income securities and derivatives will fluctuate with changes in interest rates. Typically, a rise in interest rates causes a decline in the value of fixed income securities and derivatives owned by the Fund. On the other hand, if rates fall, the value of the fixed income securities and derivatives generally increases. Your investment will decline in value if the value of the Fund’s investments decreases.
• Government-Sponsored Entities Risk – The Fund invests in securities issued or guaranteed by government-sponsored entities, but these securities may not be guaranteed or insured by the U.S. Government and may only be supported by the credit of the issuing agency.
• Hedging Risk – When the adviser believes market conditions are unfavorable, the adviser may attempt to “hedge” with defensive positions and strategies including, for example, holding substantial positions in lower-yield fixed-income securities and/or cash equivalents, which may limit potential gains when compared to unhedged funds.
• High-Yield Bond Risk – Lower-quality bonds, known as high-yield bonds or “junk bonds,” present a significant risk for loss of principal and interest. These bonds offer the potential for higher return, but also involve greater risk than bonds of higher quality, including an increased possibility that the bond’s issuer, obligor or guarantor may not be able to make its payments of interest and principal (credit quality risk).
• Interest Rate Risk – The value of the Fund may fluctuate based on changes in interest rates and market conditions. As interest rates rise, the value of income producing instruments may decrease. This risk increases as the term of the note increases.
• Issuer-Specific Risk – The value of a specific security can be more volatile than the market as a whole and can perform differently from the value of the market as a whole.
• Leverage/Volatility Risk – The use of leverage by the Fund, such as borrowing money to purchase securities or the use of options, will cause the Fund to incur additional expenses and magnify the Fund’s gains or losses.
• Management Style Risk – The adviser’s judgments about the potential appreciation of a particular security in which the Fund invests may prove to be incorrect. The adviser’s proprietary modeling process may incorrectly measure or predict the relative strength or momentum of various fixed income asset classes, and the Fund may hold a high percentage of either high-yield bonds or cash equivalents during certain periods, or for an extended period.
• Options Risk – The Fund may lose the entire put or call option premium paid if the reference asset or index does not decrease below or rise above the respective strike price before expiration. Options may not be an effective hedge because they may have imperfect correlation to the value of the Fund’s assets.
• Portfolio Turnover Risk – A higher portfolio turnover may result in higher transactional and brokerage costs.
• Preferred Stock Risk – Typically, a rise in interest rates causes a decline in the value of preferred stock. Preferred stocks are also subject to credit and default risk, which is the possibility that an issuer of preferred stock will fail to make its dividend payments.
• Short Selling and Short Position Risk – The Fund may engage in short selling and short position derivative activities, which are significantly different from the investment activities commonly associated with conservative stock or bond funds. Positions in shorted securities and derivatives are speculative and more risky than “long” positions (purchases) because the cost of the replacement security or derivative is unknown. Therefore, the potential loss on an uncovered short is unlimited, whereas the potential loss on long positions is limited to the original purchase price. You should be aware that any strategy that includes selling securities short could suffer significant losses. Shorting will also result in higher transaction costs (such as interest and dividends), which reduce the Fund’s return, and may result in higher taxes.
• Small and Medium Company Credit Risk – Small and mid-sized companies may have limited product lines, markets or financial resources, and they may be dependent on a limited management group. Therefore, equity or fixed income securities issued by smaller companies may pose greater credit risk than is generally associated with the securities of larger, more established companies.
• Stock Market Risk – Equity prices can fall rapidly in response to developments affecting a specific company or industry, or to changing economic, political or market conditions.
• Structured Notes Risk – Structured notes involve leverage risk, tracking risk and issuer default risk.

4
• Swap Risk – Swap agreements are subject to the risk that the counterparty to the swap will default on its obligation to pay the Fund and the risk that the Fund will not be able to meet its obligations to pay the counterparty to the swap. Swap agreements may also involve fees, commissions or other costs that may reduce the Fund’s gains from a swap agreement or may cause the Fund to lose money.
• Underlying Funds Risk – Underlying Funds in which the Fund invests are subject to investment advisory and other expenses, which will be indirectly paid by the Fund. As a result, the cost of investing in the Fund will be higher than the cost of investing directly in the Underlying Funds and may be higher than other mutual funds that invest directly in stocks and bonds. Each of the Underlying Funds is subject to specific risks, depending on the nature of the fund.
Performance: The bar chart and performance table below show the variability of the Fund’s returns, which is some indication of the risks of investing in the Fund. The bar chart shows performance of the Fund’s Class I shares for each full calendar year since the Fund’s inception. Returns for Class A and Class C shares, which are not presented, would be different than the returns for Class I shares. The performance table compares the performance of the Fund over time to the performance of a broad-based securities market index. You should be aware that the Fund’s past performance (before and after taxes) may not be an indication of how the Fund will perform in the future. Updated performance information is available at no cost by calling 1-877-766-2264 or visiting www.navigatorfunds.com.
Class I Shares
Annual Total Return For Calendar Year Ended December 31
Best Quarter: First Quarter 2016 7.10% Worst Quarter: Fourth Quarter 2015 (2.54)%
Performance Table Average Annual Total Returns
(For periods ended December 31, 2017)
One Year
Since Inception (3/27/14)
Return before taxes – Class I Shares 5.92% 5.18% Return after taxes on distributions 2.89% 3.15% Return after taxes on distributions and sale of Fund shares 3.33% 3.06% Return before taxes – Class A Shares 1.56% 3.81% Return before taxes – Class C Shares 4.78% 4.13% Barclays U.S. Corporate High Yield (1) 7.50% 4.93%
(1) The Barclays U.S. Corporate High Yield Bond Index is a market value-weighted index which covers the U.S. non-investment grade fixed-rate debt market. Investors cannot invest directly in an index or benchmark.
After-tax returns are calculated using the highest historical individual federal marginal income tax rate and do not reflect the impact of state and local taxes. Actual after-tax returns depend on a shareholder’s tax situation and may differ from those shown. The after-tax returns are not relevant if you hold your Fund shares in tax-deferred arrangements, such as 401(k) plans or individual retirement accounts (“IRA”). The after tax returns for Class A and Class C shares are not shown and would differ from those of Class I Shares.

5
Investment Adviser: Clark Capital Management Group, Inc. Portfolio Managers: K. Sean Clark, CFA, Chief Investment Officer of the adviser, has served the Fund as its Portfolio Manager since inception. David J. Rights, Director of Research of the adviser, has served the Fund as its Portfolio Manager since inception. Jonathan Fiebach, Executive Vice President-Fixed Income of the Adviser, has served the Fund as its Portfolio Manager since inception. Mason Wev, CFA and CMT, is a Portfolio Manager and member of the adviser’s investment committee. He has served the Fund as its Portfolio Manager since inception. Robert S. Bennett, Jr., is a Portfolio Manager and member of the adviser’s investment committee. He has served the Fund as Portfolio Manager since April 1, 2014. Purchase and Sale of Fund Shares: The minimum initial investment in Class A, Class C and Class I shares is $5,000, $5,000 and $25,000, respectively. The minimum subsequent investment in Class A and Class C is $500. Class I shares have no minimum subsequent investment requirement. The Fund reserves the right to waive any minimum. You may purchase and redeem shares of the Fund on any day that the New York Stock Exchange is open. Redemption requests may be made in writing, by telephone, or through a financial intermediary and will be paid by ACH, check or wire transfer. Tax Information: Dividends and capital gain distributions you receive from the Fund, whether you reinvest your distributions in additional Fund shares or receive them in cash, are taxable to you at either ordinary income or capital gains tax rates unless you are investing through a tax-deferred plan such as an IRA or 401(k) plan. However, these dividend and capital gain distributions may be taxable upon their eventual withdrawal from tax-deferred plans. Payments to Broker-Dealers and Other Financial Intermediaries: If you purchase the Fund through a broker-dealer or other financial intermediary (such as a bank), the Fund and its related companies may pay the intermediary for the sale of Fund shares and related services. These payments may create a conflict of interest by influencing the broker-dealer or other intermediary and your salesperson to recommend the Fund over another investment. Ask your salesperson or visit your financial intermediary’s website for more information.

6
FUND SUMMARY: NAVIGATOR DURATION NEUTRAL BOND FUND Investment Objective: The Fund seeks to maximize total return, which is comprised of income and capital appreciation, while hedging interest rate exposure. Fees and Expenses of the Fund: This table describes the fees and expenses that you may pay if you buy and hold shares of the Fund. You may qualify for sales charge discounts on purchases of Class A shares if you and your family invest, or agree to invest in the future, at least $50,000 in the Fund. More information about these and other discounts is available from your financial professional and in How to Purchase Shares on page 33 of the Fund’s Prospectus and in Purchase, Redemption and Pricing of Shares on page 60 of the Statement of Additional Information.
Shareholder Fees (fees paid directly from your investment)
Class A Shares
Class C Shares
Class I Shares
Maximum Sales Charge (Load) Imposed on Purchases (as a % of offering price) 3.75% None None
Maximum Deferred Sales Charge (Load) None None None Maximum Sales Charge (Load) Imposed on Reinvested Dividends and other Distributions None None None
Redemption Fee None None None Annual Fund Operating Expenses (expenses that you pay each year as a percentage of the value of your investment)
Management Fees 1.00% 1.00% 1.00% Distribution and/or Service (12b-1) Fees 0.25% 1.00% None Other Expenses 0.35% 0.35% 0.35% Total Annual Fund Operating Expenses 1.60% 2.35% 1.35%
Example: This Example is intended to help you compare the cost of investing in the Fund with the cost of investing in other mutual funds. The Example assumes that you invest $10,000 in the Fund for the time periods indicated and then redeem all of your shares at the end of those periods. The Example also assumes that your investment has a 5% return each year and that the Fund’s operating expenses remain the same. Although your actual costs may be higher or lower, based upon these assumptions your costs would be:
Class 1 Year 3 Years 5 Years 10 Years A $532 $861 $1,213 $2,204 C $238 $733 $1,255 $2,686 I $137 $428 $739 $1,624
Portfolio Turnover: The Fund pays transaction costs, such as commissions, when it buys and sells securities (or “turns over” its portfolio). A higher portfolio turnover may indicate higher transaction costs and may result in higher taxes when Fund shares are held in a taxable account. These costs, which are not reflected in annual fund operating expenses or in the Example, affect the Fund’s performance. During the most recent fiscal period, the Fund’s portfolio turnover rate was 39%. Principal Investment Strategies: Under normal circumstances, the Fund invests at least 80% of its assets (defined as net assets plus any borrowing for investment purposes) in bond instruments. The Fund will invest primarily in municipal bond instruments. The Fund intends to be “duration neutral”, meaning it seeks to provide exposure to the municipal bond market while protecting against loss of principal when interest rates rise. The Fund is non-diversified, which means that it can invest a greater percentage of its assets in any one issuer than a diversified fund. The Fund defines bond instruments to include bonds such as municipal bonds, and U.S. Treasury bonds and notes; derivatives based on bonds, such as futures or options on U.S. Treasury Bonds and Notes; and other investment companies, including exchange traded funds or closed-end funds (“Underlying Funds”), that invest primarily in municipal bonds. The Fund may invest in municipal bond instruments that are not tax advantaged and which may provide taxable income. The 80% bond investment policy can be changed without shareholder approval, however, shareholders would be given at least 60 days’ notice prior to any such change. Duration is the measure of a bond’s sensitivity to interest rate risk changes. Generally the longer the duration, the more sensitive a bond is to interest rate changes. By maintaining both long and short positions, the Fund expects to be able to isolate and neutralize price shifts resulting from changing interest rates, so that the Fund is duration neutral.

7
The Fund seeks to hedge the portion of the value of the municipal bond instruments subject to interest rate risk through investments in:
• U.S. Treasury Bonds and Notes;
• Futures and Options on U.S. Treasury Bonds and Notes;
• Futures and Options on LIBOR Swaps; and
• Other mutual funds, exchange traded funds (“ETFs”) or closed-end funds (collectively, “Underlying Funds”), including inverse or leveraged ETFs.
Bond Selection The Adviser uses a trading strategy based on its proprietary model to take advantage of value in the municipal bond market, by seeking investments it believes are undervalued. Using this model the Adviser expects the Fund to invest in securities of a particular municipal bond market or category when trends are favorable or, conversely, sell securities in that municipal bond market or category when trends are unfavorable. The Fund will invest primarily in investment grade bonds, rated at least Baa3 or higher by Moody’s, BBB- or higher by Standard & Poor’s, or BBB- or higher by Fitch Ratings at the time of purchase. However, there is no limitation or maximum maturity on the Fund’s investments and the Adviser expects to invest in bonds issued throughout the U.S., with various maturities. Riskless Rate Offset The Adviser believes every bond has embedded in its value a riskless interest rate and it uses a proprietary method of evaluating the amount of riskless interest rate for the base currency (U.S. dollar) embedded in the municipal bond holdings of the Fund, then expects to offset any interest rate risk through the sale of one of a series of instruments that exemplifies this riskless rate, like U.S. Treasury Bond futures contracts that trade on the Chicago Mercantile Exchange (“CME”). By hedging against the risk of rising interest rates through its duration neutral approach, the Fund seeks to avoid principal loss when interest rates rise. The adviser may engage in frequent buying and selling of securities to achieve the Fund’s investment objective. The Fund may borrow money from banks to help manage Fund inflows and outflows, such as to avoid having to sell portfolio investments in order to meet net redemptions. The Fund also may borrow money from banks to make additional portfolio investments when the Adviser believes market conditions are appropriate. The Fund may borrow an amount equal to as much as one-third of the value of its total assets (which includes the amount borrowed). Principal Investment Risks: As with all mutual funds, there is the risk that you could lose money through your investment in the Fund. The Fund is not intended to be a complete investment program. Many factors affect the Fund’s net asset value and performance.
• Correlation Risk. Municipal bonds on one hand, and treasury bonds and LIBOR swaps or options or futures on treasury bonds on the other hand, may experience a lack of correlation. Such a lack of correlation might occur due to factors unrelated to the value of the investments, such as speculative or other pressures on the markets in which these instruments are traded. The Fund can be adversely affected by times where municipal interest rates rise and the Fund interest rate hedges decline in value.
• Credit Risk. An issuer of a security, or the counterparty to a contract, may default or otherwise be unable to honor a financial obligation.
• Derivatives Risk. Even a small investment in derivatives (which include options, futures and swap contracts may give rise to leverage risk, and can have a significant impact on the Fund’s performance. Derivatives are also subject to credit risk and liquidity risk.
• Fixed Income Risk. When the Fund invests in fixed income securities, derivatives on fixed income securities, or Underlying Funds that invest in fixed income securities, the value of the Fund will fluctuate with changes in interest rates. Defaults by fixed income issuers in which the Fund invests will also harm performance.
• Inflation-Indexed Securities Risk. A nominal interest rate can be described as the sum of a real interest rate and an expected inflation rate. Inflation-indexed securities, including Treasury Inflation-Protected Securities, decline in value when real interest rates rise.

8
• Interest Rate Risk. Interest rate changes may adversely affect the market value of an investment. Fixed-income securities typically decline in value when interest rates rise. The Fund may experience adverse exposure from both increasing or declining rates. Bonds with longer maturities will be more affected by interest rate changes than intermediate-term bonds.
• Issuer-Specific Risk. The value of a specific security can be more volatile than the market as a whole and can perform differently from the value of the market as a whole.
• Leverage/Volatility Risk. The Fund may employ leverage and may invest in leveraged instruments. Borrowing magnifies the potential for losses and exposes the Fund interest expenses on borrowing. The more the Fund invests in leverage instruments, the more this leverage will magnify any losses on those investments. Leverage will cause the value of the Fund’s shares to be more volatile than if the Fund did not use leverage.
• Liquidity Risk. Liquidity risk exists when particular investments of the Fund would be difficult to purchase or sell, possibly preventing the Fund from selling such illiquid securities at an advantageous time or price, or possibly requiring the Fund to dispose of other investments at unfavorable times or prices in order to satisfy its obligations.
• Management Style Risk. The adviser’s judgments about the attractiveness, value and potential appreciation of particular security or derivative in which the Fund invests or sells short may prove to be incorrect and may not produce the desired results.
• Municipal Market Risk. Special factors may negatively affect the value of municipal securities including political or legislative changes, uncertainties related to the tax status of the securities, or the rights of investors in the securities. Municipal bond issuers may utilize derivatives, subjecting the bonds themselves to the derivatives risks described herein.
• Non-Diversification Risk. The Fund has a greater potential to realize losses upon the occurrence of adverse events affecting a particular issuer.
• Not Tax Exempt Fund. The Fund is not intended to be a tax exempt fund and may not be tax advantaged. While the Adviser expects the majority of the municipal bond instruments in which the Fund invests will be tax advantaged at the time of purchase, under current tax laws, not all municipal bond instruments are designed to be tax advantaged and the municipal bonds in which the Fund invests may generate taxable income, or be subject to the alternative minimum tax. To the extent the Fund’s returns are positive, a portion of the Fund’s investments may generate taxable gains and/or income.
• Portfolio Turnover Risk. A higher portfolio turnover may result in higher transactional and brokerage costs.
• Underlying Funds. Other mutual funds, ETFs and closed-end funds (“Underlying Funds”) in which the Fund invests are subject to investment advisory and other expenses, which will be indirectly paid by the Fund. As a result, the cost of investing in the Fund will be higher than the cost of investing directly in the Underlying Funds and may be higher than other mutual funds that invest directly in stocks and bonds.
• U.S. Government Securities Risk. The Fund may invest in obligations issued by agencies and instrumentalities of the U.S. Government. The U.S. Government may choose not to provide financial support to U.S. Government sponsored agencies or instrumentalities if it is not legally obligated to do so, in which case, if the issuer defaulted, the Fund might not be able to recover its investment.
Performance: The bar chart and performance table below show the variability of the Fund’s returns, which is some indication of the risks of investing in the Fund. The bar chart shows performance of the Fund’s Class I shares for each full calendar year since the Fund’s inception. Returns for Class A and Class C shares, which are not presented, would be different than the returns for Class I shares. The performance table compares the performance of the Fund over time to the performance of a broad-based securities market index. You should be aware that the Fund’s past performance (before and after taxes) may not be an indication of how the Fund will perform in the future. Updated performance information will be available at no cost by visiting www.navigatorfunds.com or by calling 1-877-766-2264.

9
Class I Shares
Annual Total Return For Calendar Year Ended December 31
Best Quarter: Fourth Quarter 2015 3.88% Worst Quarter: First Quarter 2016 (2.02)%
Performance Table Average Annual Total Returns
(For periods ended December 31, 2017)
One Year
Since Inception (9/23/13)
Return before taxes – Class I Shares 2.99% 2.19% Return after taxes on distributions 2.09% 1.51% Return after taxes on distributions and sale of Fund shares 1.79% 1.38% Return before taxes – Class A Shares (1.26)% 1.05% Return before taxes – Class C Shares 1.78% 1.23% Barclays Municipal Bond Index(1) 5.45% 4.32%
(1) Barclays Municipal Bond Index: Includes most investment-grade tax-exempt bonds that are issued by state and local governments. Investors cannot invest directly in an index or benchmark.
After-tax returns are calculated using the highest historical individual federal marginal income tax rate and do not reflect the impact of state and local taxes. Actual after-tax returns depend on a shareholder’s tax situation and may differ from those shown. The after-tax returns are not relevant if you hold your Fund shares in tax-deferred arrangements, such as 401(k) plans or individual retirement accounts (“IRA”). The after tax returns for Class A and Class C shares are not shown and would differ from those of Class I Shares. Investment Adviser: Clark Capital Management Group, Inc. Portfolio Manager: K. Sean Clark, CFA, Chief Investment Officer of the adviser, and Jonathan Fiebach, Executive Vice President-Fixed Income of the Adviser have each served the Fund as its Portfolio Manager since it commenced operations in 2013. Purchase and Sale of Fund Shares: The minimum initial investment in Class A, Class C and Class I shares is $5,000, $5,000 and $25,000, respectively. The minimum subsequent investment in Class A and Class C is $500. Class I shares have no minimum subsequent investment requirement. The Fund reserves the right to waive any minimum. You may purchase and redeem shares of the Fund on any day that the New York Stock Exchange is open. Redemption requests may be made in writing, by telephone, or through a financial intermediary and will be paid by ACH, check or wire transfer. Tax Information: Dividends and capital gain distributions you receive from the Fund, whether you reinvest your distributions in additional Fund shares or receive them in cash, are taxable to you at either ordinary income or capital gains tax rates unless you are investing through a tax-deferred plan such as an IRA or 401(k) plan. Payments to Broker-Dealers and Other Financial Intermediaries: If you purchase the Fund through a broker-dealer or other financial intermediary (such as a bank), the Fund and its related companies may pay the intermediary for the sale of Fund shares and related services. These payments may create a conflict of interest by influencing the broker-dealer or other intermediary and your salesperson to recommend the Fund over another investment. Ask your salesperson or visit your financial intermediary’s website for more information.

10
FUND SUMMARY: NAVIGATOR EQUITY HEDGED FUND Investment Objective: The Fund seeks long-term capital appreciation. Fees and Expenses of the Fund: This table describes the fees and expenses that you may pay if you buy and hold shares of the Fund. You may qualify for sales charge discounts on purchases of Class A shares if you and your family invest, or agree to invest in the future, at least $50,000 in the Fund. More information about these and other discounts is available from your financial professional and in How to Purchase Shares on page 33 of the Fund’s Prospectus and in Purchase, Redemption and Pricing of Shares on page 60 of the Statement of Additional Information.
Shareholder Fees (fees paid directly from your investment)
Class A Shares
Class C Shares
Class I Shares
Maximum Sales Charge (Load) Imposed on Purchases (as a % of offering price) 5.50% None None
Maximum Deferred Sales Charge (Load) (as a % of original purchase price) None None None
Maximum Sales Charge (Load) Imposed on Reinvested Dividends and other Distributions None None None
Redemption Fee None None None Annual Fund Operating Expenses (expenses that you pay each year as a percentage of the value of your investment)
Management Fees 0.75% 0.75% 0.75% Distribution and/or Service (12b-1) Fees 0.25% 1.00% None Other Expenses 0.53% 0.53% 0.53% Acquired Fund Fees and Expenses (1) 0.36% 0.36% 0.36% Total Annual Fund Operating Expenses 1.89% 2.64% 1.64% Fee Waiver and/or Expense Reimbursement (2) (0.18) (0.18)% (0.18)% Total Annual Fund Operating Expenses After Fee Waiver and/or Expense Reimbursement
1.71%
2.46%
1.46%
(1) Acquired Fund Fees and Expenses are the indirect costs of investing in other investment companies. The operating expenses in this fee table will not correlate to the expense ratio in the Fund’s financial highlights because the financial statements include only the direct operating expenses incurred by the Fund.
(2) The Fund’s adviser has contractually agreed to reduce its fees and to reimburse expenses, at least until January 31, 2019, to ensure that total annual fund operating expenses after fee waiver and/or reimbursement (excluding any front-end or contingent deferred loads, brokerage fees and commissions, acquired fund fees and expenses, fees and expenses associated with instruments in other collective investment vehicles or derivative instruments (including for example options and swap fees and expenses), borrowing costs (such as interest and dividend expense on securities sold short), taxes, expenses incurred in connection with any merger or reorganization, and extraordinary expenses, such as litigation expenses (which may include indemnification of Fund officers and Trustees and contractual indemnification of Fund service providers (other than the adviser)) will not exceed 1.35%, 2.10%, and 1.10% of average daily net assets attributable to Class A, Class C and Class I shares, respectively. These fee waivers and expense reimbursements are subject to possible recoupment from the Fund in future years on a rolling three year basis (within the three years after the fees have been waived or reimbursed) if such recoupment can be achieved within the foregoing expense limits. This agreement may be terminated only by the Fund’s Board of Trustees, on 60 days written notice to the adviser.
Example: This Example is intended to help you compare the cost of investing in the Fund with the cost of investing in other mutual funds. The Example assumes that you invest $10,000 in the Fund for the time periods indicated and then redeem all of your shares at the end of those periods. The Example also assumes that your investment has a 5% return each year and that the Fund’s operating expenses remain the same. Although your actual costs may be higher or lower, based upon these assumptions your costs would be:
Class 1 Year 3 Years 5 Years 10 Years A $714 $1,095 $1,499 $2,626 C $249 $803 $1,384 $2,960 I $149 $500 $875 $1,929
Portfolio Turnover: The Fund pays transaction costs, such as commissions, when it buys and sells securities (or “turns over” its portfolio). A higher portfolio turnover may indicate higher transaction costs and may result in higher taxes when Fund shares are held in a taxable account. These costs, which are not reflected in annual fund operating expenses or in the Example, affect the Fund’s performance. During the most recent fiscal year, the Fund’s portfolio turnover rate was 371% of the average value of its portfolio.

11
Principal Investment Strategies: The Fund’s adviser seeks to achieve the Fund’s investment objective by allocating assets across various sectors of the global equity markets by investing primarily in:
• exchange-traded funds that each invest primarily equity securities and
• put options on the Standard & Poor’s 500 Index, volatility-linked exchange-traded funds and volatility-linked exchange-traded notes for hedging purposes.
The Fund defines equity securities to include both (i) exchange-traded funds (“ETFs”) that invest primarily in common stocks and (ii) put options on the Standard & Poor’s 500 Index. The Fund invests without restriction as to capitalization, country (including emerging markets) or trading currency of the individual equity securities held by the ETFs. However, the Fund is subject to sector limits described below. Under normal market conditions, the Fund invests at least 80% of its assets in equity securities, as defined above. Global Asset Allocation Process The adviser determines global equity sector allocations using its proprietary quantitative relative strength research process. The adviser’s research process seeks an optimal asset allocation targeting equity ETF exposure in three areas. The adviser has defined minimum and maximum allocation parameters in each area to seek to prevent the process from steering portfolio construction into an over-concentrated position. The three areas are:
• U.S. equity markets by issuer capitalization and investment style (20%-80%),
• U.S. equity markets by industry sectors and sub-sectors (5%-50%), and
• foreign equity markets by region and country (10%-80%). The adviser’s proprietary research process is applied to rank investments within each of the three targeted market segments. The issuer capitalization and investment style segment groups issuers by their relative market capitalization (e.g. small, mid or large) and by their investment style (e.g. growth or value). Generally, growth refers to issuers with above-average profit or revenue growth, while value refers to issuers with above-average valuation as measured by price to earnings ratio. The sector and sub-sector segment ranks investments in various subsets of the market that share similar characteristics. Securities in the top two relative strength quartiles are investment candidates subject to further research. A representative ETF is selected for inclusion in the portfolio after it is reviewed for sufficient trading liquidity and its fit within overall portfolio diversification needs. By selecting ETFs using this process, the adviser expects that the Fund will typically hold between 10 and 40 positions. The adviser may engage in frequent buying and selling of securities to achieve the Fund’s investment objective. Hedging Process The adviser applies a hedging strategy to protect the portfolio against significant market declines. The adviser uses a protective put hedging strategy and/or volatility-linked ETFs and/or volatility-linked exchange traded notes (“ETNs”) to hedge the Fund’s equity exposure. In the case of protective puts, the Fund pays a price (referred to as a premium) to purchase a put option that gives the Fund the right to sell a security at a set (strike) price even though the market price may be lower. The protective put strategy is executed using exchange-traded S&P 500 Index put options to hedge the portfolio and to reduce volatility. The protective put strategy seeks to limit downside loss. Generally, S&P 500 put options have an inverse relationship to the S&P 500 Index. In the case of volatility-related hedging, the Fund purchases ETFs and/or ETNs that invest in instruments linked to equity market volatility or the Chicago Board Options Exchange (“CBOE”) Volatility Index (“VIX”) futures. Generally, volatility has an inverse relationship to the S&P 500 Index. The Fund invests in volatility-linked instruments to benefit from the expected negative correlation between volatility and equity market returns. Principal Investment Risks: As with all mutual funds, there is the risk that you could lose money through your investment in the Fund. The Fund is not intended to be a complete investment program. Many factors affect the Fund’s net asset value and performance. The following describes the risks the Fund may bear indirectly through investments in ETFs and ETNs as well as directly through investments in put options.
• Emerging Market Risk: Emerging market countries may have relatively unstable governments, weaker economies, and less-developed legal systems with fewer security holder rights. Emerging market economies may be based on only a few industries and security issuers may be more susceptible to economic weakness and more likely to default. Emerging market securities also tend to be less liquid.

12
• ETF Risk: ETFs are subject to investment advisory and other expenses, which will be indirectly paid by the Fund. As a result, the cost of investing in the Fund will be higher than the cost of investing directly in ETFs and may be higher than other mutual funds that invest directly in stocks. ETFs are subject to specific risks, depending on the nature of the fund.
• ETN Risk: Like ETFs and put options, ETNs are subject to administrative and other expenses, which will be indirectly paid by the Fund. As a result, the cost of investing in the Fund will be higher than the cost of investing directly in ETNs and may be higher than other mutual funds that invest directly in stocks and bonds. Each ETN is subject to specific risks, depending on the nature of the ETN. ETNs are subject to default risks.
• Foreign Investment Risk: Foreign investing, involves risks not typically associated with U.S. investments, including adverse fluctuations in foreign currency values, adverse political, social and economic developments, less liquidity, greater volatility, less developed or less efficient trading markets, political instability and differing auditing and legal standards. Investing in emerging markets imposes risks different from, or greater than, risks of investing in foreign developed countries.
• Leverage/Volatility Risk: The use of leverage, such as that embedded in options, will magnify the Fund’s gains or losses.
• Management Style Risk: The adviser’s dependence on its relative strength research process and judgments about the attractiveness, value and potential appreciation of particular asset classes, ETFs and options in which the Fund invests may prove to be incorrect and may not produce the desired results.
• Market Risk: Overall securities market risks will affect the value of individual instruments in which the Fund invests. Factors such as global economic growth and market conditions, interest rate levels, and political events affect the US and international securities markets. When the value of the Fund’s investments goes down, your investment in the Fund decreases in value and you could lose money.
• Put Option Risk: The Fund may lose the entire premium paid if the underlying index does not decrease in value. Put options on the S&P 500 Index may not be an effective hedge because they may have imperfect correlation to the value of the Fund’s ETFs, many of which may be foreign or representative of sectors outside the S&P 500 Index.
• Small and Medium Capitalization Stock Risk: The value of small or medium capitalization company stocks may be subject to more abrupt or erratic market movements than those of larger, more established companies or the market averages in general.
• Portfolio Turnover Risk: A higher portfolio turnover will result in higher transactional and brokerage costs. Performance: The bar chart and performance table below show the variability of the Fund’s returns, which is some indication of the risks of investing in the Fund. The bar chart shows performance of the Fund’s Class I shares for each full calendar year since the Fund’s inception. Returns for Class A and Class C shares, which are not presented, would be different than the returns for Class I shares. The performance table compares the performance of the Fund over time to the performance of a broad-based securities market index and a supplemental index. You should be aware that the Fund’s past performance (before and after taxes) may not be an indication of how the Fund will perform in the future. Updated performance information will be available at no cost by visiting www.navigatorfunds.com or by calling 1-877-766-2264.
Class I Shares
Annual Total Return For Calendar Years Ended December 31
Best Quarter: First Quarter 2012 6.01% Worst Quarter: Third Quarter 2011 (11.77)%

13
Performance Table Average Annual Total Returns
(For periods ended December 31, 2017)
One Year Five Year
Since Inception
(12/28/10) Return before taxes – Class I Shares 12.03% 5.09% 2.00% Return after taxes on distributions 5.73% 2.98% 0.52% Return after taxes on distributions and sale of Fund shares 7.16% 3.08% 0.94% Return before taxes – Class A Shares 5.66% 3.63% 0.92% Return before taxes – Class C Shares 10.97% 4.05% 0.98% MSCI World Index(1) 22.40% 11.64% 9.63% HFRX Equity Hedge Index(2) 9.98% 3.74% 0.39% (1) The MSCI World Index is a free float-adjusted market capitalization index that is designed to measure global developed market
equity performance consisting of 24 developed market country indices. Investors cannot invest directly in an index or benchmark. (2) The HFRX Equity Hedge Index is designed to be representative of equity hedge strategies which maintain positions both long and short in
primarily equity and equity derivative securities. A wide variety of investment processes can be employed to arrive at an investment decision, including both quantitative and fundamental techniques; strategies can be broadly diversified or narrowly focused on specific sectors and can range broadly in terms of levels of net exposure, leverage employed, holding period, concentrations of market capitalizations and valuation ranges of typical portfolios. The referenced index is shown for general market comparisons and is not meant to represent the Fund. Investors cannot invest in an index; unmanaged index returns do not reflect any fees, expenses or sales charges.
After-tax returns are calculated using the highest historical individual federal marginal income tax rate and do not reflect the impact of state and local taxes. Actual after-tax returns depend on a shareholder’s tax situation and may differ from those shown. The after-tax returns are not relevant if you hold your Fund shares in tax-deferred arrangements, such as 401(k) plans or individual retirement accounts (“IRA”). The after tax returns for Class A and Class C shares are not shown and would differ from those of Class I Shares. Investment Adviser: Clark Capital Management Group, Inc. Portfolio Manager: K. Sean Clark, CFA, Chief Investment Officer of the adviser, has served the Fund as its Portfolio Manager since it commenced operations in 2010. David J. Rights, Director of Research of the adviser, has served the Fund as its Portfolio Manager since inception. Mason Wev, CFA and CMT, is a Portfolio Manager and member of the adviser’s investment committee. He has served the Fund as its Portfolio Manager since inception. Purchase and Sale of Fund Shares: The minimum initial investment in Class A, Class C and Class I shares is $5,000, $5,000 and $25,000, respectively. The minimum subsequent investment in Class A and Class C is $500. Class I shares have no minimum subsequent investment requirement. The Fund reserves the right to waive any minimum. You may purchase and redeem shares of the Fund on any day that the New York Stock Exchange is open. Redemption requests may be made in writing, by telephone, or through a financial intermediary and will be paid by ACH, check or wire transfer. Tax Information: Dividends and capital gain distributions you receive from the Fund, whether you reinvest your distributions in additional Fund shares or receive them in cash, are taxable to you at either ordinary income or capital gains tax rates unless you are investing through a tax-deferred plan such as an IRA or 401(k) plan. Payments to Broker-Dealers and Other Financial Intermediaries: If you purchase the Fund through a broker-dealer or other financial intermediary (such as a bank), the Fund and its related companies may pay the intermediary for the sale of Fund shares and related services. These payments may create a conflict of interest by influencing the broker-dealer or other intermediary and your salesperson to recommend the Fund over another investment. Ask your salesperson or visit your financial intermediary’s website for more information.

14
FUND SUMMARY: NAVIGATOR SENTRY MANAGED VOLATILITY FUND Investment Objective: The Navigator Sentry Managed Volatility Fund (“Managed Volatility” or a “Fund”) seeks negative correlation to the U.S. equity markets, including positive returns in unfavorable equity markets. Fees and Expenses of the Fund: The following table describes the fees and expenses that you may pay if you buy and hold shares of the Fund. You may qualify for sales charge discounts on purchases of Class A shares if you and your family invest, or agree to invest in the future, at least $50,000 in the Fund. More information about these and other discounts is available from your financial professional and in How to Purchase Shares on page 33 of the Fund’s Prospectus and in Purchase, Redemption and Pricing of Shares on page 60 of the Statement of Additional Information.
Shareholder Fees
(fees paid directly from your investment) Class A Shares
Class C Shares
Class I Shares
Maximum Sales Charge (Load) Imposed on Purchases (as a % of offering price) 3.75% None None
Maximum Deferred Sales Charge (Load) (as a % of offering price if redeemed within 18 months) None None None
Maximum Sales Charge (Load) Imposed on Reinvested Dividends and Other Distributions None None None
Redemption Fee None None None Annual Fund Operating Expenses (expenses that you pay each year as a percentage of the value of your investment)
Management Fees 0.85% 0.85% 0.85% Distribution and Service (12b-1) Fees 0.25% 1.00% 0.00% Other Expenses 1.07% 1.07% 1.11%
Interest Expenses 0.06% 0.06% 0.06% Remaining Other Expenses 1.01% 1.01% 1.05%
Acquired Fund Fees and Expenses(1) 0.15% 0.15% 0.15%
Total Annual Fund Operating Expenses 2.32% 3.07% 2.11% Fee Waiver and/ or Expense Reimbursement (2) (0.61)% (0.61)% (0.65)% Total Annual Fund Operating Expenses After Fee Waiver and/or Expense Reimbursement 1.71% 2.46% 1.46%
(1) Acquired Fund Fees and Expenses are the indirect costs of investing in other investment companies. The operating expenses in this fee table will not correlate to the expense ratio in the Fund’s financial highlights because the financial statements include only the direct operating expenses incurred by the Fund.
(2) The adviser has contractually agreed to waive its management fees and to make payments to limit Fund expenses, until January 31, 2019 so that the total annual operating expenses (excluding any front-end or contingent deferred loads, brokerage fees and commissions, acquired fund fees and expenses, fees and expenses associated with instruments in other collective investment vehicles or derivative instruments (including for example options and swap fees and expenses), borrowing costs (such as interest and dividend expense on securities sold short), taxes, expenses incurred in connection with any merger or reorganization, and extraordinary expenses, such as litigation expenses (which may include indemnification of Fund officers and Trustees and contractual indemnification of Fund service providers (other than the adviser)) of the Fund do not exceed 1.50%, 2.25% and 1.25%, for Class A, Class C and Class I shares, respectively. These fee waivers and expense reimbursements are subject to possible recoupment from the Fund in future years on a rolling three year basis (within the three years after the fees have been waived or reimbursed) if such recoupment can be achieved within the foregoing expense limits. This agreement may be terminated only by the Fund’s Board of Trustees, on 60 days’ written notice to the adviser.
Example: This Example is intended to help you compare the cost of investing in the Fund with the cost of investing in other mutual funds. The example assumes that you invest $10,000 in the Fund for the time periods indicated and then redeem all of your shares at the end of those periods. The example also assumes that your investment has a 5% return each year, you reinvest all dividends and capital gains distributions and that the Fund’s operating expenses remain the same. Although your actual costs may be higher or lower, based on these assumptions, your costs would be:
Class 1 Year 3 Years 5 Years 10 Years A $542 $1,016 $1,516 $2,886 C $249 $891 $1,558 $3,341 I $149 $598 $1,074 $2,390

15
Portfolio Turnover: The Fund pays transaction costs, such as commissions, when it buys and sells securities (or “turns over” its portfolio). A higher portfolio turnover may indicate higher transaction costs and may result in higher taxes when Fund shares are held in a taxable account. These costs, which are not reflected in annual fund operating expenses or in the Example, affect the Fund’s performance. During the most recent fiscal period, the Fund’s portfolio turnover rate was 0% of the average value of its portfolio. Principal Investment Strategies: The Fund seeks to provide protection against declines in the value of a shareholder’s portfolio of equity investments. The Fund generally seeks negative correlation to the U.S. equity markets, in order to obtain positive returns in an unfavorable equity market. To achieve its investment objective, the Fund may invest in options on securities and stock indexes (including index put-options), swaps, futures, structured notes, underlying funds including hedge funds, closed end funds, exchange traded funds (“ETFs”) and other mutual funds (collectively, “Underlying Funds”), exchange traded products including exchange traded notes (“ETN”), cash, cash equivalents, short term market instruments, and money market funds. In addition, the Fund may also use various options strategies that involve a combination of both put and call options. The Fund’s decision regarding whether to utilize specific strategies will depend upon an evaluation of the available options, swaps, futures, Underlying Funds, ETNs or structured notes or other securities, and market conditions, which will dictate to what extent the Fund focuses on its hedging strategies. The Fund will reduce its exposure to hedging strategies in an up market to minimize the costs of providing market protection. Hedging Process and Strategies The adviser views stock market volatility as though it were an asset class, which is a key element to the portfolio’s risk management. The adviser allocates a portion of the Fund’s portfolio to hedging strategies on a systematic basis. As such, the adviser examines a series of volatility products and analyses potential market environments, to determine whether there exists a consistently advancing market, a declining market, or a low volatility-flat market. The adviser seeks to optimize the hedging portfolio by seeking negative correlation to any given market environment. The Fund’s hedging strategies are expected to increase in value as the overall equity markets decline, providing downside protection to the U.S. equity markets. However, the value of your investment in the Fund generally will decrease when the broad-based equity market appreciates, or is unchanged. The adviser will manage the Fund and increase its allocation to investments in hedging strategies when the market declines. Conversely, when the markets make a significant move to the upside, the adviser will typically re-allocate a larger percentage of the portfolio to cash or cash equivalents to optimize risk management and preserve capital. The Fund is non-diversified, which means that it can invest a greater percentage of its assets in any one issuer than a diversified fund. The Adviser may each engage in active and frequent trading to achieve the Fund’s investment objective. Principal Investment Risks: As with all mutual funds, there is the risk that you could lose money through your investment in the Fund. The Fund is not intended to be a complete investment program. Many factors affect the Fund’s net asset value and performance.
• Derivatives Risk – The Fund’s use of derivative instruments, including options, swaps, and futures contracts involves hedging, leverage risk and tracking risk (the derivatives may not track the volatility of the underlying volatility index).
• Hedging Risk – Although derivative instruments are intended to be used to offset or hedge against losses on an opposite position, such hedges can also potentially offset any gains on the opposite position. The Fund may also be exposed to the risk it may be required to segregate assets or enter into offsetting positions in connection with investments in derivatives, but such segregation will not limit the Fund’s exposure to loss. The Fund may also incur risk with respect to the segregated assets to the extent that, but for the applicable segregation requirement in connection with its investments in derivatives, the Fund would sell the segregated assets.
• Issuer-Specific Risk – The value of a specific security in which the Fund invests, or underlying security related to a derivative in which the Fund invests, can be more volatile than the market as a whole and can perform differently from the value of the market as a whole.
• Leverage/Volatility Risk – The Fund’s use of leverage through futures, options, short positions, or inverse ETFs will magnify the Fund’s gains or losses.
• Liquidity Risk – At times the Fund may be constrained in its ability to use derivatives by an unanticipated inability to close positions when it would be most advantageous.

16
• Management Style Risk – The Adviser’s judgments about the potential appreciation of a particular security in which the Fund invests, or its judgments about the market as a whole, may prove to be incorrect.
• Non-Diversification Risk – As a non-diversified fund, the Fund may invest more than 5% of its total assets in the securities of one or more issuers. The Fund’s performance may be more sensitive to any single economic, business, political or regulatory occurrence than the value of shares of a diversified investment company.
• Options Risk - The Fund may lose the entire put or call option premium paid if the reference asset or index does not decrease below or rise above the respective strike price before expiration. Options may not be an effective hedge because they may have imperfect correlation to the value of the Fund’s assets.
• Portfolio Turnover Risk – A higher portfolio turnover may result in higher transactional and brokerage costs.
• Short Selling and Short Position Risk – The Fund may invest in short futures or option positions and inverse ETFs which will prevent the Fund from participating in market gains. The Fund will be adversely affected by stock market gains of the underlying security which is held short.
• Stock Market Risk – Equity prices can fall rapidly in response to developments affecting a specific company or industry, or to changing economic, political or market conditions. Because of the Fund’s principal investment strategies, positive movements in the market may negatively impact the Fund.
• Structured Notes Risk – Structured notes involve tracking risk, issuer default risk and may involve leverage risk.
• Underlying Funds Risk - Underlying Funds in which the Fund invests are subject to investment advisory fees and other expenses, which will be indirectly paid by the Fund. As a result, the cost of investing in the Fund will be higher than the cost of investing directly in the Underlying Funds and may be higher than other mutual funds that invest directly. Each of the Underlying Funds is subject to specific risks, depending on the nature of the fund.
o Inverse ETFs are designed to rise in price when stock prices are falling. Inverse ETFs tend to limit the Fund’s participation in overall market-wide gains. Accordingly, their performance over longer terms can perform very differently than underlying assets and benchmarks, and volatile markets can amplify this effect.
Performance: The bar chart and performance table below show the variability of the Fund’s returns, which is some indication of the risks of investing in the Fund. The bar chart shows performance of the Fund’s Class I shares for each full calendar year since the Fund’s inception. Returns for Class A and Class C shares, which are not presented, would be different than the returns for Class I shares. The performance table compares the performance of the Fund over time to the performance of a broad-based securities market index. You should be aware that the Fund’s past performance (before and after taxes) may not be an indication of how the Fund will perform in the future. Updated performance information is available at no cost by calling 1-877-766-2264 or visiting www.navigatorfunds.com.
Class I Shares
Annual Total Return For Calendar Years Ended December 31
Best Quarter: Third Quarter 2015 4.73% Worst Quarter: Third Quarter 2017 (22.66)%

17
Performance Table Average Annual Total Returns
(For periods ended December 31, 2017)
One Year
Since Inception (3/6/2014)
Return before taxes – Class I Shares (55.28)% (37.99)% Return after taxes on distributions (55.28)% (37.99)% Return after taxes on distributions and sale of Fund shares (31.29)% (23.42)% Return before taxes – Class A Shares (56.99)% (38.71)% Return before taxes – Class C Shares (55.28)% (37.99)% S&P 500 Inverse Daily Index (1) (16.58)% (11.24)%
(1) The S&P 500 Inverse Daily Index provides inverse (positive or negative) returns of the S&P 500® by taking a short position in the index. Investors cannot invest directly in an index or benchmark.
After-tax returns are calculated using the highest historical individual federal marginal income tax rate and do not reflect the impact of state and local taxes. Actual after-tax returns depend on a shareholder’s tax situation and may differ from those shown. The after-tax returns are not relevant if you hold your Fund shares in tax-deferred arrangements, such as 401(k) plans or individual retirement accounts (“IRA”). The after tax returns for Class A and Class C shares are not shown and would differ from those of Class I Shares. Investment Adviser: Clark Capital Management Group, Inc. Portfolio Manager: K. Sean Clark, CFA, Chief Investment Officer of the adviser, has served the Fund as its Portfolio Manager since it commenced operations in 2014. Purchase and Sale of Fund Shares: The minimum initial investment in Class A, Class C and Class I shares is $5,000, $5,000 and $25,000, respectively. The minimum subsequent investment in Class A and Class C is $500. Class I shares have no minimum subsequent investment requirement. The Fund reserves the right to waive any minimum. You may purchase and redeem shares of the Fund on any day that the New York Stock Exchange is open. Redemption requests may be made in writing, by telephone, or through a financial intermediary and will be paid by ACH, check or wire transfer. Tax Information: Dividends and capital gain distributions you receive from the Fund, whether you reinvest your distributions in additional Fund shares or receive them in cash, are taxable to you at either ordinary income or capital gains tax rates unless you are investing through a tax-deferred plan such as an IRA or 401(k) plan. However, these dividend and capital gain distributions may be taxable upon their eventual withdrawal from tax-deferred plans. Payments to Broker-Dealers and Other Financial Intermediaries: If you purchase the Fund through a broker-dealer or other financial intermediary (such as a bank), the Fund and its related companies may pay the intermediary for the sale of Fund shares and related services. These payments may create a conflict of interest by influencing the broker-dealer or other intermediary and your salesperson to recommend the Fund over another investment. Ask your salesperson or visit your financial intermediary’s website for more information.

18
ADDITIONAL INFORMATION ABOUT PRINCIPAL INVESTMENT STRATEGIES AND RELATED RISKS Investment Objective
Fund Investment Objective Navigator Tactical Fixed Income Fund The Fund seeks total return with a secondary goal of current income. Navigator Duration Neutral Bond Fund The Fund seeks to maximize total return, which is comprised of
income and capital appreciation, while hedging interest rate exposure. Navigator Equity Hedged Fund The Fund seeks long-term capital appreciation. Navigator Sentry Managed Volatility Fund The Fund seeks negative correlation to the U.S. equity markets,
including positive returns in unfavorable equity markets. The investment objectives of Navigator Tactical Fixed Income Fund, Navigator Duration Neutral Bond Fund, Navigator Equity Hedged Fund, and Navigator Sentry Managed Volatility Fund (collectively the “Funds”) may be changed without shareholder approval by the Trust’s Board of Trustees upon 60 days written notice to shareholders. The 80% investment policy of each of the Navigator Tactical Fixed Income Fund, Navigator Duration Neutral Bond Fund, and Navigator Equity Hedged Fund may be changed without shareholder approval by the Board of Trustees upon 60 days written notice to shareholders. Principal Investment Strategies Navigator Tactical Fixed Income Fund In seeking to achieve its investment objective, the Fund will invest, under normal circumstances, at least 80% of its assets, defined as net assets plus the amount of any borrowings for investment purposes, in long and/or short positions in fixed income securities in accordance with its 80% investment policy. The Fund may invest in Underlying Funds, including inverse ETFs, money market funds which invest primarily in T-bills, individual bonds, options, futures, swaps, structured notes and other fixed income securities. The Fund may also invest in credit default swap indexes (“CDX”), a credit derivative used to hedge credit risk and/or take a position on a basket of credit entities. Unlike a credit default swap, which is an over the counter derivative, a CDX may be exchange traded, or sold over the counter. Each CDX is designed to track a basket of credit entities, which may be standard or customized. This means that it may be more liquid than a credit default swap, and it may be cheaper to hedge the Fund’s portfolio with a CDX than it would be to buy many single name credit default swaps to achieve a similar effect. The Fund may also purchase or sell total return swaps. The Fund’s strategy is primarily driven by a modeling process which analyzes the relative strength of various fixed income securities relative to one another based upon comparative historical momentum. This relative strength research process used to drive the Fund’s allocation seeks to identify the fixed income sectors that are exhibiting the strongest relative strength. The research is done on a daily basis and serves as both the buy and sell discipline of the Fund’s investments. Additional analysis is done at the security level, such as liquidity, yield, and valuation analysis, to balance risk and reward and optimize the Fund’s holdings. It is an unconstrained tactical approach which the adviser believes provides the Fund with the ability to be flexible and opportunistic when the fixed income markets experience volatility. The adviser’s process uses relative strength models to determine the Fund’s allocation among high yield, intermediate to long-term Treasuries, and T-bills. That analysis assists the adviser to determine the preferred asset class, which in turn drives the individual security selection. Thus, when the high yield asset class is favored, the Fund will invest in other high yield mutual funds, ETFs, individual high yield securities, preferred stocks, and synthetic high yield investments. Conversely, when the favored asset class is Treasuries, the adviser will sell and/or hedge the Fund’s high yield exposure and increase the Fund’s exposure to Treasuries through bonds, notes, money market funds which invest primarily in T-bills, ETFs and synthetic investments designed to do so. The Fund may also invest in equity securities or futures from time to time, to replicate the credit component of high yield corporate bonds. The basic structure of the High Yield corporate bond market tends to have two major components: interest rate risk and credit risk. The credit component tends to be correlated with equity prices, allowing the Fund to use equity investments as a hedge, or as a means to replace the credit component of the risk of High Yield bonds. The Fund may hold individual stocks or baskets of stocks short, invest in futures, or enter into puts or put spreads on individual stocks or equity indices to replicate the credit component of high-yield corporate bonds. The Fund is non-diversified, which means that it can invest a greater percentage of its assets in any one issuer than a diversified fund. The adviser may each engage in active and frequent trading to achieve the Fund’s investment objective.

19
Navigator Duration Neutral Bond Fund Under normal circumstances, the Fund invests at least 80% of its assets (defined as net assets plus any borrowing for investment purposes) in bond instruments. The Fund invests primarily in municipal bond instruments. The Fund intends to be “duration neutral”, meaning it seeks to provide exposure to the municipal bond market while protecting against loss of principal when interest rates rise. The Fund defines bond instruments to include municipal bonds and U.S. Treasury bonds and notes and municipal bonds; derivatives based on bonds, such as futures or options on U.S. Treasury bonds and notes; and Underlying Funds that invest primarily in municipal bonds. The Fund will invest primarily in municipal bond instruments which are investment grade (rated at least Baa3 or higher by Moody’s, BBB- or higher by Standard & Poor’s, or BBB- or higher by Fitch Ratings and considered tax advantaged at the time of purchase. However, the Fund may invest in municipal bond instruments that provide taxable income, and the tax status of municipal bonds are subject to change. The Fund may invest in municipal bonds of any maturity. The 80% investment policy can be changed without shareholder approval, however, shareholders would be given at least 60 days’ notice prior to any such change. Duration is the measure of a bond’s sensitivity to interest rate risk changes. Generally the longer the duration, the more sensitive a bond is to interest rate changes. The Fund expects to maintain municipal bond investments with a positive duration. The Fund also expects to maintain short exposures to hedge instruments, such as Treasury bond futures, options and, from time to time, other investments such as inverse or leveraged ETFs that have a net inverse (negative) duration. By maintaining both long and short positions, the Fund expects to be able to isolate and neutralize price shifts resulting from changing interest rates, so that the Fund is duration neutral. The Fund seeks to hedge the portion of the value of its municipal bond instruments subject to interest rate risk through investments in:
• U.S. Treasury Bonds and Notes;
• Futures and Options on U.S. Treasury Bonds and Notes;
• Futures and Options on LIBOR Swaps; and
• other mutual funds, exchange traded funds (“ETFs”) or closed-end funds (collectively, “Underlying Funds”), including inverse or leveraged ETFs.
Bond Selection The adviser uses a trading strategy based on its proprietary technical trend-following model to take advantage of trends and momentum in the municipal bond market. Using this model the sub-adviser expects the Fund to invest in securities of a particular municipal bond market or category when trends are favorable or, conversely, sell securities in that bond market or category when trends are unfavorable. The sub-adviser expects to invest in bonds issued throughout the U.S. with various maturities. The selection of each municipal bond investment is subject to a 4-step investment process that includes: quantitative reviews of the instrument’s structure, credit of the issuer, and further analysis of other investment metrics. The portfolio managers then calculate an option-adjusted duration and option-adjusted risk value to determine the effect of an hedge, prior to making the investment. Many municipal bonds currently trade in the marketplace at prices above their redemption value, exposing investors to deterioration of principal. By hedging against rising interest rates, the Fund seeks to avoid loss of principal from rising interest rates. Riskless Rate Offset The adviser believes every bond has embedded in its value a riskless interest rate and it uses a proprietary method of evaluating the amount of riskless interest rate for the base currency (U.S. Dollar) embedded in the municipal bond holdings of the Fund, then expects to offset its determination of interest rate risk through the sale of one of a series of instruments that exemplifies this riskless rate, like U.S. Treasury Bond futures contracts that trade on the CME. By hedging against the risk of rising interest rates through its duration neutral approach, the Fund seeks to avoid principal loss when interest rates rise. Municipal bonds generally pay a tax advantaged interest rate. This will create some natural tax efficiency, though the Fund will focus on its proprietary investment model for investment decisions, not on tax ramifications of particular municipal bonds. By selecting investments using these processes, the adviser expects that the Fund will typically hold between 10 and 100 positions with more positions to be added as the Fund’s assets grow. The adviser may engage in frequent buying and selling of securities to achieve the Fund’s investment objective.

20
The Fund may borrow money from banks to help manage Fund inflows and outflows, such as to avoid having to sell portfolio investments in order to meet net redemptions. The Fund also may borrow money from banks to make additional portfolio investments when the adviser believes market conditions are appropriate. The Fund may borrow an amount equal to as much as one-third of the value of its total assets (which includes the amount borrowed). Navigator Equity Hedged Fund The Fund’s adviser seeks to achieve the Fund’s investment objective by allocating assets across various sectors of the global equity markets by investing primarily in:
• exchange-traded funds (“ETFs”) that each invest primarily equity securities and
• put options on the Standard & Poor’s 500 Index, volatility-linked exchange-traded funds and volatility-linked exchange-traded notes for hedging purposes.
The Fund defines equity securities to include both (i) ETFs that invest primarily in common stocks and (ii) put options on the Standard & Poor’s 500 Index. The Fund invests without restriction as to capitalization, country (including emerging markets) or trading currency of the individual equity securities held by the ETFs. However, the Fund is subject to sector limits described below. Under normal market conditions, the Fund invests at least 80% of its assets in equity securities, as defined above. Global Asset Allocation Process The adviser determines global equity sector allocations using its proprietary quantitative relative strength research process. The adviser’s research process seeks an optimal asset allocation targeting equity ETF exposure in three areas. The adviser has defined minimum and maximum allocation parameters in each area to seek to prevent the process from steering portfolio construction into an over-concentrated position. The three areas are:
• U.S. equity markets by issuer capitalization and investment style (20%-80%),
• U.S. equity markets by industry sectors and sub-sectors (5%-50%), and
• foreign equity markets by region and country (10%-80%) The adviser’s proprietary research process is applied to rank investments within each of the three targeted market segments. The issuer capitalization and investment style segment groups issuers by their relative market capitalization (e.g. small, mid or large) and by their investment style (e.g. growth or value). Generally, growth refers to issuers with above-average profit or revenue growth, while value refers to issuers with above-average valuation as measured by price to earnings ratio. The sector and sub-sector segment ranks investments in various subsets of the market that share similar characteristics. Securities in the top two relative strength quartiles are investment candidates subject to further research. A representative ETF is selected for inclusion in the portfolio after it is reviewed for sufficient trading liquidity and its fit within overall portfolio diversification needs. By selecting ETFs using this process, the adviser expects that the Fund will typically hold between 10 and 40 positions. The adviser may engage in frequent buying and selling of securities to achieve the Fund’s investment objective. Hedging Process The adviser views stock market volatility as though it were an asset class, which is a key element to the portfolio’s risk management. The adviser uses a protective put hedging strategy and/or volatility-linked ETFs and/or volatility-linked exchange traded notes (“ETNs”) to hedge the Fund’s equity exposure. As such, the adviser examines a series of put options and analyses 3 possible market scenarios (1) consistent advancing market, (2) declining market and (3) low volatility-flat market. S&P 500 Index put options are usually purchased with strike prices 5-10% below the current market price, usually expiring after 9 to 18 months. The adviser will manage this allocation to preserve capital and take profits when the opportunity presents itself. In addition, when the markets make a significant move to the upside the adviser will typically re-allocate the S&P 500 Index put options to optimize risk management. The protective put serves to limit downside loss because the put rises in value when the S&P 500 Index falls and the put gives the Fund the right to sell S&P 500 Index shares at the put’s strike price until or when the option expires. Specifically, S&P 500 Index shares are not actually sold but rather a cash payment is made to the Fund for the difference between the strike price and the level of the index. Generally, the put options are expected to provide protection against overall equity market declines even though the Fund holds ETFs representing equities, including foreign equities that are not included in the S&P 500 Index. In the case of volatility-related hedging, the Fund purchases ETFs and/or ETNs that invest in instruments linked to equity market volatility or the Chicago Board Options Exchange (“CBOE”) Volatility Index (“VIX”) futures. Generally, volatility has an inverse relationship to the S&P 500 Index. The Fund invests in volatility-linked instruments to benefit from the expected negative correlation between volatility and equity market returns.

21
Navigator Sentry Managed Volatility Fund The Fund seeks to provide long-term total return consistent with certain volatility indices to hedge against losses in the U.S. equity markets. The Fund may invest in options on securities and stock indexes, cash, index put-options, swaps, futures, structured notes, underlying funds including hedge funds, closed end funds, exchange traded funds (“ETFs”), inverse ETFs, and other mutual funds (collectively, “Underlying Funds”), and exchange traded products including exchange traded notes (“ETNs”), and cash equivalents and short term market instruments, money market funds. In addition, the Fund may also use various options strategies that involve combinations of both put and call options. The Fund’s decision regarding whether or not to utilize specific strategies will depend upon an evaluation of market conditions and the relative pricing of available investments. The Fund investments are negatively correlated to the volatility of broad U.S. equity markets; such volatility strategies are used as a hedging tool against declining equity markets. Hedging Process and Strategies The adviser views stock market volatility as though it were an asset class, which is a key element to the portfolio’s risk management. The adviser allocates a portion of the Fund’s portfolio to hedging strategies on a systematic basis, based upon its market trend analysis. The adviser utilizes fundamental research and quantitative tools to gauge market trends and determine how much of the portfolio should be allocated to various hedging strategies. As such, the adviser examines a series of volatility products and analyses potential market environments to determine whether there exists a consistently advancing market, a declining market, or a low volatility-flat market. The adviser seeks to optimize the portfolio for the given market environment and invest the portfolio in a combination of options, futures, structured notes, exchange traded notes, or Underlying Funds accordingly. The adviser will manage this allocation to preserve capital and take profits when the opportunity presents itself. In addition, when the markets make a significant move to the upside the adviser will typically re-allocate a portion of the portfolio to cash or cash equivalents such as short-term treasuries or money market funds to optimize risk management and preserve capital. Generally, the volatility strategies are expected to increase in value when the overall equity markets declines, providing downside protection to an investor’s equity allocations in other funds or investments. The Fund is non-diversified, which means that it can invest a greater percentage of its assets in any one issuer than a diversified fund. The Adviser may each engage in active and frequent trading to achieve the Fund’s investment objective. Principal Investment Risks
• Credit Default Swap Risk (Tactical Fixed Income only) – The Fund may invest in credit default swaps (“CDS”) which require the Adviser to forecast, among other things, the likelihood of credit event for a securities issuer. Such forecasting is inherently difficult and entails investment risk. The use of CDS involves investment techniques and risks different from those associated with ordinary portfolio security transactions. There is no guarantee that the Fund will be able to eliminate its exposure under an outstanding CDS by entering into an offsetting swap, and the Fund may not assign a swap without the consent of the counterparty to it. In addition, each CDS exposes the Fund to counterparty risk and the adviser may determine to concentrate any or all of its CDS in a single counterparty or small group of counterparties. If a counterparty defaults, the Fund’s only recourse would be to pursue contractual remedies against the counterparty and the Fund may be unsuccessful in such pursuit. The Fund thus assumes the risk that it may be delayed in or prevented from obtaining payments owed to it pursuant to a CDS. In addition to counterparty risks, CDS are subject to credit risk on the underlying investment. If the Fund were the buyer of a CDS and no event of default occurred, the Fund would lose its entire investment. Similarly, if the Fund were the seller of a CDS and an event of default occurred, it would be required to pay its counterparty the value of the CDS, which may cause the Fund to incur a loss on the CDS transaction.
• CDX Risk (Tactical Fixed Income only) – A CDX is subject to the risks of the underlying credit default swap obligations, which include risks such as concentration risk and counterparty risk, and operational risk. Concentration risk refers to the certain large institutional buyers may take large positions in credit default swaps, and the failure of such a buyer could materially adversely affect the credit default swap market as a whole. Counterparty risk refers to the risk that the counterparty to the swap will default on its obligation to pay. Certain index-based credit default swaps are structured in tranches, whereby junior tranches assume greater default risk than senior tranches. Once fully implemented, new regulations may make swaps more costly, may limit their availability, or may otherwise adversely affect the value or performance of these instruments. The extent and impact of these regulations are not yet fully known and may not be for some time.
• Correlation Risk (Duration Neutral Bond only) – Municipal bonds on one hand, and treasury bonds or options or futures on treasury bonds and LIBOR swaps on the other hand, may experience a lack of correlation. Such a lack of correlation might occur due to factors unrelated to the value of the investments, such as speculative or other pressures on the markets in which these instruments are traded. The Fund can be adversely affected by times where municipal interest rates rise and the Fund’s interest rate hedges decline in value.

22
• Credit Risk (Tactical Fixed Income and Duration Neutral Bond) – There is a risk that issuers will not make interest and/or principal payments or otherwise be unable to honor a financial obligation, resulting in losses to the Funds. In addition, the credit quality of fixed income securities may be lowered if an issuer’s financial condition changes or the issuer is likely to default. Lower credit quality may lead to greater volatility in the price of a security and in shares of the Funds. Lower credit quality also may affect liquidity and make it difficult to sell the security. Default, or the market’s perception that an issuer is likely to default, could reduce the value and liquidity of securities held by the Funds, thereby reducing the value of your investment in shares of the Funds. In addition, default may cause the Funds to incur expenses, directly or indirectly, in seeking recovery of principal or interest on its portfolio holdings. These risks are more pronounced for securities with lower credit quality, such as those rated in the BB category by S&P. Securities are subject to varying degrees of credit risk, which are often reflected in credit ratings.
• Derivatives Risk (Tactical Fixed Income, Duration Neutral Bond, and Managed Volatility) – Derivative securities are subject to changes in the underlying securities or indices on which such transactions are based. There is no guarantee that the use of derivatives for investment or hedging purposes will be effective or that suitable transactions will be available. Derivatives such as futures, options, options on futures, swaps and structured notes involve risks different from, or possibly greater than, the risks associated with investing directly in securities and other traditional investments. These risks include (i) the risk that the counterparty to a derivative transaction may not fulfill its contractual obligations; (ii) risk of mispricing or improper valuation; and (iii) the risk that changes in the value of the derivative may not correlate perfectly with the underlying asset, rate or index. Derivative prices are highly volatile and may fluctuate substantially during a short period of time. Such prices are influenced by numerous factors that affect the markets, including, but not limited to: changing supply and demand relationships; government programs and policies; national and international political and economic events, changes in interest rates, inflation and deflation and changes in supply and demand relationships. Even a small investment in derivatives (which include options, futures and swap contracts) may give rise to leverage risk, and can have a significant impact on the Funds’ exposure to securities markets values and interest rates. Trading derivative instruments involves risks different from, or possibly greater than, the risks associated with investing directly in securities including:
o Leverage and Volatility Risk – Derivative contracts ordinarily have leverage inherent in their terms. The low margin deposits, if any, normally required in trading derivatives permit a high degree of leverage. Accordingly, a relatively small price movement may result in an immediate and substantial loss. The use of leverage may also cause a Fund to liquidate portfolio positions when it would not be advantageous to do so in order to satisfy its obligations or to meet collateral requirements. The use of leveraged derivatives can amplify the effects of market volatility on the Funds’ share price.
o Liquidity Risk – Although it is anticipated that the swaps and options traded will be actively traded, it is possible that particular investments might be difficult to purchase or sell, possibly preventing the Funds from executing positions at an advantageous time or price, or possibly requiring them to dispose of other investments at unfavorable times or prices in order to satisfy their obligations. Buying and selling put and call options can be more speculative than investing directly in securities.
o Tracking Risk – Swap and option contracts may not be perfect substitutes for the securities they are intended to track or hedge. Factors such as differences in supply and demand for certain derivatives may cause their returns to deviate from the adviser’s expectations. Consequently, derivative returns may not be highly correlated to the securities they are intended to hedge. The Funds could lose its entire investment in an option contract. Option contracts will expire worthless if the reference security or index is below its strike price in the case of call options or above in the case of put options.
o Total Return and Interest Rate Swap Risk – In a total return swap, the buyer receives a periodic return equal to the total return of a specified security, securities or index, for a specified period of time. In return, the buyer pays the counterparty a variable stream of payments, typically based upon short term interest rates, possibly plus or minus an agreed upon spread. Interest rate swaps are financial instruments that involve the exchange of one type of interest rate for another type of interest rate cash flow on specified dates in the future. Like a traditional investment in a debt security, the Funds could lose money by investing in an interest rate swap if interest rates change adversely. For example, if the Funds enter into a swap where it agrees to exchange a floating rate of interest for a fixed rate of interest, the Funds may have to pay more money than it receives. Interest rate and total return swaps entered into in which payments are not netted may entail greater risk than a swap entered into a net basis. There is a risk that adverse price movements in an instrument can result in a loss substantially greater than the Funds’ initial investment in that instrument (in some cases, the potential loss is unlimited). If there is a default by the other party to such a transaction, the Funds will have contractual remedies pursuant to the agreements related to the transaction. However, particularly in the case of privately-negotiated instruments, there is a risk that the counterparty will not perform its obligations, which could leave the Funds worse off than if it had not entered into the position. These instruments are subject to high levels of volatility, in some cases due to the high levels of leverage the Funds may achieve with them.

23
• Emerging Market Risk (Equity Hedged only) – The Fund may invest a portion of its assets in countries with newly organized or less developed securities markets. There are typically greater risks involved in investing in emerging markets securities. Generally, economic structures in these countries are less diverse and mature than those in developed countries and their political systems tend to be less stable. Emerging market economies may be based on only a few industries, therefore security issuers, including governments, may be more susceptible to economic weakness and more likely to default. Emerging market countries also may have relatively unstable governments, weaker economies, and less-developed legal systems with fewer security holder rights. Investments in emerging markets countries may be affected by government policies that restrict foreign investment in certain issuers or industries. The potentially smaller size of their securities markets and lower trading volumes can make investments relatively illiquid and potentially more volatile than investments in developed countries, and such securities may be subject to abrupt and severe price declines. Due to this relative lack of liquidity, the Fund may have to accept a lower price or may not be able to sell a portfolio security at all. An inability to sell a portfolio position can adversely affect the Fund’s value or prevent the Fund from being able to meet cash obligations or take advantage of other investment opportunities.
• Equity Securities Risk (Tactical Fixed Income only) – Although the Fund will invest primarily in fixed income securities, a portion of its portfolio may be invested in equity securities, including common stock, which are susceptible to general stock market fluctuations and to volatile increases and decreases in value as market confidence in and perceptions of their issuers change. An equity security, or stock, represents a proportionate share of the ownership of a company; its value is based on the success of the company’s business, any income paid to stockholders, the value of its assets and general market conditions. Common stocks and preferred stocks are examples of equity securities. While both represent proportional share ownership of a company, preferred stocks often pay dividends at a specific rate and have a preference over common stocks in dividend payments and liquidation of assets. The Fund may invest a portion of its assets in warrants and rights, which gives holders a right to purchase at any time during a specified period a predetermined number of shares of common stock at a fixed price. Unlike convertible debt securities or preferred stock, warrants and rights do not pay a fixed coupon or dividend. Investments in warrants and rights involve certain risks, including the possible lack of liquidity, potential price fluctuations as a result of speculation or other factors, and failure of the price of the underlying stock to reach or have reasonable prospects of reaching a level at which the warrant or right can be prudently exercised (in which event the warrant or right may expire without being exercised, resulting in a loss of the Fund’s entire investment).
• ETF Risk (Equity Hedged only) – Your cost of investing in the Fund will be higher than the cost of investing directly in ETFs and may be higher than other mutual funds that invest directly in stocks. You will indirectly bear fees and expenses charged by the ETFs in addition to the Fund’s direct fees and expenses. Investment in the Fund should be made with the understanding that the ETFs in which the Fund invests will not be able to replicate exactly the performance of the indices, if any, they track because the total return generated by the securities will be reduced by transaction costs incurred in adjusting the actual balance of the securities. In addition, the ETFs in which the Fund invests will incur expenses not incurred by their applicable indices. Certain securities comprising the indices tracked by the ETFs may, from time to time, temporarily be unavailable, which may further impede the ETFs’ ability to track their applicable indices. Investment advisers of ETFs may make investment decisions that are detrimental to the performance of the Fund. The market value of ETF shares may differ from their net asset value. This difference in price may be due to the fact that the supply and demand in the market for fund shares at any point in time is not always identical to the supply and demand in the market for the underlying basket of securities. Accordingly, there may be times when shares trade at a premium or discount to net asset value. Each ETF is subject to specific risks, depending on the nature of the fund. These risks could include liquidity risk, sector risk, and foreign currency risk.
• ETN Risk – Your cost of investing in the Fund will be higher than the cost of investing directly in ETNs and also may be higher than other mutual funds that invest directly in stocks and bonds. You will indirectly bear fees and expenses charged by the ETNs, which are similar to those charged by ETFs, in addition to the Fund’s direct fees and expenses. Investment in the Fund should be made with the understanding that the ETNs in which the Fund invests will not be able to replicate exactly the performance of the indices they track, if any, because the total return generated by the securities or indices will be reduced by transaction and other costs incurred by the ETNs. Certain securities or indices tracked by the ETNs may, from time to time, temporarily be unavailable, which may further impede the ETNs’ ability to achieve intended investment results. The value of an ETN may vary and may be influenced by time to maturity, level of supply and demand for the ETN, lack of liquidity in underlying security markets, changes in the applicable interest rates, changes in the issuer’s credit rating, and economic, legal, political, or events that affect the securities markets generally. The Fund’s decision to sell its ETN holdings may be limited by the availability of a secondary market.
• Fixed Income Risk (Tactical Fixed Income and Duration Neutral Bond) – When the Funds invests in fixed income securities or derivatives, the value of your investment in the Funds will fluctuate with changes in interest rates. Typically, a rise in interest rates causes a decline in the value of fixed income securities or derivatives owned by the Funds. In general, the market price of debt securities with longer maturities will increase or decrease more in

24
response to changes in interest rates than shorter-term securities. Other risk factors include credit risk (the debtor may default) and prepayment risk (the debtor may pay its obligation early, reducing the amount of interest payments). These risks could affect the value of a particular investment by the Funds possibly causing the Funds’ share price and total return to be reduced and fluctuate more than other types of investments.
• Foreign Investment Risk (Equity Hedged only) – Foreign investing involves risks not typically associated with U.S. investments, including adverse fluctuations in foreign currency values, adverse political, social and economic developments, less liquidity, greater volatility, less developed or less efficient trading markets, political instability and differing auditing and legal standards. Investing in emerging markets imposes risks different from, or greater than, risks of investing in foreign developed countries.
o Foreign Currency Risk – Currency market risk results from the price movement of foreign currency values in response to shifting market supply and demand. Interest rate risk arises whenever a country changes its stated interest rate target associated with its currency. Country risk arises because virtually every country has interfered with international transactions in its currency. Interference has taken the form of regulation of the local exchange market, restrictions on foreign investment by residents or limits on inflows of investment funds from abroad. Restrictions on the exchange market or on international transactions are intended to affect the level or movement of the exchange rate. This risk could include the country issuing a new currency, effectively making the “old” currency worthless.
• Government-Sponsored Entities Risk (Tactical Fixed Income only) – The Fund may invest in securities issued or guaranteed by government-sponsored entities, including Government National Mortgage Association (“GNMA”), Federal National Mortgage Association (“FNMA”) and Federal Home Loan Mortgage Corporation (“FHLMC”). However, these securities may not be guaranteed or insured by the U.S. Government and may only be supported by the credit of the issuing agency.
• Hedging Risk (Tactical Fixed Income and Managed Volatility) – When the adviser believes market conditions are unfavorable, the adviser may attempt to “hedge” with defensive positions and strategies including, for example, holding substantial positions in lower-yield fixed-income securities and/or cash equivalents, which may limit potential gains when compared to unhedged funds.
• High-Yield Bond Risk (Tactical Fixed Income only) – Lower-quality bonds, known as high-yield bonds or “junk bonds,” present a significant risk for loss of principal and interest. These bonds offer the potential for higher return, but also involve greater risk than bonds of higher quality, including an increased possibility that the bond’s issuer, obligor or guarantor may not be able to make its payments of interest and principal (credit quality risk). If that happens, the value of the bond may decrease, and the Fund’s share price may decrease and its income distribution may be reduced. An economic downturn or period of rising interest rates (interest rate risk) could adversely affect the market for these bonds and reduce the Fund’s ability to sell its bonds (liquidity risk). The lack of a liquid market for these bonds could decrease the Fund’s share price.
• Inflation-Indexed Securities Risk (Duration Neutral Bond only) – A nominal interest rate can be described as the sum of a real interest rate and an expected inflation rate. Inflation-indexed securities, including Treasury Inflation-Protected Securities, decline in value when real interest rates rise. In certain interest rate environments, such as when real interest rates are rising faster than nominal interest rates, inflation-indexed securities may experience greater losses than other fixed income securities with similar durations.
• Interest Rate Risk (Duration Neutral Bond and Tactical Fixed Income) – The value of the Fund may fluctuate based on changes in interest rates and market conditions. As interest rates rise, the value of income producing instruments may decrease. This risk increases as the term of the note increases.
• Issuer-Specific Risk (Duration Neutral Bond, Tactical Fixed Income, and Managed Volatility) – The value of a specific security can be more volatile than the market as a whole and can perform differently from the value of the market as a whole. The value of securities of smaller issuers can be more volatile than that of larger issuers. The value of certain types of securities can be more volatile due to increased sensitivity to adverse issuer, political, regulatory, market, or economic developments.
• Leverage/Volatility Risk (Tactical Fixed Income, Duration Neutral Bond, Equity Hedged, and Managed Volatility) – The Funds may employ leverage and may invest in leveraged instruments. Borrowing magnifies the potential for losses and exposes the Funds interest expenses on borrowing. The more the Funds invest in leverage instruments, the more this leverage will magnify any losses on those investments. Leverage will cause the value of the Funds’ shares to be more volatile than if the Funds did not use leverage. This is because leverage tends to exaggerate the effect of any increase or decrease in the value of the Funds’ portfolio securities or other investments. The Funds may engage in transactions or purchase instruments that give rise to forms of leverage, including inverse ETFs or derivatives. Derivative contracts ordinarily have leverage inherent in their terms. The use of leverage may also cause the Funds to liquidate portfolio positions when it would not be advantageous to do so in order to satisfy its obligations or to meet segregation requirements. Certain types of leveraging transactions could theoretically be subject to unlimited losses in cases where the Funds, for any reason, is unable to close out the transaction.

25
Furthermore, derivative contracts are highly volatile and are subject to occasional rapid and substantial fluctuations. Consequently, you could lose all or substantially all of your investment in the Funds should the funds’ trading positions suddenly turn unprofitable.
• Liquidity Risk (Duration Neutral Bond and Managed Volatility) – Liquidity risk exists when particular investments of the Fund would be difficult to purchase or sell, possibly preventing the Fund from selling such illiquid securities at an advantageous time or price, or possibly requiring the Fund to dispose of other investments at unfavorable times or prices in order to satisfy its obligations.
• Management Style Risk (Tactical Fixed Income, Duration Neutral Bond, Equity Hedged, and Managed Volatility) – The adviser’s investment process and security selection methodology may produce incorrect judgments about the attractiveness, value, return, relative value and potential appreciation of a particular investment the Funds makes and may not produce the desired results. The adviser’s proprietary modeling process may incorrectly measure or predict the relative strength or momentum of various fixed income asset classes, and the Tactical Fixed Income Fund may hold a high percentage of either high-yield bonds or cash equivalents during certain periods, or for an extended period.
• Municipal Market Risk (Duration Neutral Bond only) – Special factors may negatively affect the value of municipal securities and, as a result, the Fund’s net asset value. These factors include political or legislative changes, uncertainties related to the tax status of the securities or the rights of investors in the securities. The Fund may invest in municipal obligations that are related in such a way that an economic, business or political development or change affecting one of these obligations would also affect the other obligations. The Fund is not intended to be a tax exempt bond fund. Certain municipal bonds produce taxable income, and/or the favorable tax status of a municipal bond may change after issuance. Municipal bond issuers may utilize derivatives, subjecting the bonds themselves to the derivatives risks described herein.
• Market Risk (Equity Hedged only) – The net asset value of the Fund will fluctuate based on changes in the value of the securities in which the Fund invests. The Fund invests in securities that may be more volatile and carry more risk than some other forms of investment. The price of securities may rise or fall because of economic or political changes. Security and derivative prices in general may decline over short or even extended periods of time. Market prices of securities and derivatives in broad market segments may be adversely affected by a prominent issuer having experienced losses, lack of earnings, failure to meet the market’s expectations with respect to new products or services, or even by factors wholly unrelated to the value or condition of the issuer, such as changes in interest rates.
• Non-Diversification Risk (Duration Neutral Bond and Managed Volatility) – As a non-diversified fund, the Funds may invest more than 5% of its total assets in the securities of one or more issuers. The Funds may also invest in ETFs that are non-diversified. Because a relatively high percentage of the assets of the Funds may be invested in the securities of a limited number of issuers, the value of shares of the Funds may be more sensitive to any single economic, business, political or regulatory occurrence than the value of shares of a diversified investment company. This fluctuation, if significant, may affect the performance of the Funds.
• Not Tax Exempt Fund (Duration Neutral Bond only) – The Fund is not intended to be a tax exempt fund and may not be tax advantaged. While the Adviser expects most of the municipal bond instruments in which the Fund invests will be tax advantaged under current tax laws, not all municipal bond instruments are designed to be tax advantaged and the municipal bonds in which the Fund invests may generate taxable income. To the extent the Fund’s returns are positive, a portion of the Fund’s investments may generate taxable gains and/or income.
• Options Risk (Tactical Fixed Income and Managed Volatility) – The Fund may lose the entire put or call option premium paid if the reference asset or index does not decrease below or rise above the respective strike price before expiration. Options may not be an effective hedge because they may have imperfect correlation to the value of the Fund’s assets. Written call options may limit the Fund’s participation in market gains and may magnify the losses if the price of the written option instrument increases in value between the date when the Fund writes the option and the date on which the Fund purchases an offsetting position.
• Preferred Stock Risk (Tactical Fixed Income only) – Typically, a rise in interest rates causes a decline in the value of preferred stock. Preferred stocks are also subject to credit and default risk, which is the possibility that an issuer of preferred stock will fail to make its dividend payments.
• Portfolio Turnover Risk (Tactical Fixed Income, Duration Neutral Bond, Equity Hedged and Managed Volatility) – A higher portfolio turnover may result in higher transactional and brokerage costs associated with the turnover which may reduce the Funds’ return, unless the securities traded can be bought and sold without corresponding commission costs. Active trading of securities may also increase the Funds’ realized capital gains or losses, which may affect the taxes you pay as a Fund shareholder.

26
• Put Option Risk (Equity Hedged only) – When the Fund purchases a put option, it may lose the entire premium paid if the option is held to expiration and the underlying index does not decrease in value. The Fund is also exposed to default by the option writer who may be unwilling or unable to perform its contractual obligations to the Fund. The value of put options on the S&P 500 Index may be imperfectly correlated to the value of the Fund’s ETFs, many of which may be foreign or representative of sectors outside the S&P 500 Index, and, therefore, may not provide an effective hedge.
• Short Selling and Short Position Risk (Tactical Fixed Income and Managed Volatility) – The Funds’ long positions could decline in value at the same time that the value of short positions increase, thereby increasing the Funds’ overall potential for loss. The short positions may result in a loss if the price of the short position instruments rise and it costs more to replace the short positions. In contrast to the Funds’ long positions, for which the risk of loss is typically limited to the amount invested, the potential loss on short positions is potentially higher. However, the Funds will be in compliance with Section 18(f) of the 1940 Act, to ensure that a Funds shareholder will not lose more than the amount invested in the Funds. Market factors may prevent the Funds from closing out a short position at the most desirable time or at a favorable price.
• Small and Medium Capitalization Company Risk (Tactical Fixed Income and Equity Hedged) – The value of small or medium capitalization company securities may be subject to more abrupt or erratic market movements than those of larger, more established companies or the market in general. These companies may have narrower markets, limited product lines, fewer financial resources, and they may be dependent on a limited management group. Investing in lesser-known, small and medium capitalization companies involves greater risk of volatility of the Funds’ net asset value than is customarily associated with larger, more established companies.
• Stock Market Risk (Tactical Fixed Income and Managed Volatility) – Stock markets can be volatile. In other words, the prices of stocks can fall rapidly in response to developments affecting a specific company or industry, or to changing economic, political or market conditions. The Funds’ investments may decline in value if the stock markets perform poorly. There is also a risk that the Funds’ investments will underperform either the securities markets generally or particular segments of the securities markets.
• Structured Notes Risk (Tactical Fixed Income and Managed Volatility) – Structured notes involve risks different from, or possibly greater than, the risks associated with traditional investments. These risks include (i) the risk that the issuer may default; (ii) risk of mispricing or improper valuation; and (iii) the risk that changes in the value of the note may not correlate perfectly with the underlying assets, rate or index. Structured note prices may be highly volatile and may fluctuate substantially during a short period of time. Such prices are influenced by numerous factors that affect the markets, including, but not limited to: changing supply and demand relationships; government programs and policies; national and international political and economic events, changes in interest rates, inflation and deflation and changes in supply and demand relationships. Trading structured notes involves risk different from, or possibly greater than, the risks associated with investing traditional securities including:
o Leverage and Volatility Risk – Structured notes ordinarily have leverage inherent in their terms. Accordingly, a relatively small movement in an index to which structured note is linked may result in an immediate and substantial loss.
o Liquidity Risk – Although it is anticipated that the structured notes will be actively traded, it is possible that particular investments might be difficult to purchase or sell, possibly preventing the Funds from executing positions at an advantageous time or price, or possibly requiring them to dispose of other investments at unfavorable times or prices in order to satisfy their obligations.
o Tracking Risk – Structured notes may not be perfect substitutes for the securities, commodities or currencies they are intended to track. Factors such as differences in supply and demand for certain structured note-related derivatives and indices may cause structured note returns to deviate from the adviser’s expectations. Consequently, structured note returns may not be highly correlated to the securities commodities or currencies they are intended to track.
• Swap Risk (Tactical Fixed Income only) – Swap agreements are subject to the risk that the counterparty to the swap will default on its obligation to pay the Fund and the risk that the Fund will not be able to meet its obligations to pay the counterparty to the swap. Swap agreements may also involve fees, commissions or other costs that may reduce the Fund’s gains from a swap agreement or may cause the Fund to lose money. As described in the Principal Investment Strategies section, the Fund will invest through the Subsidiary in the swap. The Fund’s returns will be reduced or its losses will be increased by the costs associated with the swap, which are the fees deducted by the counterparty in the calculation of the returns of the swap. These fees include the management and performance fees of the Underlying Fund accessed through the swap (See “Underlying Funds Risk” below for more information on these fees). The costs associated with the swap are separate from the Fund’s operating expenses as shown in the Annual Fund Operating Expenses table. A performance fee for one or more managers represented in the swap may be deducted from the return of the swap even if the aggregate returns of the swap

27
are negative. In addition, there is the risk that the Swap may be terminated by the Fund or the counterparty in accordance with its terms. If the swap were to terminate, the Fund may be unable to implement its investment strategies and the Fund may not be able to seek to achieve its investment objective.
• Underlying Funds Risk (Tactical Fixed Income, Duration Neutral Bond, and Managed Volatility) – Underlying Funds in which a Fund invests are subject to investment advisory and other expenses, which will be indirectly paid by the Fund. As a result, the cost of investing in such Fund will be higher than the cost of investing directly the Underlying Funds and may be higher than other mutual funds that invest directly in stocks and bonds. Each of the Underlying Funds is subject to specific risks, depending on the nature of the fund. Additional related to investment in Underlying Funds include:
o Mutual Fund Risk – Mutual funds are subject to investment advisory and other expenses, which will be indirectly paid by the Fund. As a result, your cost of investing will be higher than the cost of investing directly in a mutual fund and may be higher than other mutual funds that invest directly in stocks and bonds. Mutual funds are also subject management risk because the adviser to the underlying mutual fund may be unsuccessful in meeting a Fund’s’ investment objective and may temporarily pursue strategies which are inconsistent with the Funds’ investment objective.
o Closed-End Fund Risk (Duration Neutral Bond and Managed Volatility only) – Closed-end funds are subject to investment advisory and other expenses, which will be indirectly paid by the Fund. As a result, your cost of investing will be higher than the cost of investing directly in a closed-end fund and may be higher than other mutual funds that invest directly in stocks and bonds. Closed-end funds are also subject to management risk because the adviser to the underlying closed-end fund may be unsuccessful in meeting the fund’s investment objective. These funds may also trade at a discount or premium to their net asset value and may trade at a larger discount or smaller premium subsequent to purchase by the Fund. Since closed-end funds trade on exchanges, the Fund will also incur brokerage expenses and commissions when it buys or sells closed-end fund shares.
o ETF Risk – ETFs are subject to investment advisory and other expenses, which will be indirectly paid by a Fund. As a result, your cost of investing the Fund will be higher than the cost of investing directly in ETFs and may be higher than other mutual funds that invest directly in stocks and bonds. ETFs are listed on national stock exchanges and are traded like stocks listed on an exchange. ETF shares may trade at a discount to or a premium above net asset value if there is a limited market in such shares. ETFs are also subject to brokerage and other trading costs, which could result in greater expenses to the Fund. Because the value of ETF shares depends on the demand in the market, the adviser may not be able to liquidate the Funds’ holdings at the most optimal time, adversely affecting performance.
ETF Strategy Risk (Duration Neutral Bond only) – Each ETF is subject to specific risks, depending on the nature of the ETF. These risks could include liquidity risk, sector risk, foreign and emerging market risk, as well as risks associated with real estate investments and commodities.
o Underlying Fund Strategy Risk – Each Underlying Fund is subject to specific risks, depending on the nature of the Underlying Fund. These risks could include liquidity risk, sector risk, foreign and emerging market risk, as well as risks associated with real estate investments and commodities.
o ETF Inverse Risk – Under certain circumstances, the adviser may invest in certain ETFs known as “inverse funds,” which are designed to produce results opposite to market trends. Inverse funds seek daily investment results, before fees and expenses, which correspond to the inverse (opposite) of the daily performance of a specific benchmark. Inverse ETFs are funds designed to rise in price when stock prices are falling. Inverse ETF index funds seek to provide investment results that will match a certain percentage of the inverse of the performance of a specific benchmark on a daily basis. For example, if a fund’s current benchmark is 100% of the inverse of the Russell 2000 Index and the fund meets its objective, the value of the fund will tend to increase on a daily basis when the value of the underlying index decreases (if the Russell 2000 Index goes down 5% then the fund’s value should go up 5%). Conversely, when the value of the underlying index increases, the value of the fund’s shares tend to decrease on a daily basis (if the Russell 2000 Index goes up 5% then the fund’s value should go down 5%). Additionally, inverse ETFs may employ leverage, which magnifies the changes in the underlying stock index upon which they are based. For example, if an inverse ETFs current benchmark is 200% of the inverse of the Russell 2000 Index and the ETF meets its objective, the value of the ETF will tend to increase on a daily basis when the value of the underlying index decreases (e.g., if the Russell 2000 Index goes down 5% then the inverse ETFs value should go up 10%).
o ETF Leverage Risk (Duration Neutral Bond only) – ETFs may employ leverage, which magnifies the changes in the underlying stock index upon which they are based. For example, if an ETFs current benchmark is 200% of the S&P 500 Index and the ETF meets its objective, the value of the ETF will tend to

28
increase or decrease twice the value of the change in the underlying index. (e.g., if the S&P 500 Index goes up 10% then the leveraged ETF’s value should go up 20%; conversely, if the S&P 500 Index goes down 10% then the leveraged ETF’s value should go down 20%). However, leveraged ETFs seek a certain multiple on a daily basis only, so over time a leveraged ETF may not perform consistent with its target index.
o Leverage Risk – Using derivatives or borrowing to increase the Funds’ combined long and short position exposure creates leverage, which can amplify the effects of market volatility on the Funds’ share price and make the Funds’ returns more volatile. The use of leverage may cause a Fund or an Underlying Fund to liquidate portfolio positions when it would not be advantageous to do so in order to satisfy its obligations. The use of leverage also may cause a Fund to have higher expenses than those of mutual funds that do not use leverage. Underlying Funds that are not subject to regulation under the Investment Company Act may employ leverage in excess of the amount permitted mutual funds, which are subject to various limits on leverage under the Investment Company Act.
o Net Asset Value and Market Price Risk – The market value of ETF shares may differ from their net asset value. This difference in price may be due to the fact that the supply and demand in the market for ETF shares at any point in time is not always identical to the supply and demand in the market for the underlying basket of securities. Accordingly, there may be times when an ETF share trades at a premium or discount to its net asset value.
o Tracking Risk – ETFs in which the Funds invests will not be able to replicate exactly the performance of the indices they track because the total return generated by the securities will be reduced by transaction costs incurred in adjusting the actual balance of the securities. In addition, the ETFs in which the Funds invest will incur expenses not incurred by their applicable indices. Certain securities comprising the indices tracked by the ETFs may, from time to time, temporarily be unavailable, which may further impede the ETFs’ ability to track their applicable indices.
• U.S. Government Securities Risk (Duration Neutral Bond only) – The Fund may invest in obligations issued by agencies and instrumentalities of the U.S. Government. The U.S. Government may choose not to provide financial support to U.S. Government sponsored agencies or instrumentalities if it is not legally obligated to do so, in which case, if the issuer defaulted, the Fund might not be able to recover its investment.
Temporary Investments: To respond to adverse market, economic, political or other conditions, the Funds may each invest 100% of its total net assets, without limitation, in high quality short-term debt securities and money market instruments. These short-term debt securities and money market instruments include shares of other mutual funds, commercial paper, certificates of deposit, bankers’ acceptances, U.S. Government securities and repurchase agreements. While a Fund is in a defensive position, the opportunity to achieve its investment objective will be limited. Furthermore, to the extent that a Fund invests in money market mutual funds for its cash position, there will be some duplication of expenses because the Fund would bear its pro rata portion of such money market funds’ advisory fees and operational fees. The Funds may also invest a substantial portion of its assets in such instruments at any time to maintain liquidity or pending selection of investments in accordance with its policies. Portfolio Holdings Disclosure: The Funds’ policies and procedures with respect to the disclosure of the Funds’ portfolio securities holdings are available in the Statement of Additional Information, which may be requested toll free by calling 1-877-766-2264. Cybersecurity: The computer systems, networks and devices used by the Funds and their service providers to carry out routine business operations employ a variety of protections designed to prevent damage or interruption from computer viruses, network failures, computer and telecommunication failures, infiltration by unauthorized persons and security breaches. Despite the various protections utilized by the Funds and their service providers, systems, networks, or devices potentially can be breached. The Funds and their shareholders could be negatively impacted as a result of a cybersecurity breach. Cybersecurity breaches can include unauthorized access to systems, networks, or devices; infection from computer viruses or other malicious software code; and attacks that shut down, disable, slow, or otherwise disrupt operations, business processes, or website access or functionality. Cybersecurity breaches may cause disruptions and impact the Funds’ business operations, potentially resulting in financial losses; interference with the Funds’ ability to calculate their NAV; impediments to trading; the inability of the Funds, the adviser, and other service providers to transact business; violations of applicable privacy and other laws; regulatory fines, penalties, reputational damage, reimbursement or other compensation costs, or additional compliance costs; as well as the inadvertent release of confidential information. Similar adverse consequences could result from cybersecurity breaches affecting issuers of securities in which the Funds invest; counterparties with which the Funds engages in transactions; governmental and other regulatory authorities; exchange and other financial market operators, banks, brokers, dealers, insurance companies, and other financial institutions (including financial intermediaries and service providers for the Funds’ shareholders); and other parties. In addition, substantial costs may be incurred by these entities in order to prevent any cybersecurity breaches in the future.

29
MANAGEMENT Investment Adviser: Clark Capital Management Group, Inc., located at 1650 Market Street, 53rd floor, Philadelphia, Pennsylvania 19103, serves as investment adviser to the Funds. Subject to the authority of the Board of Trustees, the adviser is responsible for the overall management of the Funds’ business affairs. The adviser is responsible for selecting the Funds’ investments according to its investment objective, polices, and restrictions. The adviser was established in 1986 and serves individual investors, corporations, foundations, retirements plans and pooled investment vehicles such as the Funds. In addition to the Funds, the adviser serves as investment adviser to three other mutual funds within the Trust. It has served as an investment adviser to mutual funds since 2010. As of September 30, 2017, the adviser had approximately $10.1 billion in assets under advisement. Pursuant to an Investment Advisory Agreement, the Navigator Tactical Fixed Income Fund, Navigator Duration Neutral Bond Fund, Navigator Equity Hedged Fund, and Navigator Sentry Managed Volatility Fund pays the adviser, on a monthly basis, an annual advisory fee equivalent to 0.85%, 1.00%, 0.75%, and 0.85% of the Funds’ average daily net assets, respectively. The adviser has contractually agreed to reduce its fees and to reimburse expenses for the Navigator Duration Neutral Bond Fund, Navigator Equity Hedged Fund, and Navigator Sentry Managed Volatility Fund, at least until January 31, 2019, to ensure that total annual fund operating expenses after fee waiver and/or reimbursement (excluding any front-end or contingent deferred loads; brokerage fees and commissions, acquired fund fees and expenses, borrowing costs (such as interest and dividend expense on securities sold short), taxes, expenses incurred in connection with any merger or reorganization, and extraordinary expenses, such as litigation expenses (which may include indemnification of Fund officers and Trustees, contractual indemnification of Fund service providers (other than the adviser)) will not exceed 1.50%, 2.25% and 1.25% of average daily net assets attributable to Class A, Class C and Class I shares, respectively, of the Sentry Managed Volatility Fund; 1.60%, 2.35% and 1.35% of the average daily net assets attributable to Class A, Class C and Class I Shares, respectively, of the Duration Neutral Bond Fund; and 1.35%, 2.10% and 1.10% of the average daily net assets attributable to Class A, Class C and Class I shares, respectively, of the Equity Hedged Fund. Fee waivers and expense reimbursements are subject to possible recoupment from the Funds in future years on a rolling three year basis (within the three years after the end of the fiscal year during which fees were waived or reimbursed) if such recoupment can be achieved within the foregoing expense limits. Fee waiver and reimbursement arrangements can decrease the Funds’ expenses and boost its performance. For the fiscal year ended September 30, 2017, Navigator Tactical Fixed Income Fund, Navigator Duration Neutral Bond Fund, Navigator Equity Hedged Fund, and Navigator Sentry Managed Volatility Fund paid the adviser 0.80%, 1.00%, 0.54%, and 0.18% of average net daily net assets, respectively. A discussion regarding the basis for the Board of Trustees’ approval of the advisory agreement between the Trust and the adviser with respect to Navigator Sentry Managed Volatility Fund, Navigator Tactical Fixed Income Fund, Navigator Duration Neutral Bond Fund, and Navigator Equity Hedged Fund are available in the Funds’ annual report to shareholders dated September 30, 2017. Adviser Portfolio Managers: K. Sean Clark, CFA
Chief Investment Officer of the Adviser Portfolio Manager for each Navigator Fund Mr. Clark oversees all of the Firm’s investment activities and heads the firm’s portfolio team, and serves as portfolio manager for each of the Funds. Mr. Clark joined the firm in 1993 and is responsible for asset allocation and investment selection for Navigator Investment Solutions as well as directing ongoing market research. Mr. Clark is a member of the Clark Capital Investment Management Committee and the Board of Directors. He graduated from the University of Delaware, earning a B.S. and an M.A. in Economics. He is also a Chartered Financial Analyst and a member of the CFA Institute (formerly AIMR) and the Financial Analysts of Philadelphia, Inc. David J. Rights
Director of Research of the Adviser Portfolio Manager Navigator Tactical Fixed Income Fund and Navigator Equity Hedged Fund As Director of Research, Mr. Rights directs the ongoing research into securities selection and portfolio strategies used to enhance the Navigator investment programs and the Navigator Tactical Fixed Income Fund. In the late 1970s, Mr. Rights began to develop economically based, quantitatively driven econometric models. Mr. Rights has also developed technical models used to enhance relative returns and reduce the risks of ETF and fund based products. Mr. Rights is a member of the Clark Capital Investment Committee. Mr. Rights was formerly President and Chief Investment Officer of RTE Asset Management which merged with Clark Capital in 2005. David holds a degree in Electrical Engineering from Lehigh University.

30
Jonathan A. Fiebach
Executive President Fixed Income Fund Portfolio Manager Navigator Duration Neutral Bond Fund and Navigator Tactical Fixed Income Fund Mr. Fiebach joined Clark Capital in 2016, previously, Mr. Fiebach had been Co-CEO and CIO of Main Point Advisors Inc. since 2013. Mr. Fiebach was also a principal with Grant Williams, L.P. from October, 2011 until June 2016. Prior to that Mr. Fiebach was President and owner of Fiebach Investments, LLC from 2010 to 2012 and Managing Director of Duration Capital Management Advisors Inc. from 2002-2012. In each capacity he was responsible for investment and hedging decisions. Mr. Fiebach has over 26 years of investment management industry experience. Mason Wev, CFT, CMT
Portfolio Manager Navigator Tactical Fixed Income Fund and Navigator Equity Hedged Fund Mr. Wev joined the adviser in 2005 as a Portfolio Manager. He is a member of the Clark Capital Investment Committee, contributing to asset allocation policy and security selection. Mr. Wev has more than a decade of experience in the investment industry. He is responsible for quantitative investment analysis, security selection, and communicating the firm’s investment policy to wealth advisers and consultants. Mr. Wev participates in the research and product development efforts of the Portfolio Team. A graduate of Dickinson College, Mr. Wev earned an M.B.A. in International Management from the Garvin School of Management at Thunderbird (the American Graduate School of International Management) and holds the CMT and CFA designations. Robert S. Bennett, Jr.
Portfolio Manager Navigator Tactical Fixed Income Fund Mr. Bennett serves as a co-portfolio manager to the Navigator Tactical Fixed Income Fund. Mr. Bennett joined the adviser in 2014. He has over eight years of experience with the management and trading of various securities and derivatives. Mr. Bennett has had extensive experience overseeing the daily trading activities of various long and short ETFs and mutual funds for ProShare Advisors LLC, including: trading cash equities, synthetic equities, futures, credit default swaps, corporate bonds, treasuries, and FX forwards. Mr. Bennett worked for ProShare Advisors, LLC from 2008-2014. He began his career as a Financial Advisor at UBS Financial Services, Inc. Robert received his B.S. in business management from Wentworth Institute of Technology. The Funds’ Statement of Additional Information provides additional information about the Portfolio Managers’ compensation structures, other accounts managed by the Portfolio Managers, and the Portfolio Managers’ ownership of shares of the Funds. Portfolio Managers’ Prior Performance Information K. Sean Clark, CFA, and Mason Wev, are responsible for managing other accounts for clients of the adviser, a portion of which are invested using the “Navigator Fixed Income Total Return Separate Account” methodology (the “FITR Accounts”). This strategy employs the same features of the Navigator Tactical Fixed Income Funds’ principal investment strategies including investment in fixed income securities, including (i) bills, (ii) notes, (iii) structured notes, (iv) bonds, (v) preferred stocks, (vi) any other debt or debt-related securities of any maturities, whether issued by U.S. or non-U.S. governments, agencies or instrumentalities thereof or corporate entities, and having fixed, variable, floating or inverse floating rates, (vii) fixed income derivatives including options, financial futures, options on futures and swaps, and (viii) underlying funds that invest primarily in fixed income securities, or (ix) other evidences of indebtedness, and may also invest in credit default swaps or credit default swap indexes, using the adviser’s investment principals. Consequently, this fixed income total return strategy is substantially similar to the strategy employed by the Navigator Tactical Fixed Income Fund. Messers. Clark, and Wev have full discretionary authority over the selection of investments for the FITR Accounts, and they use substantially the same goals and style of investment management in managing the Navigator Tactical Fixed Income Fund. The Navigator Tactical Fixed Income Fund will have substantially the same investment objective, policies and strategies as the FITR Accounts. The information for the FITR Account Composite, which includes all accounts of the adviser that are substantially similar to the Navigator Tactical Fixed Income Fund, is provided to show the past performance of the FITR Account Composite as measured against the specified benchmark. The performance of the FITR Account Composite does not represent the historical performance of the Navigator Tactical Fixed Income Fund, and should not be considered indicative of future performance of the FITR Account Composite or the Navigator Tactical Fixed Income Fund. Future results will differ from past results because of differences in future behavior of the various investment markets, in brokerage commissions, account expenses, the size of positions taken in relation to account size and diversification of securities, and the timing of purchases and sales, among other things. In addition, the FITR Account Composite is not subject to certain investment

31
limitations and other restrictions imposed by the 1940 Act and the Internal Revenue Code which, if applicable, might have adversely affected the performance of the FITR Account Composite during the periods shown. Performance of the Navigator Tactical Fixed Income Fund for future periods will definitely vary, and some months and some quarters will result in negative performance; indeed, some future years may have negative performance. The adviser provided the information shown below and calculated the performance information. The FITR Account Composite’s returns shown include realized and unrealized gains plus income, including accrued income. The performance is shown was calculated in accordance with the Global Investment Performance Standards (“GIPS”) and the net calculation includes the maximum fees and expenses (2.10%) applied to such accounts. Gross performance, which does not include any fees or expenses is also provided separately. Prospective shareholders should note that Class A shares of the Navigator Tactical Fixed Income Fund are subject to a sales load, which, if not waived by the Fund, adversely affects performance. The FITR Accounts were not subject to a sales load. Returns from cash and cash equivalents in the FITR Account Composite are included in the performance calculations, and the cash and cash equivalents are included in the total assets on which the performance is calculated. The FITR Accounts were valued on a daily basis.
FITR Account Composite Average Annual Total Returns
For the periods ended December 31, 2017
1 Year 5 Years 7 Years Since Inception1
FITR Account Composite (gross) 2 6.96 5.86 6.65 9.26 FITR Account Composite (net fees and expenses)2,3 3.82 2.75 3.51 6.05 Barclays US Corporate High Yield4 7.50 5.78 7.04 7.42 Barclays US Aggregate Bond4 3.54 2.10 3.20 4.13 1. The inception date for the FITR Account Composite is January 1, 2005. 2. As of December 31, 2015, the FITR Composite totaled $399,908,120. 3. Net returns were calculated in accordance GIPS and include the maximum account fees and expenses. 4. The Barclays US Corporate High Yield Bond Index covers the U.S. dollar-denominated, non-investment grade,
fixed-rate, taxable corporate bond market. Securities are classified as high-yield if the middle rating of Moody’s, Fitch, and S&P is Ba1/BB+/BB+ or below. The Barclays US Aggregate Bond covers investment grade bonds being traded in United States. Unlike a mutual fund, the Barclays indices do not reflect any trading costs or management fees.
Comparison of the Change of Value a $10,000 Investment
The performance data quoted is historical for the FITR Account Composite and its benchmark indices, Performance for the FITR Accounts is provided both gross and net of fees and expenses equal to 2.10%. This is not the performance of the Navigator Tactical Fixed Income Fund. Past performance is no guarantee of future results. The returns do not reflect the deduction of any taxes an account holder would have paid. Returns greater than one year are annualized. The inception date for the FITR Accounts is January 1, 2005.

32
HOW SHARES ARE PRICED The net asset value (“NAV”) and offering price (NAV plus any applicable sales charges) of each class of shares is determined as of the close of the New York Stock Exchange (“NYSE”) (normally 4:00 p.m. Eastern Time) on each day the New York Stock Exchange (“NYSE”) is open for business. NAV is computed by determining the aggregate market value of all assets of the Fund less its liabilities, divided by the total number of shares outstanding per class ((assets-liabilities)/number of shares = NAV). The NYSE is closed on weekends and New Year’s Day, Martin Luther King, Jr. Day, Presidents’ Day, Good Friday, Memorial Day, Independence Day, Labor Day, Thanksgiving Day and Christmas Day. Each Fund’s NAV takes into account the expenses and fees of the Fund, including management, administration, and distribution fees, which are accrued daily. The determination of NAV for a particular day is applicable to all applications for the purchase of shares, as well as all requests for the redemption of shares, received by the Fund (or an authorized broker or agent, or its authorized designee) before the close of trading on the NYSE on that day. Generally, the Funds’ securities are valued each day at the last quoted sales price on each security’s primary exchange. Securities traded or dealt in upon one or more securities exchanges (whether domestic or foreign) for which market quotations are readily available and not subject to restrictions against resale shall be valued at the last quoted sales price on the primary exchange or, in the absence of a sale on the primary exchange, at the mean between the current bid and ask prices on such exchange. Securities primarily traded in the National Association of Securities Dealers’ Automated Quotation System (“NASDAQ”) National Market System for which market quotations are readily available shall be valued using the NASDAQ Official Closing Price. Securities that are not traded or dealt in any securities exchange (whether domestic or foreign) and for which over-the-counter market quotations are readily available generally shall be valued at the last sale price or, in the absence of a sale, at the mean between the current bid and ask price on such over-the- counter market. Debt securities not traded on an exchange may be valued at prices supplied by a pricing agent(s) based on broker or dealer supplied valuations or matrix pricing, a method of valuing securities by reference to the value of other securities with similar characteristics, such as rating, interest rate and maturity. If market quotations are not readily available, such securities will be valued at fair value as determined using the “fair value” procedures approved by the Board. Fair value pricing involves subjective judgments and it is possible that the fair value determined for a security is materially different than the value that could be realized upon the sale of that security. The fair value prices can differ from market prices when they become available or when a price becomes available. The Board has delegated execution of these procedures to a fair value team composed of one or more representatives from each of the (i) Trust, (ii) administrator, and (iii) adviser. The team may also enlist third party consultants such as an audit firm or financial officer of a security issuer on an as-needed basis to assist in determining a security-specific fair value. The Board reviews and ratifies the execution of this process and the resultant fair value prices at least quarterly to assure the process produces reliable results. In cases where a fair valuation of securities is applied, a Fund’s NAV will reflect certain portfolio securities’ fair value rather than their market price. Fair value pricing involves subjective judgments and it is possible that the fair value determined for a security is materially different than the value that could be realized upon the sale of that security. This fair value may also vary from valuations determined by other funds using their own fair valuation procedures. The fair value prices can differ from market prices when they become available or when a price becomes available. The Board has delegated execution of these procedures to a fair value team composed of one or more representatives from each of the (i) Trust, (ii) administrator, and (iii) adviser. The team may also enlist third party consultants such as an audit firm or financial officer of a security issuer on an as-needed basis to assist in determining a security-specific fair value. The Board reviews and ratifies the execution of this process and the resultant fair value prices at least quarterly to assure the process produces reliable results. The Funds and the adviser may use independent pricing services to assist in calculating the value of the Funds’ securities. In addition, market prices for foreign securities are not determined at the same time of day as the NAV for the Funds. Because the Funds may invest in foreign securities and in ETFs and investment companies that hold portfolio securities primarily listed on foreign exchanges, and these exchanges may trade on weekends or other days when the ETFs and investment companies do not price their shares, the value of some of the Funds’ portfolio securities may change on days when you may not be able to buy or sell Fund shares. In computing the NAV, a Fund values foreign securities held by the Fund at the latest closing price on the exchange in which they are traded immediately prior to closing of the NYSE. Prices of foreign securities quoted in foreign currencies are translated into U.S. dollars at current rates. If events materially affecting the value of a security in a Fund’s portfolio, particularly foreign securities, occur after the close of trading on a foreign market but before the Fund prices its shares, the security will be valued at fair value. For example, if trading in a portfolio security is halted and does not resume before a Fund calculates its NAV, the adviser may need to price the security using the Funds’ fair value pricing guidelines. Without a fair value price, short-term traders could take advantage of the arbitrage opportunity and dilute the NAV of long-term investors. Fair valuation of the Funds’ portfolio securities can serve to reduce arbitrage opportunities available to short-term traders, but there is no assurance that fair value pricing policies will prevent dilution of the Funds’ NAV by short term traders. The determination of fair value involves subjective judgments. As a result, using fair value to price a security may result in a price materially different from the prices used by other mutual funds to determine net asset value, or from the price that may be realized upon the actual sale of the security.

33
With respect to any portion of the Funds’ assets that are invested in one or more open-end management investment companies registered under the 1940 Act, each Funds’ net asset value is calculated based upon the net asset values of those open-end management investment companies, and the prospectuses for these companies explain the circumstances under which those companies will use fair value pricing and the effects of using fair value pricing. HOW TO PURCHASE SHARES Share Classes: This Prospectus describes three classes of shares offered by the Funds. The main differences between each class are sales charges, ongoing fees and minimum investments. Class A shareholders pay a maximum sales charge of 3.75%, Class C and Class I shareholders do not pay a sales charge. Class A shares and Class C shares pay an annual fee of up to 0.25% and 1.00%, respectively, for distribution expenses pursuant to a plan under Rule 12b-1, and Class I does not pay such fees. The minimum initial investment for Class A shares or Class C shares is $5,000; Class I shares require a $25,000 initial investment. For information on ongoing distribution fees, see Distribution (12b-1) and Shareholder Servicing Fees on page 39 of this Prospectus. In choosing which class of shares to purchase, you should consider which will be most beneficial to you, given the amount of your purchase. Each class of shares in the Funds represents an interest in the same portfolio of investments in the Funds. All share classes may not be available for purchase in all states. Class A Shares: Class A shares are offered at the public offering price, which is net asset value per share plus the applicable sales charge. The sales charge varies, depending on how much you invest. There are no sales charges on reinvested distributions. You can also qualify for a sales charge reduction or waiver through a right of accumulation or a letter of intent if you are a U.S. resident. See the discussions of “Right of Accumulation” and “Letter of Intent” below. The Fund reserves the right to waive any load. The following sales charges apply to your purchases of Class A shares of the Navigator Tactical Fixed Income Fund, Navigator Duration Neutral Bond Fund, or Navigator Sentry Managed Volatility Fund:
Amount Invested
Sales Charge as a % of
Offering Price(1)
Sales Charge as a % of
Amount Invested Dealer
Reallowance Less than $50,000 3.75% 3.83% 3.25%
$50,000 but less than $100,000 3.50% 3.63% 3.00% $100,000 to $249,999 2.50% 2.56% 2.00% $250,000 to $499,999 2.00% 2.04% 1.75% $500,000 to $999,999 1.50% 1.52% 1.00% $1,000,000 and above 1.00% 1.01% 1.00%
(1) Offering price includes the front-end sales load. The sales charge you pay may differ slightly from the amount set forth above because of rounding that occurs in the calculation used to determine your sales charge.
The following sales charges apply to your purchases of Class A shares of the Navigator Equity Hedged Fund:
Amount Invested
Sales Charge as a % of
Offering Price(1)
Sales Charge as a % of
Amount Invested Dealer
Reallowance Less than $50,000 5.50% 5.82% 5.00%
$50,000 but less than $100,000 4.75% 4.99% 4.25% $100,000 to $249,999 3.75% 3.83% 3.25% $250,000 to $499,999 2.50% 2.56% 2.00% $500,000 to $999,999 2.00% 2.04% 1.50% $1,000,000 and above 1.00% 1.01% 1.00%
(1) Offering price includes the front-end sales load. The sales charge you pay may differ slightly from the amount set forth above because of rounding that occurs in the calculation used to determine your sales charge.
How to reduce your sales charge: You may be eligible to purchase Class A Shares of any Navigator Fund for reduced sales charges. To qualify for these reductions, you or your financial intermediary must provide sufficient information, in writing and at the time of purchase, to verify that your purchase qualifies for such treatment. Consistent with the policies described in this Prospectus, you and your “immediate family” (your spouse and your children under the age of 21) may combine your Funds holdings to reduce your sales charge.

34
Rights of accumulation: To qualify for the lower sales charge rates that apply to larger purchases of Class A Shares, you may combine your new purchases of Class A Shares with the shares of any other Class A Shares of the Funds that you already own. The applicable initial sales charge for the new purchase is based on the total of your current purchase and the current value of all other Class A Shares that you own. The reduced sales charge will apply only to current purchases and must be requested in writing when you buy your shares. Shares of any Fund held as follows cannot be combined with your current purchase for purposes of reduced sales charges:
• Shares held indirectly through financial intermediaries other than your current purchase broker-dealer (for example, a different broker-dealer, a bank, a separate insurance company account or an investment adviser);
• shares held through an administrator or trustee/custodian of an Employer Sponsored Retirement Plan (for example, a 401(k) plan) other than employer-sponsored IRAs; and
• shares held directly in a Fund account on which the broker-dealer (financial adviser) of record is different than your current purchase broker-dealer.
Whether a sales charge waiver is available for your retirement plan or charitable account depends upon the policies and procedures of your intermediary. Please consult your financial adviser for further information. Letters of Intent: Under a Letter of Intent (“LOI”), you commit to purchase a specified dollar amount of Class A Shares of the Funds, with a minimum of $50,000, during a 13-month period. At your written request, Class A Share purchases made during the previous 90 days may be included. The amount you agree to purchase determines the initial sales charge you pay. If the full-face amount of the LOI is not invested by the end of the 13-month period, your account will be adjusted to the higher initial sales charge level for the amount actually invested. You are not legally bound by the terms of your LOI to purchase the amount of your shares stated in the LOI. The LOI does, however, authorize the Funds to hold in escrow 5% of the total amount you intend to purchase. If you do not complete the total intended purchase at the end of the 13 month period, the Funds’ transfer agent will redeem the necessary portion of the escrowed shares to make up the difference between the reduced rate sales charge (based on the amount you intended to purchase) and the sales charge that would normally apply (based on the actual amount you purchased). Repurchase of Class A shares: If you have redeemed Class A Shares of a Fund within the past 120 days, you may repurchase an equivalent amount of Class A Shares of the Fund at NAV, without the normal front-end sales charge. In effect, this allows you to reacquire shares that you may have had to redeem, without repaying the front-end sales charge. You may exercise this privilege only once and must notify the Fund that you intend to do so in writing. The Fund must receive your purchase order within 120 days of your redemption. Note that if you reacquire shares through separate installments (e.g., through monthly or quarterly repurchases), the sales charge waiver will only apply to those portions of your repurchase order received within 120 days of your redemption. Sales Charge Waivers: The sales charge on purchases of Class A Shares is waived for certain types of investors, including:
• Current and retired directors and officers of the Funds sponsored by the adviser or any of its subsidiaries, their families (e.g., spouse, children, mother or father) and any purchases referred through the adviser.
• Employees of the adviser and their families, or any full-time employee or registered representative of the Distributor or of broker-dealers having dealer agreements with the Distributor (a “Selling Broker”) and their immediate families (or any trust, pension, profit sharing or other benefit plan for the benefit of such persons).
• Any full-time employee of a bank, savings and loan, credit union or other financial institution that utilizes a Selling Broker to clear purchases of a Fund’s shares and their immediate families.
• Participants in certain “wrap-fee” or asset allocation programs or other fee-based arrangements sponsored by broker-dealers and other financial institutions that have entered into agreements with the Distributor.
• Clients of financial intermediaries that have entered into arrangements with the Distributor providing for the shares to be used in particular investment products made available to such clients and for which such registered investment advisers may charge a separate fee.
• Institutional investors (which may include bank trust departments and registered investment advisers).
• Any accounts established on behalf of registered investment advisers or their clients by broker-dealers that charge a transaction fee and that have entered into agreements with the Distributor.
• Separate accounts used to fund certain unregistered variable annuity contracts or Section 403(b) or 401(a) or (k) accounts.

35
• Employer-sponsored retirement or benefit plans with total plan assets in excess of $5 million where the plan’s investments in the Funds are part of an omnibus account. A minimum initial investment of $1 million in a Fund is required. The Distributor in its sole discretion may waive these minimum dollar requirements.
The Funds do not waive sales charges for the reinvestment of proceeds from the sale of non-Fund shares where those shares were subject to a front-end sales charge (sometimes called an NAV transfer). Sales Charge Exceptions: You will not pay initial sales charges on Class A Shares purchased by reinvesting dividends and distributions. Class C Shares: Class C shares of the Funds are sold at NAV without an initial sales charge. This means that 100% of your initial investment is placed into shares of the Funds. Class C shares pay up to 1.00% on an annualized basis of the average daily net assets as reimbursement or compensation for service and distribution-related activities with respect to the Funds and/or shareholder services. Over time, fees paid under this distribution and service plan will increase the cost of a Class C shareholder’s investment and may cost more than other types of sales charges. Class I Shares: Class I shares of the Funds are sold at net asset value without an initial sales charge. This means that 100% of your initial investment is placed into shares of the Funds. Factors to Consider When Choosing a Share Class: When deciding which class of shares of the Funds to purchase, you should consider your investment goals, present and future amounts you may invest in the Funds, and the length of time you intend to hold your shares. To help you make a determination as to which class of shares to buy, please refer back to the examples of the Funds’ expenses over time in the “Fees and Expenses” Section of this Prospectus. You also may wish to consult with your financial adviser for advice with regard to which share class would be most appropriate for you. Promotional Incentives on Dealer Commissions: The Distributor may, from time to time, provide promotional incentives, including reallowance and/or payment of up to the entire sales charge, to certain investment firms. Such incentives may, at the Distributors discretion, be limited to investment firms who allow their individual selling representatives to participate in such additional commissions. Purchasing Shares: You may purchase shares of the Funds by sending a completed application form to:
via Regular Mail or Overnight Mail Navigator Tactical Fixed Income Fund, Navigator Duration Neutral Bond Fund,
Navigator Equity Hedged Fund, or Navigator Sentry Managed Volatility Fund
c/o Gemini Fund Services, LLC P.O. Box 541150
Omaha, Nebraska 68154
Navigator Tactical Fixed Income Fund, Navigator Duration Neutral Bond Fund,
Navigator Equity Hedged Fund, or Navigator Sentry Managed Volatility Fund
c/o Gemini Fund Services, LLC 17605 Wright Street, Suite 2
Omaha, Nebraska 68130 The Funds, however, reserve the right, in their sole discretion, to reject any application to purchase shares of the respective Funds. Applications will not be accepted unless they are accompanied by a check drawn on a U.S. bank, savings and loan, or credit union in U.S. Fund for the full amount of the shares to be purchased. After you open an account, you may purchase additional shares by sending a check together with a note stating the name(s) on the account and the account number to the above address. Make all checks payable to the Fund to be purchased: “Navigator Tactical Fixed Income Fund”, “Navigator Duration Neutral Bond Fund”, “Navigator Equity Hedged Fund”, or “Navigator Sentry Managed Volatility Fund.” The Funds will not accept payment in cash, including cashier’s checks or money orders. Also, to prevent check fraud, the Funds will not accept third-party checks, U.S. Treasury checks, credit card checks or starter checks for the purchase of shares. Note: Gemini Fund Services, LLC (“GFS” or “Transfer Agent”), the Funds’ transfer agent, will charge a $25 fee against a shareholder’s account, in addition to any loss sustained by the Funds, for any payment check returned to the Transfer Agent for insufficient funds. The USA PATRIOT Act requires financial institutions, including the Funds, to adopt certain policies and programs to prevent money-laundering activities, including procedures to verify the identity of customers opening new accounts. As requested on the application, you should supply your full name, date of birth, social security number and permanent street address. Mailing addresses containing a P.O. Box will not be accepted. This information will assist the Funds in verifying your identity. Until such verification is made, the Funds may temporarily limit additional share purchases. In addition, the Funds may limit additional share purchases or close an account if it is unable to verify a shareholder’s identity. As required by law, the Funds may employ various procedures, such as comparing the information to fraud databases or requesting additional information or documentation from you, to ensure that the information supplied by you is correct.

36
Purchase through Brokers: You may invest in the Funds through brokers or agents who have entered into selling agreements with the Funds’ Distributor. These brokers and agents are authorized to designate other intermediaries to receive purchase and redemption orders on behalf of the Funds. The Funds will be deemed to have received a purchase or redemption order when an authorized broker or its designee receives the order. The broker or agent may set its own initial and subsequent investment minimums. You may be charged a fee if you use a broker or agent to buy or redeem shares of the Funds. Finally, various servicing agents use procedures and impose restrictions that may be in addition to, or different from those applicable to investors purchasing shares directly from the Funds. You should carefully read the program materials provided to you by your servicing agent. Such brokers are authorized to designate other financial intermediaries to receive purchase and redemption orders on the Fund’s behalf. Purchase by Wire: If you wish to wire money to make an investment in the Funds, please call the Funds at 1-877-766-2264 for wiring instructions and to notify the Funds that a wire transfer is coming. Any commercial bank can transfer same-day Funds via wire. The Funds will normally accept wired Funds for investment on the day received if they are received by the Funds’ designated bank before the close of regular trading on the NYSE. Your bank may charge you a fee for wiring same-day funds. Automatic Investment Plan: You may participate in the Funds’ Automatic Investment Plan, an investment plan that automatically debits money from your bank account and invests it in the Funds through the use of electronic fund transfers or automatic bank drafts. You may elect to make subsequent investments by transfers of a minimum of $250 on specified days of each month into your established Fund account. Please contact the Fund at 1-877-766-2264 for more information about the Funds’ Automatic Investment Plan. Retirement Plans: You may purchase shares of the Funds for your individual retirement plans. Please call the Funds at 1-877-766-2264 for the most current listing and appropriate disclosure documentation on how to open a retirement account. Minimum and Additional Investment Amounts: The minimum initial investment in Class A, Class C and Class I shares is $5,000, $5,000 and $25,000, respectively. The minimum subsequent investment in Class A and Class C is $500. Class I shares have no minimum subsequent investment requirement. The Funds reserve the right to waive any minimum. There is no minimum investment requirement when you are buying shares by reinvesting dividends and distributions from the Funds. The Funds reserve the right to waive any investment minimum. When Your Order is Processed: All shares will be purchased at the NAV per share (plus applicable sales charges, if any) next determined after the Funds receive your application or request in good order. All requests received in good order by the Funds before 4:00 p.m. (Eastern Time) will be processed on that same day. Requests received after 4:00 p.m. will be processed on the next business day.
Good Order: When making a purchase request, make sure your request is in good order. “Good order” means your purchase includes:
• the name of the Fund;
• the dollar amount of shares to be purchased;
• a completed purchase application corresponding to the type of account you are opening, or a completed investment stub (make sure your investment meets the account minimum or subsequent purchase investment minimum); and
• a check payable to “Navigator Tactical Fixed Income Fund”, “Navigator Duration Neutral Bond Fund”, “Navigator Equity Hedged Fund”, or “Navigator Sentry Managed Volatility Fund.”

37
HOW TO REDEEM SHARES Redeeming Shares: The Funds typically expect that it will take up to 7 days following the receipt of your redemption request to pay out redemption proceeds by check or electronic transfer. The Funds typically expect to pay redemptions from cash, cash equivalents, proceeds from the sale of Fund shares, any lines of credit, and then from the sale of portfolio securities. These redemption payment methods will be used in regular and stressed market conditions. You will be entitled to redeem all or any portion of the shares credited to your accounts by submitting a written request for redemption to:
via Regular Mail or Overnight Mail Navigator Tactical Fixed Income Fund, Navigator Duration Neutral Bond Fund,
Navigator Equity Hedged Fund, or Navigator Sentry Managed Volatility Fund
c/o Gemini Fund Services, LLC P.O. Box 541150
Omaha, Nebraska 68154
Navigator Tactical Fixed Income Fund, Navigator Duration Neutral Bond Fund,
Navigator Equity Hedged Fund, or Navigator Sentry Managed Volatility Fund
c/o Gemini Fund Services, LLC 17605 Wright Street, Suite 2
Omaha, Nebraska 68130 Redeeming by Telephone: The telephone redemption privilege is automatically available to all new accounts except retirement accounts. If you do not want the telephone redemption privilege, you must indicate this in the appropriate area on your account application or you must write to the Funds and instruct it to remove this privilege from your account. The proceeds can be sent by mail to the address designated on your account, wired directly to your existing account in any commercial bank or brokerage firm or electronic funds transferred to your existing bank account in the United States as designated on your application. To redeem by telephone, call 1-877-766-2264. The redemption proceeds normally will be sent by mail, wire or electronic funds transfer within three business days after receipt of your telephone instructions. IRA accounts are not redeemable by telephone. The Funds reserve the right to suspend the telephone redemption privileges with respect to your account if the name(s) or the address on the account has been changed within the previous 30 days. Neither the Funds, GFS, nor their respective affiliates, will be liable for complying with telephone instructions they reasonably believe to be genuine or for any loss, damage, cost or expenses in acting on such telephone instructions and you will be required to bear the risk of any such loss. The Funds or GFS, or both, will employ reasonable procedures to determine that telephone instructions are genuine. If the Funds and/or GFS do not employ these procedures, they may be liable to you for losses due to unauthorized or fraudulent instructions. These procedures may include, among others, requiring forms of personal identification prior to acting upon telephone instructions, providing written confirmation of the transactions and/or tape recording telephone instructions. Redeeming through Broker: If shares of the Funds are held by a broker-dealer, financial institution or other servicing agent, you must contact that servicing agent to redeem shares of the Funds. The servicing agent may charge a fee for this service. Redemptions by Wire/Electronic Funds Transfer: If you request your redemption by wire transfer, you will be required to pay a $15.00 wire transfer fee to GFS to cover costs associated with the transfer but GFS does not charge a fee when transferring redemption proceeds by electronic funds transfer. In addition, your bank may impose a charge for receiving wires. Systematic Withdrawal Plan: If your individual account, IRA or other qualified plan account has a current account value of at least $25,000, you may adopt a Systematic Withdrawal Plan to provide for monthly, quarterly or other periodic checks for any designated amount of $100 or more. If you wish to open a Systematic Withdrawal Plan, please indicate on your application or contact the Funds at 1-877-766-2264. Redemptions in Kind: The Funds reserve the right to honor requests for redemption or repurchase orders by making payment in whole or in part in readily marketable securities (“redemption in kind”) if the amount of such a request is large enough to affect operations (for example, if the request is greater than $250,000 or 1% of the Funds’ assets). The securities will be chosen by the Funds and valued at the Funds’ net asset value. A shareholder may incur transaction expenses in converting these securities to cash. When Redemptions are Sent: Once the Funds receive your redemption request in “good order” as described below, it will issue a check based on the next determined NAV following your redemption request. If you purchase shares using a check and soon after request a redemption, your redemption will not be processed until the check for your purchase has cleared.

38
Good Order: Your written redemption request will be processed if it is in “good order.” To be in good order, the following conditions must be satisfied:
• The request should be in writing, unless you are redeeming by telephone, indicating the number of shares or dollar amount to be redeemed;
• the request must identify your account number;
• the request should be signed by you and any other person listed on the account, exactly as the shares are registered; and
• if you request the redemption proceeds be sent to an address other than that of record, or if the address was changed within the last 30 days, or if the proceeds of a requested redemption exceed $100,000, the signature(s) on the request must be medallion signature guaranteed by an eligible signature guarantor.
When You Need Medallion Signature Guarantees: A medallion signature guarantee assures that a signature is genuine and protects you from unauthorized account transfers. You will need your signature guaranteed if:
• you wish to change the bank or brokerage account that you have designated on your account,
• you request a redemption to be made payable to a person not on record with the Fund,
• you request that a redemption be mailed to an address other than that on record with the Fund,
• the proceeds of a requested redemption exceed $100,000,
• any redemption is transmitted by federal wire transfer to a bank other than the bank of record, or
• your address was changed within 30 days of your redemption request. Signatures may be guaranteed by any eligible guarantor institution (including banks, brokers and dealers, credit unions, national securities exchanges, registered securities associations, clearing agencies and savings associations) or by completing a supplemental telephone redemption authorization form. Contact the Funds to obtain this form. Further documentation will be required to change the designated account if, shares are held by a corporation, fiduciary or other organization. A notary public cannot guarantee signatures. Retirement Plans: If you own an IRA or other retirement plan, you must indicate on your redemption request whether the Trust should withhold federal income tax. Unless you elect in your redemption request that you do not want to have federal tax withheld, the redemption will be subject to withholding. Low Balances: If at any time your Class A, Class C or Class I account balance falls below $5,000, $5,000 and $25,000, respectively, the Funds may notify you that, unless the account is brought up to at least $5,000, $5,000 and $25,000, respectively within 30 days of the notice, your account could be closed. After the notice period, the Funds may redeem all of your shares and close your account by sending you a check to the address of record. Your account will not be closed if the account balance drops below required minimums due to a decline in NAV. The Funds will not charge any redemption fee on involuntary redemptions. TAX STATUS, DIVIDENDS AND DISTRIBUTIONS Any sale or exchange of the Funds’ shares may generate tax liability (unless you are a tax-exempt investor or your investment is in a qualified retirement account). When you redeem your shares you may realize a taxable gain or loss. This is measured by the difference between the proceeds of the sale and the tax basis for the shares you sold. (To aid in computing your tax basis, you generally should retain your account statements for the period that you hold shares in the Funds.) The Funds intend to distribute substantially all of its net investment income on a quarterly basis and net capital gain annually in December. Both distributions will be reinvested in shares of the Funds unless you elect to receive cash. Dividends from net investment income (including any excess of net short-term capital gain over net long-term capital loss) are taxable to investors as ordinary income, while distributions of net capital gain (the excess of net long-term capital gain over net short-term capital loss) are generally taxable as long-term capital gain, regardless of your holding period for the shares. Any dividends or capital gain distributions you receive from the Funds will normally be taxable to you when made, regardless of whether you reinvest dividends or capital gain distributions or receive them in cash. Certain dividends or distributions declared in October, November or December will be taxed to shareholders as if received in December if they are paid during the following January. Each year the Funds will inform you of the amount and type of your distributions. IRAs and other qualified retirement plans are exempt from federal income taxation.

39
Your redemptions, including exchanges, may result in a capital gain or loss for federal tax purposes. A capital gain or loss on your investment is the difference between the cost of your shares, including any sales charges, and the amount you receive when you sell them. On the account application, you will be asked to certify that your social security number or taxpayer identification number is correct and that you are not subject to backup withholding for failing to report income to the IRS. If you are subject to backup withholding or you did not certify your taxpayer identification number, the IRS requires the Funds to withhold a percentage of any dividend, redemption or exchange proceeds. The Funds reserve the right to reject any application that does not include a certified social security or taxpayer identification number. If you do not have a social security number, you should indicate on the purchase form that your application to obtain a number is pending. The Funds are required to withhold taxes if a number is not delivered to the Funds within seven days. This summary is not intended to be and should not be construed to be legal or tax advice to any current holder of the Funds’ shares. You should consult your own tax advisers to determine the tax consequences of owning the Funds’ shares. FREQUENT PURCHASES AND REDEMPTIONS OF FUND SHARES The Funds discourages and do not accommodate market timing. Frequent trading into and out of the Funds may harm all fund shareholders by disrupting the Funds’ investment strategies, increasing Fund expenses, decreasing tax efficiency and diluting the value of shares held by long-term shareholders. The Funds are designed for long-term investors and is not intended for market timing or other potentially disruptive trading activities. Accordingly, the Funds’ Board has approved policies that seek to curb these disruptive activities while recognizing that shareholders may have a legitimate need to adjust their fund investments as their financial needs or circumstances change. The Funds currently commits staff to review, on a continuing basis, recent trading activity in order to identify trading activity that may be contrary to the Funds’ “Market Timing Trading Policy.” Though this method involves judgments that are inherently subjective and involve some selectivity in their application, the Funds seek to make judgments and applications that are consistent with the interests of the Funds’ shareholders. The Funds reserve the right to reject or restrict purchase or exchange requests for any reason, particularly when the shareholder’s trading activity suggests that the shareholder may be engaged in market timing or other disruptive trading activities. Neither the Funds nor the adviser will be liable for any losses resulting from rejected purchase or exchange orders. The adviser may also bar an investor who has violated these policies (and the investor’s financial adviser) from opening new accounts with the Funds. Although the Funds attempt to limit disruptive trading activities, some investors use a variety of strategies to hide their identities and their trading practices. There can be no guarantee that the Funds will be able to identify or limit these activities. Omnibus account arrangements are common forms of holding shares of the Funds. While the Funds will encourage financial intermediaries to apply the Funds’ Market Timing Trading Policy to their customers who invest indirectly in the Funds, the Funds are limited in its ability to monitor the trading activity or enforce the Funds’ Market Timing Trading Policy with respect to customers of financial intermediaries. For example, should it occur, the Funds may not be able to detect market timing that may be facilitated by financial intermediaries or made difficult to identify in the omnibus accounts used by those intermediaries for aggregated purchases, exchanges and redemptions on behalf of all their customers. More specifically, unless the financial intermediaries have the ability to apply the Funds’ Market Timing Trading Policy to their customers through such methods as implementing short-term trading limitations or restrictions and monitoring trading activity for what might be market timing, the Funds may not be able to determine whether trading by customers of financial intermediaries is contrary to the Funds’ Market Timing Trading Policy. If the Funds or its transfer agent or shareholder servicing agent suspects there is market timing activity in the account, the Funds will seek full cooperation from the service provider maintaining the account to identify the underlying participant. At the request of the adviser, the service providers may take immediate action to stop any further short-term trading by such participants.

40
DISTRIBUTION OF SHARES Distributor: Northern Lights Distributors, LLC, 17605 Wright Street, Omaha, Nebraska 68130, is the distributor for the shares of the Funds. Northern Lights Distributors, LLC is a registered broker-dealer and member of the Financial Industry Regulatory Authority, Inc. (“FINRA”). Shares of the Funds are offered on a continuous basis. Distribution (12b-1) and Shareholder Servicing Fees: The Trust, with respect to the Funds, has adopted, the Trust’s Master Distribution and Shareholder Servicing Plan for Class A and Class C (the “Plans”), pursuant to Rule 12b-1 of the 1940 Act, under which the Funds may pay the Funds’ distributor an annual fee for distribution and shareholder servicing expenses of 0.25% and 1.00% of the Funds’ average daily net assets attributable to Class A and Class C shares, respectively. Because these fees are paid out of the Funds’ assets on an on-going basis, over time these fees will increase the cost of your investment and may cost you more than paying other types of sales charges. The Funds’ distributor and other entities are paid under the Plan for services provided and the expenses borne by the distributor and others in the distribution of Fund shares, including the payment of commissions for sales of the shares and incentive compensation to and expenses of dealers and others who engage in or support distribution of shares or who service shareholder accounts, including overhead and telephone expenses; printing and distribution of prospectuses and reports used in connection with the offering of the Funds’ shares to other than current shareholders; and preparation, printing and distribution of sales literature and advertising materials. In addition, the distributor or other entities may utilize fees paid pursuant to the Plan to compensate dealers or other entities for their opportunity costs in advancing such amounts, which compensation would be in the form of a carrying charge on any un-reimbursed expenses. You should be aware that if you hold your shares for a substantial period of time, you may indirectly pay more than the economic equivalent of the maximum front-end sales charge allowed by FINRA due to the recurring nature of distribution (12b-1) fees. Additional Compensation to Financial Intermediaries: The Distributor, its affiliates, and the Funds’ adviser and their affiliates may each, at its own expense and out of its own legitimate profits, provide additional cash payments to financial intermediaries who sell shares of the Funds. Financial intermediaries include brokers, financial planners, banks, insurance companies, retirement or 401(k) plan administrators and others. These payments may be in addition to the Rule 12b-1 fees and any sales charges that are disclosed elsewhere in this Prospectus. These payments are generally made to financial intermediaries that provide shareholder or administrative services, or marketing support. Marketing support may include access to sales meetings, sales representatives and financial intermediary management representatives, inclusion of the Funds on a sales list, including a preferred or select sales list, or other sales programs. These payments also may be made as an expense reimbursement in cases where the financial intermediary provides shareholder services to Fund shareholders. The distributor may, from time to time, provide promotional incentives, including reallowance and/or payment of up to the entire sales charge, to certain investment firms. Such incentives may, at the distributor’s discretion, be limited to investment firms who allow their individual selling representatives to participate in such additional commissions. Householding: To reduce expenses, we mail only one copy of the Prospectus and each annual and semi-annual report to those addresses shared by two or more accounts. If you wish to receive individual copies of these documents, please call the Funds at 1-877-766-2264 between the hours of 8:30 a.m. and 6:00 p.m. Eastern Time on days the Funds are open for business or contact your financial institution. We will begin sending you individual copies thirty days after receiving your request.

41
FINANCIAL HIGHLIGHTS The financial highlights table is intended to help you understand the Funds’ financial performance for the period of the Funds’ operations. Certain information reflects financial results for a single Fund share. The total returns in the table represent the rate that an investor would have earned (or lost) on an investment in the Funds (assuming reinvestment of all dividends and distributions). This information for the Funds has been derived from the financial statements audited by BBD, LLP, whose report, along with the Funds’ financial statements, are included in the Funds’ September 30, 2017 annual report, which is available upon request.
The table below sets forth financial data for one share of beneficial interest outstanding throughout each year presented.
Navigator Equity Hedged Fund - Class A
For the
For the
For the
For the
For the
Year Ended
Year Ended
Year Ended
Year Ended
Year Ended
September 30, 2017
September 30, 2016
September 30, 2015
September 30, 2014
September 30, 2013
Net Asset Value, Beginning of Year $8.83
$8.72
$9.60
$9.61
$9.00
From Operations:
Net investment income(a) 0.06
0.06
0.02
0.02
0.01
Net gain (loss) from securities
(both realized and unrealized) 0.97
0.35
(0.50)
0.25
0.60
Total from operations 1.03
0.41
(0.48)
0.27
0.61
Distributions to shareholders from:
Net investment income (0.08)
(0.03)
(0.01)
-
(0.00) (e)
Net realized gains -
(0.27)
(0.39)
(0.28)
-
Total distributions (0.08)
(0.30)
(0.40)
(0.28)
(0.00)
Net Asset Value, End of Year $9.78
$8.83
$8.72
$9.60
$9.61
Total Return(b) 11.68%
4.83%
(5.37)%
2.84%
6.83%
Ratios/Supplemental Data
Net assets, end of year (in 000’s) $11,465
$7,022
$3,838
$3,858
$3,420
Ratio of expenses to average net assets,
before waivers/reimbursement(c) 1.53%
1.37% (g) 1.41%
1.31%
1.31%
net of waivers/reimbursement(c) 1.32%
1.37% (g) 1.35%
1.34% (f) 1.35% (f)
Ratio of net investment income to average net assets(c)(d) 0.68%
0.67%
0.26%
0.24%
0.10%
Portfolio turnover rate 371%
363%
292%
353%
446%
(a) Per share amounts are calculated using the average shares method, which more appropriately presents the per share data for the period.
(b) Total returns are historical in nature and assume changes in share price, reinvestment of dividends and capital gains distributions, if any, and exclude any sales charges (loads).
(c) Does not include the expenses of other investment companies in which the Fund invests.
(d) Recognition of net investment income by the Fund is affected by the timing of the declaration of dividends by the underlying investment companies in which the Fund invests.
(e) Per share amount represents less than $0.01 per share.
(f) Represents the ratio of expenses to average net assets inclusive of Advisor’s recapture of waived/reimbursed fees from prior periods.
(g) Ratio includes 0.02% attributed to interest expense.

42
The table below sets forth financial data for one share of beneficial interest outstanding throughout each year presented.
Navigator Equity Hedged Fund - Class C
For the
For the
For the
For the
For the
Year Ended
Year Ended
Year Ended
Year Ended
Year Ended
September 30, 2017
September 30, 2016
September 30, 2015
September 30, 2014
September 30, 2013
Net Asset Value, Beginning of Year $8.48
$8.42
$9.34
$9.43
$8.89
From Operations:
Net investment loss(a) (0.01)
(0.01)
(0.05)
(0.06)
(0.06)
Net gain (loss) from securities
(both realized and unrealized) 0.94
0.34
(0.48)
0.25
0.60
Total from operations 0.93
0.33
(0.53)
0.19
0.54
Distributions to shareholders from:
Net realized gains -
(0.27)
(0.39)
(0.28)
-
Total distributions -
(0.27)
(0.39)
(0.28)
-
Net Asset Value, End of Year $9.41
$8.48
$8.42
$9.34
$9.43
Total Return(b) 10.97%
4.04%
(6.05)%
2.02%
6.07%
Ratios/Supplemental Data
Net assets, end of year (in 000’s) $506
$787
$1,228
$1,791
$2,608
Ratio of expenses to average net assets,
before waivers/reimbursement(c) 2.28%
2.24% (g) 2.16%
2.06%
2.06%
net of waivers/reimbursement(c) 2.07%
2.12% (g) 2.10%
2.09% (f) 2.10% (f)
Ratio of net investment loss to average net assets(c)(d) (0.07)%
(0.11)%
(0.57)%
(0.62)%
(0.68)%
Portfolio turnover rate 371%
363%
292%
353%
446%
(a) Per share amounts are calculated using the average shares method, which more appropriately presents the per share data for the period. (b) Total returns are historical in nature and assume changes in share price, reinvestment of dividends and capital gains distributions, if any, and
exclude any sales charges (loads). (c) Does not include the expenses of other investment companies in which the Fund invests. (d) Recognition of net investment income by the Fund is affected by the timing of the declaration of dividends by the underlying investment companies
in which the Fund invests. (e) Per share amount represents less than $0.01 per share. (f) Represents the ratio of expenses to average net assets inclusive of Advisor’s recapture of waived/reimbursed fees from prior periods. (g) Ratio includes 0.02% attributed to interest expense.

43
The table below sets forth financial data for one share of beneficial interest outstanding throughout each year presented.
Navigator Equity Hedged Fund - Class I
For the
For the
For the
For the
For the
Year Ended
Year Ended
Year Ended
Year Ended
Year Ended
September 30, 2017
September 30, 2016
September 30, 2015
September 30, 2014
September 30, 2013
Net Asset Value, Beginning of Year $8.87
$8.76
$9.64
$9.65
$9.03
From Operations:
Net investment income(a) 0.09
0.08
0.04
0.04
0.03
Net gain (loss) from securities
(both realized and unrealized) 0.97
0.35
(0.50)
0.25
0.62
Total from operations 1.06
0.43
(0.46)
0.29
0.65
Distributions to shareholders from:
Net investment income (0.09)
(0.05)
(0.03)
(0.02)
(0.03)
Net realized gains -
(0.27)
(0.39)
(0.28)
-
Total distributions (0.09)
(0.32)
(0.42)
(0.30)
(0.03)
Net Asset Value, End of Year $9.84
$8.87
$8.76
$9.64
$9.65
Total Return(b) 12.04%
5.01%
(5.10)%
3.01%
7.19%
Ratios/Supplemental Data
Net assets, end of year (in 000’s) $32,151
$34,298
$45,675
$72,695
$88,121
Ratio of expenses to average net assets,
before waivers/reimbursement(c) 1.28%
1.24% (f) 1.16%
1.06%
1.06%
net of waivers/reimbursement(c) 1.07%
1.12% (f) 1.10%
1.09% (e) 1.10% (e)
Ratio of net investment income to average net assets(c)(d) 0.94%
0.91%
0.43%
0.43%
0.37%
Portfolio turnover rate 371%
363%
292%
353%
446%
(a) Per share amounts are calculated using the average shares method, which more appropriately presents the per share data for the period. (b) Total returns are historical in nature and assume changes in share price, reinvestment of dividends and capital gains distributions, if any. (c) Does not include the expenses of other investment companies in which the Fund invests. (d) Recognition of net investment income by the Fund is affected by the timing of the declaration of dividends by the underlying investment companies
in which the Fund invests. (e) Represents the ratio of expenses to average net assets inclusive of Advisor’s recapture of waived/reimbursed fees from prior periods. (f) Ratio includes 0.02% attributed to interest expense.

44
The table below sets forth financial data for one share of beneficial interest outstanding throughout each period presented.
Navigator Duration Neutral Bond Fund - Class A
For the Year Ended September
30, 2017
For the Year Ended September
30, 2016
For the Year Ended September
30, 2015
For the Year Ended September
30, 2014
For the Period September 23,
2013* to September 30,
2013
Net Asset Value, Beginning of Period $10.13
$10.03
$10.42
$10.00
$10.00
From Operations:
Net investment income (loss)(a) 0.13
0.13
0.13
0.13
(0.00) (g)
Net gain (loss) from securities
(both realized and unrealized) 0.15
0.10
(0.36)
0.35
(0.00) (g)
Total from operations 0.28
0.23
(0.23)
0.48
(0.00)
Distributions to shareholders from:
Net investment income (0.14)
(0.13)
(0.12)
(0.06)
-
Net realized gains -
-
(0.04)
-
-
Total distributions (0.14)
(0.13)
(0.16)
(0.06)
-
Net Asset Value, End of Period $10.27
$10.13
$10.03
$10.42
$10.00
Total Return(b) 2.82%
2.28%
(2.18)%
4.82%
0.00% (d)
Ratios/Supplemental Data
Net assets, end of period (in 000’s) $1,017
$1,371
$1,362
$306
$100 (i)
Ratio of expenses to average net assets,
before waivers/reimbursement/recapture 1.60% (e) 1.61% (e) 1.90% (e) 2.56% (e)(h) 4.61% (c)
net of waivers/reimbursement/recapture 1.60% (e) 1.68% (e)(j) 1.90% (e) 2.01% (e)(h) 1.90% (c)
Ratio of net investment income (loss) to average net assets 1.31% (e)(f) 1.26% (e)(f) 1.32% (e)(f) 1.25% (e)(f) (1.90)% (c)
Portfolio turnover rate 39%
97%
81%
281%
0% (d)
* Commencement of operations. (a) Per share amounts are calculated using the average shares method, which more appropriately presents the per share data for the period. (b) Total returns are historical in nature and assume changes in share price, reinvestment of dividends and capital gains distributions, if any, and
exclude any sales charges (loads). (c) Annualized. (d) Not annualized. (e) Does not include the expenses of other investment companies in which the Fund invests. (f) Recognition of net investment income by the Fund is affected by the timing of the declaration of dividends by the underlying investment companies
in which the Fund invests. (g) Per share amount represents less than $0.01 per share. (h) Ratio includes, 0.11% and 0.06% for the year ended September 30, 2014 attributed to interest expense, for Class A and C, respectively. (i) Amount is actual; not presented in thousands. (j) Represents the ratio of expenses to average net assets inclusive of Advisor’s recapture of waived/reimbursed fees from prior periods.

45
The table below sets forth financial data for one share of beneficial interest outstanding throughout each period presented.
Navigator Duration Neutral Bond Fund - Class C
For the Year Ended September
30, 2017
For the Year Ended September
30, 2016
For the Year Ended September
30, 2015
For the Year Ended September
30, 2014
For the Period September 23,
2013* to September 30,
2013
Net Asset Value, Beginning of Period $10.05
$9.96
$10.36
$10.00
$10.00
From Operations:
Net investment income (loss)(a) 0.06
0.05
0.06
0.06
(0.00) (g)
Net gain (loss) from securities
(both realized and unrealized) 0.14
0.11
(0.37)
0.37
(0.00) (g)
Total from operations 0.20
0.16
(0.31)
0.43
(0.00)
Distributions to shareholders from:
Net investment income (0.08)
(0.07)
(0.05)
(0.07)
-
Net realized gains -
-
(0.04)
-
-
Total distributions (0.08)
(0.07)
(0.09)
(0.07)
-
Net Asset Value, End of Period $10.17
$10.05
$9.96
$10.36
$10.00
Total Return(b) 1.95%
1.56%
(2.95)%
4.29%
0.00% (d)
Ratios/Supplemental Data
Net assets, end of period (in 000’s) $322
$522
$767
$398
$100 (i)
Ratio of expenses to average net assets,
before waivers/reimbursement/recapture 2.35% (e) 2.39% (e) 2.65% (e) 3.15% (e)(h) 5.36% (c)
net of waivers/reimbursement/recapture 2.35% (e) 2.45% (e)(j) 2.65% (e) 2.71% (e)(h) 2.65% (c)
Ratio of net investment income (loss) to average net assets 0.56% (e)(f) 0.46% (e)(f) 0.55% (e)(f) 0.53% (e)(f) (2.65)% (c)
Portfolio turnover rate 39%
97%
81%
281%
0% (d)
* Commencement of operations. (a) Per share amounts are calculated using the average shares method, which more appropriately presents the per share data for the period. (b) Total returns are historical in nature and assume changes in share price, reinvestment of dividends and capital gains distributions, if any, and
exclude any sales charges (loads). (c) Annualized. (d) Not annualized. (e) Does not include the expenses of other investment companies in which the Fund invests. (f) Recognition of net investment income by the Fund is affected by the timing of the declaration of dividends by the underlying investment companies
in which the Fund invests. (g) Per share amount represents less than $0.01 per share. (h) Ratio includes, 0.11% and 0.06% for the year ended September 30, 2014 attributed to interest expense, for Class A and C, respectively. (i) Amount is actual; not presented in thousands. (j) Represents the ratio of expenses to average net assets inclusive of Advisor’s recapture of waived/reimbursed fees from prior periods.

46
The table below sets forth financial data for one share of beneficial interest outstanding throughout each period presented.
Navigator Duration Neutral Bond Fund - Class I
For the Year Ended September
30, 2017
For the Year Ended September
30, 2016
For the Year Ended September
30, 2015
For the Year Ended September
30, 2014
For the Period September 23,
2013* to September 30,
2013
Net Asset Value, Beginning of Period $10.10
$10.00
$10.39
$10.00
$10.00
From Operations:
Net investment income (loss)(a) 0.16
0.15
0.16
0.12
(0.00) (g)
Net gain (loss) from securities
(both realized and unrealized) 0.14
0.11
(0.37)
0.38
(0.00) (g)
Total from operations 0.30
0.26
(0.21)
0.50
(0.00)
Distributions to shareholders from:
Net investment income (0.17)
(0.16)
(0.14)
(0.11)
-
Net realized gains -
-
(0.04)
-
-
Total distributions (0.17)
(0.16)
(0.18)
(0.11)
-
Net Asset Value, End of Period $10.23
$10.10
$10.00
$10.39
$10.00
Total Return(b) 2.99%
2.55%
(2.03)%
5.03%
0.00% (d)
Ratios/Supplemental Data
Net assets, end of period (in 000’s) $55,741
$77,470
$72,143
$29,837
$7,002
Ratio of expenses to average net assets,
before waivers/reimbursement/recapture 1.35% (e) 1.35% (e) 1.65% (e) 2.21% (e)(h) 4.36% (c)
net of waivers/reimbursement/recapture 1.35% (e) 1.42% (e)(i) 1.65% (e) 1.71% (e)(h) 1.65% (c)
Ratio of net investment income (loss) to average net assets 1.55% (e)(f) 1.50% (e)(f) 1.55% (e)(f) 1.16% (e)(f) (1.64)% (c)
Portfolio turnover rate 39%
97%
81%
281%
0% (d)
* Commencement of operations. (a) Per share amounts are calculated using the average shares method, which more appropriately presents the per share data for the period. (b) Total returns are historical in nature and assume changes in share price, reinvestment of dividends and capital gains distributions, if any. (c) Annualized. (d) Not annualized. (e) Does not include the expenses of other investment companies in which the Fund invests. (f) Recognition of net investment income by the Fund is affected by the timing of the declaration of dividends by the underlying investment companies
in which the Fund invests. (g) Per share amount represents less than $0.01 per share. (h) Ratio includes 0.06% for the year ended September 30, 2014 attributed to interest expense for Class I. (i) Represents the ratio of expenses to average net assets inclusive of Advisor’s recapture of waived/reimbursed fees from prior periods.

47
The table below sets forth financial data for one share of beneficial interest outstanding throughout each period presented.
Navigator Sentry Managed Volatility Fund - Class A
For the
For the
For the
For the Period
Year Ended
Year Ended
Year Ended
March 6, 2014* to
September 30, 2017
September 30, 2016
September 30, 2015
September 30, 2014
Net Asset Value, Beginning of Period $4.16
$6.86
$7.83
$10.00
From Operations:
Net investment loss(a) (0.04)
(0.08)
(0.10)
(0.00) (g)
Net loss from securities
(both realized and unrealized) (2.15)
(2.62)
(0.87)
(2.17)
Total from operations (2.19)
(2.70)
(0.97)
(2.17)
Net Asset Value, End of Period $1.97
$4.16
$6.86
$7.83
Total Return(b) (52.64)%
(39.36)%
(12.39)%
(21.70)% (d)
Ratios/Supplemental Data
Net assets, end of period (in 000’s) $2
$5
$8
$8 (h)
Ratio of expenses to average net assets,
before waiver/reimbursement(e) 2.17% (i) 1.90% (i) 1.66%
1.65% (c)
net of waivers/reimbursement(e) 1.56% (i) 1.65% (i) 1.50%
1.50% (c)
Ratio of net investment loss to average net assets(e)(f) (1.16)%
(1.57)%
(1.50)%
(1.50)% (c)
Portfolio turnover rate 0%
3,321%
84,387%
148% (d)
* Commencement of operations. (a) Per share amounts are calculated using the average shares method, which more appropriately presents the per share data for the period. (b) Total returns are historical in nature and assume changes in share price, reinvestment of dividends and capital gains distributions, if any, and
exclude any sales charges (loads). (c) Annualized. (d) Not annualized. (e) Does not include the expenses of other investment companies in which the Fund invests. (f) Recognition of net investment income by the Fund is affected by the timing of the declaration of dividends by the underlying investment companies
in which the Fund invests. (g) Per share amount represents less than $0.01 per share. (h) Amount is actual; not presented in thousands. (i) Ratio includes 0.15% and 0.06%, respectively, for the years ended September 30, 2016 and 2017 attributed to interest expense.

48
The table below sets forth financial data for one share of beneficial interest outstanding throughout each period presented.
Navigator Sentry Managed Volatility Fund - Class C
For the
For the
For the
For the Period
Year Ended
Year Ended
Year Ended
March 6, 2014* to
September 30, 2017
September 30, 2016
September 30, 2015
September 30, 2014
Net Asset Value, Beginning of Period $4.19
$6.87
$7.83
$10.00
From Operations:
Net investment loss(a) -
-
-
(0.00) (g)
Net loss from securities
(both realized and unrealized) (2.21)
(2.68)
(0.96)
(2.17)
Total from operations (2.21)
(2.68)
(0.96)
(2.17)
Net Asset Value, End of Period $1.98
$4.19
$6.87
$7.83
Total Return(b) (52.74)%
(39.01)%
(12.26)%
(21.70)% (d)
Ratios/Supplemental Data
Net assets, end of period (in 000’s) $2
(h)
$4 (h)
$7 (h)
$8 (h)
Ratio of expenses to average net assets,
before waivers/reimbursement(e) 2.92% (i) 2.65% (i) 2.41% 2.40% (c)
net of waivers/reimbursement(e) 2.31% (i) 2.40% (i) 2.25% 2.25% (c)
Ratio of net investment loss to average net assets(e)(f) (2.25)%
(2.32)%
(2.25)%
(2.25)% (c)
Portfolio turnover rate 0%
3,321%
84,387%
148% (d)
* Commencement of operations. (a) Per share amounts are calculated using the average shares method, which more appropriately presents the per share data for the period. (b) Total returns are historical in nature and assume changes in share price, reinvestment of dividends and capital gains distributions, if any, and
exclude any sales charges (loads). (c) Annualized. (d) Not annualized. (e) Does not include the expenses of other investment companies in which the Fund invests. (f) Recognition of net investment income by the Fund is affected by the timing of the declaration of dividends by the underlying investment companies
in which the Fund invests. (g) Per share amount represents less than $0.01 per share. (h) Amount is actual; not presented in thousands. (i) Ratio includes 0.15% and 0.06%, respectively, for the years ended September 30, 2016 and 2017 attributed to interest expense.

49
The table below sets forth financial data for one share of beneficial interest outstanding throughout each period presented.
Navigator Sentry Managed Volatility Fund - Class I
For the
For the
For the
For the Period
Year Ended
Year Ended
Year Ended
March 6, 2014* to
September 30, 2017
September 30, 2016
September 30, 2015
September 30, 2014
Net Asset Value, Beginning of Period $4.19
$6.87
$7.83
$10.00
From Operations:
Net investment loss(a) (0.03)
(0.07)
(0.09)
(0.06)
Net loss from securities
(both realized and unrealized) (2.18)
(2.61)
(0.87)
(2.11)
Total from operations (2.21)
(2.68)
(0.96)
(2.17)
Net Asset Value, End of Period $1.98
$4.19
$6.87
$7.83
Total Return(b) (52.74)%
(39.01)%
(12.26)%
(21.70)% (d)
Ratios/Supplemental Data
Net assets, end of period (in 000’s) $12,282
$20,857
$37,584
$48,469
Ratio of expenses to average net assets,
before waivers/reimbursement(e) 1.96% (g) 1.65% (g) 1.41%
1.40% (c)
net of waivers/reimbursement(e) 1.31% (g) 1.40% (g) 1.25%
1.25% (c)
Ratio of net investment loss to average net assets(e)(f) (0.95)%
(1.32)%
(1.25)%
(1.22)% (c)
Portfolio turnover rate 0%
3,321%
84,387%
148% (d)
* Commencement of operations. (a) Per share amounts are calculated using the average shares method, which more appropriately presents the per share data for the period. (b) Total returns are historical in nature and assume changes in share price, reinvestment of dividends and capital gains distributions, if any. (c) Annualized. (d) Not annualized. (e) Does not include the expenses of other investment companies in which the Fund invests. (f) Recognition of net investment income by the Fund is affected by the timing of the declaration of dividends by the underlying investment companies in
which the Fund invests. (g) Ratio includes 0.15% and 0.06%, respectively, for the years ended September 30, 2016 and 2017 attributed to interest expense.

50
The table below sets forth financial data for one share of beneficial interest outstanding throughout each period presented.
Navigator Tactical Fixed Income Fund - Class A
For the
For the
For the
For the Period
Year Ended
Year Ended
Year Ended
March 27, 2014* to
September 30, 2017
September 30, 2016
September 30, 2015
September 30, 2014
Net Asset Value, Beginning of Period $10.42
$9.55
$9.79
$10.00
From Operations:
Net investment income(a) 0.06
0.22
0.18
0.20
Net gain (loss) from securities
(both realized and unrealized) 0.65
0.95
(0.23)
(0.24)
Total from operations 0.71
1.17
(0.05)
(0.04)
Distributions to shareholders from:
Net investment income (0.35)
(0.30)
(0.19)
(0.17)
Net realized gains (0.26)
-
(0.00) (g) -
Total distributions (0.61)
(0.30)
(0.19)
(0.17)
Net Asset Value, End of Period $10.52
$10.42
$9.55
$9.79
Total Return(b) 7.06%
12.38%
(0.54)%
(0.40)% (d)
Ratios/Supplemental Data
Net assets, end of period (in 000’s) $38,935
$32,937
$26,529
$7,652
Ratio of expenses to average net assets,
before waivers/reimbursement(e) 1.28%
1.31%
1.31%
1.54% (c)
net of waivers/reimbursement(e) 1.24%
1.22% (h) 1.21%
1.48% (c)
Ratio of net investment income to average net assets(e)(f) 0.69%
2.24%
1.82%
3.90% (c)
Portfolio turnover rate 278%
302%
402%
7% (d)
* Commencement of operations. (a) Per share amounts are calculated using the average shares method, which more appropriately presents the per share data for the period. (b) Total returns are historical in nature and assume changes in share price, reinvestment of dividends and capital gains distributions, if any, and exclude any
sales charges (loads). (c) Annualized. (d) Not annualized. (e) Does not include the expenses of other investment companies in which the Fund invests. (f) Recognition of net investment income by the Fund is affected by the timing of the declaration of dividends by the underlying investment companies in
which the Fund invests. (g) Per share amount represents less than $0.01 per share. (h) Represents the ratio of expenses to average net assets inclusive of Advisor’s recapture of waived/reimbursed fees from prior periods.

51
The table below sets forth financial data for one share of beneficial interest outstanding throughout each period presented.
Navigator Tactical Fixed Income Fund - Class C
For the
For the
For the
For the Period
Year Ended
Year Ended
Year Ended
March 27, 2014* to
September 30, 2017
September 30, 2016
September 30, 2015
September 30, 2014
Net Asset Value, Beginning of Period $10.43
$9.56
$9.78
$10.00
From Operations:
Net investment income (loss)(a) (0.01)
0.15
0.10
0.16
Net gain (loss) from securities
(both realized and unrealized) 0.65
0.95
(0.23)
(0.23)
Total from operations 0.64
1.10
(0.13)
(0.07)
Distributions to shareholders from:
Net investment income (0.28)
(0.23)
(0.09)
(0.15)
Net realized gains (0.26)
-
(0.00) (g) -
Total distributions (0.54)
(0.23)
(0.09)
(0.15)
Net Asset Value, End of Period $10.53
$10.43
$9.56
$9.78
Total Return(b) 6.30%
11.60%
(1.28)%
(0.71)% (d)
Ratios/Supplemental Data
Net assets, end of period (in 000’s) $9,155
$6,016
$2,983
$1,236
Ratio of expenses to average net assets,
before waivers/reimbursement(e) 2.03%
2.06%
2.06%
3.37% (c)
net of waivers/reimbursement(e) 1.99%
1.97% (h) 1.96%
2.23% (c)
Ratio of net investment income (loss) to average net assets(e)(f) (0.09)%
1.51%
1.04%
3.07% (c)
Portfolio turnover rate 278%
302%
402%
7% (d)
* Commencement of operations. (a) Per share amounts are calculated using the average shares method, which more appropriately presents the per share data for the period. (b) Total returns are historical in nature and assume changes in share price, reinvestment of dividends and capital gains distributions, if any, and exclude any
sales charges (loads). (c) Annualized. (d) Not annualized. (e) Does not include the expenses of other investment companies in which the Fund invests. (f) Recognition of net investment income by the Fund is affected by the timing of the declaration of dividends by the underlying investment companies in
which the Fund invests. (g) Per share amount represents less than $0.01 per share. (h) Represents the ratio of expenses to average net assets inclusive of Advisor’s recapture of waived/reimbursed fees from prior periods.

52
The table below sets forth financial data for one share of beneficial interest outstanding throughout each period presented.
Navigator Tactical Fixed Income Fund - Class I
For the
For the
For the
For the Period
Year Ended
Year Ended
Year Ended
March 27, 2014* to
September 30, 2017
September 30, 2016
September 30, 2015
September 30, 2014
Net Asset Value, Beginning of Period $10.43
$9.56
$9.81
$10.00
From Operations:
Net investment income(a) 0.09
0.25
0.19
0.21
Net gain (loss) from securities
(both realized and unrealized) 0.66
0.94
(0.22)
(0.22)
Total from operations 0.75
1.19
(0.03)
(0.01)
Distributions to shareholders from:
Net investment income (0.38)
(0.32)
(0.22)
(0.18)
Net realized gains (0.26)
-
(0.00) (g) -
Total distributions (0.64)
(0.32)
(0.22)
(0.18)
Net Asset Value, End of Period $10.54
$10.43
$9.56
$9.81
Total Return(b) 7.42%
12.63%
(0.33)%
(0.15)% (d)
Ratios/Supplemental Data
Net assets, end of period (in 000’s) $829,872
$408,942
$277,788
$126,571
Ratio of expenses to average net assets,
before waivers/reimbursement(e) 1.04%
0.97%
1.06%
1.11% (c)
net of waivers/reimbursement(e) 0.99%
1.06% (h) 0.96%
1.11% (c)
Ratio of net investment income to average net assets(e)(f) 0.86%
2.49%
1.93%
4.01% (c)
Portfolio turnover rate 278%
302%
402%
7% (d)
* Commencement of operations. (a) Per share amounts are calculated using the average shares method, which more appropriately presents the per share data for the period. (b) Total returns are historical in nature and assume changes in share price, reinvestment of dividends and capital gains distributions, if any. (c) Annualized. (d) Not annualized. (e) Does not include the expenses of other investment companies in which the Fund invests. (f) Recognition of net investment income by the Fund is affected by the timing of the declaration of dividends by the underlying investment companies in
which the Fund invests. (g) Per share amount represents less than $0.01 per share. (h) Represents the ratio of expenses to average net assets inclusive of Advisor’s recapture of waived/reimbursed fees from prior periods.
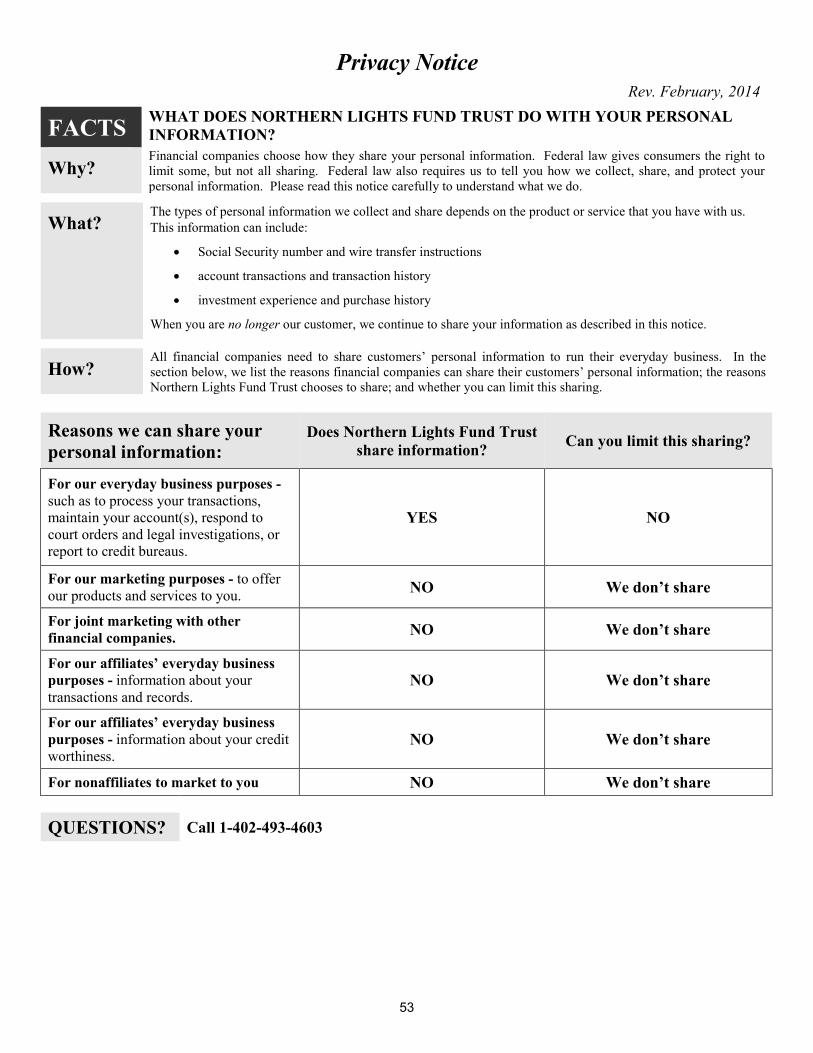
53
Privacy Notice
Rev. February, 2014 FACTS
WHAT DOES NORTHERN LIGHTS FUND TRUST DO WITH YOUR PERSONAL INFORMATION?
Why? Financial companies choose how they share your personal information. Federal law gives consumers the right to limit some, but not all sharing. Federal law also requires us to tell you how we collect, share, and protect your personal information. Please read this notice carefully to understand what we do.
What? The types of personal information we collect and share depends on the product or service that you have with us. This information can include:
• Social Security number and wire transfer instructions
• account transactions and transaction history
• investment experience and purchase history
When you are no longer our customer, we continue to share your information as described in this notice.
How? All financial companies need to share customers’ personal information to run their everyday business. In the section below, we list the reasons financial companies can share their customers’ personal information; the reasons Northern Lights Fund Trust chooses to share; and whether you can limit this sharing.
Reasons we can share your personal information:
Does Northern Lights Fund Trust share information? Can you limit this sharing?
For our everyday business purposes - such as to process your transactions, maintain your account(s), respond to court orders and legal investigations, or report to credit bureaus.
YES NO
For our marketing purposes - to offer our products and services to you. NO We don’t share
For joint marketing with other financial companies. NO We don’t share
For our affiliates’ everyday business purposes - information about your transactions and records.
NO We don’t share
For our affiliates’ everyday business purposes - information about your credit worthiness.
NO We don’t share
For nonaffiliates to market to you NO We don’t share QUESTIONS? Call 1-402-493-4603

54
What we do: How does Northern Lights Fund Trust protect my personal information?
To protect your personal information from unauthorized access and use, we use security measures that comply with federal law. These measures include computer safeguards and secured files and buildings. Our service providers are held accountable for adhering to strict policies and procedures to prevent any misuse of your nonpublic personal information.
How does Northern Lights Fund Trust collect my personal information?
We collect your personal information, for example, when you
• open an account or deposit money
• direct us to buy securities or direct us to sell your securities
• seek advice about your investments
We also collect your personal information from others, such as credit bureaus, affiliates, or other companies.
Why can’t I limit all sharing?
Federal law gives you the right to limit only:
• sharing for affiliates’ everyday business purposes – information about your creditworthiness.
• affiliates from using your information to market to you.
• sharing for nonaffiliates to market to you.
State laws and individual companies may give you additional rights to limit sharing. Definitions Affiliates Companies related by common ownership or control. They can be financial and
nonfinancial companies.
• Northern Lights Fund Trust does not share with our affiliates.
Nonaffiliates Companies not related by common ownership or control. They can be financial and nonfinancial companies.
• Northern Lights Fund Trust does not share with nonaffiliates so they can market to you.
Joint marketing A formal agreement between nonaffiliated financial companies
that together market financial products or services to you.
• Northern Lights Fund Trust doesn’t jointly market.


Navigator Tactical Fixed Income Fund Navigator Duration Neutral Bond Fund
Navigator Equity Hedged Fund Navigator Sentry Managed Volatility Fund
Adviser Clark Capital Management Group, Inc.
1650 Market Street, 53rd Floor Philadelphia, PA 19103
Distributor Northern Lights Distributors, LLC
17605 Wright Street Omaha, NE 68130
Independent Registered Public Accounting Firm
BBD, LLP 1835 Market Street, 3rd Floor
Philadelphia, PA 19103
Legal Counsel
Thompson Hine LLP 41 South Street, Suite 1700
Columbus, OH 43215
Custodian Bank of New York Mellon
225 Liberty St. New York, NY 10286
Transfer Agent
Gemini Fund Services, LLC 17605 Wright Street, Suite 2
Omaha, NE 68130
Additional information about the Funds is included in the Funds’ Statement of Additional Information dated January 29, 2018 (the “SAI”). The SAI is incorporated into this Prospectus by reference (i.e., legally made a part of this Prospectus). The SAI provides more details about the Trust’s policies and management. Additional information about the Funds’ investments will also be available in the Funds’ Annual and Semi-Annual Reports to Shareholders. In the Funds’ Annual Report, you will find a discussion of the market conditions and investment strategies that significantly affected the Funds’ performance during its last fiscal year. To obtain a free copy of the SAI and, when available, the Annual and Semi-Annual Reports to shareholders, or other information about the Funds, or to make shareholder inquiries about the Funds, please call 1-877-766-2264 or visit www.navigatorfunds.com. You may also write to:
Navigator Tactical Fixed Income Fund, Navigator Duration Neutral Bond Fund,
Navigator Equity Hedged Fund, or Navigator Sentry Managed Volatility Fund
c/o Gemini Fund Services, LLC 17605 Wright Street, Suite 2
Omaha, Nebraska 68130 You may review and obtain copies of the Funds’ information at the SEC Public Reference Room in Washington, D.C. Please call 1-202-551-8090 for information relating to the operation of the Public Reference Room. Reports and other information about the Funds are available on the EDGAR Database on the SEC’s Internet site at http://www.sec.gov. Copies of the information may be obtained, after paying a duplicating fee, by electronic request at the following E-mail address: [email protected], or by writing the Public Reference Section, Securities and Exchange Commission, Washington, D.C. 20549-1520.
Investment Company Act File # 811-21720