table of contents - home - urban development...
TRANSCRIPT

Table of Contents UDI State of the Market Quarterly Publication (Q2 2017)…………..… 4
Population ………………………………………………………………………………….... 7 1.1 Metro Vancouver Population 2007 – Present 1.2 Metro Vancouver Population Growth Rate (%yoy) 1.3 British Columbia Interprovincial Migration 1.4 British Columbia International Migration 1.5 British Columbia Net Migration 1.6 BC’s Population Growth Breakdown
Economic Indicators ………………………………………………………………..…... 8 2.1 Bank of Canada 5 Year Posted Rate (%) 2.2 Consumer Price Index, Canada, BC, Metro Vancouver 2.3 Metro Vancouver Labour Force Totals: 2007 – Present 2.4 BC Unemployment Rate 2.5 Retail Trade, Sales by NAICS: 2007 – Present 2.6 Canada GDP: 2007 – Present
Economic Indicators ……………………………………………………………..……... 9 3.1 Budgetary Balance - Canada 3.2 BC Investment in New Construction: 2007 – Present 3.3 Price of Crude Oil (US Dollars) 3.4 BC Bankruptcies 3.5 Dow Jones Industrial Average (Close) 3.6 Toronto Stock Exchange, Value of Shares Traded
Housing Economic Indicators …………………………………………............... 10 4.1 Homeowner Protection Office Single Family Registrations 4.2 Homeowner Protection Office Multi-Family Registrations
Housing Economic Indicators………………….…………………………….……. 11 5.1 CMHC Townhome Starts 5.2 CMHC Apartment Starts 5.3 CMHC Single Family Starts 5.4 Residential Building Permit Values, Metro Vancouver 5.5 Statistics Canada Housing Price Index, BC, Metro Vancouver 5.6 CMHC Rental Housing Vacancy Rates
New Home Data: Concrete Condominiums ………………………………..…12 6.1 Concrete Condominium Projects Actively Marketing 6.2 Concrete Condominium Sales 6.3 Concrete Condominium Inventory Levels 6.4 Concrete Condominium Standing Inventory Levels
Q2-2017
Table of Contents Page 2
New Home Data: Wood Frame Condominiums ……………………….….. 13 7.1 Wood Frame Condominium Projects Actively Marketing 7.2 Wood Frame Condominium Sales 7.3 Wood Frame Condominium Inventory Levels 7.4 Wood Frame Condominium Standing Inventory Levels
New Home Data: Townhomes ……………………………………………............ 14 8.1 Townhome Projects Actively Marketing 8.2 Townhome Sales 8.3 Townhome Inventory Levels 8.4 Townhome Standing Inventory Levels
UA Affordability Index: New Home Data …………………………………….. 15 9.1 UA Affordability Index: New Concrete Condominiums 9.2 UA Affordability Index: New Wood Frame Condominiums 9.3 UA Affordability Index: New Townhomes
Re-Sale Data: Real Estate Board of Greater Vancouver………............ 16 10.1 Apartment Re-Sales and Listings 10.2 Apartment Re-Sale Prices 10.3 Attached Re-Sales and Listings 10.4 Attached Re-Sale Prices 10.5 Single Detached Re-Sales and Listings 10.6 Single Detached Re-Sales and Prices
Re-Sale Data: Fraser Valley Board………….…………………………….......... 17 11.1 Apartment Re-Sales and Listings 11.2 Apartment Re-Sale Prices 11.3 Attached Re-Sales and Listings 11.4 Attached Re-Sale Prices 11.5 Single Detached Re-Sales and Listings 11.6 Single Detached Re-Sales and Prices
New Home Data: Purpose-Built Rental Apartments……………........... 18 12.1 Apartment Rental Stock in Metro Vancouver 12.2 Vacancy Rates by Region 12.3 Average Rent per Square Foot 12.4 Currently Available Average Rent per Square Foot 12.5 Rental Units per Municipality, in Planning Stages
Methodology & Definitions…………………………………………………………. 19 Definitions Analytical Methods Other Assumptions
Sources …………………………………………………………………………………....… 20 Sources
Q2-2017
Table of Contents Page 3

UDI State of the Market Quarterly Publication
Welcome to the latest edition of UDI Pacific’s “State of the Market” quarterly publication. The Q2-2017 “State of the Market” report provides up-to-date statistics and trends on the new home and re-sale housing markets as well as an aggregate of relevant economic statistics that impact the housing market. The report also includes statistics on the newer purpose-built rental market in Metro Vancouver, and the UDI/Urban Analytics Housing Affordability Index, which is derived from Urban Analytics’ NHSLive database and the Homeowner Protection Office of British Columbia’s new home registry statistics. Population Growth & Housing Starts
The preceding table illustrates the trend of housing starts and population change in Metro Vancouver over the past four years. The second quarter net population increase (8,300) continues to outpace overall housing starts, which totaled 6,474 in Q2-2017. Housing starts are up five percent compared to the same quarter of 2016 and 50 percent higher than the five-year average. Metro Vancouver’s overall population has reached 2,191,900 residents in Q2-2017 which is up 1.4 percent over the year.
The current ratio of new Metro Vancouver residents to housing starts is 1.3, which is identical to last quarter as well as Q2-2016. However, the current ratio is down from the 2.2 housing starts per new residents in Q2-2015 and is below the five-year average of 2.1. The number of housing starts have trended upwards since the last quarter of 2016 and while the ratio of 1.3 should be considered favorable to buyers/tenants it’s important to note the overwhelming majority of multi-family housing starts have already been pre-sold. Strong demand for new multi-family homes is evidenced by the fact that over 87% of all new condominiums and townhomes released for sale since January 1st 2017 have been sold.
0
2,000
4,000
6,000
8,000
10,000
12,000
Q22013
Q32013
Q42013
Q12014
Q22014
Q32014
Q42014
Q12015
Q22015
Q32015
Q42015
Q12016
Q22016
Q32016
Q42016
Q12017
Q22017
Metro Vancouver Housing Starts and Population Change (15+)
Housing Starts Population Change (15+)
2.1 2.2
2.8
2.4 2.4
2.2
2.52.4
1.9
2.1
2.8
2.2
2.6
2.31.9
1.3
1.71.4
1.31.3
Q3 2
012
Q4 2
012
Q1 2
013
Q2 2
013
Q3 2
013
Q4 2
013
Q1 2
014
Q2 2
014
Q3 2
014
Q4 2
014
Q1 2
015
Q2 2
015
Q3 2
015
Q4 2
015
Q1 2
016
Q2 2
016
Q3 2
016
Q4 2
016
Q1 2
017
Q2 2
017
Metro Vancouver Population Change (15+) per Housing Start
Q2-2017
Table of Contents Page 4

Local Economic Factors
The most important local factor for the economy and housing market in Metro Vancouver during the second quarter of 2017 was the result of the Provincial Election in May. The Liberal Party’s 43 seat minority government was defeated by a motion of non-confidence tabled by the ‘working partnership’ arrangement of BC NDP and Green Parties, which together held one more seat in the BC Legislature than the Liberals. The policies and shared power of the NDP and Green parties has created some significant short-term economic uncertainty created due to promises by both parties to fight the federally approved Kinder Morgan Pipeline expansion project and order an environmental review of the Site C Dam project. The future of other major infrastructure projects such as the George Massey Tunnel Replacement project could also be in doubt. There could also be some significant impacts on the housing market as the NDP platform included policies that supported the construction of social and co-op housing, building 114,000 units of rental and co-op homes over the next ten years. These units have yet to be fully costed on an annual basis or confirmed that adequate skilled trades and construction capacity exists to build those in addition to market housing supply. As well, implementing a $400 annual rebate for each rental household, is estimated to cost provincial taxpayers $216 million per year. The Green party’s platform included a $750 million annual commitment help build 4,000 affordable housing units, to allocate more land for the construction of affordable housing, apply the foreign buyers tax throughout the province and double it to 30 percent, and to apply the Property Transfer Tax on a sliding rate scale from zero percent for properties under $200,000 to 12 percent for properties with a purchase price of over $3 million. We are likely to see many of these policy decisions unveiled during the coming months. Despite these uncertainties, local transit improvement projects such as the Millennium Broadway Line and the Surrey LRT Line are expected to proceed due to the committed funding from the federal government. The new multi-family home market in Metro Vancouver experienced increased activity with the launch of 18 new projects, most of which were quickly absorbed due to strong pent-up demand. There were a total of 4,674 new multi-family home sales across Metro Vancouver in Q2-2017; a 20 percent increase from first quarter. There were 1,942 new multi-family homes at the end of Q2-2017, of which 50 are move-in ready. Total supply of new multi-family homes available to purchase is nine percent lower than at the end of same quarter in 2016. Supply remains near historic lows and has continued to contribute to a rapid escalation of new home prices in Metro Vancouver. Global Economic Factors
The most impactful global event to occur in Q2-2017 was the continuation of protectionist economic and foreign policy by the United States (US), and their seemingly increased resistance to be a global partner with other industrialized nations. Two examples include the President Trump’s decision to pull the US out of the Paris Climate Agreement and his continued insistence that NAFTA be renegotiated. Meanwhile, the Canadian government is devising a new foreign policy plan that would encourage greater global trade opportunities, thereby reducing the domestic economy’s reliance on trade with the US. The Canadian dollar continues to trade below $0.80 relative to US Dollar, which in turn and increases the relative affordability of Canadian real estate for international buyers. Other notable events are the new record high reached of just over 21,000 points reached by the Dow Jones Industrial Average (DJIA) and the anticipation of further increases in the Bank of Canada’s key lending rate. We trust you find the Q2-2017 edition of the State of the Market report helpful and informative. We welcome any feedback or comments on the publication. Sincerely,
Urban Analytics Inc.
Michael Ferreira Jon Bennest
Table of Contents Page 5
Q2-2017

www.terralawcorp.ca
MEET OUR LEGAL TEAM
EXPERTISE
SERVICE FIRST
HOW WE CAN HELP YOU
One of Canada’s Top 5 Commercial Real Estate Boutiques– Canadian Lawyer Magazine
• Acquisitions & Dispositions
• Property Development
• Partnership & Joint Venture Structuring
• Corporate/Commercial
• Financing/Secured Transactions
Follow Us On
E X P E R I E N C E D . C R E A T I V E . P R A C T I C A L .
Terra Law's focus on service and responsiveness allows our clients to seize opportunities as they arise. Our experience and creativity allow us to customize innovative solutions for unique situations, moving deals forward instead of holding them back. Our practical and personalized approach means we can provide constructive and valuable advice on an efficient and cost-effective basis.
Combining over 100 years of experience in virtually every facet of the real estate business, Terra Law’s lawyers have the legal skill and industry knowledge to provide our clients with informed advice and pro-active solutions to their legal challenges. Terra Law has the bench strength, expertise and insight to help our clients protect their interests and achieve their goals.
• Leasing
• Hospitality, Resorts & Timeshare
• Municipal
• Compliance
• Infrastructure & Clean Energy
Terra Law represents a broad range of local, regional, national and international real estate players, helping themmaximize value and minimize risk. Why not put our team to work for you?
1,750
1,800
1,850
1,900
1,950
2,000
2,050
2,100
2,150
2,200
Q22007
Q22008
Q22009
Q22010
Q22011
Q22012
Q22013
Q22014
Q22015
Q22016
Q22017
Thou
sand
s
-0.25%
0.00%
0.25%
0.50%
0.75%
1.00%
Q22007
Q22008
Q22009
Q22010
Q22011
Q22012
Q22013
Q22014
Q22015
Q22016
Q22017
-3,000
-1,000
1,000
3,000
5,000
7,000
9,000
Q22007
Q22008
Q22009
Q22010
Q22011
Q22012
Q22013
Q22014
Q22015
Q22016
Q22017
-4,000-2,000
02,0004,0006,0008,000
10,00012,00014,00016,00018,00020,00022,000
Q22007
Q22008
Q22009
Q22010
Q22011
Q22012
Q22013
Q22014
Q22015
Q22016
Q22017
-5,000
0
5,000
10,000
15,000
20,000
25,000
Q22007
Q22008
Q22009
Q22010
Q22011
Q22012
Q22013
Q22014
Q22015
Q22016
Q22017
Population
Insights & Comments:
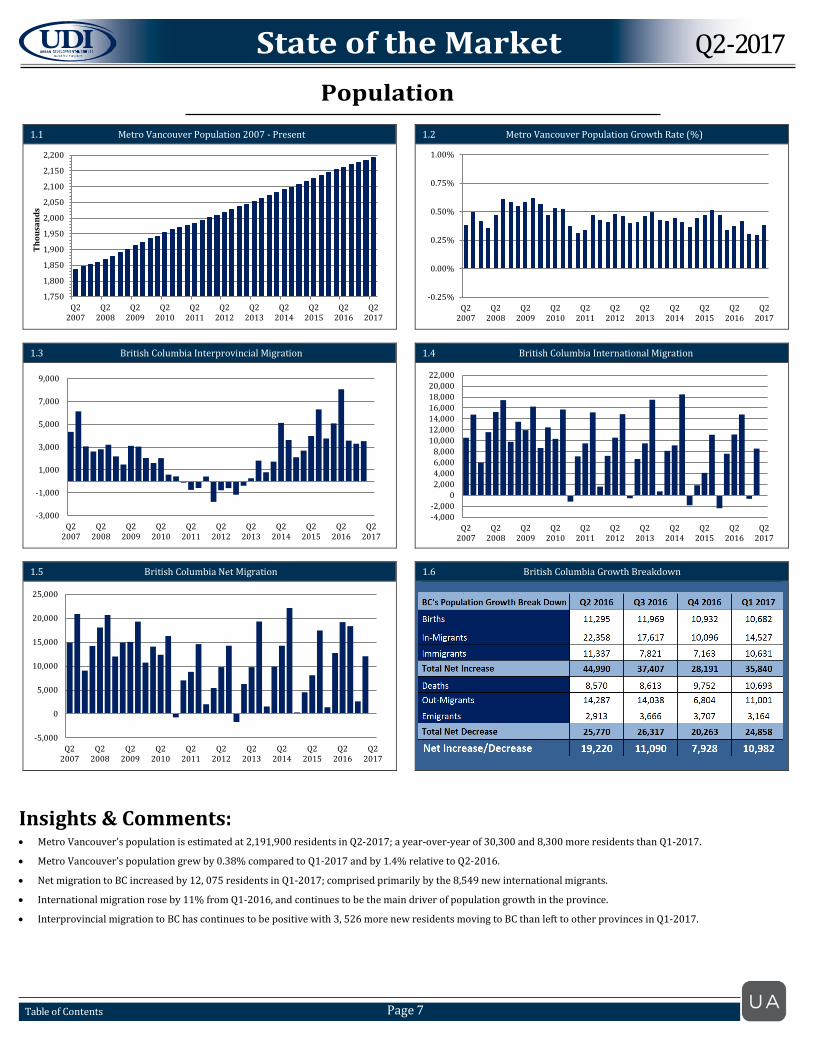
• Metro Vancouver’s population is estimated at 2,191,900 residents in Q2-2017; a year-over-year of 30,300 and 8,300 more residents than Q1-2017.
• Metro Vancouver’s population grew by 0.38% compared to Q1-2017 and by 1.4% relative to Q2-2016.
• Net migration to BC increased by 12, 075 residents in Q1-2017; comprised primarily by the 8,549 new international migrants.
• International migration rose by 11% from Q1-2016, and continues to be the main driver of population growth in the province.
• Interprovincial migration to BC has continues to be positive with 3, 526 more new residents moving to BC than left to other provinces in Q1-2017.
1.1 Metro Vancouver Population 2007 - Present
1.2 Metro Vancouver Population Growth Rate (%)
1.3 British Columbia Interprovincial Migration
1.4 British Columbia International Migration
1.5 British Columbia Net Migration
1.6 British Columbia Growth Breakdown
Q2-2017
Table of Contents Page 7
4%
5%
6%
7%
8%
Q22007
Q22008
Q22009
Q22010
Q22011
Q22012
Q22013
Q22014
Q22015
Q22016
Q22017
1,0001,0501,1001,1501,2001,2501,3001,3501,4001,4501,500
Q22007
Q22008
Q22009
Q22010
Q22011
Q22012
Q22013
Q22014
Q22015
Q22016
Q22017
Thou
sand
s
3%
4%
5%
6%
7%
8%
9%
Q22007
Q22008
Q22009
Q22010
Q22011
Q22012
Q22013
Q22014
Q22015
Q22016
Q22017
$10
$12
$14
$16
$18
$20
$22
Q22007
Q22008
Q22009
Q22010
Q22011
Q22012
Q22013
Q22014
Q22015
Q22016
Q22017
Billi
ons
$1,300
$1,375
$1,450
$1,525
$1,600
$1,675
$1,750
$1,825
$1,900
Q22007
Q22008
Q22009
Q22010
Q22011
Q22012
Q22013
Q22014
Q22015
Q22016
Q22017
BIlli
ons
95
100
105
110
115
120
125
130
135
Q22007
Q22008
Q22009
Q22010
Q22011
Q22012
Q22013
Q22014
Q22015
Q22016
Q22017
Canada Metro Vancouver
Economic Indicators
Insights & Comments:
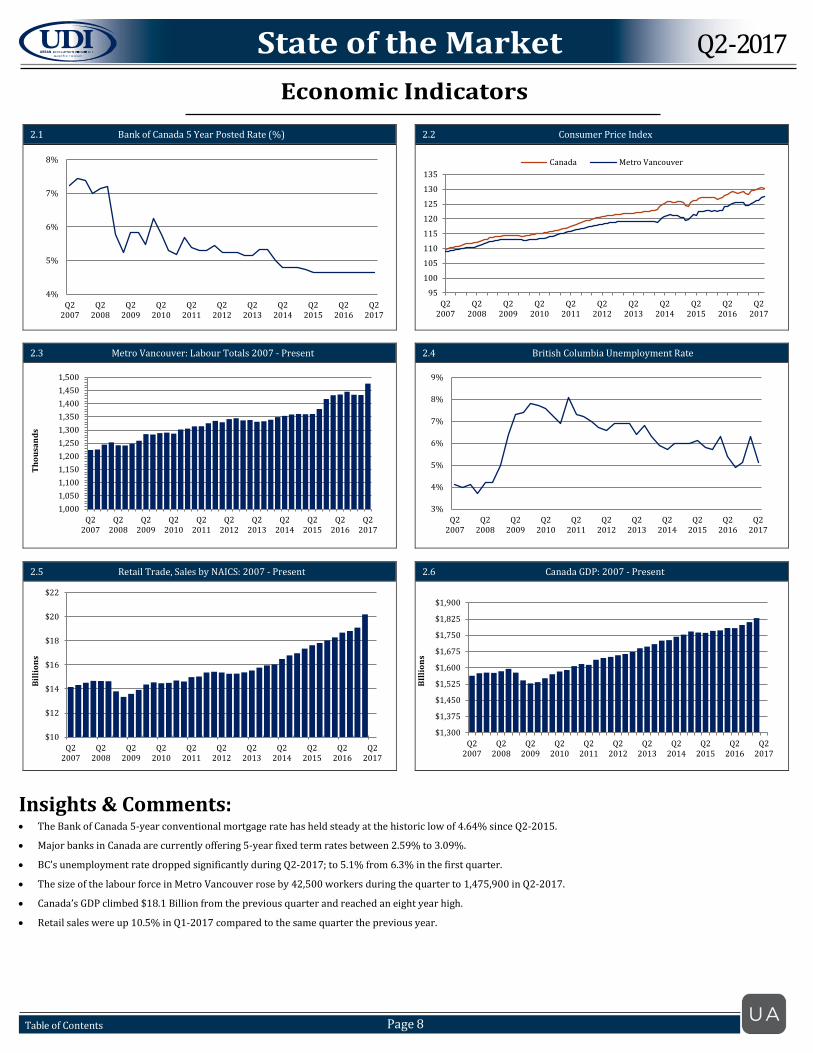
• The Bank of Canada 5-year conventional mortgage rate has held steady at the historic low of 4.64% since Q2-2015.
• Major banks in Canada are currently offering 5-year fixed term rates between 2.59% to 3.09%.
• BC’s unemployment rate dropped significantly during Q2-2017; to 5.1% from 6.3% in the first quarter.
• The size of the labour force in Metro Vancouver rose by 42,500 workers during the quarter to 1,475,900 in Q2-2017.
• Canada’s GDP climbed $18.1 Billion from the previous quarter and reached an eight year high.
• Retail sales were up 10.5% in Q1-2017 compared to the same quarter the previous year.
2.1 Bank of Canada 5 Year Posted Rate (%)
2.2 Consumer Price Index
2.3 Metro Vancouver: Labour Totals 2007 - Present
2.4 British Columbia Unemployment Rate
2.5 Retail Trade, Sales by NAICS: 2007 - Present
2.6 Canada GDP: 2007 - Present
Q2-2017
Table of Contents Page 8
-$80
-$60
-$40
-$20
$0
$20
$40
$60
Q22007
Q22008
Q22009
Q22010
Q22011
Q22012
Q22013
Q22014
Q22015
Q22016
Q22017
Billi
ons
$0$200$400$600$800
$1,000$1,200$1,400$1,600$1,800$2,000
Q22007
Q22008
Q22009
Q22010
Q22011
Q22012
Q22013
Q22014
Q22015
Q22016
Q22017
Mill
ions
$0
$20
$40
$60
$80
$100
$120
$140
Q22007
Q22008
Q22009
Q22010
Q22011
Q22012
Q22013
Q22014
Q22015
Q22016
Q22017
900
1,400
1,900
2,400
2,900
Q2 2009 Q2 2010 Q2 2011 Q2 2012 Q2 2013 Q2 2014 Q2 2015 Q2 2016 Q2 2017
Thou
sand
s
6,000
8,000
10,000
12,000
14,000
16,000
18,000
20,000
22,000
24,000
Q22007
Q22008
Q22009
Q22010
Q22011
Q22012
Q22013
Q22014
Q22015
Q22016
Q22017
$0
$25
$50
$75
$100
$125
$150
$175
$200
Q22007
Q22008
Q22009
Q22010
Q22011
Q22012
Q22013
Q22014
Q22015
Q22016
Q22017
Billi
ons
Economic Indicators
Insights & Comments:
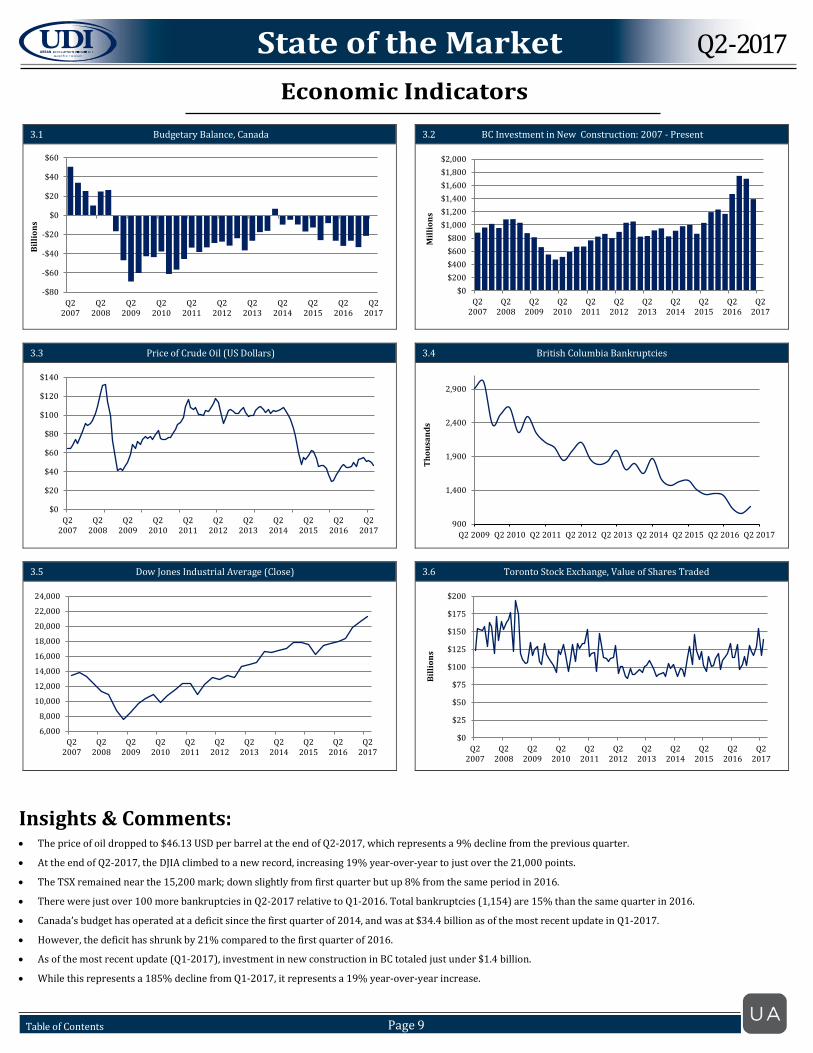
• The price of oil dropped to $46.13 USD per barrel at the end of Q2-2017, which represents a 9% decline from the previous quarter.
• At the end of Q2-2017, the DJIA climbed to a new record, increasing 19% year-over-year to just over the 21,000 points.
• The TSX remained near the 15,200 mark; down slightly from first quarter but up 8% from the same period in 2016.
• There were just over 100 more bankruptcies in Q2-2017 relative to Q1-2016. Total bankruptcies (1,154) are 15% than the same quarter in 2016.
• Canada’s budget has operated at a deficit since the first quarter of 2014, and was at $34.4 billion as of the most recent update in Q1-2017.
• However, the deficit has shrunk by 21% compared to the first quarter of 2016.
• As of the most recent update (Q1-2017), investment in new construction in BC totaled just under $1.4 billion.
• While this represents a 185% decline from Q1-2017, it represents a 19% year-over-year increase.
3.1 Budgetary Balance, Canada
3.2 BC Investment in New Construction: 2007 - Present
3.3 Price of Crude Oil (US Dollars)
3.4 British Columbia Bankruptcies
3.5 Dow Jones Industrial Average (Close)
3.6 Toronto Stock Exchange, Value of Shares Traded
Q2-2017
Table of Contents Page 9
200
300
400
500
600
700
Q2 2012 Q2 2013 Q2 2014 Q2 2015 Q2 2016 Q2 2017
Vancouver Proper Inner Metro Outer Metro
200
600
1000
1400
1800
2200
2600
3000
3400
Q2 2012 Q2 2013 Q2 2014 Q2 2015 Q2 2016 Q2 2017
Vancouver Proper Inner Metro Outer Metro
Housing Economic Indicators
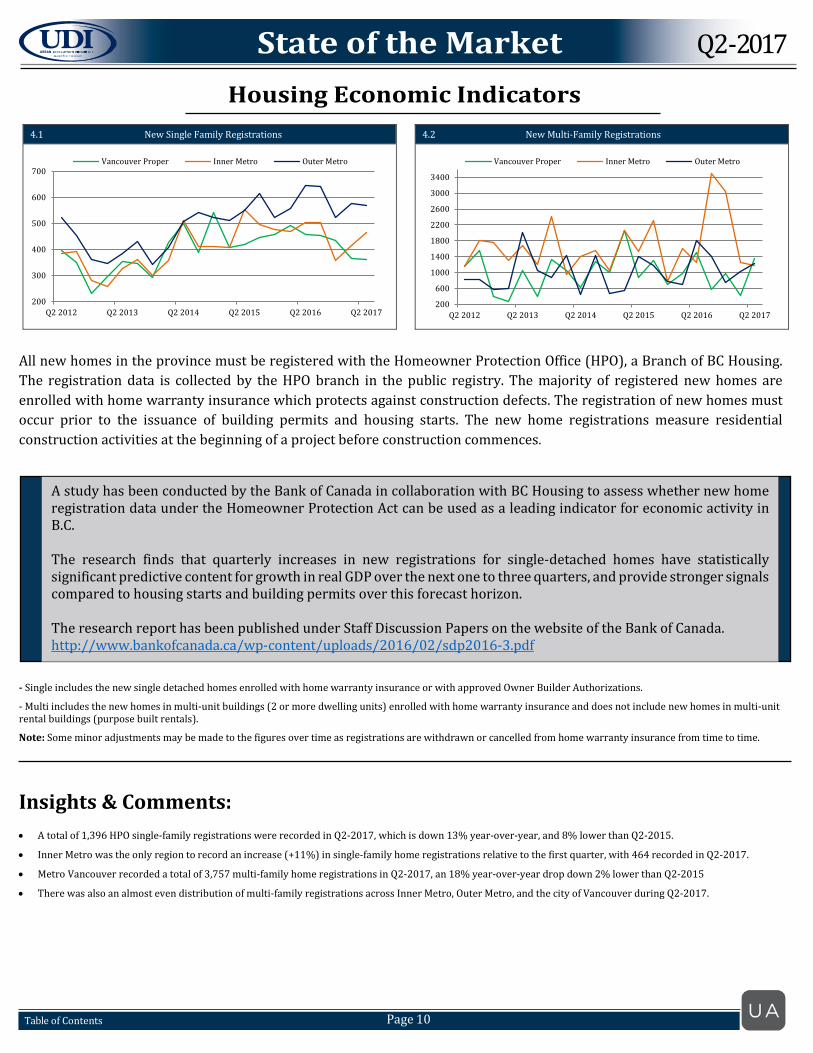
All new homes in the province must be registered with the Homeowner Protection Office (HPO), a Branch of BC Housing. The registration data is collected by the HPO branch in the public registry. The majority of registered new homes are enrolled with home warranty insurance which protects against construction defects. The registration of new homes must occur prior to the issuance of building permits and housing starts. The new home registrations measure residential construction activities at the beginning of a project before construction commences.
- Single includes the new single detached homes enrolled with home warranty insurance or with approved Owner Builder Authorizations.
- Multi includes the new homes in multi-unit buildings (2 or more dwelling units) enrolled with home warranty insurance and does not include new homes in multi-unit rental buildings (purpose built rentals).
Note: Some minor adjustments may be made to the figures over time as registrations are withdrawn or cancelled from home warranty insurance from time to time.
Insights & Comments:
• A total of 1,396 HPO single-family registrations were recorded in Q2-2017, which is down 13% year-over-year, and 8% lower than Q2-2015.
• Inner Metro was the only region to record an increase (+11%) in single-family home registrations relative to the first quarter, with 464 recorded in Q2-2017.
• Metro Vancouver recorded a total of 3,757 multi-family home registrations in Q2-2017, an 18% year-over-year drop down 2% lower than Q2-2015
• There was also an almost even distribution of multi-family registrations across Inner Metro, Outer Metro, and the city of Vancouver during Q2-2017.
4.1 New Single Family Registrations
4.2 New Multi-Family Registrations
Q2-2017
Table of Contents Page 10
A study has been conducted by the Bank of Canada in collaboration with BC Housing to assess whether new home registration data under the Homeowner Protection Act can be used as a leading indicator for economic activity in B.C. The research finds that quarterly increases in new registrations for single-detached homes have statistically significant predictive content for growth in real GDP over the next one to three quarters, and provide stronger signals compared to housing starts and building permits over this forecast horizon. The research report has been published under Staff Discussion Papers on the website of the Bank of Canada. http://www.bankofcanada.ca/wp-content/uploads/2016/02/sdp2016-3.pdf
070
140210280350420490560630700770840
Q2 2011 Q2 2012 Q2 2013 Q2 2014 Q2 2015 Q2 2016 Q2 2017
Inner Metro Outer Metro Vancouver
0225450675900
1125135015751800202522502475
Q2 2011 Q2 2012 Q2 2013 Q2 2014 Q2 2015 Q2 2016 Q2 2017
Inner Metro Outer Metro Vancouver
0
100
200
300
400
500
600
Q2 2011 Q2 2012 Q2 2013 Q2 2014 Q2 2015 Q2 2016 Q2 2017
Inner Metro Outer Metro Vancouver
0.0%
0.2%
0.4%
0.6%
0.8%
1.0%
1.2%
Vancouver North Shore
Tri-Cities/Ridge Meadows Surrey/Langley/White Rock
Richmond/Delta Burnaby/New Westminster
70
75
80
85
90
95
100
105
110
Q22007
Q22008
Q22009
Q22010
Q22011
Q22012
Q22013
Q22014
Q22015
Q22016
Q22017
Metro Vancouver BC
$0
$100
$200
$300
$400
$500
$600
$700
$800
$900
Q12007
Q12008
Q12009
Q12010
Q12011
Q12012
Q12013
Q12014
Q12015
Q12016
Q12017
Mill
ions
Housing Economic Indicators
Insights & Comments:
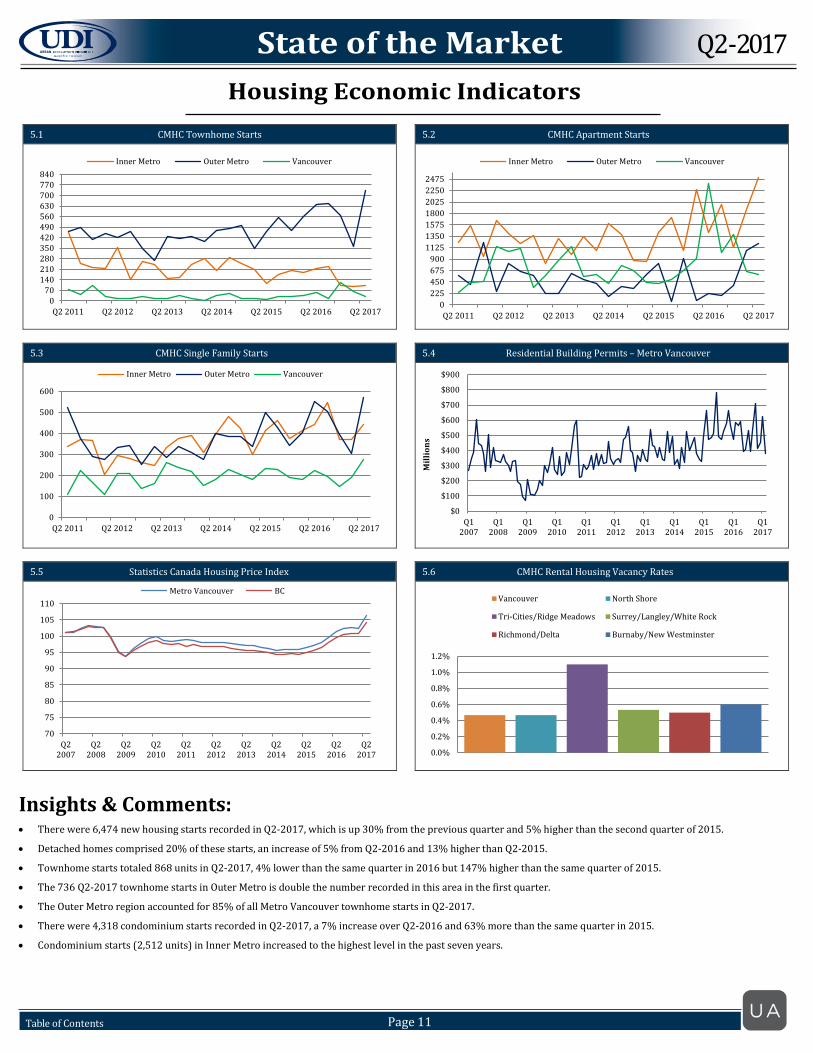
• There were 6,474 new housing starts recorded in Q2-2017, which is up 30% from the previous quarter and 5% higher than the second quarter of 2015.
• Detached homes comprised 20% of these starts, an increase of 5% from Q2-2016 and 13% higher than Q2-2015.
• Townhome starts totaled 868 units in Q2-2017, 4% lower than the same quarter in 2016 but 147% higher than the same quarter of 2015.
• The 736 Q2-2017 townhome starts in Outer Metro is double the number recorded in this area in the first quarter.
• The Outer Metro region accounted for 85% of all Metro Vancouver townhome starts in Q2-2017.
• There were 4,318 condominium starts recorded in Q2-2017, a 7% increase over Q2-2016 and 63% more than the same quarter in 2015.
• Condominium starts (2,512 units) in Inner Metro increased to the highest level in the past seven years.
5.1 CMHC Townhome Starts
5.2 CMHC Apartment Starts
5.3 CMHC Single Family Starts
5.4 Residential Building Permits – Metro Vancouver
5.5 Statistics Canada Housing Price Index
5.6 CMHC Rental Housing Vacancy Rates
Q2-2017
Table of Contents Page 11

0
10
20
30
40
50
60
70
Q2 2011 Q2 2012 Q2 2013 Q2 2014 Q2 2015 Q2 2016 Q2 2017
Inner Metro Vancouver Outer Metro
0
500
1,000
1,500
2,000
2,500
Q2 2011 Q2 2012 Q2 2013 Q2 2014 Q2 2015 Q2 2016 Q2 2017
Outer Metro Vancouver Inner Metro
0
500
1,000
1,500
2,000
2,500
3,000
3,500
4,000
Q2 2011 Q2 2012 Q2 2013 Q2 2014 Q2 2015 Q2 2016 Q2 2017
Outer Metro Vancouver Inner Metro
050
100150200250300350400450
Q2 2012 Q2 2013 Q2 2014 Q2 2015 Q2 2016 Q2 2017
Inner Metro Outer Metro Vancouver
–
New Home Data: Concrete Condominiums
Insights & Comments:
• A total of 95 new concrete condominium projects were actively selling across Metro Vancouver in Q2-2017; four fewer projects than the same quarter in 2016 and 26
fewer than in Q2-2015.
• The Inner Metro region has experienced a steady increase in new concrete condominium projects since Q3-2016, and currently accounts for 56% of all projects.
• The city of Vancouver and Outer Metro account for 34 and eight projects respectively.
• Total sales of concrete condominiums reached 2,463 across Metro Vancouver, which represents a 28% year-over-year drop, but 2% increase over Q2-2015.
• Sales are 34% higher than in Q1-2017 due to a 71% increase in concrete condominium sales in Inner Metro.
• By contrast, the city of Vancouver experienced a 63% decline in sales relative to Q1-2017, which represents 339 sales.
• Released and unsold inventory of new concrete condominiums in Metro Vancouver reached its lowest level since 2010, totaling 1,126 units in Q2-2017.
• This represents a respective decrease 4% and 76% compared to Q2-2016 and Q2-2015.
• Released and unsold inventory levels in Q2-2017 in Outer Metro (48) and Vancouver (330) have been trending lower since Q1-2013, while unsold inventory levels in
Inner Metro (748) and Outer Metro (48) are near seven-year lows.
• The number of move-in ready new concrete condominiums in Q2-2017 continues to be at near-record lows with just 23 units available across Metro Vancouver.
• There was not a single completed and unsold concrete condominium units in the city of Vancouver, while there were total of just 15 move-in ready units in all of the
Inner Metro region.
1: Released and unsold “inventory” includes new home product available for sale that is pre-construction, under construction, and completed. “Standing Inventory” refers
unsold units that are complete and move-in ready.
6.1 Concrete Condominium Projects Actively Marketing
6.2 Concrete Condominium Sales
6.3 Concrete Condominium Released & Unsold Inventory Levels
6.4 Concrete Condominium Standing Inventory Levels
Q2-2017
Table of Contents Page 12
0
10
20
30
40
50
60
Q2 2011 Q2 2012 Q2 2013 Q2 2014 Q2 2015 Q2 2016 Q2 2017
Inner Metro Outer Metro Vancouver
0100200300400500600700800900
1000
Q2 2011 Q2 2012 Q2 2013 Q2 2014 Q2 2015 Q2 2016 Q2 2017
Inner Metro Outer Metro Vancouver
0
200
400
600
800
1000
1200
1400
1600
1800
Q2 2011 Q2 2012 Q2 2013 Q2 2014 Q2 2015 Q2 2016 Q2 2017
Inner Metro Outer Metro Vancouver
0
100
200
300
400
500
600
700
800
Q2 2012 Q2 2013 Q2 2014 Q2 2015 Q2 2016 Q2 2017
Inner Metro Outer Metro Vancouver
New Home Data: Wood Frame Condominiums
Insights & Comments:
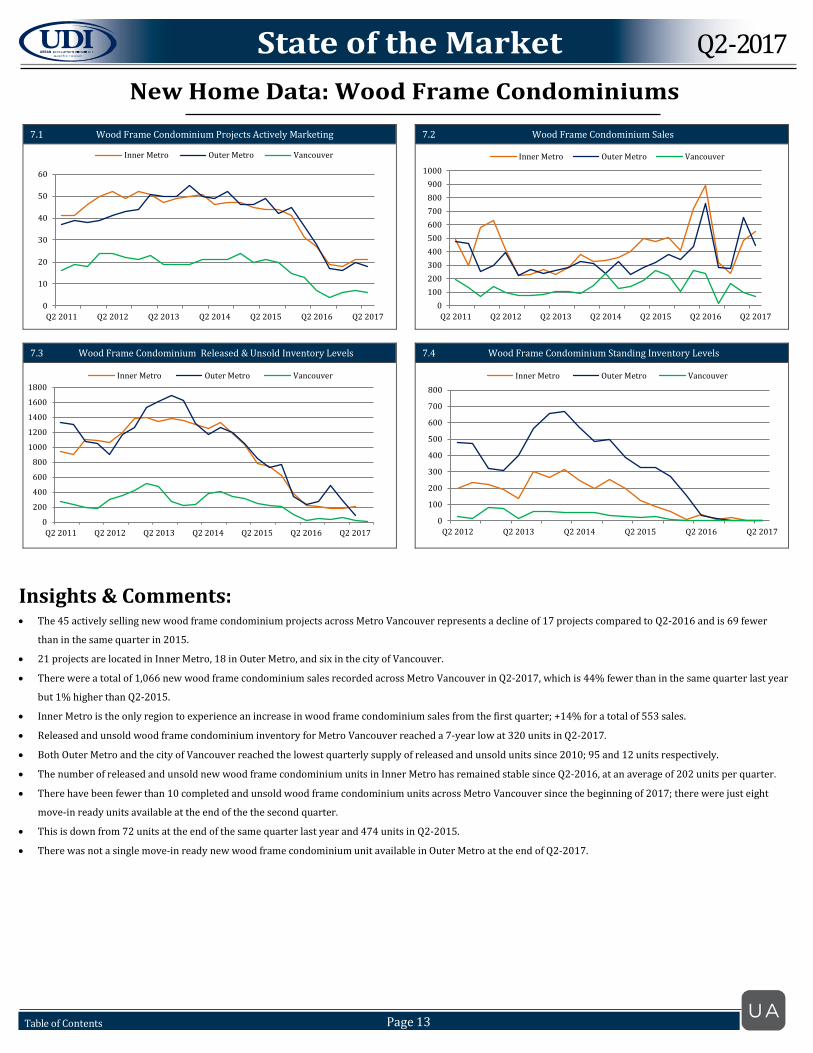
• The 45 actively selling new wood frame condominium projects across Metro Vancouver represents a decline of 17 projects compared to Q2-2016 and is 69 fewer
than in the same quarter in 2015.
• 21 projects are located in Inner Metro, 18 in Outer Metro, and six in the city of Vancouver.
• There were a total of 1,066 new wood frame condominium sales recorded across Metro Vancouver in Q2-2017, which is 44% fewer than in the same quarter last year
but 1% higher than Q2-2015.
• Inner Metro is the only region to experience an increase in wood frame condominium sales from the first quarter; +14% for a total of 553 sales.
• Released and unsold wood frame condominium inventory for Metro Vancouver reached a 7-year low at 320 units in Q2-2017.
• Both Outer Metro and the city of Vancouver reached the lowest quarterly supply of released and unsold units since 2010; 95 and 12 units respectively.
• The number of released and unsold new wood frame condominium units in Inner Metro has remained stable since Q2-2016, at an average of 202 units per quarter.
• There have been fewer than 10 completed and unsold wood frame condominium units across Metro Vancouver since the beginning of 2017; there were just eight
move-in ready units available at the end of the the second quarter.
• This is down from 72 units at the end of the same quarter last year and 474 units in Q2-2015.
• There was not a single move-in ready new wood frame condominium unit available in Outer Metro at the end of Q2-2017.
7.1 Wood Frame Condominium Projects Actively Marketing
7.2 Wood Frame Condominium Sales
7.3 Wood Frame Condominium Released & Unsold Inventory Levels
7.4 Wood Frame Condominium Standing Inventory Levels
Q2-2017
Table of Contents Page 13

0
10
20
30
40
50
60
70
Q2 2011 Q2 2012 Q2 2013 Q2 2014 Q2 2015 Q2 2016 Q2 2017
Inner Metro Outer Metro Vancouver
0
150
300
450
600
750
900
1050
1200
Q2 2011 Q2 2012 Q2 2013 Q2 2014 Q2 2015 Q2 2016 Q2 2017
Inner Metro Outer Metro Vancouver
0
150
300
450
600
750
900
Q2 2011 Q2 2012 Q2 2013 Q2 2014 Q2 2015 Q2 2016 Q2 2017
Inner Metro Outer Metro Vancouver
0
50
100
150
200
250
300
350
400
Q2 2012 Q2 2013 Q2 2014 Q2 2015 Q2 2016 Q2 2017
Inner Metro Outer Metro Vancouver
New Home Data: Townhomes
Insights & Comments:
• 79 new townhome projects were actively selling across Metro Vancouver in Q2-2017, with 47 located in Outer Metro, 24 in Inner Metro, and eight in the city of
Vancouver.
• The overall number of projects is up from 60 relative to the same quarter last year but down from 89 two years ago.
• Both the Inner and Outer Metro regions have had more new townhome projects launch since the beginning of 2017, while fewer are being marketed in the city of
Vancouver.
• In Q2-2017, there were a total of 1,145 new townhome sales across Metro Vancouver with 78% of those located in the Outer Metro region.
• Townhomes in Outer Metro experienced a 43% increase in sales compared to Q1-2017 while the number of townhome projects in the region increased to 47 from 34
in the previous quarter.
• Sales volumes have increased in all regions of Metro Vancouver compared to Q1-2017 with 223 in Inner Metro, 896 in Outer Metro, and 26 in the city of Vancouver.
• Total sales are 19% lower than the same quarter last year but 27% higher than Q2-2015.
• Total released and unsold townhome inventory has declined by 19% relative to Q1-2017; to 496 units across Metro Vancouver in the second quarter.
• The number of released and unsold townhome units has leveled off in Outer Metro since the beginning of 2017 while townhome supply has trended lower in both
Inner Metro and the city of Vancouver.
• The number of completed and unsold new townhomes increased to 19 units in Q2-2017, higher than the all-time low of two units recorded in the same quarter in
2016.
• Despite this increase, the number of move-in ready units across Metro Vancouver remain at near record lows.
8.1 Townhome Projects Actively Marketing
8.2 Townhome Sales
8.3 Townhome Released & Unsold Inventory Levels
8.4 Townhome Standing Inventory Levels
Q2-2017
Table of Contents Page 14
71.2% 70.9% 70.1% 73.6% 73.6% 74.3% 76.4% 76.5% 77.1% 75.0% 73.6% 73.7% 72.4% 73.1%
55.1%53.9% 53.0% 51.8% 55.3% 54.4% 55.4% 53.4% 51.5% 52.6% 50.7%
44.1% 42.2%34.4% 37.2%
27.2%
40.2% 39.3% 38.6% 40.9% 38.6% 36.3%31.6% 31.5% 29.7%
20.9%12.9%
9.0% 10.1% 9.5%
4.7%
Q4 2013 Q1 2014 Q2 2014 Q3 2014 Q4 2014 Q1 2015 Q2 2015 Q3 2015 Q4 2015 Q1 2016 Q2 2016 Q3 2016 Q4 2016 Q1 2017 Q2 2017
Outer Metro Inner Metro Vancouver
73.5% 72.1% 71.8%75.0% 72.5% 73.3% 71.7% 73.9% 73.4% 73.9%
68.2% 66.9% 66.4% 67.4%
57.7%
61.7% 60.0% 59.4%63.2% 61.8% 62.3% 61.9% 60.0% 59.5% 57.1% 54.5% 52.7% 49.1% 48.1%
47.7%41.7%35.0%
39.5% 40.7% 44.4%40.3% 38.2% 39.9% 36.7% 30.6%
26.8%29.6% 29.3% 29.4%
20.5%
Q4 2013 Q1 2014 Q2 2014 Q3 2014 Q4 2014 Q1 2015 Q2 2015 Q3 2015 Q4 2015 Q1 2016 Q2 2016 Q3 2016 Q4 2016 Q1 2017 Q2 2017
Outer Metro Inner Metro Vancouver
67.4% 65.2% 65.7%70.0% 67.7% 69.7% 68.5% 64.4% 67.9% 64.7%
57.9% 53.7%46.4%
55.1%
47.7%
53.5% 50.1% 46.9%51.7% 51.1% 50.6%
59.0% 49.2% 47.9% 49.3%
36.8%32.6% 36.2% 36.6%
39.3%
22.4% 18.5%22.9% 24.5%
32.8% 34.7%27.4%
32.2%
22.4% 27.3%
11.3%9.0% 8.4% 10.3%
4.2%
Q4 2013 Q1 2014 Q2 2014 Q3 2014 Q4 2014 Q1 2015 Q2 2015 Q3 2015 Q4 2015 Q1 2016 Q2 2016 Q3 2016 Q4 2016 Q1 2017 Q2 2017
Outer Metro Inner Metro Vancouver
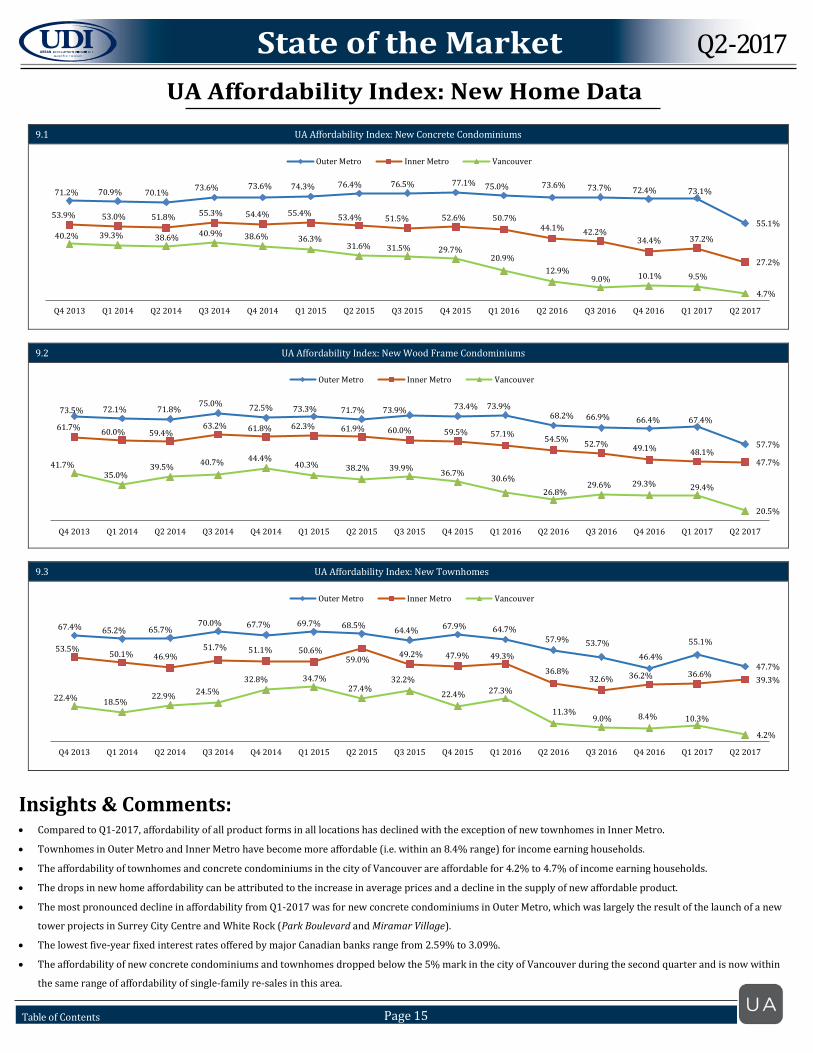
UA Affordability Index: New Home Data
Insights & Comments:
• Compared to Q1-2017, affordability of all product forms in all locations has declined with the exception of new townhomes in Inner Metro.
• Townhomes in Outer Metro and Inner Metro have become more affordable (i.e. within an 8.4% range) for income earning households.
• The affordability of townhomes and concrete condominiums in the city of Vancouver are affordable for 4.2% to 4.7% of income earning households.
• The drops in new home affordability can be attributed to the increase in average prices and a decline in the supply of new affordable product.
• The most pronounced decline in affordability from Q1-2017 was for new concrete condominiums in Outer Metro, which was largely the result of the launch of a new
tower projects in Surrey City Centre and White Rock (Park Boulevard and Miramar Village).
• The lowest five-year fixed interest rates offered by major Canadian banks range from 2.59% to 3.09%.
• The affordability of new concrete condominiums and townhomes dropped below the 5% mark in the city of Vancouver during the second quarter and is now within
the same range of affordability of single-family re-sales in this area.
9.1 UA Affordability Index: New Concrete Condominiums
9.2 UA Affordability Index: New Wood Frame Condominiums
9.3 UA Affordability Index: New Townhomes
Q2-2017
Table of Contents Page 15
0
1,000
2,000
3,000
4,000
5,000
6,000
7,000
Q22007
Q22008
Q22009
Q22010
Q22011
Q22012
Q22013
Q22014
Q22015
Q22016
Q22017
Sales Listings
0
500
1,000
1,500
2,000
2,500
Q22007
Q22008
Q22009
Q22010
Q22011
Q22012
Q22013
Q22014
Q22015
Q22016
Q22017
Sales Listings
0
1,000
2,000
3,000
4,000
5,000
6,000
7,000
Q22007
Q22008
Q22009
Q22010
Q22011
Q22012
Q22013
Q22014
Q22015
Q22016
Q22017
Sales Listings
$100$150$200$250$300$350$400$450$500$550$600
Q22007
Q22008
Q22009
Q22010
Q22011
Q22012
Q22013
Q22014
Q22015
Q22016
Q22017
Thou
sand
s
$200
$300
$400
$500
$600
$700
$800
Q22007
Q22008
Q22009
Q22010
Q22011
Q22012
Q22013
Q22014
Q22015
Q22016
Q22017
Thou
sand
s
$300
$500
$700
$900
$1,100
$1,300
$1,500
$1,700
Q22007
Q22008
Q22009
Q22010
Q22011
Q22012
Q22013
Q22014
Q22015
Q22016
Q22017
Thou
sand
s
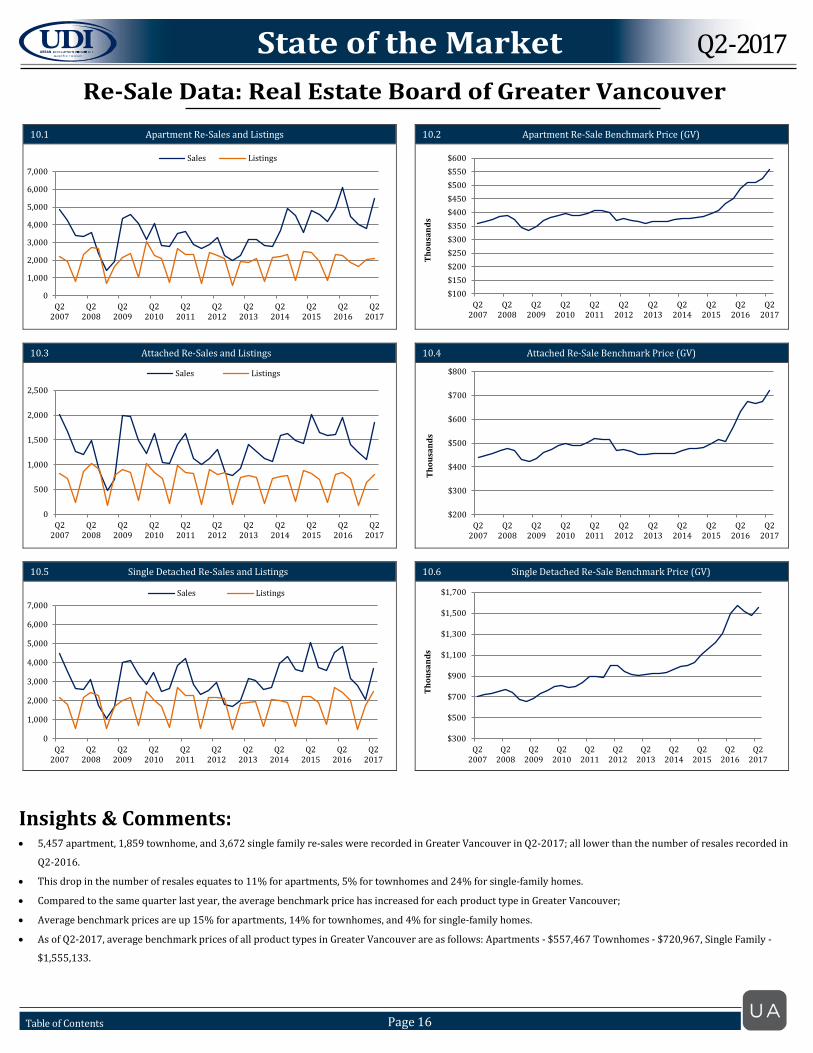
Re-Sale Data: Real Estate Board of Greater Vancouver
Insights & Comments:
• 5,457 apartment, 1,859 townhome, and 3,672 single family re-sales were recorded in Greater Vancouver in Q2-2017; all lower than the number of resales recorded in
Q2-2016.
• This drop in the number of resales equates to 11% for apartments, 5% for townhomes and 24% for single-family homes.
• Compared to the same quarter last year, the average benchmark price has increased for each product type in Greater Vancouver;
• Average benchmark prices are up 15% for apartments, 14% for townhomes, and 4% for single-family homes.
• As of Q2-2017, average benchmark prices of all product types in Greater Vancouver are as follows: Apartments - $557,467 Townhomes - $720,967, Single Family -
$1,555,133.
10.1 Apartment Re-Sales and Listings
10.2 Apartment Re-Sale Benchmark Price (GV)
10.3 Attached Re-Sales and Listings
10.4 Attached Re-Sale Benchmark Price (GV)
10.5 Single Detached Re-Sales and Listings
10.6 Single Detached Re-Sale Benchmark Price (GV)
Q2-2017
Table of Contents Page 16

0
1,000
2,000
3,000
4,000
5,000
6,000
7,000
Q2 2009 Q2 2010 Q2 2011 Q2 2012 Q2 2013 Q2 2014 Q2 2015 Q2 2016 Q2-2017
Sales Active Listings
0
200
400
600
800
1,000
1,200
1,400
1,600
1,800
Q2 2009 Q2 2010 Q2 2011 Q2 2012 Q2 2013 Q2 2014 Q2 2015 Q2 2016 Q2 2017
Sales Active Listings
0
200
400
600
800
1,000
1,200
1,400
1,600
1,800
Q2 2009 Q2 2010 Q2 2011 Q2 2012 Q2 2013 Q2 2014 Q2 2015 Q2 2016 Q2 2017
Sales Active Listings
$500
$600
$700
$800
$900
$1,000
$1,100
$1,200
Q2 2009 Q2 2010 Q2 2011 Q2 2012 Q2 2013 Q2 2014 Q2 2015 Q2 2016 Q2-2017
Thou
sand
s
$310
$360
$410
$460
$510
$560
Q2 2009 Q2 2010 Q2 2011 Q2 2012 Q2 2013 Q2 2014 Q2 2015 Q2 2016 Q2 2017
Thou
sand
s
$220
$240
$260
$280
$300
$320
$340
Q2 2009 Q2 2010 Q2 2011 Q2 2012 Q2 2013 Q2 2014 Q2 2015 Q2 2016 Q2 2017
Thou
sand
s
Re-Sale Data: Fraser Valley Board
Insights & Comments: • The Fraser Valley Real Estate Board (FREB) recorded 1,868 single family re-sales, 1,340 apartment re-sales, and 1,436 townhome re-sales in Q2-2017.
• Apartment re-sales are down 16%, townhome re-sales are 22% lower while single-family home re-sales increased by 2% relative to the same quarter last year.
• When compared to Q1-2017, re-sales are higher for product types: +41% for apartments, +85% for townhomes, and +37% for single-family homes.
• Active listings for all product types have continued to increase since the beginning of 2017, but remain significantly below the 10-year average.
• Compared to the same quarter last year, only the number of active townhome listings has increased (+33%), while active apartment listings are 25% lower.
• The number of active listings for single-family has remained relatively similar compared to Q2-2016.
• Average benchmark prices have increased across all product forms compared to Q1-2017 and to Q2-2016, and are at record highs.
• Average prices in the FREB areas are as follows as of Q2-2017: $1,080,925 for single-family homes, $519,885 for townhomes, and $339,119 for apartments.
• The most significant yearly increase was for apartments (+19%) due to price increases across all municipalities with the exception of North Delta and North Surrey.
11.1 Apartment Re-Sales and Listings
11.2 Apartment Re-Sale Average Prices
11.3 Attached Re-Sales and Listings
11.4 Attached Re-Sale Average Prices
11.5 Single Detached Re-Sales and Listings
11.6 Single Detached Re-Sale Average Prices
Q2-2017
Table of Contents Page 17
0.90%
1.24%
1.86%
0% 20% 40% 60% 80% 100%
Inner Metro
Outer Metro
Vancouver
Vac Rate Occ Rate
0
500
1000
1500
2000
2500
3000
3500
4000
Inner Metro Outer Metro Vancouver
Concrete Total Wood Frame Total Townhome Total
$0.00
$0.50
$1.00
$1.50
$2.00
$2.50
$3.00
Inner Metro PSF Outer Metro PSF Vancouver PSF
Concrete Wood Frame Townhome
$0.00
$0.50
$1.00
$1.50
$2.00
$2.50
$3.00
$3.50
$4.00
Inner Metro Outer Metro Vancouver
Concrete Wood Frame Townhome
0500
100015002000250030003500
Concrete Units Wood Frame Units Townhome Units
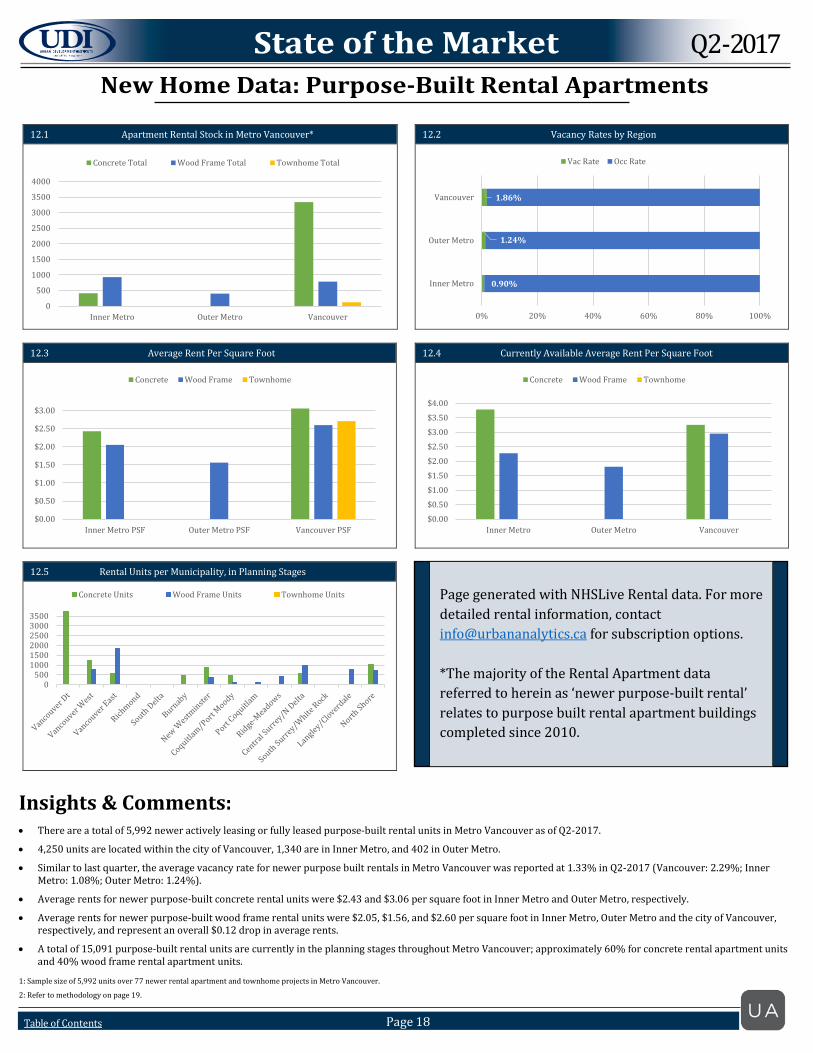
New Home Data: Purpose-Built Rental Apartments
Insights & Comments:
• There are a total of 5,992 newer actively leasing or fully leased purpose-built rental units in Metro Vancouver as of Q2-2017.
• 4,250 units are located within the city of Vancouver, 1,340 are in Inner Metro, and 402 in Outer Metro.
• Similar to last quarter, the average vacancy rate for newer purpose built rentals in Metro Vancouver was reported at 1.33% in Q2-2017 (Vancouver: 2.29%; Inner Metro: 1.08%; Outer Metro: 1.24%).
• Average rents for newer purpose-built concrete rental units were $2.43 and $3.06 per square foot in Inner Metro and Outer Metro, respectively.
• Average rents for newer purpose-built wood frame rental units were $2.05, $1.56, and $2.60 per square foot in Inner Metro, Outer Metro and the city of Vancouver, respectively, and represent an overall $0.12 drop in average rents.
• A total of 15,091 purpose-built rental units are currently in the planning stages throughout Metro Vancouver; approximately 60% for concrete rental apartment units and 40% wood frame rental apartment units.
1: Sample size of 5,992 units over 77 newer rental apartment and townhome projects in Metro Vancouver.
2: Refer to methodology on page 19.
12.1 Apartment Rental Stock in Metro Vancouver*
12.2 Vacancy Rates by Region
12.3 Average Rent Per Square Foot
12.4 Currently Available Average Rent Per Square Foot
12.5 Rental Units per Municipality, in Planning Stages
Q2-2017
Table of Contents Page 18
Page generated with NHSLive Rental data. For more detailed rental information, contact [email protected] for subscription options. *The majority of the Rental Apartment data referred to herein as ‘newer purpose-built rental’ relates to purpose built rental apartment buildings completed since 2010.
Methodology & Definitions – Affordability Index Definitions Inner Metro: West Vancouver, North Vancouver, Burnaby, New Westminster, Richmond, South Delta, Coquitlam, Port Moody & Port Coquitlam. Outer Metro: Langley, North Delta, Surrey, White Rock, Pitt Meadows and Maple Ridge. Vancouver: Downtown Vancouver, Vancouver West and Vancouver East. Prices Prices for the new home market were collected from actively selling new multi-family projects in Metro Vancouver. Re-sale prices were collected from the Real Estate Boards of Greater Vancouver and the Fraser Valley (with median and benchmark prices used). Income The Index uses household income information from Statistics Canada data from the 2010 Household Survey. Assumed Down Payments Wood frame and concrete condominiums: 20% Townhomes: 30% The reason for the difference is the assumption that townhome buyers are more likely to be move-up buyers with equity built up in their existing property. Analytical Methods Five year, fixed rate 30-year amortization mortgages were used, taking an average of the best rates at eight banks at the time of analysis. Other Assumptions The affordability index assumes that a person can afford a maximum of 32 percent of their gross family income to go toward mortgage payments.
Additional Methodology & Definitions – New Home Data: Purpose-Built Rental Apartments
Analytical Methods Chart 1: Apartment Rental Stock in Metro Vancouver: Sum of “move-in ready” units by product type. “Move-in ready” is defined as those projects that are Fully Leased and that are Active (actively leasing) with standing inventory. Chart 2: Vacancy Rates by Region: Projects included are those that are “move-in ready”, as defined above. Chart 3: Average Rent per Square Foot: Average rent for fully leased projects only. The average per region is based on average dollar per square foot prices of each sub-market. Chart 4: Currently Available Average Rent per Square Foot: Average rent for currently available units of fully leased projects. The average per region is based on average dollar per square foot prices of each sub-market. Chart 5: Rental Units per Municipality, in Planning Stages: Total units of every project in the contemplated section of the Rental database, by product type.
Q2-2017
Table of Contents Page 19

Sources Sources
Q2-2017
1.1 - Statistics Canada Monthly Labour Force Survey 1.2 - Statistics Canada Monthly Labour Force Survey 1.3 - Stats Canada Quarterly Demographic Estimates 1.4 - Stats Canada Quarterly Demographic Estimates 1.5 - Stats Canada Quarterly Demographic Estimates 1.6 - Stats Canada Quarterly Demographic Estimates 2.1 - Bank of Canada 2.2 - BC Stats Consumer Price Index 2.3 - Statistics Canada Monthly Labour Force Survey 2.4 - Statistics Canada Monthly Labour Force Survey 2.5 - Statistics Canada Retail Trade by Province 2.6 - Statistics Canada Gross Domestic Product 3.1 - Stats Canada Revenue, Expenditure & Budget 3.2 - Statistics Canada Investment in New Housing 3.3 - Index Mundi (Monthly Spot Oil Prices) 3.4 - Industry Canada Insolvency Statistics 3.5 - Statistics Canada Stock Market Statistics 3.6 - Statistics Canada Stock Market Statistics 4.1 BC Housing (data collected by the HPO branch) - New Single Family Registrations 4.2 BC Housing (data collected by the HPO branch) - New Multi-Family Registrations 5.1 - CMHC Housing Now – Vancouver & Abbotsford 5.2 - CMHC Housing Now – Vancouver & Abbotsford 5.3 - CMHC Housing Now – Vancouver & Abbotsford 5.4 - Statistics Canada Building Permits 5.5 - Statistics Canada New Housing Price Indexes 5.6 - CMHC Rental Market Report 6.1 - UA New Home Source Database 6.2 - UA New Home Source Database 6.3 - UA New Home Source Database 6.4 - UA New Home Source Database
Table of Contents Page 20
7.1 - UA New Home Source Database 7.2 - UA New Home Source Database 7.3 - UA New Home Source Database 7.4 - UA New Home Source Database 8.1 - UA New Home Source Database 8.2 - UA New Home Source Database 8.3 - UA New Home Source Database 8.4 - UA New Home Source Database 9.1 - UA New Home Source Database, Stats Canada, Bank Websites 9.2 - UA New Home Source Database, Stats Canada, Bank Websites 9.3 - UA New Home Source Database, Stats Canada, Bank Websites 10.1 - REBGV Monthly Statistics 10.2 - REBGV Monthly Statistics 10.3 - REBGV Monthly Statistics 10.4 - REBGV Monthly Statistics 10.5 - REBGV Monthly Statistics 10.6 - REBGV Monthly Statistics 11.1 - FVREB Monthly Statistics 11.2 - FVREB Monthly Statistics 11.3 - FVREB Monthly Statistics 11.4 - FVREB Monthly Statistics 11.5 - FVREB Monthly Statistics 11.6 - FVREB Monthly Statistics 12.1 – UA New Home Source Rental Database 12.2 – UA New Home Source Rental Database 12.3 – UA New Home Source Rental Database 12.4 – UA New Home Source Rental Database 12.5 – UA New Home Source Rental Database