table of contents - home: envis centre tamil nadu - …tnenvis.nic.in/air pollution database for...
TRANSCRIPT


Table of Contents
S. No
Content
Page No.
1. Introduction 1
2. Air Pollution 2
3 Conclusion 456
List of Tables
Table.no Name Page No.
2.1 Status Of Air Quality Of Important Cities /Towns Of Tamilnadu-Under National Air Quality Monitoring Programme(Namp) Annual Average Concentration Of Air Pollutants,2004-2005
6
2.2 Status Of Air Quality Of Important Cities /Towns Of Tamilnadu-Under National Air Quality Monitoring Programme(Namp) Annual Average Concentration Of Air Pollutants,2005-2006
7
2.3 Status Of Air Quality Of Important Cities/ Towns Of Tamilnadu Under National Air Quality Monitoring Progrmme (Namp) Annual Average Concentration Of Air Pollutants 2006-2007
8
2.4 Status Of Air Quality Of Important Cities /Towns Of Tamilnadu-Under National Air Quality Monitoring Programme(Namp), Annual Average Concentration Of Air Pollutants,2008-2009
9
2.5 Status Of Air Quality Of Important Cities /Towns Of Tamilnadu-Under National Air Quality Monitoring Programme(Namp) Annual Average Concentration Of Air Pollutants,2009-2010
10
2.6 Status Of Air Quality Of Important Cities /Towns Of Tamilnadu-Under National Air Quality Monitoring Programme (Namp) Annual Average Concentration Of Air Pollutants,2010-2011
11
2.7 Status Of Air Quality Of Important Cities/Towns Of Tamilnadu – Under National Air Quality Monitoring Programme (Namp) Annual Average Concentrations Of Air Pollutants, 2011 – 2012
12
2.8 Chennai Ambient Air Quality Monitoring Programme Status Of Air Quality During April 2004 To March 2005
13
2.9 Chennai Ambient Air Quality Monitoring Programme Status Of Air Quality During April 2005 To March 2006
13
2.10 Chennai Ambient Air Quality Monitoring Programme Status Of Air Quality Monitoring During 2006-2007
14
2.11 Chennai Ambient Air Quality Monitoring Programme Status Of Air Quality During April 2008 To March 2009
14
2.12 Chennai Ambient Air Quality Monitoring Programme Status Of Air Quality During April 2009 To March 2010
15
2.13 Chennai Ambient Air Quality Monitoring Programme Status Of Air Quality During April 2010 To March 2011
15
2.14 Chennai Ambient Air Quality Monitoring Programme 16 2.15 Status Report Of Trichy Air Quality Under Trichy Ambient Air
Quality Monitoring Programme (Taaqm) During 2004-2005 17
2.16 Status Report Of Trichy Air Quality Under Trichy Ambient Air Quality Monitoring Programme (Taaqm) During 2005-2006
18
2.17 Status Report Of Trichy Air Quality Under Trichy Ambient Air Quality Monitoring Programme (Taaqm) During 2006 – 2007
19
2.18 Status Report Of Trichy Air Quality Under Trichy Ambient Air Quality Monitoring Programmr (Taaqm) During 2008-2009
20
2.19 Status Report Of Trichy Air Quality Under Trichy Ambient Air Quality Monitoring Programme (Taaqm) During 2009-2010
21
2.20 Status Report Of Trichy Air Quality Under Trichy Ambient Air Quality Monitoring Programme (Taaqm) During 2010-2011
22
2.21 Status Report Of Trichy Air Quality Under Trichy Ambient Air Quality Monitoring Programmr (Taaqm) During 2011 – 2012
23
2.22 Status Of Vehicle Tested At TNPCB Vem Stations During 2004-2005 24 2.23 Status Of Vehicle Tested At TNPCB Vem Stations During 2005-2006 25 2.24 Status Of Vehicle Tested At TNPCB Vem Station During 2006-2007 26 2.25 Status Of Vehicle Tested At TNPCB Vem Stations During 2008-2009 26 2.26 Status Of Vehicle Tested At TNPCB Vem Stations During 2009-2010 27 2.27 Status Of Vehicle Tested At TNPCB Vem Stations During 2010-2011 27 2.28 Ambient Air Quality Monitoring Results of Chennai between 2003 &
2012 at Kathivakkam 28
2.29 Ambient Air Quality Monitoring Results of Chennai between 2003 & 2012 at Manali
29
2.30 Ambient Air Quality Monitoring Results of Chennai between 2003 & 2012 at Tiruvottiyur
30
2.31 Ambient Air Quality Monitoring Results of Coimbatore between 2003 & 2012
31
2.32 Ambient Air Quality Monitoring Results of Coimbatore between 2003 & 2012 at Ponniyarajapuram
32
2.33 Ambient Air Quality Monitoring Results of Coimbatore between 2003 & 2012 at SIDCO, Coimbatore
33
2.34 Ambient Air Quality Monitoring Results of Thoothukudi between 2003&2012
34
2.35 Ambient Air Quality Monitoring Results of Thoothukudi between 2003&2012 at AVM building
35
2.36 Ambient Air Quality Monitoring Results of Thoothukudi between 2003&2012 at SIPCOT
36
2.37 Ambient Air Quality Monitoring Results of Madurai between 2003&2012
37
2.38 Ambient Air Quality Monitoring Results of Madurai between 2003&2012 at Kunnathur Chatram
38

2.39 Ambient Air Quality Monitoring Results of Madurai between 2003&2012 at Highway Project Building
39
2.40 Ambient Air Quality Monitoring Results of Salem between 2003 & 2012 at Sowdeswari College Building
40
2.41 Number of vehicles in Tamil Nadu – 2013 41 2.42 Number of vehicles in Tamil Nadu – 2003 42 2.43 Number of Vehicles in the State during 2003 and 2013 43 2.44 Number of Vehicles in the Chennai during 2003 and 2013 43

List of Figures
Figure. No Name Page No.
2.1 Graph showing Ambient Air Quality in Kathivakkam Chennai between 2003-2012
28
2.2 Graph showing Ambient Air Quality in Manali Chennai between 2003-2012
29
2.3 Graph showing Ambient Air Quality in , Thiruvottiyur Chennai between 2003-2012
30
2.4 Graph showing Ambient Air Quality in GD, School Coimbatore between 2003-2012
31
2.5 Graph showing Ambient Air Quality in Ponniyarajapuram, Coimbatore between 2003-2012
32
2.6 Graph showing Ambient Air Quality in SIDCO Coimbatore between 2003-2012
33
2.7 Graph showing Ambient Air Quality in Thoothukudi between 2003-2012
34
2.8 Graph showing Ambient Air Quality in AVM building Thoothukudi between 2003-2012
35
2.9 Graph showing Ambient Air Quality in SIPCOT Thoothukudi between 2003-2012
36
2.10 Graph showing Ambient Air Quality in Madurai between 2003-2012 37 2.11 Graph showing Ambient Air Quality in Kunnathur Chatram-
Madurai between 2003-2012 38
2.12 Graph showing Ambient Air Quality in Highway Project Building -Madurai between 2003-2012
39
2.13 Graph showing Ambient Air Quality in Salem between 2003-2012 40

AIR POLLUTION IN TAMIL NADU 1. Introduction
It is a necessity to build a future in which humans live in harmony with nature. In order to
protect our ecological security we need to focus our attention and to take necessary steps
both locally and globally for the following objectives:
Ensuring conservation of the country’s biodiversity, major ecosystems and critical
landscapes. Minimizing consumption and promotion of sustainable and wise use of
natural resources by all sectors of society
Promoting the active involvement of rural and traditional communities in the
sustainable management and conservation of natural resources.
Working towards reduction in the sources and impacts of climate change.
Minimizing pollution by reducing the use of toxic chemicals and ensuring improved
management of toxic waste
Enhancing active participation of all sections of society in nature conservation and
environmental protection through environmental education, awareness raising and
capacity building
Ensuring that environmental principles are integrated into development planning,
policy and practices.
Promoting environmental governance through legislation, policy and advocacy.
Therefore it becomes necessary to identify the gaps in the present management of resource
bases. Such intervention will be realistic only if we have a strong database on the
environmental matters of the state. Therefore, it is proposed to collect data from different
source, compile them to bring together a Pollution Database for the State of Tamil Nadu.
1

2. Air Pollution Air pollution is defined as the introduction of particulates, biological molecules, or
other harmful materials into the Earth's atmosphere, possibly that cause disease, death to
humans, damage to food crops, or the natural or built environment. Stratospheric ozone
depletion due to air pollution has long been recognized as a threat to human health as well as
to the Earth's ecosystems. Indoor air pollution and urban air quality are listed as two of the
world’s worst toxic pollution problems.
2.1 Sources There are various activities or factors which are responsible for releasing pollutants
into the atmosphere. These sources can be classified into two major categories.
Anthropogenic (man-made) sources:
These are mostly due to the burning of multiple types of fuel.
Anthropogenic sources include the following:
Stationary sources include stacks of power plants, manufacturing factories, waste
incinerators, furnaces and other types of fuel-burning devices.
In less developed countries traditional biomass burning is the major source of air pollutants;
Traditional biomass includes wood, crop waste and cow-dung.
Mobile Sources include vehicles, marine vessels, and aircrafts. Fumes from paint, hair spray,
varnish, aerosol sprays and other solvents also contribute towards air pollution. Waste
deposition in landfills, generate methane during the breakdown of compounds. Methane
being highly flammable and forms explosive mixtures with air. Methane is also an asphyxiant
and displaces oxygen in an enclosed space.
Military resources, such as nuclear weapons and toxic gases are also key sources of air
pollution.
Natural sources:
Dust from natural sources, mostly large areas of land with few or no vegetation.
Radon gas from radioactive decay within the Earth's crust. Radon is a naturally occurring,
radioactive noble gas that is formed from the decay of radium. It is considered to be a health
2

hazard. Radon gas from natural sources can accumulate in buildings, especially in confined
areas is the one of the most frequent cause of lung cancer. Smoke and carbon monoxide from
wildfires Volcanic activity, produces sulfur, chlorine, and ash particulates. A pollutant can
be of natural origin or man-made. Pollutants are classified as primary or secondary.
Primary pollutants are usually produced from a process, such as ash from a volcanic
eruption. Other examples include carbon monoxide gas from motor vehicle exhaust, or the
sulfur dioxide released from factories.
Secondary pollutants are not emitted directly. Rather, they form in the air when primary
pollutants react or interact. Ground level ozone is a prominent example of a secondary
pollutant. Some pollutants may be both primary and secondary: they are both emitted directly
and formed from other primary pollutants.
In India the Major source of air pollution include Fuel wood and biomass burning in
rural and urban India, Most of India uses Fuel wood and biomass cakes for cooking and
general heating needs. Cook stoves using biomass are present in over 100 million Indian
households, and are used two to three times a day. Majority of Indians still use traditional
fuels such as dried cow dung, agricultural wastes, and firewood as cooking fuel
Major primary pollutants produced by human activity include:
Sulphur oxides (SOx) - particularly sulfur dioxide, a chemical compound with the formula
SO2 is produced by volcanoes and various industrial processes. Coal and petroleum often
contain sulfur compounds, and their combustion releases sulfur dioxide. Further oxidation of
SO2, usually in the presence of a catalyst such as NO2, forms H2SO4, and leads to the
formation of acid rain.
Nitrogen oxides (NOx)-Nitrogen oxides, particularly nitrogen dioxide, are expelled from
high temperature combustion, and are also produced during thunderstorms by electric
discharge. It is a chemical compound with the formula NO2. It is one of the most prominent
air pollutants.
3

Carbon monoxide (CO)- CO is also a toxic gas. It is a product by incomplete combustion of
fuel such as natural gas, coal or wood. Vehicular exhaust is a major source of carbon
monoxide.
Volatile organic compounds - VOCs are a well-known outdoor air pollutant. They are
categorized as either methane (CH4) or non-methane (NMVOCs). Methane is a greenhouse
gas which has contributed to enhance global warming. The aromatic NMVOCs such as
benzene, toluene and xylene are suspected carcinogens and may lead to leukemia with
prolonged exposure.
1,3-butadiene is another compound often associated with industrial use.
Particulate Matter
Particulates, alternatively referred to as particulate matter (PM), atmospheric
particulate matter, or fine particles, are particles of solid or liquid suspended in a gas.
Aerosols
In contrast, aerosol refers to combined particles and gas. They can occur naturally,
from volcanoes, dust storms, forest fires, and sea spray. Human activities, such as the burning
of fossil fuels in vehicles, power plants and industrial processes also generate significant
amounts of aerosols.
Chlorofluorocarbons (CFCs) - harmful to the ozone layer. These are gases which are
released from air conditioners, refrigerators. CFC's on being released into the air rises to
stratosphere and react with other gases and damage the ozone layer. This allows harmful
ultraviolet rays to reach the earth's surface causing skin cancer and diseases to the eye.
Secondary pollutants include:
Particulates created from gaseous primary pollutants are called secondary pollutants.
Smog is a kind of secondary air pollution. Smog results from large amounts of coal burning
in an area caused by a mixture of smoke and sulfur dioxide. Smog also comes from vehicular
and industrial emissions that are acted on in the atmosphere by ultraviolet light from the sun
to form secondary pollutants that also combine with the primary emissions to form
photochemical smog. 4

Ground level ozone (O3) is formed from NOx and VOCs. Ozone (O3) is a key constituent
of the troposphere. It is also an important constituent of certain regions of the stratosphere
commonly known as the Ozone layer.
Peroxyacetyl nitrate (PAN) – is also formed from NOx and VOCs.
5
2.2 Status of Air Quality Of Important Cities /Towns Of Tamil Nadu Table 2.1 Status Of Air Quality Of Important Cities /Towns Of Tamilnadu-Under National Air Quality Monitoring Programme (Namp)
Annual Average Concentration Of Air Pollutants, 2004-2005
SI. No CITY & LOCATION CATEGORY
Annual Average Concentration of Air Pollutants in µg/m3 SO2 NOx TSPM RSPM
Max Min Avg Max Min Avg Max Min Avg Max Min Avg 1 CHENNAI a) Kathivakkam Industrial 44 5 19 60 14 32 273 54 128 135 37 73 b) Manali Industrial 48 7 20 80 14 34 365 77 181 165 40 95 c) Thirvottiyur Mixed 38 6 19 54 12 31 494 56 133 279 36 85 2 COIMBATORE a) DCO Mixed 15 4 7 65 25 39 314 36 134 140 19 53 b) Pooniyarajapuram Residential 18 4 7 86 20 41 423 33 113 361 19 51 c) SIDCO Industrial 29 4 9 90 11 48 552 42 192 159 28 84 3 THOOTHUKUDI a) Raja Agencies Industrial 57 13 20 59 9 17 137 14 62 96 9 39 b) AVM Buildings Mixed 41 13 19 54 9 18 421 19 71 103 14 46 c) Fisheries college Industrial 56 12 19 89 9 18 118 18 60 83 14 38 4 MADURAI
a) Fenner India ltd Building Industrial 55 8 18 54 12 28 277 64 136 44 22 52
b) Kannathur chathiram Mixed 17 5 9 48 11 22 1243 106 355 1038 70 177 c) Highways project Buildings Residential 19 5 9 44 11 30 389 33 109 224 15 51 5 SALEM
Sowdeswari College Building Mixed 10 5 7 77 12 34 173 33 71 89 16 38
Prescribed Standard i)Industrial 80 80 360 120
II)Residential,Rural & other areas(mixed)
60 60 140 60
Source: TNPCB Year book , 2004-2005
6

Table 2.2 Status Of Air Quality Of Important Cities /Towns Of Tamilnadu-Under National Air Quality Monitoring Programme(Namp) Annual Average Concentration Of Air Pollutants,2005-2006
SI.No
CITY & LOCATION
CATEGORY Annual Average Concentration of Air Pollutants in µg/m3 SO2 NOX TSPM RSPM
Max Min Avg Max Min Avg Max Min Avg Max Min Avg 1 CHENNAI a) Kathivakkam Industrial 36 4 13 45 14 25 589 64 221 120 22 71 b) Manali Industrial 42 4 14 57 11 27 577 65 236 188 22 79 c) Thirvottiyur Industrial 45 4 13 46 9 28 651 39 207 142 15 70 2 COIMBATORE a) DCO Mixed 18 4 8 62 21 43 250 27 90 96 14 39 b) Poniyarajapuram Residential 14 4 7 57 19 38 209 30 86 108 10 44 C) SIDCO Industrial 25 4 10 69 31 47 382 45 161 160 25 73 3 THOOTHUKUDI a) Raja Agencies Industrial 43 11 19 71 8 20 252 19 81 232 15 61 b) AVM Buildings Mixed 36 11 19 62 8 20 291 22 105 202 10 83 C) Fisheries college Industrial 31 11 19 71 7 22 220 16 66 209 13 54 4 MADURAI a) Fennar Building Industrial 28 6 17 70 11 29 370 15 117 120 7 37 b)
Kunnathur chatiram Mixed 26 5 10 83 10 28 460 52 208 185 18 57
C) Highways project Buildings
Residential 19 6 9 69 9 27 280 36 110 121 9 37
5 SALEM Sowdeswari College
Building Mixed 11 5 7 69 16 33 122 20 69 82 18 42
Prescribed Standard: i)Industrial 80 80 360 120 II)Residential,Rural
&other areas 60 60 140 60
Source: TNPCB Year book , 2005-2006
7
Table 2.3 Status Of Air Quality Of Important Cities/ Towns Of Tamilnadu Under National Air Quality Monitoring Programme (Namp)
Annual Average Concentration Of Air Pollutants 2006-2007
Sl. No City and Location Category
Annual Average Concentrations of Air Pollutants in µg/m3 SO2 NOx TSPM RSPM
Max Min Avg Max Min Avg Max Min Avg Max Min Avg 1 CHENNAI a) Kathivakkam Industrial 31 4 14 54 11 25 392 40 140 120 27 61 b) Manali Industrial 28 5 14 44 6 25 332 62 151 225 34 81 c) Thiruvottiyur Mixed 25 4 14 41 11 24 240 39 128 155 21 66 2 COIMBATORE a) DCO Mixed 20 4 10 49 15 32 216 19 88 131 16 44 b) Pooniyarajapuram Residential 17 4 9 48 17 32 249 24 87 100 12 44 c) SIDCO Industrial 26 4 11 63 17 40 866 80 230 225 45 102 3 THOOTHUKUDI a) Raja Agencies Industrial 69 7 18 81 5 17 467 30 125 298 20 90 b) AVM Building Mixed 58 9 18 52 5 18 452 34 116 310 25 78 c) Fisheries College Industrial 37 7 17 52 7 17 358 39 90 240 23 63 4 MADURAI a) M/s. Susee Cars & Trucks
(P) Ltd Industrial 24 7 12 57 13 26 190 35 94 96 28 65
b) Avvai Girls Hr.Sec.School Mixed 25 6 10 41 14 23 266 22 103 194 10 34
c) Highways Project Building Residential 24 6 9 40 13 23 226 16 98 95 9 37 5 SALEM a) Sowdeswari College Mixed 11 5 7 69 16 33 122 20 69 82 18 42
Prescribed Standard i) Industrial 80 80 360 120
ii) Residential, Rural & Other Areas (Mixed)
60 60 140 60
Source: TNPCB Year book , 2006-2007
8

Table 2.4 Status Of Air Quality Of Important Cities /Towns Of Tamilnadu-Under National Air Quality Monitoring Programme (Namp), Annual Average Concentration Of Air Pollutants,2008-2009
SI.No CITY & LOCATION CATEGORY
Annual Average Concentration of Air Pollutants in µg/m3 SO2 NOX TSPM RSPM
Max Min Avg Max Min Avg Max Min Avg Max Min Avg 1 CHENNAI a) Kathivakkam Industrial 16 11 13 21 16 19 305 147 196 103 54 78 b) Manali Industrial 18 12 14 25 18 21 252 106 177 150 45 86 c) Thirvottiyur Industrial 15 11 13 22 16 20 293 110 196 168 50 100 2 COIMBATORE a) G.D Matric school Mixed 7 4 5 38 19 30 183 56 107 91 28 59 b) Pooniyarajapuram Residential 7 4 5 44 17 31 156 44 90 80 20 50 C) SIDCO Industrial 8 5 6 49 25 37 332 141 221 193 85 116 3 THOOTHUKUDI a) Raja Agencies Industrial 35 15 27 33 8 19 454 147 281 223 97 166 b) AVM Buildings Mixed 48 22 30 33 10 17 217 115 152 185 79 99 c) SIPCOT Industrial 41 22 30 66 12 19 269 83 130 192 60 86 4 MADURAI a) M/S Susee Cars &
Trucks (p) Ltd., Industrial 12 9 11 26 20 24 116 66 91 67 29 45
b) Awai Girls Higher Secondary School
Mixed 11 8 10 28 21 24 109 41 87 94 27 49
C) Highways project Buildings
Residential 11 9 10 26 21 24 111 64 84 67 29 41
5 SALEM Sowdeswari College Mixed 9 8 9 26 23 25 159 83 118 104 53 79 Prescribed
Standard:
i)Industrial 80 80 360 120 II)Residential,Rural 60 60 140 60 Source: TNPCB Year book , 2008-2009
9

Table 2.5 Status Of Air Quality Of Important Cities /Towns Of Tamilnadu-Under National Air Quality Monitoring Programme (Namp) Annual Average Concentration Of Air Pollutants,2009-2010
SI. NO
CITY & LOCATION CATEGORY
Annual Average Concentration of Air Pollutants in µg/m3 SO2 NOX TSPM RSPM
Max Min Avg Max Min Avg Max Min Avg Max Min Avg 1 CHENNAI a) Kathivakkam Industrial 19 8 12 31 11 19 340 87 181 184 35 78 b) Manali Industrial 22 8 13 27 12 20 375 50 174 223 32 83 c) Thirvottiyur Industrial 26 9 15 38 11 22 706 94 218 406 40 108 2 COIMBATORE a) G.D Matric school Mixed 18 4 5 56 10 23 540 39 121 273 23 60 b) Pooniyarajapuram Residential 16 4 5 50 10 23 236 33 98 153 11 51 C) SIDCO Industrial 29 4 7 60 10 27 955 98 231 216 51 100 3 THOOTHUKUDI a) Raja Agencies Industrial 38 4 15 31 5 12 670 52 254 360 20 135 b) AVM Buildings Mixed 45 4 15 32 5 13 297 24 97 146 12 47 C) SIPCOT Industrial 47 4 17 36 4 11 368 40 138 146 21 70 4 MADURAI
a) M/S Susee Cars & Trucks (p) Ltd., Industrial 15 7 11 34 18 25 129 47 81 70 16 36
b) Awai Girls Higher Secondary School Mixed 19 7 10 32 17 24 267 54 104 136 49 76
C) Highways project Buildings Residential 15 7 10 33 18 25 227 44 97 125 24 46
5 SALEM
Sowdeswari College Building Mixed 14 6 9 41 16 24 267 56 133 167 32 85
Prescribed Standard: i)Industrial 80 80 360 120 II)Residential,Rural 60 60 140 60 Source: TNPCB Year book , 2009-2010
10

Table 2.6 Status Of Air Quality Of Important Cities /Towns Of Tamilnadu-Under National Air Quality Monitoring Programme (Namp) Annual Average Concentration Of Air Pollutants, 2010-2011
S. NO CITY & LOCATION CATEGORY
Annual Average Concentration of Air Pollutants in µg/m3 SO2 NOX TSPM RSPM
Max Min Avg Max Min Avg Max Min Avg Max Min Avg 1 CHENNAI a) Kathivakkam Industrial 36 9 12 32 12 18 353 62 179 219 29 88 b) Manali Industrial 58 9 12 40 12 20 407 46 165 246 38 87 c) Thirvottiyur Industrial 17 8 12 28 12 20 585 77 167 292 30 66 2 COIMBATORE a) G.D Matric school Mixed 49 4 6 46 13 24 506 34 157 250 15 60
b) Pooniyarajapuram Residential 34 4 5 39 9 21 463 21 111 190 10 56 C) SIDCO Industrial 43 4 6 264 12 34 1403 39 273 1184 12 102 3 THOOTHUKUDI a) Raja Agencies Industrial 88 4 12 35 6 14 764 79 310 385 50 178 b) AVM Buildings Mixed 48 4 10 46 7 14 389 23 90 198 13 53 C) SIPCOT Industrial 36 4 12 28 7 12 589 38 156 347 17 88 4 MADURAI a) M/S Susee Cars &
Trucks (p) Ltd., Industrial 19 7 11 42 16 25 166 60 111 82 22 42
b) Awai Girls Higher Secondary School
Mixed 15 7 8 34 15 25 207 25 107 88 25 45
C) Highways project Buildings
Residential 17 5 11 33 12 24 222 52 101 101 23 47
5 SALEM Sowdeswari College
Building Mixed 12 5 9 59 13 24 228 30 111 157 28 74
Prescribed Standard: SO2 NOX TSPM RSPM
i)Industrial 80 80 360 120 II)Residential, Rural & other
areas 60
60 140 60
Source: TNPCB Year book , 2010-2011
11

Table 2.7 Status Of Air Quality Of Important Cities/Towns Of Tamilnadu – Under National Air Quality Monitoring Programme (Namp) Annual Average Concentrations Of Air Pollutants, 2011 – 2012
S.NO City & Location Category Annual Average concentrations of Air Pollutants in µg/m3
SO₂ NO₂ RSPM Max Min Avg Max Min Avg Max Min Avg
1 CHENNAI a) Kathivakkam Industrial 48 10 22 64 13 27 363 39 132 b) Manali Industrial 46 9 20 68 11 26 152 26 70 c) Thirvottiyur Industrial 42 8 20 61 12 27 351 22 88 2 COIMBATORE a) G.D Matric school Mixed 9 4 5 73 13 30 218 19 68 b) Pooniyarajapuram Residential 13 4 5 76 13 29 273 11 68 C) SIDCO Industrial 8 4 5 111 9 35 443 20 205 3 THOOTHUKUDI a) Raja Agencies Industrial 29 4 7 35 9 13 601 51 132 b) AVM Buildings Mixed 48 4 7 46 9 14 215 17 81 C) SIPCOT Industrial 23 4 9 34 9 15 437 26 112 4 MADURAI
a) M/S Susee Cars & Trucks (p) Ltd., Industrial 15 7 10 29 18 23 63 18 44
b) Awai Girls Higher Secondary School Mixed 22 5 11 43 16 24 137 26 46
C) Highways project Buildings Residential 17 6 10 27 16 24 89 28 47
5 SALEM
a) Sowdeswari College Building Mixed 13 6 8 31 13 21 134 28 62
Prescribed Standard: SO2 NOX TSPM RSPM
i)Industrial 80 80 360 120 II)Residential, Rural &other
areas 60 60 140 60
Source: TNPCB Year book , 2011-2012
12

Table 2.8 Chennai Ambient Air Quality Monitoring Programme Status Of Air Quality During April 2004 To March 2005
SI.NO
STATION
ANNUAL AVERAGE CONCENTRATION OF AIR POLLTANTS µg/m3
SO2 NOX RSPM TSPM 1 ANNA NAGAR 6 20 68 158 2 ADYAR 5 14 33 71 3 KILPAUK 7 36 97 308 4 THIYAGARAYANAGAR 8 30 77 197 5 VALLALAR NAGAR 8 33 87 255 Prescribed standard 60 60 60 140
Source: TNPCB Year book , 2004-2005
Table 2.9 Chennai Ambient Air Quality Monitoring Programme Status Of Air Quality During April 2005 To March 2006
SI.NO
STATION
ANNUAL AVERAGE CONCENTRATION OF AIR POLLTANTS µg/m3
SO2 NOX RSPM TSPM 1 ANNA NAGAR 6 26 75 183 2 ADAYAR 5 20 46 102 3 KILPAUK 8 39 92 267 4 THIYAGARAYA NAGAR 8 37 81 209 5 VALLALAR NAGAR 8 36 83 232
PRESCRIBED STANDARDS 60 60 60 140 Source: TNPCB Year book , 2005-2006
13

Table 2.10 Chennai Ambient Air Quality Monitoring Programme Status Of Air Quality Monitoring During 2006-2007
Source: TNPCB Year book , 2006-2007
Table 2.11 Chennai Ambient Air Quality Monitoring Programme Status Of Air Quality During April 2008 To March 2009
SI.No STATION ANNUAL AVERAGE CONCENTRATION OF AIR POLLTANTS, µg/m3
SO2 NOX RSPM TSPM 1 ANNA NAGAR 10 25 121 262 2 ADYAR 7 12 50 97 3 KILPAUK 11 28 98 231 4 THIYAGARAYANAGAR 11 29 129 278 5 VALLALAR NAGAR 12 28 140 359
Prescribed standard 60 60 60 140 Source: TNPCB Year book , 2008-2009
Sl.No. Station Average Concentrations of Air Pollutants, µg/m3 SO2 NOx RSPM TSPM
1 ANNA NAGAR 8 22 63 146 2 ADAYAR 7 17 41 90 3 KILPAUK 9 27 91 211 4 THIYAGARAYANAGAR 10 27 83 218 5 VALLALAR NAGAR 10 33 92 249
Prescribed Standard 60 60 60 140
14

Table 2.12 Chennai Ambient Air Quality Monitoring Programme Status of Air Quality During
April 2009 To March 2010
SI.No
STATION
ANNUAL AVERAGE CONCENTRATION OF AIR POLLTANTS µg/m3
SO2 NOX RSPM TSPM 1 ANNA NAGAR 9 22 92 207 2 ADAYAR 8 16 40 78 3 KILPAUK 10 32 110 240 4 THIYAGARAYA NAGAR 12 30 143 285 5 VALLALAR NAGAR 12 35 136 315
PRESCRIBED STANDARDS 60 60 60 140 Source: TNPCB Year book , 2009-2010
Table 2.13 Chennai Ambient Air Quality Monitoring Programme Status of Air Quality During April 2010 To March 2011
S.NO
STATION
ANNUAL AVERAGE CONCENTRATION OF AIR POLLTANTS µg/m3 SO2 NOX RSPM
1 ANNA NAGAR 8 21 98 2 ADYAR 8 15 34 3 KILPAUK 10 28 91 4 THIYAGARAYANAGAR 11 30 119 5 VALLALAR NAGAR 11 29 135
Prescribed standard 60 60 60 Source: TNPCB Year book , 2010-2011
15

Table 2.14 Chennai Ambient Air Quality Monitoring Programme
Source: TNPCB Year book , 2011-2012
STATION
ANNUAL AVERAGE CONCENTRATION OF AIR
POLLTANTS µg/m3
SO₂ NO₂ RSPM
ANNA NAGAR 9 18 136
ADYAR 8 12 63
KILPAUK 10 20 135
THIYAGARAYANAGAR 11 21 145
VALLALAR NAGAR 11 21 168
Prescribed Standard 50 40 60
16

Table 2.15 Status Report Of Trichy Air Quality Under Trichy Ambient Air Quality
Monitoring Programme (Taaqm) During 2004-2005
Sl.No
Station
Average Concentrations of Air Pollutants, micro gram /m3
SO2 NOX RSPM TSPM
1 Gandhi Market 15 19 90 208
2 Mainguard Gate 15 19 84 197
3 Bishop Heber College 11 15 53 72
4 Golden Rock 12 15 62 87
5 Central Bus Stand , Trichy 15 18 81 180
Prescribed Standard 60 60 60 140
Source: TNPCB Year book , 2004-2005
17

Table 2.16 Status Report Of Trichy Air Quality Under Trichy Ambient Air Quality
Monitoring Programme (Taaqm) During 2005-2006
SI.NO
STATION
AVERAGE CONCENTRATIONS OF AIR POLLUTANTS µg/m3
SO2 NOx RSPM TSPM
1 Gandhi Market 16 19 80 180
2 Mainguard Gate 16 20 83 185
3 Bishop Heber College 11 13 50 70
4 Golden Rock 12 15 58 81
5 Central Bus Stand , Trichy 15 19 71 153
Prescribed Standard 60 60 60 140
Source: TNPCB Year book , 2005-2006
18

Table 2.17 Status Report Of Trichy Air Quality Under Trichy Ambient Air Quality Monitoring Programme (Taaqm) During
2006 - 2007
Sl.No. Station Average Concentrations of Air Pollutants, µg/m3
SO2 NOx RSPM TSPM
1 Gandhi Market 17 23 73 223
2 Mainguard Gate 15 20 77 250
3 Bishop Heber
College 11 17 48 119
4 Golden Rock 11 16 42 108
5 Central Bus Stand,
Trichy 18 23 105 227
Prescribed Standard 60 60 60 140
Source: TNPCB Year book, 2006-2007
19

Table 2.18 Status Report Of Trichy Air Quality Under Trichy Ambient Air Quality
Monitoring Programmr (Taaqm) During 2008-2009
Sl.No
Station
Average Concentrations of Air Pollutants, µg/m3
SO2 NOX RSPM TSPM
1 Gandhi Market 20 25 95 251
2 Mainguard Gate 20 25 80 222
3 Bishop Heber College 10 14 36 73
4 Golden Rock 11 15 39 102
5 Central Bus Stand , Trichy 19 24 103 228
Prescribed Standard 60 60 60 140
Source: TNPCB Year book , 2008-2009
20

Table 2.19 Status Report Of Trichy Air Quality Under Trichy Ambient Air Quality
Monitoring Programme (Taaqm) During 2009-2010
SI.NO
STATION
AVERAGE CONCENTRATIONS OF AIR POLLUTANTS µg/m3
SO2 NOx RSPM TSPM
1 Gandhi Market 16 22 105 220
2 Mainguard Gate 15 22 96 226
3 Bishop Heber College 9 13 38 98
4 Golden Rock 9 14 37 99
5 Central Bus Stand , Trichy 17 24 137 256
Prescribed Standard 60 60 60 140
Source: TNPCB Year book, 2009-2010
21
Table 2.20 Status Report Of Trichy Air Quality Under Trichy Ambient Air Quality
Monitoring Programme (Taaqm) During 2010-2011
S.No
Station Average Concentrations of Air Pollutants, µg/m3
SO2 NOX RSPM TSPM
1 Gandhi Market 14 21 100 223
2 Mainguard Gate 13 19 69 183
3 Bishop Heber College 9 13 36 92
4 Golden Rock 10 15 35 87
5 Central Bus Stand , Trichy 20 22 92 219
Prescribed Standard 60 60 60 140
Source: TNPCB Year book, 2010-2011
22

Table 2.21 Status Report Of Trichy Air Quality Under Trichy Ambient Air Quality
Monitoring Programmr (Taaqm) During 2011 – 2012
S.No
Station
Average Concentration of Air Pollutants, µg/m3
SO₂ NO₂ RSPM
1 Gandhi Market 12 17 92
2 Mainguard Gate 11 17 68
3 Bishop Heber College 9 14 40
4 Golden Rock 10 15 42
5 Central Bus Stand, Trichy 13 19 113
Prescribed Standard 50 40 60
Source: TNPCB Year book , 2011-2012
23
Table 2.22 Status Of Vehicle Tested At Tnpcb Vem Stations During 2004-2005
SI.No
STATION
NO. OF
VEHICLES
TESTED
VEHICLES
WITHIN
THE LIMIT
VEHICLES
EXCEEDED
THE LIMIT
DURING
FIRST TEST
VEHICLES
COMPLIED
EMISSION
STANDARD
AFTER
RECTIFICATION
VEHICLES
NOT
COMPLIED
EMISSION
STANDARD
% OF
VEHICLE
EXCEEDED
THE LIMIT
DURING
FIRST TEST
1
Chennai City
34553
28138
6475
4944
1531
19
2 Udhagamandalam 5247 4275 972 834 138 19
3 Dindigul 2303 2195 108 40 68 5
4 Palani 3783 3204 579 543 36 15
5 Chengalpattu 5454 3637 1817 1606 211 33
6 Katteri 2827 2141 686 610 76 24
Grand Total 54167 43590 10637 8577 2060 20
Source: TNPCB Year book , 2004-2005
24

Table 2.23 Status Of Vehicle Tested At Tnpcb Vem Stations During 2005-2006
SI.NO
STATION
NO. OF
VEHICLES
TESTED
VEHICLES
WITHIN
THE LIMIT
VEHICLES
EXCEEDED
THE LIMIT
DURING
FIRST TEST
VEHICLES
COMPLIED
EMISSION
STANDARD
AFTER
RECTIFICATION
VEHICLES
NOT
COMPLIED
EMISSION
STANDARD
% OF
VEHICLE
EXCEEDED
THE LIMIT
DURING
FIRST TEST
1
Chennai
32,200
29,892 2,308 1,626 682 7.17
2
VEM stations other
than Chennai city
5,147
4,647
500
394
106
9.70
Grand Total
37,347
34,539
2,808
2,020
788
7.52
*The TNPCB VEM stations other than Chennai city denote the stations at Udagamandalam, Katteri, Dindigul, Palani & Chengalpattu. The
above stations were closed with effect from 16.11.2005 and emission check is being carried out by authorized private vehicle emission testing
centres in the above places.
25

Table 2.24 Status Of Vehicle Tested At Tnpcb Vem Station During 2006-2007
Sl.No Station
No. of
Vehicles
tested
Vehicles
within the
limit
Vehicles
exceeded the
limit during
the first test
Vehicles
complied
emission
standard
after
rectification
Vehicles
not
complied
emission
standard
% of vehicle
exceeded the
limit during
the first test
1 Chennai
City 35,370 32,670 2,700 1,943 757 7.63
Table 2.25 Status Of Vehicle Tested At Tnpcb Vem Stations During 2008-2009
Si.No
Station
No. Of
Vehicles Tested
Vehicles
Within The Limit
Vehicles
Exceeded The Limit
During First Test
Vehicles Complied Emission Standard After Rectification
Vehicles Not Complied Emission Standard
% Of Vehicle Exceeded The Limit During
First Test
1
Chennai City
42,206
40,835
4,760
3,389
1371
11.28
26
Table 2.26 Status Of Vehicle Tested At Tnpcb Vem Stations During 2009-2010
Si.No
Station
No. Of
Vehicles
Tested
Vehicles
Within The
Limit
Vehicles
Exceeded The
Limit During
First Test
Vehicles Complied
Emission Standard
After Rectification
Vehicles Not
Complied
Emission
Standard
% Of Vehicle
Exceeded The Limit
During First Test
1
Chennai
22,012
21,504
1,668
1,160
508
7.58%
Table 2.27 Status Of Vehicle Tested At Tnpcb Vem Station During 2010-2011
Sl.No Station
No. of
Vehicles
tested
Vehicles
within
the limit
Vehicles
exceeded the
limit during
the first test
Vehicles complied
emission
standard after
rectification
Vehicles not
complied
emission
standard
% of vehicle
exceeded the limit
during the first test
1 Chennai City 1,142 1,117 27 2 25 2.36 %
All data Sources are from TNPCB Year Books
27

Table 2.28 Ambient Air Quality Monitoring Results of Chennai between 2003 &2012
A. Location: Municipal Kalyanamandapam, Kathivakkam, Chennai
Category -Industrial Area
Year Annual Average Concentration of Air
pollutants, µg/m3 TSPM RSPM NOx SO2
2003-2004 163 90 32 24
2004-2005 128 73 32 19
2005-2006 221 71 25 13
2006-2007 140 61 25 14
2008-2009 196 78 19 13
2009-2010 181 78 19 12
2010-2011 179 88 18 12
2011-2012 NA 132 27 22
Prescribed Standard
Industrial 360 120 80 80
Residential, Rural & Other Areas (Mixed) 140 60 60 60
NAAQS-2009 NA 60 40 50
Figure. 2.1 Graph showing Ambient Air Quality in Kathivakkam Chennai between
2003-2012
28

Figure. 2.2 Graph showing Ambient Air Quality in Manali Chennai between 2003-2012
Table 2.29 Ambient Air Quality Monitoring Results of Chennai between 2003 &2012
B. Govt. Hr. Sec, School, Manali, Chennai
Category -Industrial Area
Year Annual Average Concentration of Air pollutants, µg/m3
TSPM RSPM NOx SO2
2003-2004 214 109 34 22
2004-2005 181 95 34 20
2005-2006 236 79 27 14
2006-2007 151 81 25 14
2008-2009 177 86 21 14
2009-2010 174 83 20 13
2010-2011 165 87 20 12
2011-2012 NA 70 26 20
Prescribed Standard
Industrial 360 120 80 80
Residential, Rural &
Other Areas (Mixed) 140 60 60 60
NAAQS-2009 NA 60 40 50
29

Table 2.30 Ambient Air Quality Monitoring Results of Chennai between 2003 &2012 C. Municipal Office , Thiruvottiyur, Chennai
Category - Mixed Area
Year Annual Average Concentation of Air pollutants, µg/m3 TSPM RSPM NOx SO2
2003-2004 151 95 32 20 2004-2005 133 85 31 19 2005-2006 207 70 28 13 2006-2007 128 66 24 14 2008-2009 196 100 20 13 2009-2010 218 108 22 15 2010-2011 167 66 20 12 2011-2012 NA 88 27 20
Prescribed Standard Industrial 360 120 80 80 Residential, Rural & Other Areas (Mixed)
140 60 60 60
NAAQS-2009 NA 60 40 50
Figure. 2.3 Graph showing Ambient Air Quality in Thiruvottiyur Chennai between 2003-2012
30

Table 2.31 Ambient Air Quality Monitoring Results of Coimbatore between 2003&2012
A. Location: Collectorate Office Building/GD Matric School, Coimbatore
Category -Mixed Area
Year Annual Average Concentration of Air pollutants, µg/m3
TSPM RSPM NOx SO2
2003-2004 108 43 51 10 2004-2005 134 53 39 7 2005-2006 90 39 43 8 2006-2007 88 44 32 10 2008-2009 107 59 30 5 2009-2010 121 60 23 5 2010-2011 157 60 24 6 2011-2012 NA 68 30 5
Prescribed Standard
Industrial 360 120 80 80 Residential, Rural & Other Areas (Mixed) 140 60 60 60
NAAQS-2009 NA 60 40 50
Figure. 2.4 Graph showing Ambient Air Quality in GD, School Coimbatore between 2003-2012
31

Table 2.32 Ambient Air Quality Monitoring Results of Coimbatore between 2003 &2012
B. Location: Ponniyarajapuram, Coimbatore
Category -Residential Area
Year Annual Average Concentration of Air pollutants, µg/m3
TSPM RSPM NOx SO2
2003-2004 111 46 46 10
2004-2005 113 51 41 7
2005-2006 86 44 38 7
2006-2007 87 44 32 9
2008-2009 90 50 31 5
2009-2010 98 51 23 5
2010-2011 111 56 21 5
2011-2012 NA 68 29 5
Prescribed Standard
Industrial 360 120 80 80
Residential, Rural &
Other Areas (Mixed) 140 60 60 60
NAAQS-2009 NA 60 40 50
Figure. 2.5 Graph showing Ambient Air Quality in Ponniyarajapuram Coimbatore between
2003-2012
32

Table 2.33 Ambient Air Quality Monitoring Results of Coimbatore between 2003 &2012
C. Location: SIDCO, Coimbatore
Category -Industrial Area
Year Annual Average Concentration of Air pollutants, µg/m3
TSPM RSPM NOx SO2
2003-2004 151 62 56 13
2004-2005 192 84 48 9
2005-2006 161 73 47 10
2006-2007 230 102 40 11
2008-2009 221 116 37 6
2009-2010 231 100 27 7
2010-2011 273 102 34 6
2011-2012 NA 205 35 5
Prescribed Standard
Industrial 360 120 80 80
Residential, Rural &
Other Areas (Mixed) 140 60 60 60
NAAQS-2009 NA 60 40 50
Figure. 2.6 Graph showing Ambient Air Quality in SIDCO Coimbatore between 2003-2012
33

Table 2.34 Ambient Air Quality Monitoring Results of Thoothukudi between 2003&2012
A. Location: Raja Agencies, Thoothukudi
Category -Industrial Area
Year Annual Average Concentration of Air pollutants, µg/m3
TSPM RSPM NOx SO2
2003-2004 35 29 22 20
2004-2005 62 39 17 20
2005-2006 81 61 20 19
2006-2007 125 90 17 18
2008-2009 281 166 19 27
2009-2010 254 135 12 15
2010-2011 310 178 14 12
2011-2012 NA 132 13 7
Prescribed Standard
Industrial 360 120 80 80
Residential, Rural &
Other Areas (Mixed) 140 60 60 60
NAAQS-2009 NA 60 40 50
Figure. 2.7 Graph showing Ambient Air Quality in Thoothukudi between 2003-2012
34

Table 2.35 Ambient Air Quality Monitoring Results of Thoothukudi between 2003&2012
B. Location: AVM Building, Thoothukudi
Category -Mixed Area
Year Annual Average Concentration of Air pollutants, µg/m3
TSPM RSPM NOx SO2
2003-2004 41 34 20 19
2004-2005 71 46 18 19
2005-2006 105 83 20 19
2006-2007 116 78 18 18
2008-2009 152 99 17 30
2009-2010 97 47 13 15
2010-2011 90 53 14 10
2011-2012 NA 81 14 7
Prescribed Standard
Industrial 360 120 80 80
Residential, Rural & Other
Areas (Mixed) 140 60 60 60
NAAQS-2009 NA 60 40 50
Figure. 2.8 Graph showing Ambient Air Quality in Thoothukudi between 2003-2012
35

Table 2.36 Ambient Air Quality Monitoring Results of Thoothukudi between 2003&2012
C. Location: Fisheries College/ SIPCOT, Thuthookudi
Category -Industrial Area
Year Annual Average Concentration of Air pollutants, µg/m3
TSPM RSPM NOx SO2
2003-2004 38 30 19 20
2004-2005 60 38 18 19
2005-2006 66 54 22 19
2006-2007 90 63 17 17
2008-2009 130 86 19 30
2009-2010 138 70 11 17
2010-2011 156 88 12 12
2011-2012 NA 112 15 9
Prescribed Standard
Industrial 360 120 80 80
Residential, Rural
& Other Areas
(Mixed)
140 60 60 60
NAAQS-2009 NA 60 40 50
Figure. 2.9 Graph showing Ambient Air Quality in SIPCOT Thoothukudi between 2003-2012
36

Table 2.37 Ambient Air Quality Monitoring Results of Madurai between 2003&2012
A. Location: Fennar Ltd, M/s. Susee cars & Trucks (p)Ltd., Madurai
Category -Industrial Area
Year Annual Average Concentration of Air pollutants, µg/m3
TSPM RSPM NOx SO2
2003-2004 163 72 29 22
2004-2005 136 52 28 18
2005-2006 117 37 29 17
2006-2007 94 65 26 12
2008-2009 91 45 24 11
2009-2010 81 36 25 11
2010-2011 111 42 25 11
2011-2012 NA 44 23 10
Prescribed Standard
Industrial 360 120 80 80
Residential, Rural & Other Areas
(Mixed) 140 60 60 60
NAAQS-2009 NA 60 40 50
Figure. 2.10 Graph showing Ambient Air Quality in Madurai between 2003-2012
37

Table 2.38 Ambient Air Quality Monitoring Results of Madurai between 2003&2012
B. Location: Kunnathur Chatram/Avvai Girls Hr.Sec.school Madurai
Category -Mixed Area
Year Annual Average Concentration of Air pollutants, µg/m3
TSPM RSPM NOx SO2
2003-2004 416 154 31 9
2004-2005 355 177 22 9
2005-2006 208 57 28 10
2006-2007 103 34 23 10
2008-2009 87 49 24 10
2009-2010 104 76 24 10
2010-2011 107 45 25 8
2011-2012 NA 46 24 11
Prescribed Standard
Industrial 360 120 80 80
Residential, Rural &
Other Areas (Mixed) 140 60 60 60
NAAQS-2009 NA 60 40 50
Figure. 2.11 Graph showing Ambient Air Quality in Kunnathur Chatram Madurai between
2003-2012
38
Table 2.39 Ambient Air Quality Monitoring Results of Madurai between 2003&2012
C. Location: Highway Project Building, Madurai
Category -Residential Area
Year Annual Average Concentration of Air pollutants, µg/m3
TSPM RSPM NOx SO2
2003-2004 135 60 25 8
2004-2005 109 51 20 9
2005-2006 110 37 27 9
2006-2007 98 37 23 9
2008-2009 84 41 24 10
2009-2010 97 46 25 10
2010-2011 101 47 24 11
2011-2012 NA 47 24 10
Prescribed Standard
Industrial 360 120 80 80
Residential, Rural &
Other Areas (Mixed) 140 60 60 60
NAAQS-2009 NA 60 40 50
Figure. 2.12 Graph showing Ambient Air Quality in Highway Project Building -Madurai
between 2003-2012
39

Table 2.40 Ambient Air Quality Monitoring Results of Salem between 2003&2012
A. Location: Sowdeswari College Building , Salem
Category -Mixed Area
Year Annual Average Concentration of Air pollutants, µg/m3
TSPM RSPM NOx SO2
2003-2004 66 28 37 8
2004-2005 71 38 34 7
2005-2006 69 42 33 7
2006-2007 69 42 33 7
2008-2009 118 79 25 9
2009-2010 133 85 24 9
2010-2011 111 74 24 9
2011-2012 NA 62 21 8
Prescribed Standard
Industrial 360 120 80 80
Residential, Rural &
Other Areas (Mixed) 140 60 60 60
NAAQS-2009 NA 60 40 50
Figure. 2.13 Graph showing Ambient Air Quality in Salem between 2003-2012
From the above data it is clearly seen that levels of RSPM and TSPM are found to be high across all
industrial and urban areas in Tamil Nadu.
40

2.3 Status of Number of Vehicles in Tamil Nadu Table 2.41 Number of vehicles in Tamil Nadu - 2013
District wise Number of Commercial Vehicles As On 01.4.2013
Sl.No. Name Of The District
Stage Carriages Mini
Buses Autorick-
Shaws
Ordi-Nary Taxi
Motor Cabs Maxi Cabs Omni Buses Psv
Public Private Sp Aip Sp Aip Sp Aip 1 2 3 4 5 6 7 8 9 10 11 12 13 14 1 Chennai 6546 6 0 70675 531 21560 7550 16023 3484 189 57 3474 2 Kancheepuram 659 177 112 3741 0 2189 148 4670 38 66 0 2950 3 Tiruvallore 182 108 62 5927 0 2872 832 2958 752 11 0 569 4 Vellore 599 615 98 14095 132 862 539 1337 126 0 2 478 5 Tiruvannamalai 271 331 157 2581 2 1309 372 661 65 0 5 66 6 Cuddalore 401 345 122 4011 8 2876 113 1802 10 0 0 54 7 Villupuram 755 303 172 8030 23 3428 124 1473 68 5 0 27 8 Salem 855 501 215 5955 5 2281 161 1894 16 88 9 162 9 Namakkal 266 518 203 821 0 1948 45 930 8 42 0 329
10 Dharmapuri 394 314 55 1767 0 557 63 434 18 1 0 18 11 Krishnagiri 494 143 48 3084 0 290 488 414 55 3 0 157 12 Trichy 769 465 204 9791 1895 4180 186 2288 83 63 9 178 13 Karur 116 167 117 1216 0 537 12 442 6 4 0 156 14 Perambalur 67 72 98 522 0 604 10 353 1 0 0 16 15 Ariyalur 125 31 34 209 0 520 4 323 0 0 0 11 16 Thanjavur 601 226 167 5677 12 2651 157 1484 131 52 21 22 17 Nagapattinam 170 162 189 4185 0 1983 22 1023 146 16 0 15 18 Tiruvarur 180 96 84 1525 0 1490 14 629 13 0 0 2 19 Pudukkottai 357 189 49 1483 61 1245 0 869 0 0 5 31 20 Erode 463 512 155 2780 0 3164 127 1366 15 4 4 341 21 Coimbatore 1203 448 161 10782 69 11629 155 3746 9 43 41 658 22 Udhagamandalam 423 0 118 2967 838 1781 462 710 37 0 2 54 23 Tiruppur 513 306 87 1733 15 1956 18 1285 5 17 0 779 24 Madurai 1184 240 274 13252 0 4117 142 3133 65 27 2 271 25 Dindigul 519 376 102 4848 32 2438 21 1457 16 18 0 181 26 Theni 258 103 109 5750 0 1193 65 1391 30 34 0 160 27 Virudhunagar 339 268 149 3345 0 1690 15 1413 8 11 0 1165 28 Sivagangai 285 170 58 2373 2 1647 4 784 0 5 0 52 29 Ramanathapuram 337 106 60 5134 8 1090 13 1578 2 0 0 14 30 Tuticorin 330 189 166 3904 68 2357 6 1517 1 44 6 307 31 Tirunelveli 556 292 267 10072 25 4556 13 3333 0 7 0 391 32 Kanniyakumari 684 78 233 6094 25 1887 0 1963 0 0 0 130
State Total 22053
8060 4125 218329 3751 92887 11881 63683 5208 750 163 13218
Chennai -City 6546 6 0 70675 531 21560 7550 16023 3484 189 57 3474
Source : Transport Department, Govt. of Tamil Nadu
41

Table 2.42 Number of vehicles in Tamil Nadu - 2003 DISTRICTWISE NUMBER OF COMMERCIAL VEHICLES AS ON 01.04.2003
SL.
Name of the
Stage Carriages
Mini Buses
Auto Rick-
Ordi Nary
Motor Maxi cabs Omni Buses
Private Service
Sch- Ool
Ambu- Lance
Fire Figh-
Light Commercial
Lorri- Ies
Arti- Culated
National Permit
Trac- Tors &
Total Trans- Cabs Cabs
NO. District Pub- Pri- Saws Taxi Sp Aip Sp Aip Sp Aip Vehicle Bus Ter Vehicle Vehicle Lorri- Articulated Trai- Port Lic Vate Ies Vehicle Lers Vehicles
1 2 3 4 5 6 7 8 9 10 11 12 13 14 15 16 17 18 19 20 21 22 23 24
1 Chennai 3673 0 0 39782 222 5162 2400 3828 191 138 66 690 740 645 64 7156 16334 988 2939 649 660 86327
2 Kancheepuram 765 157 84 8145 41 1622 659 1272 32 5 3 232 387 85 30 2076 3912 73 329 7 1761 21677
3 Tiruvallore 80 108 59 2961 0 496 80 1154 47 0 0 36 118 35 4 935 4292 68 490 12 385 11360
4 Vellore 554 413 87 5943 27 230 78 585 14 3 4 176 60 43 20 269 5810 124 1767 14 1230 17451
5 Tiruvannamalai 176 280 150 1744 0 44 62 294 16 1 2 33 17 42 10 491 1979 98 385 0 344 6168
6 Cuddalore 336 291 115 3027 32 1787 37 1186 23 4 1 52 37 67 25 146 2816 488 614 3 1572 12659
7 Villupuram 586 293 156 1650 14 906 25 738 14 8 0 137 50 49 66 297 2903 334 638 2 1426 10292
8 Salem 470 416 166 3606 2 1252 41 834 40 19 16 109 213 68 33 4269 4622 298 2401 33 1523 20431 9 Namakkal 248 252 209 401 1 585 41 405 9 6 2 82 108 47 8 1836 5735 2479 6082 573 2042 21151
10 Dharmapuri 662 212 131 3169 0 213 39 312 10 1 0 120 275 58 19 1364 3438 94 573 50 870 11610 11 Trichy 507 362 192 4739 17 2570 28 1126 24 30 20 65 131 91 30 2775 4777 479 826 124 1353 20266 12 Karur 111 263 130 807 0 272 25 163 6 8 2 24 15 48 7 1211 2045 169 599 53 863 6821 13 Perambalur 170 97 147 363 0 441 5 300 8 3 0 34 49 17 1 119 920 17 161 10 1000 3862 14 Thanjavur 387 243 203 2900 6 1371 67 982 15 2 2 61 19 37 16 958 2499 117 102 0 1452 11439 15 Nagapattinam 195 88 150 1597 4 1795 66 774 25 5 0 24 42 21 10 281 1196 121 169 12 1466 8041 16 Tiruvarur 170 82 103 1165 0 1293 2 452 7 0 0 3 7 4 1 389 812 6 25 26 344 4891 17 Pudukkottai 309 159 49 1155 2 999 38 822 3 11 0 28 46 65 19 458 2362 100 128 2 545 7300 18 Erode 530 423 168 2642 7 1283 86 823 9 5 5 126 169 86 46 3280 7637 1252 1613 3 2376 22569 19 Coimbatore 1255 580 215 8407 41 2872 314 1672 84 15 8 518 785 207 93 7155 12663 1014 2071 7 2814 42790
20 Udhagamandalam 359 0 98 1837 88 564 82 393 36 2 1 45 85 88 12 428 653 160 236 0 427 5594 21 Madurai 817 196 238 6190 0 1448 115 1411 29 33 6 111 320 114 63 2253 3906 160 459 0 1523 19392 22 Dindigul 321 301 132 2459 24 1019 52 668 3 5 1 73 228 45 12 510 3184 107 384 0 1363 10891
23 Theni 242 73 90 961 0 257 56 665 14 8 2 94 87 44 10 303 1487 290 432 0 875 5990
24 Virudhunagar 348 179 134 1206 3 637 38 1032 11 4 2 195 205 107 23 1748 2277 106 482 0 874 9611
25 Sivagangai 258 130 59 1089 17 696 39 528 6 3 0 34 140 42 6 673 1301 430 34 0 498 5983
26 Ramanathapuram 295 65 46 2002 0 647 21 401 3 0 0 32 30 49 6 537 563 101 70 0 669 5537
27 Tuticorin 316 171 172 1835 66 1244 59 1146 17 3 0 204 103 104 28 1219 2774 95 329 290 764 10939
28 Tirunelveli 445 308 184 4341 179 2111 110 2778 43 7 4 89 262 156 39 3175 5076 193 205 11 2099 21815
29 Kanniyakumari 677 0 236 3596 121 1547 48 1266 65 0 0 53 195 92 34 1928 2171 77 196 6 928 13236 State -total 16414 6345 3903 119719 914 35363 4713 28010 804 329 147 3480 4923 2556 735 48239 110144 10038 24739 1887 34046 457448
Chennai city 3673 0 0 39782 222 5162 2400 3828 191 138 66 690 740 645 64 7156 16334 988 2939 649 660 86327 Source : Transport Department , Govt. of Tamil Nadu
42

Table 2.43 Number of Vehicles in the State during 2003 and 2013
Year Name
Of The District
Stage Carriages Mini Buses
Autorick-Shaws
Ordi-Nary Taxi
Motor Cabs Maxi Cabs Omni Buses PSV
Public Private SP AIP SP AIP SP AIP
2003 State - Total
16414 6345 3903 119719 914 35363 4713 28010 804 329 147 3480
2013 22053 8060 4125 218329 3751 92887 11881 63683 5208 750 163 13218 Source : Transport Department , Govt. of Tamil Nadu
Table 2.44 Number of Vehicles in the Chennai during 2003 and 2013
Year Name
Of The District
Stage Carriages Mini Buses
Autorick-Shaws
Ordi-Nary Taxi
Motor Cabs Maxi Cabs Omni Buses PSV
Public Private SP AIP SP AIP SP AIP
2003 State - Total
3673 0 0 39782 222 5162 2400 3828 191 138 66 690
2013 6546 6 0 70675 531 21560 7550 16023 3484 189 57 3474 Source: Transport Department, Govt. of Tamil Nadu
The number of Vehicles has a direct indication on the Air pollution in the State. Urban
areas like Chennai City have high levels of air pollution especially levels of CO and So2, due to
the high number of vehicles. Further improper combustion of fuels and bad maintenance of
vehicles add to the Pollution from vehicles. Frequent Checking is needed across the state to keep
a check on the emissions from vehicles.
2.4 Action Taken to Prevent Air Pollution in Tamil Nadu
(a) Industrial Pollution
The salient features of actions taken to control industrial pollution are as follows:
No new polluting units are permitted within the city.
No new incinerators are permitted within the city, old incinerators being phased out.
Common facilities are set up outside the city for incineration of Bio-medical Waste.
The industries have been directed to develop a green belt of minimum 33% of the project
area; Green belt is also being developed by industries on road sides as avenue plantations.
Renewal of the consent is based on compliance with this condition.
Periodic inspection of industrial units is to be fitted with online stack monitor connected to
the pollution control board – CARE Air centre.
43

(b) Vehicular Pollution
The salient features of action taken to control vehicular pollution are as follows:
Bharat Stage –II norms have been implemented for the registration of new passenger car from
1-7-2011.
Emission norms for in-use vehicles in consultation with MoRTH & MoEF have been
implemented in Chennai city for all vehicles from 1-1-1997.
Catalytic Converter fitted passenger car have been registered since, 1997.
Periodic inspection of in use vehicles in Chennai is conducted by the officials of transport
Department and Police Department.
Supply of Unleaded petrol from February 2000.
In Chennai City Low sulphur diesel (0.05%) is supplied since 1-7-2001.
Supply of Pre-mixed 2T oil since 1-4-2002
Entry of heavy vehicles is restricted by the road in Chennai city during peak hours.
Ring Road have been constructed to avoid the entry of intercity vehicles in the city.
Mass transport system ( metro Rail ) from Beach to Velachery is completed.
Fiscal Measures like structuring parking fees and road tolls has been implemented.
44

3. Conclusion
Data collected from various organizations and Departments of Government of Tamil Nadu,
reveals that there is pollution in the environment in various districts of the State.
Population explosion, urbanization and Industrialization in the recent past has led to complex
Environmental Pollution in Tamil Nadu. It was our belief that utilization of control equipment,
establishment of Effluent treatment plants, Sewage Treatment Plants are enough to control
emissions and for safe discharge of effluent into receptors like rivers, lakes, streams etc. But the
real solution lies in avoiding the sources of pollution by adopting measures like resource recovery
and cleaner technological processes for effective way of tackling the Environmental issues and
problems. Process development to use less polluting raw materials is a long term preventive
action. Recovery of Chromium from Tannery Effluent is a classic example of resource
conservation.
Due to the compulsion on alternative energy sources, industries which produce hot waste
gases have opted for the generation of power. This resulted in reducing the usage of coal and
greenhouse gases.
Replacing hazardous substances with eco-friendly substances will not only reduce the
pollution load, but also reduce the consumption of raw materials .
Environmental concerns due to generation of large quantity of municipal solid wastes,
hazardous wastes, E-wastes, Bio-medical Wastes, Plastic Wastes from residential units,
industries, institutions, Health care facilities, commercial establishments and service providers are
posing Environmental pollution to a larger extent affecting land , water , air and the environment
which leads to degradation of resources and loss of ecosystem depriving cleaner environment for
future generation .
Sewage collection, treatment and solid waste management remains extensively unsolved in
major cities and towns.
Transport is another sector that contributes to air pollution, especially in urban areas. A good
action plan must be developed for traffic management in urban areas as the levels of pollution in
the ambient air due to traffic is increasing at an alarming rate.
Many issues of environmental concern can be solved by making all stake holders to
understand the problems in greater depth, so that it is possible to find appropriate solutions.
45

Industries, waste processors, communities, NGO’s and all other stake holders must
contribute their might to solve Environmental problems in addition to Government and regulatory
Authorities.
Whether, it is pollution from Industry or local body or transport activity, it is the basic
knowledge of the stake holders in the field of the latest legislations, technology, standards and all
connected issues which will help for effective implementation of the Environment protection
programmes.
46
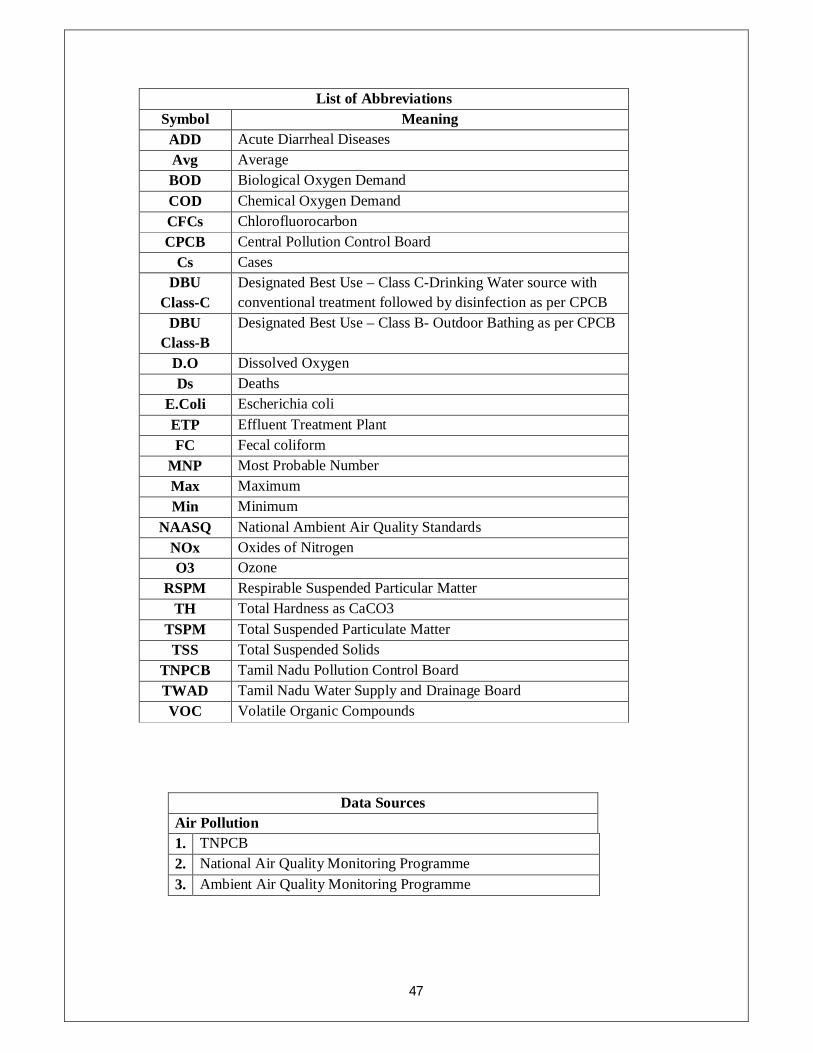
Data Sources Air Pollution 1. TNPCB 2. National Air Quality Monitoring Programme 3. Ambient Air Quality Monitoring Programme
List of Abbreviations Symbol Meaning
ADD Acute Diarrheal Diseases Avg Average BOD Biological Oxygen Demand COD Chemical Oxygen Demand CFCs Chlorofluorocarbon CPCB Central Pollution Control Board
Cs Cases DBU
Class-C Designated Best Use – Class C-Drinking Water source with conventional treatment followed by disinfection as per CPCB
DBU Class-B
Designated Best Use – Class B- Outdoor Bathing as per CPCB
D.O Dissolved Oxygen Ds Deaths
E.Coli Escherichia coli ETP Effluent Treatment Plant FC Fecal coliform
MNP Most Probable Number Max Maximum Min Minimum
NAASQ National Ambient Air Quality Standards NOx Oxides of Nitrogen O3 Ozone
RSPM Respirable Suspended Particular Matter TH Total Hardness as CaCO3
TSPM Total Suspended Particulate Matter TSS Total Suspended Solids
TNPCB Tamil Nadu Pollution Control Board TWAD Tamil Nadu Water Supply and Drainage Board VOC Volatile Organic Compounds
47