table of contents - astdd | homepage · web viewnalliah et al., in analyzing 2006 neds data, found...
TRANSCRIPT

Methods in Assessing Non-Traumatic Dental Care in Emergency Departments
Prepared by: Association of State and Territorial Dental Directors
Primary Author: Michael C. Manz, DDS, MPH, DrPH, ASTDD Surveillance Consultant
Work Group:Junhie Oh, BDS, MPH, Oral Health Epidemiologist/Evaluator, Rhode Island Department of Health and
Chair, ASTDD Data Committee Kathy Phipps, DrPH, ASTDD Data and Oral Health Surveillance CoordinatorKrishna Aravamudhan, BDS, MS, Director, Council on Dental Benefit Programs, ADA Practice Institute Eli Schwarz, DDS, MPH, PhD, FHKAM, FCDSHK, FACD, FRACDS, Professor and Chair, Department of
Community Dentistry, Oregon Health and Science University Donna Carden, MD, FACEP, Professor, Department of Emergency Medicine, College of Medicine,
University of Florida, GainesvilleMary Foley, MPH, Executive Director, Medicare/Medicaid/CHIP Services Dental Association Rich Manski, DDS, MBA, PhD, Professor and Chief, Dental Public Health, University of Maryland School of
Dentistry Scott L. Tomar, DMD, MPH, DrPH, Professor & Chair, Department of Community Dentistry & Behavioral
Science, University of Florida College of Dentistry
Supported by: DentaQuest Foundation
Acknowledgments: Beverly Isman, RDH, MPH, ELS and Christine Wood, BS for their careful review and editing.
ASTDD, 3858 Cashill Blvd., Reno, NV 89509
Approved 01/12/2016

Table of ContentsExecutive Summary...............................................................................................................................................................................................3
Introduction...............................................................................................................................................................................................6
ASTDD ED Project and Purpose of this Report...............................................................................................................................................................................................6
Research Methods...............................................................................................................................................................................................8
Research Questions: Target Populations/Outcomes of Interest/Predictor Variables...............................................................................................................................................................................................9
Target Populations...............................................................................................................................................................................................9
International Studies...............................................................................................................................................................................................9
US National Perspective...............................................................................................................................................................................................10
State Perspective...............................................................................................................................................................................................12
Local and Other Subpopulation Perspective...............................................................................................................................................................................................14
1
Target Population Defined by Patient Care Processes or Outcomes...............................................................................................................................................................................................15
Outcomes of Interest...............................................................................................................................................................................................16
General Dental Access and ED Utilization...............................................................................................................................................................................................16
ED Utilization for Dental Care and NTDC Care—Rates and Factors Affecting Rates...............................................................................................................................................................................................17
Other Outcomes Related to ED Utilization for Dental Care...............................................................................................................................................................................................19
Care Related Outcomes...............................................................................................................................................................................................20
Trends or Changes in Dental ED Utilization...............................................................................................................................................................................................21
Predictive Factors...............................................................................................................................................................................................22
Demographics and Other Patient Factors...............................................................................................................................................................................................22
Access Issues/Policy Changes...............................................................................................................................................................................................25
Drug Seeking Behavior...............................................................................................................................................................................................28
2
Data Sources/Available Data Elements/Diagnosis-Procedure Codes Studied...............................................................................................................................................................................................29
Data Sets/Sources and Available Data Elements...............................................................................................................................................................................................29
National Datasets...............................................................................................................................................................................................29
State Level Data/Sources...............................................................................................................................................................................................30
Local Level Data/Sources...............................................................................................................................................................................................31
Diagnosis-Procedure Codes Investigated...............................................................................................................................................................................................32
Positive Aspects of Research Data and Methodology...............................................................................................................................................................................................34
Problematic Aspects of Research Data and Methodology...............................................................................................................................................................................................34
Summary and Conclusions...............................................................................................................................................................................................36
Recommendations...............................................................................................................................................................................................36
General Recommendations...............................................................................................................................................................................................36
3

Recommendations Specific to States...............................................................................................................................................................................................37
References...............................................................................................................................................................................................37
Appendices (separate file)...............................................................................................................................................................................................43
Appendix 1. The National Emergency Department Sample...............................................................................................................................................................................................43
Appendix 2. Medical Expenditure Panel Survey...............................................................................................................................................................................................45
Appendix 3. National Hospital Ambulatory Medical Care Survey...............................................................................................................................................................................................48
Appendix 4. State Emergency Department Databases (SEDD)...............................................................................................................................................................................................49
Appendix 5. Oral/Dental Related ICD 9 Codes...............................................................................................................................................................................................52
4
Executive Summary
Background
Access to dental care continues as a major topic of interest among health organizations, state departments of health, state oral health programs, and the public. This includes the use of hospital emergency departments (EDs) for dental care. Though some ED usage for dental care due to oral trauma can be expected, particularly for oral trauma occurring during non-business hours and over weekends when many primary dental care offices and clinics are not open, a large proportion of oral problems presenting at EDs are not a result of trauma. These non-traumatic dental conditions (NTDCs) can be treated more effectively, or prevented altogether, through regular dental care in a primary dental care setting. Many investigators are exploring potential cost savings and improvements in quality of life through interventions designed to prevent or divert people from using EDs for oral problems, especially for NTDCs.
As with most public health problems, the first steps in addressing the issue are to confirm its existence and quantify its extent. Problems arise, however, when datasets and methods vary, resulting in a muddied picture of the problem’s extent, distribution, and causal or predictive factors.
Purpose of the Report
The DentaQuest Foundation funded the Association of State and Territorial Dental Directors from December 1, 2014 through November 30, 2015 to search the scientific literature and online sources for reports on the use of EDs for dental care. The intended purpose of this project is to fully explore the extent of variation in the different aspects of research conducted, including target populations, outcomes of interest, predictive factors investigated, data sources used, and specific research methods employed including the diagnostic codes used in defining ED dental care. This report presents the findings of the investigation, summarizes the positive and negative aspects of the findings, and provides recommendations on the conduct of future research. Specifically, standardization of methodology, to the extent possible, is recommended to provide for consistency in data collection, analysis, and reporting, and to aid in the collection of data for state and national surveillance of ED dental care. Standardized surveillance of the use of EDs for NTDCs would support national tracking and provide states with actionable data to plan and implement effective interventions.
Research Methods
Information on ED dental care investigations was gathered and thoroughly evaluated. Searches of the scientific literature in published scientific journals and posted internet reports focusing on government or organization websites was conducted. The scientific literature search involved multiple searches in PubMed using different combinations of terms to discover studies related to different aspects of dental
5

care provided in emergency settings. An ongoing search was also established through an account with “My NCBI,” the National Center for Biotechnology Information (NCBI) at the US National Library of Medicine (NLM). This provided a comprehensive listing of the most recent publications through October, 2015.
The search for online publications involved Google searching. The searches included both general and more specific search code, with more specific searches limited to online posting on government and organization websites, filtering out general opinion and other non-scientific postings on the subject.
The resulting collection of studies from these searches was then systematically reviewed to determine the specific population and research design aspects for each study. Findings were summarized and methods compared to explore similarities and differences. Findings were evaluated to form conclusions and recommendations for future research and investigation.
Summary of Findings
1. Investigations varied widely in terms of target populations of interest. Target populations ranged from national, state, and local levels down to a single hospital or ED. Some target populations were further defined by limiting the study population to those with specific demographic or other characteristics, or by specific aspects of patient care processes or outcomes.
2. Investigation outcomes of interest varied widely, including general access to dental care and ED use, counts and rates of ED general dental and NTDC usage, rates of ED return visits, rates of hospital admission for dental conditions, and trends or changes in rates of ED utilization for dental care.
3. Predictive factors investigated varied widely. Though some basic demographic and insurance status predictors were commonly investigated, other factors included urban/rural status and other environmental factors, psychological factors, other concurrent conditions, and changes in insurance coverage or policy (e.g., adult Medicaid coverage).
4. Data sources for investigations varied widely, though some national and state data systems were commonly used. Some studies (e.g., local hospital studies) used different sources of data but had similar variable content in the datasets.
5. Specific sets of diagnosis codes used to define dental care, or more specifically, NTDCs, varied. Few investigators used exactly the same sets of codes. Some investigators used similar codes with slight variations, while other investigators used very different sets of codes to define the same dental care category (e.g., NTDCs).
6. While there have been many investigations of the use of EDs for dental care that explored different aspects of the issue, the variation in studies and the methods employed have resulted in inconsistent data that often are not comparable. This does not allow for effective standardized surveillance of ED dental care at the state and local levels.
7. Standardized research protocols, including data collection, analysis and reporting methods need to be developed and promoted, particularly at the state level, to ensure reliable comparable data sufficient for tracking and comparing state trends.
6

Recommendations Summary
Specifically define study populations of interest, assess usability of data sources, and follow good investigation protocol in assessing ED dental care and planning interventions.
Develop sets of codes and analysis methods, including important predictive factors that will most appropriately answer research questions with the underlying motivation of standardizing methods to the extent possible to allow for comparison to other studies on other populations.
Encourage specific research on ED use for NTDCs, which includes the majority of unnecessary visits and costs and could most effectively be addressed in the primary dental care setting.
Develop and promote standardized sets of codes and analysis methods providing appropriate basic ED dental use data for state oral health surveillance systems and for state data submission to a national data repository for tracking national ED dental care, allowing for comparability across states. Additional optional data analyses can be conducted by states as desired.
7

Introduction
There is increasing attention given to the use of hospital emergency departments (EDs) for oral problems, when care could more appropriately and less expensively be provided in primary dental care settings. Many investigators and organizations have reported the numerous concerns associated with this phenomenon.(1-4) The primary concern is that EDs generally provide only palliative care for oral problems (e.g., antibiotics and pain medication). Interestingly, Cohen et al., in a focus group study of Maryland low income white, black and Hispanic adults, found that toothache pain was the most common dental reason for visits to physicians or EDs, and financial constraints were most commonly cited as the reason for not seeking care from dentists. Of particular note is that participants in this study were aware that they were likely to only get prescriptions and would need to seek follow-up care with a dentist.(5) While there has been some attention to the potentially increasing role of non-dental professionals in providing dental care to certain population groups such as low-income and minority populations(6), currently dental care in EDs primarily addresses symptoms. ED care that only addresses symptoms, without definitive care to alleviate the cause of oral problems, results in patients often returning to EDs multiple times for the same problem. ED visits, especially when repeated for the same problem, generate high costs to patients, insurance companies, and taxpayers, depending on the patients’ means to pay.
Many investigators have assessed data on the use of emergency departments for oral problems, and more specifically, non-traumatic dental conditions (NTDCs) at the local, state, and national levels. Particularly at the state level, the general thinking is that if states were to adopt policies that support increased access to dental care in dental offices or clinics, there would be significant cost savings and better oral health outcomes. Though many states have started to look at data on dental related ED visits, there currently is no standardized protocol for collection and analysis of these data. Therefore, data interpretation and comparability of data between studies are in question.
Concerns related to lack of data comparability with past reports include the different sources of the data, the content of the data used, the way the data were analyzed, and the way the data were reported. The lack of comparability between reports can cause frustration. This lack of standardization impacts the ability of local, state, and national policy makers to make informed decisions that address the economic and quality of life impact of the use of EDs for NTDCs. Development of a standardized protocol for the collection, analysis, and reporting of ED data will allow local, state and national policy makers to make informed policy decisions that will result in more efficient use of scarce resources and promote better quality of life for individuals with improved access to “dental homes.”
8

ASTDD ED Project and Purpose of this Report
The Association of State and Territorial Dental Directors (ASTDD) was funded by the DentaQuest Foundation in 2015 to conduct a project with two branches. One branch is development of this report, which focuses on a literature review that informs ED data collection, analysis and reporting. This review analyzes and summarizes the methodological similarities and differences around ED data including the quality, strengths and shortcomings of existing reports, and then presents recommendations to inform future data collection and analysis efforts. The second branch is researching and producing a Best Practice Approach Report that describes policies and programs that can be implemented at the local, state and national level to create systems to refer consumers to primary dental care settings where they can obtain definitive, cost-effective care instead of accessing EDs for NTDCs. The report includes examples of successful policies and strategies that have resulted in decreased use of EDs for oral problems.
This report will also provide guidance for a future phase of the project. In partnership with organizations such as the Council of State and Territorial Epidemiologist (CSTE), the American Dental Association (ADA), and the Centers for Medicare and Medicaid Services (CMS), ASTDD will form an advisory committee and workgroup to develop a standardized protocol and guidelines for the collection, analysis and reporting of ED data for possible inclusion in national data sets such as the National Oral Health Surveillance System (NOHSS).
A summary report will be developed that describes dental care in EDs, summarizes the findings from the literature review, introduces the newly developed data collection, analysis, and reporting protocol and guidelines, discusses policy implications, and includes examples of successful state and local strategies. All three reports will be widely disseminated. ASTDD also will provide technical assistance to states for implementing the standardized ED data methods protocol and disseminating findings from their data collection. Advocates can then use the data to “make the case” for policy changes such as establishment of comprehensive adult Medicaid benefits and creation of ED diversion programs that will result in a reduction in dental related ED visits and better dental care and oral health outcomes for consumers.
To inform planning and research questions for this project, ASTDD convened conference calls with state oral health program directors, stakeholder organizations and individuals with an interest in the topic. Participants included the Centers for Disease Control and Prevention (CDC), Medicare Medicaid CHIP Services Dental Association, PEW Center on the States, Dental Quality Alliance, American Dental Association, state oral health program directors, and researchers studying ED dental care. Current surveillance and research activity on ED dental care and shortcomings of these activities and available data were discussed. There was agreement on the need for standardization of methods contributing to best practices development for surveillance and intervention.
This project addresses two DentaQuest Oral Health 2020 goals: 1) “Comprehensive national oral health measurement system” (target is “A comprehensive national and state oral health measurement system is in place.”) and 2) “Mandatory inclusion of an adult dental benefit in publicly funded health insurance” (target is “By 2020, at least 30 states have a comprehensive Medicaid adult dental benefit and no states
9

that currently have a Medicaid adult dental benefit roll back or eliminate that coverage.”) It also addresses Health People 2020 Objective OH-16, “Increase the number of states and the District of Columbia that have an oral and craniofacial health surveillance system,” as part of surveillance of the dental care system would involve monitoring of ED visits for oral problems.
Research Methods
The project involved identifying, evaluating and summarizing ED dental care studies. Searches included scientific literature in published scientific journals and reports on the internet that may have been posted on government or organization websites but not submitted for publication in scientific journals. The scientific literature search involved multiple searches in PubMed using different combinations of terms. The most expansive search was specified as follows:
("dental care"[mh] OR "dental"[tiab] OR "dentistry"[tiab]) AND ("emergency service, hospital"[mh] OR "emergency room"[tiab] OR "emergency department"[tiab] OR "emergency departments"[tiab] OR "emergency ward"[tiab] OR "emergency wards"[tiab] OR "emergency unit"[tiab] OR "emergency units"[tiab] OR "emergency service"[tiab] OR "emergency services"[tiab] OR "ambulatory care"[tiab]) NOT (editorial[pt] OR comment[pt] OR letter[pt] OR "case reports"[pt])
This specification provided a comprehensive listing of studies related to different aspects of dental care provided in emergency settings.
A continuous search was also established through an account with “My NCBI,” the National Center for Biotechnology Information (NCBI) at the U.S. National Library of Medicine (NLM). Notifications of new publications meeting the search specification were emailed as they were detected. This continuous search provided the most recent publications during the writing of the report. This continuous search was specified as follows:
("emergency service, hospital"[majr] OR "emergency room"[ti] OR "emergency rooms"[ti] OR "emergency department"[ti] OR "emergency departments"[ti]) AND (dental care[mh] OR dental[ti])
Identifying online publications involved Google searching using some of the following specifications:
1. emergency room visits dental2. er visits dental3. emergency room visits dental site:gov4. er visits dental site:gov
The “:gov” designation limited the searches to online posting of government websites. Likewise, a “:org” designation could be used to limit the search to posts on organization websites. This greatly focused the results of the Google searches to actual governmental and organization reports on the ED dental care issue, filtering out general opinion and other non-scientific postings.
10

The resulting studies from these searches were then systematically reviewed to determine for each study 1) target population, 2) outcome(s) of interest of the investigation, 3) predictive factors investigated, 4) data sources used, and 5) analysis methods and diagnosis codes employed.
This report includes a thorough summary of each of these aspects. Methods were compared to explore where investigations were similar and where they differed. An evaluation of these findings led to the overall summary, conclusions and recommendations in the final sections of this report. In some cases, this report uses the terms “oral” and “dental” interchangeably, most often using “oral” in relation to oral health and oral problems, and dental in most other situations.
Research Questions: Target Populations/Outcomes of Interest/Predictor Variables
Though the issue of people using the ED for dental care has been of interest to many researchers, there are many related aspects of interest, and therefore, numerous research questions posed. Researchers may be interested in quantifying the extent of the ED dental care problem in terms of simple numbers of people involved, proportion of ED visits accounted for, costs of services provided, proportion of total costs, predictive factors in terms of demographics or other patient characteristics, factors affecting access to dentists and dental care, or effects of changes in policy. Because of the many possible related research questions, studies have varied by target populations of interest, data sources and elements used, and the statistical methods employed. The following sections include discussion of different components of research questions, including target population, outcome of interest, predictive factors, data sources used to address the research question, and data and analysis methods employed. Information is summarized in tables at the ends of each section.
Target Populations
International StudiesThough this report will focus on assessing research on dental care in the ED within the United States, such research is not limited to the United States. For example, Oliva et al. reviewed charts of a Toronto, Canada pediatric emergency department characterizing NTDC patients and summarizing treatment provided.(7) Verma and Chambers explored data from an Australian hospital ED finding 1% of ED visits to be dental in nature and 9% of dental related visits resulting in hospital admission, with most dental visits among patients 30 years of younger and most being dental abscesses or toothaches.(8) Whymann et al. analyzed New Zealand national health data to characterize and document increasing trends of hospital admissions for preventable dental conditions over a 20-year period.(9) Cachovan et al. found that 9% of patients presenting for emergency dental care at a Hamburg, Germany emergency outpatient unit had dental infections most often associated with first molars, with 20-29-year-olds being the most common age group.(10) Currie et al. investigated level of dental condition-associated pain among patients presenting at Newcastle upon Tyne (England) emergency clinics and effects on quality of life for
11

these patients.(11) Patel and Driscoll surveyed accident and emergency senior house officers in England and found they had limited dental knowledge and knowledge of proper treatment for dental emergencies.(12) In a survey of UK ED physicians, Trivedy et al. found that respondents didn’t feel properly trained and lacked confidence in treating dental emergencies.(13) Ryan and McMahon published a paper on the importance of identification and proper treatment of dental infections for medical personnel in EDs.(14)
Quiñonez has authored a number of papers on ED visits for oral problems. Two of these studies analyzed data from a national Canadian telephone interview survey: in one of these studies Quiñonez found 5% of respondents reporting having visited an ED for an NTDC; in the other study Quiñonez et al. reported that 3% of respondents had spent a day in bed for a dental problem in the past two weeks, and 2% reported having cut down on their normal activity due to the oral problem.(15, 16) Other studies reported on the province of Ontario population. Using the Ambulatory Care Reporting System, Quiñonez et al. found that 79,133 day surgery visits for dental care occurred between 2003 and 2006 in Ontario with proportionally more visits among children under 5 years old, and over half of ED visits for NTDCs were among those age 20 to 44, most often having abscesses and toothaches.(17, 18) In another study using multiple Ontario administrative datasets, Quiñonez et al. found that 26,000 Ontarians had visited EDs for NTDCs in 2006 at an estimated cost of $16.4 million, with the majority of use by low-income adults.(19) Ramraj and Quiñonez, in a telephone study of working poor Canadians, found that having spent a day in bed due to dental pain and inability to afford dental care were the biggest predictors of ED visits for NTDCs.(20) A summary of these international study target populations is provided in Table 1.
Table 1: International Study Authors and Target Populations
Authors International Target PopulationsOliva et al. (7) Toronto, Canada pediatric ED patientsVerma and Chambers (8) Australian hospital ED patients Whymann et al. (9) New Zealand national health data (hospital admissions) over 20 years Cachovan et al.(10) Hamburg, Germany emergency outpatient unit patients Currie et al. (11) Newcastle upon Tyne (England) Hospitals emergency clinics patientsPatel and Driscoll (12) English emergency senior house officers Trivedy et al. (13) United Kingdom ED physiciansQuiñonez et al. (15, 16) Canadian national populationQuiñonez et al.(17-19) Ontario, Canada resident ambulatory care patientsRamraj and Quiñonez.(20) Working poor Canadians
Reference 14 is not included in the table as it was not a population study
US National Perspective Many researchers have assessed the ED dental care issue at the national level using nationally representative datasets with data elements relevant to assessing aspects of ED care for NTDCs. Allareddy et al. analyzed the Nationwide Emergency Department Sample (NEDS) dataset of the Healthcare Cost and Utilization Project (HCUP) to study national trends and predictors of ED visits for dental conditions.(21, 22) Nalliah et al. used 2006 NEDS data to investigate national caries related ED
12
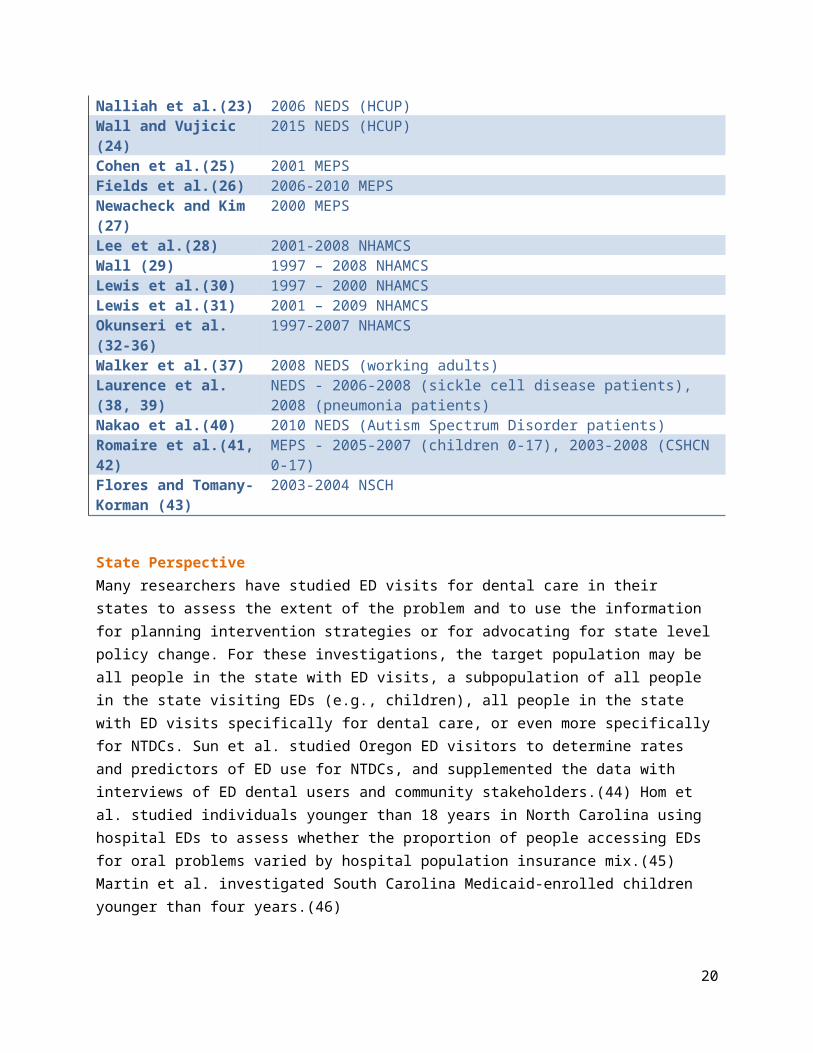
visits.(23) Wall and Vujicic analyzed the latest annual NEDS data in March 2015 to determine overall national rates and costs of ED visits for dental conditions, excluding ED dental patient visits resulting in hospital admission.(24) Cohen et al. explored 2001 Medical Expenditure Panel Survey (MEPS) data to determine levels and types of medical care services for oral problems outside the traditional community dental care system.(25) Fields et al. used 2006-2010 MEPS data to investigate insurance instability and metropolitan status related to health service utilization.(26) Newacheck and Kim used MEPS data to explore health and dental care access and expenses of children with special health care needs (CSHCN), and make comparisons to other children.(27) Lee et al. used the 2001-2008 data from the National Hospital Ambulatory Medical Care Survey (NHAMCS) to investigate national levels, trends, and predictors of ED use for dental care.(28) Likewise, Wall analyzed 1997 – 2008 NHAMCS to explore overall national trends in ED visits for dental care, and the patients presenting for such care.(29) Lewis et al. analyzed NHAMCS data, first looking at 1997-2000 data to determine national rates of ED use for dental care focusing on toothache and tooth injury, as well as predictive factors for ED dental visits compared to other ED visits.(30) Then in a subsequent study, Lewis et al. analyzed 2001-2009 NHAMCS data, with particular focus on comparing young adult ED dental use to dental and other ED usage in general.(31) Okunseri et al., using NHAMCS data, studied several aspects of NTDC care in EDs and predictors for the national population.(32-36)
Subpopulations within these national datasets are often investigated. Walker et al. restricted their analyses of NEDS data to working-age adults in their study of differences in ED dental care utilization.(37) Laurence et al. used NEDS data in researching sickle cell disease patients and pneumonia patients to determine if dental infections increased the probability of hospital admission from EDs.(38, 39) Nakao et al. used NEDS data to explore differences in NTDC related ED visit rates and costs for people with Autism Spectrum disorders.(40) Romaire et al. investigated MEPS data subsets of children aged 0 to 17 years in one study and CSHCN children 0 to 17 years in another study to explore effects of having a medical home on healthcare access and expenses for these child subpopulations.(41, 42)
Other investigators have focused on national surveys specifically designed to address national subpopulations. For example, some investigators have focused on health care and utilization for children. Flores and Tomany-Korman analyzed 2003-2004 National Survey of Children’s Health data to examine racial/ethnic disparities in health and dental care among children, exploring many measures of oral and medical health status, access, and utilization.(43) National study target populations and data sources are summarized in Table 2.
Table 2: U.S. National Study Authors and Target Populations
Authors National Target Population - DatasetAllareddy et al.(21, 22) NEDS (HCUP)Nalliah et al.(23) 2006 NEDS (HCUP)Wall and Vujicic (24) 2015 NEDS (HCUP)Cohen et al.(25) 2001 MEPS Fields et al.(26) 2006-2010 MEPSNewacheck and Kim (27) 2000 MEPSLee et al.(28) 2001-2008 NHAMCS
13

Wall (29) 1997 – 2008 NHAMCSLewis et al.(30) 1997 – 2000 NHAMCSLewis et al.(31) 2001 – 2009 NHAMCSOkunseri et al.(32-36) 1997-2007 NHAMCSWalker et al.(37) 2008 NEDS (working adults)Laurence et al.(38, 39) NEDS - 2006-2008 (sickle cell disease patients), 2008 (pneumonia patients)Nakao et al.(40) 2010 NEDS (Autism Spectrum Disorder patients)Romaire et al.(41, 42) MEPS - 2005-2007 (children 0-17), 2003-2008 (CSHCN 0-17)Flores and Tomany-Korman (43)
2003-2004 NSCH
State PerspectiveMany researchers have studied ED visits for dental care in their states to assess the extent of the problem and to use the information for planning intervention strategies or for advocating for state level policy change. For these investigations, the target population may be all people in the state with ED visits, a subpopulation of all people in the state visiting EDs (e.g., children), all people in the state with ED visits specifically for dental care, or even more specifically for NTDCs. Sun et al. studied Oregon ED visitors to determine rates and predictors of ED use for NTDCs, and supplemented the data with interviews of ED dental users and community stakeholders.(44) Hom et al. studied individuals younger than 18 years in North Carolina using hospital EDs to assess whether the proportion of people accessing EDs for oral problems varied by hospital population insurance mix.(45) Martin et al. investigated South Carolina Medicaid-enrolled children younger than four years.(46)
Some state level studies have used wider target populations to address a unique research question. For example, Cohen et al. used a telephone interview of a statewide representative sample of people who had sought care for oral problems at EDs, physician offices, or dental offices to assess the magnitude of impact that health literacy had in patient/provider interactions.(47, 48) In another study of the Maryland Medicaid population, Cohen et al. assessed the percent of total ED visits for dental reasons resulting in hospital admissions, and the costs associated with these admissions.(49) Okunseri et al. conducted a study using Wisconsin Medicaid data to assess factors associated with ED and physician office care for NTDCs among the state’s Medicaid population.(50) Pajewski and Okunseri conducted another analysis of Wisconsin Medicaid data focusing on follow-up treatment after an NTDC ED visit among adult Medicaid patients.(51)
Another type of statewide studies focused on healthcare issues in a specific subpopulation. Kempe et al. surveyed a random sample of Colorado Child Health Plan Plus (CHP+) enrollees to assess health access changes, including changes accessing dental care and EDs for health care, before to one year after enrollment.(52) Lee et al. studied North Carolina Medicaid children to determine if participation in the Special Supplemental Nutrition Program for Women, Infants, and Children (WIC) was associated with differences in dental care access.(53) In an investigation of different aspects of health care access, DeVoe et al. drew a disproportionate random sample representing Oregon children participating in the food stamp program to explore differences by urban/rural residence status.(54) Singhal et al. studied California Medicaid adults to assess rates and trends of ED dental visits before and after state Medicaid
14

policy change eliminating adult dental benefits.(55) Likewise, Wallace et al. studied changes in accessing medical settings (medical offices and EDs) for dental care by continuously enrolled Oregon Health Plan patients after elimination of dental benefits.(56)
Another form of state level investigation is analysis of data from different states to make comparisons between the states. Shortridge and Moore used 2005 SEDD data from Utah, Vermont, and Wisconsin to assess similarities and differences among ED dental care seekers in these specific states considered “diverse” by the investigators.(57) State study target populations and data sources are summarized in Table 3.
Table 3: State Study Authors and Target Populations
Authors State Target PopulationSun et al.(44) Oregon ED users and stakeholdersHom et al.(45) North Carolina ED users younger than 18 yrsMartin et al.(46) South Carolina Medicaid children younger than 4 yrsCohen et al.(47, 48) Maryland residents seeking care at EDs, physician offices or dental offices
for oral problems Cohen et al.(49) Maryland Medicaid ED users for dental reasonsOkunseri et al.(50) Wisconsin Medicaid users of EDs and physician offices for NTDCsPajewski and Okunseri(51) Wisconsin Medicaid adult ED users for NTDCsKempe et al.(52) Colorado Child Health Plan Plus enrolleesLee et al.(53) North Carolina Medicaid childrenDeVoe et al.(54) Oregon food stamp participating childrenSinghal et al.(55) California Medicaid adultsWallace et al.(56) Oregon Health Plan patientsShortridge and Moore(57) Utah, Vermont, and Wisconsin users of EDs for dental care
Online ReportsA number of states have posted reports related to ED care for NTDCs online. Many of these reports are brief, with minimal information on study methods and referencing. Online study report target populations and data sources are summarized in Table 4.
Table 4: Online Study Authors/Organizations and Target Populations
Authors/Organization Target PopulationMaryland Office of Oral Health(58) Maryland state residentsNew Hampshire Department of Health and Human Services(59)
New Hampshire state residents
Ohio Department of Health(60) Ohio state residentsCommonwealth of Massachusetts Center for Health Information and Analysis(61)
Massachusetts adult residents (ages 18+)
Hawaii State Department of Health(62) Hawaii state residentsOh and Leonard (Rhode Island Department of Health)(63)
Rhode Island adults (ages 21-64)
Missouri Department of Health and Senior Missouri state residents
15

Services(64)Anderson Economic Group, LLC(65) Michigan state residentsTennessee Department of Health(66) Tennessee state residents
Local and Other Subpopulation PerspectiveMany studies select a specific population group to research. Sometimes this will simply involve a specific convenience population, for example, those presenting at the ED of a hospital. McCormick, A et al. studied ED data from a hospital in Richmond, Virginia.(67) Neely et al. analyzed ED data from Boston Medical Center.(68) Hardie et al. analyzed 2012 ED admission data from a rural Maryland hospital to characterize frequents users of the ED.(69) Waldrop et al. conducted a chart review of all patients presenting at a Baton Rouge, Louisiana hospital ED with dental complaints.(70) McCormick, D. et al. interviewed a convenience sample of ED patients at a Cambridge, Massachusetts safety-net hospital.(71) Dorfman et al. studied barriers encountered by a convenience sampling of 200 patients presenting at the pediatric emergency department (PED) of a hospital for NTDCs.(72) Ferayorni et al. interviewed parents of children visiting a Phoenix, Arizona PED, with a focus on access and barriers to care, comparing those with and without insurance and children that were or were not foreign born.(73) Hayes et al. studied ED patients presenting with different forms of infection (including dental infections) at an urban medical center, comparing return rates of those given prescriptions with those provided with medications.(74) Patel et al. interviewed and examined patients presenting at the Hennepin County Medical Center ED in the period June through August, 2009.(75) Stevens et al. interviewed non-institutionalized cognitively-intact older patients (65+) without life threatening conditions presenting at random times during an eight-week period at a southeastern US ED.(76)
Studies also involve hospital data from hospitals/hospital systems of a community or metropolitan area. Davis et al. studied hospital administrative data for five major hospital systems in the Minneapolis-St. Paul metropolitan area.(77) Fox et al. researched the effects of an instituted prescribing guideline on opioid prescriptions for patients with oral pain complaints in a two- hospital system.(78) Weiner studied patients presenting at two hospital EDs with a chief complaint of back pain, dental pain, or headache in an investigation of consistency of emergency providers’ impressions using objective criteria from a state prescription drug monitoring program to identify drug seeking behavior among.(79) Also in the realm of investigations on drug seeking behavior (DSB) associated with oral pain complaints in the ED, Grover et al. conducted two chart review studies of a hospital ED, one of patients specifically identified for a DSB intervention program, and the other comparing those in the DSB program with other ED patients.(80, 81)
Somewhat more comprehensive studies include an entire geographic or demographic subpopulation of a state. Hong et al. chose the entire population of Kansas City, Missouri in their studies of ED use for dental care.(82, 83) A geographic area and hospitals of Rochester, New York, were studied by Roghmann and Goldberg to explore the effects of a neighborhood health center providing continuous dental care.(84)
16

Combinations of geographic areas and demographic subpopulations can also define a target population. Feinglass et al. studied enrollees of Access DuPage, a program for low-income uninsured residents of DuPage County, Illinois.(85) Lave et al. surveyed new enrollees in western Pennsylvania health insurance programs for low-income uninsured residents to track changes in health care access during the first year following enrollment.(86) Local and other subpopulation study target populations and data sources are summarized in Table 5.
Table 5: Local and Subpopulation Study Authors and Target Populations
Authors Local/Subpopulation Target PopulationMcCormick, A. et al.(67) Richmond, Virginia hospital ED patientsNeely et al.(68) Boston (MA) Medical Center ED patientsHardie et al.(69) Rural Maryland hospital frequent ED usersWaldrop et al.(70) Baton Rouge, LA hospital ED patients with dental complaints McCormick, D. et al.(71) Cambridge, MA safety-net hospital ED patientsDorfman et al.(72) Hospital pediatric ED patients presenting for NTDCsFerayorni et al.(73) Phoenix, AZ hospital pediatric ED patientsHayes et al.(74) Urban medical center patients presenting with infectionsPatel et al.(75) Hennepin County (MN) Medical Center ED patientsStevens et al.(76) Southeastern US ED cognitively-intact older (65+) patientsDavis et al.(77) Minneapolis-St. Paul hospital systems (five) ED patients presenting for
dental problems Fox et al.(78) Two-hospital system ED patients presenting with dental painWeiner(79) Two academic medical centers’ ED patients presenting with back pain,
dental pain, or headacheGrover et al.(80, 81) Hospital ED patients focusing on those with drug seeking behavior Hong et al.(82, 83) Kansas City, Missouri residents Roghmann and Goldberg.(84)
Rochester, NY area residents
Feinglass et al.(85) DuPage County, IL Access DuPage enrolleesLave et al.(86) Western Pennsylvania low-income health insurance program enrollees
Target Population Defined by Patient Care Processes or OutcomesAnother variable in defining target populations among different studies relates to patient characteristics in terms of health care processes or outcomes. For example, some study populations are defined by outcomes of the ED visit: some investigators limit their analyses to ED care resulting in patient discharge;(87) some investigators include ED care resulting either in discharge or hospital admission; others have limited their investigations to only ED treatment for oral conditions resulting in hospital admission. Chi and Masterson limited their analysis to children aged 3-17 having a hospital admission.(88) In another study, Chi et al. evaluated both children aged 3-17 and adults 18 and older with hospital admissions.(89)
Subject demographics believed to be related to ED use for NTDCs are often investigated. A study by Cohen et al. involved focus group discussions with low-income individuals who had sought care from physicians or at EDs for NTDCs.(5)
17

Combinations of subject factors are also studied. A Cohen et al. studied people covered by Medicaid who had been admitted to hospitals due to NTDCs.(49) Patient care processes or outcomes used to define target populations and their data sources are summarized in Table 6.
Table 6: Authors and Care Processes or Outcomes Used to Define Target Populations
Authors Care Processes or Outcomes Defining Target PopulationsAnderson et al.(87) Patients with dental related ED visits resulting in dischargeChi and Masterson(88) Patients aged 3-17 with dental related ED visits resulting in hospital
admissionChi et al.(89) Patients aged 3-17 and adults 18+ with dental related ED visits resulting in
hospital admissionCohen et al.(5) Low-income individuals having sought care for NTDCs at physician offices
or EDs Cohen et al.(49) Persons covered by Medicaid admitted to hospitals due to NTDCs
Outcomes of Interest
General Dental Access and ED Utilization As with other aspects of ED dental care research, study outcomes varied widely. Some researchers have conducted general studies of ED use and access to regular dental care, without specifically looking at ED use for dental problems.(26, 54, 73, 85, 90-92) Newacheck and Kim explored health and dental care access and expenses with a focus on CSHCN.(27) Romaire et al. used MEPS data to explore healthcare access and expenses, including ED visits and dental visits, in subsets of children aged 0 to 17 years in one study and CSHCN children 0 to 17 years in another study.(41, 42) Flores and Tomany-Korman analyzed 2003-2004 National Survey of Children’s Health to examine racial/ethnic disparities in health and dental care among children, exploring many measures of oral and medical health status, access, and utilization, including perceived oral health status, dental insurance, preventive dental care in the past year, and ED visits, though the investigation did not include ED visits specifically for oral problems.(43) Stevens et al. interviewed older patients (aged 65+) presenting at a southeastern US ED to ascertain frequency of ten health care access problems, including difficulty in obtaining dental care.(76) McCormick, D et al. investigated health care access issues, including delayed dental care or not getting dental care among ED patients in an investigation of health care access impacts of health care reform in Massachusetts.(71) Wallace et al. assessed changes among Oregon Medicaid patients in unmet dental needs, utilization of preventive services, and ED dental visit rates and associated costs associated with the elimination of dental benefits.(56) Lee et al. investigated dental care access and ED visits with a primary diagnosis of caries through Medicaid claims as the outcome, comparing North Carolina Medicaid children participating in WIC compared to those not participating in WIC.(53) Martin et al. also used Medicaid data to investigate outcomes of preventive dental visits, receipt of preventive dental procedures, dental home status, and access to ED or medical offices for dental care.(46) Patel et al. interviewed and examined all patients presenting at the Hennepin County Medical Center ED to determine the
18

proportions of patients with early or urgent dental care needs, independent of the patients’ reason for visiting the ED.(75) Authors and general dental access and ED utilization outcomes studied are summarized in Table 7.
Table 7: Authors and General Dental Access and ED Utilization Outcomes Studied
Authors General Dental Access and ED Utilization Outcomes InvestigatedNewacheck and Kim(27) Health and dental care access and expenses with a focus on CSHCNRomaire et al.(41) Healthcare access and expenses, including ED visits and dental visits, in
children aged 0 to 17Romaire et al.(42) Healthcare access and expenses, including ED visits and dental visits, in
CSHCN children aged 0 to 17 Flores and Tomany- Korman(43)
Racial/ethnic disparities among children in oral and medical health status, access, and utilization, including perceived oral health status, dental insurance, preventive dental care in the past year, and ED visits
Stevens et al.(76) Frequency of ten health care access problems, including difficulty in obtaining dental care among older patients (aged 65+)
McCormick, D et al.(71) Health care access issues, including delayed dental care or not getting dental care among ED patients in Massachusetts
Wallace et al.(56) Changes among Oregon Medicaid patients in unmet dental needs, utilization of preventive services, and ED dental visit rates and associated costs
Lee et al.(53) Dental care access and ED visits with a primary diagnosis of caries Martin et al.(46) Preventive dental visits, receipt of preventive dental procedures, dental
home status, and access to ED or medical offices for dental carePatel et al.(75) Proportions of patients with early or urgent dental care needs,
independent of the patients’ reason for visiting the ED
ED Utilization for Dental Care and NTDC Care – Rates and Factors Affecting RatesMore basic outcomes specifically related to ED utilization for dental care generally, or more specifically for NTDCs, include simple assessments of counts of ED visits for dental care or NTDCs, proportions of populations using EDs for dental care or NTDCs in the past year,(85) proportions of total ED visits that are for dental care or NTDCs, costs or charges associated with ED visits for dental care or NTDCs, and possibly trends of these measures over time. Wall analyzed 1997-2008 NHAMCS data to determine national rates and trends of ED dental visits.(29) Wall and Vujicic analyzed the latest NEDS data in 2015 to determine national rates and costs of ED visits for dental reasons.(24) Shortridge and Moore used 2005 SEDD data from Utah, Vermont, and Wisconsin to assess and compare ED visit rates in three states for dental care in general, for preventable dental diagnoses, and for dental diagnoses considered to have low severity.(57) Nalliah et al. analyzed 2006 NEDS data to investigate national counts, rates, and costs specifically for caries related ED visits.(23) Walker et al. analyzed 2008 NEDS data to determine predictors of ED visits with caries diagnoses among working age adults.(37) Lewis et al. investigated overall rates of ED use for dental complaints focusing on toothache as the primary visit complaint in NHAMCS data,(30) and then followed up with another NHAMCS data study with a focus on comparing
19
similar outcomes and trends in ED use for young adults compared to other ED users (with specific comparisons to ED use for back pain).(31)
Many studies have gone beyond reporting levels of ED dental utilization to explore predictive factors. Sun et al. used a combination of 2010 claims data from 45 of Oregon’s 60 hospitals (including all payer groups) and the Oregon Payer All Claims file (which includes procedure, prescription, repeat ED visits, and costs data not available in hospital supplied data), and also interviewed purposive samples of ED dental visitors and community stakeholders in six counties to determine rates, costs, and predictors of ED use for NTDCs and possible interventions.(44) Hom et al. studied individuals younger than 18 years in North Carolina visiting hospital EDs to assess whether the proportion of people accessing EDs for oral problems varied by hospital population insurance mix.(45) Hong et al. studied the Kansas City, Missouri population to determine number and rates of ED use for dental care and to identify predictive factors for ED dental visits.(82, 83) Waldrop et al. conducted a chart review of all patients presenting with dental complaints during the period from 1987 to 1995 at a Baton Rouge, Louisiana hospital ED to determine rates, and trends of ED use for dental complaints and severity of dental conditions, finding increasing rates over the time period, and that half of the cases were non-emergent and could have been treated at dental offices during normal business hours.(70) Roghmann and Goldman studied the geographic area and hospitals of Rochester, New York to explore if a neighborhood health center providing continuous dental care reduced the number of ED dental emergency visits.(84) Nakao et al. assessed NTDC related ED visit rates and costs, and compared overall rates and costs to those for people with autism spectrum disorder.(40)
Okunseri et al., in several NTDC ED treatment studies, investigated a variety of outcomes. In one study they assessed rates of ED and physician office care for NTDCs in the Wisconsin Medicaid population, with a focus on racial and ethnic differences.(50) In another study of national NHAMCS data, they assessed rates and trends of ED visits for NTDCs, evaluating different predictive factors. One of their studies evaluated ED waiting times for treatment of NTDCs.(32) Another study evaluated rates of ED use by time of day and weekends vs. weekdays.(33) Authors and ED dental care utilization rate related outcomes studied are summarized in Table 8.
Table 8: Authors and ED Dental Care Utilization Rate Related Outcomes Studied
Authors ED Dental Care Utilization Rate Related OutcomesFeinglass et al.(85) Proportions of populations using EDs for dental care or NTDCs in the past
yearWall(29) National rates and trends of ED dental visitsWall and Vujicic(24) National rates and costs of ED visits for dental reasonsShortridge and Moore(57) Compare ED visit rates in three states for dental care in general, for
preventable dental diagnoses, and for dental diagnoses considered to have low severity
Nalliah et al.(23) National counts, rates, and costs specifically for caries related ED visitsWalker et al.(37) ED visits with caries diagnoses among working age adultsLewis et al.(30) Overall rates of ED use for dental complaints focusing on toothache as the
primary visit complaint
20
Lewis et al.(31) Outcomes and trends in ED use for young adults compared to other ED users (with specific comparisons to ED use for back pain)
Sun et al.(44) Rates, costs, and predictors of ED use for NTDCs and possible interventions
Hom et al.(45) Proportion of people (younger than 18 yrs) accessing EDs for oral problems compared by hospital population insurance mix
Hong et al.(82, 83) Numbers and rates of ED use for dental care Waldrop et al.(70) rates, and trends of ED use for dental complaints and severity of dental
conditionsRoghmann and Goldman(84)
Reduction in the number of ED dental emergency visits
Nakao et al.(40) NTDC related ED visit rates and costs, comparing the overall population to people with autism spectrum disorder
Okunseri et al.(50) Rates of ED and physician office care for NTDCs in the Wisconsin Medicaid population, with a focus on racial and ethnic differences
Okunseri et al.(32) ED waiting times for treatment of NTDCsOkunseri et al.(33) Rates of ED use by time of day and weekends vs. weekdays
Other Outcomes Related to ED Utilization for Dental CareOther factors related to ED visits for dental care have been studied. An important outcome related to basic ED dental care utilization is the rate of same subject return visits to EDs for the same oral problem (if that can be determined), which has an obvious direct impact on total ED related costs for NTDCs. Davis et al. investigated costs and frequency of return visits in Minneapolis-St. Paul area hospitals.(77) In addition to basic findings on number and costs of ED visits for dental care, DeLia et al. took investigation of return visits a step further and identified “high users” as subjects accessing EDs four or more times during the study period of 2008-10.(93) They explored differences of “high users” in terms of primary dental diagnoses and secondary diagnoses, and also found that “high users” often accessed multiple hospitals in their repeat visits. They also found that young adults, non-Hispanic blacks, and medically uninsured were over-represented among “high users.” Likewise, Hardie et al. analyzed 2012 ED admission data from a rural Maryland hospital to characterize frequents users of the ED, finding multiple distinct diagnoses correlated with number of ED admissions, and that many of the return visits involved dental diagnoses.(69) A variation on investigation of return visits to EDs as an outcome was conducted by Hayes et al., comparing the return rates of patients with infections (including dental infections) receiving medications vs. those receiving prescriptions.(74)
Another somewhat commonly evaluated outcome is dental related ED visits resulting in hospital admission. Nalliah et al., in analyzing 2006 NEDS data, found that 158 hospital admissions occurred out of 330,757 caries related ED visits.(23) Cohen et al. found that 2% of Medicaid related ED visits for dental reasons resulted in hospital admissions with a mean associated claims cost of $5,793.(49) Laurence et al. also explored the outcome of hospital admission using NEDS data to assess if patients with sickle cell disease and patients with pneumonia had increased probability of hospital admission from EDs if they also had dental infections.(38, 39) Authors and ED dental care utilization related outcomes studied are summarized in Table 9.
21

Table 9: Authors and ED Dental Care Utilization Related Outcomes Studied
Authors ED Dental Care Utilization Related OutcomesDavis et al.(77) Costs and frequency of return visits in Minneapolis-St. Paul area hospitalsDeLia et al.(93) Identified “high users” as subjects accessing EDs four or more times over a
three year periodHardie et al.(69) Frequent users of the ED in terms of multiple distinct diagnoses, including
dentalHayes et al.(74) Return rates of patients with infections (including dental infections)
receiving medications vs. those receiving prescriptionsNalliah et al.(23) Proportion of hospital admissions out of all caries related ED visitsCohen et al.(49) Proportion and costs of hospital admissions among Medicaid related ED
visits for dental reasons Laurence et al.(38, 39) Hospital admission among patients with sickle cell disease and patients
with pneumonia who also had dental infections
Care Related Outcomes Many investigations have explored the care received for NTDCs in EDs. Virtually all formal and informal reports find that in EDs where no dental personnel or dental clinics are present, care primarily is provided in the form of prescriptions for pain and antibiotics. While Cohen found that subject demographics were related to where care was sought, and care varied depending on whether care was sought at EDs, dental offices, or MD offices, the services provided at these different site categories did not vary by subjects’ incomes or race/ethnicity.(48)
Two studies conducted by Okunseri et al. focusing specifically on dental related ED prescriptions evaluated national rates and trends of medications prescribed at EDs for NTDCs, one looking at analgesics and antibiotics in general,(34) and the other assessing rates and trends of opioid, non-opioid, and combination analgesics.(36) Related to ED prescribing is the issue of DSB, more specifically the seeking of opioid prescriptions with oral pain given as the chief complaint. Fox et al. conducted chart reviews in a two-hospital system to study the effects of an instituted prescribing guideline on opioid prescribing for patients with oral pain complaints, finding the rate of opioid prescribing dropped, as well as the rate of ED visits for oral pain.(78) In the Grover et al. chart review studies, DSB was studied related to ED patient behaviors and complaints, including oral pain complaints.(80, 81) Weiner studied consistency of emergency providers’ impressions using objective criteria from a state prescription drug monitoring program to identify drug seeking behavior among patients presenting at two hospital EDs with a chief complaint of back pain, dental pain, or headache.(79)
Another outcome of interest is whether those presenting at an ED with NTDCs had follow-up care with a dentist. Cohen et al. found in their Maryland phone survey that 96% of those having gone to an ED for a NTDC contacted a dentist after their ED visit.(48) Pajewski and Okunseri found in an analysis of Wisconsin Medicaid data that among adults, 30% visited a dentist within 30 days; 42% visited a dentist within 180 days; 10% returned to the ED within 30 days; and 18.3 percent returned to the ED within 180 days.(51) Of the patients visiting a dentist following an ED NTDC related visit, 38% had a tooth extraction.
22

Many other outcomes have been investigated in relation to ED dental care. Cohen et al., in their state telephone interview study, included an assessment of dentist, physician, and ED visits for dental care that resulted in a health literacy related problem in caregiver-patient interactions.(47) Authors and ED dental care related outcomes studied are summarized in Table 10.
Table 10: Authors and ED Dental Care Related Outcomes Studied
Authors ED Dental Care Related OutcomesCohen(48) Care provided at EDs, dental offices, or MD offices, and comparisons by
patient income and race/ethnicityOkunseri et al.(34) National rates and trends of NTDC related ED visit analgesic and antibiotic
prescriptionsOkunseri et al.(36) Rates and trends of NTDC related ED visit opioid, non-opioid, and
combination analgesicsFox et al.(78) Effects of an instituted prescribing guideline on opioid prescribing for
patients with oral pain complaintsGrover et al.(80, 81) Drug seeking behavior related to ED patient behaviors and complaints,
including oral pain complaintsWeiner(79) Consistency of emergency providers’ impressions using objective criteria
from a state prescription drug monitoring program to identify drug seeking behavior among patients with a chief complaint of back pain, dental pain, or headache
Cohen et al.(48) Percentage of those having gone to an ED for a NTDC contacting a dentist after their ED visit
Pajewski and Okunseri(51) Percentage visiting a dentist (and procedures provided) or returning to an ED within 30 days and 180 days of a dental related ED visit
Cohen et al.(47) Dentist, physician, and ED visits for dental care resulting in a health literacy related problem in caregiver-patient interactions
Trends or Changes in Dental ED Utilization While many researchers have studied point in time associations of different ED dental care outcomes with different predictors, some investigators have also explored changes between two points in time or trends in ED use for oral problems over time. Lee et al. determined an increasing trend in ED dental visits over the years 2001 to 2008 in data from the NHAMCS.(28) Pajewski and Okunseri, in their analysis of Wisconsin 2001-2009 Medicaid data focusing on follow-up treatment after NTDC ED visits among adult Medicaid patients, found a 43% increase in NTDC visits to EDs over the nine years of data.(51)Hong et al. found increased ED use for dental complaints over a six-year period from 2001 to 2006 in ER discharge data for Kansas City, Missouri hospital EDs.(82)
Other studies have investigated trends or changes in dental ED utilization related to specific care factors. Kempe et al. explored changes in care and access for general health, dental health, and ED care for Colorado residents before and one year after enrollment in Colorado’s CHP+ program.(52) Lave et al. investigated changes over the first year in health care access, including having a regular dentist, access to dental care when needed, and proportion having visited an ED, among new enrollees in Western Pennsylvania health insurance programs for low-income uninsured residents.(86) McCormick et al., in
23

addition to determining basic ED dental usage rates and costs, also analyzed changes in these rates, costs, and repeat ED visits after instituting a program to divert patients with dental complaints to an urgent dental care clinic in the oral and maxillofacial surgery department of the hospital.(67) Likewise, Neely et al. explored dental related ED visit rates and costs, but specifically explored changes in rates and costs 3 years before and 2 years after Massachusetts health care reform.(68) Singhal et al. assessed rates and trends of ED dental visits over the time period from 2006 to 2011, before and after a July, 2009 Medicaid policy change in California eliminating adult dental benefits, and compared these rates and trends to those for other ambulatory care-sensitive conditions.(55) Authors and ED dental care trend or change related outcomes studied are summarized in Table 11.
Table 11: Authors and ED Dental Care Trend/Change Outcomes Studied
Authors ED Dental Care Trend/Change Related OutcomesLee et al.(28) National trend in ED dental visits over the years 2001 to 2008 Pajewski and Okunseri(51) State trend in Medicaid NTDC visits to EDs over nine yearsHong et al.(82) City trend in ED use for dental complaints over a six-year period Kempe et al.(52) Changes in care and access for general health, dental health, and ED care
for state residents before and one year after enrollment in CHP+ programLave et al.(86) Changes in health care access, including having a regular dentist, access to
dental care when needed, and proportion having visited an ED over the first year among new enrollees in Western Pennsylvania health insurance programs for low-income uninsured residents
McCormick et al.(67) Changes in ED dental usage rates, costs, and repeat ED visits after instituting a diversion program
Neely et al.(68) Changes in dental related ED visit rates and costs 3 years before and 2 years after state health care reform
Singhal et al.(55) Trends of ED dental visit rates over five years, before and after state Medicaid policy change eliminating adult dental benefits, and comparison to trends for other ambulatory care-sensitive conditions
Predictive Factors
Demographics and Other Patient FactorsMany of the studies on ED dental care evaluated basic demographic and patient factors associated with presenting at the ED with non-traumatic dental problems. Wall(29) and Wall and Vujicic(24) included analyses by age group and primary payer in their studies of national ED visits for dental care. Cohen et al., in an analysis of MEPS data, studied associations of gender, race/ethnicity, family income, education, employment, and urban/rural status with medical and ED visits for dental problems, and found that only education was statistically associated with ED visits for dental problems.(25) Sun et al. explored age, gender, race/ethnicity, insurance type, and residence zip code level measures of poverty, education, and unemployment in their study of rates, costs, and predictors of NTDC related ED visits in Oregon.(44) Flores and Tomany-Korman specifically focused on racial/ethnic disparities in an analysis of 2003-2004 National Survey of Children’s Health, exploring many measures of oral and medical health status, access, and utilization.(43) Fields et al. investigated the effects of metropolitan residence status and insurance
24

instability, along with other patient demographic and health predictors on healthcare utilization.(26) Hong et al. investigated gender, age, and race/ethnicity, along with zip code community and census level variables, and other access related variables in their studies.(82, 83) Lee H. et al. found increasing rates of ED dental care access associated with adults aged 18-44, Blacks, and the uninsured.(28) Stevens et al. explored physical, economic, and psychological factors, in addition to standard demographic factors, in characterizing health care access problems among older patients (65+) presenting at southeastern US ED.(76) In the various Okunseri et al. studies, analyses usually included age, race/ethnicity, gender, time (investigating trends over years), and insurance type, some with additional predictors of interest.(32-36, 50) For example, their study on analgesic medication ED prescription for NTDCs trends included having reported a dental problem as the reason for the ED visit and patient-reported severity of pain;(36) their study of ED waiting time for NTDCs included a triage category predictor variable.(32)
Other demographic and patient level factors have been studied. Ferayorni et al. investigated associations of being foreign born, as well as insurance status, with access to dental care and use of a pediatric ED as a primary source of care.(73) Lee J. et al., comparing dental care and ED visits for caries among North Carolina Medicaid children participating in WIC to those not participating in WIC, controlled for maternal educational level, maternal age, household income, and marital status in their analyses.(53) Patel et al., in their study of oral health status of patients presenting at the Hennepin County Medical Center ED in the period June through August of 2009, found age, ethnicity, and not having a routine dental checkup/cleaning in the last three years to be predictive of early and urgent dental needs.(75) Newacheck and Kim investigated health and dental care access and expenses focusing on differences for CSHCN.(27) Nakao et al. focused on autism spectrum disorders as a predictor of NTDC related ED visit rates and costs.(40) Note that some of the factors listed in the cited studies might be considered patient level factors, or might more appropriately fall into community/area level predictive factors or factors related to the access to care discussion that follows.
A variation on assessing predictive factors involves assessing factors specifically associated with hospital admission for NTDCs. Chi and Masterson found such hospital admissions associated with the number of complex chronic conditions in patients, being non-white, being publicly insured, and having lower income, while also assessing age and gender.(88) In a separate study, Chi et al. found that hospital admissions associated with NTDCs were slightly, though non-significantly, higher for children with intellectual and developmental disabilities (IDDs), but significantly lower for adults with IDDs.(89) Laurence et al. actually explored dental infection as a predictor of hospital admission among patients with sickle cell disease and patients with pneumonia.(38, 39)
In another variation on the standard demographics related to ED use for NTDCs, Cohen et al., in their study on health literacy issues in dental care, found males and Hispanics more likely to experience health literacy problems when seeking dental care from dentists, physicians and at EDs.(47) In another report on the same survey, Cohen et al. reported that reasons for contacting an ED for a NTDC varied by race, education level, and income, and interestingly, found that having been advised at the ED to contact a dentist for follow-up care varied by race, with 98% of whites reporting getting such advice, compared to only 16% of Hispanics.(48) Another example of a less common potential predictive factor is serious psychological distress (SPD), investigated by Dismuke et al. in association with different types of health
25

and dental expenditures, including ED expenditures.(92) While they found SPD associated with higher ED related expenditures, SPD was associated with lower dental expenditures. Specific dentally related ED expenditures were not investigated in this study, so conclusions on the association of SPD and ED dental care can’t be drawn.
In addition to evaluation of demographics of subjects accessing EDs for dental care, area factors have also been investigated, which goes beyond subject factors to environmental factors in exploring associations with ED dental care. For example, DeVoe et al. studied different aspects of general and dental health care access, including use of EDs, with a primary focus on investigating differences by urban/rural residence status.(54) Martin et al. focused on urban/rural residence status in their study of dental care utilization, while also controlling for age, gender, race/ethnicity, and special healthcare need status.(46) DeLia et al. merged census data, NJ Family Health Survey data (for statewide insurance coverage distribution), and NJ dentist licensure data by zip code with NJ hospital discharge data and found ED use was associated with local dentist supply and use of EDs for other conditions.(93) Hong et al. included census data in one study,(82) and American Community Survey 5-Year Estimates data in another study(83) to combine patient level variables with community level variables including income, education level, and primary language spoken in homes. They studied predictors of dental related ED visits, finding community level income and language spoken at home to be significant predictors. Likewise, Nalliah found ED visits for caries associated with low-income area residence.(23) Authors and ED dental care patient characteristic predictors studied are summarized in Table 11.
Table 11: Authors and ED Dental Care Patient Characteristic Predictors Studied
Authors ED Dental Care Patient Characteristic PredictorsWall(29) Age group, primary payerWall and Vujicic(24) Age group, primary payerCohen et al. (25) Gender, race/ethnicity, family income, education, employment, and
urban/rural status Sun et al.(44) Age, gender, race/ethnicity, insurance type, and residence zip code level
measures of poverty, education, and unemployment Flores and Tomany- Korman(43)
Racial/ethnic disparities
Fields et al.(26) Metropolitan residence status and insurance instability, along with other patient demographic and health predictors
Hong et al. (82, 83) Gender, age, race/ethnicity, zip code community and census level variables, and other access related variables
Lee H. et al.(28) Age, race/ethnicity, insurance statusStevens et al.(76) Physical, economic, and psychological factors, demographic factorsOkunseri et al.(32-36, 50) Age, race/ethnicity, gender, time (investigating trends over years),
insurance type, additional predictors for specific research questions: triage category, patient reported dental pain and severity of pain
Ferayorni et al.(73) Being foreign born, insurance status, access to dental care, pediatric ED as a primary source of care
Lee J. et al.(53) WIC participation among Medicaid children, maternal educational level,
26

maternal age, household income, and marital statusPatel et al.(75) Age, race/ethnicity, not having a routine dental checkup/cleaning in the
last 3 years Newacheck and Kim(27) Differences for CSHCNNakao et al.(40) Autism spectrum disordersChi and Masterson(88) Number of patient complex chronic conditions, race/ethnicity, insurance
type, income, age, genderChi et al.(89) Intellectual and developmental disabilitiesLaurence et al.(38, 39) Dental infection as a predictor of hospital admissionCohen et al.(47) Gender, race/ethnicityCohen et al.(48) Education level, income, race/ethnicityDismuke et al.(92) Serious psychological distress (SPD)DeVoe et al.(54) Urban/rural residence statusMartin et al.(46) Urban/rural residence status, age, gender, race/ethnicity, and special
healthcare need statusDeLia et al.(93) Insurance, local dentist supply, use of EDs for other conditions than dentalHong et al. (82) (83) Patient level variables and community level variables including income,
education level, and primary language spoken in homesNalliah(23) Low-income area residence
Access Issues/Policy ChangesAccess related factors are often investigated in relation to ED use for NTDCs. One primary access factor often investigated is dental insurance. Having insurance is often included with other subject level demographic factors as mentioned previously (23, 25, 26, 67, 73), and often includes designation of whether the insurance is private or public. In another study focusing on young adults, Lewis found people without insurance or on Medicaid were more likely to use EDs for dental problems in general,(30) and likewise for young adults.(31) While some studies include insurance with a mix of other patient demographic characteristics, some researchers focus primarily on insurance status and other access issues related to healthcare utilization. Walker et al. analyzed 2008 NEDS data with a primary objective of determining if insurance status and rural residence were predictors of ED visits with caries diagnoses among working-age adults.(37) Dorfman et al. investigated insurance status and other patient reported access issues related to primary medical and dental care, duration of NTDC symptoms, diagnosis, and seeking care at a hospital PED in interviews of patients accessing the PED for NTDCs.(72) The patient survey used in this study asked a number of questions about barriers to dental care with private practicing dentists. Lee et al. studied dental care access and ED visits with a primary diagnosis of caries through Medicaid claims for North Carolina Medicaid children, with WIC participation as the primary predictor of interest.(53) These studies can be grouped into a category that describes individual factors as predictors of ED use for NTDCs.
Other studies, however, investigate access in terms of population level, community level, or area level predictors. Okunseri et al., in a study of the Wisconsin Medicaid population, evaluated county of residence for DHPSA designation, in addition to Urban Influence Code (a measure for rurality), race/ethnicity, age, and gender as predictors of treatment for NTDCs in EDs and physician offices.(50) Pajewski and Okunseri, in another analysis of Wisconsin Medicaid data focusing on follow-up treatment
27

after an NTDC ED visit among adult Medicaid patients, used similar predictor variables, with a generated variable on low-income population to dentist ratio.(51) In addition to age, gender, race, and income, Shortridge and Moore focused on urban/rural residence, dental DHPSA residence, and state Medicaid policies to assess similarities and differences in ED dental care rates in three states.(57)
Davis et al. found that a Minneapolis-St. Paul population with commercial dental insurance utilized EDs for oral problems at a much lower rate than the metropolitan population in general.(77) Hom et al. studied individuals under 18 years old in North Carolina using hospital EDs to assess whether the proportion of people accessing EDs for oral problems varied by hospital population insurance mix, and found that a higher proportion of dentally related ED visits were covered by Medicaid than ED visits in general, and that hospitals serving populations with larger proportions of children on Medicaid have a greater proportion of total ED visits that are for dental care.(45)
A more basic access barrier is the lack of available dental care. Hardie et al., in analyzing 2012 ED admission data from a rural Maryland hospital to characterize frequents users of the ED, found that many of the return visits involved dental diagnoses, and that the community had no dental facilities, with dental care only available in an adjacent state or at a dental clinic two hours away.(69) Related to lack of local dental facilities is the issue of dental facilities’ business hours. Some investigators have included time of day and day of week in their analyses of ED use for dental problems. Hong et al. found that weekends were associated with higher proportion of ED visits for dental problems.(82) Lewis et al. found that weekends and after-hour weekdays were associated with increased use of EDs for dental problems.(30) In addition to exploring rates and trends of visits for dental complaints at a Louisiana ED, Waldrop et al. found that non-emergent dental conditions were more likely to present during normal business hours, while emergent dental conditions were seen more between 7:00 PM and 7:00 AM.(70) While Lee et al. studied patient factors predictive of increasing rates of ED dental visits, they also compared increasing ED dental visit rates to unchanging asthma visit rates and concluded that the difference was likely due to decreasing access to community dental care.(28)
Related to availability of care is the issue of medical and dental homes. Romaire et al. analyzed MEPS data subsets of children aged 0 to 17 years in one study and CSHCN children 0 to 17 years in another study to explore effects of having a medical home on healthcare access and expenses, including ED and dental visits, for these child subpopulations.(41, 42)
Many publications address magnitude and changes in ED dental care related to changes in policy, particularly those for dental insurance coverage. For example, Becker et al. assessed changes in overall health care expenditures and utilization, including care provided in EDs (ED dental care was not specifically assessed), following an expansion of Children’s Health Insurance Program (CHIP) coverage in Alabama.(90) They found that though new expansion enrollees had higher care costs and utilization, their utilization rate of EDs was lower. McCormick, D. et al. investigated health care access issues following health care reform in Massachusetts, finding higher numbers of Medicaid and Commonwealth Care ED patients reporting delayed dental care or not getting dental care compared to privately insured patients.(71) In another study of the effects of Massachusetts healthcare reform, Neely et al. explored dental related ED visit rates and costs at Boston Medical Center, but specifically explored changes in
28

rates and costs three years before and two years after Massachusetts health care reform.(68) Singhal et al. assessed differential effects based on patient age, sex, race/ethnicity, and geographic location, but their primary predictor of interest was changing Medicaid policy in California that eliminated adult dental benefits.(55) The investigators looked at rates of dental ED visits before and after the policy change and compared them to rates for other ambulatory care-sensitive conditions (asthma, headache, abdominal pain, diabetes, and back pain) during the same time period. Similarly, while controlling for other demographic factors, Wallace et al. assessed changes among continuously enrolled Oregon Medicaid patients in unmet dental needs, utilization of preventive services, and ED dental visit rates and associated costs after the elimination of dental benefits.(56)
A slight variation on policy change is change in healthcare coverage status. Feinglass et al. compared new Access DuPage (a healthcare program for low- income, uninsured residents of DuPage County, IL) enrollees to those who had been enrolled in Access DuPage for more than a year, and found that though there were many improvements in aspects of health, there was no improvement in dental care access, nor a decrease in ED use for the longer-term enrollees.(85) Likewise, Kempe et al. explored changes in care and access for general health, dental health, and ED care for Colorado residents before and one year after enrollment in Colorado’s CHP+ program, finding generally better healthcare access, better dental access, but no change in ED access for health issues.(52) Lave et al. followed new enrollees in Western Pennsylvania health insurance programs for low-income, uninsured residents to track changes in health care access during the first year following enrollment.(86)
Another area of potential policy change relates to patient care and related ED procedures. Hayes et al. studied whether providing medications to patients presenting to an urban ED with infections (including dental infections) differed in return rate to the ED from patients receiving only prescriptions.(74) While providing medications reduced return rates for some types of infection, there was no statistical difference seen among those presenting with dental infections.
Though not the subject of this report, another predictive factor studied by some researchers has been actual intervention programs designed to curb ED use for NTDCs. A companion document to this report is addressing ED dental care interventions. However, intervention programs do represent another predictive factor of ED use for dental care, and their effects have been evaluated. For example, researchers concluded that a Calhoun County, Michigan program significantly reduced the number of patients presenting at a local hospital for dental pain.(94) McCormick et al. found a 52% reduction in ED patients with dental complaints and a 66% reduction in ED patients with two or more visits after instituting a diversion program to a hospital emergency dental clinic.(67) Roghmann and Goldman explored the effects of a new neighborhood health center providing continuous dental care in reducing the number of ED dental emergency visits to area hospitals.(84) Authors and dental access and policy change predictors studied are summarized in Table 12.
Table 12: Authors and ED Dental Access and Policy Change Predictors Studied
Authors ED Dental Access and Policy Change PredictorsMany studies, e.g.,(23, 25, Having insurance and whether insurance is public or private
29

26, 67, 73)Lewis(30, 31) Insurance status and typeWalker et al.(37) Insurance status, rural residence Dorfman et al.(72) Insurance status and other patient reported access issues Lee et al.(53) WIC participation (among Medicaid children)Okunseri et al.(50) County of residence for DHPSA designation, Urban Influence Code (a
measure for rurality) Pajewski and Okunseri(51) Generated variable on low-income population to dentist ratioShortridge and Moore(57) Urban/rural residence, dental HPSA residence, and state Medicaid policiesDavis et al.(77) Insurance status and typeHom et al.(45) Hospital population insurance mixHardie et al.(69) Dental clinic proximityHong et al.(82) Weekends vs. weekdaysLewis et al.(30) Weekends vs. weekdays, after hours vs. normal business hoursWaldrop et al.(70) After hours vs. normal business hoursRomaire et al.(41, 42) Having a medical homeBecker et al.(90) Expansion of state Children’s Health Insurance Program (CHIP) coverage McCormick et al.(71) State health care reform related to insurance type Neely et al.(68) State health care reformSinghal et al.(55) Changing Medicaid policy in California eliminating adult dental benefitsWallace et al.(56) Elimination of Medicaid dental benefitsFeinglass et al.(85) Enrollment in a county healthcare program for low-income, uninsured
residents Kempe et al.(52) Enrollment in state CHP+ programLave et al.(86) Enrollment in a state regional health insurance program for low-income
uninsured residents Hayes et al.(74) Program providing medications to patients with infections vs. receiving
only prescriptionsHigbea et al.(94) Local ED dental care diversion programMcCormick et al.(67) Hospital diversion program to a hospital emergency dental clinicRoghmann and Goldman(84)
New neighborhood health center providing continuous dental care
Drug Seeking Behavior (DSB)An alternative predictor of ED utilization for dental problems that some researchers have explored is patients that access EDs reporting dental pain to obtain prescriptions for opioids. Fox et al. conducted chart reviews in a two-hospital system to study the effects of an instituted prescribing guideline on opioid prescribing for patients with oral pain complaints.(78) In the Grover et al. chart review studies, patient behaviors and complaints when presenting at a hospital ED, including oral pain complaints, were investigated to assess their relation to DSB.(80, 81) Weiner et al., in a study comparing emergency provider impression to objective criteria in a state prescription drug monitoring program in identifying DSB, also assessed predictors of DSB including requesting opioids by name, multiple visits for the same complaint, suspicious history, reporting stolen medications, and symptoms out of proportion to examination.(79) DSB impacts on reported ED dental care utilization must be considered.
30

Data Sources/Available Data Elements/Diagnosis-Procedure Codes Studied
Data Sets/Sources and Available Data ElementsData sources for investigating dental care provided in EDs are numerous. The data sources to a large extent are chosen depending on the specific research question being asked. Some researchers are assessing the issue at a national level. Others, either due to a local focus or possibly in some cases just using the data that are most convenient to them, elect to use administrative data from a single hospital or group of hospitals, or in some cases from patient interviews. Stakeholders at a county level will use data for a county. State oral health programs (SOHPs) will usually obtain and use state level data to elucidate a problem or implement interventions or have others influence policymakers to address the problem at the state level. The source and characteristics of the data used directly impact the research questions that can be addressed and the inference of results to specific populations. Some commonly used datasets are summarized in the following sections.
National Datasets
The National Emergency Department Sample (NEDS)The Nationwide Emergency Department Sample (NEDS) includes data sampled from a family of state inpatient (SID) and state emergency department (SEDD) databases including software developed by the Healthcare Cost and Utilization Project (HCUP).(95) NEDS is a stratified sample of about 20% of U.S. hospital EDs and contains data from 950 hospitals in 30 states. NEDS data can be used to generate national and regional estimates of ED use. Further information on NEDS can be found in Appendix 1. Investigators using this dataset include Allareddy et al.(21, 22), Chi et al.(89), Laurence et al.(38, 39), Nakao et al.(40), Nalliah et al.(23), Walker et al.(37), Wall and Vujicic(24).
Medical Expenditure Panel Survey (MEPS)In 1996 the Medical Expenditure Panel Survey began collecting data on use, frequency of use, and costs of health services used by American families and individuals, and how these services are paid for.(96) The surveys include data from families, individuals, doctors, hospitals, pharmacies, and employers across the United States. MEPS surveys include a household component (including additional information from health care providers) and an insurance component. Further information on MEPS can be found in Appendix 2. Investigators using this dataset include Dismuke et al.(92), Fields et al.(26), Chevarly et al.(91), Newacheck et al.(27), Romaire et al.(41, 42)
National Hospital Ambulatory Medical Care Survey (NHAMCS)
The National Hospital Ambulatory Medical Care Survey (NHAMCS) includes data on utilization and care provided in hospital emergency and outpatient departments and in ambulatory surgery centers. The hospital component of the survey includes data from a national probability sample of visits to emergency and outpatient departments and to ambulatory surgery facilities in non-institutional hospitals in all 50 States and the District of Columbia. The freestanding ambulatory surgery component includes data from a national probability sample of visits to ambulatory surgery centers in all 50 States and the District of Columbia. Data include demographic characteristics of patients, expected source(s) of
31

payment, patients' complaints, diagnoses, diagnostic/screening services, procedures, medication therapy, disposition, types of providers seen, causes of injury (emergency department and ambulatory surgery center only), and certain characteristics of the facility, such as geographic region and metropolitan status. See Appendix 3 for additional information on NHAMCS. Investigators using this dataset include Lee et al.(28), Lewis et al.(30, 31), Okunseri et al.(32-36), Wall(29),
Other National Databases
Other national datasets containing relevant health and dental care utilization data, including use of EDs for care, have also been used to explore various research questions. Flores and Tomany-Korman analyzed 2003-2004 National Survey of Children’s Health to examine racial/ethnic disparities in health and dental care.(43)
State Level Data/SourcesSome investigators, especially those connected to SOHPs, are more interested in state level data. These data may vary by availability and the content of datasets. To the extent that data are available and consistent across states, and similar methodology is employed, comparisons among states can be made. A common source of state level data is the state’s emergency room discharge database (SEDD).
State Emergency Department Databases (SEDD)The State Emergency Department Databases (SEDD) are part of the family of databases including software developed by the Healthcare Cost and Utilization Project (HCUP) The SEDD includes data on emergency visits at hospital emergency departments that do not result in hospitalization. Data on patients admitted to a hospital after an ED visit are included in the State Inpatient Databases (SID). The SEDD files include all ED patients regardless of payer, and include clinical and non-clinical data. Thirty-two states currently participate in SEDD. Further information on SEDD can be found in Appendix 4.
Other State Emergency Department Data SourcesStates that don’t participate in SEDD may still maintain and make available their own ED databases. Different researchers have used SEDD data or state ED databases to study ED dental care at the state level. Singhal et al. used California 2006-2011 SEDD data and Medicaid enrollment and reimbursement data from the California Department of Health Care Services in a study of the effects of changes in state Medicaid benefits.(55) Sun et al. used a combination of 2010 claims data from 45 of Oregon’s 60 hospitals (including all payer groups) and the Oregon Payer All Claims file (which includes procedure, prescription, repeat ED visits, and costs data not available in hospital supplied data), and also interviewed purposive samples of ED dental visitors and community stakeholders in six counties.(44) Anderson et al. studied ED use for non-traumatic dental care in New Hampshire using the New Hampshire Hospital Discharge dataset, focusing on ED visits not resulting in hospital admission.(87) Likewise, DeLia et al., in their study of ED dental care, used the New Jersey Discharge Data Collection System, which contains billing records for inpatient and ED care for all of the state’s hospitals.(93) Hom et al. used the North Carolina Emergency Room Discharge Database to investigate the relation of dental related ED visits to insurance mix of patient populations across North Carolina EDs.(45) Shortridge and
32

Moore used 2005 SEDD data from three states to assess similarities and differences in ED dental care among the states.(57)
Available state level datasets other than hospital ED discharge data also are used. Lee et al. used a combination of North Carolina birth records, Medicaid data, WIC files, and the area resource file in comparing North Carolina Medicaid children participating in WIC to those not participating in WIC for dental care access, dental procedures, and ED visits specifically for caries.(53) Wallace et al. analyzed a combination of data from before and after an elimination of Medicaid dental benefits, including Oregon Health Plan eligibility data, fee-for-service claims data, and encounter data from managed care organizations, as well as patient survey data in their research on changes in dental care utilization and accessing medical care settings for dental care among Oregon Medicaid patients.(56) Martin et al. used South Carolina Medicaid data in their study of dental care utilization for Medicaid children younger than four years.(46) Okunseri et al. used Wisconsin state Medicaid data combined with county Wisconsin DHPSA data and US Department of Agriculture Urban Influence Codes (a measure of county rurality) in their study of Medicaid dental treatment provided in EDs and physicians’ offices.(50) Pajewski and Okunseri did a similar analysis of Wisconsin Medicaid data focusing on adult Medicaid patients.(51) Medicaid data availability presents an opportunity for investigating ED access for dental care in the primary care sector as medical and dental data for Medicaid subjects can be linked. For example, follow-up dental care subsequent to ED visits for dental problems can be explored. When using state Medicaid data, issues related to Medicaid data analysis must be addressed, including changes in eligibility affecting numerator and denominator determination in calculation of rates, and the use of procedure codes instead of diagnostic codes in dental insurance data.
DeVoe et al. collected their own Oregon state level dataset of a demographic subpopulation, sending mail surveys to a sample of randomly selected families in the Oregon food stamp program.(54) Similarly, Kempe et al. surveyed a statewide random sample of Colorado Child Health Plan Plus (CHP+) enrollees to assess health access changes, including changes accessing dental care and EDs for health care, before to one year after enrollment.(52)
Local Level Data/SourcesMany studies have used administrative data or collected patient data in single hospitals or EDs.(7, 10-12, 67-76, 80, 81) Other local studies have used administrative data from a hospital system of two or more hospitals, or a group of hospital systems. Davis et al. analyzed hospital administrative data from five major hospital systems in the Minneapolis-St. Paul metropolitan area.(77) Fox et al. conducted chart reviews in a two-hospital system to study the effects of an instituted prescribing guideline on opioid prescribing for patients with oral pain complaints.(78) Other studies utilize smaller geographic areas within states. Roghmann and Goldman used emergency logs of Rochester, New York hospitals along with Medicaid data and ED patient interviews to explore the effects of a new neighborhood health center on ED dental emergency visits.(84) Feinglass et al. studied enrollees in Access DuPage, a healthcare program for low-income, uninsured residents of DuPage County, IL.(85) Hong et al. used the Kansas City, Missouri data subset from state 2001-2006 hospital discharge data in one study,(82) and combined 2001-2010 Kansas City hospital discharge data with the 2007-2011 American Community Survey 5-Year Estimates data to explore community level predictors in another study.(83) Lave et al.
33

used a random sample survey of new enrollees in Western Pennsylvania health insurance programs for low-income uninsured residents studying changes in health care access during the first year following enrollment.(86)
Diagnosis-Procedure Codes InvestigatedICD-9 diagnosis codes used in analysis provide for direct comparisons between research studies. There are definite variations in the strategies of codes used by researchers. One major difference is whether they are interested in any dentally related condition or procedure, or if they are interested in a subset of dental conditions/procedures. A fairly exhaustive range of dental/oral related ICD 9 codes and their descriptions are presented in Appendix 5.
Some investigators set out to investigate any dental care sought in non-dental settings [e.g. Cohen et al.(25), DeLia et al.(93), Hom et al.(45), Shortridge and Moore(57)], often using the entire range of ICD-9 codes 520-529.9. In their analysis of dental care seeking in medical settings by Oregon Medicaid enrollees, Wallace et al. used codes 521.00 – 523.99, 525.30 – 525.39, 525.90 – 525.99, 873.63, and 873.73 to define services for dental problems.(56) In one analysis of NAMCH data, Wall was interested in ED dental visits related to disorders of the teeth and jaws, using ICD-9 codes 520.00 – 526.99.(29) In another analysis of NEDS data, Wall and Vujicic expanded this definition to include ambulatory care sensitive dental conditions, using codes 520.0 – 526.9, 528.0 – 528.9, 784.92, V523, V534, V585, and V722.(24) Some investigators use an even broader range of dental/oral related codes to capture ED visits related to other oral problems such as oral injuries/trauma or TMJ problems. Hong et al. used codes for dental caries (520.1), other dental disease unspecified (521.2, 521.3, 522.0 – 522.9, 523, 525 – 529), TMJ disorders (524.6, 830.0 – 830.1, 848.1), and injuries to dentofacial structures (873.51, 873.53, 873.54, 873.63 – 873.69).(82) Neely et al. likewise used a wide range of ICD-9 codes that related to any condition of the teeth, mouth, jaw, face, or neck.(68)
Another major category includes researchers who are interested in access to non-dental settings for specific dental conditions that are readily prevented or definitively treated through regular traditional dental care, using a subset of dental codes. This latter category represents the more specific investigation of preventable dental conditions (NTDCs) addressed in EDs, which is the primary focus of this report.
Within this category many of the previously mentioned studies limited their research to specific ICD codes determined to identify NTDCs. Though often similar, the exact set of codes employed in analyses was often not the same. McCormick et al. used ICD-9 codes 520 to 526.99.(67) In defining NTDCs, Sun et al. used codes 520.0 – 520.9, 521.00 - 521.09, 522.0 - 522.9, 523.00 - 523.9, and 525.0 – 525.9.(44) Allareddy et al. used codes 521.00 - 521.09, 522.0 - 522.9, 523.00 - 523.9, 528.3.(21, 22) Anderson et al. used codes 521, 522, 523, 525, and 528.(87) Of note in the case of using code 525 is that 525.11 is for “loss of teeth due to trauma.” Unfortunately, some reports don’t include the specific codes used when indicating that they limited investigation to NTDCs.(72) Okunseri et al. used ICD-9 codes 521 – 521.9, 522 – 522.9, 523 – 523.9, 525.3, 525.9 in identifying NTDCs in several of their analyses of NHAMC survey data.(32-34, 36) Okunseri et al. added code 873.63 in identifying NTDCs in their Wisconsin Medicaid data study of NTDC treatment in EDs and physician offices.(50) Nakao et al. in identifying NTDCs for their
34

study used the same codes as the Okunseri Medicaid data study (codes 521 – 521.9, 522 – 522.9, 523 – 523.9, 525.3, 525.9, 873.63).(40) Of note is that both authors describe code 873.63 as “internal structures of mouth, without broken tooth,” but looking up the ICD-9 code revealed a definition of “broken or fractured tooth due to trauma without mention of complications.” Okunseri et al., in another report of ED treatment for NTDCs, defined NTDCs with a much broader definition including codes 520.0 - 521.9, 522.0 – 522.9, 523.0 – 523.9, 524.0 – 524.9, 525.0 - 525.6, 525.9, 526.0 -526.9, 527.0 – 527.0, 528.0 – 528.9, 529.0 – 529.9, and 873.63.(35) Singhal et al. defined dental visits to the ED using ICD-9 codes 521.00-521.99, 522.00-522.99, 523.00-523.99, 525.00-525.99, 528.00-528.99.(55) Though the investigators state that they were identifying visits with a “primary diagnosis of dental disease,” further explanation in the appendix shows they were focusing on non-traumatic dental conditions ideally seen in a dental office, but presenting at the ED likely due to lack of access to dental care. While Shortridge and Moore used codes 520-529.9 in their analysis of 2005 SEDD data from three states, they also created a subset of dental diagnosis codes considered preventable or severe, but didn’t provide the specific codes included in these subsets.(57)
Investigators interested in more specific diagnoses make use of a subset of NTDC related ICD-9 codes. Hayes et al. used codes related to dental infections (521.0 to 523.9 and 525.0 to 525.9) to identify patients presenting to EDs with dental infections in their study comparing ED patient receiving medications at ED discharge to those receiving only prescriptions.(74) Naliah et al. chose to focus specifically on caries related ED visits and only used ICD-9 codes 521.00 – 521.09.(23) Walker et al. also wanted to focus on dental caries related diagnoses, but chose to use codes 521.0 – 521.09, 522.0, 522.1, 525.13, 525.63, 525.64, and 527.3 (abscess of salivary gland).(37) Study authors and ICD-9 codes used in their research are summarized in Table 13.
Table 13: Authors and ICD-9 Codes Studied
Authors Local/Subpopulation Target PopulationCohen et al.(25) 520-529.9DeLia et al.(93) 520-529.9Hom et al.(45) 520-529.9Shortridge and Moore(57) 520-529.9Wallace et al.(56) 521.00 – 523.99, 525.30 – 525.39, 525.90 – 525.99, 873.63, 873.73Wall(29) 520.00 – 526.99Wall and Vujicic(24) 520.0 – 526.9, 528.0 – 528.9, 784.92, V523, V534, V585, V722Hong et al.(82) 520.1, 521.2, 521.3, 522.0 – 522.9, 523, 525 – 529, 524.6, 830.0 – 830.1,
848.1, 873.51, 873.53, 873.54, 873.63 – 873.69McCormick et al.(67) 520-526.99Sun et al.(44) 520.0 – 520.9, 521.00 - 521.09, 522.0 - 522.9, 523.00 - 523.9, 525.0 – 525.9Allareddy et al.(21, 22) 521.00 - 521.09, 522.0 - 522.9, 523.00 - 523.9, 528.3Anderson et al.(87) 521, 522, 523, 525, and 528.Okunseri et al.(32-34, 36) 521 – 521.9, 522 – 522.9, 523 – 523.9, 525.3, 525.9Okunseri et al.(50) 521 – 521.9, 522 – 522.9, 523 – 523.9, 525.3, 525.9, 873.63 Nakao et al.(40) 521 – 521.9, 522 – 522.9, 523 – 523.9, 525.3, 525.9, 873.63Okunseri et al.(35) 520.0 - 521.9, 522.0 – 522.9, 523.0 – 523.9, 524.0 – 524.9, 525.0 - 525.6,
525.9, 526.0 -526.9, 527.0 – 527.0, 528.0 – 528.9, 529.0 – 529.9, 873.63
35

Singhal et al.(55) 521.00-521.99, 522.00-522.99, 523.00-523.99, 525.00-525.99, 528.00-528.99
Hayes et al.(74) 521.0 to 523.9, 525.0 to 525.9Naliah et al.(23) 521.00 – 521.09Walker et al.(37) 521.0 – 521.09, 522.0, 522.1, 525.13, 525.63, 525.64, 527.3
The NHAMCS national probability survey of U. S. hospital EDs has its own set of codes for a “reason for visit” variable that was used to identify ED visits for dental care. Lee et al. used codes 1500.0 (symptoms of teeth and gums), 1500.1 (toothache), 1500.2 (gum pain), and 1500.3 (bleeding gums) to identify ED visits for dental care for this “reason for visit” variable, in part because of problems in physician use of ICD-9 dental codes. Lewis used NHAMCS data to determine national rates and predictors of ED dental use in one study,(30) and then reported comparisons, trends, and predictors of ED dental use by young adults compared to other ED users,(31) focusing on codes 1500.0 and 1500.1.
Positive Aspects of Research Data and Methodology
The most positive aspect of research on ED use for oral problems is that it is being done, and being done fairly widely. There is an abundance of research and reports from local, state, and national levels. Researchers have investigated a wide variety of research questions including different aspects of care, costs, target populations and population subgroups, predictors, etc. There have been studies of both traumatic and non–traumatic reasons for dental care in EDs. When investigating presenting conditions, researchers have generally used different sets of ICD-9-CM codes. Though there is variation in the codes used to define conditions of interest, this variation is somewhat small, with the major differences relating primarily to whether trauma related oral conditions are included. Some codes are not used frequently and likely have a small impact on comparability of results between studies.
Problematic Aspects of Research Data and Methodology
The problematic aspects of research methods addressing ED use for oral problems primarily relate to inconsistencies across studies. To some extent methodology will vary depending on the interests of the researchers. Researchers vary in their populations of interest, definition of ED treatments they are concerned about, the predictors of ED use they want to investigate, and factors related to potentially effective intervention strategies. Some of this variation may be due to low interest among researchers to simply determine rates and costs of ED dental care, and high interest in exploring unique and unstudied relationships of outcomes and predictors.
Another problematic aspect of research is coding at the EDs. Studies have assessed oral health training and knowledge, or lack thereof, of medical professionals providing care in EDs. Dentists are rarely on staff in EDs. Physicians typically address the presenting symptoms of pain and infection, often without a
36

good understanding of the causes and appropriate treatment of the oral problems underlying these symptoms. Care usually involves providing prescriptions for pain medications and/or antibiotics, along with advice to see a dentist. This lack of ability to precisely determine the nature of the oral problem is reflected in part by use of the ICD code “dental disorder unspecified” (ICD-9 code 525.9, also related codes 521.8, 521.9, and 525.8), the most commonly used dental related code in hospital ED data. When more specific dental codes are used, they may be used inaccurately due to ED physicians’ lack of oral health knowledge. The problem of inaccurate and imprecise ICD-9 dental code use by physicians was pointed out by Lee et al. explaining their use of NHAMCS “reason for visit” codes instead of ICD-9 codes.(28) There is no easy way to address these issues.
Another code related issue is the variation in codes used by different researchers in different studies. The major difference in selected dental codes is whether there is interest in all dental related ED visits or interest in ED dental visits specifically related to conditions that might be preventable through regular dental care access, or NTDCs. However, even when researchers indicate an interest in all dental related visits or in NTDC visits, there still is variation in the codes used within these two defined categories. This lack of standardized code use can affect the comparability between studies.
Another problem associated with many available datasets is that identifiers are often associated with an ED visit, not a specific person. The result is that records for a person cannot be linked. Without knowing if a specific ED visit is for a first-time or a repeat patient, the extent of repeat visits to the ED for the same oral problem cannot be quantified. This was pointed out as a shortcoming in NHAMCS by Lee et al.(28) As much of the perceived problem with ED dental care is usually non-definitive treatment, and symptoms are addressed but the source of the problem is not resolved, a major shortcoming exists in our ability to assess unnecessary treatment and costs that would potentially not occur if there was a source of regular dental care, or at least some level of definitive treatment for those presenting at EDs.
A related problem is the inability to link medical and ED data for a given patient to dental claims data, hindering the ability to explore follow-up dental care in the primary care dental setting after ED visits for oral problems, and the impact of regular dental care on dental related ED visit rates. The utility of linked medical and dental data even when linking is possible is limited by the long-standing use of treatment codes rather than diagnostic codes in dentistry. However, initiatives for developing and implementing dental diagnostic codes, developing and promoting use of electronic health and dental records, and for linking medical and dental data are ongoing.
Some variability in research findings is introduced because some researchers limit their analyses to ED care resulting in discharge; some include ED care resulting in hospital admission; others limit their investigation to only ED treatment for oral conditions that result in hospital admission.
37

Summary and Conclusions
While many researchers have studied dental related ED care, there is a great deal of variation in target populations and different aspects of study methods. Study populations vary from the local to national level and are sometimes limited to subpopulations based on patient characteristics or certain care processes or outcomes. Research questions and outcomes of interest vary from general assessments of access to dental; care to specific rates, changes, or trends in ED usage for NTDCs. Studied predictive factors include basic demographics, insurance, environmental factors, other concurrent health conditions, and changes in dental care coverage or policies. Data sources also vary, though some national and state datasets are commonly used. Diagnostic codes used and the specific analysis methods employed also vary substantially, even when investigators were supposedly studying the same defined oral conditions. Although some problems with ED oral care research will be difficult to address, such as non-specific and incorrect use of oral diagnosis codes by physicians, efforts to develop and promote more standardized methods of study should be undertaken, especially in the area of basic surveillance.
Recommendations
General Recommendations Thoroughly define specific study populations to determine the presence and extent of the
problem and for whom effective interventions can be implemented. Assess data sources to determine if the required information for the study population and
research question(s) of interest are included. Establish whether a problem exists and quantify the size of the problem as the first stage of any
study of predictive factors or interventions. Identify and promote research of specific risk or predictive factors that will aid in determining
what types of interventions might be most effectively implemented or best targeted. Develop sets of codes and analysis methods that will most appropriately answer research
questions with the underlying motivation of standardizing methods to the extent possible to allow for comparison to other studies on other populations.
Promote specific code sets and guidelines for analysis methods for commonly used datasets in determining NTDC or general dental ED visit count and proportion outcomes to establish the extent of the problem, and to standardize basic data collection for surveillance.
Encourage inclusion of commonly identified, associated predictive factors that will help determine effective intervention strategies and promote basic levels of consistency across studies, while also accounting for possible confounding effects in studies of additional predictive factors.
Encourage specific research on ED use for NTDCs, which includes the majority of unnecessary visits and costs, and could most effectively be addressed in the primary dental care setting.
38
Recommendations Specific to States Thoroughly define whether the research or surveillance is for the entire state population or for a
specific state sub-population of interest to determine the presence and extent of the problem, and for whom effective interventions could be implemented.
Assess data sources to determine if the required information for the target population and research question(s) of interest are included. If the state is part of the SEDD system, there should be some consistency in data with other states in SEDD. If the state is not in the SEDD system, research should determine if there is a sufficient data source to investigate ED dental care and how consistent the data source is with SEDD?
Establish whether a problem exists and quantify the size of the problem as a first stage of any investigation of predictive factors or interventions; this should be a part of state level oral health surveillance.
Identify and promote research on use of specific risk or predictive factors that will aid in determining what types of interventions might be most effectively implemented or best targeted.
Develop standardized sets of codes and analysis methods providing appropriate basic ED dental use data for state oral health surveillance systems and for state data submission to a national data repository for tracking national ED dental care, allowing for comparability across states. Additional optional data analyses can be conducted by states as desired.
Promote standardized sets of codes and guidelines for analysis methods for commonly used state level datasets in determining NTDC and general dental ED visit data as part of standardized state and national oral health surveillance systems. Specifically explore further use of Medicaid data for tracking ED dental care in this population.
Encourage inclusion of commonly identified associated predictive factors that will help determine effective intervention strategies and promote basic levels of consistency across studies, while also accounting for possible confounding effects in studies of additional predictive factors.
Encourage specific research on ED use for NTDCs, which includes the majority of unnecessary visits and costs, and could most effectively be addressed with state and local level interventions, and data used to promote support and resources for such intervention programs.
References
1. States PEWCot. A Costly Dental Destination: Hospital Care Means States Pay Dearly: Pew Center on the States; 2012 Feb 2012.2. Aston G. Easing the bite on the ED. Trustee : the journal for hospital governing boards. 2013;66(10):13-4, 9, 1.3. Nalliah RP, Allareddy V, Allareddy V. Dentists in the US should be integrated into the hospital team. British dental journal. 2014;216(7):391-2.4. Newton MF, Keirns CC, Cunningham R, Hayward RA, Stanley R. Uninsured adults presenting to US emergency departments: assumptions vs data. Jama. 2008;300(16):1914-24.5. Cohen LA, Harris SL, Bonito AJ, Manski RJ, Macek MD, Edwards RR, et al. Low-income and minority patient satisfaction with visits to emergency departments and physician offices for dental problems. The Journal of the American College of Dentists. 2009;76(3):23-31.
39

6. Cohen LA. The role of non-dental health professionals in providing access to dental care for low-income and minority patients. Dental clinics of North America. 2009;53(3):451-68.7. Oliva MG, Kenny DJ, Ratnapalan S. Nontraumatic dental complaints in a pediatric emergency department. Pediatric emergency care. 2008;24(11):757-60.8. Verma S, Chambers I. Dental emergencies presenting to a general hospital emergency department in Hobart, Australia. Australian dental journal. 2014;59(3):329-33.9. Whyman RA, Mahoney EK, Morrison D, Stanley J. Potentially preventable admissions to New Zealand public hospitals for dental care: a 20-year review. Community dentistry and oral epidemiology. 2014;42(3):234-44.10. Cachovan G, Phark JH, Schon G, Pohlenz P, Platzer U. Odontogenic infections: an 8-year epidemiologic analysis in a dental emergency outpatient care unit. Acta odontologica Scandinavica. 2013;71(3-4):518-24.11. Currie CC, Stone SJ, Durham J. Pain and problems: a prospective cross-sectional study of the impact of dental emergencies. Journal of oral rehabilitation. 2015.12. Patel KK, Driscoll P. Dental knowledge of accident and emergency senior house officers. Emergency medicine journal : EMJ. 2002;19(6):539-41.13. Trivedy C, Kodate N, Ross A, Al-Rawi H, Jaiganesh T, Harris T, et al. The attitudes and awareness of emergency department (ED) physicians towards the management of common dentofacial emergencies. Dental traumatology : official publication of International Association for Dental Traumatology. 2012;28(2):121-6.14. Ryan P, McMahon G. Severe dental infections in the emergency department. European journal of emergency medicine : official journal of the European Society for Emergency Medicine. 2012;19(4):208-13.15. Quinonez C. Self-reported emergency room visits for dental problems. International journal of dental hygiene. 2011;9(1):17-20.16. Quinonez C, Figueiredo R, Locker D. Disability days in Canada associated with dental problems: a pilot study. International journal of dental hygiene. 2011;9(2):132-5.17. Quinonez C, Gibson D, Jokovic A, Locker D. Emergency department visits for dental care of nontraumatic origin. Community dentistry and oral epidemiology. 2009;37(4):366-71.18. Quinonez C, Gibson D, Jokovic A, Locker D. Day surgery visits for dental problems. Community dentistry and oral epidemiology. 2009;37(6):562-7.19. Quinonez C, Ieraci L, Guttmann A. Potentially preventable hospital use for dental conditions: implications for expanding dental coverage for low income populations. Journal of health care for the poor and underserved. 2011;22(3):1048-58.20. Ramraj CC, Quinonez CR. Emergency room visits for dental problems among working poor Canadians. Journal of public health dentistry. 2013;73(3):210-6.21. Allareddy V, Rampa S, Lee MK, Allareddy V, Nalliah RP. Hospital-based emergency department visits involving dental conditions: profile and predictors of poor outcomes and resource utilization. Journal of the American Dental Association (1939). 2014;145(4):331-7.22. Allareddy V, Nalliah RP, Haque M, Johnson H, Rampa SB, Lee MK. Hospital-based emergency department visits with dental conditions among children in the United States: nationwide epidemiological data. Pediatric dentistry. 2014;36(5):393-9.23. Nalliah RP, Allareddy V, Elangovan S, Karimbux N, Allareddy V. Hospital based emergency department visits attributed to dental caries in the United States in 2006. The journal of evidence-based dental practice. 2010;10(4):212-22.24. Wall T, Vujicic, M. Emergency department use for dental conditions continues to increase. Research Brief. Health Policy Institute, 2015.
40

25. Cohen LA, Manski RJ. Visits to non-dentist health care providers for dental problems. Family medicine. 2006;38(8):556-64.26. Fields BE, Bell JF, Moyce S, Bigbee JL. The impact of insurance instability on health service utilization: does non-metropolitan residence make a difference? The Journal of rural health : official journal of the American Rural Health Association and the National Rural Health Care Association. 2015;31(1):27-34.27. Newacheck PW, Kim SE. A national profile of health care utilization and expenditures for children with special health care needs. Archives of pediatrics & adolescent medicine. 2005;159(1):10-7.28. Lee HH, Lewis CW, Saltzman B, Starks H. Visiting the emergency department for dental problems: trends in utilization, 2001 to 2008. American journal of public health. 2012;102(11):e77-83.29. Wall T. Recent trends in dental emergency department visits in the United States:1997/1998 to 2007/2008. Journal of public health dentistry. 2012;72(3):216-20.30. Lewis C, Lynch H, Johnston B. Dental complaints in emergency departments: a national perspective. Annals of emergency medicine. 2003;42(1):93-9.31. Lewis CW, McKinney CM, Lee HH, Melbye ML, Rue TC. Visits to US emergency departments by 20- to 29-year-olds with toothache during 2001-2010. Journal of the American Dental Association (1939). 2015;146(5):295-302.e2.32. Okunseri C, Okunseri E, Chilmaza CA, Harunani S, Xiang Q, Szabo A. Racial and ethnic variations in waiting times for emergency department visits related to nontraumatic dental conditions in the United States. Journal of the American Dental Association (1939). 2013;144(7):828-36.33. Okunseri C, Okunseri E, Fischer MC, Sadeghi SN, Xiang Q, Szabo A. Nontraumatic dental condition-related visits to emergency departments on weekdays, weekends and night hours: findings from the National Hospital Ambulatory Medical Care survey. Clinical, cosmetic and investigational dentistry. 2013;5:69-76.34. Okunseri C, Okunseri E, Thorpe JM, Xiang Q, Szabo A. Medications prescribed in emergency departments for nontraumatic dental condition visits in the United States. Medical care. 2012;50(6):508-12.35. Okunseri C, Okunseri E, Thorpe JM, Xiang Q, Szabo A. Patient characteristics and trends in nontraumatic dental condition visits to emergency departments in the United States. Clinical, cosmetic and investigational dentistry. 2012;4:1-7.36. Okunseri C, Okunseri E, Xiang Q, Thorpe JM, Szabo A. Prescription of opioid and nonopioid analgesics for dental care in emergency departments: Findings from the National Hospital Ambulatory Medical Care Survey. Journal of public health dentistry. 2014;74(4):283-92.37. Walker A, Probst JC, Martin AB, Bellinger JD, Merchant A. Analysis of hospital-based emergency department visits for dental caries in the United States in 2008. Journal of public health dentistry. 2014;74(3):188-94.38. Laurence B, Haywood C, Jr., Lanzkron S. Dental infections increase the likelihood of hospital admissions among adult patients with sickle cell disease. Community dental health. 2013;30(3):168-72.39. Laurence B, Mould-Millman NK, Scannapieco FA, Abron A. Hospital admissions for pneumonia more likely with concomitant dental infections. Clinical oral investigations. 2015;19(6):1261-8.40. Nakao S, Scott JM, Masterson EE, Chi DL. Non-traumatic Dental Condition-Related Emergency Department Visits and Associated Costs for Children and Adults with Autism Spectrum Disorders. Journal of autism and developmental disorders. 2014.41. Romaire MA, Bell JF, Grossman DC. Health care use and expenditures associated with access to the medical home for children and youth. Medical care. 2012;50(3):262-9.42. Romaire MA, Bell JF, Grossman DC. Medical home access and health care use and expenditures among children with special health care needs. Archives of pediatrics & adolescent medicine. 2012;166(4):323-30.
41

43. Flores G, Tomany-Korman SC. Racial and ethnic disparities in medical and dental health, access to care, and use of services in US children. Pediatrics. 2008;121(2):e286-98.44. Sun BC, Chi DL, Schwarz E, Milgrom P, Yagapen A, Malveau S, et al. Emergency department visits for nontraumatic dental problems: a mixed-methods study. American journal of public health. 2015;105(5):947-55.45. Hom JM, Burgette LF, Lee JY. The effect of North Carolina hospital payor mix on dental-related pediatric emergency room utilization. Journal of public health dentistry. 2013;73(4):289-96.46. Martin AB, Vyavaharkar M, Veschusio C, Kirby H. Rural-urban differences in dental service utilization among an early childhood population enrolled in South Carolina Medicaid. Maternal and child health journal. 2012;16(1):203-11.47. Cohen LA, Bonito AJ, Eicheldinger C, Manski RJ, Edwards RR, Khanna N. Health literacy impact on patient-provider interactions involving the treatment of dental problems. Journal of dental education. 2011;75(9):1218-24.48. Cohen LA, Bonito AJ, Eicheldinger C, Manski RJ, Macek MD, Edwards RR, et al. Comparison of patient visits to emergency departments, physician offices, and dental offices for dental problems and injuries. Journal of public health dentistry. 2011;71(1):13-22.49. Cohen LA, Magder LS, Manski RJ, Mullins CD. Hospital admissions associated with nontraumatic dental emergencies in a Medicaid population. The American journal of emergency medicine. 2003;21(7):540-4.50. Okunseri C, Pajewski NM, Brousseau DC, Tomany-Korman S, Snyder A, Flores G. Racial and ethnic disparities in nontraumatic dental-condition visits to emergency departments and physician offices: a study of the Wisconsin Medicaid program. Journal of the American Dental Association (1939). 2008;139(12):1657-66.51. Pajewski NM, Okunseri C. Patterns of dental service utilization following nontraumatic dental condition visits to the emergency department in Wisconsin Medicaid. Journal of public health dentistry. 2014;74(1):34-41.52. Kempe A, Beaty BL, Crane LA, Stokstad J, Barrow J, Belman S, et al. Changes in access, utilization, and quality of care after enrollment into a state child health insurance plan. Pediatrics. 2005;115(2):364-71.53. Lee JY, Rozier RG, Norton EC, Kotch JB, Vann WF, Jr. Effects of WIC participation on children's use of oral health services. American journal of public health. 2004;94(5):772-7.54. DeVoe JE, Krois L, Stenger R. Do children in rural areas still have different access to health care? Results from a statewide survey of Oregon's food stamp population. The Journal of rural health : official journal of the American Rural Health Association and the National Rural Health Care Association. 2009;25(1):1-7.55. Singhal A, Caplan DJ, Jones MP, Momany ET, Kuthy RA, Buresh CT, et al. Eliminating Medicaid adult dental coverage in California led to increased dental emergency visits and associated costs. Health affairs (Project Hope). 2015;34(5):749-56.56. Wallace NT, Carlson MJ, Mosen DM, Snyder JJ, Wright BJ. The individual and program impacts of eliminating Medicaid dental benefits in the Oregon Health Plan. American journal of public health. 2011;101(11):2144-50.57. Shortridge EF, Moore JR. Use of emergency departments for conditions related to poor oral healthcare: implications for rural and low-resource urban areas for three states. Journal of public health management and practice : JPHMP. 2009;15(3):238-45.58. The Maryland Oral Health Surveillance Digest. Maryland Department of Health and Mental Hygiene; 2013.59. Ambulatory Care Sensitive Emergency Department Visits; Chronic Disease Conditions, New Hampshire, 2001-2005. New Hampshire Division of Public Health Services; 2010.
42
60. Utilization of Ohio Emergency Departments to Treat Dental Problems, 2010-2011. Ohio Department of Health; 2013.61. Massachusetts' Emergency Departments and Preventable Adult Oral Health Conditions: Utilization, Impact and Missed Opportunities (2008-2011). Massachusetts Center for Health Information and Analysis; 2012.62. Hawaii Oral Health: Key Findings. Hawaii State Department of Health; 2013.63. Oh J, Leonard L. Hospital emergency department visits for non-traumatic oral health conditions among Rhode Island adults age 21-64 years, 2006-2010. Medicine and health, Rhode Island. 2012;95(11):367-9.64. Oral Health Fact Sheet: Emergency Department Utilization for Dental Complaints, Missouri 1994-2013. Missouri Department of Health and Senior Services; 2015.65. The Cost of Dental-Related Emergency Room Visits in Michigan. 2014.66. Adult Emergency Oral Health Care 2008. Tennessee Department of Health; 2009.67. McCormick AP, Abubaker AO, Laskin DM, Gonzales MS, Garland S. Reducing the burden of dental patients on the busy hospital emergency department. Journal of oral and maxillofacial surgery : official journal of the American Association of Oral and Maxillofacial Surgeons. 2013;71(3):475-8.68. Neely M, Jones JA, Rich S, Gutierrez LS, Mehra P. Effects of cuts in Medicaid on dental-related visits and costs at a safety-net hospital. American journal of public health. 2014;104(6):e13-6.69. Hardie TL, Polek C, Wheeler E, McCamant K, Dixson M, Gailey R, et al. Characterising emergency department high-frequency users in a rural hospital. Emergency medicine journal : EMJ. 2015;32(1):21-5.70. Waldrop RD, Ho B, Reed S. Increasing frequency of dental patients in the urban ED. The American journal of emergency medicine. 2000;18(6):687-9.71. McCormick D, Sayah A, Lokko H, Woolhandler S, Nardin R. Access to care after Massachusetts' health care reform: a safety net hospital patient survey. Journal of general internal medicine. 2012;27(11):1548-54.72. Dorfman DH, Kastner B, Vinci RJ. Dental concerns unrelated to trauma in the pediatric emergency department: barriers to care. Archives of pediatrics & adolescent medicine. 2001;155(6):699-703.73. Ferayorni A, Sinha M, McDonald FW. Health issues among foreign born uninsured children visiting an inner city pediatric emergency department. Journal of immigrant and minority health / Center for Minority Public Health. 2011;13(3):434-44.74. Hayes BD, Zaharna L, Winters ME, Feemster AA, Browne BJ, Hirshon JM. To-Go medications for decreasing ED return visits. The American journal of emergency medicine. 2012;30(9):2011-4.75. Patel R, Miner JR, Miner SL. The need for dental care among adults presenting to an urban ED. The American journal of emergency medicine. 2012;30(1):18-25.76. Stevens TB, Richmond NL, Pereira GF, Shenvi CL, Platts-Mills TF. Prevalence of nonmedical problems among older adults presenting to the emergency department. Academic emergency medicine : official journal of the Society for Academic Emergency Medicine. 2014;21(6):651-8.77. Davis EE, Deinard AS, Maiga EW. Doctor, my tooth hurts: the costs of incomplete dental care in the emergency room. Journal of public health dentistry. 2010;70(3):205-10.78. Fox TR, Li J, Stevens S, Tippie T. A performance improvement prescribing guideline reduces opioid prescriptions for emergency department dental pain patients. Annals of emergency medicine. 2013;62(3):237-40.79. Weiner SG, Griggs CA, Mitchell PM, Langlois BK, Friedman FD, Moore RL, et al. Clinician impression versus prescription drug monitoring program criteria in the assessment of drug-seeking behavior in the emergency department. Annals of emergency medicine. 2013;62(4):281-9.
43

80. Grover CA, Close RJ, Wiele ED, Villarreal K, Goldman LM. Quantifying drug-seeking behavior: a case control study. The Journal of emergency medicine. 2012;42(1):15-21.81. Grover CA, Elder JW, Close RJ, Curry SM. How Frequently are "Classic" Drug-Seeking Behaviors Used by Drug-Seeking Patients in the Emergency Department? The western journal of emergency medicine. 2012;13(5):416-21.82. Hong L, Ahmed A, McCunniff M, Liu Y, Cai J, Hoff G. Secular trends in hospital emergency department visits for dental care in Kansas City, Missouri, 2001-2006. Public health reports (Washington, DC : 1974). 2011;126(2):210-9.83. Hong L, Liu Y, Hottel TL, Hoff GL, Cai J. Neighborhood socio-economic context and emergency department visits for dental care in a U.S. Midwestern metropolis. Public health. 2015;129(3):252-7.84. Roghmann KJ, Goldberg HJ. Effect of Rochester neighborhood health center on hospital dental emergencies. Medical care. 1974;12(3):251-9.85. Feinglass J, Nonzee NJ, Murphy KR, Endress R, Simon MA. Access to care outcomes: a telephone interview study of a suburban safety net program for the uninsured. Journal of community health. 2014;39(1):108-17.86. Lave JR, Keane CR, Lin CJ, Ricci EM, Amersbach G, LaVallee CP. Impact of a children's health insurance program on newly enrolled children. Jama. 1998;279(22):1820-5.87. Anderson L, Cherala S, Traore E, Martin NR. Utilization of Hospital Emergency Departments for non-traumatic dental care in New Hampshire, 2001-2008. Journal of community health. 2011;36(4):513-6.88. Chi DL, Masterson EE. A serial cross-sectional study of pediatric inpatient hospitalizations for non-traumatic dental conditions. Journal of dental research. 2013;92(8):682-8.89. Chi DL, Masterson EE, Wong JJ. U.S. emergency department admissions for nontraumatic dental conditions for individuals with intellectual and developmental disabilities. Intellectual and developmental disabilities. 2014;52(3):193-204.90. Becker DJ, Blackburn J, Morrisey MA, Sen B, Kilgore ML, Caldwell C, et al. Enrollment, expenditures, and utilization after CHIP expansion: evidence from Alabama. Academic pediatrics. 2015;15(3):258-66.91. Chevarley FM, Owens PL, Zodet MW, Simpson LA, McCormick MC, Dougherty D. Health care for children and youth in the United States: annual report on patterns of coverage, utilization, quality, and expenditures by a county level of urban influence. Ambulatory pediatrics : the official journal of the Ambulatory Pediatric Association. 2006;6(5):241-64.92. Dismuke CE, Egede LE. Association of serious psychological distress with health services expenditures and utilization in a national sample of US adults. General hospital psychiatry. 2011;33(4):311-7.93. DeLia D, Lloyd K, Feldman CA, Cantor JC. Patterns of emergency department use for dental and oral health care: implications for dental and medical care coordination. Journal of public health dentistry. 2015.94. Higbea RJ, Palumbo CH, Pearl SA, Byrne MJ, Wise J. Dentists' partnership of Michigan's Calhoun County: a care model for uninsured populations. Health affairs (Project Hope). 2013;32(9):1646-51.95. Quality AfHRa. Overview of the Nationwide Emergency Department Sample (NEDS): Agency for Healthcare Research and Quality; December 2014 [August 9, 2015]. Available from: https://www.hcup-us.ahrq.gov/nedsoverview.jsp.96. Quality AfHRa. Medical Expenditure Panel Survey: Survey Background: Agency for Healthcare Research and Quality; 2009 [cited 2015]. Available from: http://meps.ahrq.gov/mepsweb/about_meps/survey_back.jsp.
44