table of contents 1.0 introduction
TRANSCRIPT
TABLE OF CONTENTS
1.0 INTRODUCTION ...........................................................................................1 1.1 Goals and Purpose of Study.................................................................................................................. 2 1.2 Summary Recommendations................................................................................................................ 2 1.3 General Site Description ....................................................................................................................... 3
2.0 BUILDING BLOCKS .....................................................................................6 2.1 Land Use, Zoning, and Entitlements.................................................................................................... 6
2.1.1 Existing Land Use............................................................................................................................. 6 2.1.2 Future Land Use .............................................................................................................................. 9 2.1.3 Zoning............................................................................................................................................ 13 2.1.4 Adjacent Local Governments ........................................................................................................ 16 2.1.5 Ownership Patterns ........................................................................................................................ 18 2.1.6 Committed Projects ........................................................................................................................ 20 2.1.7 Publicly Owned Lands and Conservation Easements .................................................................... 22 2.1.8 Historic Sites or Cultural Resources .............................................................................................. 24
2.2 Infrastructure ...................................................................................................................................... 24 2.2.1 Transportation System ................................................................................................................... 24 2.2.2 Sewer, Wastewater Treatment, and Reuse..................................................................................... 28 2.2.3 Water Supply and Alternative Water Sources ............................................................................... 34 2.2.4 Drainage and Drainage Basins....................................................................................................... 38 2.2.5 Telecommunication ....................................................................................................................... 40 2.2.6 Power ............................................................................................................................................. 40 2.2.7 Natural Gas .................................................................................................................................... 40 2.2.8 Solid Waste.................................................................................................................................... 40
2.3 Environmental ..................................................................................................................................... 42 2.3.1 Ecological Resources..................................................................................................................... 42 2.3.2 Land Use/Vegetative Cover........................................................................................................... 43 2.3.3 Wetlands ........................................................................................................................................ 47 2.3.4 Areas of Conservation Interest....................................................................................................... 50 2.3.5 Protected Species and Biodiversity Hot Spots ............................................................................... 50 2.3.6 Conservation Areas........................................................................................................................ 61 2.3.7 Strategic Habitat Conservation Areas ............................................................................................ 64 2.3.8 Econlockhatchee River Protection Area ........................................................................................ 69 2.3.9 Known Superfund and Petroleum Clean-up Sites.......................................................................... 71 2.3.10 Floodplains .................................................................................................................................. 71 2.3.11 Topography.................................................................................................................................. 72 2.3.12 Soils ............................................................................................................................................. 72 2.3.13 Special Water Quality Protection Corridors ................................................................................ 77
2.4 Economic Development Analysis........................................................................................................ 80 2.4.1 Demographic Profile...................................................................................................................... 80 2.4.2 Existing Resources......................................................................................................................... 84 2.4.3 Business Survey............................................................................................................................. 94 2.4.4 Schools........................................................................................................................................... 99
3.0 PLAN DEVELOPMENT.............................................................................102 3.1 Plan Development Foundations........................................................................................................ 102 3.2 Public Input........................................................................................................................................ 102 3.3 Surrounding Land Uses .................................................................................................................... 105
3.3.1 International Airport .................................................................................................................... 105 3.3.2 The University of Central Florida................................................................................................ 106

3.3.3 Central Florida Research Park ..................................................................................................... 106 3.3.4 Valencia Community College...................................................................................................... 107 3.3.6 Existing DRIs............................................................................................................................... 108
3.4 Green Development – The Starting Point........................................................................................ 108 3.4.1 An Introduction to Green Development....................................................................................... 108 3.4.2 Responsible Greenfield Development ......................................................................................... 109 3.4.3 Integrating Green Development Ideas ......................................................................................... 110
3.5 High Tech Industry and the Research Park.................................................................................... 110 3.5.1 Keys to a Successful High Technology Corridor......................................................................... 111 3.5.2 High-tech Site Selection Criteria ................................................................................................. 114
4.0 MASTER PLANNING ................................................................................124 4.1 Five Scenarios .................................................................................................................................... 125
4.1.1 Scenario One: Current Trends ..................................................................................................... 125 4.1.2 Yield for Scenario One Current Trends ....................................................................................... 128 4.1.3 Scenario Two: Compact Edge ..................................................................................................... 128 4.1.4 Yield for Compact Edge .............................................................................................................. 132 4.1.5 Scenario Three Village ................................................................................................................ 134 4.1.6 Yield for Scenario Three Village................................................................................................. 138 4.1.7 Scenario Four Activity Village .................................................................................................... 141 4.1.8 Yield for Scenario Four Activity Village..................................................................................... 144 4.1.9 Scenario Five ............................................................................................................................... 147 4.1.10 Yield for Scenario Five............................................................................................................... 150
4.2 Absorption and Build-out ................................................................................................................. 152 4.3 School Impacts ................................................................................................................................... 155 4.4 Infrastructure Analysis ..................................................................................................................... 157
4.4.1 Water Demand ............................................................................................................................. 157 4.4.2 Wastewater Demand.................................................................................................................... 160 4.4.3 Reclaimed Water ......................................................................................................................... 162 4.4.4 Intermediate Utility Demands 5-year and 10-year Demand Projections...................................... 163 4.4.5 Physical Environmental Analysis ................................................................................................ 168
4.5 Transportation Analysis Summary Findings .................................................................................. 170 4.5.1 Existing Transportation Conditions ............................................................................................. 171 4.5.2 Existing Level of Service............................................................................................................. 173 4.5.3 Programmed and Planned Improvements .................................................................................... 176 4.5.4 Transportation Model .................................................................................................................. 181 4.5.5 Trip Generation............................................................................................................................ 181 4.5.6 Analysis of Future Year Travel Demand Projections .................................................................. 182 4.5.7 Internal Transportation System.................................................................................................... 206 4.5.8 Cost of Transportation Improvements ......................................................................................... 218 4.5.9 Conclusions ................................................................................................................................. 220
4.6 Scenario Evaluation........................................................................................................................... 221 4.6.1 Evaluation Criteria....................................................................................................................... 221 4.6.2 Scenario One Current Trends ...................................................................................................... 222 4.6.3 Scenario Two Compact Edge ...................................................................................................... 223 4.6.4 Scenario Three Village ................................................................................................................ 224 4.6.5 Scenario Four Activity Village .................................................................................................... 224 4.6.6 Scenario Five ............................................................................................................................... 224
4.7 Draft Principles and Master Planning Guidelines.......................................................................... 225 4.7.1 Goal 1: Provide Sufficient Land for a High Tech/High Value Corridor...................................... 225 4.7.2 Goal 2: Provide and Maintain Sufficient Entitlements and Infrastructure................................... 228 4.6.3 Goal 3: Recognize and Protect Ecological Systems and Corridors............................................. 230 4.7.4 Goal 4: Stimulate and Stabilize Orange County’s Long Term Economy and Employment Base with High Tech Sector ........................................................................................................................... 232

4.7.5 Goal 5: Ensure the Effectiveness and Efficiency of Government Services and Programs by Fostering Intergovernmental Coordination............................................................................................ 233 4.7.6 Goal 6: Design an Attractive High Quality Environment. Integrate High Technology Businesses with Communities Based on a Compact Development Pattern, Traditional Neighborhood Design, and Transit Oriented Design......................................................................................................................... 234
5.0 SUMMARY ................................................................................................236
6.0 APPENDIX.................................................................................................238
7.0 REFERENCE LIST ....................................................................................241

Orange County, Florida Innovation Way Economic Development & Environmental Resource Management Study
December 2005
1
1.0 INTRODUCTION In his 2005 State of the County speech Orange County Mayor Richard Crotty outlined a “Blueprint for Orange County’s Future”. This Blueprint included the vision of a high tech corridor in east Orange County stretching from the University of Central Florida to the Orlando International Airport. The high tech corridor is envisioned to follow the planned Alafaya Trail extension. Thus, the southeast quadrant of Orange County is at a threshold. While much of the area remains natural, interest in development increases. On a regional, county-wide, and sector scale, recent studies indicate that population, housing starts, and employment of Orange County will increase dramatically in the future (see “VII: Seven County Orlando Region” Penn Study 2005 by the University of Pennsylvania graduate students). As development increases so does pressure on the natural environment. Without responsible long term planning these increases could result in a continuation of a fragmented development pattern and imbalances in land use, which would in turn, continue an urban sprawl development pattern. A new highway, deemed “Innovation Way” will further intensify development interest in southeast Orange County. Rather than allow development to proceed in a disconnected and piece-meal fashion, Orange County elected to assume a proactive stance towards growth. The County seeks to expand within a master development framework which promotes economic growth, protects private property rights, and provides long term flexibility of land use. Innovation Way will serve as a “high tech/high value” corridor that will stimulate the development of high technology parks and clean industries that provide a balanced range of employment opportunities and incomes as well as promote greater economic diversity for the County and region as a whole. The concept of a high technology (high tech) corridor has already begun to take shape. The University of Central Florida with over 40,000 students (7,400 graduate students) and the Central Florida Research Park with 106 companies and 9,500 employees combine to provide a strong anchor to the north. It is anchored to the south by one of the busiest airports in Florida, the Orlando International Airport (OIA). This airport served over 31 million passengers in 2004 and employed 16,600; it is a major regional transportation hub, activity center, and economic generator of jobs and commerce. Underlying the opportunities and demands generated as a consequence of this growth is the apparent ecological sensitivity of the area that includes both the Econlockhatchee River and the St. John’s River and their collective tributaries. The ecological diversity of these community assets is well documented. The study by the University of Pennsylvania noted that, “land use decisions and water consumption in the region affect the entire state’s availability of water, quality of water, wildlife habitat”. This report intends to provide guidelines and policy recommendations for the successful implementation of the public vision for the area. Guidelines and recommendations are based on technical analysis including the following:
• Transportation • Economy and Employment
Orange County, Florida Innovation Way Economic Development & Environmental Resource Management Study
December 2005
2
• Ecological Systems Inventory and Analysis • Infrastructure (water, sewer, electric, telecommunications, etc.) • Land Use
In addition to technical analysis, input derived from three well attended community meetings hosted by Orange County over the summer and fall of 2005 influences this report. These meetings brought together property owners, environmental groups, planning consultants and engineers, developers, and other concerned citizens.
1.1 Goals and Purpose of Study In early July, 2005 the Board of County Commissioners of Orange County, Florida contracted with Ivey Planning Group, LLC and its subcontractors to develop the Innovation Way Economic Development & Environmental Resource Management Study for the Orange County Planning Division. This study focuses on the southeast region of Orange County, where recent growth pressures and infrastructure improvements along the west side of the Econlockhatchee River have opened the way for more intensive development. Although still predominantly rural and agricultural in character, this study will examine the potential for future development while preserving and protecting environmental resources. The study further examines the potential for the development of a high technology business corridor or “Innovation Way” stretching from the University of Central Florida to the Orlando International Airport in southeast Orange County. The goals of this study include identifying where and how growth may occur, to propose the appropriate environmental controls, and ensuring the promotion of high-technology industries for sustainable economic development.
1.2 Summary Recommendations This report makes a number of key recommendations regarding southeast Orange County, they include the following: 1. The County should establish a High Technology Corridor land use designation overlay for inclusion in the County Comprehensive Plan. The land use would promote high tech/high value land uses as the primary use, but would also require a mix of uses to include residential, retail, hotel, and institutional uses. 2. Implementation of the Plan Amendment should include specific policies requiring multimodal transportation encompassing pedestrian, bicycle, bus service and possibly rail. 3. The Plan Amendment should require implementation of design principles that will promote internal trip capture.

Orange County, Florida Innovation Way Economic Development & Environmental Resource Management Study
December 2005
3
4. The Plan Amendment should create opportunities for the County to acquire ecologically sensitive lands not currently in the public domain. Such acquisition could include fee simple purchases, acquisition of conservation easements, transfer of development rights, and the opportunity to increase intensities/densities of development in return for donation of valuable habitat similar to the Rural Land Stewardship Program authorized by Senate Bill 360 amendments to Chapter 163, Florida Statutes. 5. The location of Innovation Way should generally follow the alignment shown on Figure 1.3-1. Access to Innovation should be restricted to maintain its carrying capacity. Section 4.7 of the Study lists specific goals for any Plan Amendment that includes sustaining viable environmental communities during and after development of the Study Area, promotes the development of high tech/high value parks, protects roadway capacities by requiring multi-modal concepts in the design of developments, and provides housing of all types close to the Innovation Way Corridor.
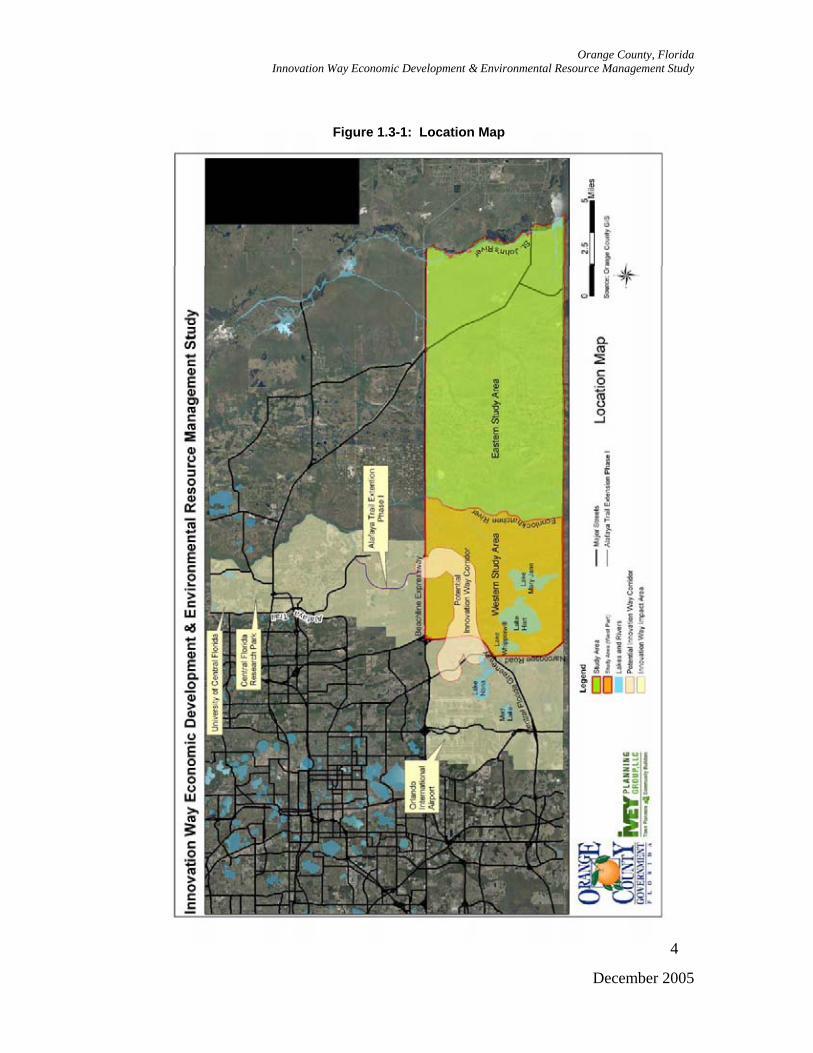
1.3 General Site Description The total area under study comprises approximately 97,000 acres located in the southeast area of Orange County (see Figure 1.3-1). The Econlockhatchee River divides the Study Area into two parts. The western part (approximately 32,000 acres) borders SR 417 on the west, the Beachline Expressway to the north, the Osceola–Orange County line on the south, and the Econ River on the east. The eastern part of the Study Area (approximately 65,000 acres) abuts the Econ River on the west, the Beachline Expressway on the north, the Osceola–Orange County line on the south and the Brevard-Orange County Line and the St. John’s River on the east. On Figure 1.3-1 the approximate location of the potential Innovation Way Corridor is located with a generalized buffer outline. A preliminary planned Alafaya Trail Extension would transverse the Innovation Way corridor buffer. Stemming from immediate growth opportunities and issues, the development recommendations of the Innovation Way Economic Development & Environmental Resource Management Study concentrate on the western part, hereafter referred to simply
Orange County, Florida Innovation Way Economic Development & Environmental Resource Management Study
December 2005
4
Figure 1.3-1: Location Map

Orange County, Florida Innovation Way Economic Development & Environmental Resource Management Study
December 2005
5
as the “Study Area”. Maps and analysis will focus on the western part, but may make specific reference when discussing either the eastern part or the total combined Study Area. The borders of the entire Study Area are graphically illustrated in Figure 1.3-1 as well as the outline for the western and eastern portions.

Orange County, Florida Innovation Way Economic Development & Environmental Resource Management Study
December 2005
6
2.0 BUILDING BLOCKS
2.1 Land Use, Zoning, and Entitlements
2.1.1 Existing Land Use The existing land use analysis of the Study Area is based on information provided by Orange County’s GIS data and information provided by the County’s Environmental Protection Division. In addition to the primary existing land use GIS data set, information concerning recorded conservation easements was obtained and mapped with GIS. Since the conservation easement data was not included with the County’s existing land use data, the conservation easement data was compared to the existing land use GIS data and then subtracted from this data set to account for conservation easements.
Eight general land use categories were found. The GIS data revealed a current land use pattern primarily composed of Rural/Agricultural uses (53%). The County’s conservation lands amounted to 25%, while water bodies took up 9%. Recorded
Figure 2.1.1-1: Proportion of Existing Land Use
53.08%
25.65%
9.66%
6.56%
3.48%
0.84%
0.70%
Rural/Agricultural
Conservation
Water Body
Conservation Easements
Residential
Institutional
Other (Industrial, Parks andRec, Commercial)
Source: Orange County GIS
Orange County, Florida Innovation Way Economic Development & Environmental Resource Management Study
December 2005
7
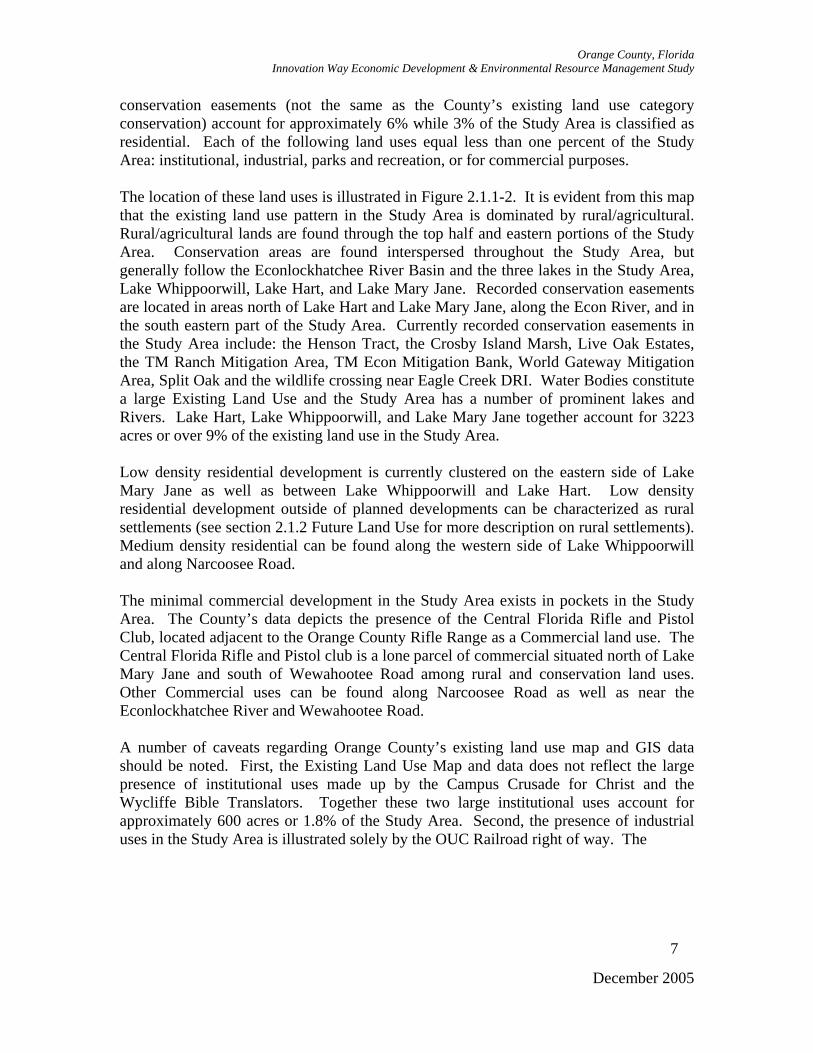
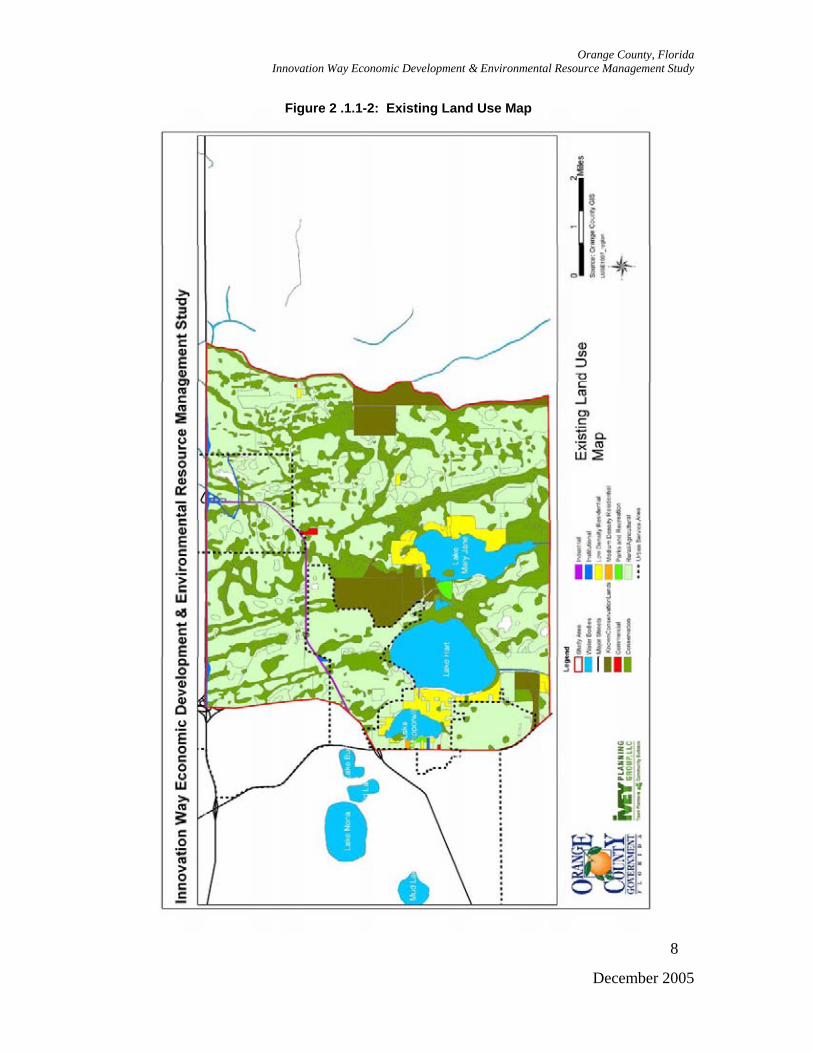
conservation easements (not the same as the County’s existing land use category conservation) account for approximately 6% while 3% of the Study Area is classified as residential. Each of the following land uses equal less than one percent of the Study Area: institutional, industrial, parks and recreation, or for commercial purposes. The location of these land uses is illustrated in Figure 2.1.1-2. It is evident from this map that the existing land use pattern in the Study Area is dominated by rural/agricultural. Rural/agricultural lands are found through the top half and eastern portions of the Study Area. Conservation areas are found interspersed throughout the Study Area, but generally follow the Econlockhatchee River Basin and the three lakes in the Study Area, Lake Whippoorwill, Lake Hart, and Lake Mary Jane. Recorded conservation easements are located in areas north of Lake Hart and Lake Mary Jane, along the Econ River, and in the south eastern part of the Study Area. Currently recorded conservation easements in the Study Area include: the Henson Tract, the Crosby Island Marsh, Live Oak Estates, the TM Ranch Mitigation Area, TM Econ Mitigation Bank, World Gateway Mitigation Area, Split Oak and the wildlife crossing near Eagle Creek DRI. Water Bodies constitute a large Existing Land Use and the Study Area has a number of prominent lakes and Rivers. Lake Hart, Lake Whippoorwill, and Lake Mary Jane together account for 3223 acres or over 9% of the existing land use in the Study Area. Low density residential development is currently clustered on the eastern side of Lake Mary Jane as well as between Lake Whippoorwill and Lake Hart. Low density residential development outside of planned developments can be characterized as rural settlements (see section 2.1.2 Future Land Use for more description on rural settlements). Medium density residential can be found along the western side of Lake Whippoorwill and along Narcoosee Road. The minimal commercial development in the Study Area exists in pockets in the Study Area. The County’s data depicts the presence of the Central Florida Rifle and Pistol Club, located adjacent to the Orange County Rifle Range as a Commercial land use. The Central Florida Rifle and Pistol club is a lone parcel of commercial situated north of Lake Mary Jane and south of Wewahootee Road among rural and conservation land uses. Other Commercial uses can be found along Narcoosee Road as well as near the Econlockhatchee River and Wewahootee Road. A number of caveats regarding Orange County’s existing land use map and GIS data should be noted. First, the Existing Land Use Map and data does not reflect the large presence of institutional uses made up by the Campus Crusade for Christ and the Wycliffe Bible Translators. Together these two large institutional uses account for approximately 600 acres or 1.8% of the Study Area. Second, the presence of industrial uses in the Study Area is illustrated solely by the OUC Railroad right of way. The
Orange County, Florida Innovation Way Economic Development & Environmental Resource Management Study
December 2005
8
Figure 2 .1.1-2: Existing Land Use Map

Orange County, Florida Innovation Way Economic Development & Environmental Resource Management Study
December 2005
9
County’s data does not reflect the presence of other industrial uses located in International Corporate Park. The location of the Urban Service boundary is also indicated in Figure 2.1.1-2. The Urban Service Area generally extends into the Study Area to include four large Planned Development projects, previously approved as part of the DRI process (see section 2.1.6 Committed Projects of Significance). The remainder of the Study Area, largely the eastern half is excluded from the Urban Service Area.
2.1.2 Future Land Use The Growth Management Act of 1985 required all local governments within the State to adopt comprehensive plans which were to serve as a blueprint for the future. Each of these plans had to be adopted and approved by the State of Florida. Each plan had to include a land use element that identified all of the permissible land uses. In turn, each land use was mapped as part of this Future Land Use Element. Information for this analysis was taken from three data sources, Orange County’s Future Land Use GIS file, the County’s Conservation GIS file, and Recorded Conservation Easement data obtained from the County’s Environmental Protection Department. Since conservation data was not included with the County’s Future Land Use GIS file, the Conservation GIS file was overlayed on the Future Land Use data to obtain an accurate idea of the area and size of conservation lands. According to the Orange County Comprehensive Policy Plan (CPP), the Conservation/Wetlands designation on the Future Land Use Map (FLUM) serves only as a conceptual indicator. It is meant to serve planning purposes and inform applicants on potential wetland issues and approximate wetland areas. For this study, conservation lands were treated as a separate land use category and overlayed on the Future Land Use Map to be depict their overall size and proportion of the Study Area. Since the County did not include the category of “conservation” in its Future Land Use GIS data, conservation lands were not calculated as part of proportion of the future land use for the Study Area, but rather treated as an overlay. An estimate of the proportion of the area of land designated for conservation in the Study Area is approximate. Further, an estimate of the amount of conservation lands based on the County’s Conservation GIS file was calculated in proportion to the Study Area as whole to illustrate the general land use pattern in the Study Area. The distribution of these land uses is displayed in Table 2.1.2-1. Eight general categories of Future Land Use were found in the Study Area (not including conservation). Rural/agricultural land uses dominate, comprising over 50% of the total Study Area. Like the Existing Land Use Map rural/agricultural uses are concentrated in the eastern portion of the Study Area near the Econlockhatchee River. According to Orange County’s Comprehensive Policy Plan the County seeks to ensure that adequate land is available for continued agricultural use. Large sections of southeast Orange County have historically been used for citrus cultivation and the agricultural industry and the County

Orange County, Florida Innovation Way Economic Development & Environmental Resource Management Study
December 2005
10
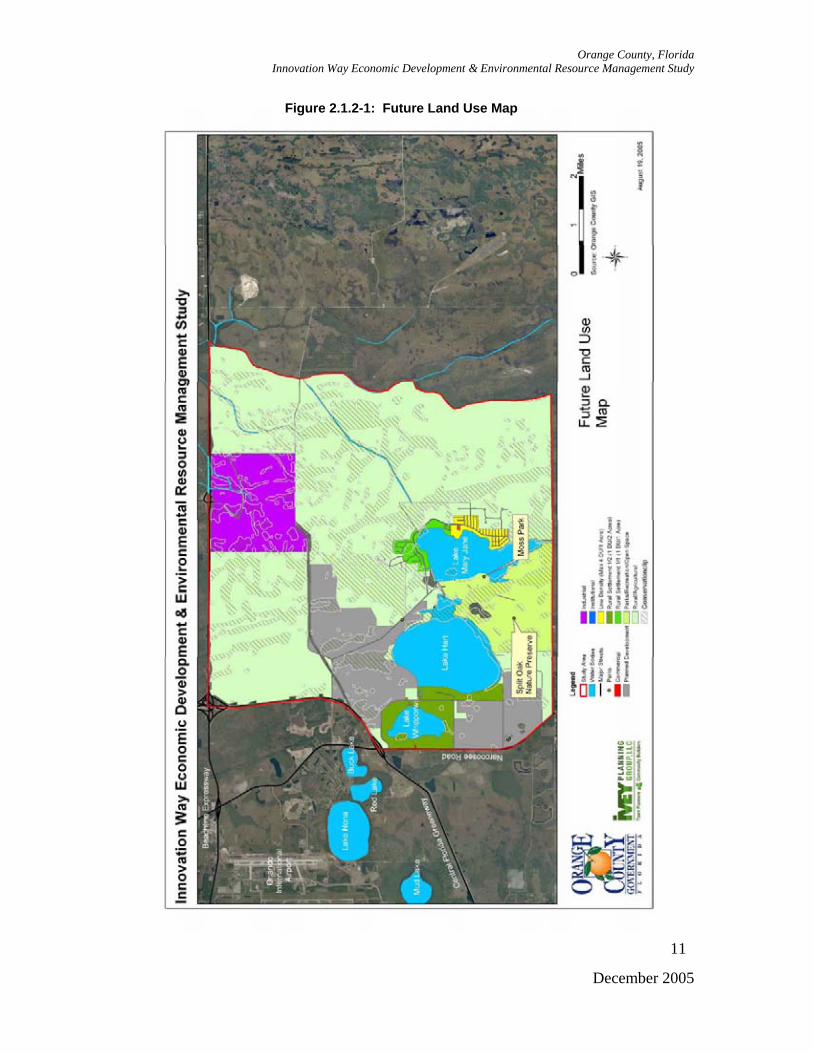
has made it a goal to continue to promote the long-term viability of agricultural uses as an economic asset in this area. The maximum density for the rural/agricultural future land use is one dwelling unit per ten acres. Conservation is a large part of the Study Area and remains interspersed throughout. For the purposes of this analysis, the conservation GIS data file created by Orange County was overlayed on the Future Land Use layer to give an approximate picture of where conservation lands exist and how much of the Study Area could be described as conservation. It describes the amount of land reserved for wetlands, wildlife corridors, and other environmentally sensitive areas. For further explanation of environmentally sensitive areas in the Study Area, see section 2.3. The County’s GIS information describes over 28% of the Study Area as conservation. Areas of conservation can be found throughout the Study Area but heavy concentrations occur in north south corridors generally to the north and east of Lake Mary Jane as well as along the Econlockhatchee River.
The next largest Future Land Use category in the Study Area is planned development. Large areas of planned development are primarily composed of four sites in the Study Area: the Lake Hart PD, Moss Park DRI, Eagle Creek DRI, and the International Corporate Park (ICP) DRI. These planned developments currently have approvals for varying intensities of
development (see 2.4 Committed Projects of Significance). The Lake Hart PD, Moss Park DRI, the Eagle Creek DRI, and ICP planned developments are all located within the Urban Service Boundary. Water Bodies constitute a large part of the Study Area and will continue to play a major role in the future land use pattern serving as important environmental resources and wildlife habitats, scenic corridors, and community focal points. Orange County has designated 5% of the Study Area as industrial. The industrial future land use designation within the Study Area closely follows the borders and encompasses the International Corporate Park DRI. The International Corporate Park is located in the northeast part of the Study Area, straddling the Beachline Expressway.
Future Land Use % of Study AreaRural, Agricultural 59.64%Planned Development 11.45%Water Body 11.18%Industrial 7.18%Parks, Recreation, Open Space 6.41%Residential 4.10%Commercial/Institutional 0.02%Conservation (Overlay) 28.38%Note: The Conservation Overlay was not calculated as part of the overall proportion. The Overlay does constitute 28.38% of the total Study Area. Source: Orange County, FL GIS
Table 2.1.2-1: Study Area Future Land Use
Orange County, Florida Innovation Way Economic Development & Environmental Resource Management Study
December 2005
11
Figure 2.1.2-1: Future Land Use Map

Orange County, Florida Innovation Way Economic Development & Environmental Resource Management Study
December 2005
12
The County has designated 6% of the Study Area for parks, recreation, and open space. This Future Land Use designation can be primarily found on the Orange County owned land in the south part of the Study Area in between Lake Mary Jane and Lake Hart, near the Orange/Osceola County line. Split Oak Nature Preserve and Moss Park are both located within this area. The County has designated three residential future land use categories with approximately 3% of the Study Area. Differences in the residential land use categories are based primarily on density and intensity. All of the residential districts (except for those found in the planned developments) are outside of the Urban Service Area. More than 200 acres of Low Density Residential (max 4DU/per acre) is located along the east side of Lake Mary Jane. In addition, the County has designated the Lake Hart/Lake Whippoorwill/Lake Mary Jane network as rural settlements in the Study Area. According to the County Comprehensive Plan the purpose of rural settlements is to preserve existing development patterns, provide for a rural residential lifestyle, and effectively manage the transition of rural areas adjacent to the Urban Service Area. Rural settlements attempt to preserve agricultural and rural uses in Orange County's Rural Service Area. Approximately 830 acres of rural settlement 1/2 (1 DU/2 Acres) is located around Lake Whippoorwill and borders the western side of Lake Hart. Approximately 230 acres of rural settlement 1/1 (1 DU/1 Acre) is located along the north side of Lake Hart. Orange County has included a number of criteria in the land development code to ensure the scale, and density and/or intensity of development within the Rural Service Area to promote the intended rural character of these settlements and manage growth. The County will specifically address development impacts to the Lake Hart/Lake Whippoorwill Rural Settlement from adjacent properties in the City of Orlando as well as nonresidential development or redevelopment growth impacts associated with property fronting Narcoossee Road. The County designates 5 acres for Commercial and approximately 3 acres for institutional on the Future Land Use Map. Commercial areas are located in small pockets along Narcoosee Road and in the low density residential development east of Lake Mary Jane. According to Orange County Future Land Use data, institutional in the Study Area accounts for only 3% of the Study Area. Institutional is located along the Beachline Expressway. The County depicts the institutional uses associated with the Campus Crusade for Christ and the Wycliffe Bible Translators as part of the Planned Development future land use designation. With the continued growth of the Orlando International Airport, the growth of the University of Central Florida and Valencia Community College, and retail centers such as Waterford Lakes, all near the Greeneway and the planned Innovation Way corridor, these land uses will be subject to evaluation as to their appropriateness for the implementation of Orange County’s long range goals. The County foresees a rise in development and has designated large planned developments in the Study Area along Narcoosee Road and to the immediate north and west of Lake Hart. The County has also
Orange County, Florida Innovation Way Economic Development & Environmental Resource Management Study
December 2005
13
designated a large amount of land as Industrial to the north of the Study Area (International Corporate Park).
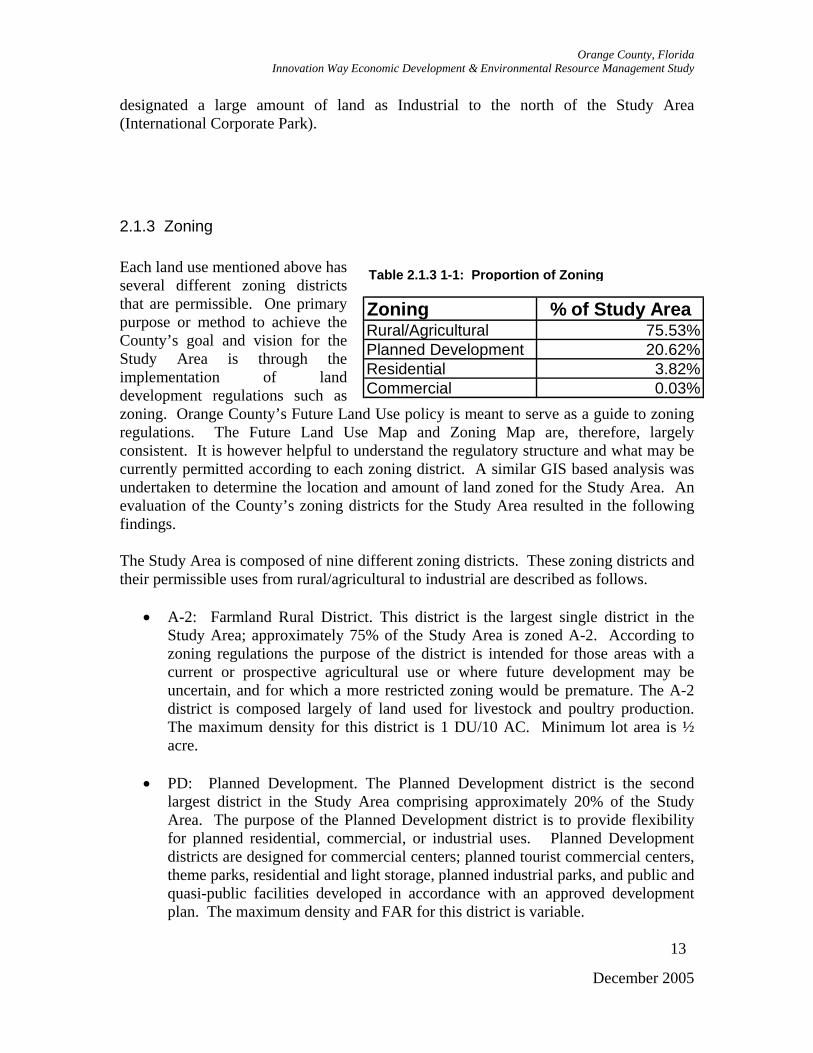
2.1.3 Zoning Each land use mentioned above has several different zoning districts that are permissible. One primary purpose or method to achieve the County’s goal and vision for the Study Area is through the implementation of land development regulations such as zoning. Orange County’s Future Land Use policy is meant to serve as a guide to zoning regulations. The Future Land Use Map and Zoning Map are, therefore, largely consistent. It is however helpful to understand the regulatory structure and what may be currently permitted according to each zoning district. A similar GIS based analysis was undertaken to determine the location and amount of land zoned for the Study Area. An evaluation of the County’s zoning districts for the Study Area resulted in the following findings. The Study Area is composed of nine different zoning districts. These zoning districts and their permissible uses from rural/agricultural to industrial are described as follows.
• A-2: Farmland Rural District. This district is the largest single district in the Study Area; approximately 75% of the Study Area is zoned A-2. According to zoning regulations the purpose of the district is intended for those areas with a current or prospective agricultural use or where future development may be uncertain, and for which a more restricted zoning would be premature. The A-2 district is composed largely of land used for livestock and poultry production. The maximum density for this district is 1 DU/10 AC. Minimum lot area is ½ acre.
• PD: Planned Development. The Planned Development district is the second
largest district in the Study Area comprising approximately 20% of the Study Area. The purpose of the Planned Development district is to provide flexibility for planned residential, commercial, or industrial uses. Planned Development districts are designed for commercial centers; planned tourist commercial centers, theme parks, residential and light storage, planned industrial parks, and public and quasi-public facilities developed in accordance with an approved development plan. The maximum density and FAR for this district is variable.
Table 2.1.3 1-1: Proportion of Zoning
Zoning % of Study AreaRural/Agricultural 75.53%Planned Development 20.62%Residential 3.82%Commercial 0.03%

Orange County, Florida Innovation Way Economic Development & Environmental Resource Management Study
December 2005
14
• R-1A and R-1AA Single-Family Dwelling Districts and R-1AAA Residential
Urban District: The R1A and R-1AA districts are single-family residential areas with large lots and low densities. The R-1AAA Residential Urban District is intended to provide low density single-family homes within the existing or planned urban service area. These districts can be found along the eastern side of Lake Mary Jane outside the Urban Service Area. The maximum density for these districts is 4 DU/AC. Minimum lot area for R-1A is 7,500 sq ft. Minimum lot area for R-1AA is 10,000 sq ft. Minimum lot area for R-1AAA is 14,520 or 1/3 acre.
• RCE Country Estate District and RCE2 Rural Residential District: The Country
Estate District is meant to establish areas where very low residential densities may be maintained and where investment in homes will be protected from the adverse effects sometimes found in agricultural districts. This district is primarily residential; however, certain uses found only in agricultural districts may be permitted as special exceptions. The intent of the RCE2 or Rural Residential District is to provide for single-family ownership in a rural atmosphere to be located principally in the rural service area; and to permit limited agricultural uses which are compatible with a rural residential environment by providing protection from adverse agricultural uses. These districts are found along Lake Whippoorwill. The maximum density for RCE is 1 DU/AC and 2 DU/AC for RCE-2. Minimum lot area is 1 acre for RCE and minimum lot area is 2 acres for RCE-2.
• C-1 Retail Commercial District and C-2 General Commercial District: The C-1
district is composed of lands and structures used primarily for retail and services. C-1 Retail Commercial is meant to be located where adequate public facilities and services are available; where compatible with adjacent areas or where buffers can be provided to ensure compatibility; and to a limited extent in rural settlements throughout the county to meet the needs of an identified community, or in growth centers as defined in the comprehensive policy plan. The C-2 or General Commercial District occupies an area larger than that of the retail commercial district, serves a greater population, and offers a wider range of services than C-1. Both commercial districts can be found along Narcoosee Road and in the development directly east of Lake Mary Jane. The maximum FAR for these districts is 3.0. Minimum lot area for C-1 is 6,000 sq ft. Minimum lot area for C-2 is 8,000 sq ft.
The location of these zoning districts is mapped in Figure 2.1.3-1. It is important to note the large areas of the Study Area currently zoned for Industrial and Planned Development. These districts signal a change in the overall Rural/Agricultural land use pattern extending towards the Econlockhatchee River. The existing planned developments are located along major transportation corridors (Beachline Expressway, Central Florida Greeneway) in the Study Area.

Orange County, Florida Innovation Way Economic Development & Environmental Resource Management Study
December 2005
15
Figure 2.1.3-1: Zoning Map

Orange County, Florida Innovation Way Economic Development & Environmental Resource Management Study
December 2005
16
Future planning for the Study Area should take into account the potential for large changes in the land use and development, which the Industrial and Planned Development Districts may bring, as well as the development potential along transportation corridors. It is crucial to plan for future development with these land development regulations in mind. The occurrence of Rural/Agricultural land uses side by side with Industrial and Residential land uses may be problematic and may potentially pose future problems. A reevaluation of the County’s Future Land Use as well as Zoning regulations is advisable considering future growth and development under current land development regulations in the Study Area.
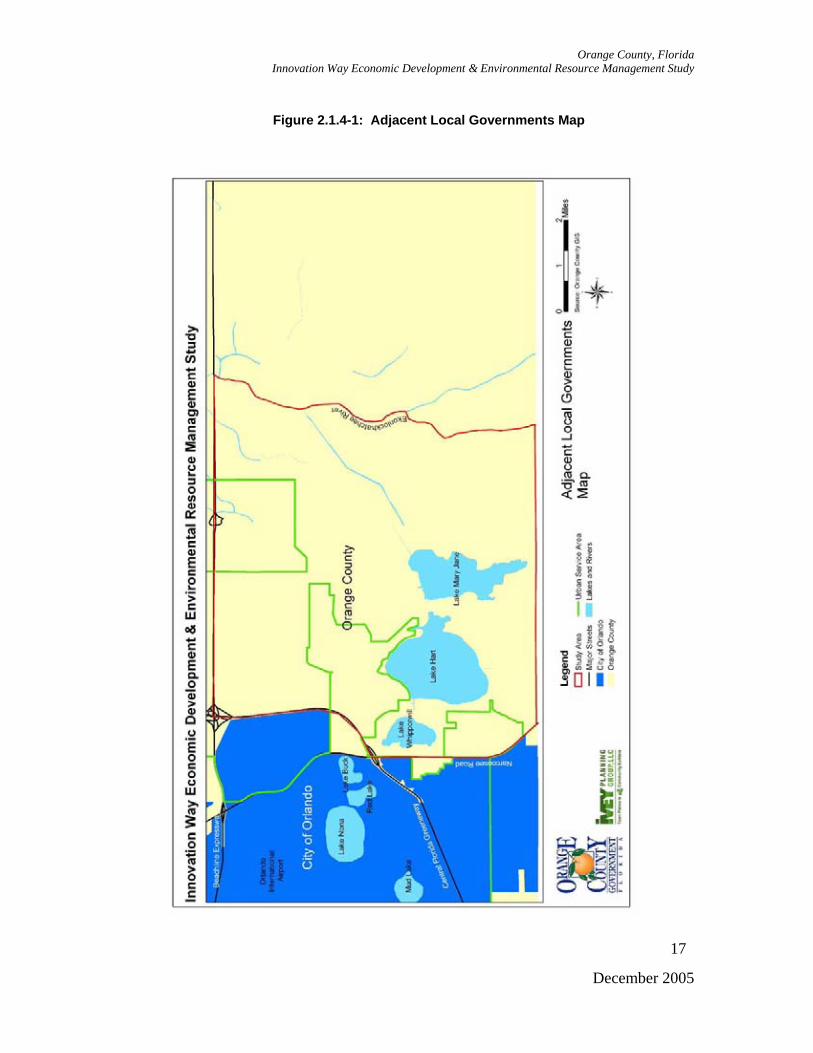
2.1.4 Adjacent Local Governments Adjacent local governments near the Study Area include the City of Orlando and unincorporated Osceola County (Brevard County makes up the eastern border of the eastern half of the Study Area). The City of Orlando makes up the western border of the Study Area along Narcoosee Road and the Central Florida Greeneway. According to the City of Orlando’s Future Land Use Map, the land adjacent to the Study Area is dominated in large part by the proximity of the Orlando International Airport. Much of the land immediately surrounding the airport has been designated as Airport Support Districts; these districts may accommodate airport hangars, repair shops, or other airport related functions. A majority of the land to the south and east of the airport remains undeveloped (south of Mud Lake). The City has a defined development pattern for this land on the Future Land Use Map with three land uses: Conservation, Urban Reserve, and Urban Villages. Although the City has reserved large portions of this land for low density Conservation (Max 1DU/5 acres) or Urban Reserve (Max 1DU/10acres), the City also anticipates growth in the area and has designated large areas of the land south and east of the airport as Urban Villages. Development already exists north of the Central Florida Greeneway and to the east of the airport and the City has focused development efforts on the Narcoosee Road corridor. The City has plans to widen Narcoosee Road and to improve service levels as well as improve the corridor. Planning efforts have also produced the South East Sector Plan for the area. The City envisions the Narcoosee Road corridor as a mixed use activity center. The City of Orlando has designated a number of Future Land Use designations along this corridor which support increased development. An Urban Activity Center as well as Community Activity Center have been identified near the intersection of Narcoosee Road and South Frontage Road. The City has also designated land along Narcoosee Road with a Mixed Use Corridor Medium Intensity (Max 30/DU Acre) designation as well as a Mixed Use Neighborhood Development (Max 12/DU Acre) designation. It is clear from the City’s Future Land Use Map, that the City intends Narcoosee Road to not only serve as a transportation route, but also as a residential, retail, and entertainment focal point. Development intensifies north and west along Narcoosee Road and is heavily urbanized at the termination of South Semoran Boulevard and the Beachline Expressway.
Orange County, Florida Innovation Way Economic Development & Environmental Resource Management Study
December 2005
17
Figure 2.1.4-1: Adjacent Local Governments Map

Orange County, Florida Innovation Way Economic Development & Environmental Resource Management Study
December 2005
18
Osceola County has designated land to the south of the Orange/Osceola County Line and east of Narcoosee Road as Urban Residential, Suburban Residential, and Agricultural on its Future Land Use Map. The County’s Future Land Use Map indicates land directly to the east of Narcoossee Road as Urban Residential. The County limits the Urban Residential future land use by the Urban Growth Boundary to the east. Lower density Suburban Residential lies directly to the east beyond the Urban Growth Boundary (south of Lake Mary Jane). The Econlockhatchee River is the approximate location where Suburban Residential transitions to the Agricultural Future Land Use. The Agricultural future land use stretches to the St. John’s River.
2.1.5 Ownership Patterns Ownership patterns indicate how well a large area plan may be implemented and how well that plan may be adapted to individual owners. The Study Area is largely composed of a few landowners with large amounts of land. Eleven landowners in the Study Area possess over 500 acres of land. Together these landowners account for over 70% of the Study Area (see Table 2.1.5-1). The location of these properties is identified on Figure 2.1.5-1. The large land holdings are predominantly clustered towards the Econlockhatchee River. A few large parcels are situated between Lake Hart and Lake Mary Jane as well as towards the north east corner of the Study Area near the intersection of the Beachline Expressway and the Central Florida Greeneway. The predominant land use in all of the large land holdings is primarily Rural/Agricultural oriented. Smaller
landowners are clustered predominantly around the lakes in the Study Area. These small landowners are largely located in the rural settlements and residential planned development. For the most part these parcels are predominantly residential, with a small proportion of commercial and institutional land uses.
Table 2.1.5-1: Large Landholdings
Acres % of Study Area
1 Farmland Reserve Inc 4,671.57 14.86%2 Southeast Orlando Partners LLC 4,025.24 12.80%3 Orange County BCC 2,906.38 9.24%4 Carlsbad Orlando LLC 2,547.81 8.10%5 Holland Properties Inc 2,351.27 7.48%6 International Corporate Park 1,792.09 5.70%7 Moss Park Properties LTD 1,283.66 4.08%8 Eagle Creek Development Corporation 1,023.34 3.25%9 Lake Hart Partners 829.56 2.64%
10 Bonnet Creek Resort Community Development District 713.73 2.27%11 Ung Bon Van 521.34 1.66%
Total 22,666.00 72.09%Source: Orange County GIS
Landowner over 500 acres

Orange County, Florida Innovation Way Economic Development & Environmental Resource Management Study
December 2005
19
Figure 2.1.5-1: Large Land Holdings Map

Orange County, Florida Innovation Way Economic Development & Environmental Resource Management Study
December 2005
20
The presence of large land holdings by the Campus Crusade for Christ and the Wycliffe Bible Translators north of Lake Hart should be noted for their size. These landowners each possess large parcels with corporate facilities on large landscaped lots. Both the Campus Crusade for Christ and the Wycliffe Bible Translators are located in the Moss Park DRI.
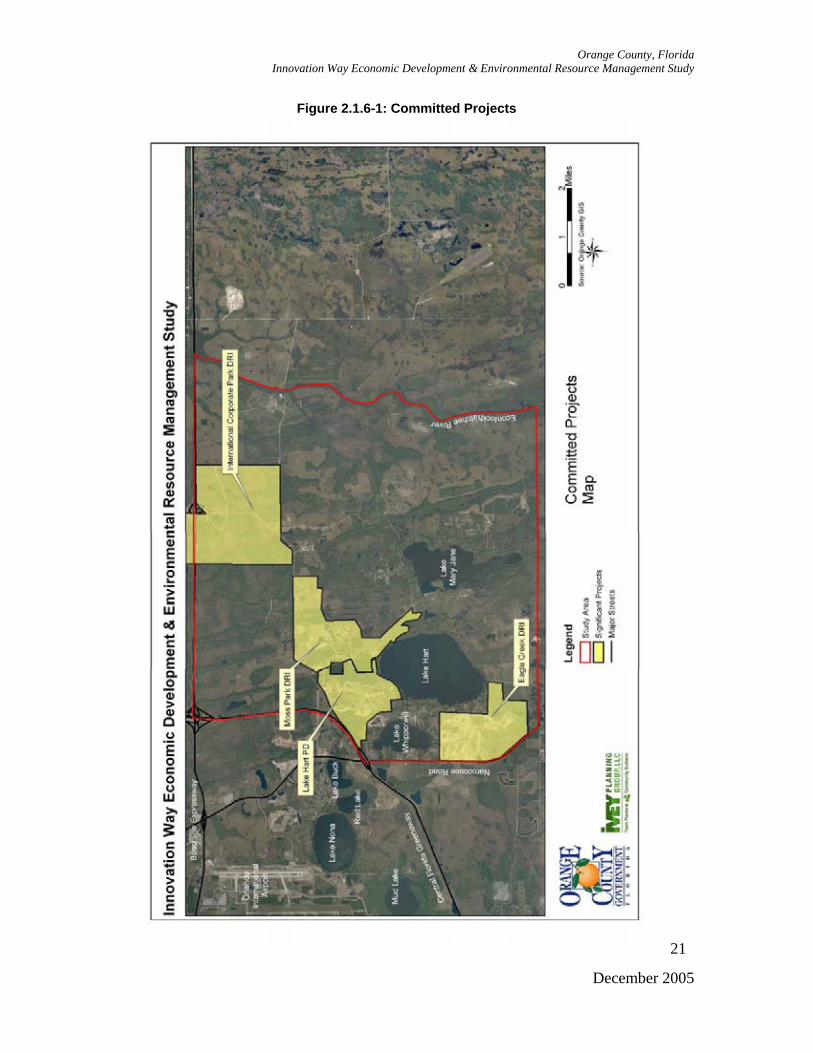
2.1.6 Committed Projects A committed project is one which has valid land use approvals, zoning approvals, and, if necessary Development of Regional Impact (DRI) approvals either imminent or in place but may not have yet commenced or built out construction. Within the Study Area, there are 4 projects that meet this description. They include:
• International Corporate Park DRI: The International Corporate Park DRI approved in 1986 made possible the conversion of a large wooded site primarily used for cattle grazing into a large corporate/office park. The site straddles the Beachline Expressway and has direct access to this major east west roadway. The original DRI approval included industrial, warehouse, manufacturing, commercial, office, and hotel uses.
• Moss Park DRI: The Campus Crusade for Christ International (CCCI) was initially given permission to develop its headquarters on a 285 acre site in 1995 to the north of Lake Hart. CCCI subsequently erected headquarters buildings and began occupation of these buildings in 1999. Around the same time the developers sought to expand the original DRI. The Moss Park DRI approved in 2000 increased the original 285 acre site through the addition of 1312 contiguous acres bringing the total area of the project to 1597 acres. The developers sought to expand the CCCI program, provide for the headquarters for Wycliffe Bible Translators, and also develop a mixed use community. The Moss Park DRI permitted the development of retail, residential, office, hotel, and industrial land uses to the area directly to the north and east of Lake Hart.
• Eagle Creek DRI: The Eagle Creek DRI approved in 2001 permitted residential, office, retail/service, hotel, public/institutional, and golf course development on approximately 1200 acres. The project site is located in the southwest corner of the Study Area. The Eagle Creek DRI is bordered on the west by Narcoosee Road and comes close to Lake Hart on the east. According to the approved development order the developer is entitled to construct residential, office, retail, hotel rooms, and an 18-hole golf course.
• Lake Hart PD: The Lake Hart Planned Development (PD) is located north of Lake Hart west of the Moss Park DRI and north east of the rural settlements along Lake Whippoorwill. Approximately 1,000 acres of the Lake Hart PD within the Study Area is Residential. The developer is entitled to construct single family residential, multi-family residential, townhouses, retail, and industrial in the Lake Hart PD.
Orange County, Florida Innovation Way Economic Development & Environmental Resource Management Study
December 2005
21
Figure 2.1.6-1: Committed Projects

Orange County, Florida Innovation Way Economic Development & Environmental Resource Management Study
December 2005
22
2.1.7 Publicly Owned Lands and Conservation Easements Public Lands are a recreation resource for the County. In accordance with the Orange County Comprehensive Plan, private and public open spaces should be designed to accomplish the following: bring nature into the urban environment; enable passive and active recreation; encourage community and family gatherings; stimulate private investment in the community; and be a source of beauty. The study corridor contains one County park known as Moss Park see Figure 2.1.7-1. Moss Park encompasses 1,551 acres of recreational facilities. The park provides two boat ramps, two playgrounds, pavilions, swimming facilities, ball fields, camp sites, hiking trails, picnic areas with grilles, recreation programs, RV campsites, and volleyball courts. The park is located 4 miles southeast of Narcoossee Road on Moss Park Road. Split Oak nature preserve and forest is located near Moss Park. Split Oak Forest is approximately 1,800 acres and may be accessed through Moss Park. Split Oak nature preserve provides hiking and equestrian trails, as well as opportunities to view wildlife. A conservation easement is a restriction on the use of a property. It is a recorded deed restriction, and the right to enforce the restriction is given to a tax-exempt charitable organization (generally in the conservation field) or a government agency. The study corridor contains the TM Ranch Mitigation Area, the TM-Econ Mitigation Bank (Holland Property), the Henson Property, Crosby Island Marsh, Live Oaks Estates, the World Gateway DRI Mitigation Area, and a wildlife crossing across Narcoosee Road near the World Gateway DRI Mitigation Area. Conservation Lands may maintain intact floral and faunal assemblages representative of the ecosystems present within those preserves as long as they enjoy contiguity with similar (or at least compatible) adjacent landscapes. Once conservation lands are isolated from similar habitat, they become terrestrial islands subject to invasive species. The TM-Econ Mitigation Bank is located adjacent to the TM-Ranch. Credits may be purchased in the mitigation bank for development purposes in less environmentally sensitive areas, thereby conserving valuable wetland and wildlife areas. In September of 2002 Orange County purchased 1280 acres of the TM Ranch. The Ranch is located in the Lake Hart – Econ River Drainage Basin in east Orange County. A condition of the sale was that Holland Properties, Inc. obtain a mitigation bank permit for the County’s 1280 acres, along with the 3920 acres that Holland Properties, Inc. were proposing to operate as a mitigation bank. The Henson Property is part of the new Orange County initiative called “Green PLACE.” The program is designed to preserve, enhance, and restore environmentally sensitive lands.

Orange County, Florida Innovation Way Economic Development & Environmental Resource Management Study
December 2005
23
Figure 2.7.1-1: Public Lands and Conservation Easements

Orange County, Florida Innovation Way Economic Development & Environmental Resource Management Study
December 2005
24
"Green PLACE" stands for Park Land Acquisition for Conservation and Environmental protection. This program bases land acquisition of environmentally sensitive land on biological diversity, conservation of water resources, and preservation of unique ecologically significant habitats. This program encourages regional connections, greenways, and blueways. The Henson Property in the study corridor is a large parcel in the north portion of the land between Lake Hart and Lake Mary Jane. The Henson Tract is located at the intersection of Lake Mary Jane Road and Moss Park Road. The parcel is 246 acres of Freshwater Marshes, Forested Wetland, Oak Hammock, Pine Flatwoods and littoral zone of Lake Hart. The parcel is contiguous with the Crosby Island Marsh Mitigation Area, Moss Park and Split Oak Forest. The Green PLACE Program provides the opportunity to preserve important, unique Central Florida habitats for future generations. Bond appropriation, grants, partnerships, and the Conservation Trust Fund provide funding for the program. By combining these funds purchases can be applied to large significant parcels instead of smaller parcels surrounded by development. Smaller parcels are more difficult to maintain as viable ecosystems, typically offer less valuable habitat to various species and often face environmental degradation due to storm water diversion and other pressures.
2.1.8 Historic Sites or Cultural Resources The office of Cultural and Historical Programs is within the Department of State, and is the state agency responsible for promoting the historical, archaeological, museum, arts, and folk culture resources in Florida. The Director of the Division of Historical Resources serves as Florida’s State Historic Preservation Officer (SHPO). The State of Florida has enacted laws to protect archaeological sites, specifically Chapter 872, F.S., protects historically significant human burials (marked and unmarked) on public and private property. A computer database of all known historical structures and archaeological sites within Florida is maintained by the Bureau of Historic Preservation, Division of Historical Resources, and Florida Department of State. This Florida Master Site File was reviewed for the location of historic and archaeological sites located within the Study Area. A total of 33 known archaeological sites, 17 historical standing structures (dated from the 1920’s to the 1940’s) and one historic bridge (early 1900’s privately owned wood bridge) are located within the Study Area. The location of these sites is shown on Figure 2.1.8-1 Historical and Culturally Significant Sites.
2.2 Infrastructure
2.2.1 Transportation System The local roadway network within the Study Area is illustrated in Figure 2.2.1-1. There are two limited access facilities, Beachline Expressway (SR 528) and Central Florida GreeneWay (SR 417) forming the northern and western limits of the Study Area.

Orange County, Florida Innovation Way Economic Development & Environmental Resource Management Study
December 2005
25
Figure 2.1.8-1: Historical and Culturally Significant Sites

Orange County, Florida Innovation Way Economic Development & Environmental Resource Management Study
December 2005
26
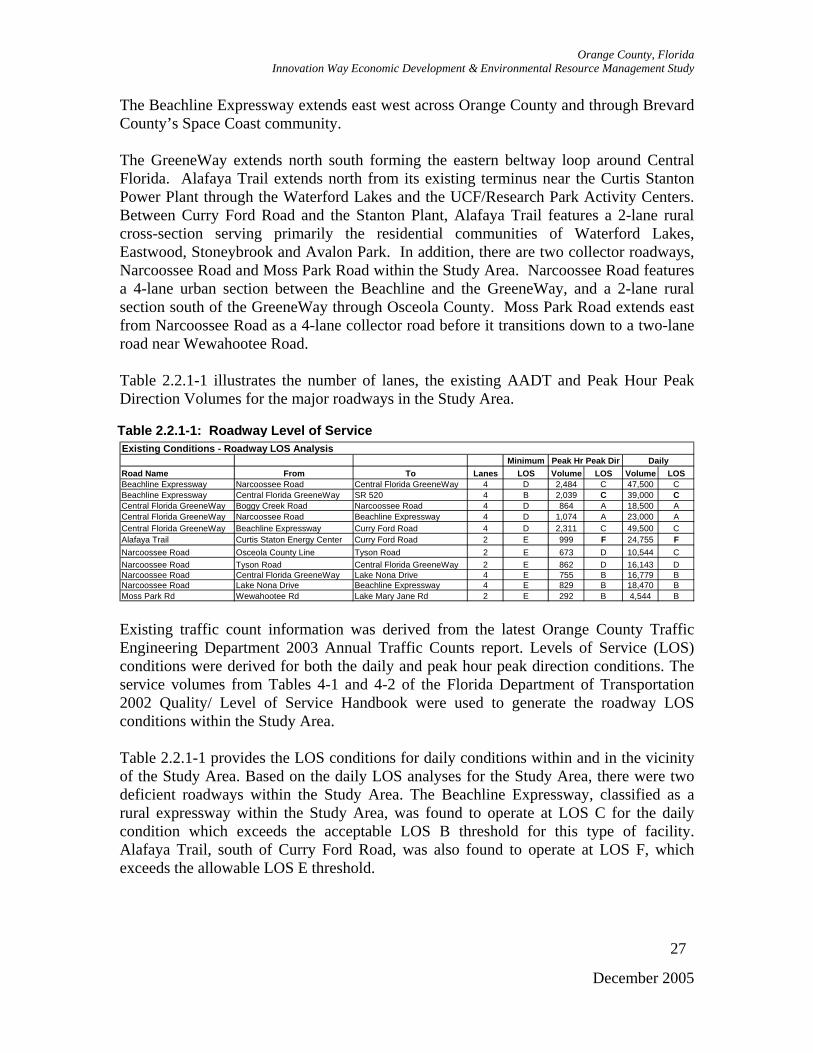
Figure 2.2.1-1: Existing AADT and Peak Hour/Peak Direction Volumes
Orange County, Florida Innovation Way Economic Development & Environmental Resource Management Study
December 2005
27
The Beachline Expressway extends east west across Orange County and through Brevard County’s Space Coast community. The GreeneWay extends north south forming the eastern beltway loop around Central Florida. Alafaya Trail extends north from its existing terminus near the Curtis Stanton Power Plant through the Waterford Lakes and the UCF/Research Park Activity Centers. Between Curry Ford Road and the Stanton Plant, Alafaya Trail features a 2-lane rural cross-section serving primarily the residential communities of Waterford Lakes, Eastwood, Stoneybrook and Avalon Park. In addition, there are two collector roadways, Narcoossee Road and Moss Park Road within the Study Area. Narcoossee Road features a 4-lane urban section between the Beachline and the GreeneWay, and a 2-lane rural section south of the GreeneWay through Osceola County. Moss Park Road extends east from Narcoossee Road as a 4-lane collector road before it transitions down to a two-lane road near Wewahootee Road. Table 2.2.1-1 illustrates the number of lanes, the existing AADT and Peak Hour Peak Direction Volumes for the major roadways in the Study Area.
Existing traffic count information was derived from the latest Orange County Traffic Engineering Department 2003 Annual Traffic Counts report. Levels of Service (LOS) conditions were derived for both the daily and peak hour peak direction conditions. The service volumes from Tables 4-1 and 4-2 of the Florida Department of Transportation 2002 Quality/ Level of Service Handbook were used to generate the roadway LOS conditions within the Study Area. Table 2.2.1-1 provides the LOS conditions for daily conditions within and in the vicinity of the Study Area. Based on the daily LOS analyses for the Study Area, there were two deficient roadways within the Study Area. The Beachline Expressway, classified as a rural expressway within the Study Area, was found to operate at LOS C for the daily condition which exceeds the acceptable LOS B threshold for this type of facility. Alafaya Trail, south of Curry Ford Road, was also found to operate at LOS F, which exceeds the allowable LOS E threshold.
Table 2.2.1-1: Roadway Level of Service
MinimumRoad Name From To Lanes LOS Volume LOS Volume LOSBeachline Expressway Narcoossee Road Central Florida GreeneWay 4 D 2,484 C 47,500 CBeachline Expressway Central Florida GreeneWay SR 520 4 B 2,039 C 39,000 CCentral Florida GreeneWay Boggy Creek Road Narcoossee Road 4 D 864 A 18,500 ACentral Florida GreeneWay Narcoossee Road Beachline Expressway 4 D 1,074 A 23,000 ACentral Florida GreeneWay Beachline Expressway Curry Ford Road 4 D 2,311 C 49,500 CAlafaya Trail Curtis Staton Energy Center Curry Ford Road 2 E 999 F 24,755 FNarcoossee Road Osceola County Line Tyson Road 2 E 673 D 10,544 CNarcoossee Road Tyson Road Central Florida GreeneWay 2 E 862 D 16,143 DNarcoossee Road Central Florida GreeneWay Lake Nona Drive 4 E 755 B 16,779 BNarcoossee Road Lake Nona Drive Beachline Expressway 4 E 829 B 18,470 BMoss Park Rd Wewahootee Rd Lake Mary Jane Rd 2 E 292 B 4,544 B
Peak Hr Peak Dir DailyExisting Conditions - Roadway LOS Analysis

Orange County, Florida Innovation Way Economic Development & Environmental Resource Management Study
December 2005
28
The service volumes from Tables 4-7 and 4-8 of FDOT’s 2002 Quality/ Level of Service Handbook were used to generate the peak hour LOS conditions of the surrounding roadways. Table 2.2.1-1 also provides the peak hour LOS conditions. The peak hour LOS characteristics exhibit the same patterns as the daily LOS conditions. Both the Beachline Expressway and Alafaya Trail exceed their respective minimum acceptable LOS thresholds. All the other roadways were found to operate within the minimum acceptable LOS standards.
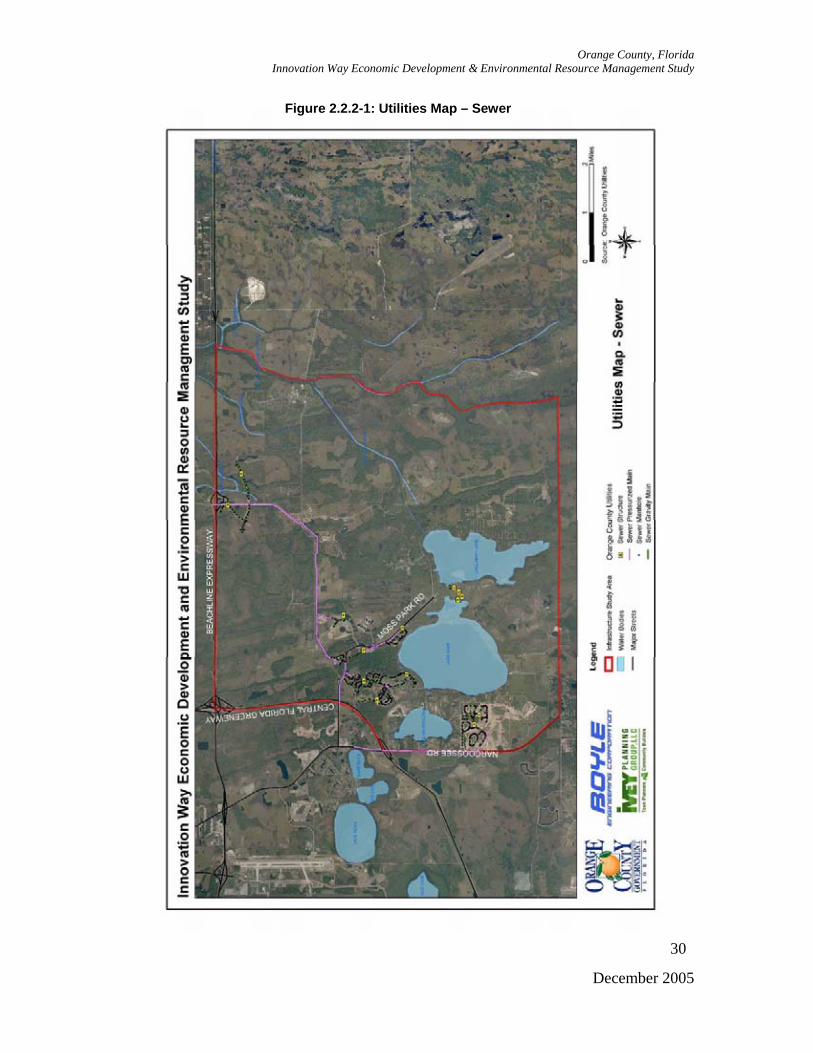
2.2.2 Sewer, Wastewater Treatment, and Reuse The Study Area is served by Orange County’s Eastern Regional Water Reclamation Facility (ERWRF), which has a current capacity of 19 MGD and is located on South Alafaya Trail, approximately five miles north of the Study Area. An expansion to this WRF is planned which will increase the capacity to 24 MGD. A small package wastewater treatment plant is located at Moss Park. This treatment plant, however, will not provide service to the general study area. The existing sewer collection and transmission system is limited in coverage area. Existing piping, lift stations and force mains are shown on Figure 2.2.2-1 Utilities Map – Sewer. The gravity sewer collection system includes 83,796 linear feet of piping that ranges from six inches to twelve inches in diameter, and 503 manholes. Sewage is conveyed from the collection system through 14 lift stations and 77,960 feet of force main piping that ranges from four inches to twenty-four inches in diameter. Treated wastewater effluent is reclaimed at the Eastern Regional WRF and is distributed to a limited portion of the Study Area, as shown on Figure 2.2.2-1 Utilities Map – Sewer, Figure 2.2.2-2 Utilities Map – Reclaimed Water. The reclaimed water is distributed through 94,309 linear feet of piping that ranges from four inches to twenty inches in diameter. The existing transmission systems are capable of serving the planned growth in this area for a number of years. Orange County has several projects that are planned, budgeted and under design to expand the wastewater and reclaimed water service within the study area as development occurs. In Orange County the State of Florida Department of Health regulates the construction of septic tanks and associated drain fields. Constraints to septic tanks include soil conditions, proximity of ground water to the ground surface, proximity of the drain field to drinking water wells and to lakes, streams and other surface water bodies, and the elevation of the ground at the location of the drain field. Soil conditions impact the functionality of the septic tank drain field. More permeable soils combined with a deep ground water table allow the treated sewage effluent to

Orange County, Florida Innovation Way Economic Development & Environmental Resource Management Study
December 2005
29
percolate into the soil. Locations that have less permeable soils and locations where the ground water is close to the ground surface are typically unusable for septic tanks and drain fields. Orange County ordinances prohibit construction of septic tanks within 150 feet of surface water bodies. Septic tanks and drain fields are typically prohibited at sites having elevations within the 100-year flood plain.
Orange County, Florida Innovation Way Economic Development & Environmental Resource Management Study
December 2005
30
Figure 2.2.2-1: Utilities Map – Sewer

Orange County, Florida Innovation Way Economic Development & Environmental Resource Management Study
December 2005
31
Figure 2.2.2-2: Utilities Map-Reclaimed Water
Orange County, Florida Innovation Way Economic Development & Environmental Resource Management Study
December 2005
32
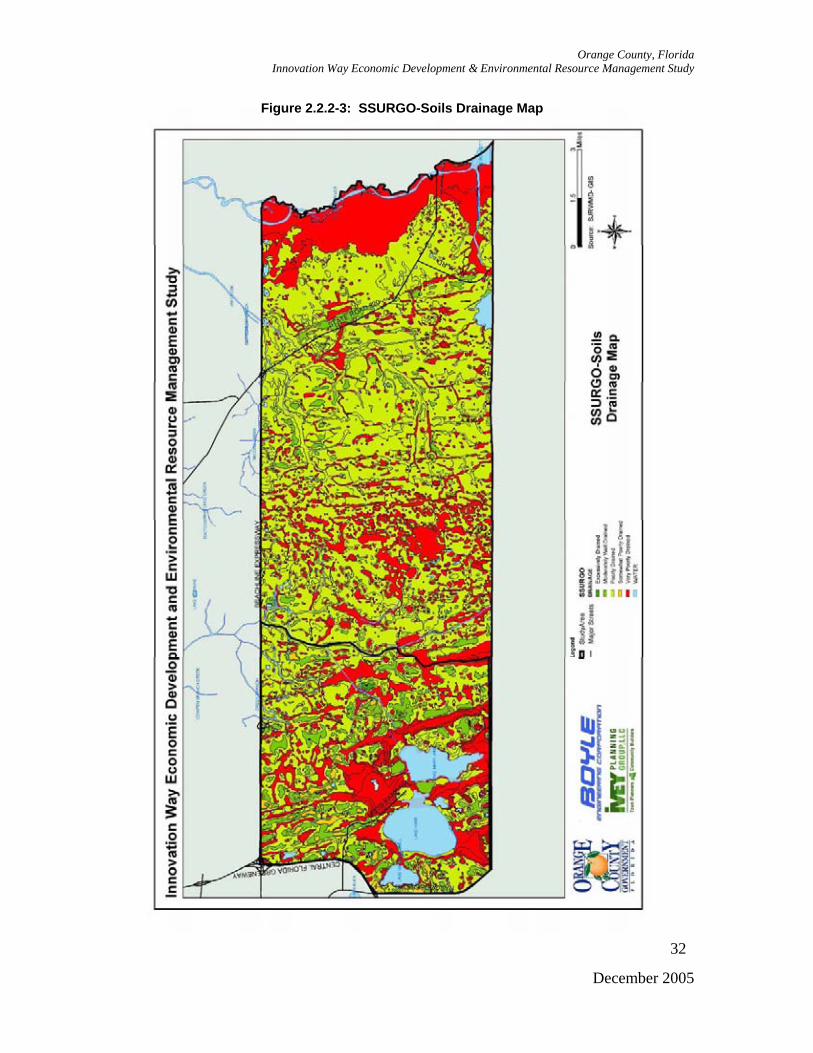
Figure 2.2.2-3: SSURGO-Soils Drainage Map

Orange County, Florida Innovation Way Economic Development & Environmental Resource Management Study
December 2005
33
Figure 2.2.2-4: FEMA Floodplain Map
Orange County, Florida Innovation Way Economic Development & Environmental Resource Management Study
December 2005
34
Additionally, septic tanks and drain fields are prohibited on single family residential lots smaller than ½ acre in size. As shown in Figure 2.2.2-3 SSURGO-Soils Drainage Map, soils throughout most of the Study Area are classified as “Poorly Drained” or “Very Poorly Drained”. A few pockets of “Moderately Well Drained” soils exist along the ridges. However, as shown in Figure 2.2.2-4 FEMA Floodplain Map, a significant portion of the Study Area lies within the 100-year flood plain.
2.2.3 Water Supply and Alternative Water Sources The Floridan Aquifer is the current water source for the Study Area. Groundwater is drawn through wells from this source and treated in water treatment plants. Local recharge or replenishment of this aquifer is constrained by the layers and types of soil that overlay the water bearing strata. As shown in Figure 2.2.3-1, Aquifer Recharge Potential, there is limited recharge of the Floridan Aquifer in the Study Area. Areas having higher recharge rates are generally located north and west of the Study Area. Use of the water resources within the study are regulated by the St. Johns River Water Management District and the South Florida Water Management District. In recent years both state agencies have told large quantity consumers of water from the Floridan, such as Orange County and OUC, to begin planning to obtain additional water from other sources, such as the St. Johns River or lower quality groundwater sources. Orange County (in concert with OUC and several other water utilities in the region) is planning to obtain water from the St. John’s River. Although the St. Johns River will be the source for this additional water, the water will be withdrawn from the Taylor Creek Reservoir. This surface water reservoir will provide storage and blending for water withdrawn from the St. Johns River, and is located near the southeast corner of the Study Area. Approximately 12 MGD of water is being considered for delivery to Orange County within the next eight years. The Floridan aquifer is historically the primary source of drinking water in the State of Florida. Recharge to the Floridan aquifer occurs in areas where the elevation of the water table within the surficial aquifer is higher than the elevation of the potentiometric surface displayed within the Floridan aquifer. In these areas, water moves from the surficial aquifer in a downward direction to the Floridan aquifer, moving through the upper confining media which separates the two. Recharge can also occur directly from infiltrating rainfall in relatively rare corridors that have the necessary geologic conditions conducive to movement of water from ground surface to the deep aquifer below. These corridors are important because of the need to ensure an adequate quantity of recharge, and also because they represent the most direct natural route for contamination from the surface to reach our drinking water supply. In contrast, discharge from the Floridan aquifer occurs in areas where the elevation of the potentiometric surface within the aquifer is higher than the water table above. In these
Orange County, Florida Innovation Way Economic Development & Environmental Resource Management Study
December 2005
35
areas, water moves from the Floridan aquifer in an upward direction, passing through the upper confining media to the overlying surficial aquifer. Due to low topography, an abundance of soils designated as Hydrologic Soil Group B/D, and a high water table, the majority of the Study Area has low recharge potential. The ridge of uplands between the Econlockhatchee and St. Johns Rivers has a recharge potential of 4 to 8 inches per year. The remainder of the Study Area west of SR 520 has a recharge potential of 0 to 4 inches per year. The area located between SR 520/Nova Road and the St. Johns River is classified as a discharge area. The potential aquifer recharge and discharge areas are shown on Figure 2.2.3-1; Aquifer Recharge Potential. Three water treatment plants currently serve the Study Area. Orange County’s Eastern Regional Water Supply Facility is located on Curry Ford Road, approximately five miles from the Study Area. This WTP is currently permitted to produce 25 MGD of water, a construction project is under way to expand the capacity to 40 MGD within one year, and expected improvements are projected to increase the production capacity to 50 MGD within five years. Two Orlando Utility Commission water treatment plants serve the southwestern portion of the Study Area. The South East Water Plant, located on Boggy Creek Road within 0.5 miles of the Study Area, and the Conway Water Treatment Plant, located near the intersection of Conway Road and Michigan Avenue, supply water to the region. The service to the area is a blend of water from these two plants, with a service capacity of approximately 5 MGD. A limited amount of water distribution piping is currently installed within the Study Area. As shown on Figure 2.2.3-2, Utilities Map – Water Main, both Orange County and OUC have water pipelines in the Study Area. Orange County has approximately 119,131 linear feet of water piping ranging from 2 inches to 24 inches in diameter. OUC has approximately 43,581 linear feet of water piping ranging from 2 inches to 24 inches in diameter. There are approximately 104 fire hydrants in the Study Area. Private wells serve most of the less developed portions of the study corridor. The existing transmission systems are capable of serving the planned growth in this area for a number of years. Orange County has several projects that are planned, budgeted and under design to expand the water supply service within the study area as development occurs.

Orange County, Florida Innovation Way Economic Development & Environmental Resource Management Study
December 2005
36
Figure 2.2.3-1: Aquifer Recharge Potential

Orange County, Florida Innovation Way Economic Development & Environmental Resource Management Study
December 2005
37
Figure 2.2.3-2: Utilities Map – Water Main
Orange County, Florida Innovation Way Economic Development & Environmental Resource Management Study
December 2005
38
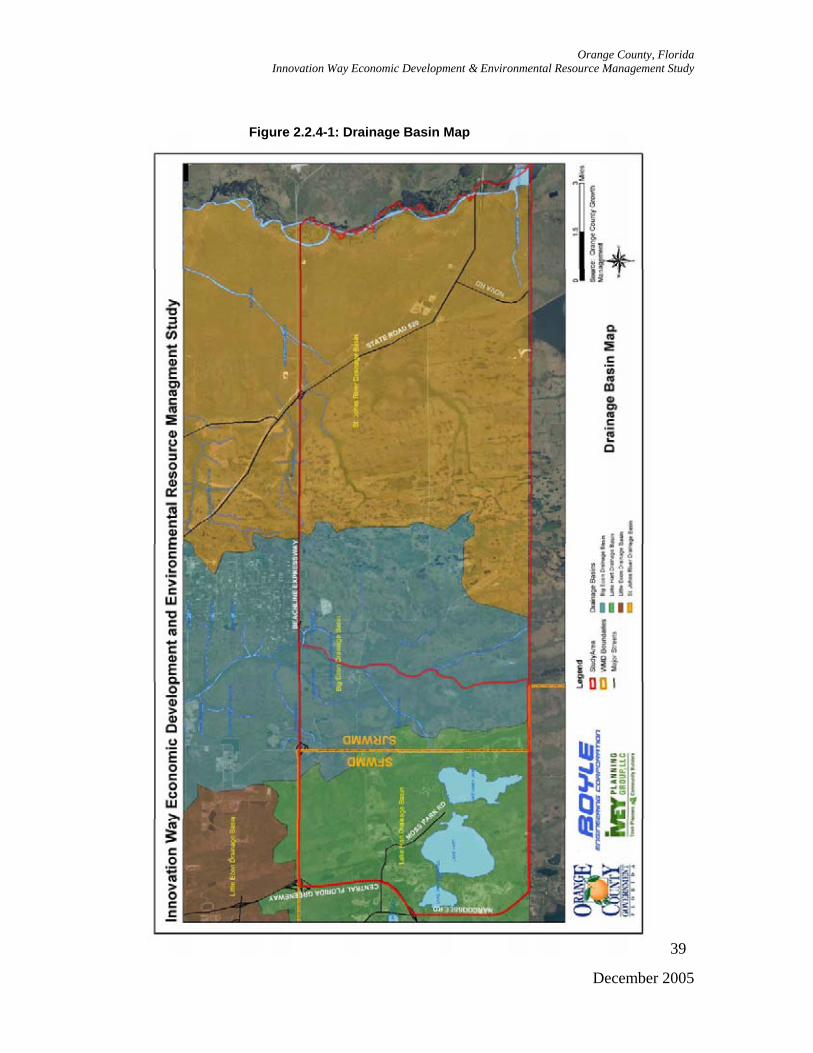
2.2.4 Drainage and Drainage Basins Drainage in the Study Area is currently accomplished through a series of ditches, lakes, canals, and streams. General drainage basin delineation is presented in Figure 2.2.4-1 Drainage Basin Map. In the developed areas within the Study Area, stormwater is routed from impervious areas such as parking lots, streets, etc., into swales and treatment ponds. Water seeps into the ground or flows out of these systems into the local ditches, lakes, canals and streams. There are two major hydrologic drainage basins within the Study Area, the Upper St. Johns River Basin and the Kissimmee River Basin. Predominant surface water flow within the Upper St. Johns River Basin is to the north and east and falls within the jurisdictional boundaries of the St. Johns River Water Management District (SJRWMD). Predominant surface water flow within the Kissimmee River Basin is to the south and west and falls within the jurisdictional boundaries of the South Florida Water Management District (SFWMD). Florida’s Water Management Districts regulate and govern stormwater management systems constructed to manage excess rainfall runoff within their jurisdictional boundaries. These large basins are further sub-divided into smaller drainage basins based on topography and typically associated with prominent water features (such as lakes and rivers) that collect drainage. Two drainage sub-basins within the Upper St. Johns River Basin that are located in the Study Area include the St. Johns River Drainage Basin and the Big Econ Drainage Basin. One drainage sub-basin within the Kissimmee River Basin that is located in the Study Area includes the Lake Hart Drainage Basin. The boundaries of these drainage sub-basins are shown on Figure 2.2.4-1; Drainage Basin Map.
Orange County, Florida Innovation Way Economic Development & Environmental Resource Management Study
December 2005
39
Figure 2.2.4-1: Drainage Basin Map
Orange County, Florida Innovation Way Economic Development & Environmental Resource Management Study
December 2005
40
2.2.5 Telecommunication Principal vendors for hard-wire telephone service in the Study Area include ATT and Sprint. Cellular telephone service is currently provided in the Study Area by a variety of vendors. Cable television services are provided by Brighthouse Networks and Strategic Technologies, Inc. These services are located generally within the developed corridors and along major traffic routes.
2.2.6 Power Two utility companies provide electric power within the study corridor. The Orlando Utility Commission, which owns the Stanton Energy Station and supplies power through a network of substations, transmission lines and distribution lines; Progress Energy, which distributes power through a network of substations, transmission lines and distribution lines. Figure 2.2.6-1 Utilities – Electric, presents the general service boundaries of these two utilities. Details of existing electric utility infrastructure and capacity were not made available due to security considerations.
2.2.7 Natural Gas Natural gas service in the vicinity of the Study Area is provided by two vendors, Florida Gas Transmission and Peoples Gas. Information about existing natural gas infrastructure and capacity was not available.
2.2.8 Solid Waste The Solid Waste Division is responsible for providing efficient and effective solid waste management services in Orange County. With over 2,500 tons of waste received daily, Orange County operates the largest publicly owned and operated landfill in Florida. In addition to the 5,000-acre landfill at the terminus of Young Pine Road, within one mile of the Study Area, the Solid Waste Division also operates household hazardous waste facilities and two solid waste transfer stations. These are the Porter Transfer Station, at 8750 White Road, and the McLeod Road Transfer Station at 5000 L.B. McLeod Road. The division is responsible for managing the residential garbage, yard waste and recycling collection program for single-family homes in unincorporated Orange County.

Orange County, Florida Innovation Way Economic Development & Environmental Resource Management Study
December 2005
41
Figure 2.2.6-1: Utilities – Electric
Orange County, Florida Innovation Way Economic Development & Environmental Resource Management Study
December 2005
42
2.3 Environmental The Study Area for the environmental analysis includes both the Eastern Study Area and the Western Study Area. The environmental data collection for the project concentrated on obtaining the necessary base data to undertake the study and to identify the ecological and physical environment within the Study Area. This process included extensive mapping of key data variables and development of information such as:
• Topography • Soils • Floodplains • Water resources • Vegetation/land use communities • Wetlands & other natural features • Protected species occurrences & habitats • Environmentally sensitive resources • Recorded conservation easements • Wildlife corridors • Ecological constraints – wetland dominance, ecological integrity, vegetative
biodiversity, biological connectivity, and physical constraints.
2.3.1 Ecological Resources The study area for the ecological analysis includes both the eastern and western study areas which encompass over 90,000 acres. The overall purpose of the environmental resource study is to address the protection of environmentally sensitive areas and areas of significant natural resources within the study area. The protection of these resources are necessary to ensure that adequate amounts of land are set aside as permanent open space for public benefit and to protect and preserve the significant natural resources. In order to identify the existing ecological resources within the study area, data collection concentrated on obtaining available data necessary to describe the natural resource environment within the area. From the environmental data collected, environmental base maps of the ecological resources have been prepared in order to describe the vegetation/land use, wetlands and other natural features, protected species occurrences and habitats, environmentally sensitive resources, and conservation areas. In order to identify and evaluate the existing environmental conditions of the study area, available ecological documents, maps, data, and other information were obtained from existing databases and Orange County. The resources used in this study included the following:
• Orange County GIS files; • Florida Natural Areas Inventory (FNAI) records;
Orange County, Florida Innovation Way Economic Development & Environmental Resource Management Study
December 2005
43
• St. Johns River Water Management District (SJRWMD) and South Florida Water Management District (SFWMD) databases;
• U.S. Fish & Wildlife Service (USFWS), National Wetlands Inventory (NWI) maps;
• Agency internet databases for threatened and endangered species information; • Environmental Constraints Analysis & Development Suitability Mapping. Orange
County Contract No. Y4-635. Final Report. March 31, 1995; • Vision Northwest Data Collection Report prepared for Orange County Planning
Department. October 1996; and • Other in-house databases.
As a result of the data collection efforts, the following maps have been prepared to document the existing ecological resources within the study area:
• Florida Land Use, Cover and Forms Classification System (FLUCCS) Map (Vegetation/Land Use);
• Wetland Areas – National Wetlands Inventory Map; • Areas of Conservation Interest – FNAI Map; • Protected Species and Biodiversity Hot Spots Map; • Orange County Conservation Areas Map (a combination of several subsets); • Strategic Habitat Conservation Areas Map; and • Econlockhatchee River Protection Area Map.
The information provided represents data obtained from available sources and does not include field reconnaissance data. Because of the sensitivity of the information provided by the FNAI, locations of known protected species (threatened, endangered, and species of special concern) are approximated. The data obtained from FNAI on the locations and potential occurrences of protected species within Orange County is included in the Protected Species & Biodiversity Hot Spots map.
2.3.2 Land Use/Vegetative Cover The combined study area was mapped using FLUCCS data obtained from SJRWMD and SFWMD. As shown on the FLUCCS Map, the following classification numbers represent each type of vegetation cover/land cover:
• 100-urban and build up; • 200-agriculture; • 300-rangeland; • 400-upland forests; • 500-water (aquatic systems); • 600-wetlands; • 700-barren lands; and • 800-transportation/communication/utilites.
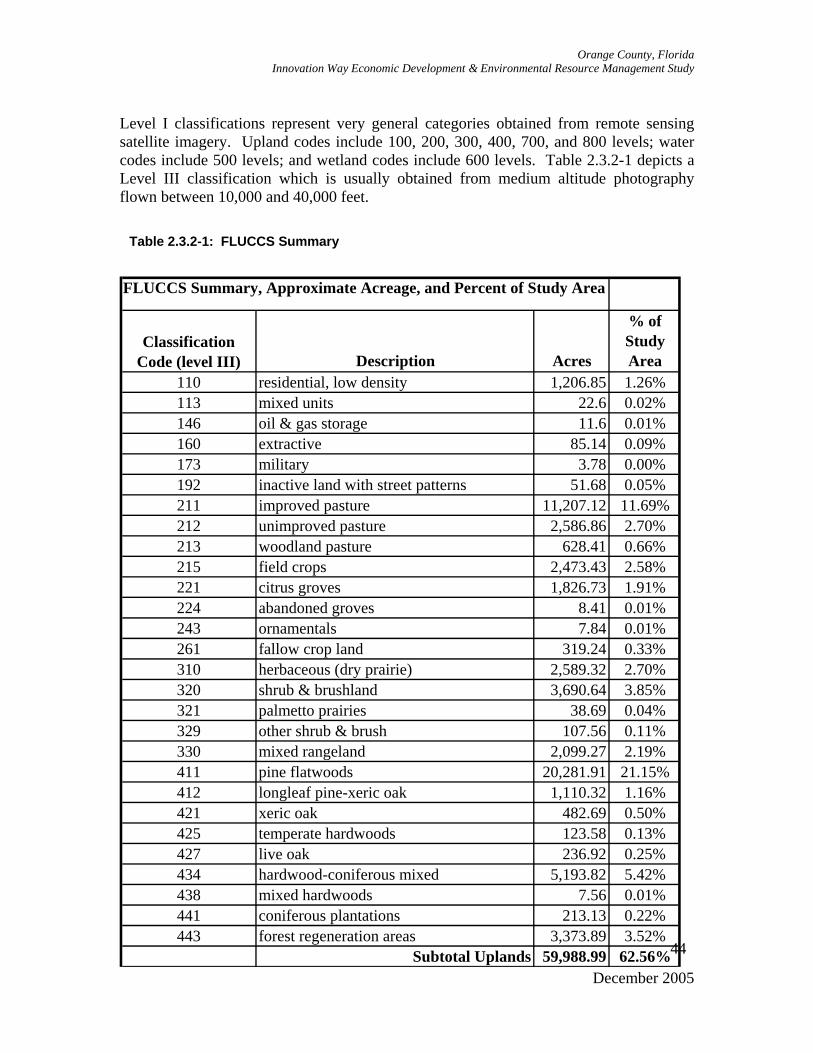
Orange County, Florida Innovation Way Economic Development & Environmental Resource Management Study
December 2005
44
Level I classifications represent very general categories obtained from remote sensing satellite imagery. Upland codes include 100, 200, 300, 400, 700, and 800 levels; water codes include 500 levels; and wetland codes include 600 levels. Table 2.3.2-1 depicts a Level III classification which is usually obtained from medium altitude photography flown between 10,000 and 40,000 feet.
FLUCCS Summary, Approximate Acreage, and Percent of Study Area
Description Acres
% of Study Area
residential, low density 1,206.85 1.26%mixed units 22.6 0.02%oil & gas storage 11.6 0.01%extractive 85.14 0.09%military 3.78 0.00%inactive land with street patterns 51.68 0.05%improved pasture 11,207.12 11.69%unimproved pasture 2,586.86 2.70%woodland pasture 628.41 0.66%field crops 2,473.43 2.58%citrus groves 1,826.73 1.91%abandoned groves 8.41 0.01%ornamentals 7.84 0.01%fallow crop land 319.24 0.33%herbaceous (dry prairie) 2,589.32 2.70%shrub & brushland 3,690.64 3.85%palmetto prairies 38.69 0.04%other shrub & brush 107.56 0.11%mixed rangeland 2,099.27 2.19%pine flatwoods 20,281.91 21.15%longleaf pine-xeric oak 1,110.32 1.16%xeric oak 482.69 0.50%temperate hardwoods 123.58 0.13%live oak 236.92 0.25%hardwood-coniferous mixed 5,193.82 5.42%mixed hardwoods 7.56 0.01%coniferous plantations 213.13 0.22%forest regeneration areas 3,373.89 3.52%
Subtotal Uplands 59,988.99 62.56%
441443
425427434438
330411412421
310320321329
221224243261
211212213215
146160173192
Classification Code (level III)
110113
Table 2.3.2-1: FLUCCS Summary
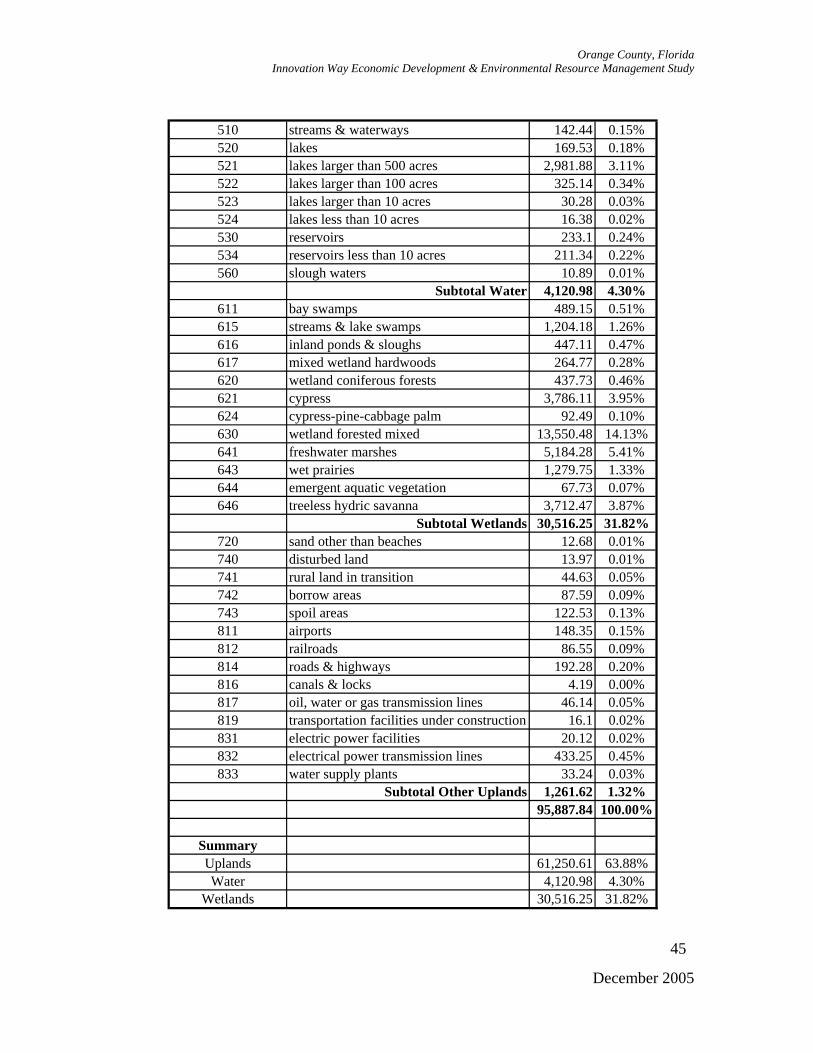
Orange County, Florida Innovation Way Economic Development & Environmental Resource Management Study
December 2005
45
streams & waterways 142.44 0.15%lakes 169.53 0.18%lakes larger than 500 acres 2,981.88 3.11%lakes larger than 100 acres 325.14 0.34%lakes larger than 10 acres 30.28 0.03%lakes less than 10 acres 16.38 0.02%reservoirs 233.1 0.24%reservoirs less than 10 acres 211.34 0.22%slough waters 10.89 0.01%
Subtotal Water 4,120.98 4.30%bay swamps 489.15 0.51%streams & lake swamps 1,204.18 1.26%inland ponds & sloughs 447.11 0.47%mixed wetland hardwoods 264.77 0.28%wetland coniferous forests 437.73 0.46%cypress 3,786.11 3.95%cypress-pine-cabbage palm 92.49 0.10%wetland forested mixed 13,550.48 14.13%freshwater marshes 5,184.28 5.41%wet prairies 1,279.75 1.33%emergent aquatic vegetation 67.73 0.07%treeless hydric savanna 3,712.47 3.87%
Subtotal Wetlands 30,516.25 31.82%sand other than beaches 12.68 0.01%disturbed land 13.97 0.01%rural land in transition 44.63 0.05%borrow areas 87.59 0.09%spoil areas 122.53 0.13%airports 148.35 0.15%railroads 86.55 0.09%roads & highways 192.28 0.20%canals & locks 4.19 0.00%oil, water or gas transmission lines 46.14 0.05%transportation facilities under construction 16.1 0.02%electric power facilities 20.12 0.02%electrical power transmission lines 433.25 0.45%water supply plants 33.24 0.03%
Subtotal Other Uplands 1,261.62 1.32%95,887.84 100.00%
61,250.61 63.88%4,120.98 4.30%
30,516.25 31.82%
UplandsWater
Wetlands
Summary
819831832833
812814816817
741742743811
646
720740
630641643644
617620621624
611615616
524530534560
520521522523
510

Orange County, Florida Innovation Way Economic Development & Environmental Resource Management Study
December 2005
46
Figure 2.3.2-1: FLUCCS Map
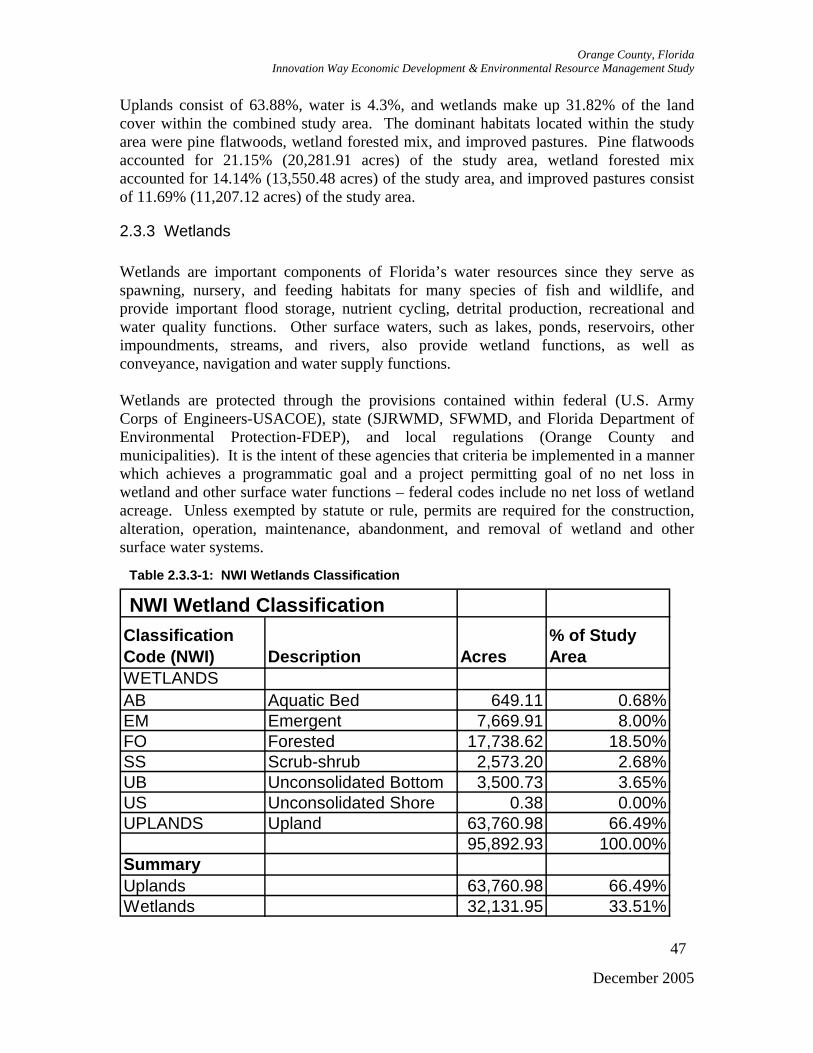
Orange County, Florida Innovation Way Economic Development & Environmental Resource Management Study
December 2005
47
Uplands consist of 63.88%, water is 4.3%, and wetlands make up 31.82% of the land cover within the combined study area. The dominant habitats located within the study area were pine flatwoods, wetland forested mix, and improved pastures. Pine flatwoods accounted for 21.15% (20,281.91 acres) of the study area, wetland forested mix accounted for 14.14% (13,550.48 acres) of the study area, and improved pastures consist of 11.69% (11,207.12 acres) of the study area.
2.3.3 Wetlands Wetlands are important components of Florida’s water resources since they serve as spawning, nursery, and feeding habitats for many species of fish and wildlife, and provide important flood storage, nutrient cycling, detrital production, recreational and water quality functions. Other surface waters, such as lakes, ponds, reservoirs, other impoundments, streams, and rivers, also provide wetland functions, as well as conveyance, navigation and water supply functions. Wetlands are protected through the provisions contained within federal (U.S. Army Corps of Engineers-USACOE), state (SJRWMD, SFWMD, and Florida Department of Environmental Protection-FDEP), and local regulations (Orange County and municipalities). It is the intent of these agencies that criteria be implemented in a manner which achieves a programmatic goal and a project permitting goal of no net loss in wetland and other surface water functions – federal codes include no net loss of wetland acreage. Unless exempted by statute or rule, permits are required for the construction, alteration, operation, maintenance, abandonment, and removal of wetland and other surface water systems.
Table 2.3.3-1: NWI Wetlands Classification
Classification Code (NWI) Description Acres
% of Study Area
WETLANDSAB Aquatic Bed 649.11 0.68%EM Emergent 7,669.91 8.00%FO Forested 17,738.62 18.50%SS Scrub-shrub 2,573.20 2.68%UB Unconsolidated Bottom 3,500.73 3.65%US Unconsolidated Shore 0.38 0.00%UPLANDS Upland 63,760.98 66.49%
95,892.93 100.00%SummaryUplands 63,760.98 66.49%Wetlands 32,131.95 33.51%
NWI Wetland Classification
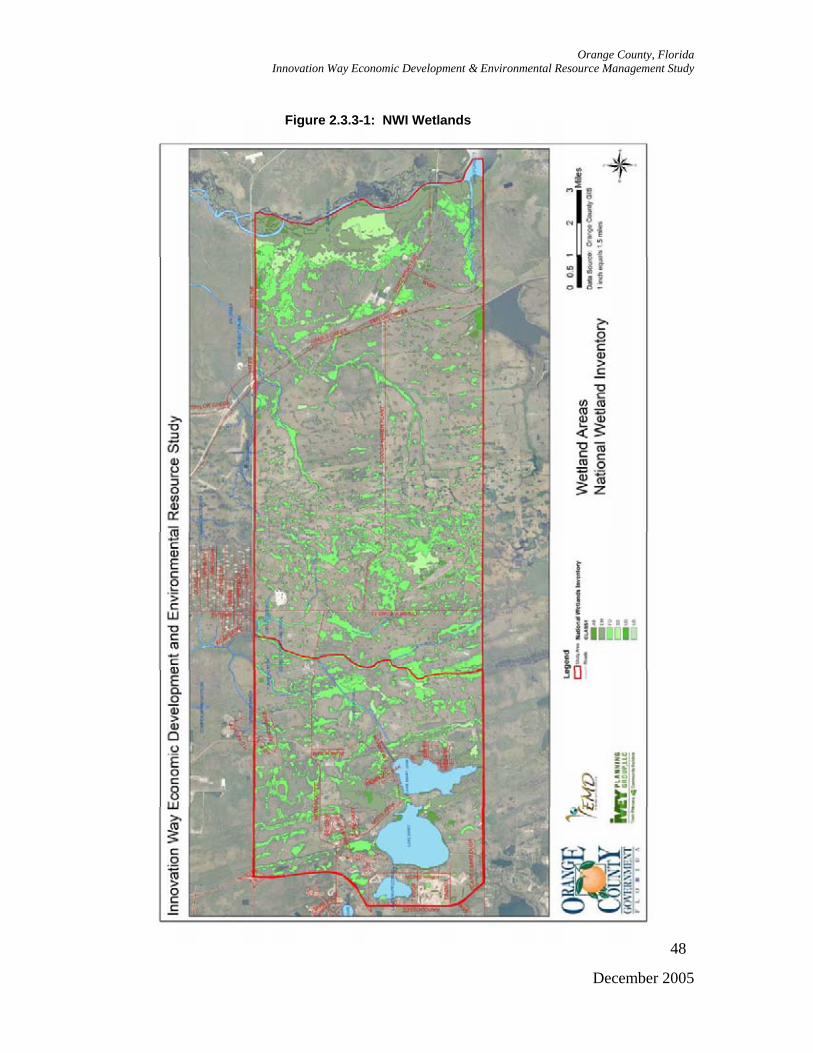
Orange County, Florida Innovation Way Economic Development & Environmental Resource Management Study
December 2005
48
Figure 2.3.3-1: NWI Wetlands
Orange County, Florida Innovation Way Economic Development & Environmental Resource Management Study
December 2005
49
As part of the permitting process, an upland buffer is generally provided adjacent to these systems. For this study, wetlands were mapped using the National Wetlands Inventory (NWI) developed by the USFWS (Figure 2.3.3-1 NWI Map). Wetlands were also defined using the Wetlands and Deepwater Habitats Classification System (Cowardin, 1979). According to the NWI information, the combined study area contains approximately 32,132 acres of wetlands as shown on Table 2.3.3-1. The classification codes are broadly described as palustrine, lacustrine (limnetic and littoral subsystems), or riverine systems. Palustrine systems include the vast majority of the inland marshes, bogs, and swamps and do not include any deepwater habitats. Lacustrine systems are deepwater dominated systems but include standing waterbodies such as lakes, reservoirs and deep ponds. Riverine systems are limited to freshwater river and stream channels and are mainly deepwater habitat systems. All three classification systems are further categorized into classes as described below: Aquatic Bed (AB) These habitats typically consist of algal, aquatic moss, rooted vascular, floating vascular, unknown submergent, or unknown surfaces. The aquatic beds class can be found within lacustrine (limnetic and littoral), palustrine, and riverine systems. Emergent (EM) The emergent class can be described as lacustrine (littoral), palustrine, or riverine systems. Within palustrine systems, this habitat can be either persistent or nonpersistent, whereas this habitat is nonpersistent within riverine and littoral systems. Scrub-Shrub (SS) The scrub-shrub class includes systems such as broad-leaved deciduous, needle-leaved deciduous, broad-leaved evergreen, needle-leaved evergreen, dead, deciduous, and evergreen. The scrub-shrub habitats are defined as palustrine systems. Forested (FO) The forested class includes systems such as broad-leaved deciduous, needle-leaved deciduous, broad-leaved evergreen, needle-leaved evergreen, dead, deciduous, and evergreen. This class is further defined as a palustrine system. Unconsolidated Bottom (UB) The unconsolidated bottom class generally includes open water habitats void of any vegetation. These systems can have cobble-gravel, sand, mud, or organic bottoms. These habitats can be lacustrine (limnetic and littoral), palustrine, or riverine.

Orange County, Florida Innovation Way Economic Development & Environmental Resource Management Study
December 2005
50
Unconsolidated Shore (US) The unconsolidated shore class generally includes open water habitats void of any vegetation. These habitats can be lacustrine (littoral), palustrine, or riverine. These systems can have cobble-gravel, sand, mud, or organic bottoms.
2.3.4 Areas of Conservation Interest The FNAI designates Areas of Conservation Interest (ACIs), which are sites that support currently unprotected lands of important natural resources and are delineated into three categories (Figure 2.3.4-1 Areas of Conservation Interest Map). Lands already on Florida’s Conservation and Recreation Lands (CARL) and Save Our Rivers (SOR) project lists are excluded from these categories. ACI Category A The identification of ACI Category A lands are based on FNAI documented occurrences of rare, imperiled, or outstanding populations of animals, plants, or natural communities supplemented by aerial photo-interpretation of the vegetation surrounding the occurrence. Each identified site contains one or more occurrences of FNAI-tracked species or natural communities. ACI Categories B and C ACI Categories B and C are identified primarily from aerial photo-interpretation of natural communities by FNAI scientists and from public input during the Regional Ecological Workshops (REW) held in each Regional Planning Council during 1993 and 1994. Category B lands are considered to have higher priority than Category C lands based on the quality, size, and rarity of their natural communities. Out Parcel The Out Parcel designation is used to describe lands that are not in an Area of Conservation Interest. The current dataset used in the three categories was completed in March 1995. The quantity and quality of data collected by FNAI are dependent on the research and observations of many individuals and organizations and are typically not the result of comprehensive or site-specific field surveys. Within the combined study area, there are approximately 56,500 acres of ACI Category B lands as shown on the Areas of Conservation Interest Map. ACI Category A or Category C features are not identified in the area evaluated.
2.3.5 Protected Species and Biodiversity Hot Spots The Florida Natural Areas Inventory (FNAI) database was used in order to determine protected species found within the combined Study Area.
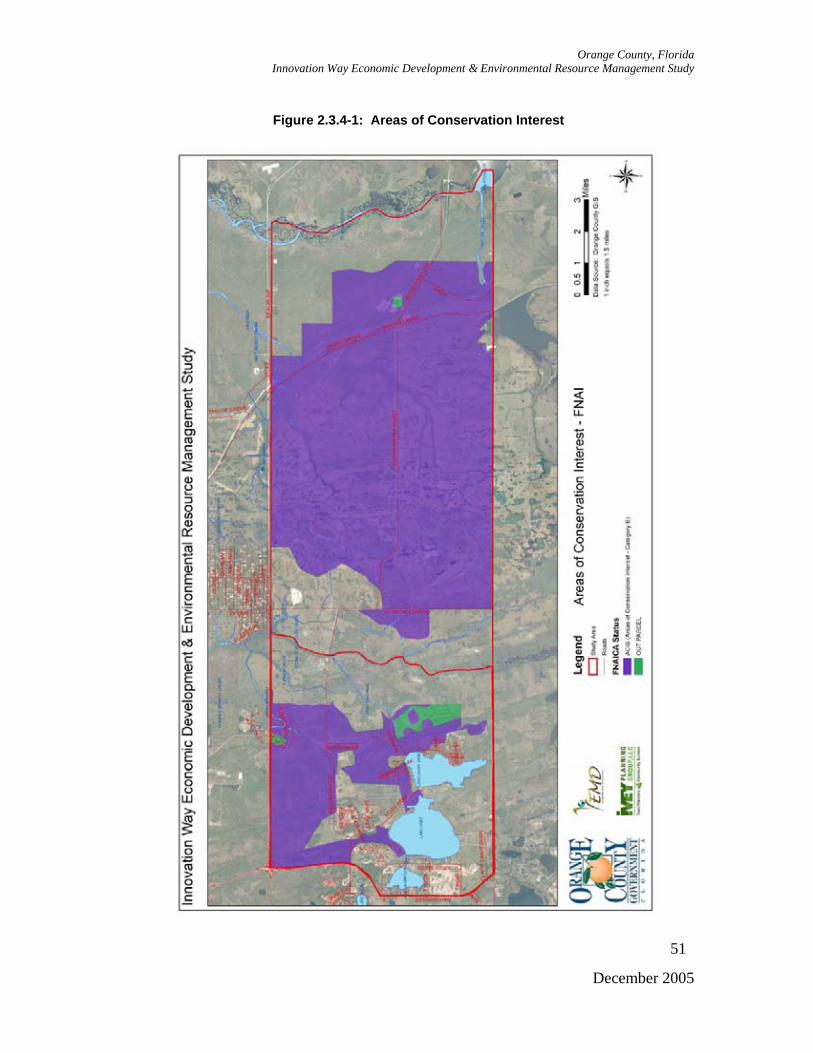
Orange County, Florida Innovation Way Economic Development & Environmental Resource Management Study
December 2005
51
Figure 2.3.4-1: Areas of Conservation Interest
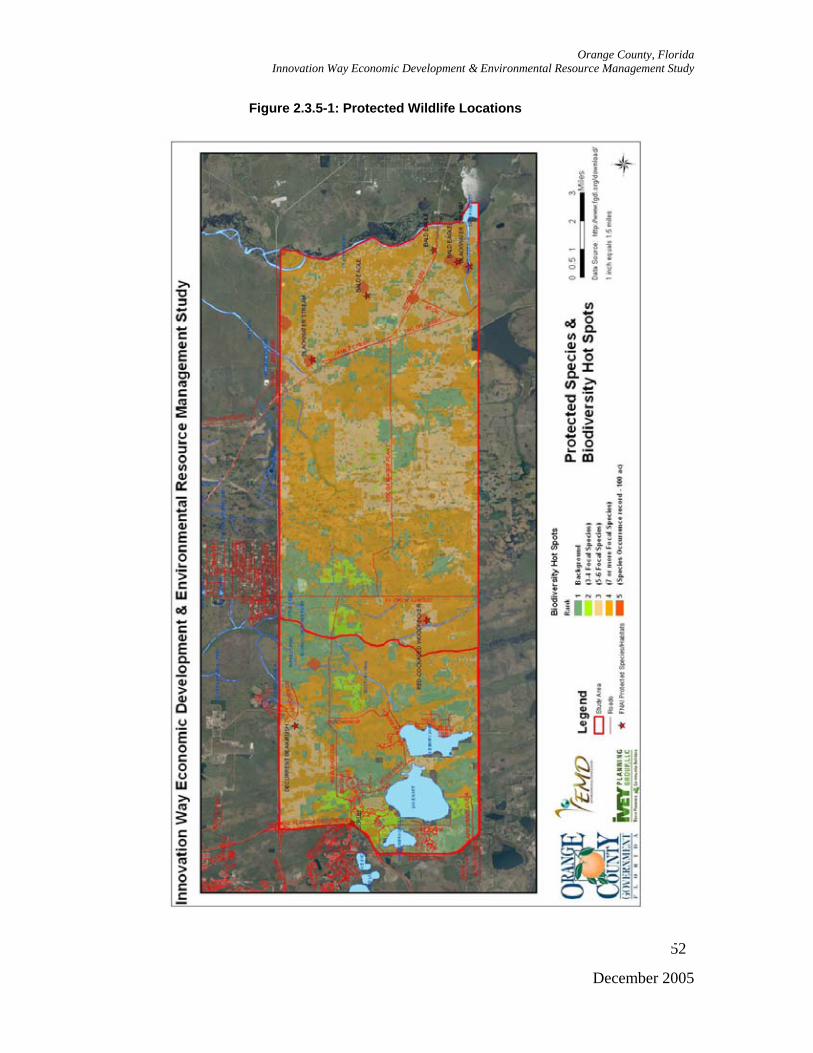
Orange County, Florida Innovation Way Economic Development & Environmental Resource Management Study
December 2005
52
Figure 2.3.5-1: Protected Wildlife Locations
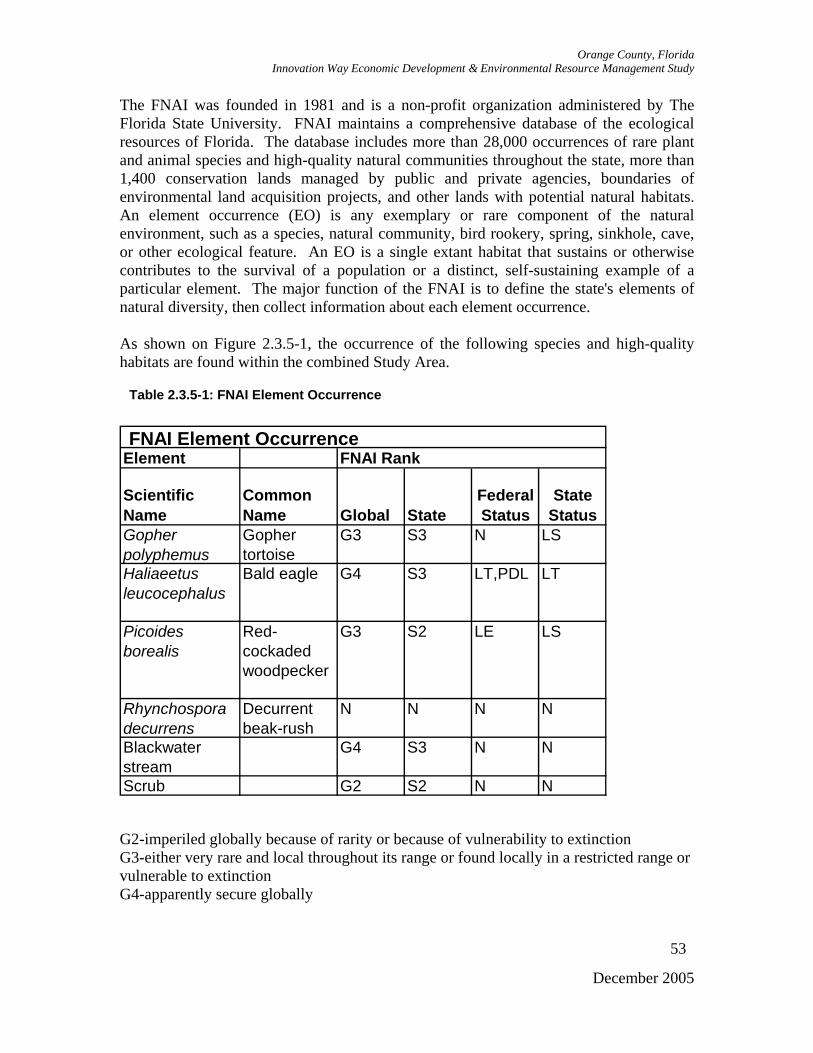
Orange County, Florida Innovation Way Economic Development & Environmental Resource Management Study
December 2005
53
The FNAI was founded in 1981 and is a non-profit organization administered by The Florida State University. FNAI maintains a comprehensive database of the ecological resources of Florida. The database includes more than 28,000 occurrences of rare plant and animal species and high-quality natural communities throughout the state, more than 1,400 conservation lands managed by public and private agencies, boundaries of environmental land acquisition projects, and other lands with potential natural habitats. An element occurrence (EO) is any exemplary or rare component of the natural environment, such as a species, natural community, bird rookery, spring, sinkhole, cave, or other ecological feature. An EO is a single extant habitat that sustains or otherwise contributes to the survival of a population or a distinct, self-sustaining example of a particular element. The major function of the FNAI is to define the state's elements of natural diversity, then collect information about each element occurrence. As shown on Figure 2.3.5-1, the occurrence of the following species and high-quality habitats are found within the combined Study Area.
G2-imperiled globally because of rarity or because of vulnerability to extinction G3-either very rare and local throughout its range or found locally in a restricted range or vulnerable to extinction G4-apparently secure globally
Table 2.3.5-1: FNAI Element Occurrence
Element
Gopher polyphemus
Gopher tortoise
G3 S3 N LS
Haliaeetus leucocephalus
Bald eagle G4 S3 LT,PDL LT
Picoides borealis
Red-cockaded woodpecker
G3 S2 LE LS
Rhynchospora decurrens
Decurrent beak-rush
N N N N
Blackwater stream
G4 S3 N N
Scrub G2 S2 N N
FNAI Rank
Scientific Name
Common Name Global State
FNAI Element Occurrence
FederalStatus
State Status
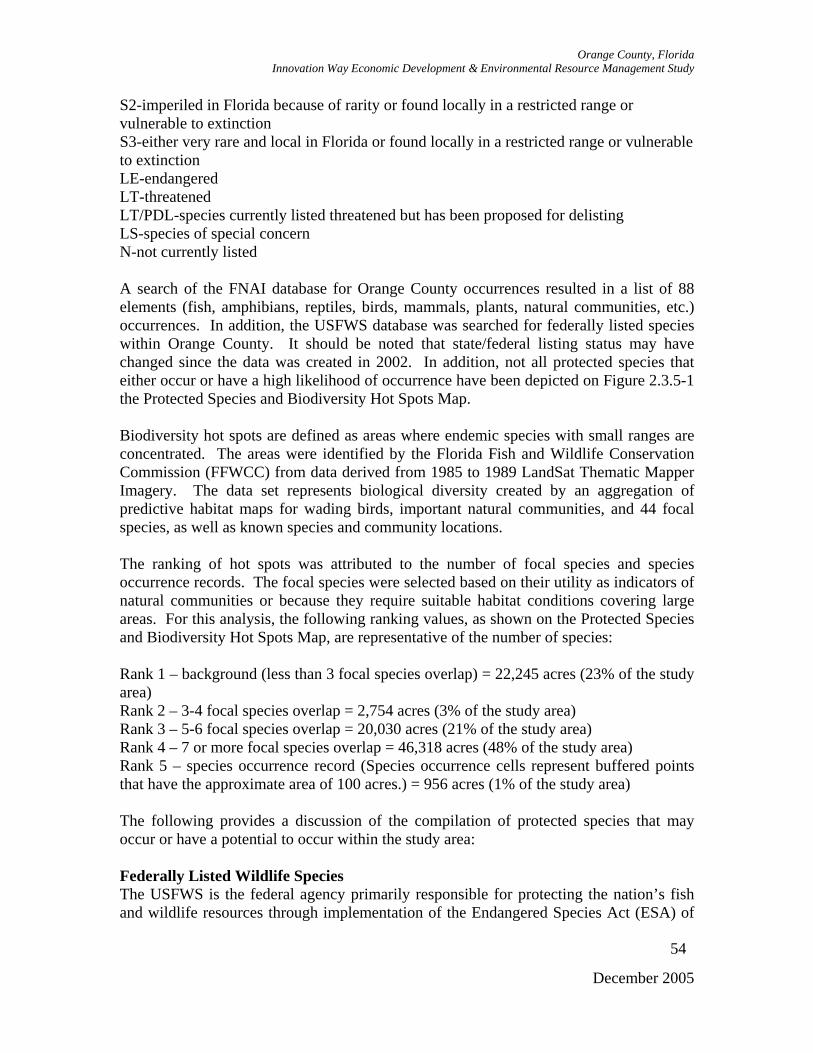
Orange County, Florida Innovation Way Economic Development & Environmental Resource Management Study
December 2005
54
S2-imperiled in Florida because of rarity or found locally in a restricted range or vulnerable to extinction S3-either very rare and local in Florida or found locally in a restricted range or vulnerable to extinction LE-endangered LT-threatened LT/PDL-species currently listed threatened but has been proposed for delisting LS-species of special concern N-not currently listed A search of the FNAI database for Orange County occurrences resulted in a list of 88 elements (fish, amphibians, reptiles, birds, mammals, plants, natural communities, etc.) occurrences. In addition, the USFWS database was searched for federally listed species within Orange County. It should be noted that state/federal listing status may have changed since the data was created in 2002. In addition, not all protected species that either occur or have a high likelihood of occurrence have been depicted on Figure 2.3.5-1 the Protected Species and Biodiversity Hot Spots Map. Biodiversity hot spots are defined as areas where endemic species with small ranges are concentrated. The areas were identified by the Florida Fish and Wildlife Conservation Commission (FFWCC) from data derived from 1985 to 1989 LandSat Thematic Mapper Imagery. The data set represents biological diversity created by an aggregation of predictive habitat maps for wading birds, important natural communities, and 44 focal species, as well as known species and community locations. The ranking of hot spots was attributed to the number of focal species and species occurrence records. The focal species were selected based on their utility as indicators of natural communities or because they require suitable habitat conditions covering large areas. For this analysis, the following ranking values, as shown on the Protected Species and Biodiversity Hot Spots Map, are representative of the number of species: Rank 1 – background (less than 3 focal species overlap) = 22,245 acres (23% of the study area) Rank 2 – 3-4 focal species overlap = 2,754 acres (3% of the study area) Rank 3 – 5-6 focal species overlap = 20,030 acres (21% of the study area) Rank 4 – 7 or more focal species overlap = 46,318 acres (48% of the study area) Rank 5 – species occurrence record (Species occurrence cells represent buffered points that have the approximate area of 100 acres.) = 956 acres (1% of the study area) The following provides a discussion of the compilation of protected species that may occur or have a potential to occur within the study area: Federally Listed Wildlife Species The USFWS is the federal agency primarily responsible for protecting the nation’s fish and wildlife resources through implementation of the Endangered Species Act (ESA) of
Orange County, Florida Innovation Way Economic Development & Environmental Resource Management Study
December 2005
55
1973, as amended, 16 U.S.C. §§ 1531-1543. The USFWS has the responsibility for terrestrial and freshwater species. Florida Panther The Florida panther (Puma concolor coryi) is a federal and state listed endangered species. In the South Florida Multi-Species Recovery Plan (USFWS, 1999) it was estimated that the panther population in south Florida was between 30 and 50 adults (30 to 80 total individuals). In 2002, the Panther sub-team of the Multi-Species Ecosystem Recovery and Implementation Team (MERIT) mapped panther population extents and drafted a landscape conservation strategy (FFWCC. 2005. Use of Least Cost Pathways to Identify Key Highway Segments for Panther Conservation). It was documented that the primary zone supports nearly all of the current (2002) population of 80 to 100 panthers. The habitat of the panther is characteristic of an extensive landscape comprised of a mix of natural, semi-natural, and agricultural land uses. Large patches of forested habitats are an important component of the Florida panther’s habitat. Preferred panther habitat includes mixed swamp forest, hardwood hammock, and pine flatwoods. Habitat loss and fragmentation remain one of the greatest threats to the Florida panther. The survival and recovery of the panther is dependent on 1) protection and enhancement of the existing population, associated habitats, and prey resources, 2) improving genetic health and population viability, and 3) re-establishing at least two populations within the panther’s historic range. The current known range of the Florida panther is limited to South Florida, generally south of the Caloosahatchee River; however, occurrences have been identified outside of this area. Over the last thirty years, there have been 19 panthers (18 males), of which four were radio collared, documented north of the Caloosahatchee River. The following information provides documentation of known panther locations the central Florida area:
• In June of 2005, the FFWCC reported that a male panther was struck by a car on I-95 on the Flagler and St. Johns County Line (FFWCC. June 7, 2005. Panther Struck by I-95 Motorist. News Release).
• In May 2000, a radio collared male panther (FP62) began what was described as a secondary dispersal event. This panther was the first documented to cross the Caloosahatchee River in April 1998 (Bureau of Wildlife Diversity Conservation. 2000. Florida Panther Genetic Restoration and Management Annual Performance Report 1999-2000). Over the next two months, this panther continued northward, almost reaching I-4 west of Orlando. By July 1998, this panther settled into a known use area within Catfish Creek, Polk County, with occasional north (crossing I-4 twice) and east (crossing the Florida Turnpike) movements. In May 2000, FP62 vacated the Catfish Creek area and headed east towards Vero Beach. The panther crossed the Florida Turnpike and U.S. 441, traveling north along the St. John’s River until reaching the shore of Lake Washington in Brevard County. FP62 then turned southwest passing through the Bull Creek area in Osceola County before heading south through Blue Cypress

Orange County, Florida Innovation Way Economic Development & Environmental Resource Management Study
December 2005
56
Lake in Indian River County. The panther then resumed his movement south and west to the Kissimmee River, Lake Istokpoga, and finally crossed U.S. 27 to the west. FP62 was last recorded on the Glades-Charlotte County line on June 23, 2000 and began centering his location movements in and around Telegraph Swamp before his transmitter failed on June 24, 2000.
• On September 25, 1989, panther hair samples from a vehicle grill was identified within Korona, Flagler County (McBride. 2002. Florida Panther Current Verified Population, Distribution, and Highlights of Field Work: Fall 2001-Winter 2002).
• On July 3, 1989, tracks of a male panther were identified with the Relay Wildlife Management Area (WMA) in Flagler County (McBride. 2002. Florida Panther Current Verified Population, Distribution, and Highlights of Field Work: Fall 2001-Winter 2002).
• On December 19, 1987, a male skeleton was found by a deer hunter within Farmton WMA in Volusia County (McBride. 2002. Florida Panther Current Verified Population, Distribution, and Highlights of Field Work: Fall 2001-Winter 2002).
• On November 2, 1986, tracks of a male were identified within Tosohatchee WMA within Orange County (McBride. 2002. Florida Panther Current Verified Population, Distribution, and Highlights of Field Work: Fall 2001-Winter 2002).*
• On March 9, 1986, tracks of a male were identified within Deseret Ranch in Orange County (McBride. 2002. Florida Panther Current Verified Population, Distribution, and Highlights of Field Work: Fall 2001-Winter 2002).*
• On January 3, 1986, tracks of a male were identified within Mud Lake Canal, Tosohatchee WMA in Orange County (McBride. 2002. Florida Panther Current Verified Population, Distribution, and Highlights of Field Work: Fall 2001-Winter 2002).*
• On August 10, 1984, tracks of a male were identified within Relay WMA within Flagler County (McBride. 2002. Florida Panther Current Verified Population, Distribution, and Highlights of Field Work: Fall 2001-Winter 2002).
• On March 31, 1984, tracks of a male were identified within the Lighter Hunt Club in Volusia County (McBride. 2002. Florida Panther Current Verified Population, Distribution, and Highlights of Field Work: Fall 2001-Winter 2002).
*Documentation is within the Innovation Way study area. From the Florida Panther Habitat Conservation report – How Much is Enough? Landscape-scale Conservation for the Florida Panther (Kautz et. al.) obtained from the USFWS in September 2005, panther telemetry location data does not place the panther within the boundaries of the combined study area from 1981 to 2001; however, there have been two confirmed male panther tracks documented by McBride (2002) at the Tosohatchee WMA which is located within the study area. There has not been any other confirmed documentation of the panther within study area since 1986. The study area does not fall within the USFWS Florida Panther Consultation Area specified in the Standard Local Operating Procedures for Endangered Species.
Orange County, Florida Innovation Way Economic Development & Environmental Resource Management Study
December 2005
57
Wood Stork The wood stork (Mycteria americana) is listed by USFWS and FFWCC as an endangered species. Wood storks are typically found within marshes, cypress swamps, open water ditches, lacustrine systems, seepage streams, and ruderal areas. Storks nest in colonies (rookeries), and typically roost and feed in flocks. Feeding, nesting, and roosting habitat management and guidelines are described below. To the maximum extent possible, feeding sites should be protected by adherence to the following protection zones and guidelines:
• There should be no human intrusion into feeding sites when storks are present. Depending upon the amount of screening vegetation, human activity should be no closer than between 300 feet (where solid vegetation screens exist) and 750 feet (no vegetation screen).
• Feeding sites should not be subjected to water management practices that alter traditional water levels or the seasonally normal drying patterns and rates. Sharp rises in water-levels are especially disruptive to feeding storks.
The introduction of contaminants, fertilizers, or herbicides into wetlands that contain stork feeding sites should be avoided; especially those compounds that could adversely alter the diversity and numbers of native fishes, or that could substantially change the characteristics of aquatic vegetation. Increase in the density and height of emergent vegetation can degrade or destroy sites as feeding habitat. Construction of tall towers (especially with guy wires) within three miles, or high power lines (especially across long stretches of open country) within one mile of major feeding sites should be avoided. Management zones and guidelines for nesting colonies are dependent on the distance of activity from the nesting area. These zones are known as the primary and secondary zones and are discussed below: The primary zone is the most critical area and must be managed according to recommended guidelines to insure that a colony site survives. The primary zone must extend between 1,000 and 1,500 feet in all directions from the actual colony boundaries when there are no visual or broad aquatic barriers, and never less than 500 feet even when there are strong visual or aquatic barriers. The secondary zone is utilized to minimize disturbances that might impact the primary zone, and to protect essential areas outside of the primary zone. The secondary zone may be used by storks for collecting nesting material, roosting, loafing, and feeding, and may be important as a screen between the colony and areas of relatively intense human activities. The secondary zone should range outward from the primary zone 1,000 to 2,000 feet or to a radius of 2,500 feet of the outer edge of the colony. Numerous sightings of wood stocks (anecdotal information) have been identified within the study area.

Orange County, Florida Innovation Way Economic Development & Environmental Resource Management Study
December 2005
58
Bald Eagle The bald eagle (Haliaeetus leucocephalus) is listed by USFWS and FFWCC as threatened in Florida. Bald eagles are considered water-dependent species typically found near estuaries, large lakes, reservoirs, major rivers, and some seacoast habitats. The nesting habitat of eagles typically includes a nest tree, perch sites, roost sites, and adjacent high-use areas, which collectively comprise the nesting territory. Current threats to the bald eagle include habitat fragmentation and loss, collisions with cars and power lines, and shooting. Bald eagle guidelines include a primary protection zone of 750 feet encompassing the nest tree. This zone is the most critical area and must be maintained to promote acceptable conditions for the breeding eagles. Construction activities should not occur within this zone at any time. A secondary zone typically encompasses an area extending from the primary zone an additional 750 feet (1,500 feet total radius). This zone helps minimize any disturbance that might compromise the integrity of the primary zone. Active bald eagle nests have been identified within the study area. Red-cockaded Woodpecker The red-cockaded woodpecker (Picoides borealis) is listed as endangered by the USFWS and as a species of special concern by the FFWCC. The red-cockaded woodpecker requires old growth pine stands for nesting. Open stands of pines with a minimum age of 80 to 120 years, depending on the site, provide suitable nesting habitat. Longleaf pines (Pinus palustris) are most commonly used, but other species of southern pine, including slash pine (Pinus elliottii), are also acceptable. Foraging habitat is provided in pine and pine/hardwood stands 30 years old or older with foraging preference for pine trees 10 inches or larger in diameter. In good, well-stocked, pine habitat, sufficient foraging substrate can be provided on 80 to 125 acres. The territory for a group averages about 200 acres, but observers have reported territories running from a low of around 60 acres, to an upper extreme of more than 600 acres. The expanse of territories is related to both habitat suitability and population density. There are known occurrences of the red-cockaded woodpecker in the study area. Florida Scrub Jay The Florida scrub jay (Aphelocoma coerulescens) is listed by USFWS and FFWCC as a threatened species. The Florida scrub jay has extremely specific habitat requirements and prefers large tracts of scrub habitat. It is endemic to peninsular Florida’s ancient dune ecosystems of scrubs which occur on well-drained to excessively well-drained sandy soils. Relict oak-dominated scrub, or xeric oak scrub, is essential habitat to the Florida scrub jay. This community type has adapted to nutrient-poor soils, periodic drought, high seasonal rainfall and frequent fires.
Orange County, Florida Innovation Way Economic Development & Environmental Resource Management Study
December 2005
59
Eastern Indigo Snake The eastern indigo snake (Drymarchon corais couperi) is designated as threatened by USFWS and FFWCC. The eastern indigo snake is considered a commensal species of the gopher tortoise and has been observed within the study area. Audubon’s Crested Caracara The Audubon’s crested caracara (Caracara cheriway) is a federal and state listed threatened species. The Audubon’s crested caracara occurs in dry or wet prairie areas with scattered cabbage palms (Sabal palmetto). It may also be found in lightly wooded areas. Although no management activities have been undertaken for the caracara, draft habitat management guidelines are being developed that should aid in the recovery. There are known occurrences of the Audubon’s crested caracara in the study area. American Alligator The American alligator (Alligator mississippiensis) is federally listed as threatened due to the similarity of appearance to the endangered American crocodile (Crocodylus acutus). The American alligator is also state listed as a species of special concern. The American alligator is not typically expected to be directly impacted by development as these are highly mobile animals which relocate naturally due to conditions such as water levels and adequacy of food supplies. It has been documented that the American alligator occurs within the study area. State Listed Wildlife Species Article IV, Section 9 of the Florida Constitution authorizes the FFWCC to “exercise the regulatory and executive powers in the state with regard to wild animal life and fresh water aquatic life…” The FFWCC regulates the taking of endangered species, threatened species, and species of special concern, and their nests. The FFWCC also provides technical assistance to other agencies that have regulatory authority over activities that may affect fish and wildlife and its habitat. Florida Sandhill Crane The Florida sandhill crane (Grus Canadensis pratensis) is listed as threatened in Florida. Cranes typically require marsh habitat with standing water for nest building and protection of their young. Foraging occurs in open pastureland, ruderal areas, dry prairies, freshwater marshes, and roadsides. Known nest sites occur within the study area (anecdotal information). Florida Burrowing Owl The Florida burrowing owl (Athene cunicularia floridana) is listed as a species of special concern in Florida. Preferential habitat includes open pastures, dry prairies, sandhills, ruderal sites, golf courses, and grassy areas associated with airport runways. Gopher Tortoise and Associated Commensal Species

Orange County, Florida Innovation Way Economic Development & Environmental Resource Management Study
December 2005
60
The gopher tortoise (Gopherus polyphemus) is listed as a species of special concern by the state. The tortoise is typically found in old fields, sandhill, scrub, xeric hammock, pine flatwoods, and ruderal sites. They are known to occupy well-drained, sandy soils that are ideal for the digging habits of tortoises and to construct burrows. These habitats generally have an abundance of herbaceous ground cover and a generally open canopy with sparse shrub cover. Periodic natural fires play an important role in maintaining tortoise habitat by opening up the canopy and promoting growth of herbaceous food plants. Fire suppressed habitats may become unsuitable for tortoises. The FFWCC has identified the following habitat types which it considers important gopher tortoise habitat: North Florida coastal strand, south Florida coastal strand, north Florida flatwoods, south Florida flatwoods, sand pine scrub, longleaf-pine-turkey oak hills, mixed hardwood and pine, upland hardwood hammocks, and oak hammocks. Gopher tortoise occurrences have been documented within the study area. Several listed species, known as commensal species, are commonly associated with gopher tortoise burrows. These include the gopher frog (Rana capito), Florida mouse (Podomys floridanus), and Florida pine snake (Pituophis melanoleucus magitus), eastern indigo snake, and burrowing owl. Southeastern American kestrel The southeastern American kestrel (Falco sparverius paulus), state listed as threatened, is typically found in pasture, sandhill, mesic flatwoods, ruderal, dry prairie, and open brushland areas where possible snags are present. Sherman's fox squirrel Fox squirrels (Sciurus niger shermani), state listed as species of special concern, typically utilize mature, fire-maintained, longleaf pine-turkey oak sandhill, pine flatwoods, and pastures and other open, ruderal habitats with scattered pines and oaks. There are known occurrences of the Sherman’s fox squirrel in the study area. Wading Bird Species The wetland communities in the study area offer foraging and nesting habitat for listed species of wading birds, including limpkin (Aramus guarauna), little blue heron (Egretta caerulea), snowy egret (E. thula), reddish egret (E. rufescens), (tricolored heron (E. tricolor), and white ibis (Eudocimus albus). All species are listed as species of special concern in Florida and have a high potential for occurrence in the area.

Orange County, Florida Innovation Way Economic Development & Environmental Resource Management Study
December 2005
61
2.3.6 Conservation Areas Conservation lands represent areas determined by the FNAI to be habitats (primarily wetlands) to be of significant value. The Conservation Area dataset was maintained at the GeoPlan Center until the fall of 1999 then transferred to the FNAI. This database was compiled to support the planning of a statewide greenways system by the Florida Greenways Commission and may not be suitable for other purposes. The Orange County Conservation Areas Map represents conservation areas designated as the following:
• Conservation and Recreation Lands (CARL) potential acquisition • Existing Conservation Lands • Wetlands
The potential acquisition areas consist of SJRWMD’s CARL project boundaries, SFWMD’s Save Our Rivers, and Florida Managed Lands (FLMA). FLMA sites include public and some private lands that FNAI has identified as having natural resource values and managed at least partially for conservation purposes. Included within this map is the Upper Econ Mosaic potential acquisition area which is approximately 32,140 acres within Orange and Osceola Counties. This area was included on the CARL/Florida Forever list in order to preserve natural lands around existing conservation areas, maintain habitat that the diverse wildlife needs to survive, and ensure that the public will still be able to enjoy the natural landscape. The ranking history for the CARL/Florida Forever acquisition projects listed the Upper Econ Mosaic as a priority project from 1996 to 2004; however, the 2005 Florida Forever five-year plan shows that the Upper Econ Mosaic was removed from the list in January 2005 (FDEP, 2005). Also included on the Orange County Conservation Areas Map are existing conservation lands within the study area – Split Oak Nature Preserve, World Gateway DRI mitigation area, Wildlife Crossing, TM-Econ Mitigation Bank, TM Ranch mitigation area, Moss Park, Crosby Island Marsh, Live Oaks Estates, Henson Tract, and Tosahatchee State Reserve. Wetland areas have been identified using the NWI maps for the area. In summary, there are approximately 41,505 acres of conservation lands within the combined study area. Habitat Corridors/Biological Connectivity The Orange County Conservation Areas map (Figure 2.3.6-1) also identifies areas which may be important to the upholding of biological connectivity between managed conservation areas. These areas, known as “wildlife or habitat corridors”, are necessary because they maintain biodiversity, allow populations to interbreed, and provide access to

Orange County, Florida Innovation Way Economic Development & Environmental Resource Management Study
December 2005
62
larger habitats. It is crucial that these areas be protected since they increase the effective amount of habitat that is available for species and effectively reverse habitat fragmentation and biological isolation in natural preserves. Most wildlife corridors, both remnant and designed, are riparian corridors that are essential to protect river systems. These corridors provide both aquatic and terrestrial connectivity as well as significant recreational opportunities. At the largest scale, widths are typically several miles wide; however, wildlife corridors can also be beneficial at smaller scales. When roads or other infrastructure cross a wildlife corridor, it is essential to maintain transportation connections that do not diminish the effectiveness of the corridor. Structural solutions to make roads more wildlife friendly are possible by providing safe passage across a road through means of routing wildlife above or below the traffic flow. Wildlife underpasses are tunnels, culverts, or other structures that often include fencing and strategically placed vegetation to funnel animals to the safe crossing points. Wildlife overpasses or “land bridges” let wildlife cross above the highway. Longer bridge spans also allow more space for wildlife passage since many animals use floodplains and water bodies to move from one corridor to the next. It is logical and easy to design bridge ends to extend farther beyond the floodplain or water body than is required in addition to being less expensive than a separate wildlife crossings under an existing roadway. Wetlands and open water typically serve as the preferred habitat corridor route over all other cover types. Riverine systems and their associated wetlands also create natural corridors for the movement of both wildlife and nutrients through an ecosystem. Furthermore, the regulatory protection afforded wetlands makes them a better candidate as the backbone of any habitat corridor scheme, since they are most likely to be protected over time. Utilizing existing and potential conservation lands, wetlands, and river ecosystems as anchor points to habitat corridors seems to be the most logical approach. The intermixed uplands and open space along with decreased edge effect are also essential to the integrity of the corridors. There are three major north-south potential corridors that have been identified within the Innovation Way combined study area. The first potential corridor is located along the eastern boundary of the study area and is comprised of the conservation lands associated with the St. Johns River along with the Tosahatchee State Reserve. The second potential corridor is located within the central portion of the study area and consists of conservation lands associated with the Econ River, the Upper Econ Mosaic that is identified as a potential acquisition under CARL lands, TM Ranch Mitigation area, and TM-Econ Mitigation Bank. The third potential corridor is located within the western portion of the study area and consists of Split Oak Nature Preserve, World Gateway DRI mitigation area, Wildlife Crossing, Moss Park, Crosby Island Marsh, Live Oaks Estates, Henson Tract, and the existing wetlands north of the Crosby Island Marsh.

Orange County, Florida Innovation Way Economic Development & Environmental Resource Management Study
December 2005
63
Figure 2.3.6-1: Orange County Conservation Areas

Orange County, Florida Innovation Way Economic Development & Environmental Resource Management Study
December 2005
64
2.3.7 Strategic Habitat Conservation Areas The FFWCC’s report, Closing the Gaps in Florida’s Wildlife Habitat Conservation System (Cox et al. 1994) identified Strategic Habitat Conservation Areas (SHCAs) in Florida that are important conservation needs for each of 40 rare and imperiled vertebrates, four rare natural communities, and 105 globally rare plants. SHCAs identify habitat areas that should be conserved if key components of the state’s biological diversity are to be maintained. In 2000, the FFWCC developed a system to prioritize the SHCAs that had not been placed into conservation. The approach for prioritizing SHCAs for species was based on species listing status (i.e., endangered, threatened, species of special concern, unlisted), geographic distribution in Florida, and dependence on upland versus wetland habitats. Upland-dependent species listed as endangered were assumed to be the most threatened and received the highest ranking. The four rare natural communities (sandhill, scrub, pine rockland, and tropical hardwood hammock) were ranked as the highest priority. In order to be classified as a Potential Natural Area, the natural communities identified through aerial photographs had to meet the following criteria: Must be a minimum of 500 acres except for sandhill (minimum of 320 acres), scrub (minimum of 80 acres), and pine rockland (minimum 20 acres); must contain at least one of the following: 1) one or more high quality examples of FNAI state-ranked S3 or above natural communities or 2) an outstanding example of any FNAI tracked natural community. These rare natural communities, as defined by FNAI and FFWCC, are described in the following paragraphs. Only Sandhill and Scrub Communities are found within the study area as shown on Figure 2.3.7-1 the Rare Natural Communities Map. Sandhill Communities are described as uplands with deep sand substrate; xeric; temperate or subtropical; occasional or rare fire (20-80 years); longleaf pine and/or turkey oak with wiregrass understory. These communities are characterized by a nearly continuous ground cover of wiregrass (Aristida beyrichiana) and widely spaced longleaf pines. These communities have been called longleaf pine savannas, high pine, pine barrens, longleaf pine/turkey oak, longleaf pine/wiregrass, and longleaf pine ridge lands. The FLUCCS code for the sandhill community is 412 (longleaf pine-xeric oak) category which is found within the study area. Scrub Communities are described as old dune with deep fine sand substrate; xeric; temperate of subtropical; occasional or rare fire (20-80 years); sand pine and/or scrub oaks and/or rosemary.
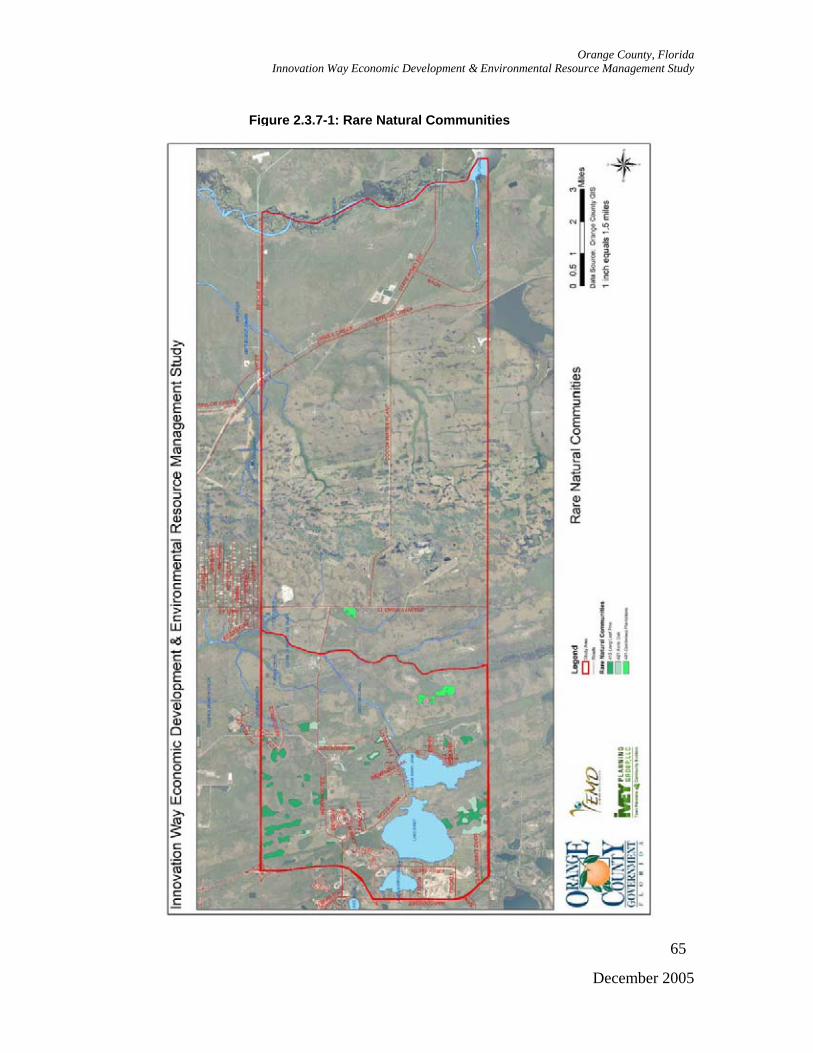
Orange County, Florida Innovation Way Economic Development & Environmental Resource Management Study
December 2005
65
Figure 2.3.7-1: Rare Natural Communities
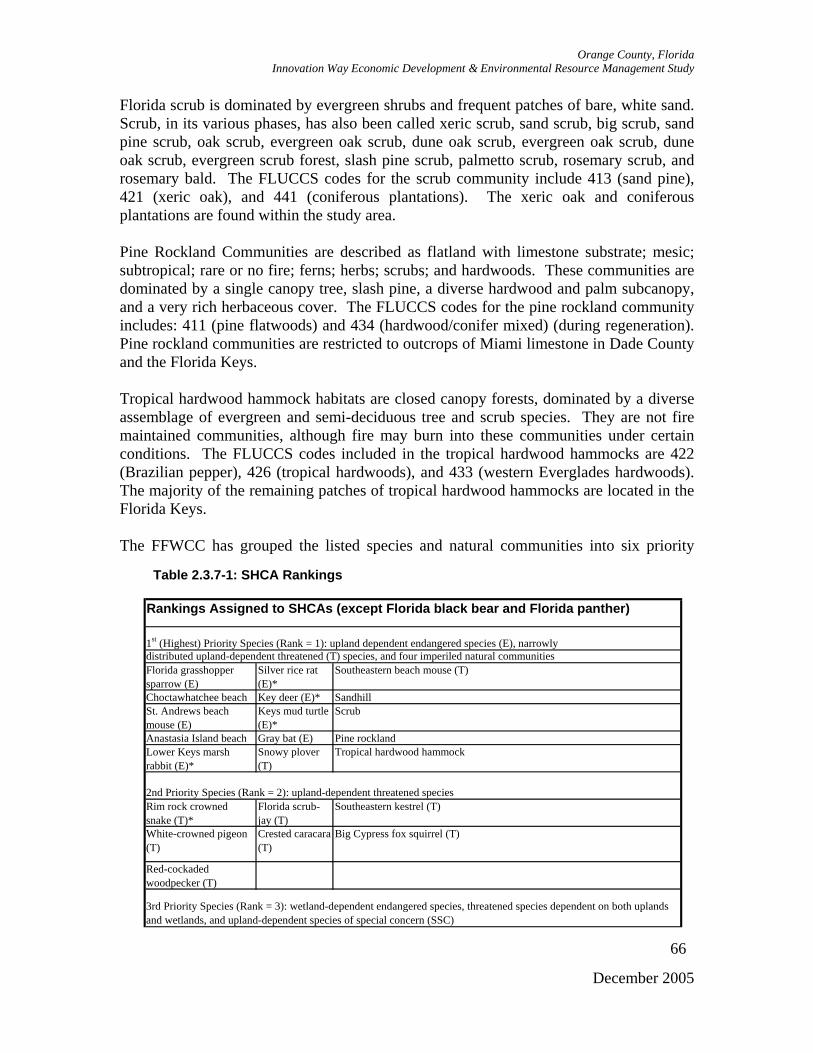
Orange County, Florida Innovation Way Economic Development & Environmental Resource Management Study
December 2005
66
Florida scrub is dominated by evergreen shrubs and frequent patches of bare, white sand. Scrub, in its various phases, has also been called xeric scrub, sand scrub, big scrub, sand pine scrub, oak scrub, evergreen oak scrub, dune oak scrub, evergreen oak scrub, dune oak scrub, evergreen scrub forest, slash pine scrub, palmetto scrub, rosemary scrub, and rosemary bald. The FLUCCS codes for the scrub community include 413 (sand pine), 421 (xeric oak), and 441 (coniferous plantations). The xeric oak and coniferous plantations are found within the study area. Pine Rockland Communities are described as flatland with limestone substrate; mesic; subtropical; rare or no fire; ferns; herbs; scrubs; and hardwoods. These communities are dominated by a single canopy tree, slash pine, a diverse hardwood and palm subcanopy, and a very rich herbaceous cover. The FLUCCS codes for the pine rockland community includes: 411 (pine flatwoods) and 434 (hardwood/conifer mixed) (during regeneration). Pine rockland communities are restricted to outcrops of Miami limestone in Dade County and the Florida Keys. Tropical hardwood hammock habitats are closed canopy forests, dominated by a diverse assemblage of evergreen and semi-deciduous tree and scrub species. They are not fire maintained communities, although fire may burn into these communities under certain conditions. The FLUCCS codes included in the tropical hardwood hammocks are 422 (Brazilian pepper), 426 (tropical hardwoods), and 433 (western Everglades hardwoods). The majority of the remaining patches of tropical hardwood hammocks are located in the Florida Keys. The FFWCC has grouped the listed species and natural communities into six priority
Silver rice rat (E)*
Southeastern beach mouse (T)
Key deer (E)* SandhillKeys mud turtle (E)*
Scrub
Gray bat (E) Pine rocklandSnowy plover (T)
Tropical hardwood hammock
Florida scrub-jay (T)
Southeastern kestrel (T)
Crested caracara (T)
Big Cypress fox squirrel (T)
Rankings Assigned to SHCAs (except Florida black bear and Florida panther)
3rd Priority Species (Rank = 3): wetland-dependent endangered species, threatened species dependent on both uplands and wetlands, and upland-dependent species of special concern (SSC)
2nd Priority Species (Rank = 2): upland-dependent threatened speciesRim rock crowned snake (T)*White-crowned pigeon (T)
Red-cockaded woodpecker (T)
Choctawhatchee beach St. Andrews beach mouse (E)Anastasia Island beach Lower Keys marsh rabbit (E)*
1st (Highest) Priority Species (Rank = 1): upland dependent endangered species (E), narrowlydistributed upland-dependent threatened (T) species, and four imperiled natural communitiesFlorida grasshopper sparrow (E)
Table 2.3.7-1: SHCA Rankings
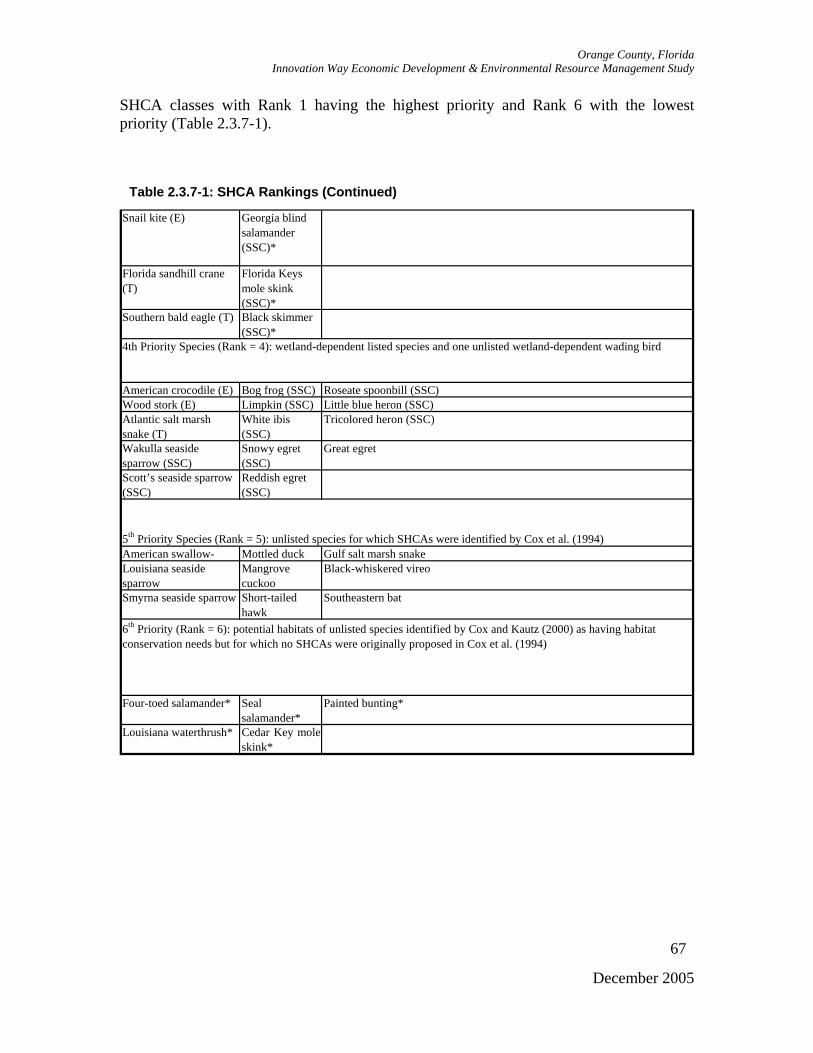
Orange County, Florida Innovation Way Economic Development & Environmental Resource Management Study
December 2005
67
SHCA classes with Rank 1 having the highest priority and Rank 6 with the lowest priority (Table 2.3.7-1).
Georgia blind salamander (SSC)*
Florida Keys mole skink (SSC)*Black skimmer (SSC)*
Bog frog (SSC) Roseate spoonbill (SSC)Limpkin (SSC) Little blue heron (SSC)White ibis (SSC)
Tricolored heron (SSC)
Snowy egret (SSC)
Great egret
Reddish egret (SSC)
Mottled duck Gulf salt marsh snakeMangrove cuckoo
Black-whiskered vireo
Short-tailed hawk
Southeastern bat
Seal salamander*
Painted bunting*
Cedar Key moleskink*
Louisiana waterthrush*
Louisiana seaside sparrowSmyrna seaside sparrow
6th Priority (Rank = 6): potential habitats of unlisted species identified by Cox and Kautz (2000) as having habitat conservation needs but for which no SHCAs were originally proposed in Cox et al. (1994)
Four-toed salamander*
Wakulla seaside sparrow (SSC)Scott’s seaside sparrow (SSC)
5th Priority Species (Rank = 5): unlisted species for which SHCAs were identified by Cox et al. (1994)American swallow-
4th Priority Species (Rank = 4): wetland-dependent listed species and one unlisted wetland-dependent wading bird
American crocodile (E)Wood stork (E)Atlantic salt marsh snake (T)
Snail kite (E)
Florida sandhill crane (T)
Southern bald eagle (T)
Table 2.3.7-1: SHCA Rankings (Continued)

Orange County, Florida Innovation Way Economic Development & Environmental Resource Management Study
December 2005
68
Figure 2.3.7-2: Strategic Habitat Conservation Areas
Orange County, Florida Innovation Way Economic Development & Environmental Resource Management Study
December 2005
69
The study area contains 716 acres of the second priority ranking (Rank 2) which is approximately 1% of the study area and 19,634 acres of the fourth priority ranking (Rank 4) which is 20% of the study area as shown on the Strategic Habitat Conservation Areas Map (Figure 2.3.7-2). It should be noted that areas where listed species are known to occur may not be depicted on this map due to lack of available data. SHCA Rank 2 includes upland-dependent threatened species. HCA Rank 4 within the study area includes wetland-dependent listed species and one unlisted wetland-dependent wading bird.
2.3.8 Econlockhatchee River Protection Area The Econlockhatchee (Econ) River originates in Osceola County, flows into Orange County, and then flows into Seminole County where it enters the St. Johns River above Lake Harney. A portion of the river swamp extends into Osceola County south of the study area. The river is 36 miles long and drains approximately 280 square miles. It is separated into two segments – the lower more urbanized segment and the upper more rural segment. The Econ River has a variety of plant and wildlife communities within its waters and two-mile wide biological corridor. The wetland habitats within the area not only provide support for the significant wildlife habitat communities, but are also characteristic of the upper drainage basin floodplain area. Wetlands also serve as critical surface water retention and treatment sites that allow for storage of floodwaters. The Econlockhatchee River swamp serves as the sole headwater source of flow for the river. Riparian Habitat Protection Zones (RHPZ) are located within the wetlands and in the uplands adjacent to the Econlockhatchee River, its headwaters, and its tributaries. The study area also includes regionally significant upland habitat including protected species (i.e., gopher tortoises and red-cockaded woodpeckers) nesting and foraging areas. On a regional basis, the Econ River, an Outstanding Florida Water (OFW), is a major tributary system in the upper St. Johns River watershed. Recent development pressures within the lower Econlockhatchee River and Little Econlockhatchee River drainage basins have increased in response to rapid urbanization in east Orange County. The result is a significant loss of ecological habitat and surface water quality degradation. In 1990, SJRWMD and Orange County established regulations on development within the Econ River basin and established Riparian Habitat Protection Zones/River Corridor Protection Zones (including upland buffers) for additional protection to the river system. The purpose of the County regulation was “. . . . to protect the public interest in the natural resources of the Econlockhatchee (Econ) River Basin ecosystem by balancing development and private property rights with environmental protection.”
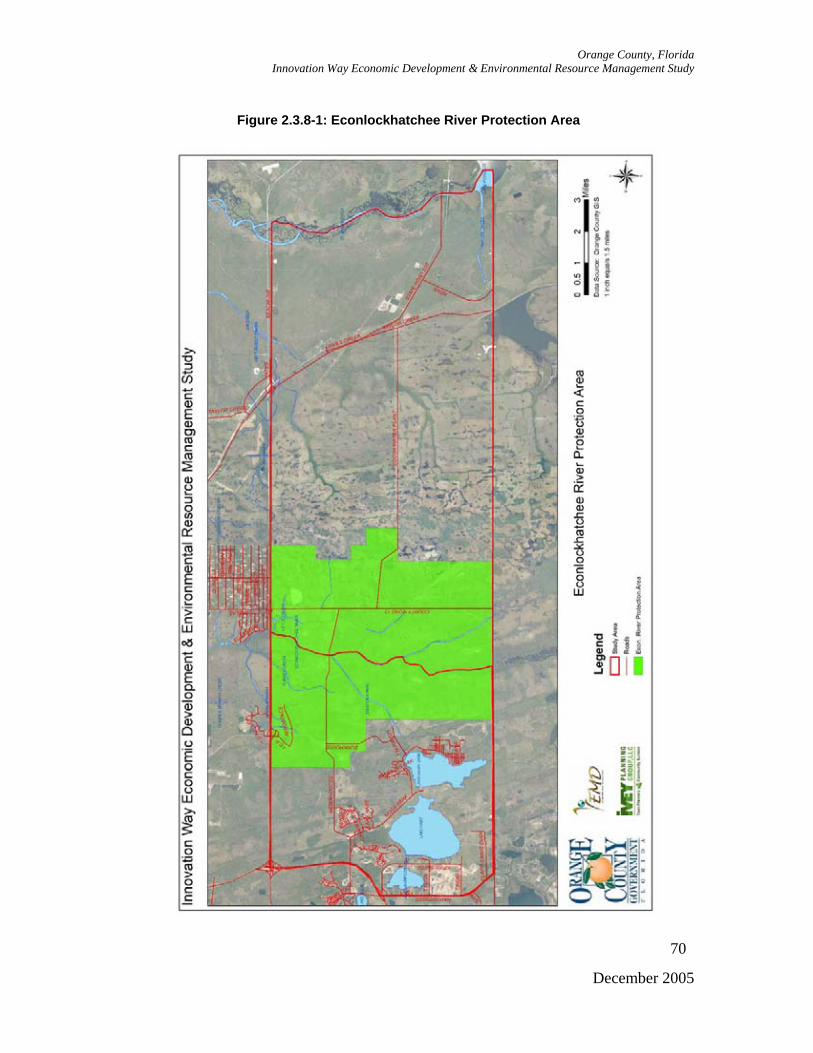
Orange County, Florida Innovation Way Economic Development & Environmental Resource Management Study
December 2005
70
Figure 2.3.8-1: Econlockhatchee River Protection Area

Orange County, Florida Innovation Way Economic Development & Environmental Resource Management Study
December 2005
71
The River Corridor Protection Zone within the study area includes the main river, major tributaries, and at least 1,100 feet landward of the stream’s edge of the Econ River main channel and at least 550 feet landward from the stream’s edge of the named major tributaries, and at least 50 feet of uplands landward of the landward edge of the wetland abutting the main river channel and the named tributaries. As depicted in the Econlockhatchee River Protection Area Map (Figure 2.3.8-1), there are approximately 28,813 acres of land within the Econ River Protection Area identified in the study area. Goal 2, Objective 2.3 of the Orange County Conservation Element states that “Orange County shall protect and preserve the surface water quality and quantity, wildlife populations and habitat, aesthetics, open space, historical and archaeological resources, floodplains, wetland areas, native upland areas and recreation lands of the Econlockhatchee (Econ) River Basin by implementing . . .” policies 2.3.1 through 2.3.3.
2.3.9 Known Superfund and Petroleum Clean-up Sites The U.S. Environmental Protection Agency (EPA) Comprehensive Environmental Response, Compensation Information System (CERCLIS) contains information for sites on the National Priorities List (also known as superfund sites). A search of this database indicated that there are currently no known superfund sites located within the Study Area. According to the database, there are three superfund sites located within Orange County, the closest one being approximately 11 miles northwest of the Study Area. The Orange County Environmental Protection Division (EPD), Petroleum Clean-Up Section is under contract with the Florida Department of Environmental Protection (FDEP) to oversee and regulate compliance and clean-up issues with petroleum underground storage tanks (USTs). Review of the EPD database indicates that there are less than ten facilities with USTs located within the Study Area and that these facilities are in compliance with petroleum regulations. There are no known petroleum contaminant sites within the Study Area. The closest reported petroleum contaminant site is located approximately two miles west of the Study Area at the intersection of Narcoossee Road and the Beachline Expressway.
2.3.10 Floodplains Floodplains are described as any land area susceptible to being inundated by floodwater from a source such as rivers, lakes and wetlands. Special flood hazard areas and risk premium zones applicable to a community are delineated by the Federal Emergency Management Agency (FEMA) and are typically shown on Federal Insurance Rate Maps. Most flood zone areas are based on 100-year and 500-year storm events.

Orange County, Florida Innovation Way Economic Development & Environmental Resource Management Study
December 2005
72
There are scattered designated flood zone areas throughout the Study Area and primarily border the numerous lakes, wetlands and the two main rivers within the area. The FEMA designated 100-year and 500-year floodplains are shown on Figure 2.2.2-4 FEMA Floodplain Map. The 100-year floodplains account for approximately 41 percent of the total area of land within the Study Area.
2.3.11 Topography The topography of the Study Area ranges from 85 feet, NGVD, along the western border along Narcoossee Road to 10 feet, NGVD, along the St. Johns River on the eastern border, as shown on Figure 2.3.11-1, Topography Map. Elevations surrounding the three main lakes located in the southwest portion of the Study Area (Lake Whippoorwill, Lake Hart, Lake Mary Jane) are approximately 55-60 feet, NGVD.
2.3.12 Soils The U.S. Department of Agriculture Soil Conservation Service (now called the Natural Resource Conservation Service (NRCS)) mapped a total of 26 soil types in the Study Area (Figure 2.3.12-1). Five soil types best characterize the Study Area: Smyrna, Malabar and St. John’s fine sands, Felda fine sand frequently flooded, Floridana and Chobee soils, frequently flooded These soils constitute approximately 82% of the Study Area. A brief description of these soils is provided. The remainder of the Study Area is mapped as minor amounts of other soils types and water (i.e., lakes).
Smyrna fine sand (44) comprises more that half of the land within the Study Area. It is nearly level, poorly drained and typically found on broad flatwoods. During most years, a seasonal high water table is within 10 inches of the surface for one to four months with the water table receding to approximately 40 inches below land surface for six months. Organic content is moderate to moderately low. Permeability is rapid in the surface layers and moderate in the subsoil. Natural vegetation includes longleaf and slash pine with an understory of saw palmetto, wax myrtle, and various grasses. The hydrologic soil group for this soil classification is B/D, which is discussed below.
Malabar fine sand (23) is nearly level, poorly drained and typically found on narrow to broad sloughs and poorly defined drainageways. During most years, a seasonal high water table is within 10 inches of the surface for two to six months with the water table remaining between 10 and 40 inches below land surface for the remainder of the year. Organic content is low. Permeability is rapid in the surface layers but slow in the loamy part of the subsoil. Natural vegetation includes longleaf and slash pine, cabbage palm and laurel oak with an understory of scattered saw palmetto, wax myrtle, and various sedges and grasses. The hydrologic soil group for this soil classification is B/D.

Orange County, Florida Innovation Way Economic Development & Environmental Resource Management Study
December 2005
73
St. John’s fine sand (37) is nearly level, poorly drained and typically found on broad flats of flatwoods. During most years, a seasonal high water table is within 10 inches of the surface for six to 12 months and can recede to 40 inches below land surface for six months during dry years. In the rainy season, water level can rise to the surface for brief periods. Organic content is moderate. Permeability is rapid in the surface layers and moderately slow in the subsoil. Natural vegetation includes longleaf and slash pine, and laurel oak with an understory of saw palmetto, wax myrtle, and various weeds and grasses. The hydrologic soil group for this soil classification is B/D.
Felda fine sand, frequently flooded (15) is nearly level, poorly drained and typically found along the floodplains of the Econlockhatchee River and other minor streams. During most years, this soil is flooded for very long periods following prolonged, intense rains. Organic content is low. Permeability is rapid in the surface layers and moderate in the subsoil. Natural vegetation includes red maple, scattered slash pine and sweetgum with an understory of scattered saw palmetto, wax myrtle, and blue maidencane. The hydrologic soil group for this soil classification is B/D.
Floridana and Chobee soils, frequently flooded (11) are nearly level, very poorly drained and typically found on the floodplains of the St. Johns River and its tributaries. During most years, these soils are flooded for very long periods following heavy, intense rains. Organic content is medium. Permeability is rapid in the surface layers and slow in the subsoil. Natural vegetation includes bald cypress, scattered cabbage palm, water oak and blackgum with an understory of buttonbush, maidencane, and water tolerant grasses. The hydrologic soil group for this soil classification is D.
Soils are assigned to one of four hydrologic soil groups (A,B,C,D), used to estimate runoff from precipitation. The hydrologic soil groups are defined below. Soils are grouped according to the intake of water when thoroughly wet and receive precipitation from long-duration storms. The five most predominant soil types in the Study Area are assigned to the B/D and D hydrologic soil groups (Figure 2.3.12-2). Soils assigned two hydrologic soil groups reflect different hydrologic characteristics under different conditions. For example, some soils may have a seasonably high water table under natural conditions but can be well drained with installed drainage systems. For instance, a designation B/D would denote the drained conditions of the soil first and the undrained condition second. The four hydrologic soil groups are briefly described below.
• Group A. Soils that have a high infiltration rate and consist of deep, well drained to excessively drained sands. Less than 1% of the soils within the Study Area are assigned to this hydrologic group.
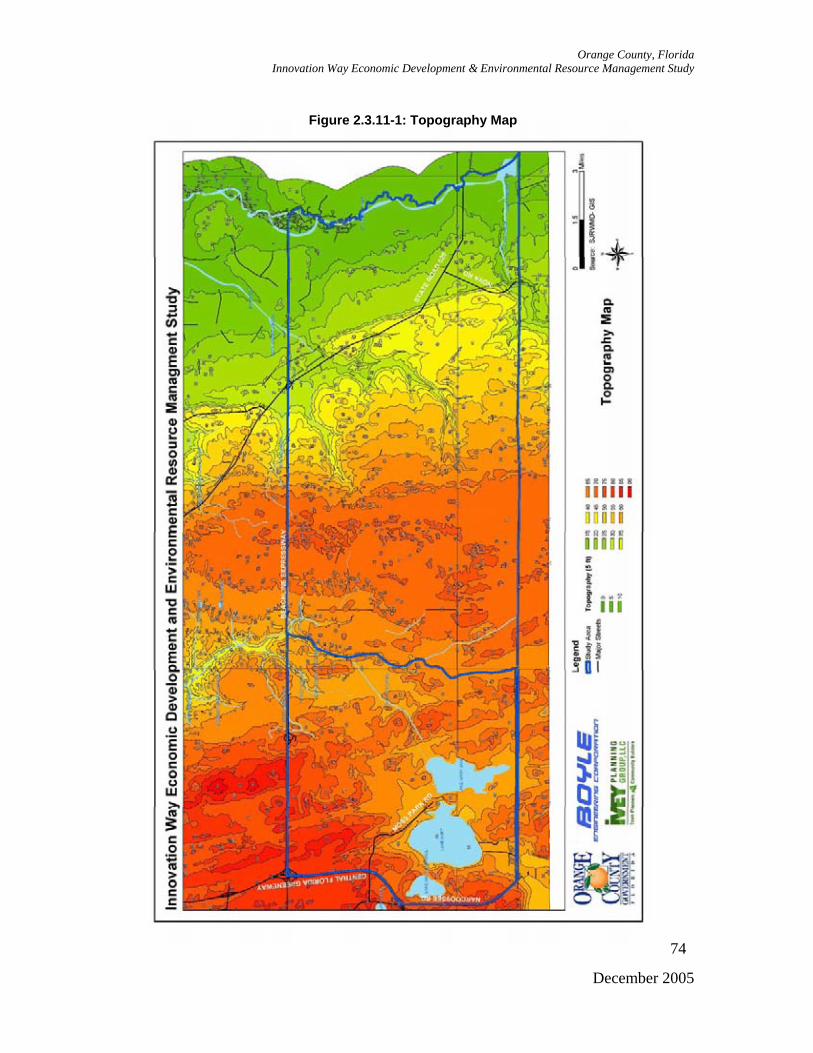
Orange County, Florida Innovation Way Economic Development & Environmental Resource Management Study
December 2005
74
Figure 2.3.11-1: Topography Map
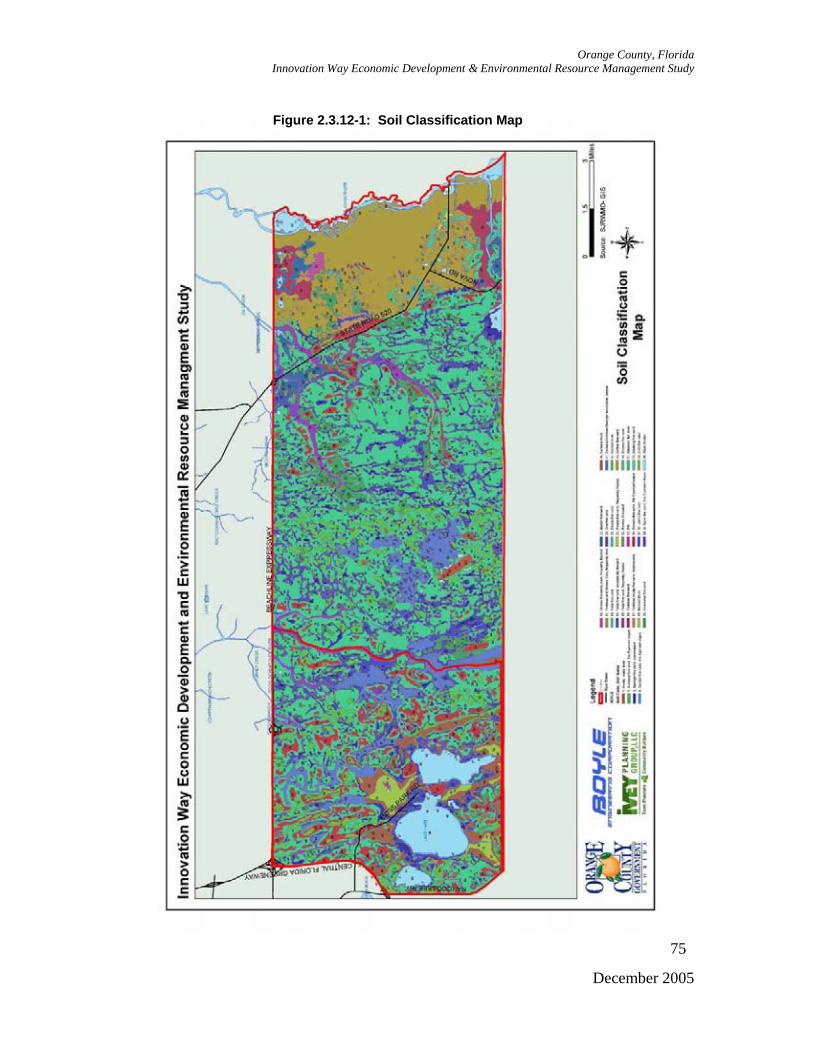
Orange County, Florida Innovation Way Economic Development & Environmental Resource Management Study
December 2005
75
Figure 2.3.12-1: Soil Classification Map
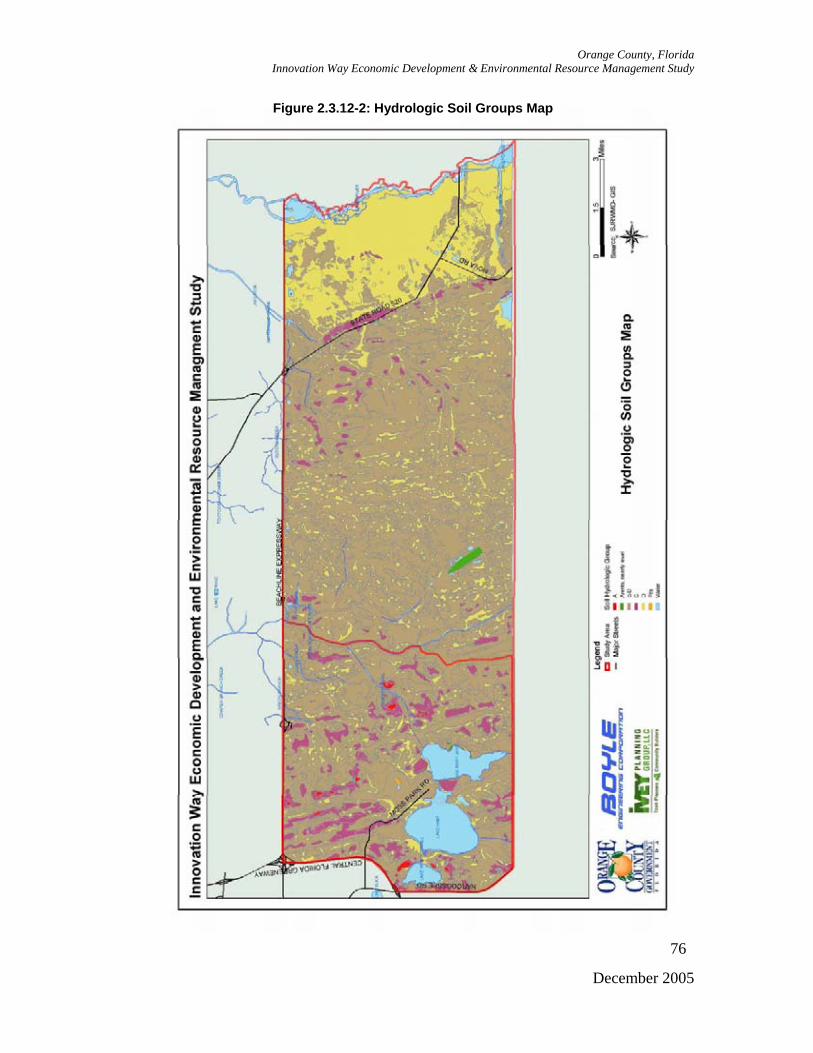
Orange County, Florida Innovation Way Economic Development & Environmental Resource Management Study
December 2005
76
Figure 2.3.12-2: Hydrologic Soil Groups Map
Orange County, Florida Innovation Way Economic Development & Environmental Resource Management Study
December 2005
77
Group B. Soils that have a moderate infiltration rate when thoroughly wet make up this group. They consist chiefly of moderately deep, moderately drained soils that have moderately fine texture. There are no soils within the Study Area are assigned to this hydrologic group. • Group C. Soils that have a slow infiltration rate when thoroughly wet make up
this group. They consist of soils that have a layer that impedes the downward movement of water. Approximately 3% of soils within the Study Area are assigned to this hydrologic group.
• Group D. Soils that have a very slow infiltration rate make up this group. They consist chiefly of clays that have high shrink-swell potential and have a permanent high water table. Approximately 14% of the soils with the Study Area are assigned to this hydrologic group.
2.3.13 Special Water Quality Protection Corridors Special Water Quality Protection Corridors identify those corridors where development activities or inappropriate site designs on the surface might adversely affect either groundwater or surface water. Two areas designated as special water quality protection corridors are located within the Study Area and are denoted as the Econlockhatchee River System and the William Beardall Tosohatchee State Reserve. The location of these two water quality protection corridors is shown on Figure 2.3.13-1, Water Quality Protection. The Econlockhatchee River arises from extensive cypress wetlands south of the Orange/ Osceola County border. The first definable channel of the 36-mile long river appears near the Osceola/Orange County line. The river flows northward through Orange County and into Seminole County, flowing east near the city of Oviedo. It discharges into the St. Johns River a short distance south of Lake Harney near the town of Geneva. The tributaries near the headwaters of the Econlockhatchee River that are located within the Study Area include Turkey Creek, Little Creek, Green Branch, and the man-made Disston Canal which flows from Lake Mary Jane. The Florida Department of Environmental Protection (FDEP) granted Outstanding Florida Water (OFW) status to the Econlockhatchee River. The OFW designation includes all of the Econlockhatchee proper, the named tributaries, the Little Econ River upstream to Michael’s Dam at Jay Blanchard Park, and the Econlockhatchee River swamp upstream to SR 532. As shown in Figure 2.3.13-1 Water Quality Protection, the Econlockhatchee River and many of its tributaries are considered to be Outstanding Florida Waters. Waters bearing this designation are protected from receiving contaminants from stormwater runoff by requiring that all runoff water be treated prior to discharge.

Orange County, Florida Innovation Way Economic Development & Environmental Resource Management Study
December 2005
78
The William Beardall Tosohatchee State Reserve's diverse habitat supports a wide variety of wildlife including white-tailed deer, bobcats, fox squirrels, bald eagles, gray foxes, turkeys, hawks, owls, and many species of songbirds.
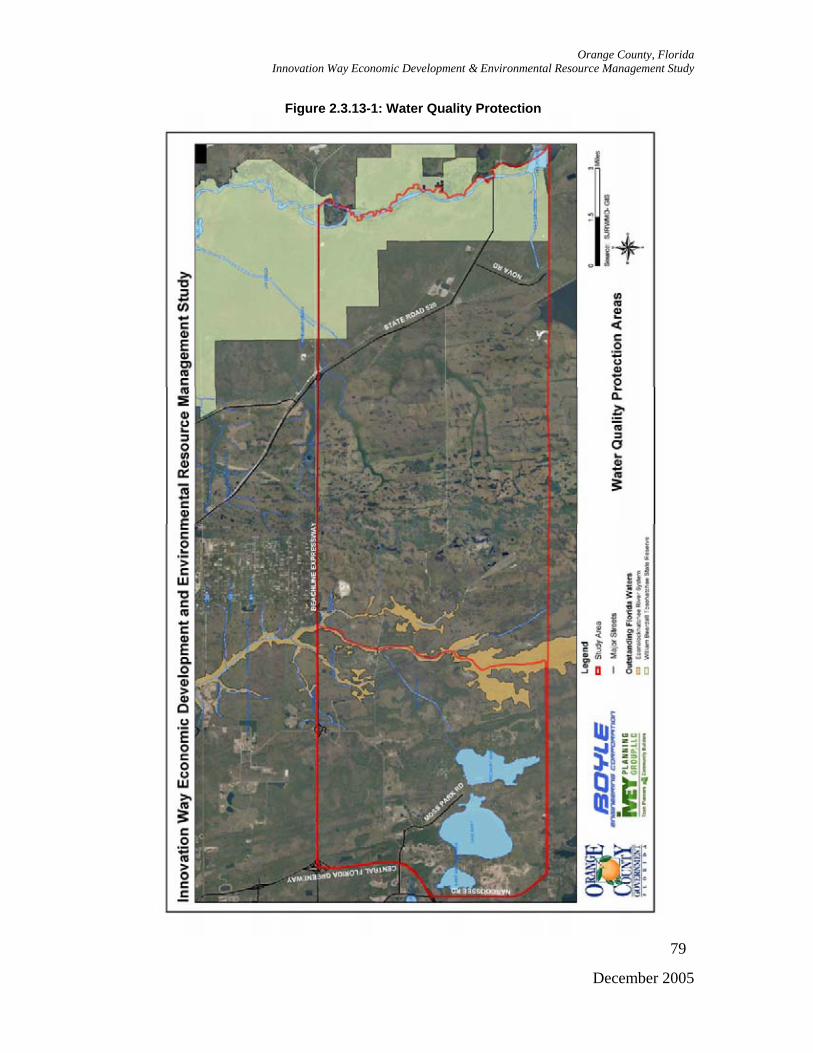
Orange County, Florida Innovation Way Economic Development & Environmental Resource Management Study
December 2005
79
Figure 2.3.13-1: Water Quality Protection
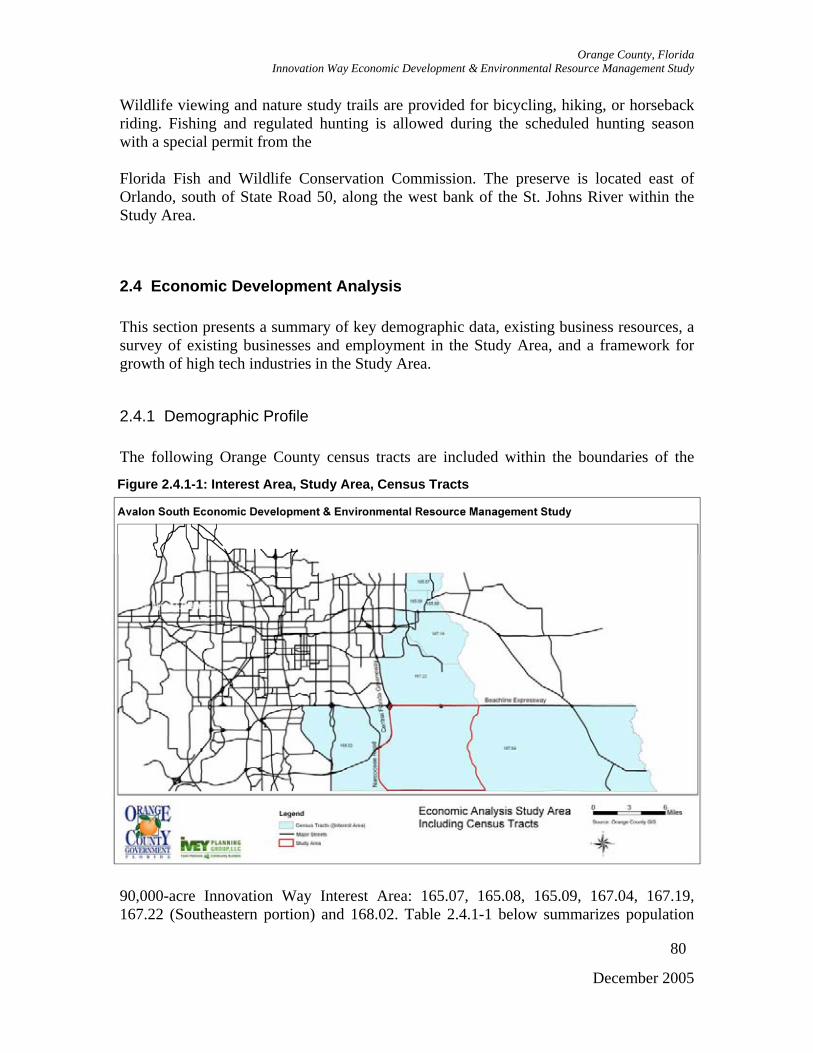
Orange County, Florida Innovation Way Economic Development & Environmental Resource Management Study
December 2005
80
Wildlife viewing and nature study trails are provided for bicycling, hiking, or horseback riding. Fishing and regulated hunting is allowed during the scheduled hunting season with a special permit from the Florida Fish and Wildlife Conservation Commission. The preserve is located east of Orlando, south of State Road 50, along the west bank of the St. Johns River within the Study Area.
2.4 Economic Development Analysis This section presents a summary of key demographic data, existing business resources, a survey of existing businesses and employment in the Study Area, and a framework for growth of high tech industries in the Study Area.
2.4.1 Demographic Profile The following Orange County census tracts are included within the boundaries of the
90,000-acre Innovation Way Interest Area: 165.07, 165.08, 165.09, 167.04, 167.19, 167.22 (Southeastern portion) and 168.02. Table 2.4.1-1 below summarizes population
Figure 2.4.1-1: Interest Area, Study Area, Census Tracts
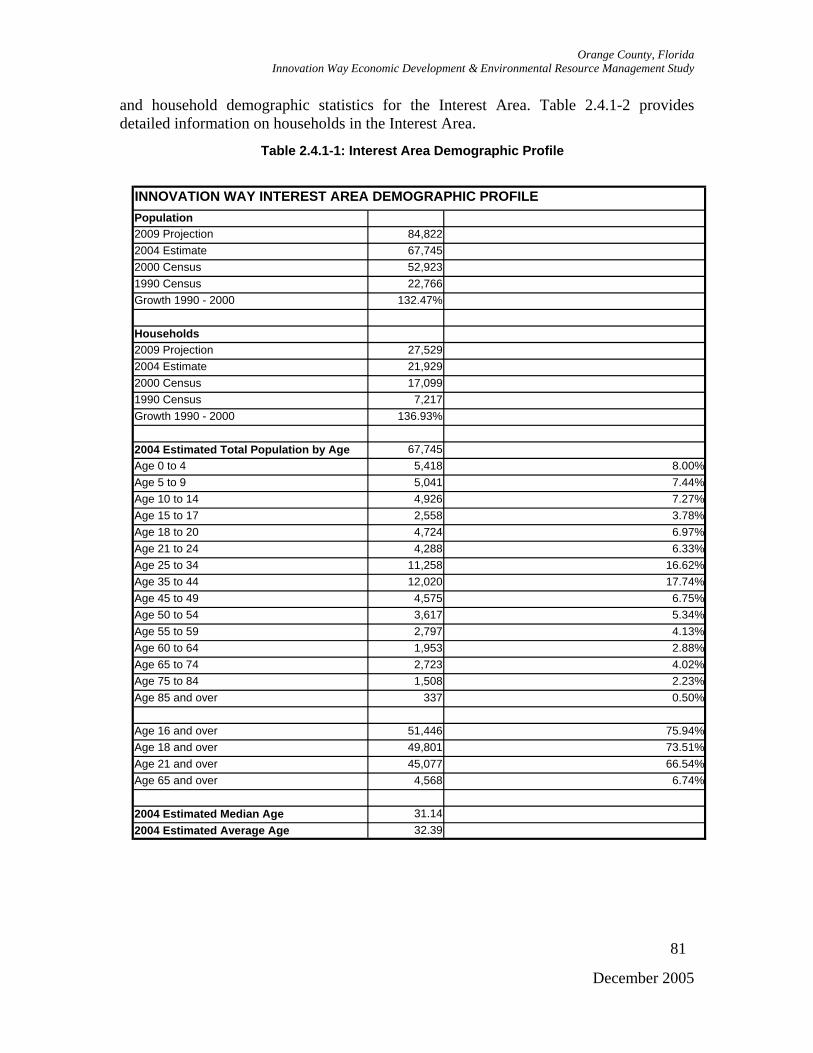
Orange County, Florida Innovation Way Economic Development & Environmental Resource Management Study
December 2005
81
and household demographic statistics for the Interest Area. Table 2.4.1-2 provides detailed information on households in the Interest Area. Table 2.4.1-1: Interest Area Demographic Profile
Population2009 Projection 84,8222004 Estimate 67,7452000 Census 52,9231990 Census 22,766Growth 1990 - 2000 132.47%
Households2009 Projection 27,5292004 Estimate 21,9292000 Census 17,0991990 Census 7,217Growth 1990 - 2000 136.93%
2004 Estimated Total Population by Age 67,745Age 0 to 4 5,418 8.00%Age 5 to 9 5,041 7.44%Age 10 to 14 4,926 7.27%Age 15 to 17 2,558 3.78%Age 18 to 20 4,724 6.97%Age 21 to 24 4,288 6.33%Age 25 to 34 11,258 16.62%Age 35 to 44 12,020 17.74%Age 45 to 49 4,575 6.75%Age 50 to 54 3,617 5.34%Age 55 to 59 2,797 4.13%Age 60 to 64 1,953 2.88%Age 65 to 74 2,723 4.02%Age 75 to 84 1,508 2.23%Age 85 and over 337 0.50%
Age 16 and over 51,446 75.94%Age 18 and over 49,801 73.51%Age 21 and over 45,077 66.54%Age 65 and over 4,568 6.74%
2004 Estimated Median Age 31.142004 Estimated Average Age 32.39
INNOVATION WAY INTEREST AREA DEMOGRAPHIC PROFILE
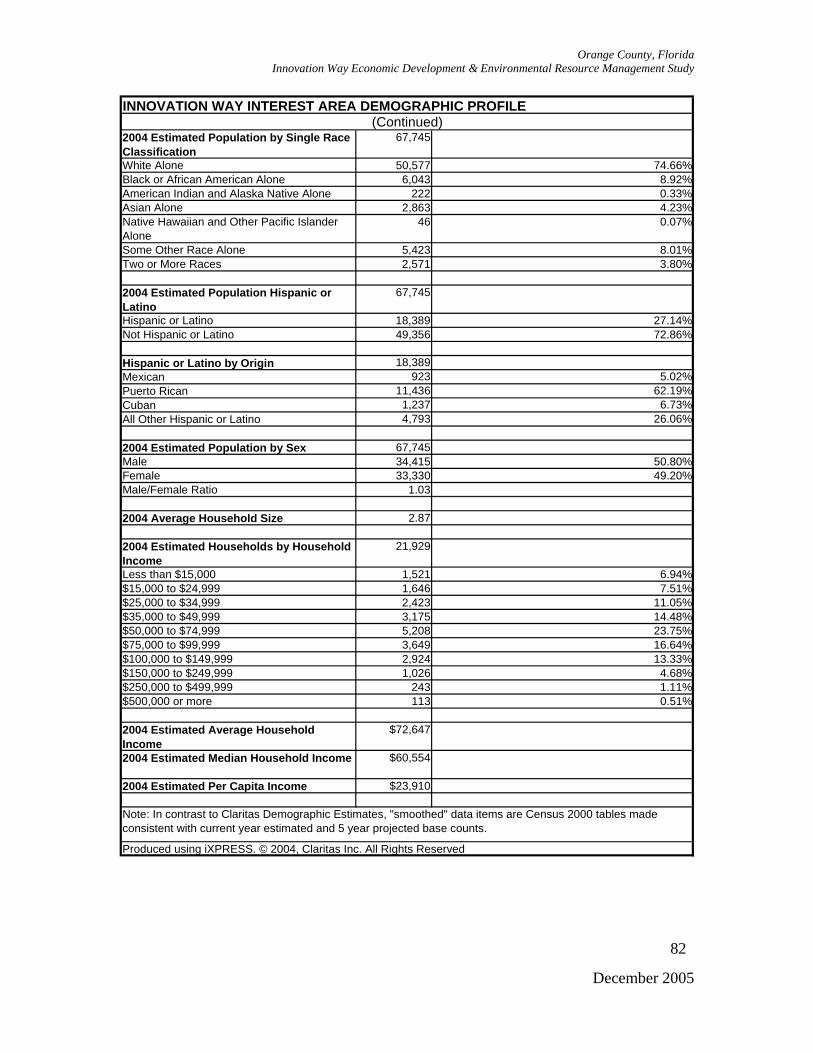
Orange County, Florida Innovation Way Economic Development & Environmental Resource Management Study
December 2005
82
2004 Estimated Population by Single Race Classification
67,745
White Alone 50,577 74.66%Black or African American Alone 6,043 8.92%American Indian and Alaska Native Alone 222 0.33%Asian Alone 2,863 4.23%Native Hawaiian and Other Pacific Islander Alone
46 0.07%
Some Other Race Alone 5,423 8.01%Two or More Races 2,571 3.80%
2004 Estimated Population Hispanic or Latino
67,745
Hispanic or Latino 18,389 27.14%Not Hispanic or Latino 49,356 72.86%
Hispanic or Latino by Origin 18,389Mexican 923 5.02%Puerto Rican 11,436 62.19%Cuban 1,237 6.73%All Other Hispanic or Latino 4,793 26.06%
2004 Estimated Population by Sex 67,745Male 34,415 50.80%Female 33,330 49.20%Male/Female Ratio 1.03
2004 Average Household Size 2.87
2004 Estimated Households by Household Income
21,929
Less than $15,000 1,521 6.94%$15,000 to $24,999 1,646 7.51%$25,000 to $34,999 2,423 11.05%$35,000 to $49,999 3,175 14.48%$50,000 to $74,999 5,208 23.75%$75,000 to $99,999 3,649 16.64%$100,000 to $149,999 2,924 13.33%$150,000 to $249,999 1,026 4.68%$250,000 to $499,999 243 1.11%$500,000 or more 113 0.51%
2004 Estimated Average Household Income
$72,647
2004 Estimated Median Household Income $60,554
2004 Estimated Per Capita Income $23,910
(Continued)
Note: In contrast to Claritas Demographic Estimates, "smoothed" data items are Census 2000 tables made consistent with current year estimated and 5 year projected base counts.
Produced using iXPRESS. © 2004, Claritas Inc. All Rights Reserved
INNOVATION WAY INTEREST AREA DEMOGRAPHIC PROFILE
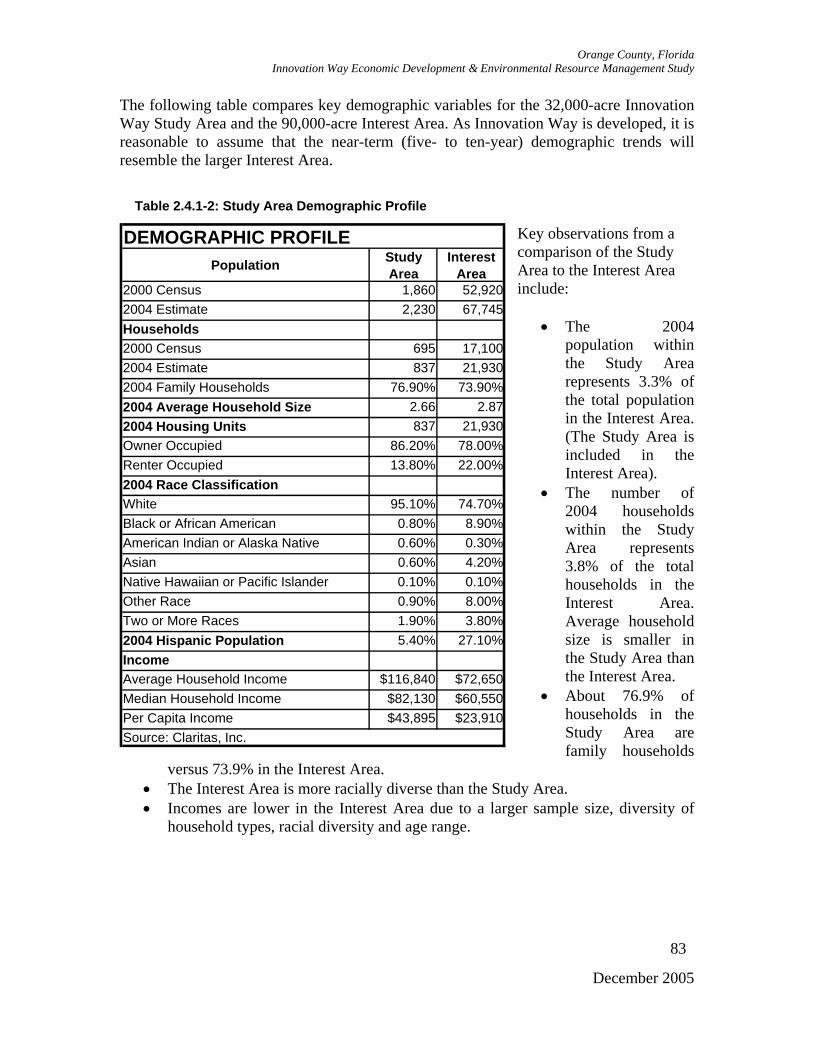
Orange County, Florida Innovation Way Economic Development & Environmental Resource Management Study
December 2005
83
The following table compares key demographic variables for the 32,000-acre Innovation Way Study Area and the 90,000-acre Interest Area. As Innovation Way is developed, it is reasonable to assume that the near-term (five- to ten-year) demographic trends will resemble the larger Interest Area.
Key observations from a comparison of the Study Area to the Interest Area include:
• The 2004 population within the Study Area represents 3.3% of the total population in the Interest Area. (The Study Area is included in the Interest Area).
• The number of 2004 households within the Study Area represents 3.8% of the total households in the Interest Area. Average household size is smaller in the Study Area than the Interest Area.
• About 76.9% of households in the Study Area are family households
versus 73.9% in the Interest Area. • The Interest Area is more racially diverse than the Study Area. • Incomes are lower in the Interest Area due to a larger sample size, diversity of
household types, racial diversity and age range.
Table 2.4.1-2: Study Area Demographic Profile
Population Study Area
Interest Area
2000 Census 1,860 52,9202004 Estimate 2,230 67,745Households2000 Census 695 17,1002004 Estimate 837 21,9302004 Family Households 76.90% 73.90%2004 Average Household Size 2.66 2.872004 Housing Units 837 21,930Owner Occupied 86.20% 78.00%Renter Occupied 13.80% 22.00%2004 Race ClassificationWhite 95.10% 74.70%Black or African American 0.80% 8.90%American Indian or Alaska Native 0.60% 0.30%Asian 0.60% 4.20%Native Hawaiian or Pacific Islander 0.10% 0.10%Other Race 0.90% 8.00%Two or More Races 1.90% 3.80%2004 Hispanic Population 5.40% 27.10%IncomeAverage Household Income $116,840 $72,650 Median Household Income $82,130 $60,550 Per Capita Income $43,895 $23,910
DEMOGRAPHIC PROFILE
Source: Claritas, Inc.

Orange County, Florida Innovation Way Economic Development & Environmental Resource Management Study
December 2005
84
2.4.2 Existing Resources This section highlights the key business development initiatives in the Orlando metropolitan area that are instrumental in attracting high tech industry to the region. The Metro Orlando Economic Development Commission is an organization that helps business. The EDC is dedicated to meeting the needs of today's industries and creating a competitive economic climate where businesses can thrive. To meet this goal, the EDC provides key services and support, which range from relocation and expansion expertise, to export counseling, to long-term planning. With the support of community partners, the EDC has successfully assisted thousands of companies. These efforts have resulted in more than $6.9 billion in capital investment, almost 125,000 jobs and 58.5 million square feet of office and industrial space leased or constructed. More than 750 film and television productions have been filmed here during the past 10 years. With $1.54 billion in exports annually, the region is consistently ranked among the fastest-growing export markets in the state of Florida. A not-for-profit, private-public partnership, the EDC serves Orange, Seminole, Lake and Osceola counties and the City of Orlando. The Florida High Tech Corridor Council (FHTCC) was formed in 1996 by the University of Central Florida (UCF) and the University of South Florida (USF). Their original idea was simple: work together. Since then, these universities have created a model that is truly an example of the strength of partnership in action. In conjunction with a number of economic development organizations, community colleges and high tech industry representatives throughout a 21-county region, the group works to attract, retain and grow high tech industry and the workforce to support it. Most recently, this partnership took a leap forward when the FHTCC welcomed the University of Florida (UF) along with two more counties and the economic development organizations that serve them. From the onset, the Matching Grants Program has represented one of the primary goals of the FHTCC, fostering applied research between the partner universities and high tech industry. As UF came on board, it pledged an annual investment of $2 million additional to the Council’s matching grants program. In fact, the majority of the Council’s funding is allocated to the Matching Grants Research Program. Since its inception, the FHTCC has provided more than $40 million, which has benefited 215 companies and supported more than 550 research projects. Added to research dollars provided by those companies, the FHTCC has generated more than $128 million in applied research for the area. Industries that have been impacted include: aviation and aerospace; information technology; medical technologies and life sciences; microelectronics and nanotechnology; modeling, simulation and training; and, optics and photonics. Nearly $90 million of these funds have been used to engage 1,000 graduate and doctoral students, research assistants and 300 faculty members in side-by-side research with scientists and engineers from the participating companies. The additional $2 million from UF will only increase these employment numbers and offer even more opportunities for companies throughout the Corridor.

Orange County, Florida Innovation Way Economic Development & Environmental Resource Management Study
December 2005
85
When the regional approach to economic development was initially established, there were a total of 21 counties; with the addition of UF, the number of counties has increased to 23. The two additional counties, Alachua and Putnam, house a number of advanced technological and workforce initiatives, such as the Gainesville Area Innovation Network (GAIN). GAIN’s mission is to encourage the start-up and development of technology enterprises in the Gainesville area by providing support through networking and educational opportunities. Additionally, the Alachua/Bradford Career Centers provides services to job seekers and professionals in the area. Such organizations help to buttress the Corridor Council’s general mission of attracting, retaining and growing high tech industry and the workforce to support it. The relationship formed between these three universities is a truly dynamic partnership and has helped establish Florida as an economic model of excellence for others to mirror. With three powerhouse universities combined as a single strategic force, and participation from more than 20 progressive economic development organizations, 14 community colleges, and the multitude of high tech representatives, the Florida High Tech Corridor Council will continue to help make Florida not only a national technology leader, but a global leader as well. Together these organizations are accomplishing their mission to cultivate a high tech hub in Florida through a university research initiative that matches state funding with corporate and federal dollars; the development of Corridor workforce development projects; and joint marketing of the region with economic development and community college partners. With over 6,000 members, the Orlando Regional Chamber of Commerce is the region's largest pro-business advocate. Since 1913, the Chamber has been building solid business relationships across Central Florida. Dedicated to Building Community, the Orlando Regional Chamber believes that a strong, vital community goes hand in hand with a strong, vital business environment. The Chamber offers a wide range of business services throughout the seven-county region (Brevard, Lake, Orange, Osceola, Polk, Seminole and Volusia). Education Responding to the rapid rise in the high-tech sector in Metro Orlando, local educational institutions have developed curricula to provide their students with a solid foundation in the field and the skills necessary to meet the hiring needs of technology companies. All levels of education related to software and advanced manufacturing are offered in the region from high school magnet courses to doctoral programs. Leading the way in high tech education is the University of Central Florida (UCF), whose 2005 enrollment is approximately 45,000 students in undergraduate, masters and doctoral level programs. Considered one of the country's leading metropolitan research universities, UCF works in concert with Central Florida Research Park, which is located
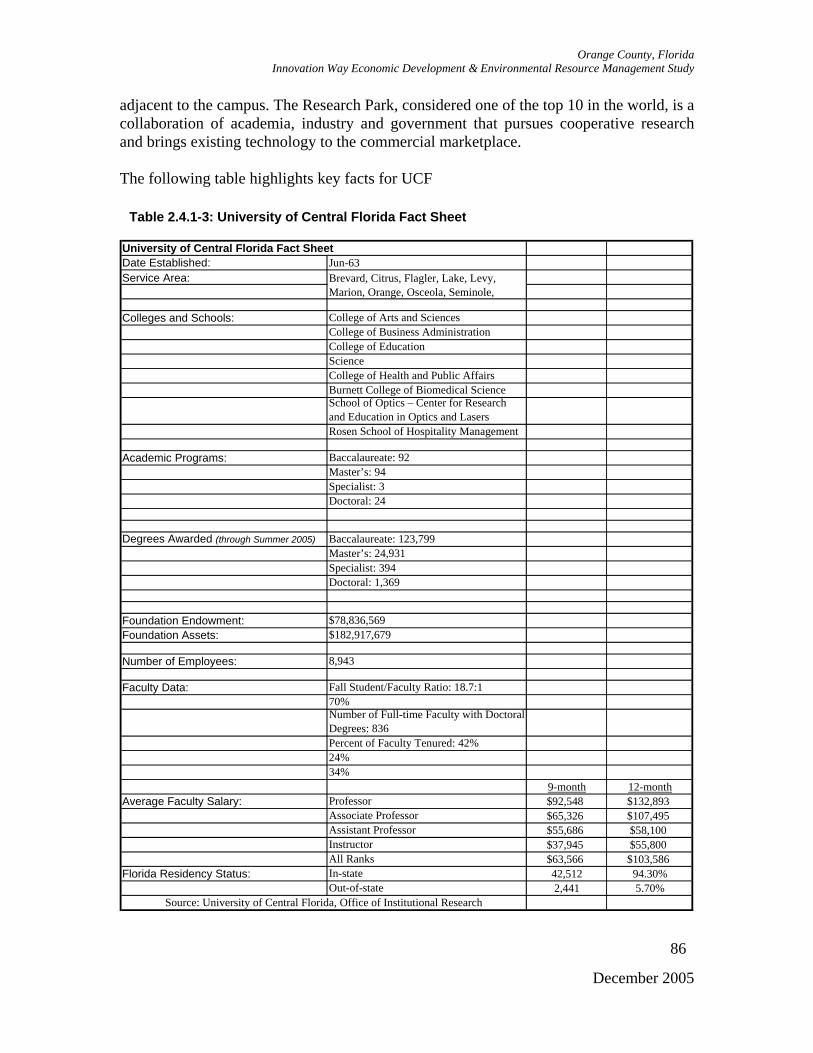
Orange County, Florida Innovation Way Economic Development & Environmental Resource Management Study
December 2005
86
adjacent to the campus. The Research Park, considered one of the top 10 in the world, is a collaboration of academia, industry and government that pursues cooperative research and brings existing technology to the commercial marketplace. The following table highlights key facts for UCF
Date Established: Jun-63Service Area:
Colleges and Schools: College of Arts and SciencesCollege of Business AdministrationCollege of EducationScienceCollege of Health and Public AffairsBurnett College of Biomedical ScienceSchool of Optics – Center for Research and Education in Optics and LasersRosen School of Hospitality Management
Academic Programs: Baccalaureate: 92Master’s: 94Specialist: 3Doctoral: 24
Degrees Awarded (through Summer 2005) Baccalaureate: 123,799Master’s: 24,931Specialist: 394Doctoral: 1,369
Foundation Endowment: $78,836,569 Foundation Assets: $182,917,679
Number of Employees: 8,943
Faculty Data: Fall Student/Faculty Ratio: 18.7:170%Number of Full-time Faculty with Doctoral Degrees: 836Percent of Faculty Tenured: 42%24%34%
9-month 12-monthAverage Faculty Salary: Professor $92,548 $132,893
Associate Professor $65,326 $107,495Assistant Professor $55,686 $58,100Instructor $37,945 $55,800All Ranks $63,566 $103,586
Florida Residency Status: In-state 42,512 94.30%Out-of-state 2,441 5.70%
Source: University of Central Florida, Office of Institutional Research
Brevard, Citrus, Flagler, Lake, Levy, Marion, Orange, Osceola, Seminole,
University of Central Florida Fact Sheet
Table 2.4.1-3: University of Central Florida Fact Sheet
Orange County, Florida Innovation Way Economic Development & Environmental Resource Management Study
December 2005
87
The University of Central Florida (UCF) has emerged as one of the premier computer science universities in the country. Graduating more computer science majors than any other Florida university, UCF has developed strong partnerships with industry, world-class centers and institutes that focus on technology and software. The University of Central Florida’s College of Engineering and Computer Science (CECS) offers superior programs in areas related to advanced manufacturing, such as computer engineering, computer science and electrical engineering. CECS offers bachelors, masters, and doctoral degrees in the areas of Computer Engineering, Electrical Engineering and Computer Science. The computer science doctoral program ranks among the top 10 in the nation, according the National Association of Graduate and Professional Studies. CECS is the top research-funded college at UCF, with awards exceeding $14 million. The college is engaged in nearly 200 funded research projects sponsored by industrial groups and local, state and federal agencies. Notably, CECS received one of 14 awards from the National Science Foundation to fund student research in computer vision and semiconductors. CECS professors are involved in active research that often involves collaboration among faculty members, graduate students and post-doctoral researchers and visitors. Current CECS research labs include:
• Software Engineering Research Laboratory • Solid State and Microelectronics Laboratory • Chip Design and Reliability Laboratory
Approximately 80 percent of CECS students gain job-related experience before graduating, and more than 75 percent of graduates remain in Florida five years or more after completing their education. On average, CECS annually graduates nearly 1,000 engineers and computer scientists with a significant percentage taking jobs in the state. The Center For Applied Human Factors in Aviation (CAHFA) at UCF, established in 1990, is a research consortium of UCF and Embry-Riddle Aeronautical University. CAHFA focuses on enhancing safety in the nation's airspace system through applied human factors research, systems design, and training strategies. UCF provides CAHFA with the multidisciplinary capabilities of a major university, including academic strengths in applied psychology and engineering. Embry-Riddle, with campuses in Daytona Beach and Prescott, Arizona, provides CAHFA with research and testing facilities, including the Center for Aviation/Aerospace Research and the Airway Science Simulation Laboratory. The Aerospace Engineering Program is designed to provide a broadly-based foundation in aeronautics and astronautics, including topics such as aerodynamics, propulsion, aerospace structures and materials, and flight dynamics, control and performance. The
Orange County, Florida Innovation Way Economic Development & Environmental Resource Management Study
December 2005
88
program is intended to prepare graduates for employment as engineers in aerospace or allied disciplines, and for graduate study in engineering, or business, or allied areas. Among the many career opportunities afforded by this course of study are design and development of aircraft, missiles and spacecraft systems. UCF is delivering on its promise to become one of the nation's leading partnership universities through relationships on local, national and international levels. While a significant amount of the $66 million in sponsored research UCF generates annually is provided by industry along Florida's high tech corridor, state and federal funding is achieving record levels, and centers such as the Florida Eastern Europe Linkage Institute assist in facilitating UCF affiliations with new international partners. UCF keeps regional, state, national and international needs in the forefront when recruiting top students, faculty and staff and developing the infrastructure to achieve global prominence in selected areas of research. Partnership with the Central Florida Technology Incubator and UCF's Small Business Development Center solidifies the university's local connections and assists UCF researchers in transferring technology to the marketplace. UCF's Technology Incubator is modeled to provide emerging technology companies with the enabling tools, training and infrastructure necessary to grow and prosper. Such comfort with technology firms, and commensurate development of strong supporting academic resources, has resulted in an ideal combination of affordable lifestyle and abundant employment pool. The average wage of high tech workers in Metro Orlando is higher than the average wage of American employees, but still comparatively affordable for companies hoping to find a cost of living consistent with educated, talented employees. The University of Central Florida Office of Research fosters the creation of intellectual capital that can solve today's pressing problems, improve the quality of life, and provide an engine for economic growth. The UCF Office of Research serves UCF researchers as the official liaison between UCF and government and commercial sectors and by providing a helping hand for faculty as they work their way through the funding and contract management process. The Office helps establish connections with the agencies and individuals who invest in the promise of science. As one of America's leading metropolitan research universities, UCF is committed to the pursuit of research excellence and intellectual growth. Valencia Community College has proven a valuable partner to UCF and area business by preparing students for vibrant IT careers. One of the top three colleges in the nation in the total number of associate's degrees awarded, Valencia is a fully accredited institution that offers degrees in areas related to software development designed with input from industry leaders. These two-year degrees combine academic learning with hands-on experience, and many include industry certifications.
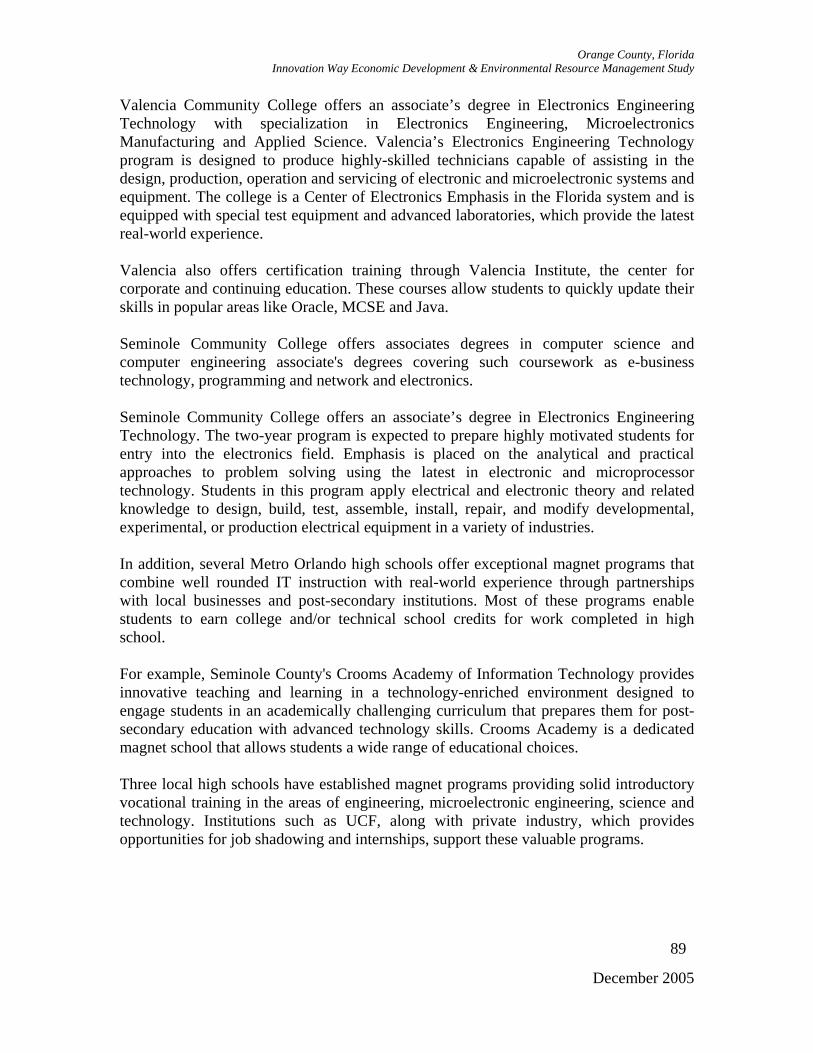
Orange County, Florida Innovation Way Economic Development & Environmental Resource Management Study
December 2005
89
Valencia Community College offers an associate’s degree in Electronics Engineering Technology with specialization in Electronics Engineering, Microelectronics Manufacturing and Applied Science. Valencia’s Electronics Engineering Technology program is designed to produce highly-skilled technicians capable of assisting in the design, production, operation and servicing of electronic and microelectronic systems and equipment. The college is a Center of Electronics Emphasis in the Florida system and is equipped with special test equipment and advanced laboratories, which provide the latest real-world experience. Valencia also offers certification training through Valencia Institute, the center for corporate and continuing education. These courses allow students to quickly update their skills in popular areas like Oracle, MCSE and Java. Seminole Community College offers associates degrees in computer science and computer engineering associate's degrees covering such coursework as e-business technology, programming and network and electronics. Seminole Community College offers an associate’s degree in Electronics Engineering Technology. The two-year program is expected to prepare highly motivated students for entry into the electronics field. Emphasis is placed on the analytical and practical approaches to problem solving using the latest in electronic and microprocessor technology. Students in this program apply electrical and electronic theory and related knowledge to design, build, test, assemble, install, repair, and modify developmental, experimental, or production electrical equipment in a variety of industries. In addition, several Metro Orlando high schools offer exceptional magnet programs that combine well rounded IT instruction with real-world experience through partnerships with local businesses and post-secondary institutions. Most of these programs enable students to earn college and/or technical school credits for work completed in high school. For example, Seminole County's Crooms Academy of Information Technology provides innovative teaching and learning in a technology-enriched environment designed to engage students in an academically challenging curriculum that prepares them for post-secondary education with advanced technology skills. Crooms Academy is a dedicated magnet school that allows students a wide range of educational choices. Three local high schools have established magnet programs providing solid introductory vocational training in the areas of engineering, microelectronic engineering, science and technology. Institutions such as UCF, along with private industry, which provides opportunities for job shadowing and internships, support these valuable programs.
Orange County, Florida Innovation Way Economic Development & Environmental Resource Management Study
December 2005
90
Local Organizations Additionally, local organizations have been formed specifically to focus on increasing the value of Metro Orlando's workforce. O-Force, a business and education partnership, launched the Orlando Regional Information Technology Consortium to improve and expand the technology workforce in Central Florida. The consortium is working to coordinate post-secondary technology training to better meet the current and future labor needs of local employers. Central Florida Innovation Corporation (CFIC) is a not-for-profit organization whose mission is to strengthen the economic base of Metro Orlando by creating, building and encouraging investment in technology-based companies. CFIC's activities have led to the formation of MILCOM in the private sector, and opened the door to the aggressive creation of new high tech companies. Each year, CFIC hosts the annual venture capital conference, Innovation Florida, which showcases the hottest emerging technology companies seeking first outside money to an audience of investors, investment bankers and financial firms. The Central Florida Technology Partnership (CFTP) is a program managed by the Metro Orlando Economic Development Commission's Tech Team in partnership with the Florida High Tech Corridor Council (FHTCC), Orlando Regional Chamber of Commerce, and the University of Central Florida. By combining the power of these organizations, CFTP is able to help technology companies grow and succeed. CFTP provides information, resources and activities that connect the Central Florida technology community with professional development and business opportunities. Thriving communities in the new economy are those that encourage the creation and growth of new entrepreneurial technology companies. Recognizing that, a key indicator of this region’s economic development success in the years ahead will be a percentage increase in the number of new entrepreneurial technology companies established in Metro Orlando. The University of Central Florida Technology Incubator and Disney/SBA National Entrepreneur Center have taken a leadership role in the growth of this area. The Marketing Team of the Metro Orlando Economic Development Commission continues to work on the implementation of our region's unified business brand “Putting imagination to work.” Three core implementation strategies are in place to encompass internal market education, outreach to area visitors through community gateways, and external market promotion. Spearheaded by the Florida High Tech Corridor Council and myregion.org, the goal of this group is to acquire and deploy the regional resources needed to attract, retain and grow the region’s technology industry. Efforts include joint advocacy, cooperative marketing, incubator development, university research and investment incentives.

Orange County, Florida Innovation Way Economic Development & Environmental Resource Management Study
December 2005
91
Types of High Tech Industries The following high tech industries currently have a strong presence in the region and are among the growing industries that can be expected to expand in the Study Area. Advanced Manufacturing From production of high performance components for wireless communications, computing, power generation systems, frequency control products, automotive systems and more, Metro Orlando is emerging as a significant locale for high tech manufacturing. Crossing over many traditional industry sectors, these companies share a reliance on research, engineering and intensive manufacturing. Key businesses in the industry have established headquarters in Metro Orlando, which reinforces the region’s position as a center for advanced manufacturing. In addition to production, advanced manufacturing companies in the region are involved in the design and prototyping of complex products. The sector enjoys strong support from public and private organizations, benefits from a central location with infrastructure vital to distribution activity and possesses a highly skilled, diverse workforce. Additionally, local well-respected educational institutions attract research dollars and consistently produce an impressive number of graduates that adds to the quality of workforce availability in Metro Orlando. Aviation and Aerospace The aviation and aerospace sector in Metro Orlando has developed over the past 60 years from a collection of military installations and small airstrips to become a hub for global commercial air travel, advanced flight training, air defense projects and space exploration. Aviation in the region is anchored by Orlando International Airport. One of the largest airports in the world, Orlando International Airport is frequently cited as a key advantage to companies doing business in Metro Orlando. With more than 50 airlines, scheduled service to over 100 domestic and international locations and thriving air cargo operations, companies across a diverse range of industries can easily transport both people and goods to virtually anywhere in the world from Orlando International Airport. Metro Orlando is also served by Orlando Sanford International Airport, a smaller, but fast-growing facility, as well as a number of well-regarded regional airports. Located less than an hour from the renowned NASA launch facilities at Kennedy Space Center, Metro Orlando is a prime location for the region’s aviation and aerospace industry. Defense contract powerhouse Lockheed Martin is a stronghold in the region, earning billions of dollars in government and commercial contracts for a host of projects from missile and rocket systems to jet fighters. Smaller companies in the region often capture
Orange County, Florida Innovation Way Economic Development & Environmental Resource Management Study
December 2005
92
lucrative government subcontracts, along with other major contractors that have a Florida presence such as The Boeing Co. and Harris Corporation. With many crossover applications, the sector benefits from a region firmly designated as the world’s capital for modeling, simulation and training. Organizations in the region employ simulation technology in such applications as flight training for commercial and private pilots and air traffic management. The sector enjoys strong support from public and private organizations that are dedicated to advancing the industry locally. Additionally, community educational institutions develop programs specifically geared toward enhancing the quality of the workforce available to aviation and aerospace businesses. Biotechnology and Life Sciences Metro Orlando's emerging bio-technology and life sciences sector has sprung from a renowned regional healthcare system, comprising some of the top hospitals in the country. The sector has also spun off from a prominent agricultural base and the collaborative efforts of the region’s established photonics and modeling, simulation and training sectors. Clinical trials of newly developed medications are emerging as an important aspect of this sector as well. The region’s strength in agriculture, combined with an established high tech base, have spurred an agrotechnology boom that is integrating advanced processes for use in everything from industrial food ingredients to cosmetics to plant reproduction. Today, the sector features:
• Over 500 biotechnology and life sciences companies • 42,000 workers • An estimated $3.6 billion in earnings
The biotechnology and life sciences sector is augmented by several prestigious educational and research centers such as:
• Mid-Florida Research and Education Center • University of Central Florida’s Biomolecular Science Center • Central Florida Research Park, one of the country’s top 10 research facilities
Local governmental officials are currently exploring development of a second research park, which would be dedicated to biotechnology study and research. Metro Orlando’s teaching hospitals provide valuable medical training in a number of fields, which additionally contributes to the knowledge base of the sector. Through the convergence of thriving high tech industries, agriculture, healthcare systems and superior public and private supporting resources, Metro Orlando’s biotechnology and life sciences sector is poised to continue flourishing.

Orange County, Florida Innovation Way Economic Development & Environmental Resource Management Study
December 2005
93
Energy and Alternative Fuels Metro Orlando has a firmly established a traditional energy sector with the presence of such worldwide industry leaders as Siemens Westinghouse and Mitsubishi Power Systems, as well as leading utility companies and a host of related service and equipment companies. With this foundation in place, the sector is beginning to shift more focus on alternative fuel sources. The region is steadily becoming a hotbed for renewable energy and alternative fuel endeavors as businesses and non-profit entities engage in a variety of research and development projects aimed at deploying more cost-efficient, environmentally friendly power. With federal government urgency to reduce reliance on foreign oil, hydrogen technologies are a key area of research being conducted in Metro Orlando. NASA, the world’s chief end user of liquid hydrogen, and the federal Department of Energy have awarded millions of dollars in grant money toward hydrogen research in the region. State and local government are committed to creating a diversified economy, which ensures ample supporting resources and incentives are available for high-tech industry sectors in the region, including energy and alternative fuels. As a result, there is great potential in Metro Orlando for start-up and existing businesses alike to flourish. Photonics Metro Orlando is a nationally recognized leader in the photonics and laser optics industry, and local companies within this sector have a rich history of innovation and expansion. Since the early 1960s, the photonics industry has grown from a vastly specialized military pursuit to one of the strongest, most diverse industries in the region. Today, the sector features:
• Approximately 70 photonics companies • 20,000 workers • Between $20-50 million in annual revenue generation
These companies enjoy an environment fostering progress through collaboration with internationally recognized academic institutions, a highly skilled workforce and numerous community and government agencies dedicated to facilitating industry growth throughout Metro Orlando. The photonics industry in Metro Orlando is clearly poised to flourish well into the future. Software and Hardware Metro Orlando is home to some of the most progressive, talented and diverse software development companies in the U.S. Led by companies serving the financial services industry, more than 1,000 businesses specializing in software development and service, data processing and information retrieval are based in the region. Employing approximately 12,000, these companies generate nearly $1 billion in annual revenue and serve such distinct industries as banking and finance, government, education,

Orange County, Florida Innovation Way Economic Development & Environmental Resource Management Study
December 2005
94
consumer products and utilities automation. The software sector also crosses over into the well-established modeling, simulation and training and digital media clusters, which are heavily involved in developing programs for use in such applications as film and television, interactive entertainment, military exercises and transportation planning.
2.4.3 Business Survey The Innovation Way Interest Area includes portions of the University and University Research Office sub-markets and the East Orange County Industrial sub-market as surveyed by CoStar®. The following table summarizes the number of employees and businesses classified as office or industrial users by industry group located within the boundaries of the Innovation Way Interest Area. A total of 2.66 million square feet of occupied office and industrial space was included in the survey. It is significant to note that some significant business parks including The Quadrangle and Koger Center are not included in this data because these parks are outside the limits of the Innovation Way Interest Area. This business survey does not include retail employment and tenants located within the Interest Area boundaries. Key observations from the business survey include:
• The highest percentage (42.9%) of office and industrial employers in the Interest Area are in manufacturing industries. This is in sharp contrast to the Orlando metropolitan region overall where manufacturing accounts for 4.9% of total employment.
• Business Services is the second largest employment category in the Interest Area with 21.6% of the total. This is a very broad category and includes a mix of highly skilled as well as clerical workers.
• The University of Central Florida is the major government employer in the Interest Area.
• The vast majority (76%) of businesses in the Interest Area lease space versus 16% that own their facilities. This is typical of small and young, expanding companies.
• About 46% of the businesses located within the Interest Area are branch locations, with 44% classified as the main headquarters location.
• Manufacturing also accounts for the largest percentage of tenants in the Interest Area at 17.4%. Professional/Personal Services and Computers/Data Processing are the next largest industry classifications in the Interest Area.
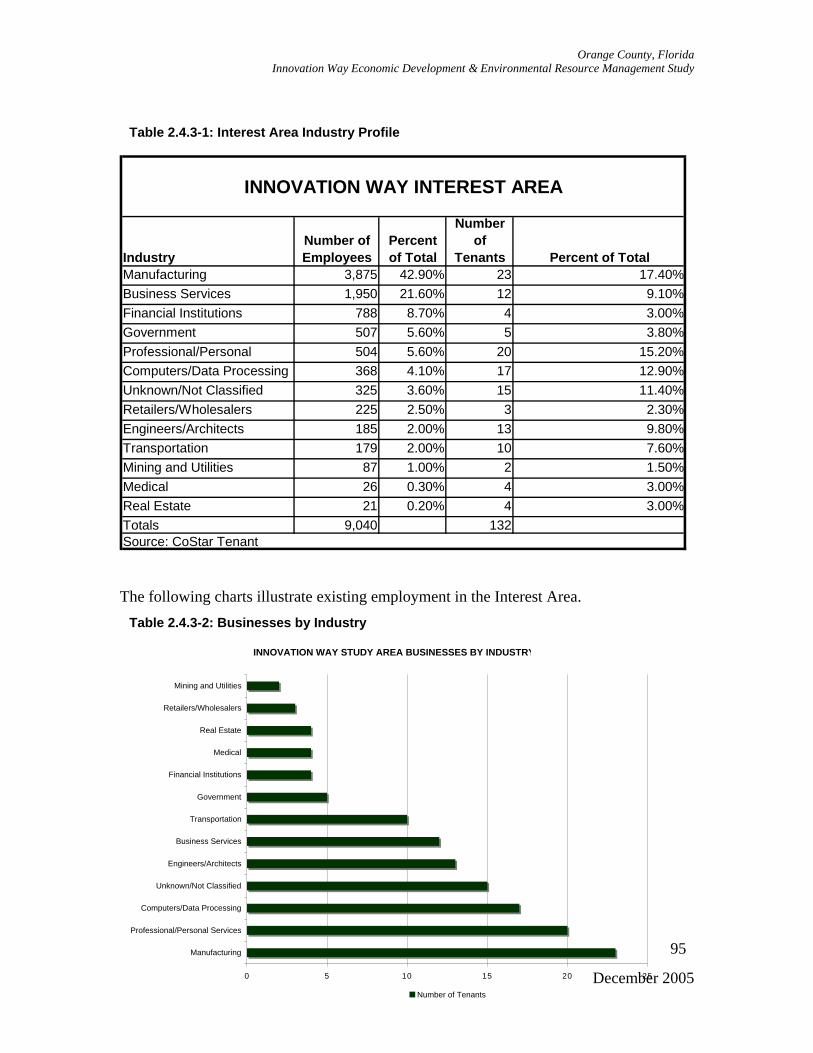
Orange County, Florida Innovation Way Economic Development & Environmental Resource Management Study
December 2005
95
The following charts illustrate existing employment in the Interest Area.
INNOVATION WAY STUDY AREA BUSINESSES BY INDUSTRY
0 5 10 15 20 25
Manufacturing
Professional/Personal Services
Computers/Data Processing
Unknown/Not Classified
Engineers/Architects
Business Services
Transportation
Government
Financial Institutions
Medical
Real Estate
Retailers/Wholesalers
Mining and Utilities
Number of Tenants
IndustryNumber of Employees
Percent of Total
Number of
Tenants Percent of TotalManufacturing 3,875 42.90% 23 17.40%Business Services 1,950 21.60% 12 9.10%Financial Institutions 788 8.70% 4 3.00%Government 507 5.60% 5 3.80%Professional/Personal 504 5.60% 20 15.20%Computers/Data Processing 368 4.10% 17 12.90%Unknown/Not Classified 325 3.60% 15 11.40%Retailers/Wholesalers 225 2.50% 3 2.30%Engineers/Architects 185 2.00% 13 9.80%Transportation 179 2.00% 10 7.60%Mining and Utilities 87 1.00% 2 1.50%Medical 26 0.30% 4 3.00%Real Estate 21 0.20% 4 3.00%Totals 9,040 132Source: CoStar Tenant
INNOVATION WAY INTEREST AREA
Table 2.4.3-1: Interest Area Industry Profile
Table 2.4.3-2: Businesses by Industry
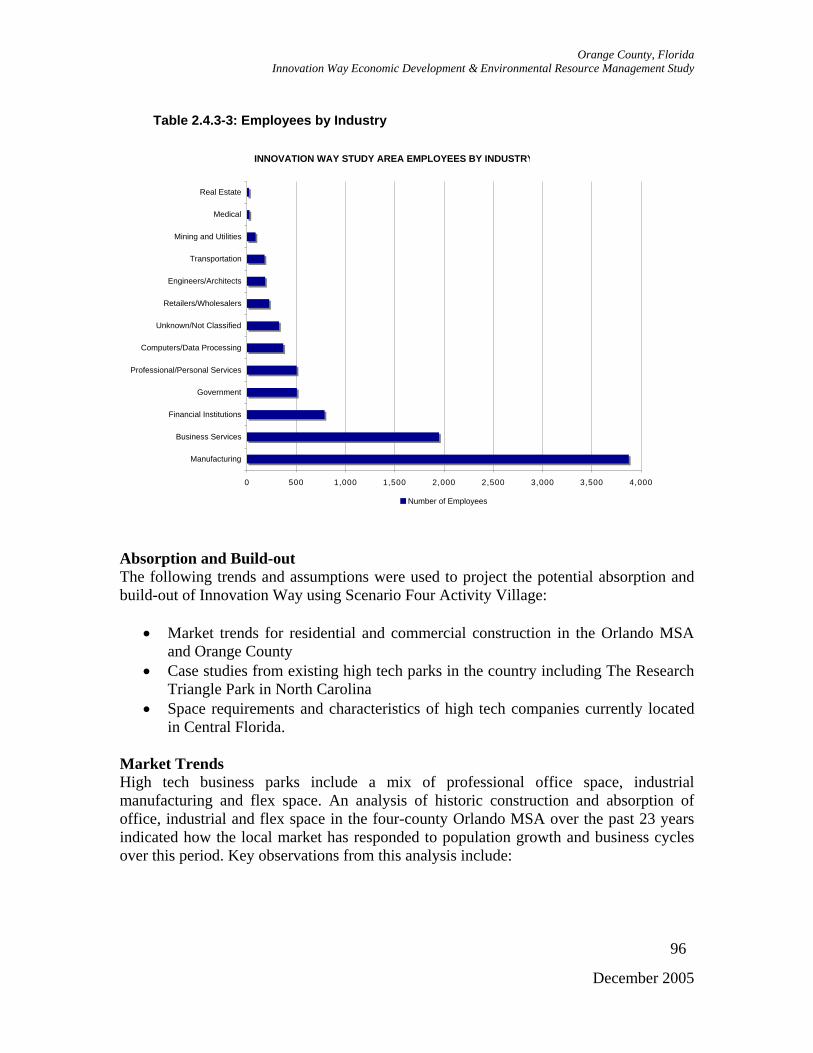
Orange County, Florida Innovation Way Economic Development & Environmental Resource Management Study
December 2005
96
Absorption and Build-out The following trends and assumptions were used to project the potential absorption and build-out of Innovation Way using Scenario Four Activity Village:
• Market trends for residential and commercial construction in the Orlando MSA and Orange County
• Case studies from existing high tech parks in the country including The Research Triangle Park in North Carolina
• Space requirements and characteristics of high tech companies currently located in Central Florida.
Market Trends High tech business parks include a mix of professional office space, industrial manufacturing and flex space. An analysis of historic construction and absorption of office, industrial and flex space in the four-county Orlando MSA over the past 23 years indicated how the local market has responded to population growth and business cycles over this period. Key observations from this analysis include:
INNOVATION WAY STUDY AREA EMPLOYEES BY INDUSTRY
0 500 1,000 1,500 2,000 2,500 3,000 3,500 4,000
Manufacturing
Business Services
Financial Institutions
Government
Professional/Personal Services
Computers/Data Processing
Unknown/Not Classified
Retailers/Wholesalers
Engineers/Architects
Transportation
Mining and Utilities
Medical
Real Estate
Number of Employees
Table 2.4.3-3: Employees by Industry
Orange County, Florida Innovation Way Economic Development & Environmental Resource Management Study
December 2005
97
Office • The current inventory of office space in the four-county MSA is 55.8 million
square feet. • Over the past 23 years, an average of slightly less than two million square feet of
office space has been delivered annually in the MSA. • Construction of office space has been impacted by national and local business
cycles more than other commercial land uses. For example, construction of new office space declined significantly during the years from 1991 through 1994.
• Orange County is the dominant county in the MSA with 41.2 million square feet of office space or about 74% of the total inventory.
• The existing inventory of office space in the University Research sub-market is 2.35 million square feet.
• Based upon historic trends and where future office development is likely to occur in Orange County, we estimate that Innovation Way can capture between 20 and 25% of the market area demand for office space over the projection period.
Industrial
• The current inventory of industrial space in the four-county MSA is 119.8 million square feet.
• Over the past 23 years, an average of just over three million square feet of industrial space has been delivered annually in the MSA.
• The industrial market segment has been impacted less by national and local business cycles than the office market.
• Orange County is the dominant county in the MSA for industrial space with 92.4 million square feet or 77% of the total inventory.
• Based upon historic trends and growth patterns within Orange County, we estimate that Innovation Way can capture between 10 and 15% of the county-wide demand for industrial space over the projection period. This projection could increase if Innovation Way develops with a higher percentage of manufacturing space rather than research and development or flex space.
High tech High tech space includes a variable mix of office, research and development, light manufacturing or assembly and distribution space. Our absorption projection is based primarily on historic experience at existing high tech parks such as The Research Triangle in North Carolina where absorption has averaged about 440,000 square feet annually of the 43-year history of the park. Absorption for this class of space can be expected to vary over time in response to changes in the type of industries that locate here, the mix of research and development versus service companies, developing technologies, and international, national and local economic cycles. Single-family Residential Single-family is the preferred housing product in Central Florida accounting for about 65% of all new residential construction over the past 15 years. Orange County has historically represented about 55% of the single-family market in the MSA. East Orange

Orange County, Florida Innovation Way Economic Development & Environmental Resource Management Study
December 2005
98
County has historically accounted for between 25 and 30% of the county-wide total. We anticipate that these trends will continue, and have projected that Innovation Way can absorb between 1,800 and 2,000 single-family units annually. This represents about 20% of the demand within the MSA, and 25 to 30 percent of the demand within Orange County over the projection period. Multifamily Residential The multifamily market is more cyclical than the single-family market. Historically, Orange County has been the dominant county for multifamily construction in the MSA. East Orange County has historically captured the largest percentage of new multifamily construction in the County. Looking forward, new multifamily construction in Orange County is anticipated to occur on the East and West sides of the County. We have projected that Innovation Way can absorb between 1,000 and 1,250 multifamily units annually. This represents about 20% of the demand within the MSA, and 25 to 30% of the demand within Orange County over the projection period.
Retail and Hotel Retail and hotel space is absorbed in response to residential and commercial growth. The type of retail space developed at Innovation Way can be expected to mature over time from service and convenience retail to specialty and destination type centers. As with other business parks in Central Florida
and around the country, retail development can be expected to trail residential and commercial development with a peak in construction and absorption during the middle to later phases of the project. Table 2.4.3-4 summarizes our annual absorption projections and build-out for Innovation Way under the Modified Village scenario.
Table 2.4.3-4: Activity Village Absorption
Land Use Units/SF High Low High Low
Single-family
19,600 2,000 1,800 10 11
Multifamily 17,900 1,250 1,000 14 18
Industrial 892,000 30,000 22,500 30 40Office 1,727,000 50,000 43,000 35 40High tech 16,361,000 465,000 410,000 35 40Sub-total 18,980,000 545,000 475,500 35 40
Retail 2,480,000 82,500 62,000 30 40Hotel 1,350 Developed over the total build-out period
Activity Village Scenario
Average Annual Absorption
Build-out in Years

Orange County, Florida Innovation Way Economic Development & Environmental Resource Management Study
December 2005
99
2.4.4 Schools The Innovation Way Interest Area includes four regular Orange County high schools and five regular middle schools. The Timber Creek and Oak Ridge high school districts cover the largest portion of the interest and Study Areas. The Conner Lake, Discovery and Odyssey middle school districts cover the largest portion of the developed and undeveloped portions of the Study Area. A small section of the Southwest corner of the
Study Area (west of Orlando International Airport) is included in the Walker and Meadow Woods middle school districts. The following table summarizes current enrollment by percent and number enrolled. The Orange County Public School Board has identified sites for future elementary, middle and high schools in the Innovation Way Interest Area. Table 2.4.4-1 shows available information on the programmed new schools in the interest and Study Areas.
School White Black Hispanic Other
Permanent Program Capacity
Total Enrollment
2005 – 06 Projected
Enrollment
Avalon 66.84% 4.89% 19.95% 8.32% 684 1,288 1,488Camelot 39.08% 10.20% 41.93% 8.79% 754 1,264 1,340Cypress Springs
43.85% 9.09% 37.55% 9.51% 684 1,254 887
Northlake Park
48.70% 9.01% 35.57% 6.72% 988 1,043 1,250
Sunrise 73.47% 8.98% 11.15% 6.40% 600 690 695Waterford 55.07% 8.56% 27.88% 8.49% 794 1,004 993
Corner Lake
61.62% 7.07% 26.47% 4.84% 1,231 1,639 1,654
Discovery 48.56% 11.29% 33.15% 7.00% 1,075 2,090 1,695Meadow Woods
19.32% 13.65% 60.24% 6.79% 1,175 1,977 2,014
Odyssey 40.72% 9.14% 42.96% 7.18% 1,031 1,564 1,480Walker 24.13% 16.29% 53.62% 5.96% 833 1,160 1,142
Cypress Creek
23.00% 11.46% 53.88% 11.66% 2,629 2,895 3,235
Oak Ridge 14.54% 50.71% 30.52% 4.23% 2,644 2,015 2,187
Timber Creek
58.49% 9.83% 26.84% 4.84% 2,771 3,274 3,748
University 40.65% 8.87% 41.94% 8.54% 3,163 3,345 3,582
Regular High Schools
Source: Orange County Public Schools, May 13, 2005
EXISTING PUBLIC SCHOOL ENROLLMENT SUMMARY
Regular Elementary Schools
Regular Middle Schools
Table 2.4.4-1: School Summary

Orange County, Florida Innovation Way Economic Development & Environmental Resource Management Study
December 2005
100
Map Key School CIP Year Site Status
1 Bonneville/Columbia Relief 2005 Tanner Road Owned
8 Camelot/Avalon Relief 2006 Stoneybrook East Owned
17 Northlake Park Relief 1 2008 Narcossee Road Seeking site20 Corner Lake Relief 2009 Avalon Park Seeking site
21 Hidden Oaks Relief 2009 Vista Lakes Seeking site26 Avalon Elementary Relief 2009 Stoneybrook East
or Waterford TrailsOwned
31 Northlake Park Relief 2 2011 Eagle Creek orLake Hart
Reserved
35 Northlake Park Relief 3 2012 Eagle Creek orLake Hart
Owned
43 Area to be determined 2016 Wedgefield Seeking site
44 Area to be determined 2016 Wedgefield Seeking site
45 Area to be determined 2016 Cypress Lakes Reserved
48 Area to be determined 2017 Moss Park orLake Nona
Seeking site
49 Area to be determined 2017 Moss Park orLake Nona
Reserved
46 Area to be determined 2017 Wedgefield Seeking site
24 University/Timber CreekRelief
2009 East Highway 50 Seeking site
29 Oak Ridge/Cypress CreekRelief
2010 Whippoorwill Road
Owned
42 Cypress Creek/Oak RidgeRelief
2016 International Corp.Park
Seeking site
High Schools
Source: Orange County Public Schools
PROPOSED NEW PUBLIC SCHOOLS
Elementary Schools
Middle Schools
Table 2.4.4-2: Proposed New Public Schools

Orange County, Florida Innovation Way Economic Development & Environmental Resource Management Study
December 2005
101
Figure 2.4.4-1: Proposed New Public Schools
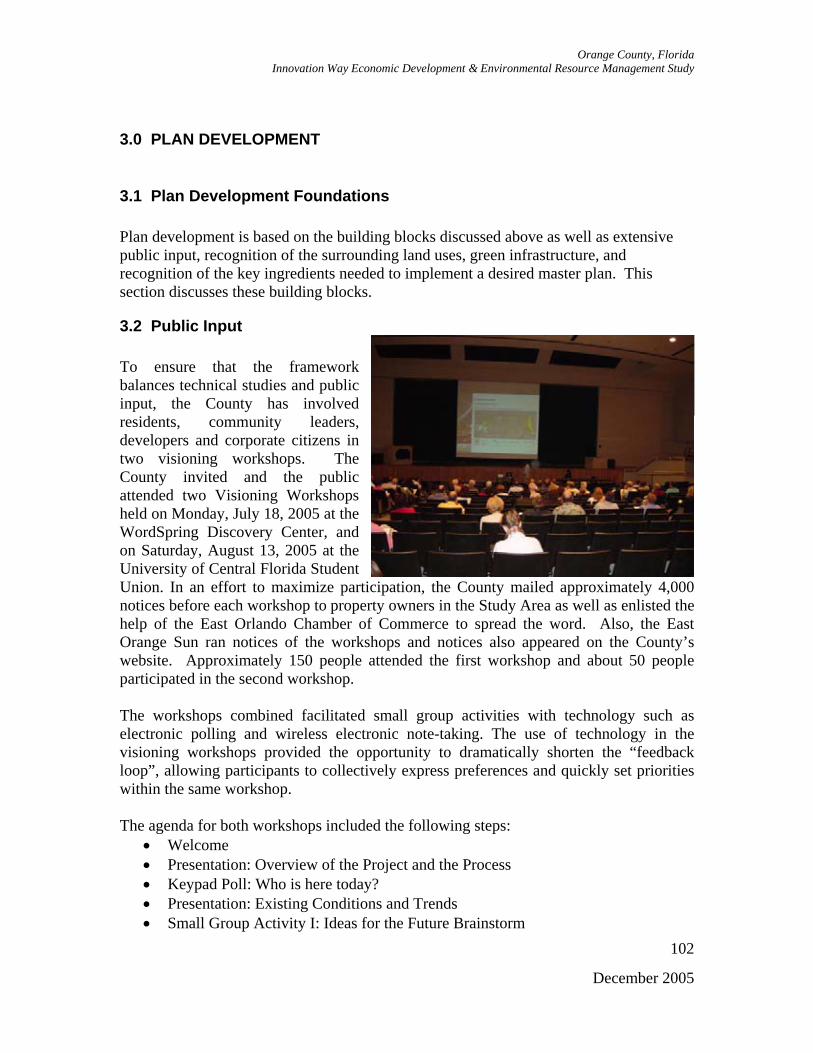
Orange County, Florida Innovation Way Economic Development & Environmental Resource Management Study
December 2005
102
3.0 PLAN DEVELOPMENT
3.1 Plan Development Foundations Plan development is based on the building blocks discussed above as well as extensive public input, recognition of the surrounding land uses, green infrastructure, and recognition of the key ingredients needed to implement a desired master plan. This section discusses these building blocks.
3.2 Public Input To ensure that the framework balances technical studies and public input, the County has involved residents, community leaders, developers and corporate citizens in two visioning workshops. The County invited and the public attended two Visioning Workshops held on Monday, July 18, 2005 at the WordSpring Discovery Center, and on Saturday, August 13, 2005 at the University of Central Florida Student Union. In an effort to maximize participation, the County mailed approximately 4,000 notices before each workshop to property owners in the Study Area as well as enlisted the help of the East Orlando Chamber of Commerce to spread the word. Also, the East Orange Sun ran notices of the workshops and notices also appeared on the County’s website. Approximately 150 people attended the first workshop and about 50 people participated in the second workshop. The workshops combined facilitated small group activities with technology such as electronic polling and wireless electronic note-taking. The use of technology in the visioning workshops provided the opportunity to dramatically shorten the “feedback loop”, allowing participants to collectively express preferences and quickly set priorities within the same workshop. The agenda for both workshops included the following steps:
• Welcome • Presentation: Overview of the Project and the Process • Keypad Poll: Who is here today? • Presentation: Existing Conditions and Trends • Small Group Activity I: Ideas for the Future Brainstorm
Orange County, Florida Innovation Way Economic Development & Environmental Resource Management Study
December 2005
103
• Presentation: Current Proposals for “Innovation Way” Corridor • Small Group Activity II: Critical Questions • Presentation: Summary of Ideas for the Future • Keypad Poll: Measuring Agreement • Overview of Evening Results and Next Steps • Adjourn
In total, participants generated 356 ideas for the future. These ideas were encoded in a computerized database verbatim and sorted into applicable categories. The participants then prioritized and categorized their ideas and then the entire assembly voted on the priority ideas by category. The critical issues discussed were economic prosperity, land use and development, natural environment, and transportation. In the August workshop a fifth critical issue was polled concerning social issues. The assemblies at both workshops voted for the top two priorities for each critical issue category. The top two results voted most important by the workshop participants are listed below by category.
• Economic Prosperity July 18, 2005 1. Innovation industries centrally located around which to build communities
and bring hi tech and IT jobs without long commutes. 2. Incentives to draw high-tech industry to the area. August 13, 2005
Active and passive recreation areas, large regional, small neighborhood parks, more family recreational activities. Incentivize high-paying employers.
• Land Use and Land Development
July 18, 2005 Develop a plan that identifies environmental resources, protects transportation corridors, and development nodes. Land use and development should encourage development that allows residents to live and work within the region.
August 13, 2005
Appropriate mix of land uses supported by adequate infrastructure (roads, trails, transit). Appropriate mix of land uses supported by adequate infrastructure (roads, trails, transit).
• Natural Environment
July 18, 2005 Develop an integrated ecological based natural area plan with both uplands and wetlands being functional 50 years from now.
Orange County, Florida Innovation Way Economic Development & Environmental Resource Management Study
December 2005
104
Better connected park systems. Protect wetlands, greenspace, and wells and keeping the natural setting, maintaining the preservation, keep the County look-feel.
August 13, 2005
Identify what is truly environmentally sensitive versus what is not and incorporate in long-range planning, mix of housing that is also affordable. Identify, protect and increase sensitive environmental areas including watersheds and conservation area.
• Transportation
July 18, 2005 Develop master plan for balanced growth served by an efficient multi-modal transportation system serving OIA, Downtown and the universities. County should construct improvements large enough to handle all projected growth in the area. Good public planning is critical to a quality environment.
August 13, 2005
1. Create transportation that will facilitate parks, rec., entertainment types area (separating people etc.).
2. Need to think about overall density, problem with road traffic.
• Social Issues August 13, 2005 1. First Priority: Adherence to a solid, responsible development plan
(leadership). 2. Balance interests of transportation, residential and commercial development,
schools and environment. Post-workshop, the ideas in each critical issue category were reviewed, themes were identified for recurring concepts, and vision statements were formulated based on these emerging themes. ACP – Visioning and Planning, Ltd. prepared a detailed summary of the polling results and an analysis of the workshop feedback which is included as an appendix to this report. The vision statements and themes were carefully considered when drafting the master plan for the area and were reflected in the final product.

Orange County, Florida Innovation Way Economic Development & Environmental Resource Management Study
December 2005
105
3.3 Surrounding Land Uses
3.3.1 International Airport The Orlando International Airport is located 9 miles southeast of downtown Orlando, at the junction of State Road 436 (SR 436 - Semoran Boulevard) and State Road 528 (SR 528 - Beachline Expressway). In 1974 McCoy Air Force Base (MCO) closed and in 1975 the City of Orlando received the deed for land for airport facility use. Shortly thereafter the Greater Orlando Aviation Authority (GOAA) was created by special legislative act and the airport was renamed Orlando International Airport The Orlando International Airport (MCO remains the official airport designator code), is operated and managed by the Greater Orlando Aviation Authority. The Greater Orlando Aviation Authority consists of five board members appointed by the Governor of the State of Florida, one member from the Orlando City Council and one member from the Orange County Commission. An Executive Director appointed by the Authority manages the airport system and a staff of over 500 full-time employees. The Orlando International Airport is a large, well equipped, state of the art facility. The airport contains a total of 14,672 acres, making it the third largest airport in overall area within the United States. The central tri-level building is connected to four airside satellite terminals by people mover systems. The airport features two 12,000 foot by 200 foot runways, one 10,000 foot by 150 foot runway, and more than 5 million square feet of total airport terminal space. The airport has a parking capacity of over 20,000 paved parking spaces and has an Automated Guideway Transit Systems (AGT) which consists of four 1,960-foot elevated guideways; and eight trains containing a total of 24 vehicles with the capacity for 85,000 passengers per day. The Orlando International Airport has been designated a large hub by the FAA. Single plane service is available to more than 120 cities worldwide. The Greater Orlando Aviation Authority is in the midst of a $1.2 billion expansion program previously approved by the Board and its airline partners. Future projects include a fourth runway, Concessions Redevelopment, Heintzelman Blvd. extension, and a new, 14-acre Cessna Site. Preparatory work has begun on Phase I of the South Terminal Complex, which will double the current facility when fully completed. The Orlando International Airport is served by more than 50 airlines. The Airport provides scheduled non-stop service to 70 destinations in the U.S., scheduled non-stop service to 14 international cities, and direct service to more than 100 locations world-wide. Approximately 86,000 passengers use the airport on a daily basis and 31,469,000 annually. There are approximately 880 daily airplane arrivals and departures from the airport and 324,000 annually.
Orange County, Florida Innovation Way Economic Development & Environmental Resource Management Study
December 2005
106
The Orlando International Airport continues to grow and exceed expectations at a rapid pace. Passenger traffic exceeded previous records set in March 2001, and in 2004, the Orlando International Airport overtook Miami as the largest passenger airport in Florida. In terms of overall passenger traffic it is currently ranked #14 in the U.S. and #24 in the world. The airport has received numerous awards and high ratings for customer service and satisfaction.
3.3.2 The University of Central Florida Originally founded as the Florida Technological University in 1963 the name was eventually changed by the Florida Legislature to the University of Central Florida in 1978. Construction on the University began in 1967 and classes were first held the following year. The original enrollment of students numbered just under 2000. Today the University reports a steadily increasing student population and a current enrollment of more than 42,000. The University of Central Florida is located 13 miles east of downtown Orlando. It is one of Florida's 11 public universities. The University has four regional campuses throughout the greater metropolitan Orlando region in addition to the main campus. The main campus is located on 1,415 acres; the campus covers a total of 5,518,957 gross square feet and consists of 117 permanent buildings. The University of Central Florida is a major regional employer. The University employs approximately 4,700 full and part time faculty and staff. Seventy percent of University faculty have doctoral degrees and average a salary of $103,586 for 12 month terms and $63,566 for 9 month terms.
3.3.3 Central Florida Research Park The Central Florida Research Park is one of the 10 largest high technology/research parks in the country and the only large-scale success in Florida. Located directly adjacent to the main UCF campus, it is a university related research park established as a result of legislation passed by the Florida Legislature in 1978. The Park is a cooperative effort between UCF, the Orange County Research and Development Authority, and the Orange County Board of County Commissioners. The governing body of the Park is the Orange County Research and Development Authority (the Orange County Board of County Commissioners appoints the members of the Authority). The primary objective of the Central Florida Research Park is "to encourage and promote the establishment of research and development activity combining the resources of institutions of higher learning, private sector enterprise involved in pure or applied research, and state or federal governmental agency research." The goal of the research park is to establish an academic/industry community, which fosters connections between
Orange County, Florida Innovation Way Economic Development & Environmental Resource Management Study
December 2005
107
these two sectors. The establishment of close ties between the University and industry creates an attractive environment conducive to the location of research-oriented industry in the Park. Industry activity supports the academic, teaching, and research programs of the University. In turn the University as a community of scholars provides the necessary expertise and human resources to enhance the research and development activities required and planned by research park businesses. The Central Florida Research Park provides a campus-like environment for business adjacent to UCF on over 1,000 acres of land. Businesses which desire a "university relationship" can purchase or lease land in the Research Park on which to construct a facility or can lease space for office, office/lab, or light manufacturing activities. Currently over 100 companies are located in the Research Park pursuing activities in simulation and training, lasers, optical filters, behavioral sciences, diagnostic test equipment, and oceanographic equipment. Approximately 9,500 employees currently work in the Research Park including faculty and students. University organizations, including the Institute for Simulation and Training, are located in the Research Park. The Naval Air Warfare Center Training Systems Division, and the Army Simulation, Training, and Instrumentation Command (STRICOM), the focal point of the nation's simulation and training industry, have their headquarters in the Research Park. Over $700 million in federal contracts is granted by the Army and Navy each year. Research Park tenants are closely involved with the University of Central Florida through sponsored research, faculty consultants, and provide an opportunity for graduate and undergraduate student internships and employment. Research Park tenants may also contract with the University for library use, computer resources, and laboratory facilities. Cooperative projects range from technical research to developing business plans and employee training programs.
3.3.4 Valencia Community College In 1967, Valencia Junior College was founded to serve students in Orange and Osceola Counties. The college changed its name in 1971 to become Valencia Community College. Today, Valencia Community College is the third largest of Florida’s 28 community colleges. Valencia boasts an annual enrollment of over 50,000 students. The Valencia Community College offers the Associate in Arts degree in over 40 A.A. pre-majors, and more than 80 Associate in Science and Applied Science degree and certificate programs which lead to immediate entry into the workforce. Valencia Community College has been one of the fastest growing of the five largest Florida community colleges. Valencia employs 385 full-time faculty, 21.8% with doctoral degrees and 79.3% have master’s degrees. The college operates four campuses and two centers in the Orlando area. Eighty-two percent of Valencia graduates, who choose to transfer to the State University System, continue their studies at the University of Central Florida.

Orange County, Florida Innovation Way Economic Development & Environmental Resource Management Study
December 2005
108
3.3.6 Existing DRIs The Eagle Creek DRI is located close to the Orange/Osceola County boundary along Narcoosee Road. According to the approved development order a 1,253 acre mixed use development will be allowed with 2,850 single-family dwelling units, 150,000 square feet of retail space, 50,000 square feet of office space, a 150 room hotel, and an 18 hole golf course. The development order approved in 2001 by the Orange County Board of Commissioners specifies a three part phasing plan establishing residential units and the golf course in the first phase and successively adds retail and office uses in following stages. The Campus Crusade for Christ (CCCI) received development order approval for a Development of Regional Impact from Orange County in 1995 to construct their international headquarters. The original 285 acre site was recently expanded, however, in 2000 with the approval of the Moss Park DRI. The Moss Park DRI adds 1312 contiguous acres of land (total 1,597 acres) and allows for a mixed use development. The development order will allow 2,650 single family dwelling units, 150,000 square feet of retail space, 1,100,000 square feet of office space, 250,000 square feet of industrial, and 1,100 hotel rooms. According to the developer, International Corporate Park is a large business/industrial/research park, with more than 2,900 acres of fully permitted sites and 20 million square feet approved for manufacturing, light industrial, biotech, warehouse, telecommunications, office and small business. It is the future home of the second site of the Central Florida Research Park. The developer will provide a fully updated telecommunications infrastructure, including broadband wireless, an underground fiber optic ring which will surround the entire park, and a Network Operations Center. Roadway infrastructure and utilities are in place including high-capacity sewer and water system. International Corporate Park also plans to provide master-planned communities including single-family residential neighborhoods, multifamily housing, and senior living facilities as well as a K through12 charter school.
3.4 Green Development – The Starting Point
3.4.1 An Introduction to Green Development When considering the tremendous changes and impacts the development of a large scale high technology district may bring to Orange County and the Orlando Metropolitan region, it is necessary to take a proactive approach to planning to ensure growth proceeds in a manner consistent with the visions and goals of Orange County. These goals may best be realized by using innovative planning strategies that seek to protect the natural resources and infrastructure assets of today while planning for a high quality future. The

Orange County, Florida Innovation Way Economic Development & Environmental Resource Management Study
December 2005
109
term “Green Development” refers to the basic idea of managing growth in a manner that is environmentally sensitive to produce cost effective, attractive, and people oriented environments. This approach supported by the Rocky Mountain Institute looks to integrate ecology and real estate in an effort to go beyond ordinary development practice. By combining environmental responsiveness, resource efficiency, and sensitivity to the existing culture and community; environmental and economic benefits may be realized through the Green Development approach. This approach identifies and links interconnections to find the best solutions to multiple problems. A decision making approach that focuses on what end users want and need is a part of this process. For example, by addressing the infrastructure needs associated with a high technology research businesses up front and how these needs may be met at the lowest cost, can yield tremendous savings. This consideration may also increase the desirability and attractiveness of the Innovation Way location. Adaptability issues should be considered. Design decisions made during the preliminary planning stages can have substantial affects on the overall productivity, attractiveness, longevity, and adaptability of the project. Bringing the right people together enables a complete consideration of various needs so that the vision and goals can be realized. Public visioning workshops and community charrettes are excellent ways of gathering viewpoints and building consensus.
3.4.2 Responsible Greenfield Development When considering the development of Innovation Way, it is important to consider the problem of urban sprawl. Urban sprawl has many costs including: dependence on automobiles, long commutes, loss of prime agricultural lands, loss of neighborhood cohesiveness and sense of community, and the creation of unattractive and unappealing environments. Responsible greenfield development minimizes the environmental impacts associated with sprawl. Planning to mitigate the effects of sprawl may include cluster development patterns, protection of significant ecosystem/wildlife corridors, and reducing automobile dependence through compact land use patterns and transit systems. Cluster development patterns can produce cost effective and attractive places by clustering buildings together in order to preserve remaining land for open space or conservation. By grouping buildings and development together (in a density found in most city neighborhoods), tremendous amounts of land can be salvaged from a standardized and uniform low density development pattern. Cluster development patterns offer the opportunity to create communities that acknowledge the existing natural topography and terrain. Development patterns in the United States since the 1940s have produced automobile centered suburban style large lot communities. Zoning laws regulated single land uses and large setbacks from the street as well as from adjacent buildings. The idea was to create housing subdivisions based on the “private estate” model separated from work
Orange County, Florida Innovation Way Economic Development & Environmental Resource Management Study
December 2005
110
(e.g. industry or manufacturing). Neotraditional development (New Urbanism, Transit Oriented Development) instead advocates for a building pattern based on small cities and towns prior to the suburban postwar housing boom. Neotraditional developments stress close building proximity, a mix of housing types, a mix of land uses, a grid street pattern, and public space. Neotraditional developments strive to create a sense of community by creating environments based not on the automobile, but on pedestrians. These communities stress multimodal forms of transportation (pedestrian, bicycle, bus, automobile). They are designed to offer those who do not drive a degree of mobility, including the elderly and young. These concepts are reinforced through civic architecture, public spaces, narrow streets to slow traffic, front porches, and shallow front yard setbacks designed to encourage neighbor communication and interaction.
3.4.3 Integrating Green Development Ideas Large “corporate campuses” located outside urban centers have serious land use planning implications including dependence on the automobile for commuting and the destruction of natural resources leading to a sprawling development pattern. The aerospace industry giant Boeing Corporation built a corporate campus, Longacres Park, addressing some of the land use concerns associated with sprawl. Conscious of the impact on Seattle’s already overcrowded roadways, Boeing chose to locate on 214 acres outside the city. Instead of building in a remote location, Boeing chose to build adjacent to a metro transit route. The new development is organized around a central park, and wherever possible the site plan clusters buildings to create common entries and outdoor terraces. A network of paths and covered walkways encourages walking between buildings. Boeing downsized the parking area, provided buses for students and visitors, and implemented ride sharing other incentives to minimize automobile use. To avoid sprawl, Innovation Way should focus on increased intensities and densities in the corridor, with low densities and more conservation areas outside of the corridor, creating a compact urban form.
3.5 High Tech Industry and the Research Park The high technology industry is a fast growing, high paying, and extremely diverse industry encompassing the research and development associated with everything from medicine to aeronautics. As the high technology industry has grown more specialized so have the needs and demands of the industry. Today, the physical location and supporting facilities of the surrounding region are critical. With the advent of successful examples like the Research Triangle Park in North Carolina and Silicon Valley in northern California, the advantages of grouping or clustering high technology corporations with research institutions have become evident. The research park located near a major university clustered with similar high technology industry firms has become a viable model to maximize the benefits associated with location. Clusters provide extensive

Orange County, Florida Innovation Way Economic Development & Environmental Resource Management Study
December 2005
111
resources for established businesses and create a spawning ground for start-up companies. The Florida High Tech Corridor Council (FHTCC) an advocacy group established by the Florida Legislature to promote high technology industry identifies six industry sectors: Aviation and Aerospace, Information Technology, Medical Technologies, Microelectronics, Modeling/Simulation/Training, and Optics/Photonics. Combinations and clusters of these sectors compose successful research parks and define the high tech industry throughout the United States and world. Land Uses and businesses appropriate for a high tech research park include: medical research and/or laboratory, a hospital, research and development, bio tech, computer software development, data processing, corporate headquarters (over 25,000 s.f.), and electronic manufacturing and development. One general definition of a technology/research park characterizes the parks as spacious and well landscaped, with excellent architectural quality, rigorous exclusion of incompatible industrial uses, and heavy emphasis on aesthetic and environmental considerations. This type of park is different from an industrial park or a warehousing center, both of which conflict with the implementation of high tech/high value users. (Source: Industrial Development Handbook, the Urban Land Institute, 1975.) Further, the Association of University Research Parks (AURP) defines university related research parks as master planned properties and buildings with:
• A contractual, formal or operational relationship with one or more science/research institutions of higher education
• A role in promoting the university's research and development through industry partnerships, assisting in the growth of new ventures and promoting economic development
• A role in aiding the transfer of technology and business skills between university and industry teams
• A role in promoting technology-led economic development for the community or region
• The park may be a not-for-profit or for-profit entity owned wholly or partially by a university or a university related entity. Alternatively, the park may be owned by a non-university entity but have a contractual or other formal relationship with a university, including joint or cooperative ventures between a privately developed research park and a university
3.5.1 Keys to a Successful High Technology Corridor The high technology industry is viewed by many as a critical component to the continued growth of the local and regional central Florida economy. The high technology industry does not grow uniformly, but rather in concentrated geographical locations (e.g. Silicon Valley, Raleigh-Durham Research Triangle). The question of what makes a successful high technology research park has been asked by many cities and regions around the nation and answered with varying degrees of success. Although the ultimate success of

Orange County, Florida Innovation Way Economic Development & Environmental Resource Management Study
December 2005
112
high tech business commerce relies on numerous interrelated factors, a few critical ingredients for a successful site have been identified. The high tech industry demands a highly educated workforce, the close proximity to major research institutions, as well as a supportive regional community and infrastructure. All of these factors combined are important. Without a major research university or being situated in a place that high technology professionals want to live the results will be uncertain. For example many communities have the research capacity, but are not the type of metropolis that global companies tend to call home. Other communities have a business-friendly atmosphere, but lack a major research institution. In addition to the above characteristics needed for the successful startup of a high technology research park, the presence of one defining industry sector or company to galvanize interest and characterize the area is often beneficial. International Business Machines Inc. set up operations in the Research Triangle Park in the Raleigh-Durham, N.C., area, leading that park to become the largest in the country. Likewise Silicon Valley has defined itself as a leader in the computer industry. Similarly the Orlando region has begun to distinguish itself as a focal point for the nation's simulation and training and optics/photonics industry. A study completed by the Association of University Research Parks, which surveyed major research parks throughout the nation found that after the lack of venture capital research parks report that “Availability of Land”, the “Lack of Community Support”, and “Access to University Resources” were all major barriers that impede growth. The University of Central Florida (UCF), Valencia Community College, and other regional institutions are an important aspect in the promotion of the high technology industry. Both the University of Central Florida and Valencia Community College located to the north will directly contribute to the research and workforce needs of high tech companies. These institutions will provide qualified and highly educated students, graduates, and faculty necessary to meet the research and development needs of businesses. Further, the University of Central Florida has taken important steps to promote high technology by making the School of Optics and Photonics full college status. In doing so it has become the first college dedicated specifically to Optics and Photonics at a public university in the United States. A supportive regional community and infrastructure is also important in the promotion of a research park. Competition for high tech firms is fierce and many city, county, and state governments across the nation have taken steps to encourage the establishment of high technology industry through incentive programs. Examples of such programs include:
• Business Incubator Programs • Fast Track Permitting • Reduced Impact or Development Fees • Higher Education Program Development • Workforce Technical Training Grants • Specialized Training Coordination
Orange County, Florida Innovation Way Economic Development & Environmental Resource Management Study
December 2005
113
• Job Creation Tax Credits • Business Recruitment • Enterprise Zone Tax Credits • Small Business Assistance • Utility Rate Incentives • Reduced Income Tax Rate for High-Tech Companies • Venture Capital • Financial Assistance
Although a multitude of incentives exist, those programs that maximize the opportunities specific to Orange County and the Innovation Way high technology corridor should be pursued. An example of how these incentive programs may work to attract and create high technology business growth can be found in the development of the University Research Park (URP) in Riverside California. The City of Riverside, the County of Riverside, and the University of California, Riverside (UCR) have formed a tri-party partnership to establish the University Research Park. The research park is in close proximity to the university and offers access to the university resources. The City of Riverside, Riverside County and UCR have each provided resources in the development of the project. Contributions have included $3 million from the County for land assembly and site preparation and $1.8 million from the City for infrastructure including a fiber optic ring. The university plans to develop a technology transfer center and provides space for the Small Business Development Center, which offers a variety of on-site business support services. The City of Riverside provided a 48 strand fiber optic backbone designed to accommodate high-speed voice, data, and video services for networking in and outside of the park. Currently, the city is implementing a high tech overlay district designed to maintain the focus of the park on research and development. The City of Riverside also expedites development review and permit processing of projects within the park. Planning for the high tech industry in central Florida is not new. The idea of a high technology center in the Orlando metropolitan area has been supported by local decision makers, regional governments, as well as the State of Florida. The Innovation Way corridor falls into a vision of a high technology corridor stretching from Tampa Bay through Orlando to Daytona Beach and the Space Coast. The Central Florida Research Park established as a result of legislation passed by the Florida Legislature in 1978, has become one of the most successful research parks in the country. The park is notable as the home of the Army’s Simulation, Training, and Instrumentation Command (STRICOM), the center of the nation's simulation and training industry. Although many needs of high tech companies do not exceed the normal regulations governing manufacturing and general industry, special ad hoc advisory committees should be formed to guide and manage the direction of the research park due to the unique demands and concerns of individual companies. Site planning will play an important role in the location of companies that may use hazardous materials or create malodorous odors. Site planning will also play an important role in the conservation of

Orange County, Florida Innovation Way Economic Development & Environmental Resource Management Study
December 2005
114
environmentally sensitive areas and the positioning of mixed uses, including residential in and among the research park.
3.5.2 High-tech Site Selection Criteria The term ‘high-tech’ describes companies engaged in a growing list of businesses including:
• Software development • Memory chip development • Computers and electronics • Software development and maintenance (including Internet and web-based
activities) • Telecommunications • Biomedical • Genetics and genome research • Nanotechnology • Myriad advanced manufacturing and industrial technologies • Environmental and pollution control technologies • Agricultural and food-sciences • Government programs related to energy • Transportation • Space and astronomical sciences • Unknown technologies grown from ongoing research and development.
The primary driving factor for high-tech firms is a qualified work force. These companies are seeking higher education degrees, especially masters and doctorates. In particular, advanced degrees in physics, chemistry or biology are highly prized. National site selection consultants agree that communities competing to attract high-tech companies must demonstrate the following criteria: • evidence of a stable work force with low turnover • an ability to recruit and retain highly qualified employers from outside the region • work-force diversity • an ability to recruit and retain foreign workers to the region • acceptance of foreign workers. Proximity to universities with strong research and development backgrounds is also important. Universities provide R&D support, both independently and through private financial support, as well as deep involvement in federally funded research programs. Such institutions also provide graduates for recruitment and hiring, plus new product

Orange County, Florida Innovation Way Economic Development & Environmental Resource Management Study
December 2005
115
development including new technology that can be commercialized and taken to the market. Additional beneficial factors include property tax abatements and accelerated depreciation schedules for production, manufacturing and other equipment, which can be just as important as abatements. Incentives and any tools that help a company reduce costs are becoming increasingly more appealing when companies are comparing locations around the country. For most high-tech companies, venture capital is not a strong factor, but it may influence startups searching for their financial footing. The traditional quality-of-life factors such as competitive costs for housing and food, access to the arts and entertainment options have weight for many knowledge-based firms and their educated workers. The ideal community for a high-tech firm will work with the company to educate and supply the best workers possible, and support pro-business laws benefiting the bottom line. In turn the company will be a great community neighbor, and will respect and continually educate its workers. The following sections summarize the state and local level business advantages and incentives available to companies expanding or locating in Central Florida and the agencies responsible for administering these programs, as well as local program such as the University of Central Florida Small Business Development Center that provide assistance at little or no cost. Tax Advantages Florida's stable and highly favorable tax climate provides advantages that make a Florida location profitable for every type of business. Progressive legislation also ensures that Florida remains a worldwide hub for new and expanding businesses. Florida has no:
• Corporate income tax on limited partnerships • Corporate income tax on subchapter S-corporations • State personal income tax guaranteed by constitutional provision • Corporate franchise tax on capital stock • State-level property tax assessed • Property tax on business inventories • Property tax on goods-in-transit for up to 180 days • Sales and use tax on goods manufactured or produced in Florida for export
outside the state • Sales tax on purchases of raw materials incorporated in a final product for resale,
including non-reusable containers or packaging
Orange County, Florida Innovation Way Economic Development & Environmental Resource Management Study
December 2005
116
• Sales/use tax on boiler fuels • Sales/use tax on co-generation of electricity
Florida offers Sales and Use Tax Exemptions on:
• Semiconductor, defense and space technology-based industry transactions involving manufacturing or research equipment
• Purchases of machinery and equipment used by a new or expanding Florida business to manufacture, produce or process tangible personal property for sale
• Labor, parts and materials used in repair of and incorporated into machinery and equipment that qualify for sales tax exemption upon purchase (phased in over four years, 75% exempt on July 1, 2001)
• Electricity used in the manufacturing process • Aircraft parts, modification, maintenance and repair, sale or lease of qualified
aircraft • Commercial space activity -- launch vehicles, payloads and fuel, machinery and
equipment for production of items used exclusively at Spaceport Florida • Labor component of research and development expenditures. • Any facility, device, fixture, machinery or equipment required for pollution
control, abatement or monitoring of equipment used in manufacturing processing or compounding items for sale.
Direct Financial Incentives Direct investments and Loans Capital development is a focus of Enterprise Florida Inc., Florida's government/business partnership for economic development that assumed responsibility for guiding the state's economy. Enterprise Florida’s mission is to build access to financial markets for small- and medium-sized Florida firms in sectors generating high-wage jobs. Several financing programs are administered or marketed by Enterprise Florida Inc. These include:
• The SBA 504 subordinate mortgage loan program: Loans can be used to buy land or existing buildings, construct new or expanded facilities, and purchase machinery and equipment.
• Enterprise Bonds, a tax-exempt, pooled industrial development revenue bond program, finances fixed-asset projects for manufacturers ranging in size from $500,000 to $2.5 million or more. Bonds are credit enhanced through a direct pay letter of credit from an investment-grade commercial bank. The program provides 30 percent below-prime-rate loans at variable interest rates for terms to maturity comparable with conventional financing.
• Loans and guarantees are available to black-owned and -operated businesses through the Florida Black Business Investment Board's regional affiliates.
• Export-finance-related direct loans and guarantees as well as packaging services are offered through the Florida Export Finance Corporation. This entity provides

Orange County, Florida Innovation Way Economic Development & Environmental Resource Management Study
December 2005
117
access to EXIM Bank and SBA export finance and working capital guaranty programs.
• Enterprise Florida publishes on its website a listing of firms providing risk capital to Florida companies. The directory helps economic development organizations assist entrepreneurs in raising risk-based capital.
The Florida Recycling Loan Program The program, administered by Florida First Capital Finance Corp. (FFCFC) for the Department of Environmental Protection, provides below-market financing for companies that manufacture products from recycled materials or convert recyclable materials into raw material for use in manufacturing. Direct loans have a maximum of $200,000 and a minimum of $20,000. Maturity is up to 10 years or the weighted average life of asset(s), whichever is less. Rate of interest is fixed for the life of the loan and may be as low as 2 percent below the prime-lending rate. Eligible use includes machinery and equipment for manufacturing or processing, or for conversion systems utilizing materials that have been or will be recycled. Private Activity Bonds (PAB) There is a federal allocation of tax-exempt bonding authority granted to each state. Florida reserves a portion of its federal allocation of tax exempt debt for manufacturing to assure that bonding capacity is reserved to finance manufacturers, which are important to our economy. State of Florida Incentives The State of Florida offers incentives for all types of businesses, from corporate headquarters to manufacturing plants to service firms. Florida offers incentives for:
• Targeted Industries • Workforce Training • Road Infrastructure • Special Opportunities
An overview of these key state incentive programs is provided in the following paragraphs. Targeted Industry Incentives Qualified Target Industry Tax Refund (QTI) The Qualified Target Industry Tax Refund incentive is available for companies that create high wage jobs in targeted high value-added industries. This incentive includes refunds on corporate income, sales, ad valorem, intangible personal property, insurance premium, and certain other taxes. Pre-approved applicants who create jobs in Florida receive tax refunds of $3,000 per net new Florida full-time equivalent job created; $6,000 in an Enterprise Zone or rural county. For businesses paying 150 percent of the average annual wage, add $1,000 per job; for businesses paying 200 percent of the average annual
Orange County, Florida Innovation Way Economic Development & Environmental Resource Management Study
December 2005
118
salary, add $2,000 per job. The local community where the company locates contributes 20 percent of the total tax refund. There is a cap of $5 million per single qualified applicant in all years, and no more than 25 percent of the total refund approved may be taken in any single fiscal year. New or expanding businesses in selected targeted industries or corporate headquarters are eligible. High Impact Performance Incentive Grant (HIPI) The High Impact Performance Incentive is a negotiated grant used to attract and grow major high impact facilities in Florida. Grants are provided to pre-approved applicants in certain high-impact sectors designated by the Governor's Office of Tourism, Trade and Economic Development (OTTED). In order to participate in the program, the project must: operate within designated high-impact portions of the following sectors: biomedical technology, financial services, silicon technology, and transportation equipment manufacturing; create at least 100 new full-time equivalent jobs (if R&D facility creates at least 75 new full-time equivalent jobs) in Florida in a three-year period; makes a cumulative investment in the state of at least $100 million (if R&D facility make a cumulative investment of at least $75 million) in a three-year period. Once recommended by Enterprise Florida, Inc. (EFI) and approved by OTTED, the high impact business is awarded 50 percent of the eligible grant upon commencement of operations and the balance of the awarded grant once full employment and capital investment goals are met. Qualified Defense Contractor Tax Refund (QDC) Florida has committed to preserving and growing its high technology employment base -giving Florida defense contractors a competitive edge in consolidating defense contracts, acquiring new contracts, or converting to civilian production. The Qualified Defense Contractor Tax Refund may be up to $5,000 per job created or saved in Florida through: the conversion of defense jobs to civilian production, the acquisition of a new defense contract, or the consolidation of a defense contract which results in at least a 25 percent increase in Florida employment or a minimum of 80 jobs. Governor Bush and the 2003 Florida Legislature enacted new legislation adding contracts and subcontracts approved by the United States Department of Homeland Security as eligible under the Qualified Defense Contractors (QDC) Tax Refund program. Capital Investment Tax Credit (CITC) The Capital Investment Tax Credit is used to attract and grow capital-intensive industries in Florida. It is an annual credit, provided for up to twenty years, against the corporate income tax. Eligible projects are those in designated high-impact portions of the following sectors: biomedical technology, financial services, information technology, silicon technology, and transportation equipment manufacturing. Projects must also create a minimum of 100 jobs and invest at least $25 million in eligible capital costs. Eligible capital costs include all expenses incurred in the acquisition, construction, installation, and equipping of a project from the beginning of construction to the commencement of operations. The level of investment and the project’s Florida corporate

Orange County, Florida Innovation Way Economic Development & Environmental Resource Management Study
December 2005
119
income tax liability for the 20 years following commencement of operations determines the amount of the annual credit. Quick Response Training Incentives (QRT) Quick Response Training is a customer-driven training program designed to assist new value-added businesses and provide existing Florida businesses the necessary training for expansion. A local training provider—community college, area technical center or university—is available to assist with application and program development or delivery. If the company has a training program, a state training provider will manage the training program and serve as the fiscal agent for the grant funds. Reimbursable training expenses include: instructors’/trainers’ salaries, curriculum development, textbooks/manuals, and materials/supplies. This program is customized, flexible and responsive to individual company needs. Workforce Florida, Inc. is Florida’s innovative private-public partnership for competitive workforce incentives. Incumbent Worker Training Program (IWT) Incumbent Worker Training is a program that provides training to currently employed workers to keep Florida’s workforce competitive in a global economy and to retain existing businesses. The program is available to all Florida businesses that have been in operation for at least one year prior to application and require training for existing employees. Road Infrastructure Incentive Economic Development Transportation Fund The Economic Development Transportation Fund, commonly referred to as the “Road Fund,” is an incentive tool designed to alleviate transportation problems that adversely impact a specific company’s location or expansion decision. These grants are limited to $2 million and are awarded to the local government for public transportation facility improvements. Special Opportunity Incentives Urban Incentives Florida offers increased incentive awards and lower wage qualification thresholds for businesses locating in many urban core/inner city areas that are experiencing conditions affecting the economic viability of the community and hampering the self-sufficiency of the residents. Enterprise Zone Incentives Florida offers an assortment of tax incentives to businesses that choose to create employment within an enterprise zone, which is a specific geographic area targeted for economic revitalization. These include a sales and use tax credit, tax refund for business machinery and equipment used in an enterprise zone, sales tax refund for building
Orange County, Florida Innovation Way Economic Development & Environmental Resource Management Study
December 2005
120
materials used in an Enterprise Zone, and a sales tax exemption for electrical energy used in an enterprise zone. Brownfield Incentives Florida offers incentives to businesses that locate in Brownfield sites, which are underutilized industrial or commercial sites due to actual or perceived environmental contamination. The Brownfield Redevelopment Bonus Refund is available to encourage Brownfield redevelopment and job creation. Approved applicants receive tax refunds of $2,500 for each job created. Federal and State Programs Contrary to popular belief, the government does not give away "free money" to starting or expanding businesses. However, there are several federal and state programs available that provide businesses with some financial aid including the following: Enterprise Bond Program The state provides financial assistance through the Enterprise Bond Program. The program offers tax-exempt, low interest bond financing to qualified manufacturing and 501(c) 3 non-profit organizations. This program was designed to improve low cost capital availability to Florida’s growing and expanding businesses, including minorities and rural communities, to allow them to be more competitive in the global and domestic market place. Loan amounts range between $500,000 and $2,000,000. SBA Loan Programs The U.S. Small Business Administration (SBA) offers several loan programs that provide financial aid to small businesses. A few of the most popular SBA loan programs are: Basic 7(a) Business Loan, Micro-Loans, and the CDC/504 Program.
• Basic 7(a) Business Loan Program: All 7(a) loans are provided by lenders who are called participants because they participate with SBA in the 7(a) program. 7(a) loans are only available on a guaranty basis. This means they are provided by lenders who choose to structure their own loans by SBA's requirements and who apply and receive a guaranty from SBA on a portion of this loan. The SBA does not fully guaranty 7(a) loans.
• Micro-Loan Program: The MicroLoan Program provides very small loans to start-up, newly established, or growing small business concerns. Under this program, SBA makes funds available to nonprofit community based lenders (intermediaries) which, in turn, make loans to eligible borrowers in amounts up to a maximum of $35,000.
• CDC/504 Loan Program: The CDC/504 loan program is a long-term financing tool for economic development within a community. The 504 Program provides
Orange County, Florida Innovation Way Economic Development & Environmental Resource Management Study
December 2005
121
growing businesses with long-term, fixed-rate financing for major fixed assets, such as land and buildings. A Certified Development Company is a nonprofit corporation set up to contribute to the economic development of its community. CDCs work with the SBA and private sector lenders to provide financing to small businesses.
University of Central Florida Small Business Development Center One of goals of the University of Central Florida is to be America’s leading partnership university. The University of Central Florida Small Business Development Center works with small businesses across the eight-county region from three regional centers: Brevard Community College, Seminole Community College and Daytona Beach Community College. The Center also has an office at the Kissimmee/Osceola County Chamber of Commerce. The UCF SBDC has a proven track record of providing counseling, seminars and programs that help to grow successful companies. Part of the statewide network supported by the Small Business Administration and the State University System, the UCF SBDC provides one-on-one counseling to those businesses which meet minimum criteria and training in multiple areas of business management at low or no cost. The operation of the program is funded by Orange County and supported the generosity of sponsors. All of the Advisors are volunteers. Every participant of the Advisory Board Council is interested in building relationships and improving the economic community in Central Florida. Programs and Services
• Individual Assistance -Certified Business Analysts are available to discuss ideas and provide guidance on a one-to-one basis, at no charge to the client. Areas in which the CBAs can help include: business planning, market research, advertising, financial analysis, loan assistance, recordkeeping, taxes, selling to the government, energy conservation, business valuation, and business start-up.
• Seminars - Services of the SBDC include regularly scheduled training events on a wide range of business topics such as starting a business, how to find financing, taxes, writing a business plan, international trade, contracting with government agencies, patents and trademarks, and e-commerce issues. The UCF SBDC works closely with numerous community organizations to offer programs and services to the Central Florida Business Community. Examples of these partnerships include:
• CVB Resource Delivery Partnership - The SBCD is partnering with the Orlando/Orange County Convention and Visitor’s Bureau to offer business development programs to International Drive area businesses.
• Vocational Rehabilitation and Division of Blind Services Cooperative Agreements- The SBDC works in cooperation with the Vocational Rehabilitation

Orange County, Florida Innovation Way Economic Development & Environmental Resource Management Study
December 2005
122
and Division of Blind Services agencies to provide targeted assistance and training to qualifies business owners.
Advisory Board Council Program Orange County has adopted two economic stimulus packages to provide all companies in the community with opportunities to grow and prosper. With assistance from Orange County’s Economic Stimulus Package 2.0 that was approved on January 29, 2002, the UCF SBDC established the Advisory Board Council Program. The purpose of the Advisory Board Council is to provide no-cost advisory boards to take companies to the next level of their development. A few of the projects that have benefited from this program include:
• $700,000 to establish the Institute for Economic Competitiveness • $150,000 to build a Biotech Research Greenhouse • $150,000 to the UCF College of Arts and Sciences to develop a digital media
education prototype project • $100,000 to build an Orange County Venture Lab at the UCF Technology
Incubator • $100,000 to support a Business Advisory Board Service for the UCF Small
Business Development Center • $50,000 to support a Rosen School of Hospitality Management study on
enhancing jobs in the visitor-related industry • $15,000 start-up funding for the UCF Institute for Certified Business Consultants.
Over 300 professionals have volunteered to serve on advisory boards, there are over thirty companies with active boards, and these advisory boards impact over 900 jobs. An Advisory Board client company was selected as the 2004 SBA Business of the year for Florida, and the Florida Small Business Development Center Network selected an Advisory Board volunteer as the Volunteer of the Year. The "Council" is an economic development program that operates within the University of Central Florida Small Business Development Center and is significantly funded by Orange County's economic stimulus package. The Council acts as a matchmaker between Central Florida businesses and volunteer Advisors. By forming advisory boards, the Council can assist business reach the outside expertise that the business needs. The Council's intent is to positively impact Central Florida businesses as measured by revenue and profit increases, the creation of new jobs, and an increase in client employee

Orange County, Florida Innovation Way Economic Development & Environmental Resource Management Study
December 2005
123
wages, improved operations and customer service and reduced costs and delivery times. The Council exists to help businesses get to the next level. Once a company completes the Advisory Board Council application, a brief interview is conducted and the information gathered is used to evaluate whether the company is ready to work with an Advisory Board. Then the company's needs are defined and volunteer Advisors, who have completed an Advisor application and are "on file" with the Council, are selected. The potential Advisors then meet with the Client. This meeting allows both the company director and the Advisor to determine if it is a suitable and worthy "match". After the Client has met all of their Advisors, a first board meeting time is scheduled. Board meetings are quarterly for approximately 3 hours each. Every meeting focuses on strategy and planning, with the Client taking "Action Items" to work on and report back at the next meeting. Phone and email support is encouraged and often necessary. The board works together for approximately 12 months. Some boards may stay in place longer if needed to complete projects, or at the request of the board. After board service for one company, and Advisor can be assigned to a new Client Company if he or she chooses to do so.
Orange County, Florida Innovation Way Economic Development & Environmental Resource Management Study
December 2005
124
4.0 MASTER PLANNING Using the building blocks discussed above, the consultant team believed that the three predominant goals of the master plan should be to: 1. Provide a green network protecting wetland systems and preserving upland habitat. 2. Provide an adequate supply of land to be used primarily for high tech/high value users to last at least 25 years. 3. Anticipate that the limiting factor will be long term roadway capacity. The green network, provided in master plan scenarios 2,3, 4, and 5 accomplishes several environmental objective to include:
• A sustainable/continuous wildlife corridor is provided north to south through the project area. No new development activity should be allowed to pierce this corridor.
• Other ecologically sensitive areas are connected to the main corridor. A trail system is proposed that will link these assets together to be enjoyed by the community as a whole. Densities and intensities decrease comprehensive plan entitlements as one gets closer to the Econ River.
The scenarios that are discussed below all provide a land inventory for high tech users that exceeds 25 years. A two mile wide corridor is proposed. Adjusting gross acres to delete wetland acres, road right of ways, stormwater retention, committed projects and additional open space, the building program identified for each scenario still supplies a healthy inventory of available land. The major constraint to implementation of a successful high technology park will be inadequate roadway capacity. To address this concern, the master plans presented in scenarios 2, 3, 4, and 5 all include a strong multi modal component consisting of two multi modal stations, a looped internal transit system intended to be used by pedestrians, bicyclists, and shuttles. The loop system is “fed” by multi modal trails extending out of the corridor to other parts of the Study Area. Another key component of the transportation network will be the Innovation Way arterial. The master plans anticipate a 240 foot wide right of way that would, at build out, accommodate a six land divided roadway and a rapid rail and/or express bus dedicated lane. Third, Innovation Way will have a limited number of access points/intersections. Access points will be spaced approximately one mile apart with allowances made for avoiding wetland impacts. Fourth, parallel roadway facilities to Innovation Way will be encouraged. These parallel arterials will be intended to accommodate internal project traffic and keep the internal traffic off of Innovation Way.

Orange County, Florida Innovation Way Economic Development & Environmental Resource Management Study
December 2005
125
4.1 Five Scenarios
4.1.1 Scenario One: Current Trends This option extends current development trends to buildout. The scenario recognizes the current development opportunities and constraints inherent in existing governmental land use plans, zoning, and regulatory requirements. This program is predicated on doing no further sector wide master planning for the area and assuming that the development trends that have shaped Orange County to date continue. In assessing the current trends, it is assumed that a high tech corridor remains as one of the accepted goals. (Please refer to Figure 4. 1.1-1) It would be very difficult to implement a high tech corridor under the current trends scenario for several reasons. First, without a plan, landowners will respond to the market demands of today (vs. tomorrow). The demand today (2005) is for residential. For a County to successfully launch a high tech park/corridor, there are some key components that are recognized as being essential to include a master plan with development guidelines supportive of the high tech use, a transportation system that is effective in moving people and goods, an educated labor force within a reasonable commuting distance of the work place, provision or existence of lifestyle quality indicators such as schools, libraries, cultural opportunities, and recreational opportunities. Maintaining existing development trends would not directly support any of these needs. In addition, getting landowners to voluntarily set aside lands where the demand for the proposed use may take a period of time to mature could be difficult. For these reasons, the current trends scenario is not supportive of the County’s goal of providing a high tech corridor that is competitive in attracting industry at the national and international level. As a consequence, this option seems to have the least chance of success and would therefore have the most adverse impact on the County’s goal of providing employment diversification and improving its ad valorem tax base. Providing an effective transportation network for the sector in the current trends scenario could be achieved by developer exactions and impact fees as well as future improvements undertaken by the FDOT. However, prioritization of improvements would be based on demand for the improvement which, in turn, would be based on the demand of current development trends. Under this scenario it would be difficult to provide a comprehensive transportation network intended to support a unified high tech corridor. Achieving a massing of employees to support mass transit would also be hindered by maintenance of current trends. In analyzing the consequence of maintaining current trends on environmental systems it is important to note that the current trends scenario is not “freezing” what is geographically in place today, but rather “freezing” the existing entitlements/planning and permitting system that is in place today. Therefore, the question that needs to be answered is has the existing planning/permitting system provided the level of protection that is needed or desired. From the visioning workshops, it appears that the answer to the

Orange County, Florida Innovation Way Economic Development & Environmental Resource Management Study
December 2005
126
question is “no.” While the existing system can successfully require an individual developer to set aside some uplands and some wetlands, it is difficult to apply these set asides to an overall corridor with connectivity to other systems. Said another way, the opportunity to address ecological issues on a systemic level is diminished. Infrastructure to support the current trends scenario, excepting roads, should not be problematical in that much of the cost to provide the infrastructure is borne by the private sector as a consequence of development approvals and impact fees. However, this advantage is somewhat offset by the inability to forecast future need. Line sizes and plant capacities would be determined by projected demand and existing flows. The projected demand would be difficult to address in that it would have to be based on the County’s perception of what changes to the land use plan (if any) would occur and what population increase would accompany that land use change. In addition, there would undoubtedly be inefficiencies in the sizing, installation/construction costs, and land costs resulting from a disjointed implementation of a high tech corridor as opposed to a master planned concept.

Orange County, Florida Innovation Way Economic Development & Environmental Resource Management Study
December 2005
127
Figure 4.1.1-1 Scenario #1 Current Trends
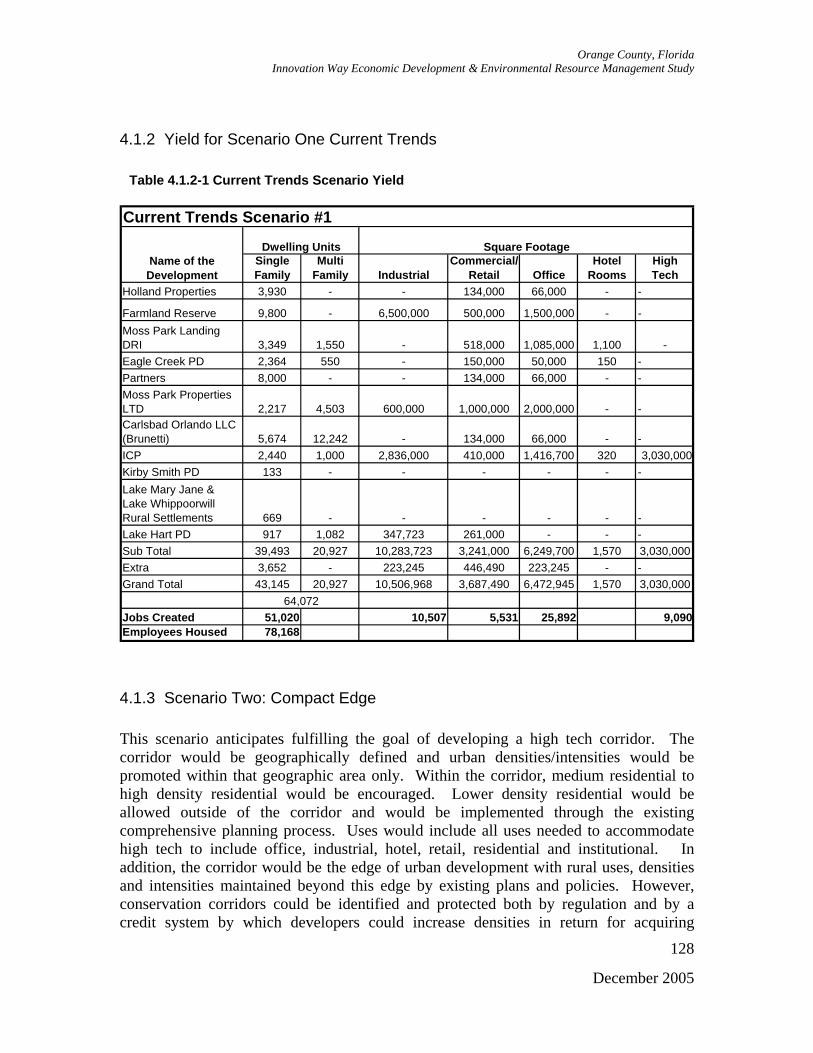
Orange County, Florida Innovation Way Economic Development & Environmental Resource Management Study
December 2005
128
4.1.2 Yield for Scenario One Current Trends
4.1.3 Scenario Two: Compact Edge This scenario anticipates fulfilling the goal of developing a high tech corridor. The corridor would be geographically defined and urban densities/intensities would be promoted within that geographic area only. Within the corridor, medium residential to high density residential would be encouraged. Lower density residential would be allowed outside of the corridor and would be implemented through the existing comprehensive planning process. Uses would include all uses needed to accommodate high tech to include office, industrial, hotel, retail, residential and institutional. In addition, the corridor would be the edge of urban development with rural uses, densities and intensities maintained beyond this edge by existing plans and policies. However, conservation corridors could be identified and protected both by regulation and by a credit system by which developers could increase densities in return for acquiring
Table 4.1.2-1 Current Trends Scenario Yield
Single Family
Multi Family Industrial
Commercial/ Retail Office
Hotel Rooms
High Tech
Holland Properties 3,930 - - 134,000 66,000 - -
Farmland Reserve 9,800 - 6,500,000 500,000 1,500,000 - -Moss Park Landing DRI 3,349 1,550 - 518,000 1,085,000 1,100 -Eagle Creek PD 2,364 550 - 150,000 50,000 150 -Partners 8,000 - - 134,000 66,000 - -Moss Park Properties LTD 2,217 4,503 600,000 1,000,000 2,000,000 - -Carlsbad Orlando LLC (Brunetti) 5,674 12,242 - 134,000 66,000 - -ICP 2,440 1,000 2,836,000 410,000 1,416,700 320 3,030,000Kirby Smith PD 133 - - - - - -Lake Mary Jane & Lake Whippoorwill Rural Settlements 669 - - - - - -Lake Hart PD 917 1,082 347,723 261,000 - - -Sub Total 39,493 20,927 10,283,723 3,241,000 6,249,700 1,570 3,030,000Extra 3,652 - 223,245 446,490 223,245 - -Grand Total 43,145 20,927 10,506,968 3,687,490 6,472,945 1,570 3,030,000
Jobs Created 51,020 10,507 5,531 25,892 9,090Employees Housed 78,168
64,072
Current Trends Scenario #1
Name of the Development
Dwelling Units Square Footage

Orange County, Florida Innovation Way Economic Development & Environmental Resource Management Study
December 2005
129
conservation easements over conservation lands or by simple fee purchase. (Please refer to Figure 4.1.3-1) This approach would also be adaptable to the traditional neighborhood design (TND) approach between the high tech corridor and the rural edge. This scenario would provide a formal designation of lands to accommodate a high tech corridor and would therefore provide the opportunity to assess the special needs of such a corridor and provide them. The advantage of such an approach is that it would improve the competitiveness of the Orange County site in the national marketplace. Not only would the high tech aspects of the project be addressed, but the ancillary retail and institutional uses associated with the high tech users would also serve the balance of the sector plan lands. The scenario would allow the County to achieve the goal of providing the high tech corridor. The transportation system that would support such a scenario would consist of a linear “spine” consisting of an Innovation Way arterial from which parallel road facilities would provide access to a secondary arterial and collector road network running approximately perpendicular to Innovation Way and its parallel network. Innovation Way would not provide direct access to any single user but would be a controlled access facility that is intended to rapidly move people and goods to other parts of the region conveniently. The parallel roads to Innovation Way would only offer direct access to high tech users exceeding a threshold of 300,000 s.f. in a single building or one million square feet in an office park environment. The secondary arterials would service regional retail and other high tech users. Medium and high density residential developments would access this network via a collector system. From an environmental perspective, this scenario could help achieve some of the County’s objectives relating to protection of environmental systems. Density/intensity bonuses can be awarded to developers who provide or acquire from others conservation easements or fee ownership of valuable environmental lands (to include native upland habitats as well as wetlands). Additionally, this concept is a macro version of clustering where higher densities and intensities are encouraged in the corridor for the specific articulated goal of preserving by acquisition or easement key environmental areas. The provision of infrastructure should be very efficient for those lands in the Innovation Way corridor under this scenario in that development is focused principally along the Innovation Way corridor thus eliminating most of the demand to extend water, sewer and grayline pipes over the entire Study Area. The provision of stormwater facilities could be especially effective under this scenario in that large ponds that would serve a master planned area would be more efficient (both in terms of the amount of land required and costs to pipe and construct). For the same reason, the provision of schools and the ease of community access to those schools would be effective with this design scenario in that situating schools close to residential areas and places of work results in a more effective delivery of students to the school site. Community parks and recreational facilities can also be used to meet some of the design requirements of the school.
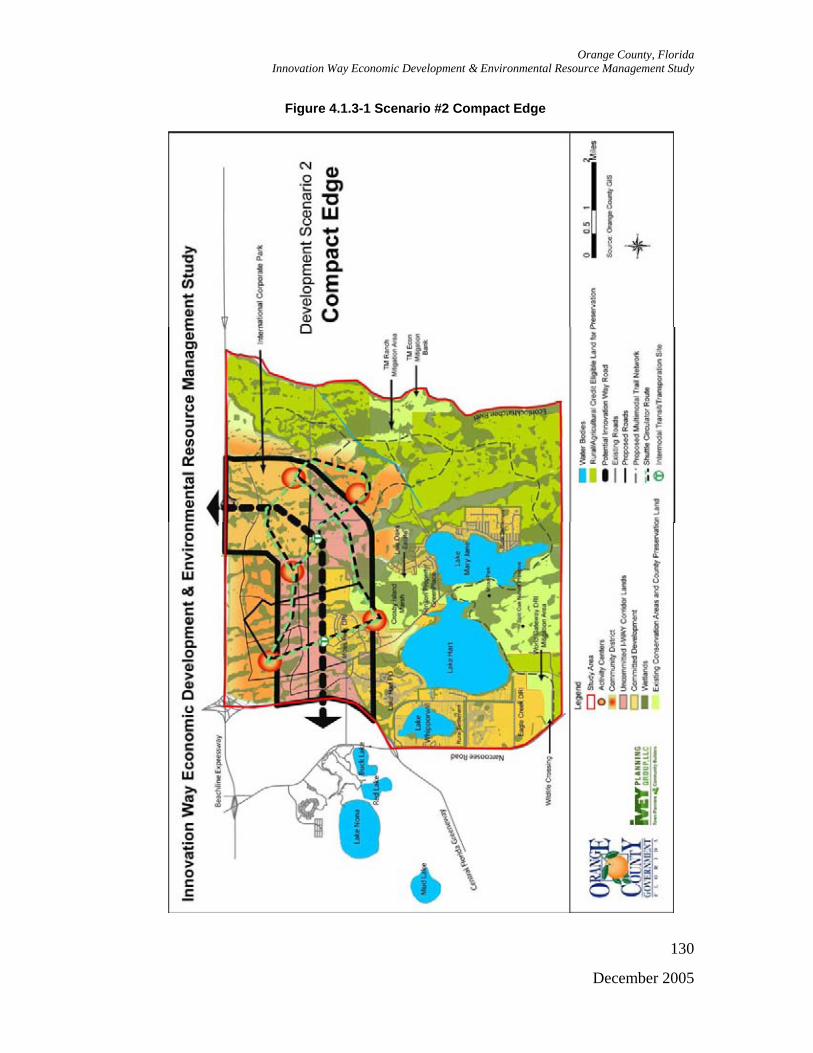
Orange County, Florida Innovation Way Economic Development & Environmental Resource Management Study
December 2005
130
Figure 4.1.3-1 Scenario #2 Compact Edge

Orange County, Florida Innovation Way Economic Development & Environmental Resource Management Study
December 2005
131
Figure 4.1.3-2 Scenario #2 Compact Edge Profile
Orange County, Florida Innovation Way Economic Development & Environmental Resource Management Study
December 2005
132
4.1.4 Yield for Compact Edge Yield for the Innovation Way High Tech Corridor
• Goal: The goal is to deliver a substantial inventory of land to be developed for high tech/high value jobs. Master infrastructure is anticipated. Other uses are discouraged except in the activity centers with the exception of hotels, which would be allowed at major intersections. Hotel use would further reduce the yield noted above, probably by 25 acres or 326,700 s.f. Open space of 15% on top of wetlands is suggested.
• Given that stormwater and roads have already been debited, a F.A.R. of .3 should be attainable. This yields 17,916,620 s.f. Over 50 years this would equal 358,332 s.f. per year. Over 25 years this would be 716,164 per year. These calculations do not include ICP or Moss Park DRI.
Yield for Activity Centers
• Goal: Provide the support needed for the high tech corridor. Therefore, uses would include retail (both community and neighborhood), transit, professional, office, hotel, and institutional uses.
Assuming an 80 acre activity center, the mix of uses would be:
• Park- 5 acres • Stormwater – 12 acres • Transit – 1 acre • Retail – 30 acres • Professional office – 7.5acres • Institutional – 9.5 acres • R.O.W. – 9.5 acres • Housing – 10.5 acres @ 12 dupa = 126 du
Non-Corridor Lands Goals
• Provide a mix of housing types • Provide a mix of housing prices • Provide 10% of housing stock as affordable to low income (defined as 80% of
average household income for Orange County) • Promote alternative forms of commuting • Provide incentives to acquire conservation easements in balance of project • Provide a reasonable land budget for schools • Yields: It is suggested to divide the remaining land into 3 blocks. Block one is all
of the land north of the corridor. Block two are those lands east of ICP, extending south and west to the gun range. Block three is a comparatively small area at the northeast corner of Moss Park.

Orange County, Florida Innovation Way Economic Development & Environmental Resource Management Study
December 2005
133
Density Single Family Multi Family Industrial/Light Industrial Commercial/Retail Office Corridor - High TechActivitiy Centers 630 435,600 870,000 975,000Community District 7,226 22,032
Compact Edge Scenario #2 AcresStudy Area 31,970.41
Innovation Way Corridor 7,322.64Less Acreage of DRIs in Innovation Way Corridor 3,458.72
Wetland in Corridor 1,819.49Wetland in DRIs and PD 689.92Wetlands in 220 foot ROW 43.23Less Wetland in Corridor (minus wetlands in DRIs, PD, and ROW) 1,086.34
220 foot ROW 331.79220 foot ROW in DRIs 161.99Less Acres in ROW (excluding DRI in ROW) 169.80Less Activity Centers 400.00SubTotal 2,207.78Less 15% for Roads 331.17Less 15% for Retention 331.17Less 15% for Open Space 331.17Total Uncommitted Acreage in Innovation Way Corridor 1,214.28
Land Outside Corridor 24,647.77
Less ICP, Lake Hart PD Moss Park, Eagle Creek DRI, and Rural Settlements 4677.59
Less Recorded Conservation Easements 2,097.98
Less Water Bodies in Study Area 3,361.27
Orange County BCC 2,570.48Orange County BCC in Lake 538.53Less Orange County BCC (minus lake) 2,031.95
Wetlands in Study Area outside of Corridor 9,275.42Wetlands in DRIs and Rural Settlements outside of corridor 923.74Wetlands in Conservation Areas 967.36Wetlands in Orange County BCC 1,166.37Less Wetlands (minus DRIs, Rural Settlements, Conservation Areas, Orange BCC) 6,217.95Less Activity Centers 125.00SubTotal of Remaining Land 6,136.03Less 15% for Roads 920.40Less 15% for Retention 920.40Less 15% for Open Space 920.40Total Uncommitted land Outside of Innovation Way Corridor 3,374.82
Figure 4.1.3-2 Land Inventory for Compact Edge Scenario #2
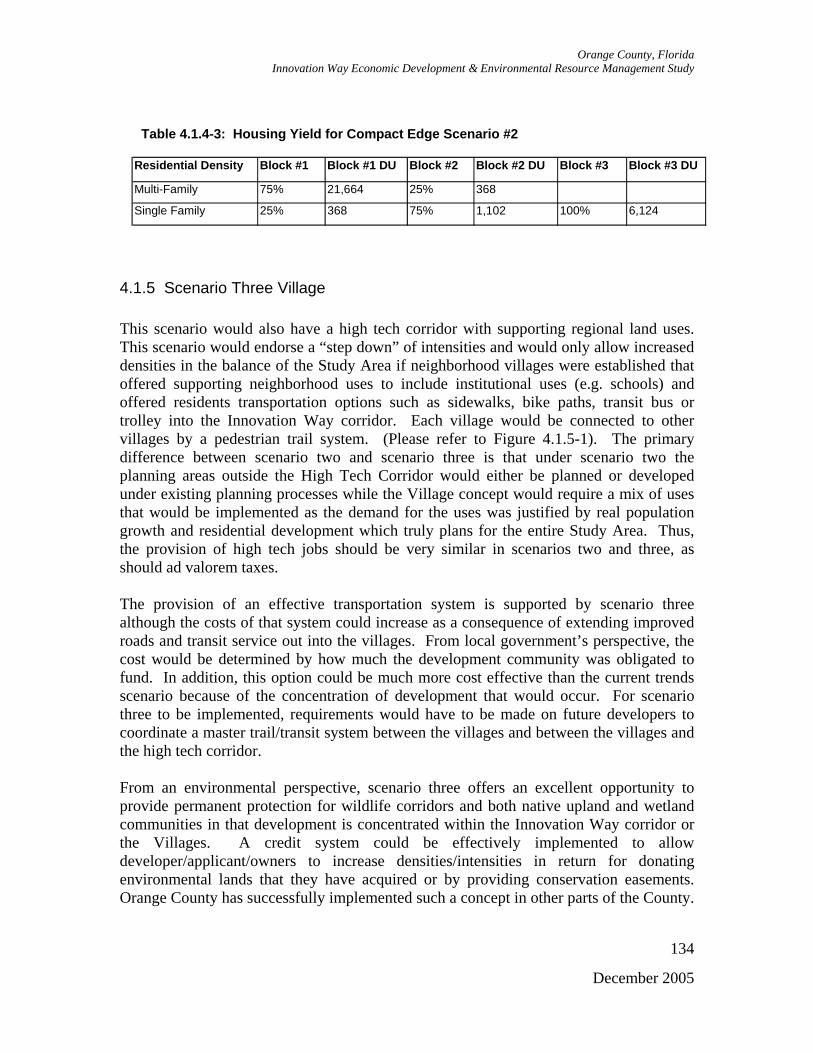
Orange County, Florida Innovation Way Economic Development & Environmental Resource Management Study
December 2005
134
4.1.5 Scenario Three Village This scenario would also have a high tech corridor with supporting regional land uses. This scenario would endorse a “step down” of intensities and would only allow increased densities in the balance of the Study Area if neighborhood villages were established that offered supporting neighborhood uses to include institutional uses (e.g. schools) and offered residents transportation options such as sidewalks, bike paths, transit bus or trolley into the Innovation Way corridor. Each village would be connected to other villages by a pedestrian trail system. (Please refer to Figure 4.1.5-1). The primary difference between scenario two and scenario three is that under scenario two the planning areas outside the High Tech Corridor would either be planned or developed under existing planning processes while the Village concept would require a mix of uses that would be implemented as the demand for the uses was justified by real population growth and residential development which truly plans for the entire Study Area. Thus, the provision of high tech jobs should be very similar in scenarios two and three, as should ad valorem taxes. The provision of an effective transportation system is supported by scenario three although the costs of that system could increase as a consequence of extending improved roads and transit service out into the villages. From local government’s perspective, the cost would be determined by how much the development community was obligated to fund. In addition, this option could be much more cost effective than the current trends scenario because of the concentration of development that would occur. For scenario three to be implemented, requirements would have to be made on future developers to coordinate a master trail/transit system between the villages and between the villages and the high tech corridor. From an environmental perspective, scenario three offers an excellent opportunity to provide permanent protection for wildlife corridors and both native upland and wetland communities in that development is concentrated within the Innovation Way corridor or the Villages. A credit system could be effectively implemented to allow developer/applicant/owners to increase densities/intensities in return for donating environmental lands that they have acquired or by providing conservation easements. Orange County has successfully implemented such a concept in other parts of the County.
Residential Density Block #1 Block #1 DU Block #2 Block #2 DU Block #3 Block #3 DU
Multi-Family 75% 21,664 25% 368
Single Family 25% 368 75% 1,102 100% 6,124
Table 4.1.4-3: Housing Yield for Compact Edge Scenario #2

Orange County, Florida Innovation Way Economic Development & Environmental Resource Management Study
December 2005
135
Like transportation, the provisions of water and sewer under this option would be more effective than the current trends scenario in that development is occurring within a high intensity corridor, or it is occurring in a designated village. Demand (and capital facilities expenditure) would be easier to forecast in that development is tied to demand and a schedule. Other infrastructure, such as stormwater would be provided in a much more effective and efficient manner. One of the significant advantages of master planning is that stormwater can be routed to large stormwater ponds (rather than many small ponds) that can serve multiple purposes to include stormwater retention, open space and parks, visual amenity, and wildlife habitat. For schools, this scenario has all the advantages of scenario 2 and has the added advantage of clustering development outside the Innovation Way Corridor into villages that could support at least some of the educational demand of that village’s population.
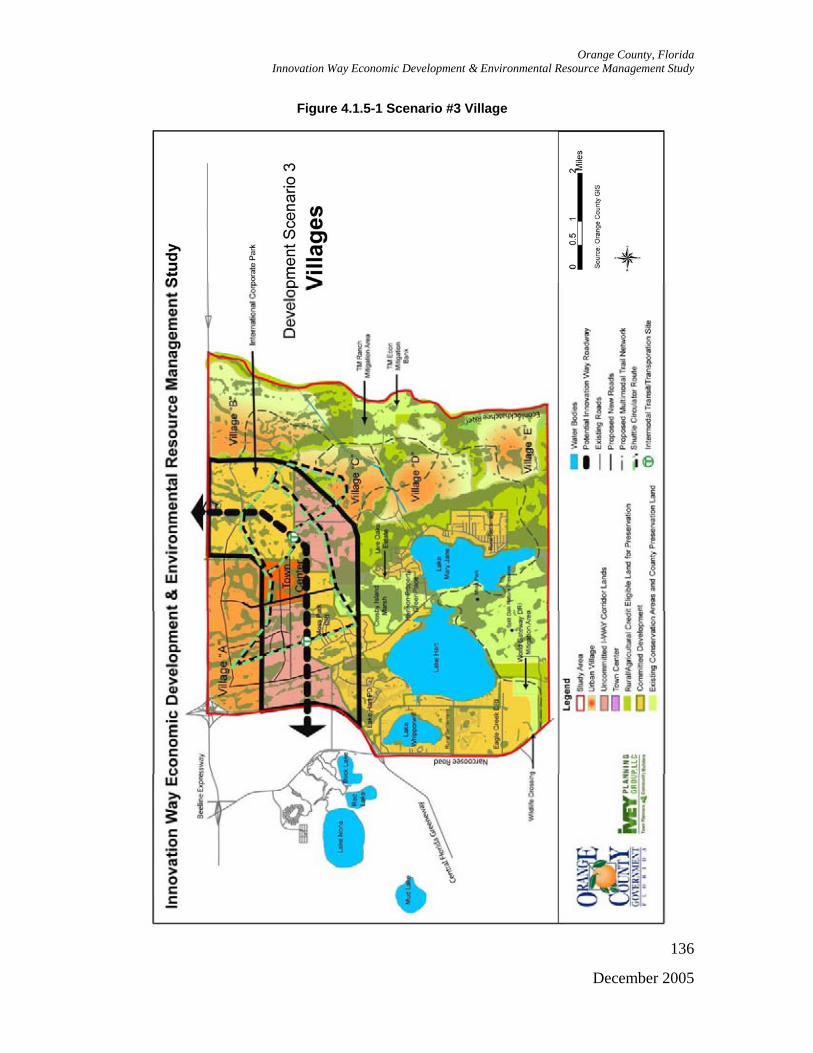
Orange County, Florida Innovation Way Economic Development & Environmental Resource Management Study
December 2005
136
Figure 4.1.5-1 Scenario #3 Village
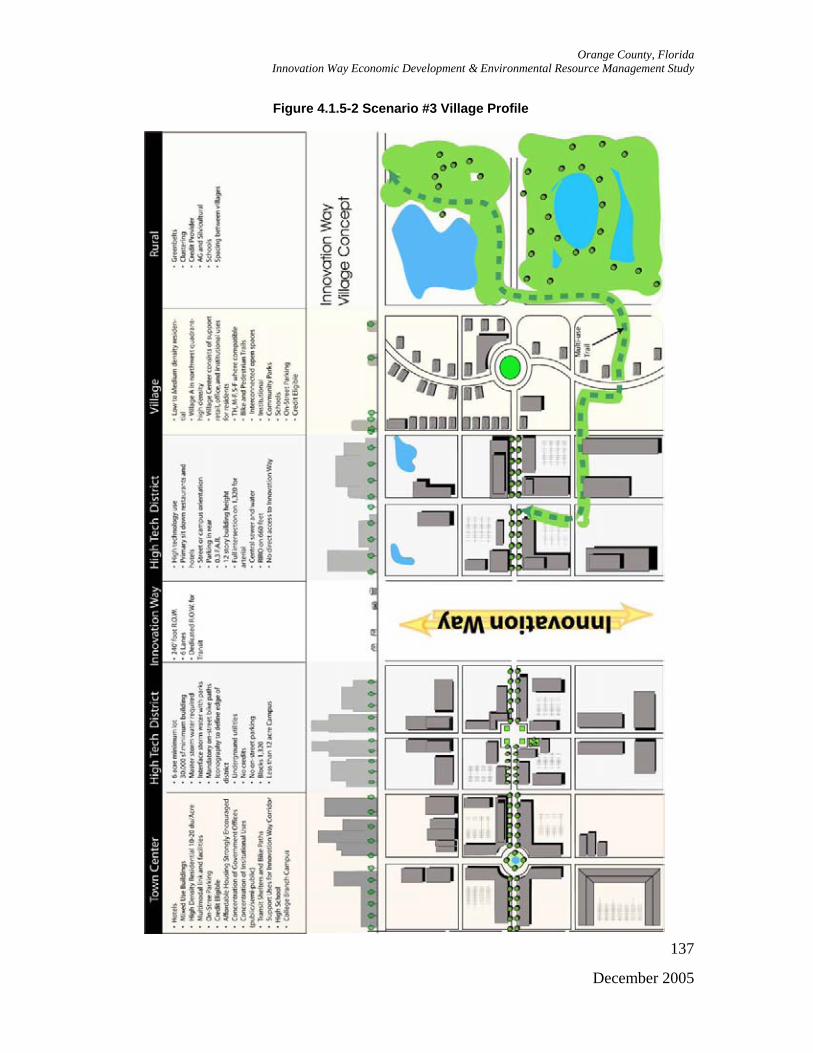
Orange County, Florida Innovation Way Economic Development & Environmental Resource Management Study
December 2005
137
Figure 4.1.5-2 Scenario #3 Village Profile
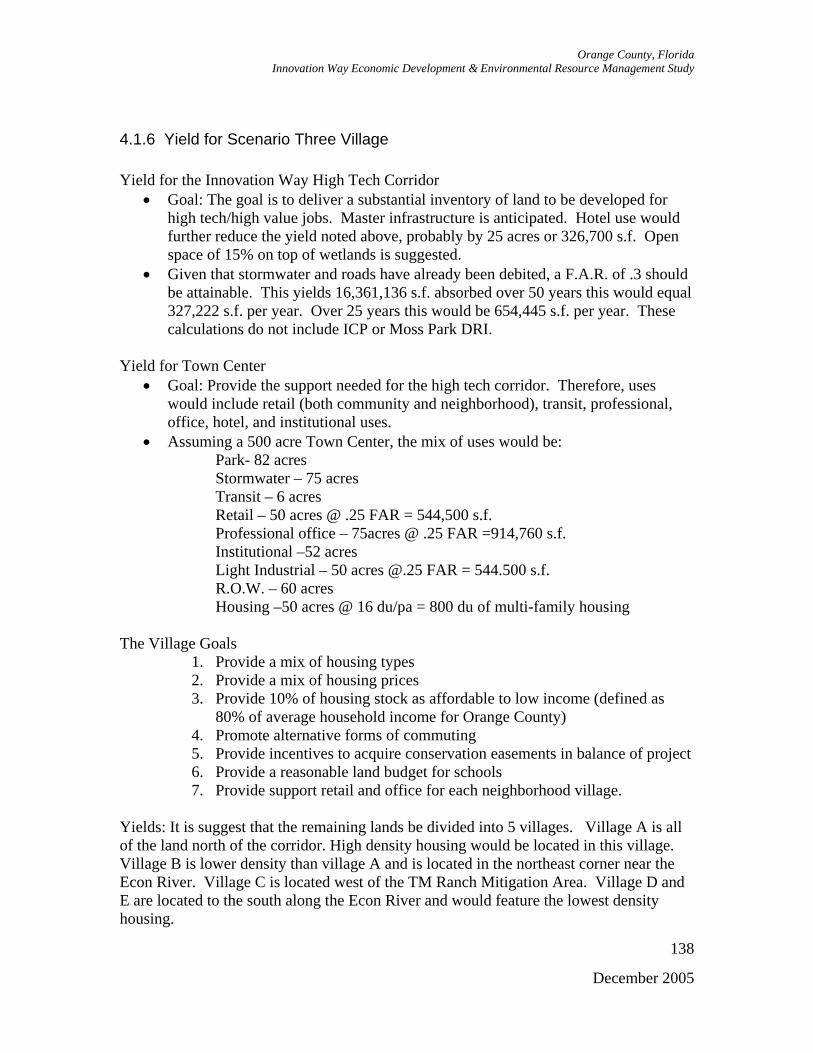
Orange County, Florida Innovation Way Economic Development & Environmental Resource Management Study
December 2005
138
4.1.6 Yield for Scenario Three Village Yield for the Innovation Way High Tech Corridor
• Goal: The goal is to deliver a substantial inventory of land to be developed for high tech/high value jobs. Master infrastructure is anticipated. Hotel use would further reduce the yield noted above, probably by 25 acres or 326,700 s.f. Open space of 15% on top of wetlands is suggested.
• Given that stormwater and roads have already been debited, a F.A.R. of .3 should be attainable. This yields 16,361,136 s.f. absorbed over 50 years this would equal 327,222 s.f. per year. Over 25 years this would be 654,445 s.f. per year. These calculations do not include ICP or Moss Park DRI.
Yield for Town Center
• Goal: Provide the support needed for the high tech corridor. Therefore, uses would include retail (both community and neighborhood), transit, professional, office, hotel, and institutional uses.
• Assuming a 500 acre Town Center, the mix of uses would be: Park- 82 acres Stormwater – 75 acres Transit – 6 acres Retail – 50 acres @ .25 FAR = 544,500 s.f. Professional office – 75acres @ .25 FAR =914,760 s.f. Institutional –52 acres Light Industrial – 50 acres @.25 FAR = 544.500 s.f. R.O.W. – 60 acres Housing –50 acres @ 16 du/pa = 800 du of multi-family housing
The Village Goals
1. Provide a mix of housing types 2. Provide a mix of housing prices 3. Provide 10% of housing stock as affordable to low income (defined as
80% of average household income for Orange County) 4. Promote alternative forms of commuting 5. Provide incentives to acquire conservation easements in balance of project 6. Provide a reasonable land budget for schools 7. Provide support retail and office for each neighborhood village.
Yields: It is suggest that the remaining lands be divided into 5 villages. Village A is all of the land north of the corridor. High density housing would be located in this village. Village B is lower density than village A and is located in the northeast corner near the Econ River. Village C is located west of the TM Ranch Mitigation Area. Village D and E are located to the south along the Econ River and would feature the lowest density housing.
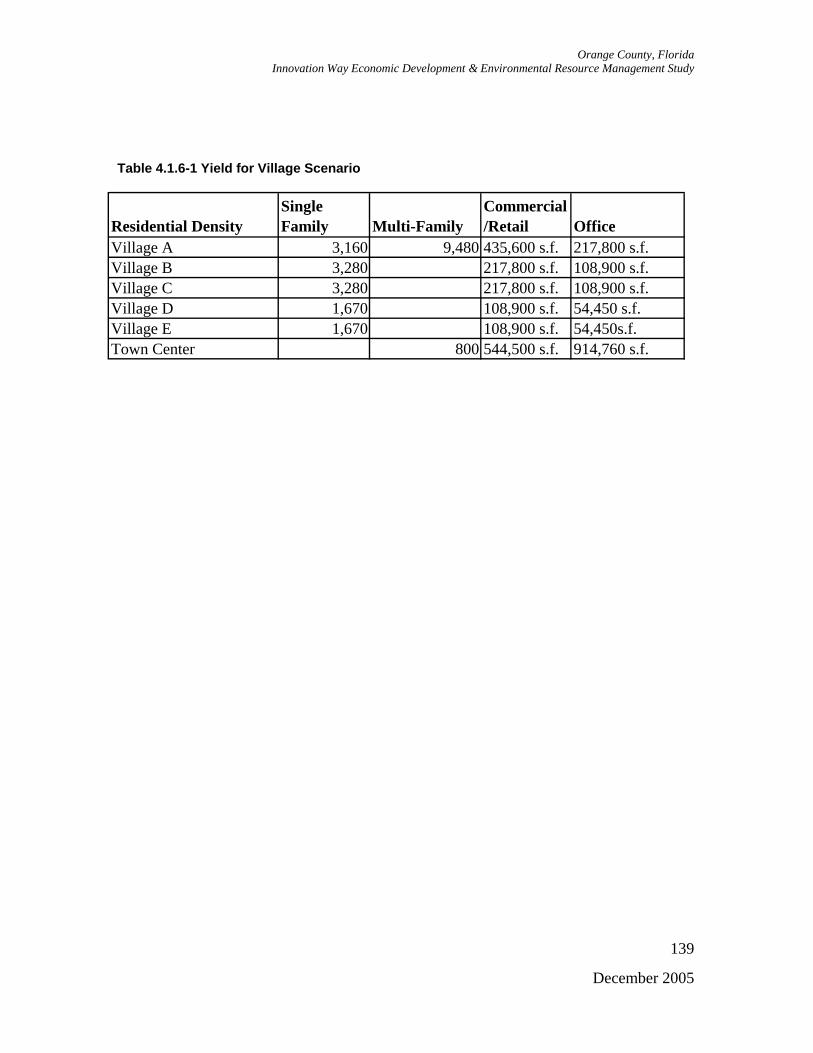
Orange County, Florida Innovation Way Economic Development & Environmental Resource Management Study
December 2005
139
Residential DensitySingle Family Multi-Family
Commercial/Retail Office
Village A 3,160 9,480 435,600 s.f. 217,800 s.f.Village B 3,280 217,800 s.f. 108,900 s.f.Village C 3,280 217,800 s.f. 108,900 s.f.Village D 1,670 108,900 s.f. 54,450 s.f.Village E 1,670 108,900 s.f. 54,450s.f.Town Center 800 544,500 s.f. 914,760 s.f.
Table 4.1.6-1 Yield for Village Scenario
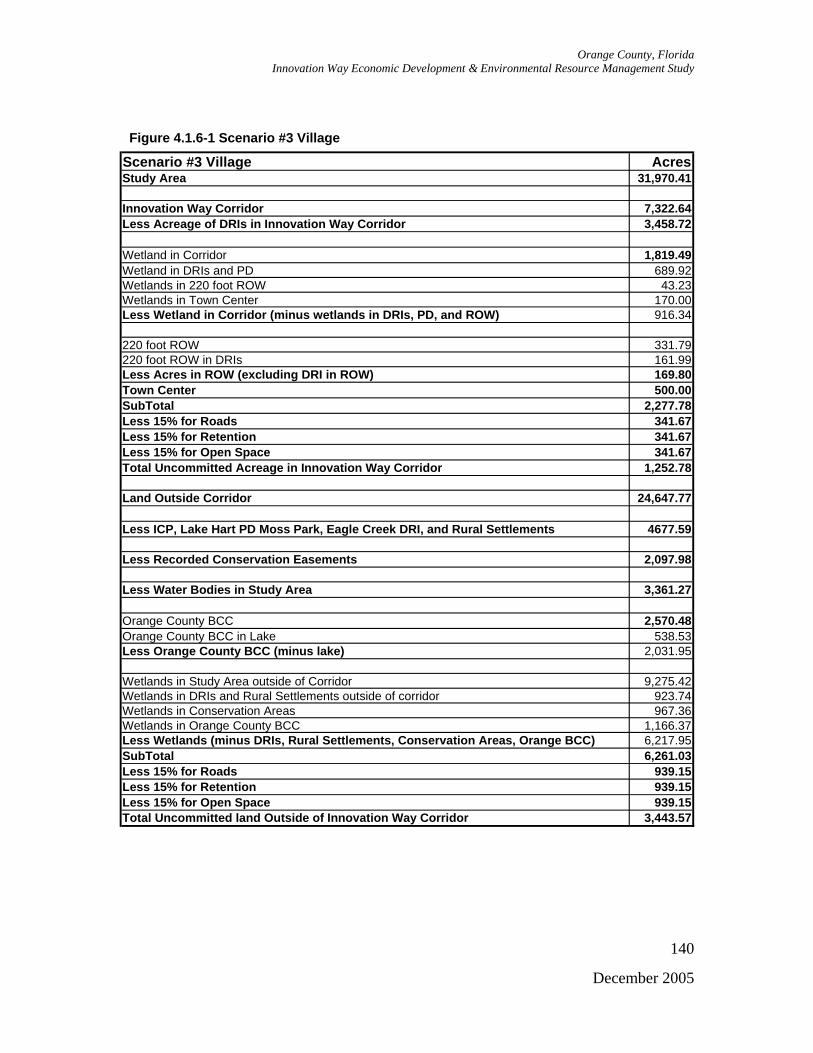
Orange County, Florida Innovation Way Economic Development & Environmental Resource Management Study
December 2005
140
Figure 4.1.6-1 Scenario #3 Village
Scenario #3 Village AcresStudy Area 31,970.41
Innovation Way Corridor 7,322.64Less Acreage of DRIs in Innovation Way Corridor 3,458.72
Wetland in Corridor 1,819.49Wetland in DRIs and PD 689.92Wetlands in 220 foot ROW 43.23Wetlands in Town Center 170.00Less Wetland in Corridor (minus wetlands in DRIs, PD, and ROW) 916.34
220 foot ROW 331.79220 foot ROW in DRIs 161.99Less Acres in ROW (excluding DRI in ROW) 169.80Town Center 500.00SubTotal 2,277.78Less 15% for Roads 341.67Less 15% for Retention 341.67Less 15% for Open Space 341.67Total Uncommitted Acreage in Innovation Way Corridor 1,252.78
Land Outside Corridor 24,647.77
Less ICP, Lake Hart PD Moss Park, Eagle Creek DRI, and Rural Settlements 4677.59
Less Recorded Conservation Easements 2,097.98
Less Water Bodies in Study Area 3,361.27
Orange County BCC 2,570.48Orange County BCC in Lake 538.53Less Orange County BCC (minus lake) 2,031.95
Wetlands in Study Area outside of Corridor 9,275.42Wetlands in DRIs and Rural Settlements outside of corridor 923.74Wetlands in Conservation Areas 967.36Wetlands in Orange County BCC 1,166.37Less Wetlands (minus DRIs, Rural Settlements, Conservation Areas, Orange BCC) 6,217.95SubTotal 6,261.03Less 15% for Roads 939.15Less 15% for Retention 939.15Less 15% for Open Space 939.15Total Uncommitted land Outside of Innovation Way Corridor 3,443.57
Orange County, Florida Innovation Way Economic Development & Environmental Resource Management Study
December 2005
141
4.1.7 Scenario Four Activity Village The Activity Village Scenario combines the best of Scenarios 2 (Compact edge) and 3 (Village) by offering a compact urban core in the Innovation Way Corridor with a town center and compact villages supplying the majority of the housing and support uses. The village northwest of the Corridor has higher densities than the other three scenarios while the remaining four villages south and east of the Corridor provides the same number of dwelling units as the Village scenario, but the Activity villages are more compact with higher densities around the neighborhood support uses core (see Figure 4.1.7-1). The provision of an effective transportation system is supported by the Activity Village scenario although the costs of that system could increase as a consequence of extending improved roads and transit service out into the villages although these villages would be more compact and lend themselves as being more transit-friendly. From local government’s perspective, the cost would be determined by how much the development community was obligated to fund. In addition, this option could be much more cost effective than the current trends scenario because of the concentration of development that would occur. Just like scenario three, developers would be required to coordinate a master trail/transit system between the villages and between the villages and the high tech corridor. From an environmental perspective, the Activity Village scenario offers a better opportunity to provide permanent protection for wildlife corridors and both native upland and wetland communities than Scenario three in that development is much more concentrated within the Innovation Way corridor or the Villages. With more compact village designs the environmental corridors should be wider and more substantial than Scenario 3. A credit system could be effectively implemented to allow developer/applicant/owners to increase densities/intensities in return for donating environmental lands that they have acquired or by providing conservation easements. Orange County has successfully implemented such a concept in other parts of the County. Like transportation, the provisions of water and sewer under this option would be more effective than the current trends scenario in that development is occurring within a high intensity corridor, or it is occurring in a designated and more compact village. Demand (and capital facilities expenditure) would be easier to forecast in that development is tied to demand and a schedule. Other infrastructure, such as stormwater would be provided in a much more effective and efficient manner. One of the significant advantages of master planning is that stormwater can be routed to large stormwater ponds (rather than many small ponds) that can serve multiple purposes to include stormwater retention, open space and parks, visual amenity, and wildlife habitat. For schools, this scenario has all the advantages of scenario 2 and has the added advantage of clustering development outside the Innovation Way Corridor into villages that could support at least some of the educational demand of that village’s population.
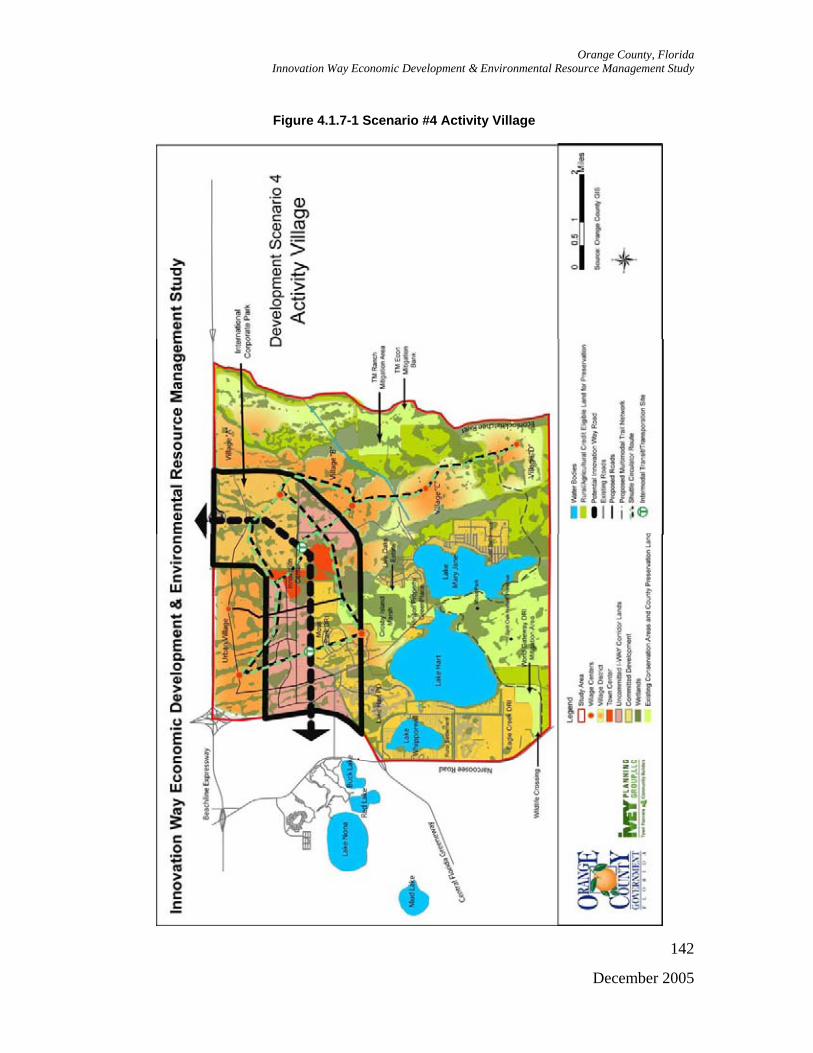
Orange County, Florida Innovation Way Economic Development & Environmental Resource Management Study
December 2005
142
Figure 4.1.7-1 Scenario #4 Activity Village
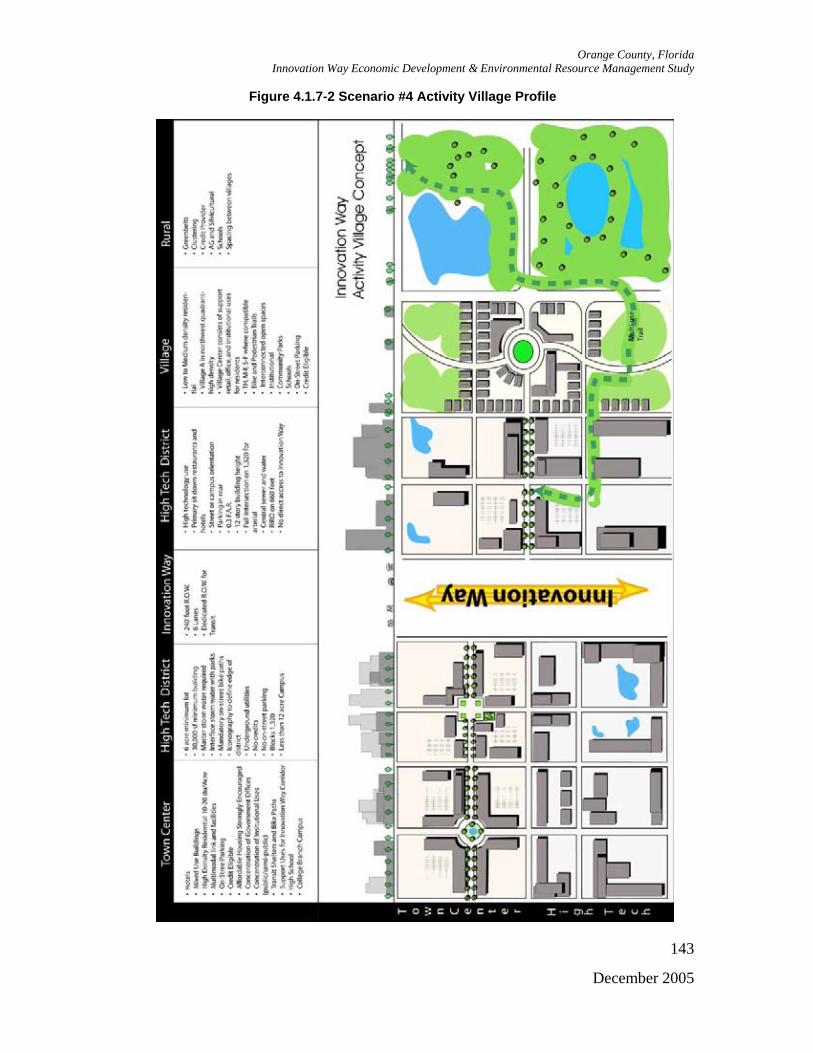
Orange County, Florida Innovation Way Economic Development & Environmental Resource Management Study
December 2005
143
Figure 4.1.7-2 Scenario #4 Activity Village Profile
Orange County, Florida Innovation Way Economic Development & Environmental Resource Management Study
December 2005
144
4.1.8 Yield for Scenario Four Activity Village Yield for the Innovation Way High Tech Corridor
• Goal: The goal is to deliver a substantial inventory of land to be developed for high tech/high value jobs. Master infrastructure is anticipated. Hotel use would further reduce the yield noted above, probably by 25 acres or 326,700 s.f. Open space of 15% on top of wetlands is suggested.
• Given that stormwater and roads have already been debited, a F.A.R. of .3 should be attainable. This yields 16,361,136 s.f. absorbed over 50 years this would equal 327,222 s.f. per year. Over 25 years this would be 654,445 s.f. per year. These calculations do not include ICP or Moss Park DRI.
Yield for Town Center
• Goal: Provide the support needed for the high tech corridor. Therefore, uses would include retail (both community and neighborhood), transit, professional, office, hotel, and institutional uses.
• Assuming a 500 acre Town Center, the mix of uses would be: Park- 82 acres Stormwater – 75 acres Transit – 6 acres Retail – 50 acres @ .25 FAR = 544,500 s.f. Professional office – 75acres @ .25 FAR =914,760 s.f. Institutional –52 acres Light Industrial – 50 acres @.25 FAR = 544.500 s.f. R.O.W. – 60 acres Housing –50 acres @ 16 du/pa = 800 du of multi-family housing
The Activity Village Goals:
• Provide a mix of housing types • Provide a mix of housing prices • Provide 10% of housing stock as affordable to low income (defined as 80% of
average household income for Orange County) • Promote alternative forms of commuting • Provide incentives to acquire conservation easements in balance of project • Provide a reasonable land budget for schools • Provide support retail and office for each neighborhood village. • The urban village would have a much higher density than the other villages.
Yields: It is suggest that the remaining lands be divided into 5 villages. The urban village is all of the land north of the corridor. High density housing would be located in this village. Village B is lower density than village A and is located in the northeast
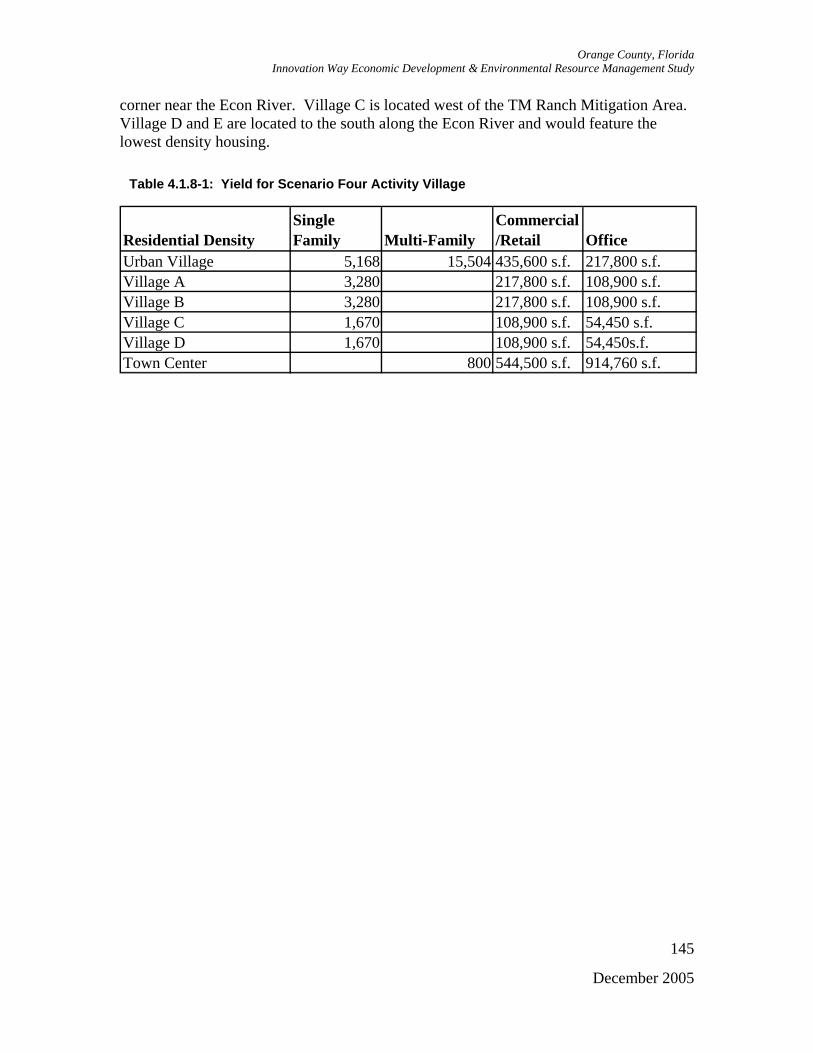
Orange County, Florida Innovation Way Economic Development & Environmental Resource Management Study
December 2005
145
corner near the Econ River. Village C is located west of the TM Ranch Mitigation Area. Village D and E are located to the south along the Econ River and would feature the lowest density housing.
Table 4.1.8-1: Yield for Scenario Four Activity Village
Residential DensitySingle Family Multi-Family
Commercial/Retail Office
Urban Village 5,168 15,504 435,600 s.f. 217,800 s.f.Village A 3,280 217,800 s.f. 108,900 s.f.Village B 3,280 217,800 s.f. 108,900 s.f.Village C 1,670 108,900 s.f. 54,450 s.f.Village D 1,670 108,900 s.f. 54,450s.f.Town Center 800 544,500 s.f. 914,760 s.f.
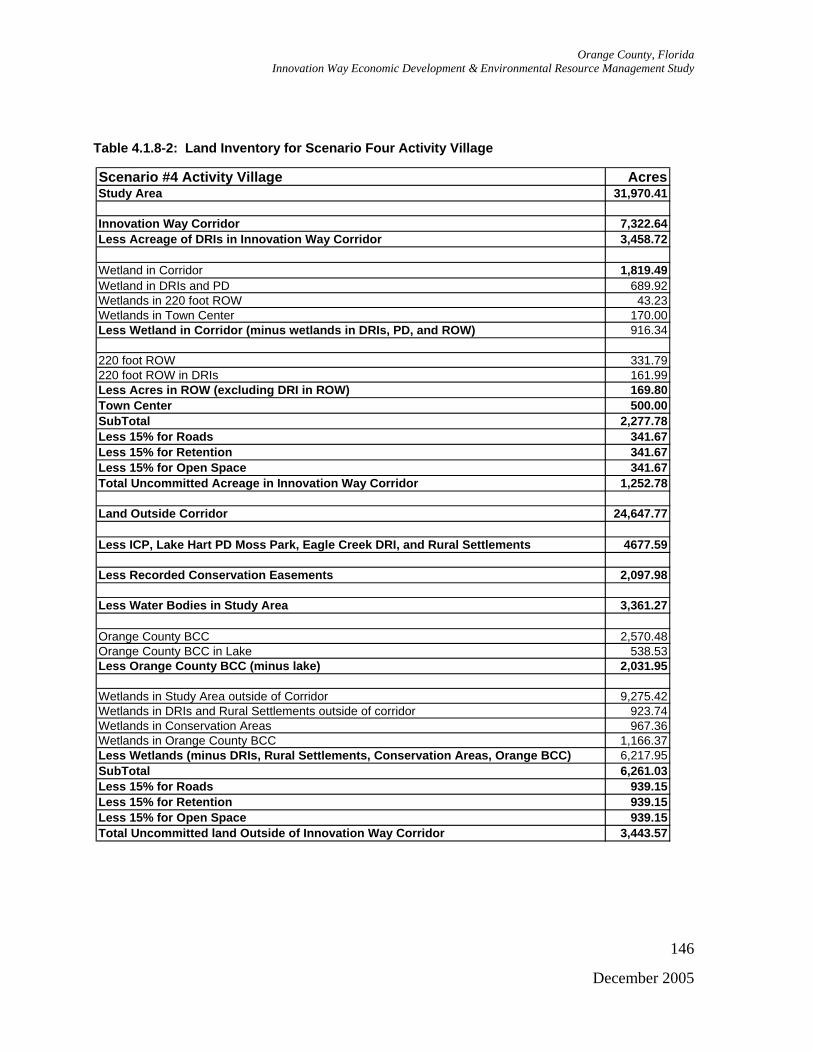
Orange County, Florida Innovation Way Economic Development & Environmental Resource Management Study
December 2005
146
Table 4.1.8-2: Land Inventory for Scenario Four Activity Village
Scenario #4 Activity Village AcresStudy Area 31,970.41
Innovation Way Corridor 7,322.64Less Acreage of DRIs in Innovation Way Corridor 3,458.72
Wetland in Corridor 1,819.49Wetland in DRIs and PD 689.92Wetlands in 220 foot ROW 43.23Wetlands in Town Center 170.00Less Wetland in Corridor (minus wetlands in DRIs, PD, and ROW) 916.34
220 foot ROW 331.79220 foot ROW in DRIs 161.99Less Acres in ROW (excluding DRI in ROW) 169.80Town Center 500.00SubTotal 2,277.78Less 15% for Roads 341.67Less 15% for Retention 341.67Less 15% for Open Space 341.67Total Uncommitted Acreage in Innovation Way Corridor 1,252.78
Land Outside Corridor 24,647.77
Less ICP, Lake Hart PD Moss Park, Eagle Creek DRI, and Rural Settlements 4677.59
Less Recorded Conservation Easements 2,097.98
Less Water Bodies in Study Area 3,361.27
Orange County BCC 2,570.48Orange County BCC in Lake 538.53Less Orange County BCC (minus lake) 2,031.95
Wetlands in Study Area outside of Corridor 9,275.42Wetlands in DRIs and Rural Settlements outside of corridor 923.74Wetlands in Conservation Areas 967.36Wetlands in Orange County BCC 1,166.37Less Wetlands (minus DRIs, Rural Settlements, Conservation Areas, Orange BCC) 6,217.95SubTotal 6,261.03Less 15% for Roads 939.15Less 15% for Retention 939.15Less 15% for Open Space 939.15Total Uncommitted land Outside of Innovation Way Corridor 3,443.57
Orange County, Florida Innovation Way Economic Development & Environmental Resource Management Study
December 2005
147
In summary, four scenarios were examined to include a current trends option, a compact edge option, a village option and an activity village option.
4.1.9 Scenario Five Scenario Five combines the best of Scenarios 2 (Compact edge), 3 (Village) and Scenario 4 (Activity Village) by offering a compact urban core in the Innovation Way Corridor with a town center and compact villages adjacent to the corridor to supply the majority of the housing and support uses while keeping urban development impacts away from the Econ River (see Figure 4.1.9-1). The village northwest of the Corridor has the highest densities while the remaining two villages south and east of the Corridor provides the same number of dwelling units as the Village scenario. The provision of an effective transportation system is supported by scenario five and the villages would be the most compact and lend themselves to being the most transit-friendly. From local government’s perspective, the cost would be determined by how much the development community was obligated to fund. In addition, this option could be much more cost effective than the other scenarios because of the concentration of development that would occur. Just like scenario three and four, developers would be required to coordinate a master trail/transit system between the two villages and between the villages and the high tech corridor. From an environmental perspective, scenario five offers a better opportunity to provide permanent protection for wildlife corridors and both native upland and wetland communities than scenarios 3 and 4 in that development is much more concentrated within the Innovation Way corridor and adjacent to the corridor. With more compact village designs the environmental corridors should be wider and more substantial than Scenarios 3 and 4. A credit system could be effectively implemented to allow developer/applicant/owners to increase densities/intensities in return for donating environmental lands that they have acquired or by providing conservation easements. Orange County has successfully implemented such a concept in other parts of the County. Like transportation, the provisions of water and sewer under this option would be more effective than the current trends scenario in that development is occurring within a high intensity corridor, or immediately adjacent to it in a more compact village. Demand (and capital facilities expenditure) would be easier to forecast in that development is tied to demand and a schedule. Other infrastructure, such as stormwater would be provided in a much more effective and efficient manner. One of the significant advantage of master planning is that stormwater can be routed to large stormwater ponds (rather than many small ponds) that can serve multiple purposes to include stormwater retention, open space

Orange County, Florida Innovation Way Economic Development & Environmental Resource Management Study
December 2005
148
and parks, visual amenity, and wildlife habitat. For schools, this scenario has all the advantages of scenario 2 and has the added advantage of clustering development outside the Innovation Way Corridor into villages immediately adjacent to the corridor that could support at least some of the educational demands of each village’s population.

Orange County, Florida Innovation Way Economic Development & Environmental Resource Management Study
December 2005
149
Figure 4.1.9-1: Scenario # 5

Orange County, Florida Innovation Way Economic Development & Environmental Resource Management Study
December 2005
150
4.1.10 Yield for Scenario Five Yield for Scenario Five
• Goal: The goal is to deliver a substantial inventory of land to be developed for high tech/high value jobs. Master infrastructure is anticipated. Hotel use would further reduce the yield noted above, probably by 25 acres or 326,700 s.f. Open space of 15% on top of wetlands is suggested.
• Given that stormwater and roads have already been debited, a F.A.R. of .3 should be attainable. This yields 16,361,136 s.f. absorbed over 50 years this would equal 327,222 s.f. per year. Over 25 years this would be 654,445 s.f. per year. These calculations do not include ICP or Moss Park DRI.
Yield for Town Center
• Goal: Provide the support needed for the high tech corridor. Therefore, uses would include retail (both community and neighborhood), transit, professional, office, hotel, and institutional uses.
• Assuming a 500 acre Town Center, the mix of uses would be: Park- 82 acres Stormwater – 75 acres Transit – 6 acres Retail – 50 acres @ .25 FAR = 544,500 s.f. Professional office – 75acres @ .25 FAR =914,760 s.f. Institutional –52 acres Light Industrial – 50 acres @.25 FAR = 544,500 s.f. R.O.W. – 60 acres Housing –50 acres @ 16 du/pa = 800 du of multi-family housing
The Village Goals:
• Provide a mix of housing types • Provide a mix of housing prices • Provide 10% of housing stock as affordable to low income (defined as 80% of
average household income for Orange County) • Promote alternative forms of commuting • Provide incentives to acquire conservation easements in balance of project • Provide a reasonable land budget for schools • Provide support retail and office for each neighborhood village. • The urban village would have a much higher density than the other villages.
Yields: It is suggest that the remaining lands be divided into 3 villages. The urban village is all of the land north of the corridor. High density housing would be located in this village. Village B is lower density than the urban and is located in the northeast
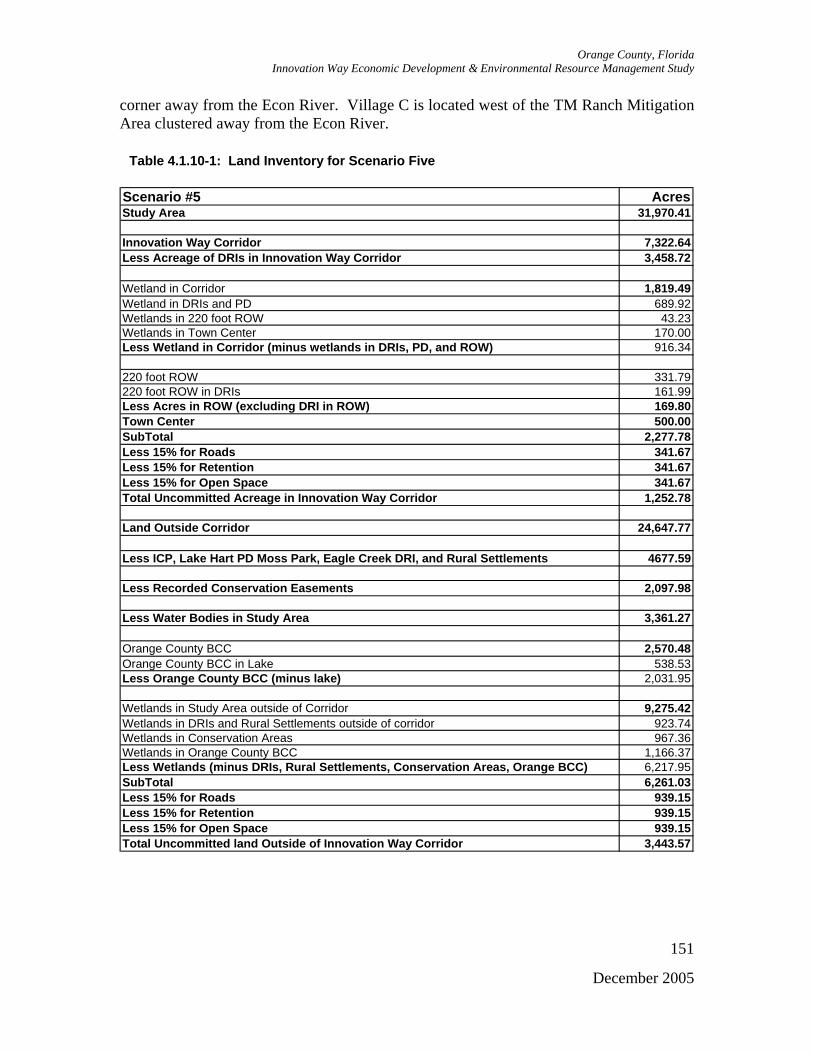
Orange County, Florida Innovation Way Economic Development & Environmental Resource Management Study
December 2005
151
corner away from the Econ River. Village C is located west of the TM Ranch Mitigation Area clustered away from the Econ River. Scenario #5 AcresStudy Area 31,970.41
Innovation Way Corridor 7,322.64Less Acreage of DRIs in Innovation Way Corridor 3,458.72
Wetland in Corridor 1,819.49Wetland in DRIs and PD 689.92Wetlands in 220 foot ROW 43.23Wetlands in Town Center 170.00Less Wetland in Corridor (minus wetlands in DRIs, PD, and ROW) 916.34
220 foot ROW 331.79220 foot ROW in DRIs 161.99Less Acres in ROW (excluding DRI in ROW) 169.80Town Center 500.00SubTotal 2,277.78Less 15% for Roads 341.67Less 15% for Retention 341.67Less 15% for Open Space 341.67Total Uncommitted Acreage in Innovation Way Corridor 1,252.78
Land Outside Corridor 24,647.77
Less ICP, Lake Hart PD Moss Park, Eagle Creek DRI, and Rural Settlements 4677.59
Less Recorded Conservation Easements 2,097.98
Less Water Bodies in Study Area 3,361.27
Orange County BCC 2,570.48Orange County BCC in Lake 538.53Less Orange County BCC (minus lake) 2,031.95
Wetlands in Study Area outside of Corridor 9,275.42Wetlands in DRIs and Rural Settlements outside of corridor 923.74Wetlands in Conservation Areas 967.36Wetlands in Orange County BCC 1,166.37Less Wetlands (minus DRIs, Rural Settlements, Conservation Areas, Orange BCC) 6,217.95SubTotal 6,261.03Less 15% for Roads 939.15Less 15% for Retention 939.15Less 15% for Open Space 939.15Total Uncommitted land Outside of Innovation Way Corridor 3,443.57
Table 4.1.10-1: Land Inventory for Scenario Five

Orange County, Florida Innovation Way Economic Development & Environmental Resource Management Study
December 2005
152
Residential Density #5
Residential DensitySingle Family Multi-Family
Commercial/Retail Office
Urban Village 5,168 15,504 435,600 s.f. 217,800 s.f.Village A 3,280 217,800 s.f. 108,900 s.f.Village B 3,280 217,800 s.f. 108,900 s.f.Town Center 800 544,500 s.f. 914,760 s.f.
4.2 Absorption and Build-out The following trends and assumptions were used to project the potential absorption and build-out of Innovation Way under the Activity Village Scenario:
• Market trends for residential and commercial construction in the Orlando MSA and Orange County
• Case studies from existing high tech parks in the country including The Research Triangle Park in North Carolina
• Space requirements and characteristics of high tech companies currently located in Central Florida.
Market Trends High tech business parks include a mix of professional office space, industrial manufacturing and flex space. An analysis of historic construction and absorption of office, industrial and flex space in the four-county Orlando MSA over the past 23 years indicated how the local market has responded to population growth and business cycles over this period. Key observations from this analysis include: Office
• The current inventory of office space in the four-county MSA is 55.8 million square feet.
• Over the past 23 years, an average of slightly less than two million square feet of office space has been delivered annually in the MSA.
• Construction of office space has been impacted by national and local business cycles more than other commercial land uses. For example, construction of new office space declined significantly during the years from 1991 through 1994.
• Orange County is the dominant county in the MSA with 41.2 million square feet of office space or about 74% of the total inventory.
Table 4.1.10-2: Residential Density
Orange County, Florida Innovation Way Economic Development & Environmental Resource Management Study
December 2005
153
• The existing inventory of office space in the University Research sub-market is 2.35 million square feet.
• Based upon historic trends and where future office development is likely to occur in Orange County, we estimate that Innovation Way can capture between 20 and 25% of the market area demand for office space over the projection period.
Industrial
• The current inventory of industrial space in the four-county MSA is 119.8 million square feet.
• Over the past 23 years, an average of just over three million square feet of industrial space has been delivered annually in the MSA.
• The industrial market segment has been impacted less by national and local business cycles than the office market.
• Orange County is the dominant county in the MSA for industrial space with 92.4 million square feet or 77% of the total inventory.
• Based upon historic trends and growth patterns within Orange County, we estimate that Innovation Way can capture between 10 and 15% of the county-wide demand for industrial space over the projection period. This projection could increase if Innovation Way develops with a higher percentage of manufacturing space rather than research and development or flex space.
High tech High tech space includes a variable mix of office, research and development, light manufacturing or assembly and distribution space. Our absorption projection is based primarily on historic experience at existing high tech parks such as The Research Triangle in North Carolina where absorption has averaged about 440,000 square feet annually of the 43-year history of the park. Absorption for this class of space can be expected to vary over time in response to changes in the type of industries that locate here, the mix of research and development versus service companies, developing technologies, and international, national and local economic cycles. Single-family Residential Single-family is the preferred housing product in Central Florida accounting for about 65% of all new residential construction over the past 15 years. Orange County has historically represented about 55% of the single-family market in the MSA. East Orange County has historically accounted for between 25 and 30% of the county-wide total. We anticipate that these trends will continue, and have projected that Innovation Way can absorb between 1,800 and 2,000 single-family units annually. This represents about 20% of the demand within the MSA, and 25 to 30 percent of the demand within Orange County over the projection period.

Orange County, Florida Innovation Way Economic Development & Environmental Resource Management Study
December 2005
154
Multifamily Residential The multifamily market is more cyclical than the single-family market. Historically, Orange County has been the dominant county for multifamily construction in the MSA. East Orange County has historically captured the largest percentage of new multifamily construction in the County. Looking forward, new multifamily construction in Orange County is anticipated to occur on the East and West sides of the County. We have projected that Innovation Way can absorb between 1,000 and 1,250 multifamily units annually. This represents about 20% of the demand within the MSA, and 25 to 30% of the demand within Orange County over the projection period. Retail and Hotel Retail and hotel space is absorbed in response to residential and commercial growth. The type of retail space developed at Innovation Way can be expected to mature over time from service and convenience retail to specialty and destination type centers. As with other business parks in Central Florida and around the country, retail development can be expected to trail residential and commercial development with a peak in construction and absorption during the middle to later phases of the project. The table below summarizes our annual absorption projections and build-out for Innovation Way under the Activity Village scenario. This scenario was selected for analysis because it had the highest yield and (theoretically) longest absorption.
Land Use Units/SF High Low High Low
Single-family
19,600 2,000 1,800 10 11
Multifamily 17,900 1,250 1,000 14 18
Industrial 892,000 30,000 22,500 30 40Office 1,727,000 50,000 43,000 35 40High tech 16,361,000 465,000 410,000 35 40Sub-total 18,980,000 545,000 475,500 35 40
Retail 2,480,000 82,500 62,000 30 40Hotel 1,350 Developed over the total build-out period
Activity Village Scenario
Average Annual Absorption
Build-out in Years
Table 4.2.-1: Annual Absorption and Build out

Orange County, Florida Innovation Way Economic Development & Environmental Resource Management Study
December 2005
155
4.3 School Impacts The following four tables calculate the number of students generated by each scenario, the number of new schools needed to accommodate the students generated and the number of acres needed to build the needed campuses. The first two tables utilize the formulas for student generation included in the adopted Orange County School Impact Fee. The average number of students per school type is broken down into elementary, middle and high school formulas. An elementary school is assumed to accommodate 800 students. A middle school is assumed to accommodate 1,200 students and a high school 2,500 students. The minimum acreage necessary for each school type is 15 for elementary, 30 for middle school and 60 for high school.
Multi-family Units
Single Family Units Total Units Elem Middle High
Total Students
14,545 41,458 56,003 11,469.83 5,426.55 6,803.37 23,699.7514,462 23,392 37,854 7,303.61 3,380.86 4,232.77 14,917.2328,134 17,432 45,566 7,751.18 3,404.65 4,247.79 15,403.6220,486 25,400 45,886 8,566.64 3,914.99 4,897.42 17,379.04
Elem Middle High
Current
Students per unit: SF 0.23 0.113 0.142 MF 0.133 0.051 0.063
Scenario
School Impacts - Impact Fee
VillageEdge
Dwelling units Number of Students
Activity
Elem Middle High Elem Middle High Elem Middle High Total Acres11,469.83 5,426.55 6,803.37 14.34 4.52 2.72 215.06 135.66 163.28 514.007,303.61 3,380.86 4,232.77 9.13 2.82 1.69 136.94 84.52 101.59 323.057,751.18 3,404.65 4,247.79 9.69 2.84 1.70 145.33 85.12 101.95 332.406,896.02 3,130.78 3,914.73 8.62 2.61 1.57 129.30 78.27 93.95 301.52
Elem Middle High
Students per school 800 1200 2500
MF 0.133 0.051 0.063 fee methodology
Acres per school type 15 30 60
Schools Needed - Impact FeeAcreage Needed
Students per unit: SF 0.23 0.113 0.142 Based on Orange County Impact
Students by School Type # of Schools Needed
Village
ScenarioCurrent
EdgeActivity
Table 4.3-2: Number of Schools and Acreage Estimated For Each Scenario
Table 4.3-1: Number of Students Generated For Each Scenario Based Upon Adopted School Impact Fee Formula
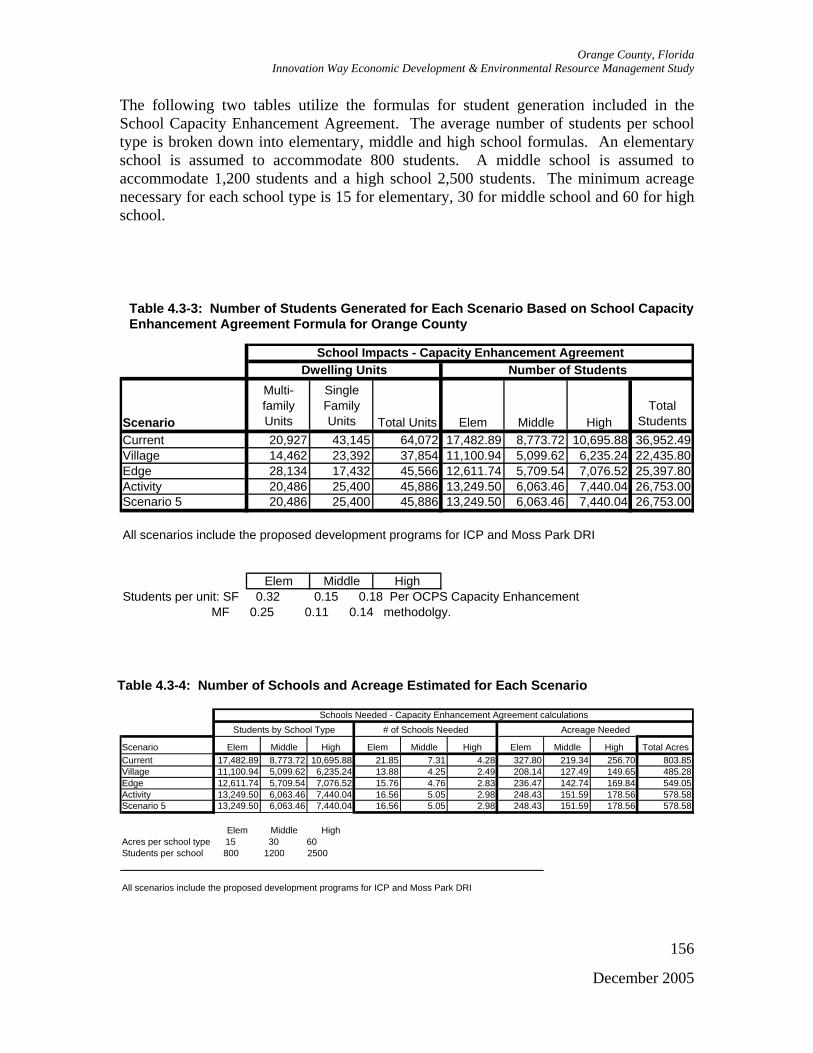
Orange County, Florida Innovation Way Economic Development & Environmental Resource Management Study
December 2005
156
The following two tables utilize the formulas for student generation included in the School Capacity Enhancement Agreement. The average number of students per school type is broken down into elementary, middle and high school formulas. An elementary school is assumed to accommodate 800 students. A middle school is assumed to accommodate 1,200 students and a high school 2,500 students. The minimum acreage necessary for each school type is 15 for elementary, 30 for middle school and 60 for high school.
Multi-family Units
Single Family Units Total Units Elem Middle High
Total Students
20,927 43,145 64,072 17,482.89 8,773.72 10,695.88 36,952.4914,462 23,392 37,854 11,100.94 5,099.62 6,235.24 22,435.8028,134 17,432 45,566 12,611.74 5,709.54 7,076.52 25,397.8020,486 25,400 45,886 13,249.50 6,063.46 7,440.04 26,753.0020,486 25,400 45,886 13,249.50 6,063.46 7,440.04 26,753.00
Elem Middle High
School Impacts - Capacity Enhancement Agreement
VillageEdge Activity
Dwelling Units Number of Students
Scenario 5
Current
Students per unit: SF 0.32 0.15 0.18 Per OCPS Capacity Enhancement MF 0.25 0.11 0.14 methodolgy.
Scenario
All scenarios include the proposed development programs for ICP and Moss Park DRI
Elem Middle High Elem Middle High Elem Middle High Total Acres17,482.89 8,773.72 10,695.88 21.85 7.31 4.28 327.80 219.34 256.70 803.8511,100.94 5,099.62 6,235.24 13.88 4.25 2.49 208.14 127.49 149.65 485.2812,611.74 5,709.54 7,076.52 15.76 4.76 2.83 236.47 142.74 169.84 549.0513,249.50 6,063.46 7,440.04 16.56 5.05 2.98 248.43 151.59 178.56 578.5813,249.50 6,063.46 7,440.04 16.56 5.05 2.98 248.43 151.59 178.56 578.58
Elem Middle High
All scenarios include the proposed development programs for ICP and Moss Park DRI
Edge
Students per school 800 1200 2500Acres per school type 15 30 60
ActivityScenario 5
Village
Schools Needed - Capacity Enhancement Agreement calculationsAcreage NeededStudents by School Type # of Schools Needed
CurrentScenario
Table 4.3-3: Number of Students Generated for Each Scenario Based on School Capacity Enhancement Agreement Formula for Orange County
Table 4.3-4: Number of Schools and Acreage Estimated for Each Scenario
Orange County, Florida Innovation Way Economic Development & Environmental Resource Management Study
December 2005
157
The preceding four tables illustrate that any of the scenarios will increase the number of schools necessary to accommodate growth in the Study Area. The capacity enhancement formula substantially increases the projected number of students. In any event, between 8 and 23 additional elementary schools will be needed. Between 2.6 and 7.3 additional middle schools will be needed and between 2 and 4 high schools will be needed depending on the scenario and formula chosen.
4.4 Infrastructure Analysis This report presents the results of analysis of the impact of the Activity Village scenario, on the existing water, wastewater and reclaimed water systems within the Innovation Way Study area. The Activity Village Scenario was selected for evaluation because it generates the highest degree of water and wastewater impacts among the four Innovation Way development scenarios. The Activity Village Scenario consists of the following development program: Single Family 15,068 dwelling units Multi Family 16,304 dwelling units Commercial/Retail 2,069,000 square feet Office 1,677,000 square feet High Tech Uses 16,361,000 square feet Industrial 544,500 square feet Hotel 1,200 rooms Because the purpose of this analysis is to determine the impact of the Activity Village Scenario upon existing infrastructure, the following existing and approved developments were excluded from this analysis: International Corporate Park DRI, Moss Park Landing DRI, Eagle Creek PD, Lake Hart PD and Kirby Smith PD, Lake Mary Jane & Lake Whippoorwill RS. It is assumed that Orange County has planned for, budgeted for and is designing and constructing sufficient water, wastewater and reclaimed capacity to satisfy these demands.
4.4.1 Water Demand Projected water demand required to serve the number of units identified in the Activity Village Scenario is based upon standard criteria established by Orange County and the Florida Department of Environmental Protection. As shown in Table 4.4.1-1 a total of 29 Million Gallons of water is needed per day to satisfy the expected water demand. This demand is in addition to the demand created by existing and approved developments.
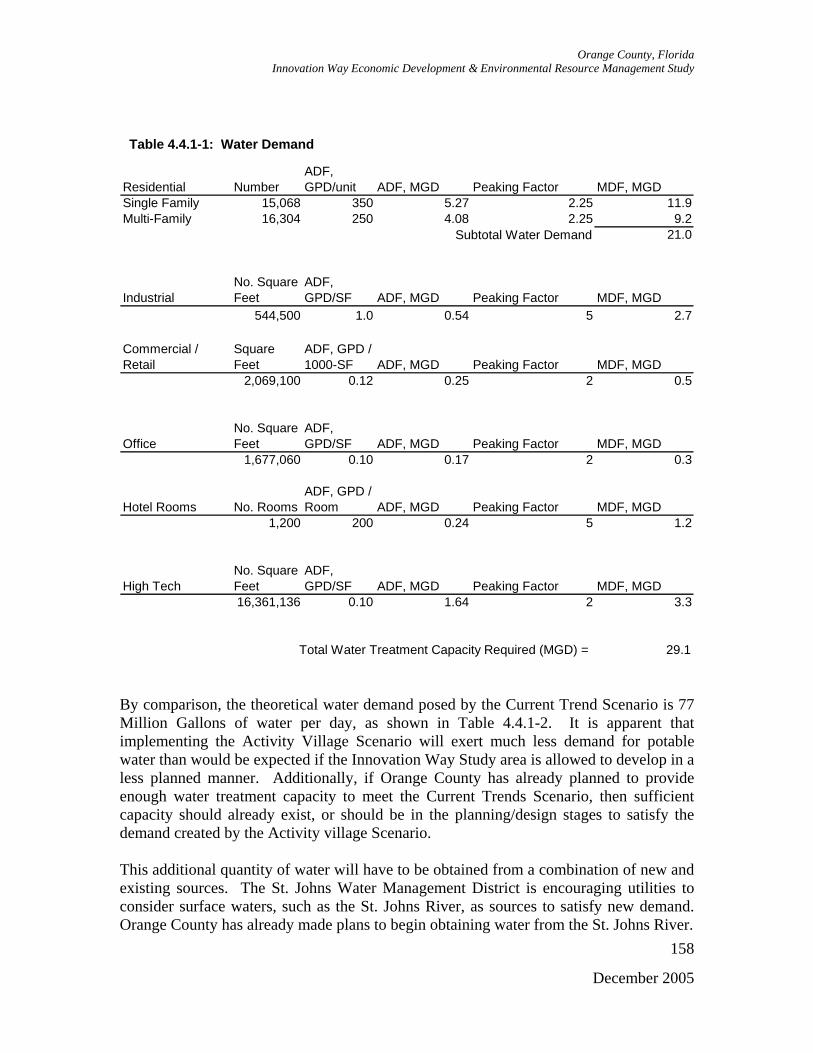
Orange County, Florida Innovation Way Economic Development & Environmental Resource Management Study
December 2005
158
By comparison, the theoretical water demand posed by the Current Trend Scenario is 77 Million Gallons of water per day, as shown in Table 4.4.1-2. It is apparent that implementing the Activity Village Scenario will exert much less demand for potable water than would be expected if the Innovation Way Study area is allowed to develop in a less planned manner. Additionally, if Orange County has already planned to provide enough water treatment capacity to meet the Current Trends Scenario, then sufficient capacity should already exist, or should be in the planning/design stages to satisfy the demand created by the Activity village Scenario. This additional quantity of water will have to be obtained from a combination of new and existing sources. The St. Johns Water Management District is encouraging utilities to consider surface waters, such as the St. Johns River, as sources to satisfy new demand. Orange County has already made plans to begin obtaining water from the St. Johns River.
Residential NumberADF, GPD/unit ADF, MGD Peaking Factor MDF, MGD
Single Family 15,068 350 5.27 2.25 11.9Multi-Family 16,304 250 4.08 2.25 9.2
Subtotal Water Demand 21.0
IndustrialNo. Square Feet
ADF, GPD/SF ADF, MGD Peaking Factor MDF, MGD
544,500 1.0 0.54 5 2.7
Commercial / Retail
Square Feet
ADF, GPD / 1000-SF ADF, MGD Peaking Factor MDF, MGD
2,069,100 0.12 0.25 2 0.5
OfficeNo. Square Feet
ADF, GPD/SF ADF, MGD Peaking Factor MDF, MGD
1,677,060 0.10 0.17 2 0.3
Hotel Rooms No. RoomsADF, GPD / Room ADF, MGD Peaking Factor MDF, MGD
1,200 200 0.24 5 1.2
High TechNo. Square Feet
ADF, GPD/SF ADF, MGD Peaking Factor MDF, MGD
16,361,136 0.10 1.64 2 3.3
Total Water Treatment Capacity Required (MGD) = 29.1
Table 4.4.1-1: Water Demand
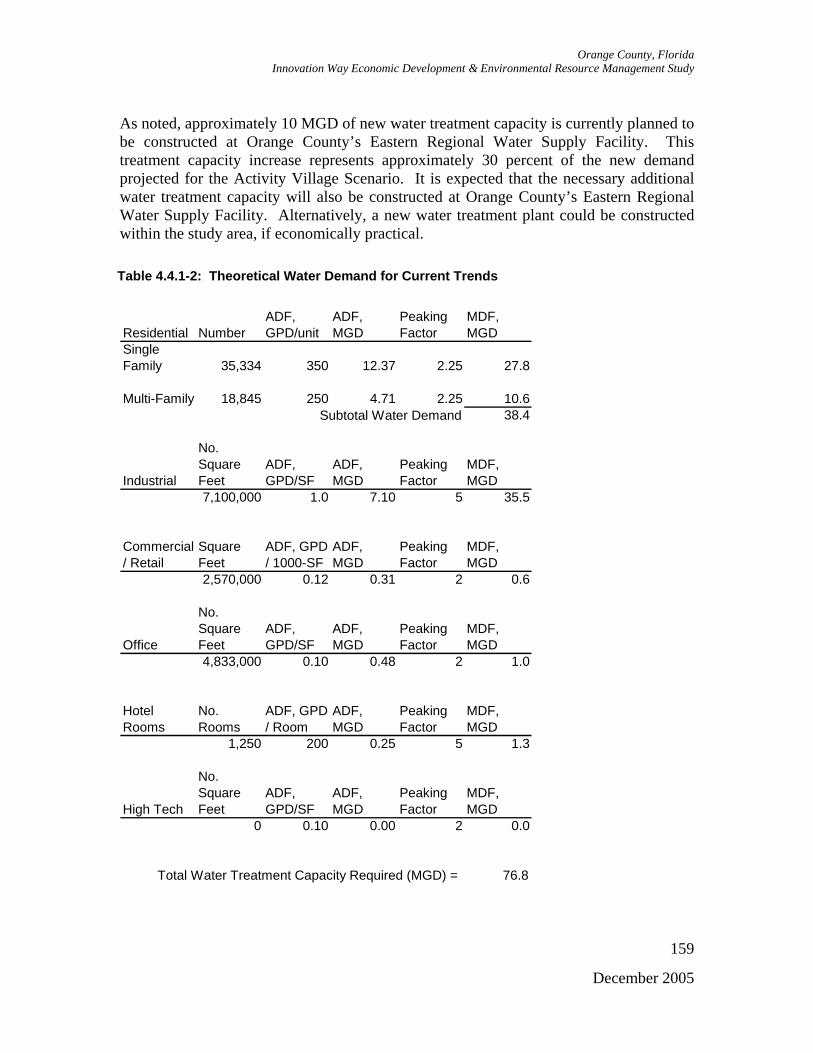
Orange County, Florida Innovation Way Economic Development & Environmental Resource Management Study
December 2005
159
As noted, approximately 10 MGD of new water treatment capacity is currently planned to be constructed at Orange County’s Eastern Regional Water Supply Facility. This treatment capacity increase represents approximately 30 percent of the new demand projected for the Activity Village Scenario. It is expected that the necessary additional water treatment capacity will also be constructed at Orange County’s Eastern Regional Water Supply Facility. Alternatively, a new water treatment plant could be constructed within the study area, if economically practical.
Residential NumberADF, GPD/unit
ADF, MGD
Peaking Factor
MDF, MGD
Single Family 35,334 350 12.37 2.25 27.8
Multi-Family 18,845 250 4.71 2.25 10.6Subtotal Water Demand 38.4
Industrial
No. Square Feet
ADF, GPD/SF
ADF, MGD
Peaking Factor
MDF, MGD
7,100,000 1.0 7.10 5 35.5
Commercial / Retail
Square Feet
ADF, GPD / 1000-SF
ADF, MGD
Peaking Factor
MDF, MGD
2,570,000 0.12 0.31 2 0.6
Office
No. Square Feet
ADF, GPD/SF
ADF, MGD
Peaking Factor
MDF, MGD
4,833,000 0.10 0.48 2 1.0
Hotel Rooms
No. Rooms
ADF, GPD / Room
ADF, MGD
Peaking Factor
MDF, MGD
1,250 200 0.25 5 1.3
High Tech
No. Square Feet
ADF, GPD/SF
ADF, MGD
Peaking Factor
MDF, MGD
0 0.10 0.00 2 0.0
Total Water Treatment Capacity Required (MGD) = 76.8
Table 4.4.1-2: Theoretical Water Demand for Current Trends
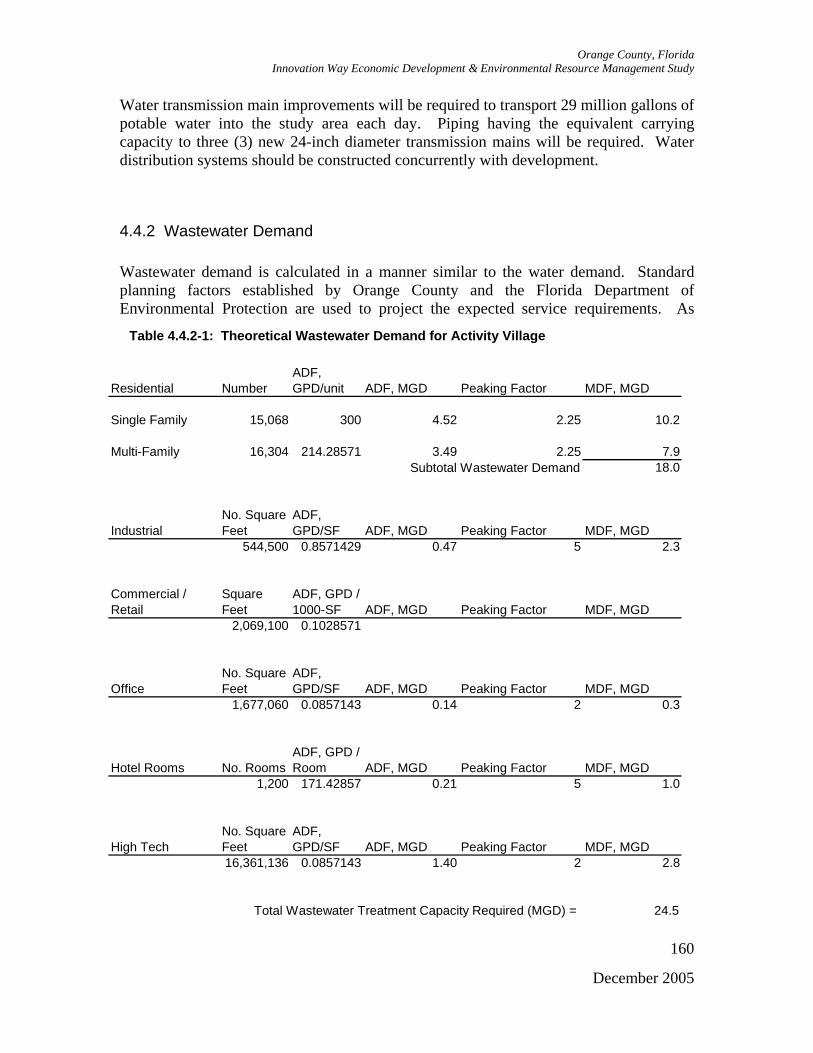
Orange County, Florida Innovation Way Economic Development & Environmental Resource Management Study
December 2005
160
Water transmission main improvements will be required to transport 29 million gallons of potable water into the study area each day. Piping having the equivalent carrying capacity to three (3) new 24-inch diameter transmission mains will be required. Water distribution systems should be constructed concurrently with development.
4.4.2 Wastewater Demand Wastewater demand is calculated in a manner similar to the water demand. Standard planning factors established by Orange County and the Florida Department of Environmental Protection are used to project the expected service requirements. As
Residential NumberADF, GPD/unit ADF, MGD Peaking Factor MDF, MGD
Single Family 15,068 300 4.52 2.25 10.2
Multi-Family 16,304 214.28571 3.49 2.25 7.9Subtotal Wastewater Demand 18.0
IndustrialNo. Square Feet
ADF, GPD/SF ADF, MGD Peaking Factor MDF, MGD
544,500 0.8571429 0.47 5 2.3
Commercial / Retail
Square Feet
ADF, GPD / 1000-SF ADF, MGD Peaking Factor MDF, MGD
2,069,100 0.1028571
OfficeNo. Square Feet
ADF, GPD/SF ADF, MGD Peaking Factor MDF, MGD
1,677,060 0.0857143 0.14 2 0.3
Hotel Rooms No. RoomsADF, GPD / Room ADF, MGD Peaking Factor MDF, MGD
1,200 171.42857 0.21 5 1.0
High TechNo. Square Feet
ADF, GPD/SF ADF, MGD Peaking Factor MDF, MGD
16,361,136 0.0857143 1.40 2 2.8
Total Wastewater Treatment Capacity Required (MGD) = 24.5
Table 4.4.2-1: Theoretical Wastewater Demand for Activity Village
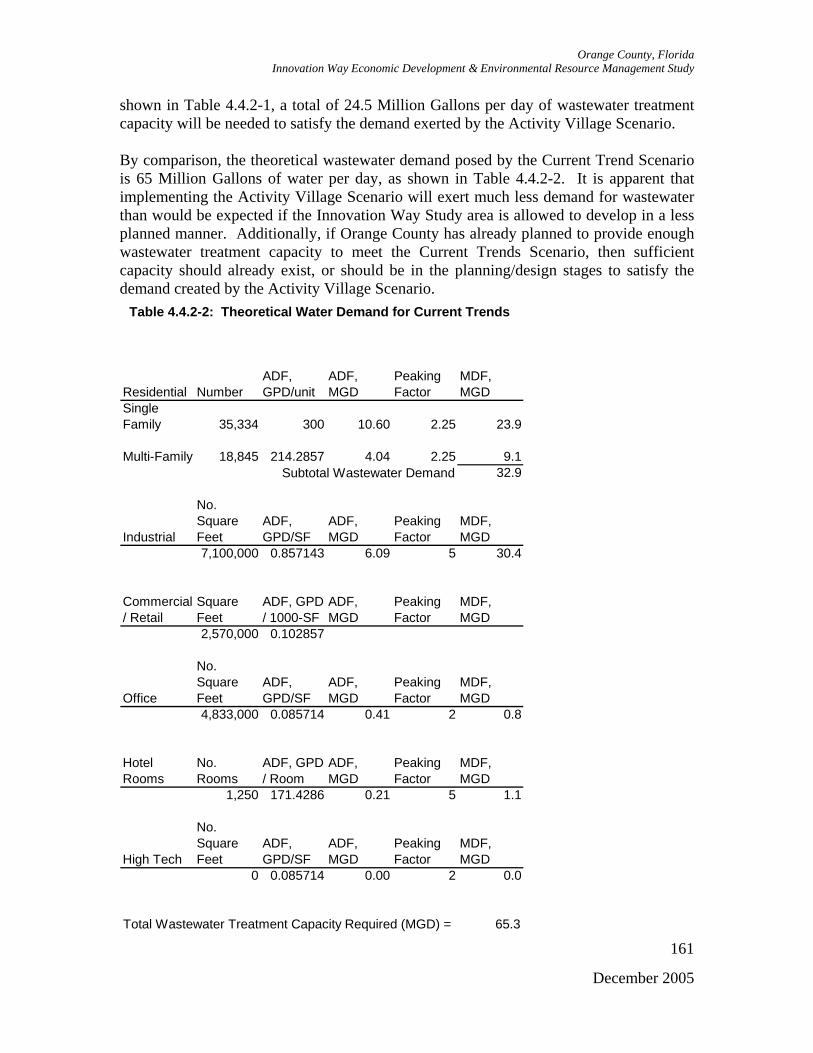
Orange County, Florida Innovation Way Economic Development & Environmental Resource Management Study
December 2005
161
shown in Table 4.4.2-1, a total of 24.5 Million Gallons per day of wastewater treatment capacity will be needed to satisfy the demand exerted by the Activity Village Scenario. By comparison, the theoretical wastewater demand posed by the Current Trend Scenario is 65 Million Gallons of water per day, as shown in Table 4.4.2-2. It is apparent that implementing the Activity Village Scenario will exert much less demand for wastewater than would be expected if the Innovation Way Study area is allowed to develop in a less planned manner. Additionally, if Orange County has already planned to provide enough wastewater treatment capacity to meet the Current Trends Scenario, then sufficient capacity should already exist, or should be in the planning/design stages to satisfy the demand created by the Activity Village Scenario.
Residential NumberADF, GPD/unit
ADF, MGD
Peaking Factor
MDF, MGD
Single Family 35,334 300 10.60 2.25 23.9
Multi-Family 18,845 214.2857 4.04 2.25 9.1Subtotal Wastewater Demand 32.9
Industrial
No. Square Feet
ADF, GPD/SF
ADF, MGD
Peaking Factor
MDF, MGD
7,100,000 0.857143 6.09 5 30.4
Commercial / Retail
Square Feet
ADF, GPD / 1000-SF
ADF, MGD
Peaking Factor
MDF, MGD
2,570,000 0.102857
Office
No. Square Feet
ADF, GPD/SF
ADF, MGD
Peaking Factor
MDF, MGD
4,833,000 0.085714 0.41 2 0.8
Hotel Rooms
No. Rooms
ADF, GPD / Room
ADF, MGD
Peaking Factor
MDF, MGD
1,250 171.4286 0.21 5 1.1
High Tech
No. Square Feet
ADF, GPD/SF
ADF, MGD
Peaking Factor
MDF, MGD
0 0.085714 0.00 2 0.0
Total Wastewater Treatment Capacity Required (MGD) = 65.3
Table 4.4.2-2: Theoretical Water Demand for Current Trends
Orange County, Florida Innovation Way Economic Development & Environmental Resource Management Study
December 2005
162
As noted in Chapter 2, Orange County is already planning to construct an additional 5 MGD of new wastewater treatment capacity at the Eastern Regional Water Reclamation Facility. This additional treatment capacity represents approximately 20 percent of the demand expected to be created by the Activity Village Scenario. It is expected that the necessary additional water treatment capacity will also be constructed at Orange County’s Eastern Regional Water Reclamation Facility. Alternatively, a new wastewater treatment plant could be constructed within the study area, if economically practical. Wastewater transmission main improvements will be required to transport 24.5 million gallons of wastewater out of the study area each day. Piping having the equivalent carrying capacity to three (3) new 24-inch diameter transmission mains will be required. Gravity collection systems to collect wastewater should be constructed concurrently with development.
4.4.3 Reclaimed Water Disposal of treated wastewater effluent (reclaimed water) via distribution to land owners as a source of irrigation water has become a viable product in Central Florida. Concurrently, disposal of treated wastewater via discharge to surface waters, infiltration through rapid infiltration basins or to wells generally is not feasible due to a variety of federal, state and local environmental regulations. It is important to note that Orange County should plan to dispose of treated wastewater effluent via distribution of the reclaimed water for irrigation purposes. The amount of wastewater treatment capacity that can be permitted may be limited to the amount of reclaimed water that can be utilized. If insufficient demand exists for the reclaimed water, then the wastewater treatment capacity may be limited. The amount of reclaimed water to be disposed of is roughly equivalent to the amount of wastewater treated. Key to disposing of the reclaimed water is the construction of a reclaimed water transmission and distribution system, including storage facilities and pumping stations. The treatment systems required to produce reclaimed water are typically constructed in conjunction with, and as part of, new wastewater treatment plants or treatment plant expansions. The reclaimed water storage facilities, pumping stations and transmission mains should be constructed concurrently with the water and wastewater transmission systems. The reclaimed water distribution systems should be constructed concurrently with development.
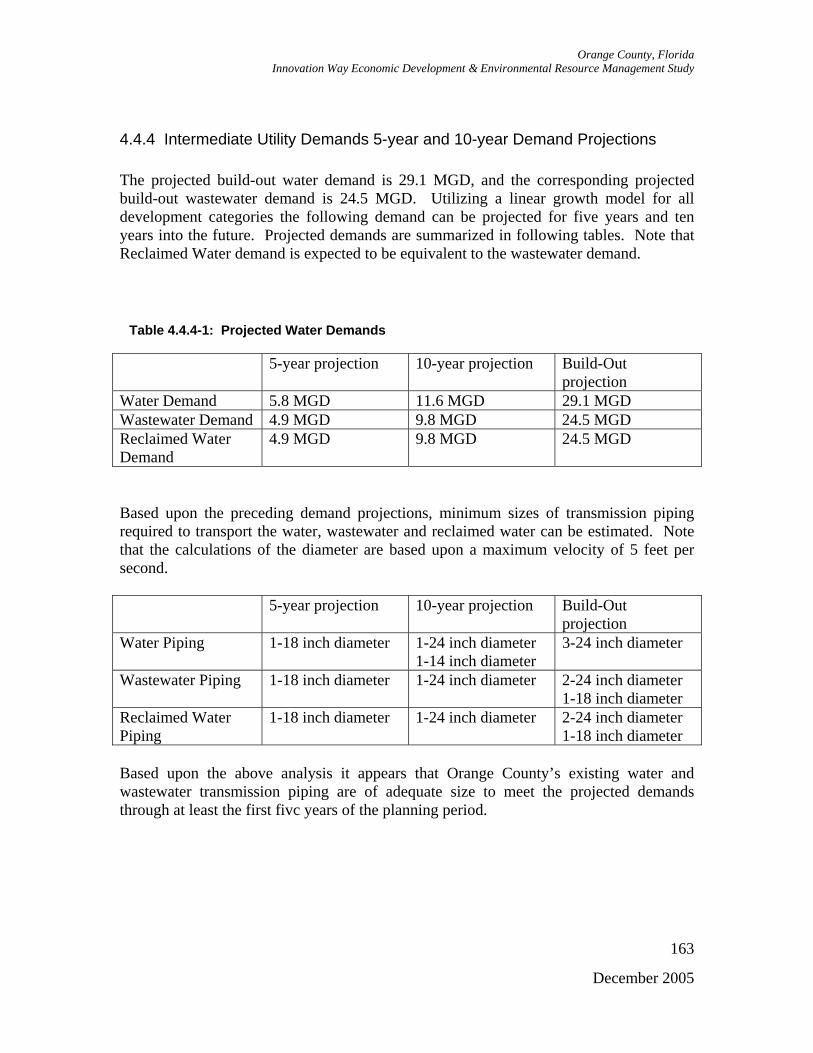
Orange County, Florida Innovation Way Economic Development & Environmental Resource Management Study
December 2005
163
4.4.4 Intermediate Utility Demands 5-year and 10-year Demand Projections The projected build-out water demand is 29.1 MGD, and the corresponding projected build-out wastewater demand is 24.5 MGD. Utilizing a linear growth model for all development categories the following demand can be projected for five years and ten years into the future. Projected demands are summarized in following tables. Note that Reclaimed Water demand is expected to be equivalent to the wastewater demand.
5-year projection 10-year projection Build-Out projection
Water Demand 5.8 MGD 11.6 MGD 29.1 MGD Wastewater Demand 4.9 MGD 9.8 MGD 24.5 MGD Reclaimed Water Demand
4.9 MGD 9.8 MGD 24.5 MGD
Based upon the preceding demand projections, minimum sizes of transmission piping required to transport the water, wastewater and reclaimed water can be estimated. Note that the calculations of the diameter are based upon a maximum velocity of 5 feet per second. 5-year projection 10-year projection Build-Out
projection Water Piping 1-18 inch diameter 1-24 inch diameter
1-14 inch diameter 3-24 inch diameter
Wastewater Piping 1-18 inch diameter 1-24 inch diameter 2-24 inch diameter 1-18 inch diameter
Reclaimed Water Piping
1-18 inch diameter 1-24 inch diameter 2-24 inch diameter 1-18 inch diameter
Based upon the above analysis it appears that Orange County’s existing water and wastewater transmission piping are of adequate size to meet the projected demands through at least the first fivc years of the planning period.
Table 4.4.4-1: Projected Water Demands
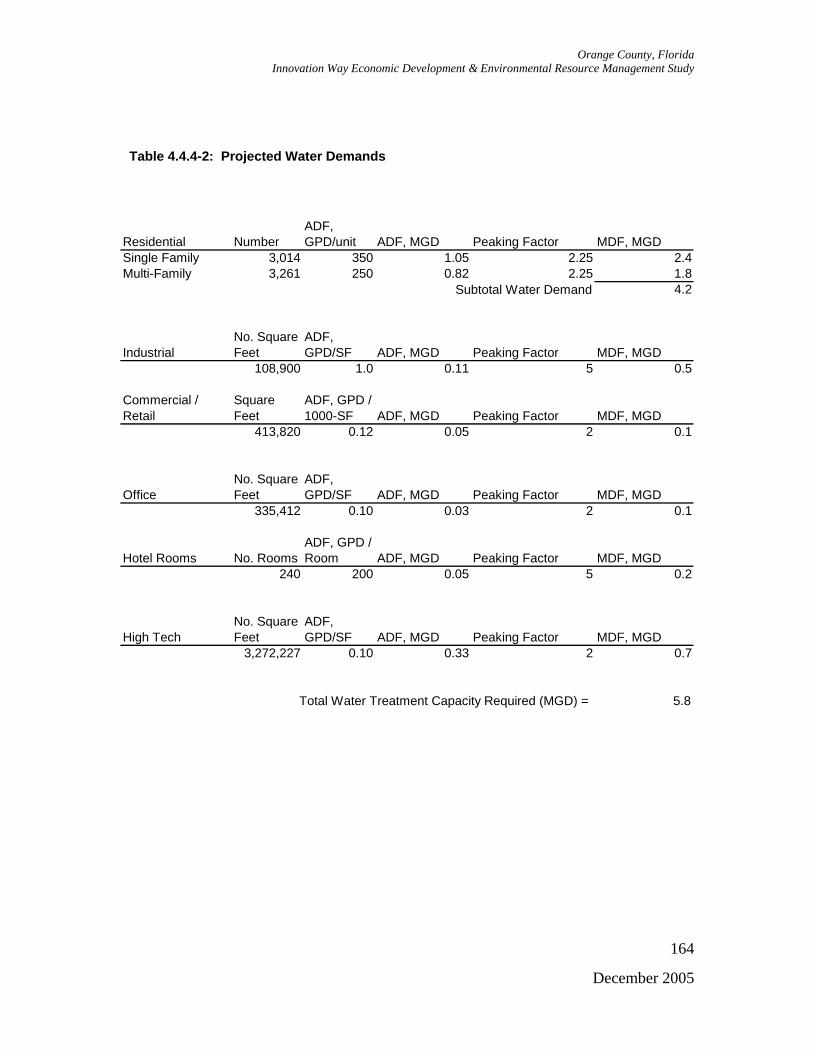
Orange County, Florida Innovation Way Economic Development & Environmental Resource Management Study
December 2005
164
Residential NumberADF, GPD/unit ADF, MGD Peaking Factor MDF, MGD
Single Family 3,014 350 1.05 2.25 2.4Multi-Family 3,261 250 0.82 2.25 1.8
Subtotal Water Demand 4.2
IndustrialNo. Square Feet
ADF, GPD/SF ADF, MGD Peaking Factor MDF, MGD
108,900 1.0 0.11 5 0.5
Commercial / Retail
Square Feet
ADF, GPD / 1000-SF ADF, MGD Peaking Factor MDF, MGD
413,820 0.12 0.05 2 0.1
OfficeNo. Square Feet
ADF, GPD/SF ADF, MGD Peaking Factor MDF, MGD
335,412 0.10 0.03 2 0.1
Hotel Rooms No. RoomsADF, GPD / Room ADF, MGD Peaking Factor MDF, MGD
240 200 0.05 5 0.2
High TechNo. Square Feet
ADF, GPD/SF ADF, MGD Peaking Factor MDF, MGD
3,272,227 0.10 0.33 2 0.7
Total Water Treatment Capacity Required (MGD) = 5.8
Table 4.4.4-2: Projected Water Demands
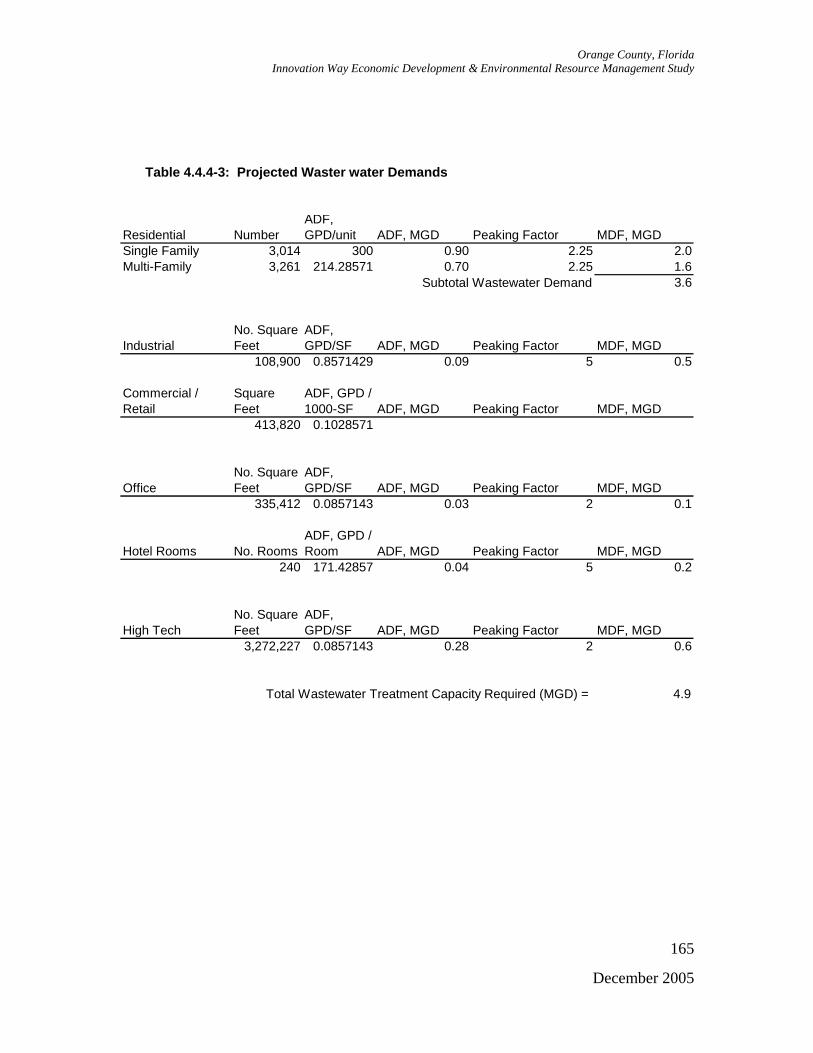
Orange County, Florida Innovation Way Economic Development & Environmental Resource Management Study
December 2005
165
Residential NumberADF, GPD/unit ADF, MGD Peaking Factor MDF, MGD
Single Family 3,014 300 0.90 2.25 2.0Multi-Family 3,261 214.28571 0.70 2.25 1.6
Subtotal Wastewater Demand 3.6
IndustrialNo. Square Feet
ADF, GPD/SF ADF, MGD Peaking Factor MDF, MGD
108,900 0.8571429 0.09 5 0.5
Commercial / Retail
Square Feet
ADF, GPD / 1000-SF ADF, MGD Peaking Factor MDF, MGD
413,820 0.1028571
OfficeNo. Square Feet
ADF, GPD/SF ADF, MGD Peaking Factor MDF, MGD
335,412 0.0857143 0.03 2 0.1
Hotel Rooms No. RoomsADF, GPD / Room ADF, MGD Peaking Factor MDF, MGD
240 171.42857 0.04 5 0.2
High TechNo. Square Feet
ADF, GPD/SF ADF, MGD Peaking Factor MDF, MGD
3,272,227 0.0857143 0.28 2 0.6
Total Wastewater Treatment Capacity Required (MGD) = 4.9
Table 4.4.4-3: Projected Waster water Demands
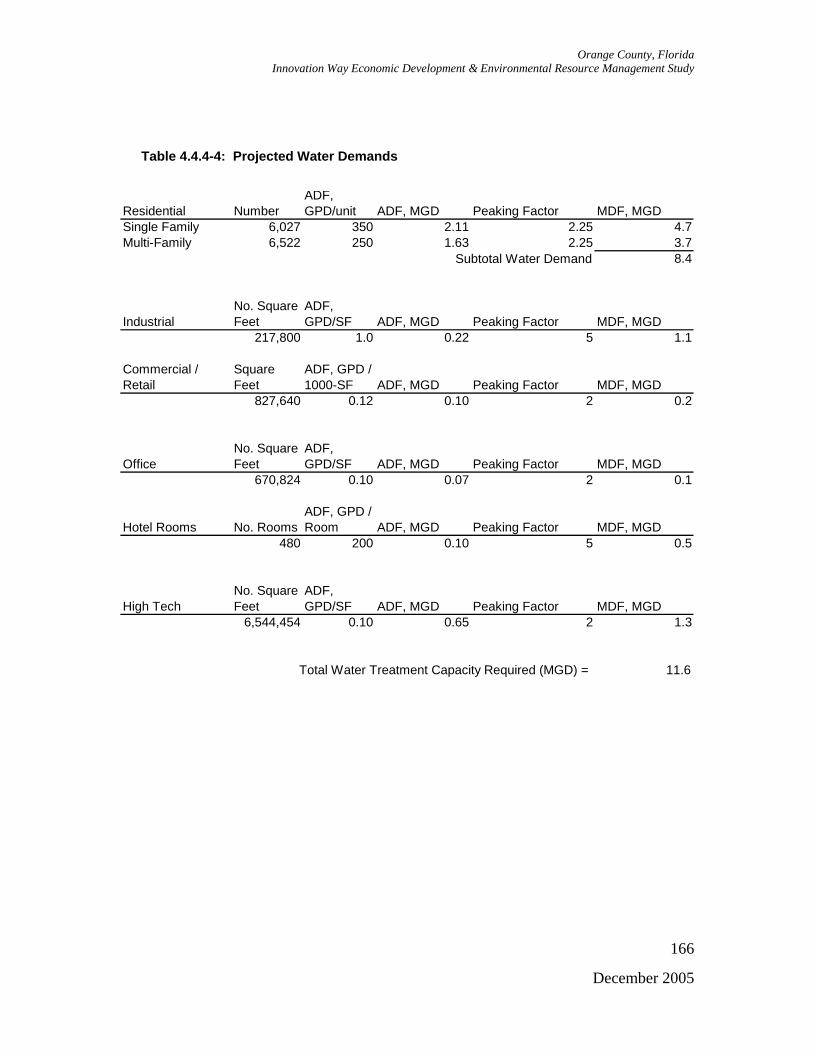
Orange County, Florida Innovation Way Economic Development & Environmental Resource Management Study
December 2005
166
Residential NumberADF, GPD/unit ADF, MGD Peaking Factor MDF, MGD
Single Family 6,027 350 2.11 2.25 4.7Multi-Family 6,522 250 1.63 2.25 3.7
Subtotal Water Demand 8.4
IndustrialNo. Square Feet
ADF, GPD/SF ADF, MGD Peaking Factor MDF, MGD
217,800 1.0 0.22 5 1.1
Commercial / Retail
Square Feet
ADF, GPD / 1000-SF ADF, MGD Peaking Factor MDF, MGD
827,640 0.12 0.10 2 0.2
OfficeNo. Square Feet
ADF, GPD/SF ADF, MGD Peaking Factor MDF, MGD
670,824 0.10 0.07 2 0.1
Hotel Rooms No. RoomsADF, GPD / Room ADF, MGD Peaking Factor MDF, MGD
480 200 0.10 5 0.5
High TechNo. Square Feet
ADF, GPD/SF ADF, MGD Peaking Factor MDF, MGD
6,544,454 0.10 0.65 2 1.3
Total Water Treatment Capacity Required (MGD) = 11.6
Table 4.4.4-4: Projected Water Demands

Orange County, Florida Innovation Way Economic Development & Environmental Resource Management Study
December 2005
167
Summary of Findings The results of this analysis indicate that Orange County continues to plan for future demands for water, wastewater and reclaimed water service. Enough treatment capacity exists or is planned to meet demand for the initial years of the study period. Additional water, wastewater and reclaimed water treatment and transmission capacity to meet the ultimate build-out demands expected to be created by implementation of the Activity Village Scenario. Currently the following additional treatment capacities are required:
Residential NumberADF, GPD/unit ADF, MGD Peaking Factor MDF, MGD
Single Family 6,027 300 1.81 2.25 4.1Multi-Family 6,522 214.28571 1.40 2.25 3.1
Subtotal Wastewater Demand 7.2
IndustrialNo. Square Feet
ADF, GPD/SF ADF, MGD Peaking Factor MDF, MGD
217,800 0.8571429 0.19 5 0.9
Commercial / Retail
Square Feet
ADF, GPD / 1000-SF ADF, MGD Peaking Factor MDF, MGD
827,640 0.1028571
OfficeNo. Square Feet
ADF, GPD/SF ADF, MGD Peaking Factor MDF, MGD
670,824 0.0857143 0.06 2 0.1
Hotel Rooms No. RoomsADF, GPD / Room ADF, MGD Peaking Factor MDF, MGD
480 171.42857 0.08 5 0.4
High TechNo. Square Feet
ADF, GPD/SF ADF, MGD Peaking Factor MDF, MGD
6,544,454 0.0857143 0.56 2 1.1
Total Wastewater Treatment Capacity Required (MGD) = 9.8
Table 4.4.4-5: Projected Water Demands
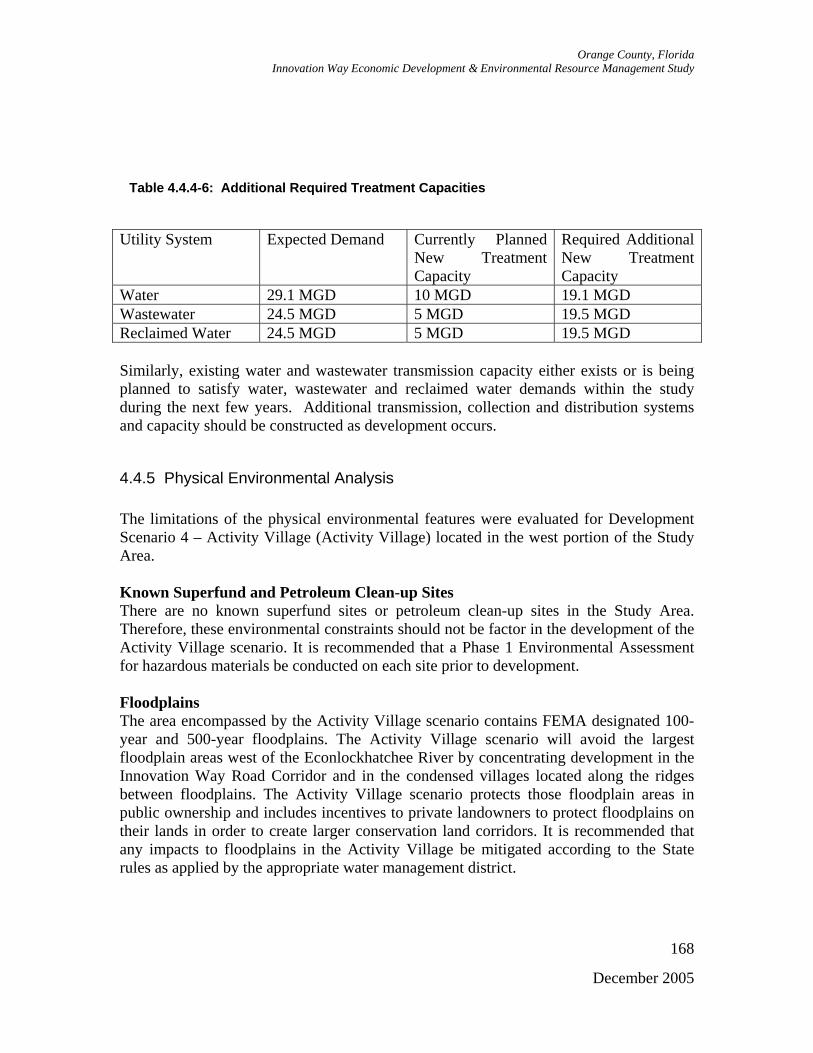
Orange County, Florida Innovation Way Economic Development & Environmental Resource Management Study
December 2005
168
Utility System Expected Demand Currently Planned
New Treatment Capacity
Required Additional New Treatment Capacity
Water 29.1 MGD 10 MGD 19.1 MGD Wastewater 24.5 MGD 5 MGD 19.5 MGD Reclaimed Water 24.5 MGD 5 MGD 19.5 MGD Similarly, existing water and wastewater transmission capacity either exists or is being planned to satisfy water, wastewater and reclaimed water demands within the study during the next few years. Additional transmission, collection and distribution systems and capacity should be constructed as development occurs.
4.4.5 Physical Environmental Analysis The limitations of the physical environmental features were evaluated for Development Scenario 4 – Activity Village (Activity Village) located in the west portion of the Study Area. Known Superfund and Petroleum Clean-up Sites There are no known superfund sites or petroleum clean-up sites in the Study Area. Therefore, these environmental constraints should not be factor in the development of the Activity Village scenario. It is recommended that a Phase 1 Environmental Assessment for hazardous materials be conducted on each site prior to development. Floodplains The area encompassed by the Activity Village scenario contains FEMA designated 100-year and 500-year floodplains. The Activity Village scenario will avoid the largest floodplain areas west of the Econlockhatchee River by concentrating development in the Innovation Way Road Corridor and in the condensed villages located along the ridges between floodplains. The Activity Village scenario protects those floodplain areas in public ownership and includes incentives to private landowners to protect floodplains on their lands in order to create larger conservation land corridors. It is recommended that any impacts to floodplains in the Activity Village be mitigated according to the State rules as applied by the appropriate water management district.
Table 4.4.4-6: Additional Required Treatment Capacities

Orange County, Florida Innovation Way Economic Development & Environmental Resource Management Study
December 2005
169
Topography The topographic features of the area encompassed by the Activity Village scenario include relatively high elevations in the north and northwest portions and along a ridge that extends in a southeasterly direction from the northwest corner of the Study Area. The ridge separates the areas of relatively lower elevations associated with the Econlockhatchee River to the east of the Activity Village from the low lying areas associated with Whippoorwill Lake, Lake Hart, and Lake Mary Jane located southwest of the Activity Village. The Activity Village scenario reduces impacts to these water bodies and their associated floodplains by directing development to the areas of higher elevations. Soils Most of the soil types mapped by the NRCS in the Activity Village scenario are classified as B/D soils. The NRCS notes that the suitability of these soils for septic tank absorption fields is severely limited due to a high water table, which results in poor filtration rates. The use of septic systems as the principal means of wastewater treatment in the Activity Village is not feasible, which necessitates the implementation of a centralized sewer and waste water treatment system. In addition, the NRCS notes that the B/D soils are poorly suited for use as road fill due to wetness and a high shrink-swell potential. Thus, there may be a need to import fill to the area. Historic Sites or Cultural Resources The area encompassed by the Activity Village scenario includes small known archaeological sites, historic standing buildings and one historic bridge site. The known historic elements are small in size and do not represent significant constraints to the development of the Activity Village. However, each site may require a site specific evaluation by a professional archaeologist to ensure that recorded and unrecorded historic or cultural resources are identified early in the development process so that these resources may be preserved in accordance with the guidelines set forth by the State of Florida Department of Historical Resources. Drainage Basins The Activity Village scenario is divided into two major drainage basins; the Upper St. Johns River Basin and the Kissmmee River Basin. The jurisdictional boundaries of the SFWMD and SJRWMD are generally defined by the drainage basin boundaries. Specifically, the jurisdictional limits of the SFWMD generally include the Kissimmee River Basin, whereas the jurisdictional limits of the SJRWMD generally include the Upper St. Johns River Basin. These agencies play a large part in the state’s regulatory oversight of development practices through the implementation of rules governing the construction of stormwater management systems, and floodplain and wetland impacts under the Environmental Resource Permitting (ERP) program. Proposed developments should comply with the ERP guidelines of the appropriate water management district. The SJRWMD has special stormwater basin criteria for projects within the Econlockhatchee River Hydrologic Basin.

Orange County, Florida Innovation Way Economic Development & Environmental Resource Management Study
December 2005
170
Aquifer Recharge Potential The land area encompassed by the Activity Village scenario contains soil types with very low Aquifer Recharge Potential. This portion of east Orange County does not contain any areas designated by the state as Most Effective Recharge Areas that would require special protection. The Activity Village includes portions of the Econlockhatchee River, which is designated an OFW. The SJRWMD requires any proposed site development to comply with the OFW criteria for stormwater management.
4.5 Transportation Analysis Summary Findings The purpose of this study is to evaluate the roadway capacity needs to support the Innovation Way Sector Plan. Estimates of the roadway construction costs that are needed for three development phases of the plan were also developed. Based on the technical scope issued by Orange County, the analysis focused on the impacts of growth and development on the roadway network system using the highway-only component of the Orlando Urban Area Transportation Study (OUATS) long-range forecasting models. Since transit use was excluded from the analysis, a worst case scenario that determines the roadway capacity needs of the Sector Plan was developed. It is anticipated that transit applications will be considered for evaluation as the Sector Plan evolves and in conjunction with an overall transit assessment of the Orlando region. The transportation analysis of the Innovation Way study documents the transportation needs of the plan’s infrastructure component. This analysis establishes existing travel characteristics occurring within the transportation roadway network and evaluates the future travel characteristics incorporating the potential impacts and road capacity needs of the sector plan at build-out. The responsibility of implementing the roadway infrastructure needs falls on the shoulders of Orange County’s Concurrency Management System administrators. Every neighborhood or village plan must go through the County’s concurrency review process where adequate transportation capacity must exist before new development takes place. This is an important point to make because, unlike the DRI process where vested trip rights are awarded, most development is subject to concurrency regulations. Therefore, this Transportation Element identifies the road infrastructure network that would be required to support Innovation Way development as it proceeds toward build-out. Through the monitoring process that governs concurrency management regulations, Orange County has the ability to regulate development approvals associated with every Sector Plan application and balance these development approvals with available road capacity.
Orange County, Florida Innovation Way Economic Development & Environmental Resource Management Study
December 2005
171
4.5.1 Existing Transportation Conditions The transportation Interest Area is formed by the boundaries established by SR 50 to the north, SR 436 to the west, Osceola County to the south and Econlockhatchee River to the east. Table 4.5.1-1 provides a summary of the roadway characteristics inventory, including daily and p.m. peak hour traffic volume levels reported by FDOT, Orange County, OOCEA, and other jurisdictions using available year 2004-05 traffic data. Traffic factors relating peak hour counts with daily counts (i.e., K100) and peak directional flow (i.e., D100) were obtained from FDOT, Orange County, OOCEA, and other jurisdictions.
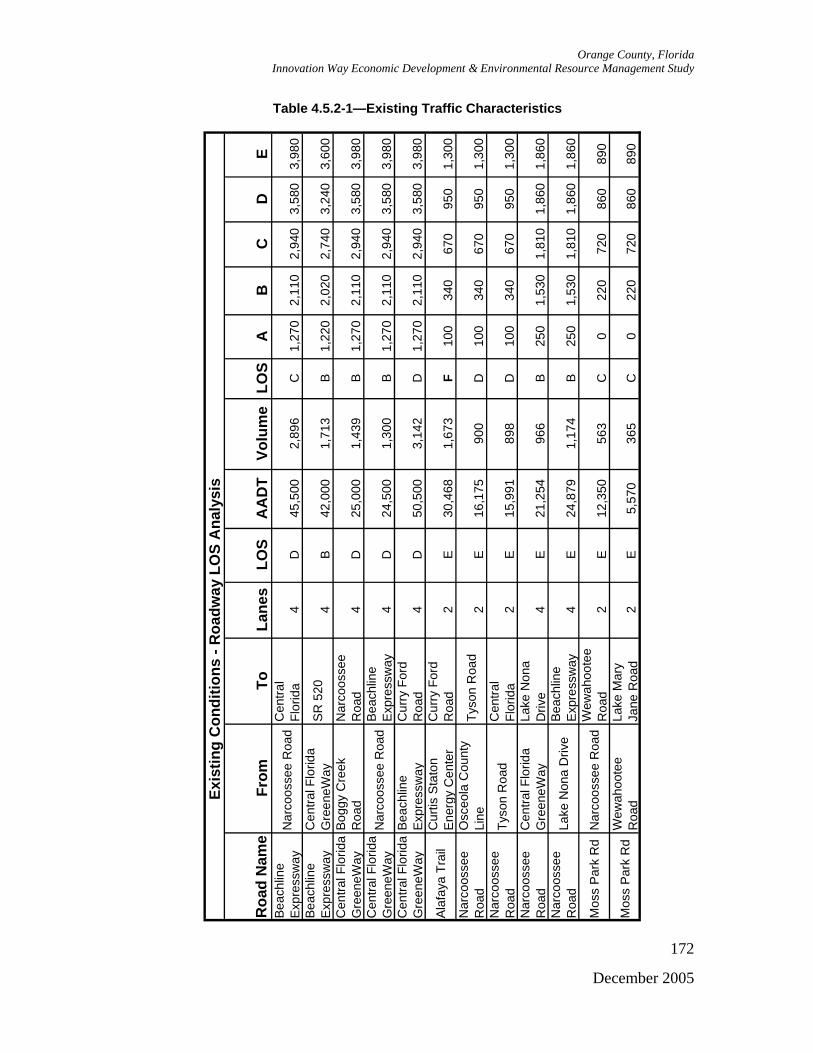
Orange County, Florida Innovation Way Economic Development & Environmental Resource Management Study
December 2005
172
Table 4.5.2-1—Existing Traffic Characteristics
Roa
d N
ame
From
ToLa
nes
LOS
AA
DT
Volu
me
LOS
AB
CD
EBe
achl
ine
Expr
essw
ayN
arco
osse
e R
oad
Cen
tral
Flor
ida
4D
45,5
002,
896
C1,
270
2,11
02,
940
3,58
03,
980
Beac
hlin
e Ex
pres
sway
Cen
tral F
lorid
a G
reen
eWa y
SR 5
204
B42
,000
1,71
3B
1,22
02,
020
2,74
03,
240
3,60
0C
entra
l Flo
rida
Gre
eneW
ayBo
ggy
Cre
ek
Roa
dN
arco
osse
e R
oad
4D
25,0
001,
439
B1,
270
2,11
02,
940
3,58
03,
980
Cen
tral F
lorid
a G
reen
eWay
Nar
coos
see
Roa
dBe
achl
ine
Expr
essw
ay4
D24
,500
1,30
0B
1,27
02,
110
2,94
03,
580
3,98
0C
entra
l Flo
rida
Gre
eneW
a yBe
achl
ine
Expr
essw
ayC
urry
For
d R
oad
4D
50,5
003,
142
D1,
270
2,11
02,
940
3,58
03,
980
Alaf
aya
Trai
lC
urtis
Sta
ton
Ener
gy C
ente
rC
urry
For
d R
oad
2E
30,4
681,
673
F10
034
067
095
01,
300
Nar
coos
see
Roa
dO
sceo
la C
ount
y Li
neTy
son
Roa
d2
E16
,175
900
D10
034
067
095
01,
300
Nar
coos
see
Roa
dTy
son
Roa
dC
entra
l Fl
orid
a 2
E15
,991
898
D10
034
067
095
01,
300
Nar
coos
see
Roa
dC
entra
l Flo
rida
Gre
eneW
ayLa
ke N
ona
Driv
e4
E21
,254
966
B25
01,
530
1,81
01,
860
1,86
0N
arco
osse
e R
oad
Lake
Non
a D
rive
Beac
hlin
e Ex
pres
sway
4E
24,8
791,
174
B25
01,
530
1,81
01,
860
1,86
0
Mos
s Pa
rk R
dN
arco
osse
e R
oad
Wew
ahoo
tee
Roa
d2
E12
,350
563
C0
220
720
860
890
Mos
s Pa
rk R
dW
ewah
oote
e R
oad
Lake
Mar
y Ja
ne R
oad
2E
5,57
036
5C
022
072
086
089
0
Exis
ting
Con
ditio
ns -
Roa
dway
LO
S A
naly
sis

Orange County, Florida Innovation Way Economic Development & Environmental Resource Management Study
December 2005
173
Level of service standards established in the Comprehensive Plans of respective local government jurisdictions were also included in the roadway characteristics inventory.
4.5.2 Existing Level of Service Transportation engineers rate the quality of traffic flow occurring on a roadway segment using Level of Service (LOS) as the measuring tool. Level of Service on a road segment relates traffic volume to the road’s capacity. Service levels ranging from LOS A, representing low demand, high speed operation, to LOS F, representing high demand that exceeds capacity, resulting in forced flow, stop-and-go operation, correspond to certain volume to capacity thresholds. These thresholds are established in the Year 2002 Quality Level of Service Handbook published by the FDOT. Service levels are described according to the following definitions:
• Level of Service A: Represents free flow conditions, with low demand and high speed operation. Vehicles are able to maneuver freely along the roadway segment with minimal conflicts with other vehicles in the traffic stream.
• Level of Service B: Represents stable traffic flow conditions, with operating speeds and ability to maneuver between traffic lanes beginning to feel restricted by the surrounding traffic stream. Operating speeds remain relatively high.
• Level of Service C: Represents higher demand within stable flow conditions. Speeds and maneuverability are influenced by the surrounding traffic stream. Operating speeds are slightly lower than those achieved at LOS B conditions.
• Level of Service D: Represents traffic flow conditions approaching capacity. Operating speeds and freedom to maneuver become restricted by higher density traffic flow conditions.
• Level of Service E: Represents traffic flow conditions at or near capacity. Operating speeds are lower than those achieved at LOS D, and a slight disruption to traffic flow results in unstable operation.
• Level of Service F: Represents forced flow traffic flow conditions. Traffic flow levels are lower than the capacity of the road because operating speeds fluctuate between stop and go condition.
The Comprehensive Plan process allows local governments to establish minimum acceptable level of service standards on all functionally classified roadways within their jurisdictions. These standards are adopted with the review of the Department of Community Affairs and become part of the local government’s Comprehensive Plan. The existing level of service conditions are established in Table 4.5.2-1 by comparing p.m. peak hour volumes against service volumes at various levels of service thresholds. The resulting level of service is compared with the respective minimum acceptable operating standard which determines whether or not a road segment is capacity deficient. A roadway segment is deemed capacity deficient if the LOS is at a worse level than the
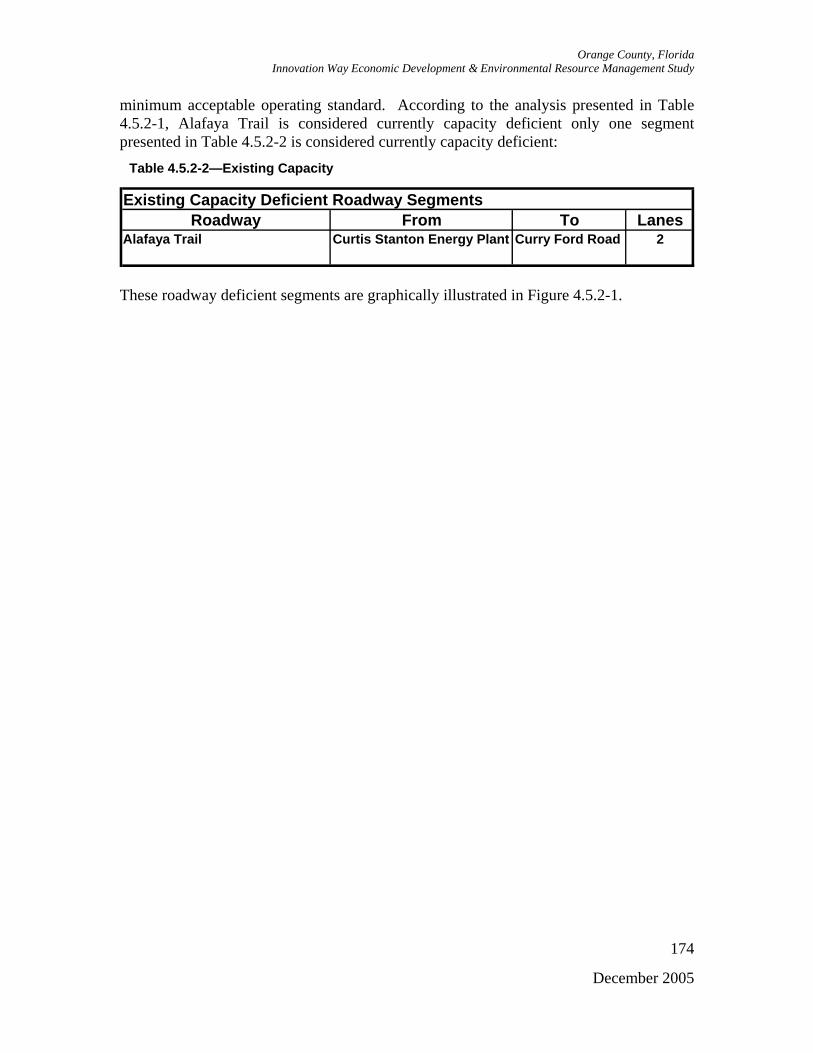
Orange County, Florida Innovation Way Economic Development & Environmental Resource Management Study
December 2005
174
minimum acceptable operating standard. According to the analysis presented in Table 4.5.2-1, Alafaya Trail is considered currently capacity deficient only one segment presented in Table 4.5.2-2 is considered currently capacity deficient:
These roadway deficient segments are graphically illustrated in Figure 4.5.2-1.
Table 4.5.2-2—Existing Capacity
Roadway From To LanesAlafaya Trail Curtis Stanton Energy Plant Curry Ford Road 2
Existing Capacity Deficient Roadway Segments

Orange County, Florida Innovation Way Economic Development & Environmental Resource Management Study
December 2005
175
Figure 4.5.2-1—Existing Capacity

Orange County, Florida Innovation Way Economic Development & Environmental Resource Management Study
December 2005
176
4.5.3 Programmed and Planned Improvements This section documents roadway improvements within the study area that are either programmed or planned in the current work programs adopted by the state and local governments. Programmed improvements have dedicated construction funds that have been earmarked for construction within three years (for state funded projects) or five years (for local government funded projects). Planned improvements are those that have been identified in the Orlando Urban Area Transportation Study (OUATS) Year 2025 Cost Feasible Plan. Programmed Improvements The MetroPlan Orlando compiles a five-year work program that lists all roadway improvement expenditures that the state and local governments have committed to fund. The five-year work program is updated annually. The current work program extends from Fiscal Year 2006 to 2010. The list of programmed road improvements within the vicinity of the study is provided in Table 4.5.3-1.
Roadway From To Agency Improvement Year
SR 50 SR 436 Old CheneyHighway
FDOT Widen from 4L to6L
2008/09
SR 528 I-4 SR 482 (SandLake Road)
FDOT Turnpike
Widen from 4L to6L
2005/06
Conway Road (SR15)
SR 528 Hoffner Road FDOT Widen from 2L to4L
2006/07
Innovation Way
SR 528 Avalon Parkway
Orange County
New 4L 2007/08
Curry FordRoad
Goldenrod Rd. SR 417 Orange County
Widen from 2L to4L
2005/06
SR 528 Boggy CreekRoad
SR 436 OOCEA Widen to 6L 2008/09
SR 417 Interchange at Moss Park Rd. OOCEA New Interchange 2005/06
Dowden Road Extension
Heintzelman Rd.
Narcoossee Road
OIA New 4L 2009/10
Programmed Road Improvements
The SR 417 (GreeneWay) project includes interchanges along the following cross-streets as documented in the OOCEA 5-Year Work Program including the SR 417 Interchange at Moss Park Road.
Table 4.5.3-1: Programmed Road Improvements

Orange County, Florida Innovation Way Economic Development & Environmental Resource Management Study
December 2005
177

Orange County, Florida Innovation Way Economic Development & Environmental Resource Management Study
December 2005
178
Planned Improvements Planned improvements benefiting the study area were obtained from the Orlando Urban Area Transportation Study (OUATS) Long Range Transportation Plan which identifies roadway improvements that are financially feasible through the year 2025. These planned improvements are provided in Table 4.5.3-2.
Roadway From To Improvement Year Study Source
SR 528 Boggy Creek Rd SR 417 Widen to 8L 2025 OUATSSR 528 SR 417 SR 520 Widen to 6L 2025 OUATSSR 408 I-4 SR 417 Widen to 10L 2025 OUATSSR 408 SR 417 SR 50 Widen to 6L 2025 OUATSSR 417 Int’l. Dr. SR 528 Widen to 6L 2025 OUATSSR 417 SR 528 SR 408 Widen to 6L 2025 OUATSSR 528 SR 436 Improve
Interchange2025 OUATS
Alafaya Trail Curry Ford Rd. Avalon Parkway Widen to 4L 2025 OUATS
Innovation Way SR 528 SR 417 New 4L 2025 OUATSInnovation Way SR 417 Narcoossee Rd. New 4L 2025 OUATS
Econlockhatchee Trail Curry Ford Rd. SR 50 Widen to 4L 2025 OUATSSR15 (Narcoossee Rd.) Osceola Co. SR 417 Widen to 4L 2025 OUATS
Econlockhatchee Trail Lee Vista Blvd. Curry Ford Road Widen to 4L 2025 OUATS
Narcoossee Road US 192 Orange Co. Widen to 4L 2025 OUATSSR 50 SR 520 Old Cheney Highway Widen to 6L 2025 OUATS
Chickasaw Tr Lk. Underhill Lee Vista Blvd. Widen to 4L 2025 OUATS
Hoffner Road SR 436 Lee Vista Blvd. Widen to 4L 2025 OUATS
Lake Nona Eastern Road Lake Nona E-W Road Narcoossee Road New 2L 2025 OUATS
Lake Nona E-W Road Boggy Creek Rd. Narcoossee Road New 4L 2025 OUATS
Lake Nona N-S Road Dowden Road Lake Nona E-W Road New 4L 2025 OUATS
Planned Roadway Improvements
Dean Road Curry Ford Rd. Lake Underhill Road Widen to 4L 2025 OUATS
Table 4.5.3-2: Programmed Road Improvements

Orange County, Florida Innovation Way Economic Development & Environmental Resource Management Study
December 2005
179
Future Development Program The Innovation Way study represents a high density mixed use development plan where residential, retail, office, and high-tech employment centers are expected to flourish and serve as the anchor for completing the sustainable community plan envisioned for the area. The Study Area scenarios will provide retail and employment opportunities to the residents of the surrounding communities of east Orange County. Table 4.5.3-3 provides a summary of the development programs for Innovation Way and the other major developments that have approved entitlements. For example, the International Corporate Park DRI, Moss Park Landing DRI, Eagle Creek PD, Lake Hart PD and Kirby Smith PD have approved entitlements that were included in the overall analysis. Traffic Analysis Zones (TAZ) were added to represent corresponding village centers. In order to ensure that land uses are not double counted, existing TAZs that partially or completely overlapped any of the Study Area were reduced or eliminated. At the direction of Orange County staff, the OUATS 2025 Cost Feasible Plan Network and its accompanying ZDATA formed the basis for analyzing the buildout condition. While the current OUATS model does not extend beyond 2025, the build-out is anticipated to extend beyond the 2025 timeframe. As such, the results of the year 2025 analysis represent conditions compatible with the Innovation Way build-out. A straight line market absorption rate was used to generate the interim year 2010 and 2015 development programs for Innovation Way.

Orange County, Florida Innovation Way Economic Development & Environmental Resource Management Study
December 2005
180
Table 4.5.3-3 – Innovation Way Sector Plan Development Program (Activity Village)
Single Family
Multi Family Industrial Commercial/
Retail Office Hotel Rooms High Tech
Project
Corridor -- High Tech - - - - - 1,200 16,361,136
Town Center - 800 544,500 544,500 914,760 - -
Village A 3,280 - - 217,800 108,900 - -
Village B 3,280 - - 217,800 108,900 - -
Village C 1,670 - - 108,900 54,450 - -
Village D 1,670 - - 108,900 54,450 - -
Urban Village 5,168 15,504 - 871,200 435,600 - -
Sub Total 15,068 16,304 544,500 2,069,100 1,677,060 1,200 16,361,136
Non Project
Eagle Creek PD 2,364 550 - 150,000 50,000 150 -
ICP 2,440 1,000 2,836,000 410,000 1,416,700 320 3,030,000
Moss Park Landing DRI 3,349 1,550 - 518,000 1,085,000 1,100 -
Kirby Smith PD 133 - - - - - -Lake Mary Jane & Lake
Whippoorwill Rural Settlements 669 - - - - - -
Lake Hart PD 917 1,082 347,723 261,000 - - -
Sub Total 9,872 4,182 3,183,723 1,339,000 2,551,700 1,570 3,030,000
Extra 460 - - - - - -
Grand Total 25,400 20,486 3,728,223 3,408,100 4,228,760 2,770 19,391,136
Innovation Way Sector Plan - Development Program
Name of the DevelopmentDwelling Units Square Footage
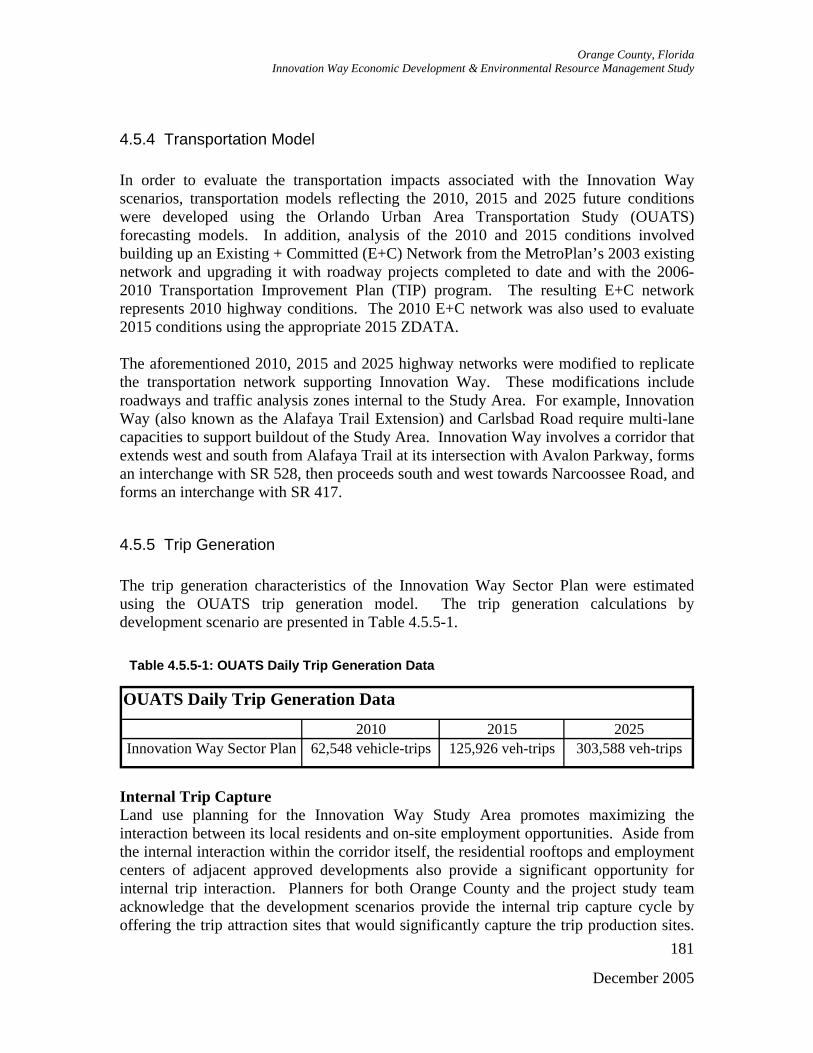
Orange County, Florida Innovation Way Economic Development & Environmental Resource Management Study
December 2005
181
4.5.4 Transportation Model In order to evaluate the transportation impacts associated with the Innovation Way scenarios, transportation models reflecting the 2010, 2015 and 2025 future conditions were developed using the Orlando Urban Area Transportation Study (OUATS) forecasting models. In addition, analysis of the 2010 and 2015 conditions involved building up an Existing + Committed (E+C) Network from the MetroPlan’s 2003 existing network and upgrading it with roadway projects completed to date and with the 2006-2010 Transportation Improvement Plan (TIP) program. The resulting E+C network represents 2010 highway conditions. The 2010 E+C network was also used to evaluate 2015 conditions using the appropriate 2015 ZDATA. The aforementioned 2010, 2015 and 2025 highway networks were modified to replicate the transportation network supporting Innovation Way. These modifications include roadways and traffic analysis zones internal to the Study Area. For example, Innovation Way (also known as the Alafaya Trail Extension) and Carlsbad Road require multi-lane capacities to support buildout of the Study Area. Innovation Way involves a corridor that extends west and south from Alafaya Trail at its intersection with Avalon Parkway, forms an interchange with SR 528, then proceeds south and west towards Narcoossee Road, and forms an interchange with SR 417.
4.5.5 Trip Generation The trip generation characteristics of the Innovation Way Sector Plan were estimated using the OUATS trip generation model. The trip generation calculations by development scenario are presented in Table 4.5.5-1.
2010 2015 2025Innovation Way Sector Plan 62,548 vehicle-trips 125,926 veh-trips 303,588 veh-trips
OUATS Daily Trip Generation Data
Internal Trip Capture Land use planning for the Innovation Way Study Area promotes maximizing the interaction between its local residents and on-site employment opportunities. Aside from the internal interaction within the corridor itself, the residential rooftops and employment centers of adjacent approved developments also provide a significant opportunity for internal trip interaction. Planners for both Orange County and the project study team acknowledge that the development scenarios provide the internal trip capture cycle by offering the trip attraction sites that would significantly capture the trip production sites.
Table 4.5.5-1: OUATS Daily Trip Generation Data

Orange County, Florida Innovation Way Economic Development & Environmental Resource Management Study
December 2005
182
The very essence of promoting internal capture within the Study Area supports Orange County’s rationale for adopting the designated overlay classification for this area. One method of measuring internal trip capture is through the use of the TIPS program developed by the Florida Department of Transportation. The Department developed the TIPS program for the purpose of standardizing the calculation of internal trip capture that a mixed use development, typically a Development of Regional Impact, can use. TIPS was calibrated from data obtained from DRI traffic studies. As such, the highest internal trip capture registered from TIPS is generally limited to DRI data. TIPS does not provide a good tool for measuring internal capture for areas as spread out as the Innovation Way study. An alternative method to measure internal trip capture is through the use of the FSUTMS-based gravity model which combines the interaction between trip productions and trip attractions relative to travel time (or spatial) impedance. For a macro-scale development such as Innovation Way (as opposed to a large-scale DRI-type development) where separation between TAZs is more pronounced, the use of the gravity model based on travel time impedance provides a more useful tool that reflects policy decisions promoting internal trip capture. Based on the 2010, 2015 and 2025 model runs, the following internal trip capture rates applied to Innovation Way analysis: Trip Generation Internal Trips % of Total
Year 2010 62,548 31,805 50.1% Year 2015 125,926 76,294 60.6%
Year 2025 303,588 187,288 61.7% These internal trip capture rates are more in line with the level of interaction expected to occur between the intense complementary residential and employment uses within the Study Area.
4.5.6 Analysis of Future Year Travel Demand Projections Future year traffic volume projections were developed for the interim year 2010, mid-year 2015 and buildout year 2025 development scenarios using the respective ZDATA and highway network models. Since the FSUTMS-based OUATS models produce peak season daily traffic volumes, the model output conversion factor of 0.99 was applied to convert model volumes to annual average daily traffic volumes (AADT). Appropriate K100 and D100 factors were applied to generate directional hourly volumes from AADTs. Directional hourly volumes were compared with the service volume tables from the FDOT Level of Service Quality Handbook to determine the road segment’s level of service operating condition. Orange County acknowledged the urban development activity that will occur with Innovation Way and as such, directed the study team to use urban capacity tables in the analysis of future conditions.
Orange County, Florida Innovation Way Economic Development & Environmental Resource Management Study
December 2005
183
Year 2010 Analysis Table 4.5.6-1 provides a summary of the traffic volume projections on the surrounding roadway network for the year 2010 condition. Figure 4.5.6-1 illustrates these capacity deficient corridors. The following roadway segments are projected to operate beyond their respective level of service operating standards:
• 6-Lane Alafaya Trail between Lake Underhill Road and SR 50 operates at LOS F. • 4-Lane Curry Ford Road between SR 436 and SR 551 operates at LOS F. • 2-Lane Lake Underhill Road between SR 436 and Rouse Road operates at LOS F, • 4-Lane SR 528 (Beachline Expressway) between SR 15 (Narcoossee Road) and
Goldenrod Road operates at LOS E, • 4-Lane SR 528 between SR 417 and SR 520 operates at LOS C, • 2-Lane Narcoossee Road between Osceola County and SR 417 operates at LOS F, • 4-Lane Narcoossee Road between Innovation Way and SR 528 operates at LOS
F, • 6-Lane SR 436 between SR 50 and SR 408 operates at LOS F, • 2-Lane Chickasaw Trail between Curry Ford Road and Lee Vista Blvd. operates
at LOS F, • 2-Lane Econlockhatchee Trail between SR 50 and Valencia College Lane
operates at LOS F, and • 2-Lane SR 15 between SR 436 and SR 551 operates at LOS F.
An analysis of the significance of the year 2010 traffic impacts induced by the Activity Village is presented in Table 4.5.6-2. The Sector Plan is deemed significant if it consumes at least five percent of the acceptable operating capacity of the road. As shown in the table, the Activity Village Scenario has significant impacts on the following capacity deficient roadways:
• Alafaya Trail between SR 50 and Lake Underhill Road, • SR 528 between Narcoossee Road and Goldenroad Road, • Narcoossee Road between Osceola County line and SR 417, and • Narcoossee Road between Innovation Way and SR 528.
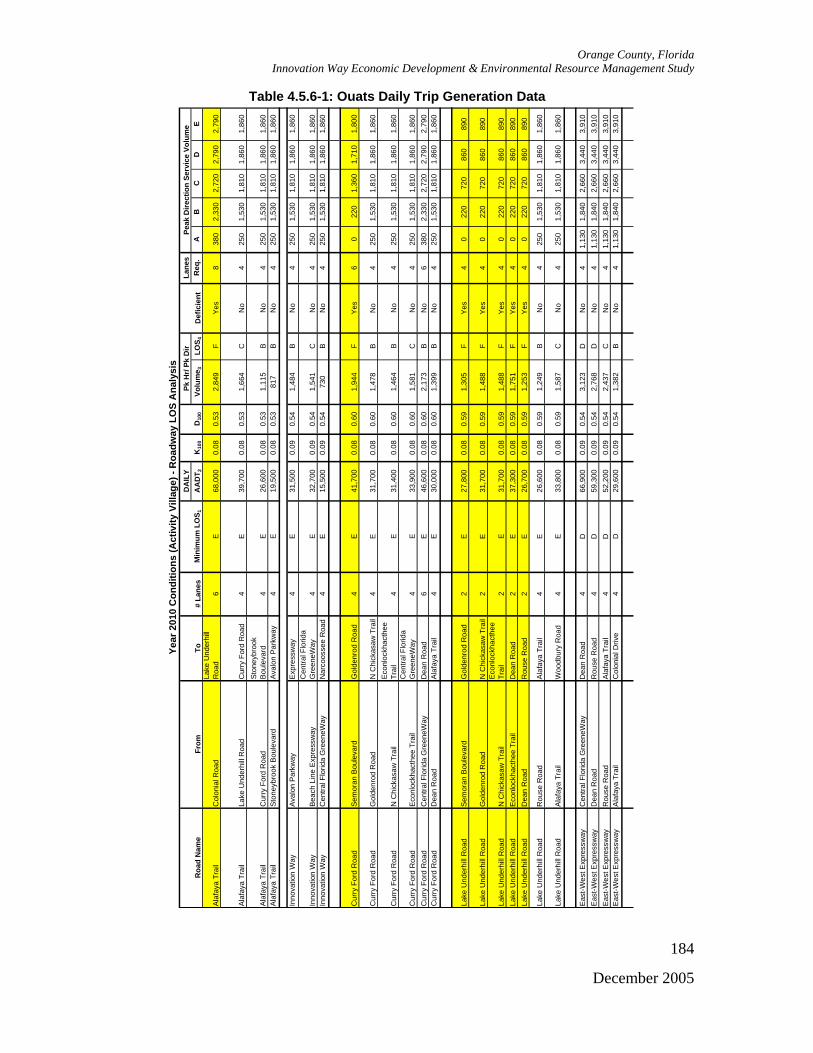
Orange County, Florida Innovation Way Economic Development & Environmental Resource Management Study
December 2005
184
Table 4.5.6-1: Ouats Daily Trip Generation Data
Lane
sA
AD
T 2Vo
lum
e 3LO
S 4R
eq.
AB
CD
E
Ala
faya
Tra
ilC
olon
ial R
oad
Lake
Und
erhi
ll R
oad
6E
68,0
000.
080.
532,
849
FYe
s8
380
2,33
02,
720
2,79
02,
790
Ala
faya
Tra
ilLa
ke U
nder
hill
Roa
dC
urry
For
d R
oad
4E
39,7
000.
080.
531,
664
CN
o4
250
1,53
01,
810
1,86
01,
860
Ala
faya
Tra
ilC
urry
For
d R
oad
Ston
eybr
ook
Boul
evar
d4
E26
,600
0.08
0.53
1,11
5B
No
425
01,
530
1,81
01,
860
1,86
0A
lafa
ya T
rail
Ston
eybr
ook
Boul
evar
dAv
alon
Par
kway
4E
19,5
000.
080.
5381
7B
No
425
01,
530
1,81
01,
860
1,86
0
Inno
vatio
n W
ayAv
alon
Par
kway
Expr
essw
ay4
E31
,500
0.09
0.54
1,48
4B
No
425
01,
530
1,81
01,
860
1,86
0
Inno
vatio
n W
ayBe
ach
Line
Exp
ress
way
Cen
tral F
lorid
a G
reen
eWay
4E
32,7
000.
090.
541,
541
CN
o4
250
1,53
01,
810
1,86
01,
860
Inno
vatio
n W
ayC
entra
l Flo
rida
Gre
eneW
ayN
arco
osse
e R
oad
4E
15,5
000.
090.
5473
0B
No
425
01,
530
1,81
01,
860
1,86
0
Cur
ry F
ord
Roa
dSe
mor
an B
oule
vard
Gol
denr
od R
oad
4E
41,7
000.
080.
601,
944
FYe
s6
022
01,
360
1,71
01,
800
Cur
ry F
ord
Roa
dG
olde
nrod
Roa
dN
Chi
ckas
aw T
rail
4E
31,7
000.
080.
601,
478
BN
o4
250
1,53
01,
810
1,86
01,
860
Cur
ry F
ord
Roa
dN
Chi
ckas
aw T
rail
Eco
nloc
khac
thee
Tr
ail
4E
31,4
000.
080.
601,
464
BN
o4
250
1,53
01,
810
1,86
01,
860
Cur
ry F
ord
Roa
dE
conl
ockh
acth
ee T
rail
Cen
tral F
lorid
a G
reen
eWay
4E
33,9
000.
080.
601,
581
CN
o4
250
1,53
01,
810
1,86
01,
860
Cur
ry F
ord
Roa
dC
entra
l Flo
rida
Gre
eneW
ayD
ean
Roa
d6
E46
,600
0.08
0.60
2,17
3B
No
638
02,
330
2,72
02,
790
2,79
0C
urry
For
d R
oad
Dea
n R
oad
Alaf
aya
Trai
l4
E30
,000
0.08
0.60
1,39
9B
No
425
01,
530
1,81
01,
860
1,86
0
Lake
Und
erhi
ll R
oad
Sem
oran
Bou
leva
rdG
olde
nrod
Roa
d2
E27
,800
0.08
0.59
1,30
5F
Yes
40
220
720
860
890
Lake
Und
erhi
ll R
oad
Gol
denr
od R
oad
N C
hick
asaw
Tra
il2
E31
,700
0.08
0.59
1,48
8F
Yes
40
220
720
860
890
Lake
Und
erhi
ll R
oad
N C
hick
asaw
Tra
ilE
conl
ockh
acth
ee
Trai
l2
E31
,700
0.08
0.59
1,48
8F
Yes
40
220
720
860
890
Lake
Und
erhi
ll R
oad
Eco
nloc
khac
thee
Tra
ilD
ean
Roa
d2
E37
,300
0.08
0.59
1,75
1F
Yes
40
220
720
860
890
Lake
Und
erhi
ll R
oad
Dea
n R
oad
Rou
se R
oad
2E
26,7
000.
080.
591,
253
FY
es4
022
072
086
089
0
Lake
Und
erhi
ll R
oad
Rou
se R
oad
Ala
faya
Tra
il4
E26
,600
0.08
0.59
1,24
9B
No
425
01,
530
1,81
01,
860
1,86
0
Lake
Und
erhi
ll R
oad
Ala
faya
Tra
ilW
oodb
ury
Roa
d4
E33
,800
0.08
0.59
1,58
7C
No
425
01,
530
1,81
01,
860
1,86
0
Eas
t-Wes
t Exp
ress
way
Cen
tral F
lorid
a G
reen
eWay
Dea
n R
oad
4D
66,9
000.
090.
543,
123
DN
o4
1,13
01,
840
2,66
03,
440
3,91
0E
ast-W
est E
xpre
ssw
ayD
ean
Roa
dR
ouse
Roa
d4
D59
,300
0.09
0.54
2,76
8D
No
41,
130
1,84
02,
660
3,44
03,
910
Eas
t-Wes
t Exp
ress
way
Rou
se R
oad
Ala
faya
Tra
il4
D52
,200
0.09
0.54
2,43
7C
No
41,
130
1,84
02,
660
3,44
03,
910
Eas
t-Wes
t Exp
ress
way
Ala
faya
Tra
ilC
olon
ial D
rive
4D
29,6
000.
090.
541,
382
BN
o4
1,13
01,
840
2,66
03,
440
3,91
0
Roa
d N
ame
From
To#
Lane
sM
inim
um L
OS 1
DA
ILY
K10
0D
efic
ient
Year
201
0 C
ondi
tions
(Act
ivity
Vill
age)
- R
oadw
ay L
OS
Ana
lysi
s
D10
0
Pk H
r/ Pk
Dir
Peak
Dire
ctio
n Se
rvic
e Vo
lum
e
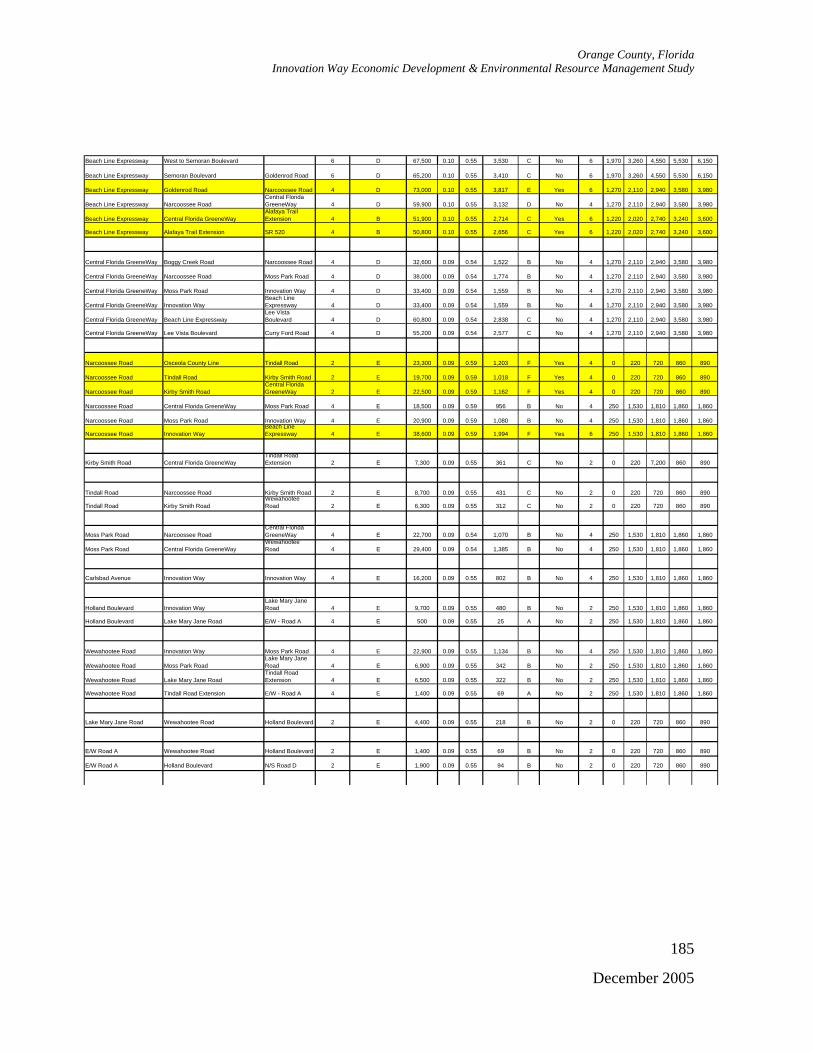
Orange County, Florida Innovation Way Economic Development & Environmental Resource Management Study
December 2005
185
Beach Line Expressway West to Semoran Boulevard 6 D 67,500 0.10 0.55 3,530 C No 6 1,970 3,260 4,550 5,530 6,150
Beach Line Expressway Semoran Boulevard Goldenrod Road 6 D 65,200 0.10 0.55 3,410 C No 6 1,970 3,260 4,550 5,530 6,150
Beach Line Expressway Goldenrod Road Narcoossee Road 4 D 73,000 0.10 0.55 3,817 E Yes 6 1,270 2,110 2,940 3,580 3,980
Beach Line Expressway Narcoossee RoadCentral Florida GreeneWay 4 D 59,900 0.10 0.55 3,132 D No 4 1,270 2,110 2,940 3,580 3,980
Beach Line Expressway Central Florida GreeneWayAlafaya Trail Extension 4 B 51,900 0.10 0.55 2,714 C Yes 6 1,220 2,020 2,740 3,240 3,600
Beach Line Expressway Alafaya Trail Extension SR 520 4 B 50,800 0.10 0.55 2,656 C Yes 6 1,220 2,020 2,740 3,240 3,600
Central Florida GreeneWay Boggy Creek Road Narcoossee Road 4 D 32,600 0.09 0.54 1,522 B No 4 1,270 2,110 2,940 3,580 3,980
Central Florida GreeneWay Narcoossee Road Moss Park Road 4 D 38,000 0.09 0.54 1,774 B No 4 1,270 2,110 2,940 3,580 3,980
Central Florida GreeneWay Moss Park Road Innovation Way 4 D 33,400 0.09 0.54 1,559 B No 4 1,270 2,110 2,940 3,580 3,980
Central Florida GreeneWay Innovation WayBeach Line Expressway 4 D 33,400 0.09 0.54 1,559 B No 4 1,270 2,110 2,940 3,580 3,980
Central Florida GreeneWay Beach Line ExpresswayLee Vista Boulevard 4 D 60,800 0.09 0.54 2,838 C No 4 1,270 2,110 2,940 3,580 3,980
Central Florida GreeneWay Lee Vista Boulevard Curry Ford Road 4 D 55,200 0.09 0.54 2,577 C No 4 1,270 2,110 2,940 3,580 3,980
Narcoossee Road Osceola County Line Tindall Road 2 E 23,300 0.09 0.59 1,203 F Yes 4 0 220 720 860 890
Narcoossee Road Tindall Road Kirby Smith Road 2 E 19,700 0.09 0.59 1,018 F Yes 4 0 220 720 860 890
Narcoossee Road Kirby Smith RoadCentral Florida GreeneWay 2 E 22,500 0.09 0.59 1,162 F Yes 4 0 220 720 860 890
Narcoossee Road Central Florida GreeneWay Moss Park Road 4 E 18,500 0.09 0.59 956 B No 4 250 1,530 1,810 1,860 1,860
Narcoossee Road Moss Park Road Innovation Way 4 E 20,900 0.09 0.59 1,080 B No 4 250 1,530 1,810 1,860 1,860
Narcoossee Road Innovation WayBeach Line Expressway 4 E 38,600 0.09 0.59 1,994 F Yes 6 250 1,530 1,810 1,860 1,860
Kirby Smith Road Central Florida GreeneWayTindall Road Extension 2 E 7,300 0.09 0.55 361 C No 2 0 220 7,200 860 890
Tindall Road Narcoossee Road Kirby Smith Road 2 E 8,700 0.09 0.55 431 C No 2 0 220 720 860 890
Tindall Road Kirby Smith RoadWewahootee Road 2 E 6,300 0.09 0.55 312 C No 2 0 220 720 860 890
Moss Park Road Narcoossee RoadCentral Florida GreeneWay 4 E 22,700 0.09 0.54 1,070 B No 4 250 1,530 1,810 1,860 1,860
Moss Park Road Central Florida GreeneWayWewahootee Road 4 E 29,400 0.09 0.54 1,385 B No 4 250 1,530 1,810 1,860 1,860
Carlsbad Avenue Innovation Way Innovation Way 4 E 16,200 0.09 0.55 802 B No 4 250 1,530 1,810 1,860 1,860
Holland Boulevard Innovation WayLake Mary Jane Road 4 E 9,700 0.09 0.55 480 B No 2 250 1,530 1,810 1,860 1,860
Holland Boulevard Lake Mary Jane Road E/W - Road A 4 E 500 0.09 0.55 25 A No 2 250 1,530 1,810 1,860 1,860
Wewahootee Road Innovation Way Moss Park Road 4 E 22,900 0.09 0.55 1,134 B No 4 250 1,530 1,810 1,860 1,860
Wewahootee Road Moss Park RoadLake Mary Jane Road 4 E 6,900 0.09 0.55 342 B No 2 250 1,530 1,810 1,860 1,860
Wewahootee Road Lake Mary Jane RoadTindall Road Extension 4 E 6,500 0.09 0.55 322 B No 2 250 1,530 1,810 1,860 1,860
Wewahootee Road Tindall Road Extension E/W - Road A 4 E 1,400 0.09 0.55 69 A No 2 250 1,530 1,810 1,860 1,860
Lake Mary Jane Road Wewahootee Road Holland Boulevard 2 E 4,400 0.09 0.55 218 B No 2 0 220 720 860 890
E/W Road A Wewahootee Road Holland Boulevard 2 E 1,400 0.09 0.55 69 B No 2 0 220 720 860 890
E/W Road A Holland Boulevard N/S Road D 2 E 1,900 0.09 0.55 94 B No 2 0 220 720 860 890

Orange County, Florida Innovation Way Economic Development & Environmental Resource Management Study
December 2005
186
E/W
Roa
d B
Inno
vatio
n W
ayIC
P2
E2,
600
0.09
0.55
129
BN
o2
022
072
086
089
0
E/W
Roa
d B
ICP
N/S
Roa
d D
2E
800
0.09
0.55
40B
No
20
220
720
860
890
E/W
Roa
d C
Inno
vatio
n W
ayN
/S R
oad
D2
E2,
900
0.09
0.55
144
BN
o2
022
072
086
089
0
N/S
Roa
d D
E/W
Roa
d B
E/W
Roa
d C
2E
800
0.09
0.55
40B
No
20
220
720
860
890
N/S
Roa
d D
E/W
Roa
d C
E/W
Roa
d A
2E
400
0.09
0.55
20B
No
20
220
720
860
890
Sem
oran
Blv
dC
olon
ial D
rive
East
Wes
t Ex
pres
sway
6E
75,0
000.
070.
552,
877
FY
es8
034
02,
110
2,57
02,
710
Sem
oran
Blv
dEa
st W
est E
xpre
ssw
ayC
urry
For
d R
oad
6E
65,5
000.
070.
552,
513
DN
o6
034
02,
110
2,57
02,
710
Sem
oran
Blv
dC
urry
For
d R
oad
Pers
hing
Ave
.6
E65
,100
0.07
0.55
2,49
8D
No
60
340
2,11
02,
570
2,71
0
Sem
oran
Blv
dPe
rshi
ng A
ve.
Hof
fner
Ave
.6
E71
,800
0.07
0.55
2,75
5D
No
638
02,
330
2,72
02,
790
2,79
0
Sem
oran
Blv
dH
offn
er A
ve.
Lee
Vis
ta
Boul
evar
d6
E67
,000
0.07
0.55
2,57
0C
No
638
02,
330
2,72
02,
790
2,79
0
Sem
oran
Blv
dLe
e Vi
sta
Boul
evar
dBe
achl
ine
Expr
essw
ay6
E70
,500
0.07
0.55
2,70
5C
No
638
02,
330
2,72
02,
790
2,79
0
Gol
denr
od R
oad
Col
onia
l Driv
eEa
st W
est
Expr
essw
ay4
E39
,200
0.07
0.54
1,58
4C
No
425
01,
530
1,81
01,
860
1,86
0
Gol
denr
od R
oad
East
Wes
t Exp
ress
way
Cur
ry F
ord
Roa
d4
E42
,500
0.07
0.54
1,71
8C
No
425
01,
530
1,81
01,
860
1,86
0
Gol
denr
od R
oad
Cur
ry F
ord
Roa
dPe
rshi
ng A
ve.
4E
44,4
000.
070.
541,
795
CN
o4
250
1,53
01,
810
1,86
01,
860
Gol
denr
od R
oad
Pers
hing
Ave
.H
offn
er A
ve.
4E
41,2
000.
070.
541,
665
CN
o4
250
1,53
01,
810
1,86
01,
860
Gol
denr
od R
oad
Hof
fner
Ave
.Le
e V
ista
Bo
ulev
ard
4E
32,2
000.
070.
541,
301
BN
o4
250
1,53
01,
810
1,86
01,
860
N. C
hick
asaw
Tra
ilC
olon
ial D
rive
East
Wes
t Ex
pres
sway
2E
17,5
000.
090.
5381
0D
No
20
220
720
860
890
N. C
hick
asaw
Tra
ilEa
st W
est E
xpre
ssw
ayLa
ke U
nder
hill
Roa
d2
E16
,600
0.09
0.53
769
DN
o2
022
072
086
089
0
N. C
hick
asaw
Tra
ilLa
ke U
nder
hill
Roa
dC
urry
For
d R
oad
2E
18,1
000.
090.
5383
8D
No
20
220
720
860
890
N. C
hick
asaw
Tra
ilC
urry
For
d R
oad
Lee
Vis
ta
Boul
evar
d2
E21
,400
0.09
0.53
991
FY
es4
022
072
086
089
0
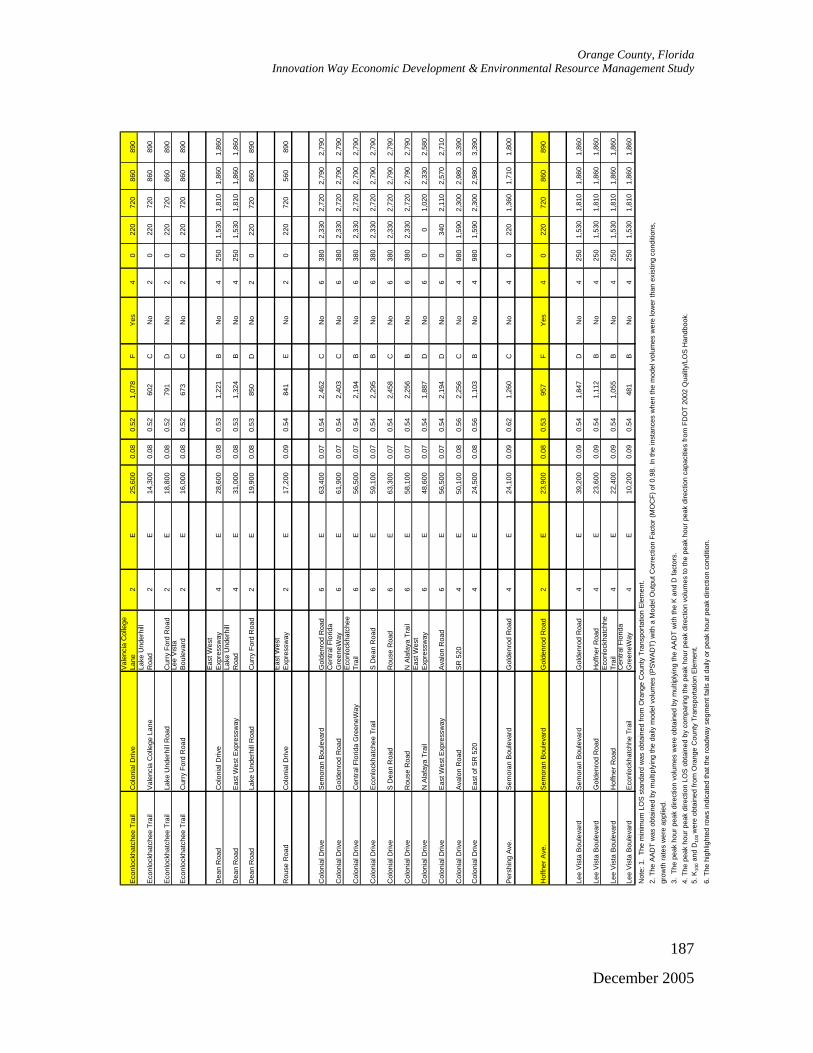
Orange County, Florida Innovation Way Economic Development & Environmental Resource Management Study
December 2005
187
Econ
lock
hatc
hee
Trai
l C
olon
ial D
rive
Vale
ncia
Col
lege
La
ne2
E25
,600
0.08
0.52
1,07
8F
Yes
40
220
720
860
890
Econ
lock
hatc
hee
Trai
l Va
lenc
ia C
olle
ge L
ane
Lake
Und
erhi
ll R
oad
2E
14,3
000.
080.
5260
2C
No
20
220
720
860
890
Econ
lock
hatc
hee
Trai
l La
ke U
nder
hill
Roa
dC
urry
For
d R
oad
2E
18,8
000.
080.
5279
1D
No
20
220
720
860
890
Econ
lock
hatc
hee
Trai
l C
urry
For
d R
oad
Lee
Vis
ta
Boul
evar
d2
E16
,000
0.08
0.52
673
CN
o2
022
072
086
089
0
Dea
n R
oad
Col
onia
l Driv
eE
ast W
est
Expr
essw
ay4
E28
,600
0.08
0.53
1,22
1B
No
425
01,
530
1,81
01,
860
1,86
0
Dea
n R
oad
East
Wes
t Exp
ress
way
Lake
Und
erhi
ll R
oad
4E
31,0
000.
080.
531,
324
BN
o4
250
1,53
01,
810
1,86
01,
860
Dea
n R
oad
Lake
Und
erhi
ll R
oad
Cur
ry F
ord
Roa
d2
E19
,900
0.08
0.53
850
DN
o2
022
072
086
089
0
Rou
se R
oad
Col
onia
l Driv
eE
ast W
est
Expr
essw
ay2
E17
,200
0.09
0.54
841
EN
o2
022
072
056
089
0
Col
onia
l Driv
eS
emor
an B
oule
vard
Gol
denr
od R
oad
6E
63,4
000.
070.
542,
462
CN
o6
380
2,33
02,
720
2,79
02,
790
Col
onia
l Driv
eG
olde
nrod
Roa
dC
entra
l Flo
rida
Gre
eneW
ay6
E61
,900
0.07
0.54
2,40
3C
No
638
02,
330
2,72
02,
790
2,79
0
Col
onia
l Driv
eC
entra
l Flo
rida
Gre
eneW
ayEc
onlo
ckha
tche
e Tr
ail
6E
56,5
000.
070.
542,
194
BN
o6
380
2,33
02,
720
2,79
02,
790
Col
onia
l Driv
eE
conl
ockh
atch
ee T
rail
S D
ean
Roa
d6
E59
,100
0.07
0.54
2,29
5B
No
638
02,
330
2,72
02,
790
2,79
0
Col
onia
l Driv
eS
Dea
n R
oad
Rou
se R
oad
6E
63,3
000.
070.
542,
458
CN
o6
380
2,33
02,
720
2,79
02,
790
Col
onia
l Driv
eR
ouse
Roa
dN
Ala
faya
Tra
il6
E58
,100
0.07
0.54
2,25
6B
No
638
02,
330
2,72
02,
790
2,79
0
Col
onia
l Driv
eN
Ala
faya
Tra
ilE
ast W
est
Expr
essw
ay6
E48
,600
0.07
0.54
1,88
7D
No
60
01,
020
2,33
02,
580
Col
onia
l Driv
eE
ast W
est E
xpre
ssw
ayAv
alon
Roa
d6
E56
,500
0.07
0.54
2,19
4D
No
60
340
2,11
02,
570
2,71
0
Col
onia
l Driv
eA
valo
n R
oad
SR 5
204
E50
,100
0.08
0.56
2,25
6C
No
498
01,
590
2,30
02,
980
3,39
0
Col
onia
l Driv
eE
ast o
f SR
520
4E
24,5
000.
080.
561,
103
BN
o4
980
1,59
02,
300
2,98
03,
390
Pers
hing
Ave
.Se
mor
an B
oule
vard
Gol
denr
od R
oad
4E
24,1
000.
090.
621,
260
CN
o4
022
01,
360
1,71
01,
800
Hof
fner
Ave
.Se
mor
an B
oule
vard
Gol
denr
od R
oad
2E
23,9
000.
080.
5395
7F
Yes
40
220
720
860
890
Lee
Vist
a Bo
ulev
ard
Sem
oran
Bou
leva
rdG
olde
nrod
Roa
d4
E39
,200
0.09
0.54
1,84
7D
No
425
01,
530
1,81
01,
860
1,86
0
Lee
Vist
a Bo
ulev
ard
Gol
denr
od R
oad
Hof
fner
Roa
d4
E23
,600
0.09
0.54
1,11
2B
No
425
01,
530
1,81
01,
860
1,86
0
Lee
Vist
a Bo
ulev
ard
Hof
fner
Roa
dEc
onlo
ckha
tchh
e Tr
ail
4E
22,4
000.
090.
541,
055
BN
o4
250
1,53
01,
810
1,86
01,
860
Lee
Vist
a Bo
ulev
ard
Eco
nloc
khat
chhe
Tra
ilC
entra
l Flo
rida
Gre
eneW
ay4
E10
,200
0.09
0.54
481
BN
o4
250
1,53
01,
810
1,86
01,
860
Not
e: 1
. Th
e m
inim
um L
OS
stan
dard
was
obt
aine
d fro
m O
rang
e C
ount
y Tr
ansp
orta
tion
Elem
ent.
2. T
he A
ADT
was
obt
aine
d by
mul
tiply
ing
the
daily
mod
el v
olum
es (P
SWAD
T) w
ith a
Mod
el O
utpu
t Cor
rect
ion
Fact
or (M
OC
F) o
f 0.9
8. In
the
inst
ance
s w
hen
the
mod
el v
olum
es w
ere
low
er th
an e
xist
ing
cond
ition
s,
grow
th ra
tes
wer
e ap
plie
d.3.
The
pea
k ho
ur p
eak
dire
ctio
n vo
lum
es w
ere
obta
ined
by
mul
tiply
ing
the
AAD
T w
ith th
e K
and
D fa
ctor
s.
4. T
he p
eak
hour
pea
k di
rect
ion
LOS
obta
ined
by
com
parin
g th
e pe
ak h
our p
eak
dire
ctio
n vo
lum
es to
the
peak
hou
r pea
k di
rect
ion
capa
citie
s fro
m F
DO
T 20
02 Q
ualit
y/LO
S H
andb
ook.
5. K
100 a
nd D
100 w
ere
obta
ined
from
Ora
nge
Cou
nty
Tran
spor
tatio
n El
emen
t.
6. T
he h
ighl
ight
ed ro
ws
indi
cate
d th
at th
e ro
adw
ay s
egm
ent f
ails
at d
aily
or p
eak
hour
pea
k di
rect
ion
cond
ition
.

Orange County, Florida Innovation Way Economic Development & Environmental Resource Management Study
December 2005
188
Figure 4.5.6-1: 2010 Roadway Needs Analysis
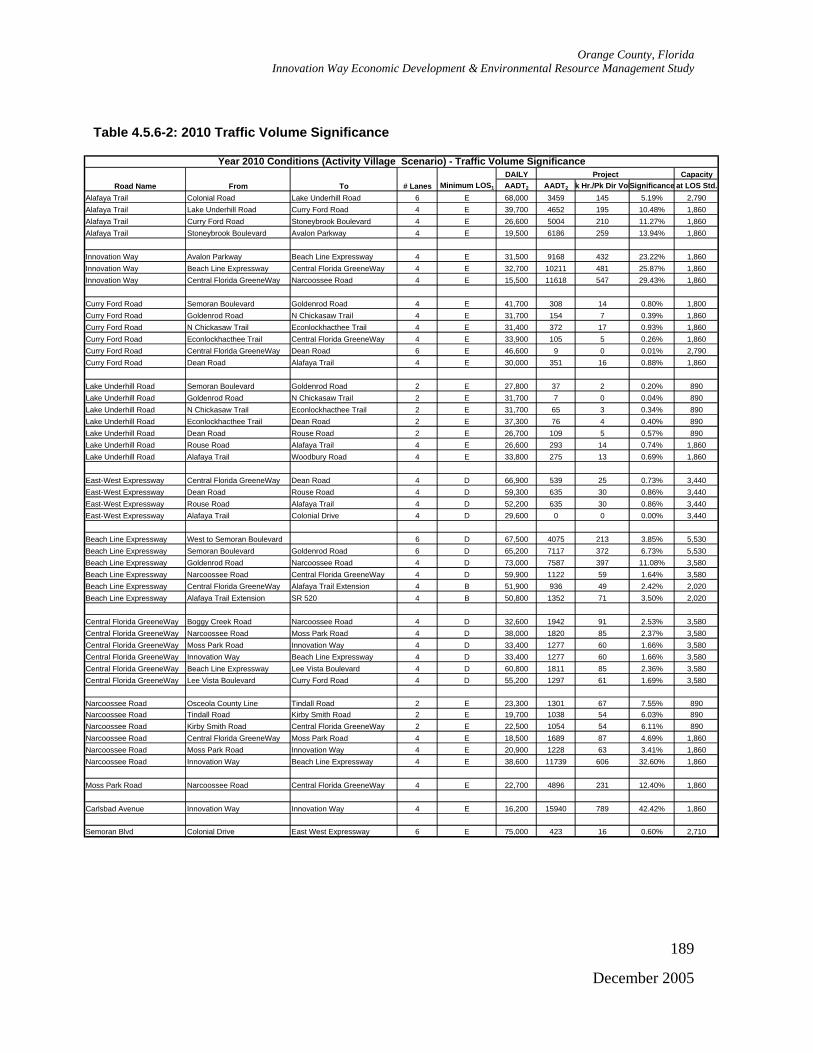
Orange County, Florida Innovation Way Economic Development & Environmental Resource Management Study
December 2005
189
CapacityAADT2 AADT2 k Hr./Pk Dir VolSignificance at LOS Std.
Alafaya Trail Colonial Road Lake Underhill Road 6 E 68,000 3459 145 5.19% 2,790Alafaya Trail Lake Underhill Road Curry Ford Road 4 E 39,700 4652 195 10.48% 1,860Alafaya Trail Curry Ford Road Stoneybrook Boulevard 4 E 26,600 5004 210 11.27% 1,860Alafaya Trail Stoneybrook Boulevard Avalon Parkway 4 E 19,500 6186 259 13.94% 1,860
Innovation Way Avalon Parkway Beach Line Expressway 4 E 31,500 9168 432 23.22% 1,860Innovation Way Beach Line Expressway Central Florida GreeneWay 4 E 32,700 10211 481 25.87% 1,860Innovation Way Central Florida GreeneWay Narcoossee Road 4 E 15,500 11618 547 29.43% 1,860
Curry Ford Road Semoran Boulevard Goldenrod Road 4 E 41,700 308 14 0.80% 1,800Curry Ford Road Goldenrod Road N Chickasaw Trail 4 E 31,700 154 7 0.39% 1,860Curry Ford Road N Chickasaw Trail Econlockhacthee Trail 4 E 31,400 372 17 0.93% 1,860Curry Ford Road Econlockhacthee Trail Central Florida GreeneWay 4 E 33,900 105 5 0.26% 1,860Curry Ford Road Central Florida GreeneWay Dean Road 6 E 46,600 9 0 0.01% 2,790Curry Ford Road Dean Road Alafaya Trail 4 E 30,000 351 16 0.88% 1,860
Lake Underhill Road Semoran Boulevard Goldenrod Road 2 E 27,800 37 2 0.20% 890Lake Underhill Road Goldenrod Road N Chickasaw Trail 2 E 31,700 7 0 0.04% 890Lake Underhill Road N Chickasaw Trail Econlockhacthee Trail 2 E 31,700 65 3 0.34% 890Lake Underhill Road Econlockhacthee Trail Dean Road 2 E 37,300 76 4 0.40% 890Lake Underhill Road Dean Road Rouse Road 2 E 26,700 109 5 0.57% 890Lake Underhill Road Rouse Road Alafaya Trail 4 E 26,600 293 14 0.74% 1,860Lake Underhill Road Alafaya Trail Woodbury Road 4 E 33,800 275 13 0.69% 1,860
East-West Expressway Central Florida GreeneWay Dean Road 4 D 66,900 539 25 0.73% 3,440East-West Expressway Dean Road Rouse Road 4 D 59,300 635 30 0.86% 3,440East-West Expressway Rouse Road Alafaya Trail 4 D 52,200 635 30 0.86% 3,440East-West Expressway Alafaya Trail Colonial Drive 4 D 29,600 0 0 0.00% 3,440
Beach Line Expressway West to Semoran Boulevard 6 D 67,500 4075 213 3.85% 5,530Beach Line Expressway Semoran Boulevard Goldenrod Road 6 D 65,200 7117 372 6.73% 5,530Beach Line Expressway Goldenrod Road Narcoossee Road 4 D 73,000 7587 397 11.08% 3,580Beach Line Expressway Narcoossee Road Central Florida GreeneWay 4 D 59,900 1122 59 1.64% 3,580Beach Line Expressway Central Florida GreeneWay Alafaya Trail Extension 4 B 51,900 936 49 2.42% 2,020Beach Line Expressway Alafaya Trail Extension SR 520 4 B 50,800 1352 71 3.50% 2,020
Central Florida GreeneWay Boggy Creek Road Narcoossee Road 4 D 32,600 1942 91 2.53% 3,580Central Florida GreeneWay Narcoossee Road Moss Park Road 4 D 38,000 1820 85 2.37% 3,580Central Florida GreeneWay Moss Park Road Innovation Way 4 D 33,400 1277 60 1.66% 3,580Central Florida GreeneWay Innovation Way Beach Line Expressway 4 D 33,400 1277 60 1.66% 3,580Central Florida GreeneWay Beach Line Expressway Lee Vista Boulevard 4 D 60,800 1811 85 2.36% 3,580Central Florida GreeneWay Lee Vista Boulevard Curry Ford Road 4 D 55,200 1297 61 1.69% 3,580
Narcoossee Road Osceola County Line Tindall Road 2 E 23,300 1301 67 7.55% 890Narcoossee Road Tindall Road Kirby Smith Road 2 E 19,700 1038 54 6.03% 890Narcoossee Road Kirby Smith Road Central Florida GreeneWay 2 E 22,500 1054 54 6.11% 890Narcoossee Road Central Florida GreeneWay Moss Park Road 4 E 18,500 1689 87 4.69% 1,860Narcoossee Road Moss Park Road Innovation Way 4 E 20,900 1228 63 3.41% 1,860Narcoossee Road Innovation Way Beach Line Expressway 4 E 38,600 11739 606 32.60% 1,860
Moss Park Road Narcoossee Road Central Florida GreeneWay 4 E 22,700 4896 231 12.40% 1,860
Carlsbad Avenue Innovation Way Innovation Way 4 E 16,200 15940 789 42.42% 1,860
Semoran Blvd Colonial Drive East West Expressway 6 E 75,000 423 16 0.60% 2,710
Year 2010 Conditions (Activity Village Scenario) - Traffic Volume Significance
Road Name From To # Lanes Minimum LOS1
DAILY Project
Table 4.5.6-2: 2010 Traffic Volume Significance
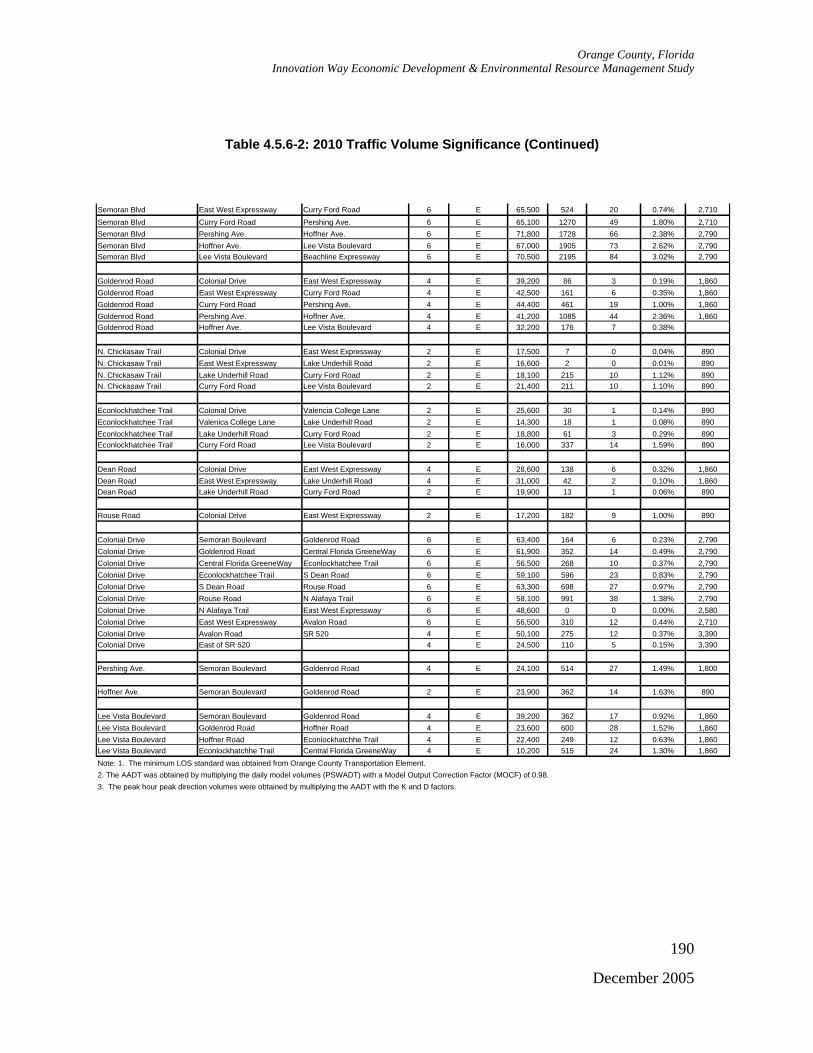
Orange County, Florida Innovation Way Economic Development & Environmental Resource Management Study
December 2005
190
Semoran Blvd East West Expressway Curry Ford Road 6 E 65,500 524 20 0.74% 2,710Semoran Blvd Curry Ford Road Pershing Ave. 6 E 65,100 1270 49 1.80% 2,710Semoran Blvd Pershing Ave. Hoffner Ave. 6 E 71,800 1728 66 2.38% 2,790Semoran Blvd Hoffner Ave. Lee Vista Boulevard 6 E 67,000 1905 73 2.62% 2,790Semoran Blvd Lee Vista Boulevard Beachline Expressway 6 E 70,500 2195 84 3.02% 2,790
Goldenrod Road Colonial Drive East West Expressway 4 E 39,200 86 3 0.19% 1,860Goldenrod Road East West Expressway Curry Ford Road 4 E 42,500 161 6 0.35% 1,860Goldenrod Road Curry Ford Road Pershing Ave. 4 E 44,400 461 19 1.00% 1,860Goldenrod Road Pershing Ave. Hoffner Ave. 4 E 41,200 1085 44 2.36% 1,860Goldenrod Road Hoffner Ave. Lee Vista Boulevard 4 E 32,200 176 7 0.38%
N. Chickasaw Trail Colonial Drive East West Expressway 2 E 17,500 7 0 0.04% 890N. Chickasaw Trail East West Expressway Lake Underhill Road 2 E 16,600 2 0 0.01% 890N. Chickasaw Trail Lake Underhill Road Curry Ford Road 2 E 18,100 215 10 1.12% 890N. Chickasaw Trail Curry Ford Road Lee Vista Boulevard 2 E 21,400 211 10 1.10% 890
Econlockhatchee Trail Colonial Drive Valencia College Lane 2 E 25,600 30 1 0.14% 890Econlockhatchee Trail Valenica College Lane Lake Underhill Road 2 E 14,300 18 1 0.08% 890Econlockhatchee Trail Lake Underhill Road Curry Ford Road 2 E 18,800 61 3 0.29% 890Econlockhatchee Trail Curry Ford Road Lee Vista Boulevard 2 E 16,000 337 14 1.59% 890
Dean Road Colonial Drive East West Expressway 4 E 28,600 138 6 0.32% 1,860Dean Road East West Expressway Lake Underhill Road 4 E 31,000 42 2 0.10% 1,860Dean Road Lake Underhill Road Curry Ford Road 2 E 19,900 13 1 0.06% 890
Rouse Road Colonial Drive East West Expressway 2 E 17,200 182 9 1.00% 890
Colonial Drive Semoran Boulevard Goldenrod Road 6 E 63,400 164 6 0.23% 2,790Colonial Drive Goldenrod Road Central Florida GreeneWay 6 E 61,900 352 14 0.49% 2,790Colonial Drive Central Florida GreeneWay Econlockhatchee Trail 6 E 56,500 268 10 0.37% 2,790Colonial Drive Econlockhatchee Trail S Dean Road 6 E 59,100 596 23 0.83% 2,790Colonial Drive S Dean Road Rouse Road 6 E 63,300 698 27 0.97% 2,790Colonial Drive Rouse Road N Alafaya Trail 6 E 58,100 991 38 1.38% 2,790Colonial Drive N Alafaya Trail East West Expressway 6 E 48,600 0 0 0.00% 2,580Colonial Drive East West Expressway Avalon Road 6 E 56,500 310 12 0.44% 2,710Colonial Drive Avalon Road SR 520 4 E 50,100 275 12 0.37% 3,390Colonial Drive East of SR 520 4 E 24,500 110 5 0.15% 3,390
Pershing Ave. Semoran Boulevard Goldenrod Road 4 E 24,100 514 27 1.49% 1,800
Hoffner Ave. Semoran Boulevard Goldenrod Road 2 E 23,900 362 14 1.63% 890
Lee Vista Boulevard Semoran Boulevard Goldenrod Road 4 E 39,200 362 17 0.92% 1,860Lee Vista Boulevard Goldenrod Road Hoffner Road 4 E 23,600 600 28 1.52% 1,860Lee Vista Boulevard Hoffner Road Econlockhatchhe Trail 4 E 22,400 249 12 0.63% 1,860Lee Vista Boulevard Econlockhatchhe Trail Central Florida GreeneWay 4 E 10,200 515 24 1.30% 1,860Note: 1. The minimum LOS standard was obtained from Orange County Transportation Element.2. The AADT was obtained by multiplying the daily model volumes (PSWADT) with a Model Output Correction Factor (MOCF) of 0.98.3. The peak hour peak direction volumes were obtained by multiplying the AADT with the K and D factors.
Table 4.5.6-2: 2010 Traffic Volume Significance (Continued)

Orange County, Florida Innovation Way Economic Development & Environmental Resource Management Study
December 2005
191
Year 2015 Analysis Table 4.5.6-3 provides a summary of the traffic volume projections on the surrounding roadway network for the year 2015 condition. Table 4.5.6-4 shows the analysis for significant impacts determined at the 5 percent minimum level. Figure 4.5.6-2 illustrates these capacity deficient corridors. In addition to the failing roadway segments listed under the 2010 analysis, the following roadway segments are projected to operate beyond their respective level of service operating standards in the year 2015:
• 4-Lane Innovation Way between Avalon Parkway and SR 417 operates at LOS F, • 4-Lane SR 528 (Beachline Expressway) between SR 436 and Goldenrod Road
operates at LOS E, • 4-Lane SR 528 between SR 15 and SR 417 operates at LOS E, • 4-Lane SR 528 between SR 417 and SR 520 operates at LOS D, • 6-Lane SR 436 between Pershing Avenue and Hoffner Avenue operates at LOS F, • 2-Lane Chickasaw Trail between Curry Ford Road and Lake Underhill Road
operates at LOS F, • 2-Lane Econlockhatchee Trail between Curry Ford Road and Lee Vista Boulevard
operates at LOS F, • 2-Lane Dean Road between Lake Underhill Road and Curry Ford Road operates
at LOS F, • 2-Lane Rouse Road between SR 50 and SR 408 operates at LOS F, and • 4-Lane Lee Vista Blvd. between SR 436 and SR 551 operates at LOS F.
An analysis of the significance of the year 2015 traffic impacts induced by Innovation Way is presented in Table 4.5.6-4. In addition to the significant impacts identified in the 2010 scenario, the Sector Plan has significant impacts on the following capacity deficient roadways in the year 2015:
• Alafaya Trail between SR 50 and Lake Underhill Road • Innovation Way between Avalon Parkway and SR 417, • SR 528 between SR 436 and Innovation Way, • Narcoossee Road between Osceola Parkway and SR 417, and • Narcoossee Road between Innovation Way and SR 528.
Except for Innovation Way and portions of SR 528, all these capacity-deficient roadway segments with significant impacts are carried over from the year 2010 analysis.
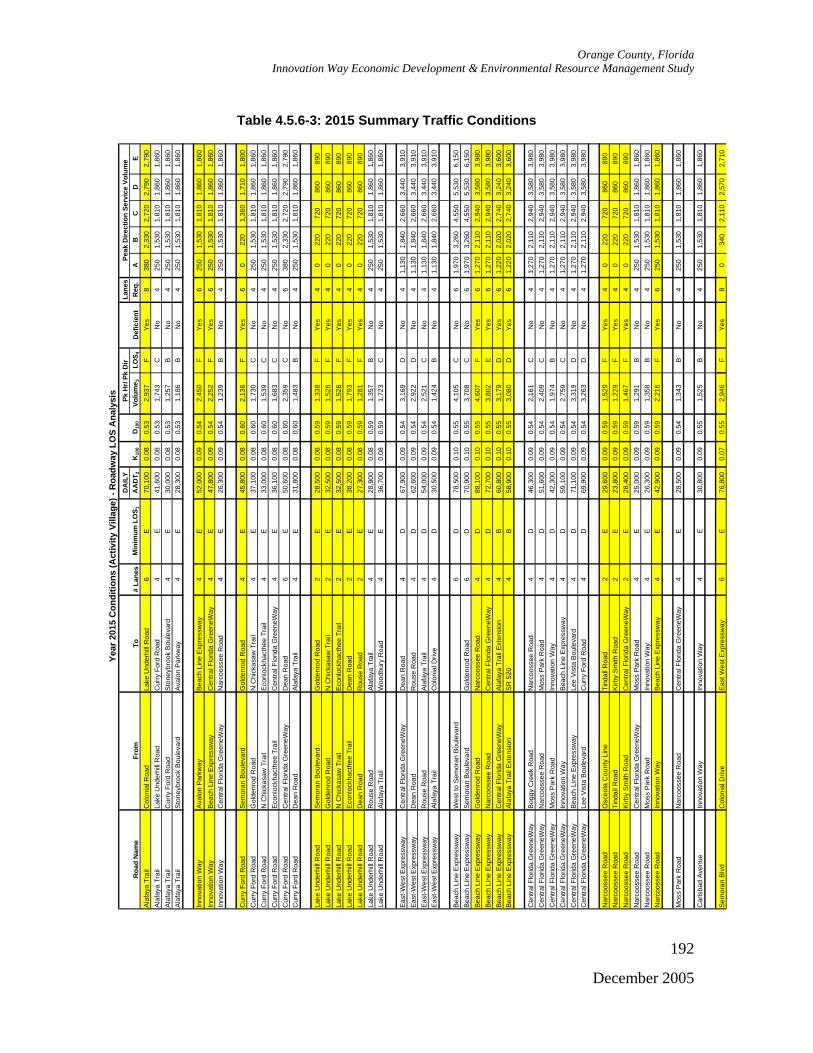
Orange County, Florida Innovation Way Economic Development & Environmental Resource Management Study
December 2005
192
Lane
sA
AD
T 2Vo
lum
e 3LO
S 4R
eq.
AB
CD
EAl
afay
a Tr
ail
Col
onia
l Roa
dLa
ke U
nder
hill
Roa
d6
E70
,100
0.08
0.53
2,93
7F
Yes
838
02,
330
2,72
02,
790
2,79
0Al
afay
a Tr
ail
Lake
Und
erhi
ll R
oad
Cur
ry F
ord
Roa
d4
E41
,600
0.08
0.53
1,74
3C
No
425
01,
530
1,81
01,
860
1,86
0Al
afay
a Tr
ail
Cur
ry F
ord
Roa
dSt
oney
broo
k Bo
ulev
ard
4E
30,0
000.
080.
531,
257
BN
o4
250
1,53
01,
810
1,86
01,
860
Alaf
aya
Trai
l St
oney
broo
k Bo
ulev
ard
Ava
lon
Park
way
4E
28,3
000.
080.
531,
186
BN
o4
250
1,53
01,
810
1,86
01,
860
Inno
vatio
n W
ayA
valo
n Pa
rkw
ayB
each
Lin
e Ex
pres
sway
4E
52,0
000.
090.
542,
450
FYe
s6
250
1,53
01,
810
1,86
01,
860
Inno
vatio
n W
ayB
each
Lin
e Ex
pres
sway
Cen
tral F
lorid
a G
reen
eWay
4E
47,8
000.
090.
542,
252
FYe
s6
250
1,53
01,
810
1,86
01,
860
Inno
vatio
n W
ayC
entra
l Flo
rida
Gre
eneW
ayN
arco
osse
e R
oad
4E
26,3
000.
090.
541,
239
BN
o4
250
1,53
01,
810
1,86
01,
860
Cur
ry F
ord
Roa
dSe
mor
an B
oule
vard
Gol
denr
od R
oad
4E
45,8
000.
080.
602,
136
FYe
s6
022
01,
360
1,71
01,
800
Cur
ry F
ord
Roa
dG
olde
nrod
Roa
dN
Chi
ckas
aw T
rail
4E
37,1
000.
080.
601,
730
CN
o4
250
1,53
01,
810
1,86
01,
860
Cur
ry F
ord
Roa
dN
Chi
ckas
aw T
rail
Eco
nloc
khac
thee
Tra
il4
E33
,000
0.08
0.60
1,53
9C
No
425
01,
530
1,81
01,
860
1,86
0C
urry
For
d R
oad
Econ
lock
hact
hee
Trai
lC
entra
l Flo
rida
Gre
eneW
ay4
E36
,100
0.08
0.60
1,68
3C
No
425
01,
530
1,81
01,
860
1,86
0C
urry
For
d R
oad
Cen
tral F
lorid
a G
reen
eWay
Dea
n R
oad
6E
50,6
000.
080.
602,
359
CN
o6
380
2,33
02,
720
2,79
02,
790
Cur
ry F
ord
Roa
dD
ean
Roa
dAl
afay
a Tr
ail
4E
31,8
000.
080.
601,
483
BN
o4
250
1,53
01,
810
1,86
01,
860
Lake
Und
erhi
ll R
oad
Sem
oran
Bou
leva
rdG
olde
nrod
Roa
d2
E28
,500
0.08
0.59
1,33
8F
Yes
40
220
720
860
890
Lake
Und
erhi
ll R
oad
Gol
denr
od R
oad
N C
hick
asaw
Tra
il2
E32
,500
0.08
0.59
1,52
6F
Yes
40
220
720
860
890
Lake
Und
erhi
ll R
oad
N C
hick
asaw
Tra
ilE
conl
ockh
acth
ee T
rail
2E
32,5
000.
080.
591,
526
FYe
s4
022
072
086
089
0La
ke U
nder
hill
Roa
dEc
onlo
ckha
cthe
e Tr
ail
Dea
n R
oad
2E
38,2
000.
080.
591,
793
FYe
s4
022
072
086
089
0La
ke U
nder
hill
Roa
dD
ean
Roa
dR
ouse
Roa
d2
E27
,300
0.08
0.59
1,28
1F
Yes
40
220
720
860
890
Lake
Und
erhi
ll R
oad
Rou
se R
oad
Alaf
aya
Trai
l4
E28
,900
0.08
0.59
1,35
7B
No
425
01,
530
1,81
01,
860
1,86
0La
ke U
nder
hill
Roa
dAl
afay
a Tr
ail
Woo
dbur
y R
oad
4E
36,7
000.
080.
591,
723
CN
o4
250
1,53
01,
810
1,86
01,
860
East
-Wes
t Exp
ress
way
Cen
tral F
lorid
a G
reen
eWay
Dea
n R
oad
4D
67,9
000.
090.
543,
169
DN
o4
1,13
01,
840
2,66
03,
440
3,91
0Ea
st-W
est E
xpre
ssw
ayD
ean
Roa
dR
ouse
Roa
d4
D62
,600
0.09
0.54
2,92
2D
No
41,
130
1,84
02,
660
3,44
03,
910
East
-Wes
t Exp
ress
way
Rou
se R
oad
Alaf
aya
Trai
l4
D54
,000
0.09
0.54
2,52
1C
No
41,
130
1,84
02,
660
3,44
03,
910
East
-Wes
t Exp
ress
way
Alaf
aya
Trai
lC
olon
ial D
rive
4D
30,5
000.
090.
541,
424
BN
o4
1,13
01,
840
2,66
03,
440
3,91
0
Beac
h Li
ne E
xpre
ssw
ayW
est t
o Se
mor
an B
oule
vard
6D
78,5
000.
100.
554,
105
CN
o6
1,97
03,
260
4,55
05,
530
6,15
0Be
ach
Line
Exp
ress
way
Sem
oran
Bou
leva
rdG
olde
nrod
Roa
d6
D70
,900
0.10
0.55
3,70
8C
No
61,
970
3,26
04,
550
5,53
06,
150
Beac
h Li
ne E
xpre
ssw
ayG
olde
nrod
Roa
dN
arco
osse
e R
oad
4D
88,1
000.
100.
554,
607
FYe
s6
1,27
02,
110
2,94
03,
580
3,98
0Be
ach
Line
Exp
ress
way
Nar
coos
see
Roa
dC
entra
l Flo
rida
Gre
eneW
ay4
D72
,700
0.10
0.55
3,80
2E
Yes
61,
270
2,11
02,
940
3,58
03,
980
Beac
h Li
ne E
xpre
ssw
ayC
entra
l Flo
rida
Gre
eneW
ayAl
afay
a Tr
ail E
xten
sion
4B
60,8
000.
100.
553,
179
DYe
s6
1,22
02,
020
2,74
03,
240
3,60
0Be
ach
Line
Exp
ress
way
Alaf
aya
Trai
l Ext
ensi
onS
R 5
204
B58
,900
0.10
0.55
3,08
0D
Yes
61,
220
2,02
02,
740
3,24
03,
600
Cen
tral F
lorid
a G
reen
eWay
Bog
gy C
reek
Roa
dN
arco
osse
e R
oad
4D
46,3
000.
090.
542,
161
CN
o4
1,27
02,
110
2,94
03,
580
3,98
0C
entra
l Flo
rida
Gre
eneW
ayN
arco
osse
e R
oad
Mos
s Pa
rk R
oad
4D
51,6
000.
090.
542,
409
CN
o4
1,27
02,
110
2,94
03,
580
3,98
0C
entra
l Flo
rida
Gre
eneW
ayM
oss
Park
Roa
dIn
nova
tion
Way
4D
42,3
000.
090.
541,
974
BN
o4
1,27
02,
110
2,94
03,
580
3,98
0C
entra
l Flo
rida
Gre
eneW
ayIn
nova
tion
Way
Bea
ch L
ine
Expr
essw
ay4
D59
,100
0.09
0.54
2,75
9C
No
41,
270
2,11
02,
940
3,58
03,
980
Cen
tral F
lorid
a G
reen
eWay
Bea
ch L
ine
Expr
essw
ayLe
e Vi
sta
Boul
evar
d4
D71
,100
0.09
0.54
3,31
9D
No
41,
270
2,11
02,
940
3,58
03,
980
Cen
tral F
lorid
a G
reen
eWay
Lee
Vist
a Bo
ulev
ard
Cur
ry F
ord
Roa
d4
D69
,900
0.09
0.54
3,26
3D
No
41,
270
2,11
02,
940
3,58
03,
980
Nar
coos
see
Roa
dO
sceo
la C
ount
y Li
neTi
ndal
l Roa
d2
E29
,600
0.09
0.59
1,52
9F
Yes
40
220
720
860
890
Nar
coos
see
Roa
dTi
ndal
l Roa
dKi
rby
Smith
Roa
d2
E23
,800
0.09
0.59
1,22
9F
Yes
40
220
720
860
890
Nar
coos
see
Roa
dKi
rby
Smith
Roa
dC
entra
l Flo
rida
Gre
eneW
ay2
E28
,400
0.09
0.59
1,46
7F
Yes
40
220
720
860
890
Nar
coos
see
Roa
dC
entra
l Flo
rida
Gre
eneW
ayM
oss
Park
Roa
d4
E25
,000
0.09
0.59
1,29
1B
No
425
01,
530
1,81
01,
860
1,86
0N
arco
osse
e R
oad
Mos
s Pa
rk R
oad
Inno
vatio
n W
ay4
E26
,300
0.09
0.59
1,35
8B
No
425
01,
530
1,81
01,
860
1,86
0N
arco
osse
e R
oad
Inno
vatio
n W
ayB
each
Lin
e Ex
pres
sway
4E
42,9
000.
090.
592,
216
FYe
s6
250
1,53
01,
810
1,86
01,
860
Mos
s Pa
rk R
oad
Nar
coos
see
Roa
dC
entra
l Flo
rida
Gre
eneW
ay4
E28
,500
0.09
0.54
1,34
3B
No
425
01,
530
1,81
01,
860
1,86
0
Car
lsba
d Av
enue
Inno
vatio
n W
ayIn
nova
tion
Way
4E
30,8
000.
090.
551,
525
BN
o4
250
1,53
01,
810
1,86
01,
860
Sem
oran
Blv
dC
olon
ial D
rive
Eas
t Wes
t Exp
ress
way
6E
76,8
000.
070.
552,
946
FYe
s8
034
02,
110
2,57
02,
710
Year
201
5 C
ondi
tions
(Act
ivity
Vill
age)
- R
oadw
ay L
OS
Ana
lysi
s
Roa
d N
ame
From
To#
Lane
sM
inim
um L
OS 1
DA
ILY
K10
0D
100
Pk H
r/ Pk
Dir
Peak
Dire
ctio
n Se
rvic
e Vo
lum
eD
efic
ient
Table 4.5.6-3: 2015 Summary Traffic Conditions
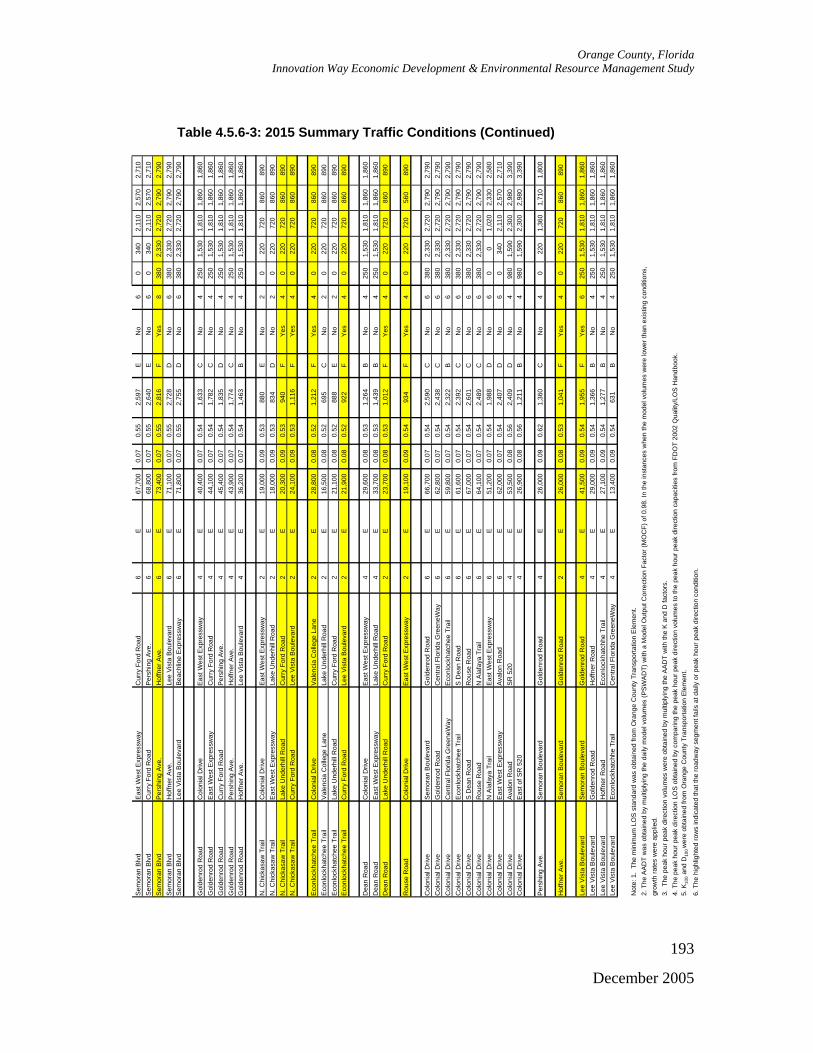
Orange County, Florida Innovation Way Economic Development & Environmental Resource Management Study
December 2005
193
Sem
oran
Blv
dE
ast W
est E
xpre
ssw
ayC
urry
For
d R
oad
6E
67,7
000.
070.
552,
597
EN
o6
034
02,
110
2,57
02,
710
Sem
oran
Blv
dC
urry
For
d R
oad
Per
shin
g Av
e.6
E68
,800
0.07
0.55
2,64
0E
No
60
340
2,11
02,
570
2,71
0S
emor
an B
lvd
Per
shin
g A
ve.
Hof
fner
Ave
.6
E73
,400
0.07
0.55
2,81
6F
Yes
838
02,
330
2,72
02,
790
2,79
0S
emor
an B
lvd
Hof
fner
Ave
.Le
e V
ista
Bou
leva
rd6
E71
,100
0.07
0.55
2,72
8D
No
638
02,
330
2,72
02,
790
2,79
0S
emor
an B
lvd
Lee
Vist
a B
oule
vard
Bea
chlin
e E
xpre
ssw
ay6
E71
,800
0.07
0.55
2,75
5D
No
638
02,
330
2,72
02,
790
2,79
0
Gol
denr
od R
oad
Col
onia
l Driv
eE
ast W
est E
xpre
ssw
ay4
E40
,400
0.07
0.54
1,63
3C
No
425
01,
530
1,81
01,
860
1,86
0G
olde
nrod
Roa
dE
ast W
est E
xpre
ssw
ayC
urry
For
d R
oad
4E
44,1
000.
070.
541,
782
CN
o4
250
1,53
01,
810
1,86
01,
860
Gol
denr
od R
oad
Cur
ry F
ord
Roa
dP
ersh
ing
Ave.
4E
45,4
000.
070.
541,
835
DN
o4
250
1,53
01,
810
1,86
01,
860
Gol
denr
od R
oad
Per
shin
g A
ve.
Hof
fner
Ave
.4
E43
,900
0.07
0.54
1,77
4C
No
425
01,
530
1,81
01,
860
1,86
0G
olde
nrod
Roa
dH
offn
er A
ve.
Lee
Vis
ta B
oule
vard
4E
36,2
000.
070.
541,
463
BN
o4
250
1,53
01,
810
1,86
01,
860
N. C
hick
asaw
Tra
ilC
olon
ial D
rive
Eas
t Wes
t Exp
ress
way
2E
19,0
000.
090.
5388
0E
No
20
220
720
860
890
N. C
hick
asaw
Tra
ilE
ast W
est E
xpre
ssw
ayLa
ke U
nder
hill
Roa
d2
E18
,000
0.09
0.53
834
DN
o2
022
072
086
089
0N
. Chi
ckas
aw T
rail
Lake
Und
erhi
ll R
oad
Cur
ry F
ord
Roa
d2
E20
,300
0.09
0.53
940
FY
es4
022
072
086
089
0N
. Chi
ckas
aw T
rail
Cur
ry F
ord
Roa
dLe
e V
ista
Bou
leva
rd2
E24
,100
0.09
0.53
1,11
6F
Yes
40
220
720
860
890
Eco
nloc
khat
chee
Tra
il C
olon
ial D
rive
Val
enci
a C
olle
ge L
ane
2E
28,8
000.
080.
521,
212
FY
es4
022
072
086
089
0E
conl
ockh
atch
ee T
rail
Val
enci
a C
olle
ge L
ane
Lake
Und
erhi
ll R
oad
2E
16,5
000.
080.
5269
5C
No
20
220
720
860
890
Eco
nloc
khat
chee
Tra
il La
ke U
nder
hill
Roa
dC
urry
For
d R
oad
2E
21,1
000.
080.
5288
8E
No
20
220
720
860
890
Eco
nloc
khat
chee
Tra
il C
urry
For
d R
oad
Lee
Vis
ta B
oule
vard
2E
21,9
000.
080.
5292
2F
Yes
40
220
720
860
890
Dea
n R
oad
Col
onia
l Driv
eEa
st W
est E
xpre
ssw
ay4
E29
,600
0.08
0.53
1,26
4B
No
425
01,
530
1,81
01,
860
1,86
0D
ean
Roa
dE
ast W
est E
xpre
ssw
ayLa
ke U
nder
hill
Roa
d4
E33
,700
0.08
0.53
1,43
9B
No
425
01,
530
1,81
01,
860
1,86
0D
ean
Roa
dLa
ke U
nder
hill
Roa
dC
urry
For
d R
oad
2E
23,7
000.
080.
531,
012
FY
es4
022
072
086
089
0
Rou
se R
oad
Col
onia
l Driv
eE
ast W
est E
xpre
ssw
ay2
E19
,100
0.09
0.54
934
FY
es4
022
072
056
089
0
Col
onia
l Driv
eS
emor
an B
oule
vard
Gol
denr
od R
oad
6E
66,7
000.
070.
542,
590
CN
o6
380
2,33
02,
720
2,79
02,
790
Col
onia
l Driv
eG
olde
nrod
Roa
dC
entra
l Flo
rida
Gre
eneW
ay6
E62
,800
0.07
0.54
2,43
8C
No
638
02,
330
2,72
02,
790
2,79
0C
olon
ial D
rive
Cen
tral F
lorid
a G
reen
eWay
Eco
nloc
khat
chee
Tra
il 6
E59
,800
0.07
0.54
2,32
2B
No
638
02,
330
2,72
02,
790
2,79
0C
olon
ial D
rive
Eco
nloc
khat
chee
Tra
il S
Dea
n R
oad
6E
61,6
000.
070.
542,
392
CN
o6
380
2,33
02,
720
2,79
02,
790
Col
onia
l Driv
eS
Dea
n R
oad
Rou
se R
oad
6E
67,0
000.
070.
542,
601
CN
o6
380
2,33
02,
720
2,79
02,
790
Col
onia
l Driv
eR
ouse
Roa
dN
Ala
faya
Tra
il6
E64
,100
0.07
0.54
2,48
9C
No
638
02,
330
2,72
02,
790
2,79
0C
olon
ial D
rive
N A
lafa
ya T
rail
Eas
t Wes
t Exp
ress
way
6E
51,2
000.
070.
541,
988
DN
o6
00
1,02
02,
330
2,58
0C
olon
ial D
rive
Eas
t Wes
t Exp
ress
way
Ava
lon
Roa
d6
E62
,000
0.07
0.54
2,40
7D
No
60
340
2,11
02,
570
2,71
0C
olon
ial D
rive
Ava
lon
Roa
dS
R 5
204
E53
,500
0.08
0.56
2,40
9D
No
498
01,
590
2,30
02,
980
3,39
0C
olon
ial D
rive
Eas
t of S
R 5
204
E26
,900
0.08
0.56
1,21
1B
No
498
01,
590
2,30
02,
980
3,39
0
Per
shin
g A
ve.
Sem
oran
Bou
leva
rdG
olde
nrod
Roa
d4
E26
,000
0.09
0.62
1,36
0C
No
40
220
1,36
01,
710
1,80
0
Hof
fner
Ave
.S
emor
an B
oule
vard
Gol
denr
od R
oad
2E
26,0
000.
080.
531,
041
FY
es4
022
072
086
089
0
Lee
Vis
ta B
oule
vard
Sem
oran
Bou
leva
rdG
olde
nrod
Roa
d4
E41
,500
0.09
0.54
1,95
5F
Yes
625
01,
530
1,81
01,
860
1,86
0Le
e V
ista
Bou
leva
rdG
olde
nrod
Roa
dH
offn
er R
oad
4E
29,0
000.
090.
541,
366
BN
o4
250
1,53
01,
810
1,86
01,
860
Lee
Vis
ta B
oule
vard
Hof
fner
Roa
dE
conl
ockh
atch
he T
rail
4E
27,1
000.
090.
541,
277
BN
o4
250
1,53
01,
810
1,86
01,
860
Lee
Vis
ta B
oule
vard
Eco
nloc
khat
chhe
Tra
ilC
entra
l Flo
rida
Gre
eneW
ay4
E13
,400
0.09
0.54
631
BN
o4
250
1,53
01,
810
1,86
01,
860
Not
e: 1
. Th
e m
inim
um L
OS
sta
ndar
d w
as o
btai
ned
from
Ora
nge
Cou
nty
Tran
spor
tatio
n E
lem
ent.
2. T
he A
AD
T w
as o
btai
ned
by m
ultip
lyin
g th
e da
ily m
odel
vol
umes
(PS
WA
DT)
with
a M
odel
Out
put C
orre
ctio
n Fa
ctor
(MO
CF)
of 0
.98.
In th
e in
stan
ces
whe
n th
e m
odel
vol
umes
wer
e lo
wer
than
exi
stin
g co
nditi
ons,
gr
owth
rate
s w
ere
appl
ied.
3. T
he p
eak
hour
pea
k di
rect
ion
volu
mes
wer
e ob
tain
ed b
y m
ultip
lyin
g th
e A
AD
T w
ith th
e K
and
D fa
ctor
s.
4. T
he p
eak
hour
pea
k di
rect
ion
LOS
obt
aine
d by
com
parin
g th
e pe
ak h
our p
eak
dire
ctio
n vo
lum
es to
the
peak
hou
r pea
k di
rect
ion
capa
citie
s fro
m F
DO
T 20
02 Q
ualit
y/LO
S H
andb
ook.
5. K
100 a
nd D
100 w
ere
obta
ined
from
Ora
nge
Cou
nty
Tran
spor
tatio
n El
emen
t.
6. T
he h
ighl
ight
ed ro
ws
indi
cate
d th
at th
e ro
adw
ay s
egm
ent f
ails
at d
aily
or p
eak
hour
pea
k di
rect
ion
cond
ition
.
Table 4.5.6-3: 2015 Summary Traffic Conditions (Continued)
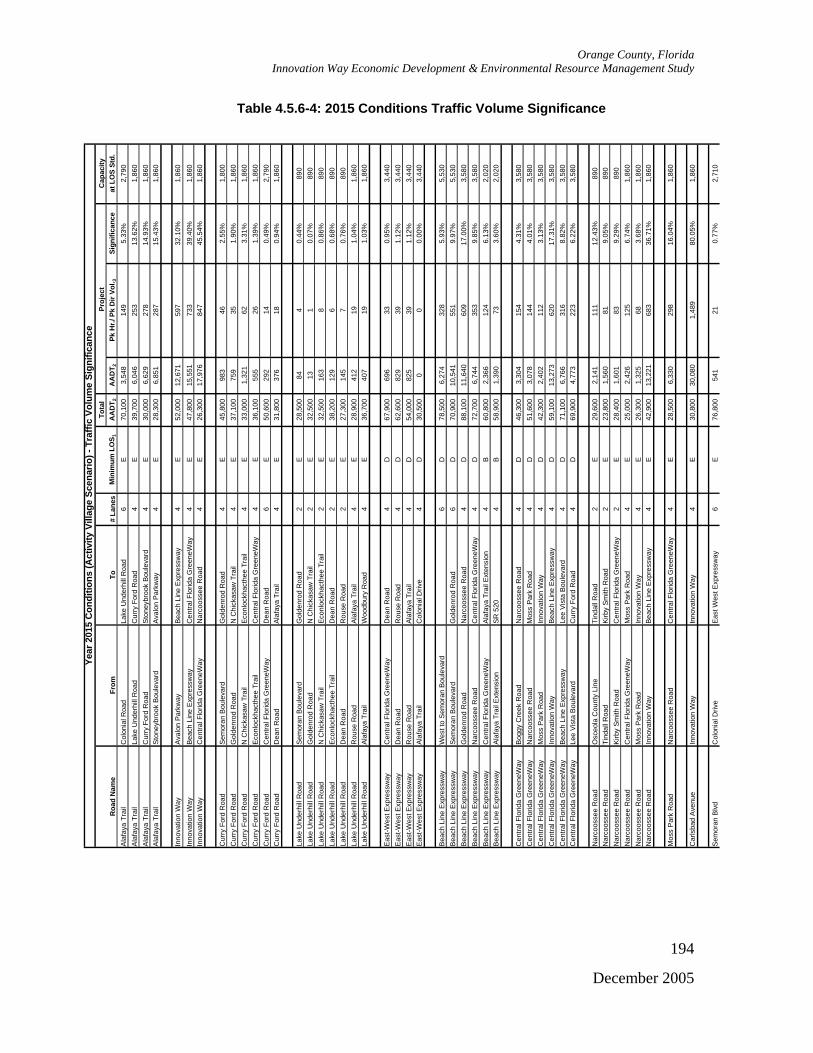
Orange County, Florida Innovation Way Economic Development & Environmental Resource Management Study
December 2005
194
Cap
acity
AA
DT 2
AA
DT 2
Pk H
r./ P
k D
ir Vo
l. 3Si
gnifi
canc
eat
LO
S St
d.A
lafa
ya T
rail
Col
onia
l Roa
dLa
ke U
nder
hill
Roa
d6
E70
,100
3,54
814
95.
33%
2,79
0A
lafa
ya T
rail
Lake
Und
erhi
ll R
oad
Cur
ry F
ord
Roa
d4
E39
,700
6,04
625
313
.62%
1,86
0A
lafa
ya T
rail
Cur
ry F
ord
Roa
dSt
oney
broo
k Bo
ulev
ard
4E
30,0
006,
629
278
14.9
3%1,
860
Ala
faya
Tra
il St
oney
broo
k Bo
ulev
ard
Aval
on P
arkw
ay4
E28
,300
6,85
128
715
.43%
1,86
0
Inno
vatio
n W
ayAv
alon
Par
kway
Beac
h Li
ne E
xpre
ssw
ay4
E52
,000
12,6
7159
732
.10%
1,86
0In
nova
tion
Way
Beac
h Li
ne E
xpre
ssw
ayC
entra
l Flo
rida
Gre
eneW
ay4
E47
,800
15,5
5173
339
.40%
1,86
0In
nova
tion
Way
Cen
tral F
lorid
a G
reen
eWay
Nar
coos
see
Roa
d4
E26
,300
17,9
7684
745
.54%
1,86
0
Cur
ry F
ord
Roa
dSe
mor
an B
oule
vard
Gol
denr
od R
oad
4E
45,8
0098
346
2.55
%1,
800
Cur
ry F
ord
Roa
dG
olde
nrod
Roa
dN
Chi
ckas
aw T
rail
4E
37,1
0075
935
1.90
%1,
860
Cur
ry F
ord
Roa
dN
Chi
ckas
aw T
rail
Econ
lock
hact
hee
Trai
l4
E33
,000
1,32
162
3.31
%1,
860
Cur
ry F
ord
Roa
dEc
onlo
ckha
cthe
e Tr
ail
Cen
tral F
lorid
a G
reen
eWay
4E
36,1
0055
526
1.39
%1,
860
Cur
ry F
ord
Roa
dC
entra
l Flo
rida
Gre
eneW
ayD
ean
Roa
d6
E50
,600
292
140.
49%
2,79
0C
urry
For
d R
oad
Dea
n R
oad
Alaf
aya
Trai
l4
E31
,800
376
180.
94%
1,86
0
Lake
Und
erhi
ll R
oad
Sem
oran
Bou
leva
rdG
olde
nrod
Roa
d2
E28
,500
844
0.44
%89
0La
ke U
nder
hill
Roa
dG
olde
nrod
Roa
dN
Chi
ckas
aw T
rail
2E
32,5
0013
10.
07%
890
Lake
Und
erhi
ll R
oad
N C
hick
asaw
Tra
ilEc
onlo
ckha
cthe
e Tr
ail
2E
32,5
0016
38
0.86
%89
0La
ke U
nder
hill
Roa
dEc
onlo
ckha
cthe
e Tr
ail
Dea
n R
oad
2E
38,2
0012
96
0.68
%89
0La
ke U
nder
hill
Roa
dD
ean
Roa
dR
ouse
Roa
d2
E27
,300
145
70.
76%
890
Lake
Und
erhi
ll R
oad
Rou
se R
oad
Alaf
aya
Trai
l4
E28
,900
412
191.
04%
1,86
0La
ke U
nder
hill
Roa
dAl
afay
a Tr
ail
Woo
dbur
y R
oad
4E
36,7
0040
719
1.03
%1,
860
Eas
t-Wes
t Exp
ress
way
Cen
tral F
lorid
a G
reen
eWay
Dea
n R
oad
4D
67,9
0069
633
0.95
%3,
440
Eas
t-Wes
t Exp
ress
way
Dea
n R
oad
Rou
se R
oad
4D
62,6
0082
939
1.12
%3,
440
Eas
t-Wes
t Exp
ress
way
Rou
se R
oad
Alaf
aya
Trai
l4
D54
,000
825
391.
12%
3,44
0E
ast-W
est E
xpre
ssw
ayAl
afay
a Tr
ail
Col
onia
l Driv
e4
D30
,500
00
0.00
%3,
440
Bea
ch L
ine
Expr
essw
ayW
est t
o S
emor
an B
oule
vard
6D
78,5
006,
274
328
5.93
%5,
530
Bea
ch L
ine
Expr
essw
aySe
mor
an B
oule
vard
Gol
denr
od R
oad
6D
70,9
0010
,541
551
9.97
%5,
530
Bea
ch L
ine
Expr
essw
ayG
olde
nrod
Roa
dN
arco
osse
e R
oad
4D
88,1
0011
,640
609
17.0
0%3,
580
Bea
ch L
ine
Expr
essw
ayN
arco
osse
e R
oad
Cen
tral F
lorid
a G
reen
eWay
4D
72,7
006,
744
353
9.85
%3,
580
Bea
ch L
ine
Expr
essw
ayC
entra
l Flo
rida
Gre
eneW
ayAl
afay
a Tr
ail E
xten
sion
4B
60,8
002,
366
124
6.13
%2,
020
Bea
ch L
ine
Expr
essw
ayAl
afay
a Tr
ail E
xten
sion
SR 5
204
B58
,900
1,39
073
3.60
%2,
020
Cen
tral F
lorid
a G
reen
eWay
Bogg
y C
reek
Roa
dN
arco
osse
e R
oad
4D
46,3
003,
304
154
4.31
%3,
580
Cen
tral F
lorid
a G
reen
eWay
Nar
coos
see
Roa
dM
oss
Park
Roa
d4
D51
,600
3,07
814
44.
01%
3,58
0C
entra
l Flo
rida
Gre
eneW
ayM
oss
Park
Roa
dIn
nova
tion
Way
4D
42,3
002,
402
112
3.13
%3,
580
Cen
tral F
lorid
a G
reen
eWay
Inno
vatio
n W
ayBe
ach
Line
Exp
ress
way
4D
59,1
0013
,273
620
17.3
1%3,
580
Cen
tral F
lorid
a G
reen
eWay
Beac
h Li
ne E
xpre
ssw
ayLe
e Vi
sta
Boul
evar
d4
D71
,100
6,76
631
68.
82%
3,58
0C
entra
l Flo
rida
Gre
eneW
ayLe
e V
ista
Bou
leva
rdC
urry
For
d R
oad
4D
69,9
004,
773
223
6.22
%3,
580
Nar
coos
see
Roa
dO
sceo
la C
ount
y Li
neTi
ndal
l Roa
d2
E29
,600
2,14
111
112
.43%
890
Nar
coos
see
Roa
dTi
ndal
l Roa
dKi
rby
Smith
Roa
d2
E23
,800
1,56
081
9.05
%89
0N
arco
osse
e R
oad
Kirb
y Sm
ith R
oad
Cen
tral F
lorid
a G
reen
eWay
2E
28,4
001,
601
839.
29%
890
Nar
coos
see
Roa
dC
entra
l Flo
rida
Gre
eneW
ayM
oss
Park
Roa
d4
E25
,000
2,42
612
56.
74%
1,86
0N
arco
osse
e R
oad
Mos
s Pa
rk R
oad
Inno
vatio
n W
ay4
E26
,300
1,32
568
3.68
%1,
860
Nar
coos
see
Roa
dIn
nova
tion
Way
Beac
h Li
ne E
xpre
ssw
ay4
E42
,900
13,2
2168
336
.71%
1,86
0
Mos
s P
ark
Roa
dN
arco
osse
e R
oad
Cen
tral F
lorid
a G
reen
eWay
4E
28,5
006,
330
298
16.0
4%1,
860
Car
lsba
d A
venu
eIn
nova
tion
Way
Inno
vatio
n W
ay4
E30
,800
30,0
801,
489
80.0
5%1,
860
Sem
oran
Blv
dC
olon
ial D
rive
East
Wes
t Exp
ress
way
6E
76,8
0054
121
0.77
%2,
710
Proj
ect
Year
201
5 C
ondi
tions
(Act
ivity
Vill
age
Scen
ario
) - T
raffi
c Vo
lum
e Si
gnifi
canc
e
Min
imum
LO
S 1To
tal
Roa
d N
ame
From
To#
Lane
sTable 4.5.6-4: 2015 Conditions Traffic Volume Significance

Orange County, Florida Innovation Way Economic Development & Environmental Resource Management Study
December 2005
195
Sem
oran
Blv
dEa
st W
est E
xpre
ssw
ayC
urry
For
d R
oad
6E
67,7
0060
423
0.86
%2,
710
Sem
oran
Blv
dC
urry
For
d R
oad
Per
shin
g A
ve.
6E
68,8
001,
360
521.
93%
2,71
0Se
mor
an B
lvd
Pers
hing
Ave
.H
offn
er A
ve.
6E
73,4
002,
152
832.
96%
2,79
0Se
mor
an B
lvd
Hof
fner
Ave
.Le
e V
ista
Bou
leva
rd6
E71
,100
2,43
493
3.35
%2,
790
Sem
oran
Blv
dLe
e Vi
sta
Bou
leva
rdB
each
line
Expr
essw
ay6
E71
,800
2,88
411
13.
97%
2,79
0
Gol
denr
od R
oad
Col
onia
l Driv
eE
ast W
est E
xpre
ssw
ay4
E40
,400
103
40.
22%
1,86
0G
olde
nrod
Roa
dEa
st W
est E
xpre
ssw
ayC
urry
For
d R
oad
4E
44,1
0017
27
0.37
%1,
860
Gol
denr
od R
oad
Cur
ry F
ord
Roa
dP
ersh
ing
Ave
.4
E45
,400
536
221.
16%
1,86
0G
olde
nrod
Roa
dPe
rshi
ng A
ve.
Hof
fner
Ave
.4
E43
,900
1,24
450
2.70
%1,
860
Gol
denr
od R
oad
Hof
fner
Ave
.Le
e V
ista
Bou
leva
rd4
E36
,200
282
110.
61%
N. C
hick
asaw
Tra
ilC
olon
ial D
rive
Eas
t Wes
t Exp
ress
way
2E
19,0
0016
10.
08%
890
N. C
hick
asaw
Tra
ilEa
st W
est E
xpre
ssw
ayLa
ke U
nder
hill
Roa
d2
E18
,000
80
0.04
%89
0N
. Chi
ckas
aw T
rail
Lake
Und
erhi
ll R
oad
Cur
ry F
ord
Roa
d2
E20
,300
333
151.
73%
890
N. C
hick
asaw
Tra
ilC
urry
For
d R
oad
Lee
Vis
ta B
oule
vard
2E
24,1
0023
511
1.22
%89
0
Econ
lock
hatc
hee
Trai
l C
olon
ial D
rive
Val
enci
a C
olle
ge L
ane
2E
28,8
0049
20.
23%
890
Econ
lock
hatc
hee
Trai
l Va
lenc
ia C
olle
ge L
ane
Lake
Und
erhi
ll R
oad
2E
16,5
0058
20.
27%
890
Econ
lock
hatc
hee
Trai
l La
ke U
nder
hill
Roa
dC
urry
For
d R
oad
2E
21,1
0027
612
1.31
%89
0Ec
onlo
ckha
tche
e Tr
ail
Cur
ry F
ord
Roa
dLe
e V
ista
Bou
leva
rd2
E21
,900
1,03
944
4.91
%89
0
Dea
n R
oad
Col
onia
l Driv
eE
ast W
est E
xpre
ssw
ay4
E29
,600
270
120.
62%
1,86
0D
ean
Roa
dEa
st W
est E
xpre
ssw
ayLa
ke U
nder
hill
Roa
d4
E33
,700
179
80.
41%
1,86
0D
ean
Roa
dLa
ke U
nder
hill
Roa
dC
urry
For
d R
oad
2E
23,7
0017
37
0.83
%89
0
Rou
se R
oad
Col
onia
l Driv
eE
ast W
est E
xpre
ssw
ay2
E19
,100
266
131.
46%
890
Col
onia
l Driv
eSe
mor
an B
oule
vard
Gol
denr
od R
oad
6E
66,7
0038
915
0.54
%2,
790
Col
onia
l Driv
eG
olde
nrod
Roa
dC
entra
l Flo
rida
Gre
eneW
ay6
E62
,800
899
351.
25%
2,79
0C
olon
ial D
rive
Cen
tral F
lorid
a G
reen
eWay
Eco
nloc
khat
chee
Tra
il 6
E59
,800
385
150.
54%
2,79
0C
olon
ial D
rive
Econ
lock
hatc
hee
Trai
l S
Dea
n R
oad
6E
61,6
0078
731
1.10
%2,
790
Col
onia
l Driv
eS
Dea
n R
oad
Rou
se R
oad
6E
67,0
0072
028
1.00
%2,
790
Col
onia
l Driv
eR
ouse
Roa
dN
Ala
faya
Tra
il6
E64
,100
1,15
545
1.61
%2,
790
Col
onia
l Driv
eN
Ala
faya
Tra
ilE
ast W
est E
xpre
ssw
ay6
E51
,200
399
150.
60%
2,58
0C
olon
ial D
rive
East
Wes
t Exp
ress
way
Ava
lon
Roa
d6
E62
,000
744
291.
07%
2,71
0C
olon
ial D
rive
Aval
on R
oad
SR
520
4E
53,5
0039
018
0.52
%3,
390
Col
onia
l Driv
eEa
st o
f SR
520
4E
26,9
0020
89
0.28
%3,
390
Pers
hing
Ave
.Se
mor
an B
oule
vard
Gol
denr
od R
oad
4E
26,0
0053
128
1.54
%1,
800
Hof
fner
Ave
.Se
mor
an B
oule
vard
Gol
denr
od R
oad
2E
26,0
0061
124
2.75
%89
0
Lee
Vist
a Bo
ulev
ard
Sem
oran
Bou
leva
rdG
olde
nrod
Roa
d4
E41
,500
665
311.
69%
1,86
0Le
e Vi
sta
Boul
evar
dG
olde
nrod
Roa
dH
offn
er R
oad
4E
29,0
0094
044
2.38
%1,
860
Lee
Vist
a Bo
ulev
ard
Hof
fner
Roa
dE
conl
ockh
atch
he T
rail
4E
27,1
0044
221
1.12
%1,
860
Lee
Vist
a Bo
ulev
ard
Econ
lock
hatc
hhe
Trai
lC
entra
l Flo
rida
Gre
eneW
ay4
E13
,400
1,99
394
5.05
%1,
860
Not
e: 1
. Th
e m
inim
um L
OS
sta
ndar
d w
as o
btai
ned
from
Ora
nge
Cou
nty
Tran
spor
tatio
n El
emen
t.2.
The
AAD
T w
as o
btai
ned
by m
ultip
lyin
g th
e da
ily m
odel
vol
umes
(PSW
ADT)
with
a M
odel
Out
put C
orre
ctio
n Fa
ctor
(MO
CF)
of 0
.98.
3.
The
pea
k ho
ur p
eak
dire
ctio
n vo
lum
es w
ere
obta
ined
by
mul
tiply
ing
the
AAD
T w
ith th
e K
and
D fa
ctor
s.
Table 4.5.6-4: 2015 Conditions Traffic Volume Significance (Continued)
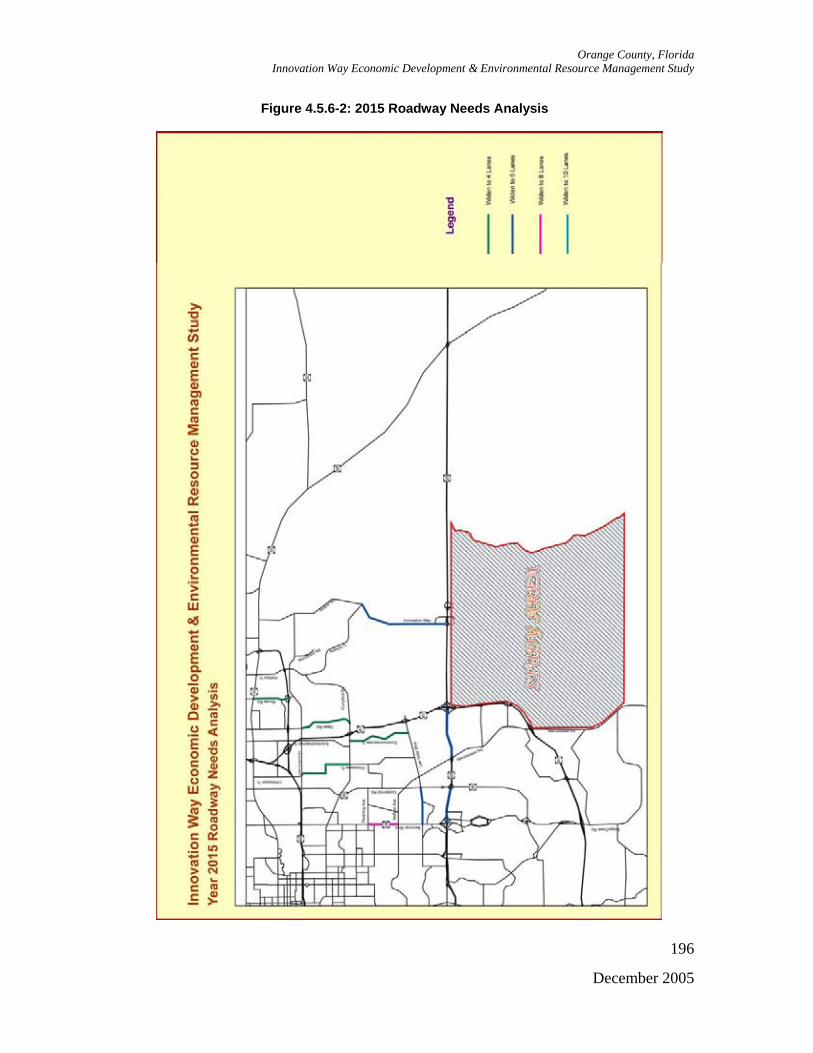
Orange County, Florida Innovation Way Economic Development & Environmental Resource Management Study
December 2005
196
Figure 4.5.6-2: 2015 Roadway Needs Analysis
Orange County, Florida Innovation Way Economic Development & Environmental Resource Management Study
December 2005
197
Year 2025 Analysis For the year 2025 condition, the following roadway segments are projected to operate at capacity deficient conditions as shown in Table 4.5.6-5 and Figure 4.5.6-3. In addition, Table 4.5.6-6 documents the significance of the capacity impacts of Innovation Way. In addition to the failing roadway segments listed under the 2015 analysis, the following roadway segments are projected to operate beyond their respective level of service operating standards in the year 2025:
• 6-Lane Alafaya Trail between Lake Underhill Road and Curry Ford Road operates at LOS F. The Sector Plan has significant impacts on this segment.
• 4-Lane Innovation Way between SR 417 and Narcoossee Road operates at LOS F. The Sector Plan has significant impacts on this segment.
• 4-Lane Curry Ford Road between SR 551 and Chickasaw trail operates at LOS F. The Sector Plan has no significant impacts on this segment.
• 4-Lane Curry Ford Road between Econlockhatchee Trail and SR 417 operates at LOS F. The Sector Plan has no significant impacts on this segment.
• 4-Lane Lake Underhill between Alafaya Trail and Woodbury Road operates at LOS F. The Sector Plan has no significant impacts on this segment.
• 4-Lane Narcoossee Road between Osceola County and SR 417 operates at LOS F. The Sector Plan has significant impacts on this segment.
• 4-Lane Narcoossee Road between Moss Park Road and Innovation Way operates at LOS F. The Sector Plan has significant impacts on this segment.
• 6-Lane SR 436 between Curry Ford Road and SR 528 operates at LOS F. The Sector Plan has significant impacts only on the segment between Hoffner Avenue and SR 528.
• 4-Lane SR 551 between SR 408 and Hoffner Avenue operates at LOS F. The Sector Plan has no significant impacts on this segment.
• 2-Lane Chickasaw Trail between SR 50 and Lake Underhill Road operates at LOS F. The Sector Plan has no significant impacts on this segment.
• 6-Lane SR 50 between Econlockhatchee Trail and Rouse Road operates at LOS F. The Sector Plan has no significant impacts on this segment.
• 6-Lane SR 50 between SR 408 and Avalon Parkway operates at LOS F. The Sector Plan has no significant impacts on this segment.
• 4-Lane Lee Vista Blvd. between SR 551 and Hoffner Road operates at LOS F. The Sector Plan has no significant impacts on this segment.
The traffic flow analyses performed for the 2010, 2015 and 2025 conditions established the roadway system capacities needed to support Innovation Way. Under current rules, the responsibility of implementing needed roadway capacity falls on the shoulders of Orange County’s Concurrency Management System regulation. All development plan approvals in the Study Area must go through the County’s concurrency review process where provisions for adequate transportation capacity must be addressed before new development takes place. New development approvals are not granted vested trip entitlements; rather, they are subject to concurrency regulations. Therefore, continued
Orange County, Florida Innovation Way Economic Development & Environmental Resource Management Study
December 2005
198
implementation of this regulatory requirement ensures that Orange County would be able to monitor development growth alongside the need for transportation facilities within the study area. A number of 6-lane arterial facilities are projected to exceed their respective acceptable level of service operating thresholds. Given the FDOT’s maximum six through-lane policy, mitigating capacity deficiencies on 6-lane facilities would need to be addressed by exploring parallel corridor facilities, promoting transit usage, or reducing demand through transportation demand management (TDM) techniques. All of the Innovation Way scenarios 2-5 propose these techniques.
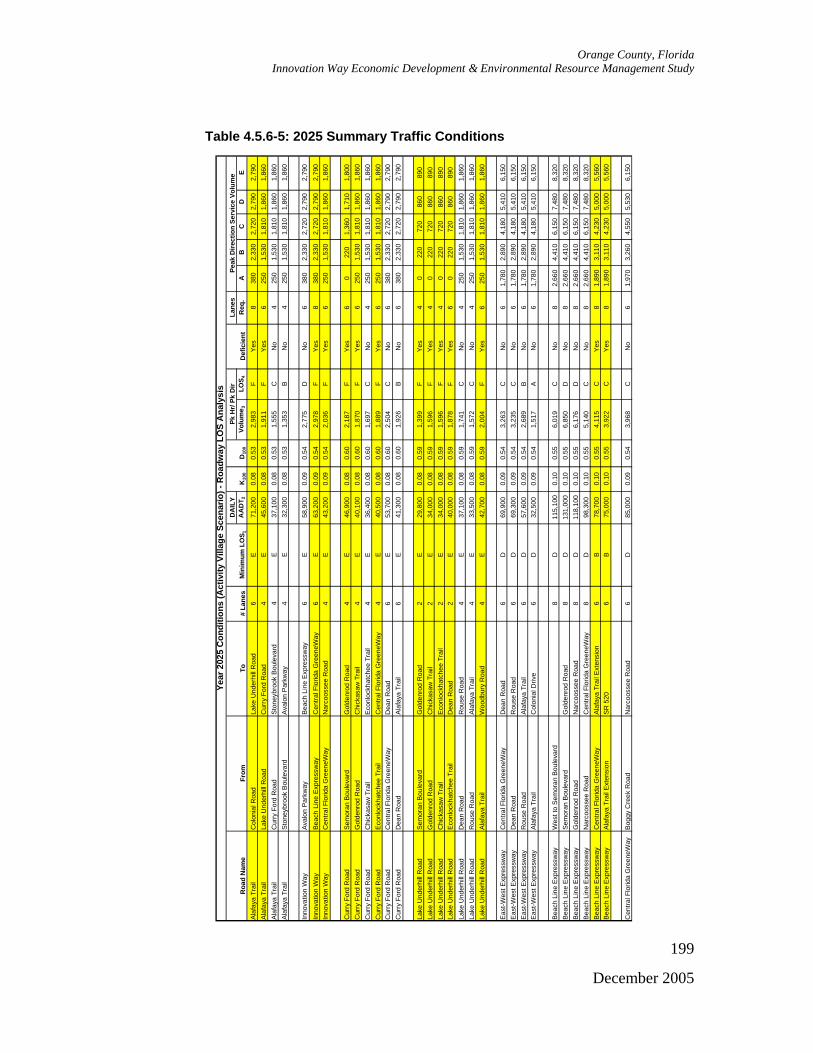
Orange County, Florida Innovation Way Economic Development & Environmental Resource Management Study
December 2005
199
Lane
sA
AD
T 2Vo
lum
e 3LO
S 4R
eq.
AB
CD
EA
lafa
ya T
rail
Col
onia
l Roa
dLa
ke U
nder
hill
Roa
d6
E71
,200
0.08
0.53
2,98
3F
Yes
838
02,
330
2,72
02,
790
2,79
0A
lafa
ya T
rail
Lake
Und
erhi
ll R
oad
Cur
ry F
ord
Roa
d4
E45
,600
0.08
0.53
1,91
1F
Yes
625
01,
530
1,81
01,
860
1,86
0A
lafa
ya T
rail
Cur
ry F
ord
Roa
dS
tone
ybro
ok B
oule
vard
4E
37,1
000.
080.
531,
555
CN
o4
250
1,53
01,
810
1,86
01,
860
Ala
faya
Tra
il S
tone
ybro
ok B
oule
vard
Ava
lon
Par
kway
4E
32,3
000.
080.
531,
353
BN
o4
250
1,53
01,
810
1,86
01,
860
Inno
vatio
n W
ayAv
alon
Par
kway
Bea
ch L
ine
Exp
ress
way
6E
58,9
000.
090.
542,
775
DN
o6
380
2,33
02,
720
2,79
02,
790
Inno
vatio
n W
ayBe
ach
Line
Exp
ress
way
Cen
tral F
lorid
a G
reen
eWay
6E
63,2
000.
090.
542,
978
FY
es8
380
2,33
02,
720
2,79
02,
790
Inno
vatio
n W
ayC
entra
l Flo
rida
Gre
eneW
ayN
arco
osse
e R
oad
4E
43,2
000.
090.
542,
036
FY
es6
250
1,53
01,
810
1,86
01,
860
Cur
ry F
ord
Roa
dS
emor
an B
oule
vard
Gol
denr
od R
oad
4E
46,9
000.
080.
602,
187
FY
es6
022
01,
360
1,71
01,
800
Cur
ry F
ord
Roa
dG
olde
nrod
Roa
dC
hick
asaw
Tra
il4
E40
,100
0.08
0.60
1,87
0F
Yes
625
01,
530
1,81
01,
860
1,86
0C
urry
For
d R
oad
Chi
ckas
aw T
rail
Eco
nloc
khat
chee
Tra
il4
E36
,400
0.08
0.60
1,69
7C
No
425
01,
530
1,81
01,
860
1,86
0C
urry
For
d R
oad
Eco
nloc
khat
chee
Tra
ilC
entra
l Flo
rida
Gre
eneW
ay4
E40
,500
0.08
0.60
1,88
9F
Yes
625
01,
530
1,81
01,
860
1,86
0C
urry
For
d R
oad
Cen
tral F
lorid
a G
reen
eWay
Dea
n R
oad
6E
53,7
000.
080.
602,
504
CN
o6
380
2,33
02,
720
2,79
02,
790
Cur
ry F
ord
Roa
dD
ean
Roa
dA
lafa
ya T
rail
6E
41,3
000.
080.
601,
926
BN
o6
380
2,33
02,
720
2,79
02,
790
Lake
Und
erhi
ll R
oad
Sem
oran
Bou
leva
rdG
olde
nrod
Roa
d2
E29
,800
0.08
0.59
1,39
9F
Yes
40
220
720
860
890
Lake
Und
erhi
ll R
oad
Gol
denr
od R
oad
Chi
ckas
aw T
rail
2E
34,0
000.
080.
591,
596
FY
es4
022
072
086
089
0La
ke U
nder
hill
Roa
dC
hick
asaw
Tra
ilE
conl
ockh
atch
ee T
rail
2E
34,0
000.
080.
591,
596
FY
es4
022
072
086
089
0La
ke U
nder
hill
Roa
dE
conl
ockh
atch
ee T
rail
Dea
n R
oad
2E
40,0
000.
080.
591,
878
FY
es6
022
072
086
089
0La
ke U
nder
hill
Roa
dD
ean
Roa
dR
ouse
Roa
d4
E37
,100
0.08
0.59
1,74
1C
No
425
01,
530
1,81
01,
860
1,86
0La
ke U
nder
hill
Roa
dR
ouse
Roa
dA
lafa
ya T
rail
4E
33,5
000.
080.
591,
572
CN
o4
250
1,53
01,
810
1,86
01,
860
Lake
Und
erhi
ll R
oad
Ala
faya
Tra
ilW
oodb
ury
Roa
d4
E42
,700
0.08
0.59
2,00
4F
Yes
625
01,
530
1,81
01,
860
1,86
0
Eas
t-Wes
t Exp
ress
way
Cen
tral F
lorid
a G
reen
eWay
Dea
n R
oad
6D
69,9
000.
090.
543,
263
CN
o6
1,78
02,
890
4,18
05,
410
6,15
0E
ast-W
est E
xpre
ssw
ayD
ean
Roa
dR
ouse
Roa
d6
D69
,300
0.09
0.54
3,23
5C
No
61,
780
2,89
04,
180
5,41
06,
150
Eas
t-Wes
t Exp
ress
way
Rou
se R
oad
Ala
faya
Tra
il6
D57
,600
0.09
0.54
2,68
9B
No
61,
780
2,89
04,
180
5,41
06,
150
Eas
t-Wes
t Exp
ress
way
Ala
faya
Tra
ilC
olon
ial D
rive
6D
32,5
000.
090.
541,
517
AN
o6
1,78
02,
890
4,18
05,
410
6,15
0
Bea
ch L
ine
Expr
essw
ayW
est t
o Se
mor
an B
oule
vard
8D
115,
100
0.10
0.55
6,01
9C
No
82,
660
4,41
06,
150
7,48
08,
320
Bea
ch L
ine
Exp
ress
way
Sem
oran
Bou
leva
rdG
olde
nrod
Roa
d8
D13
1,00
00.
100.
556,
850
DN
o8
2,66
04,
410
6,15
07,
480
8,32
0B
each
Lin
e E
xpre
ssw
ayG
olde
nrod
Roa
dN
arco
osse
e R
oad
8D
118,
100
0.10
0.55
6,17
6D
No
82,
660
4,41
06,
150
7,48
08,
320
Bea
ch L
ine
Exp
ress
way
Nar
coos
see
Roa
dC
entra
l Flo
rida
Gre
eneW
ay8
D98
,300
0.10
0.55
5,14
0C
No
82,
660
4,41
06,
150
7,48
08,
320
Bea
ch L
ine
Exp
ress
way
Cen
tral F
lorid
a G
reen
eWay
Ala
faya
Tra
il Ex
tens
ion
6B
78,7
000.
100.
554,
115
CY
es8
1,89
03,
110
4,23
05,
000
5,56
0B
each
Lin
e E
xpre
ssw
ayA
lafa
ya T
rail
Ext
ensi
onS
R 5
206
B75
,000
0.10
0.55
3,92
2C
Yes
81,
890
3,11
04,
230
5,00
05,
560
Cen
tral F
lorid
a G
reen
eWay
Bog
gy C
reek
Roa
dN
arco
osse
e R
oad
6D
85,0
000.
090.
543,
968
CN
o6
1,97
03,
260
4,55
05,
530
6,15
0
Def
icie
nt#
Lane
sM
inim
um L
OS 1
DA
ILY
K10
0
Year
202
5 C
ondi
tions
(Act
ivity
Vill
age
Scen
ario
) - R
oadw
ay L
OS
Ana
lysi
s
D10
0
Pk H
r/ Pk
Dir
Peak
Dire
ctio
n Se
rvic
e Vo
lum
eR
oad
Nam
eFr
omTo
Table 4.5.6-5: 2025 Summary Traffic Conditions
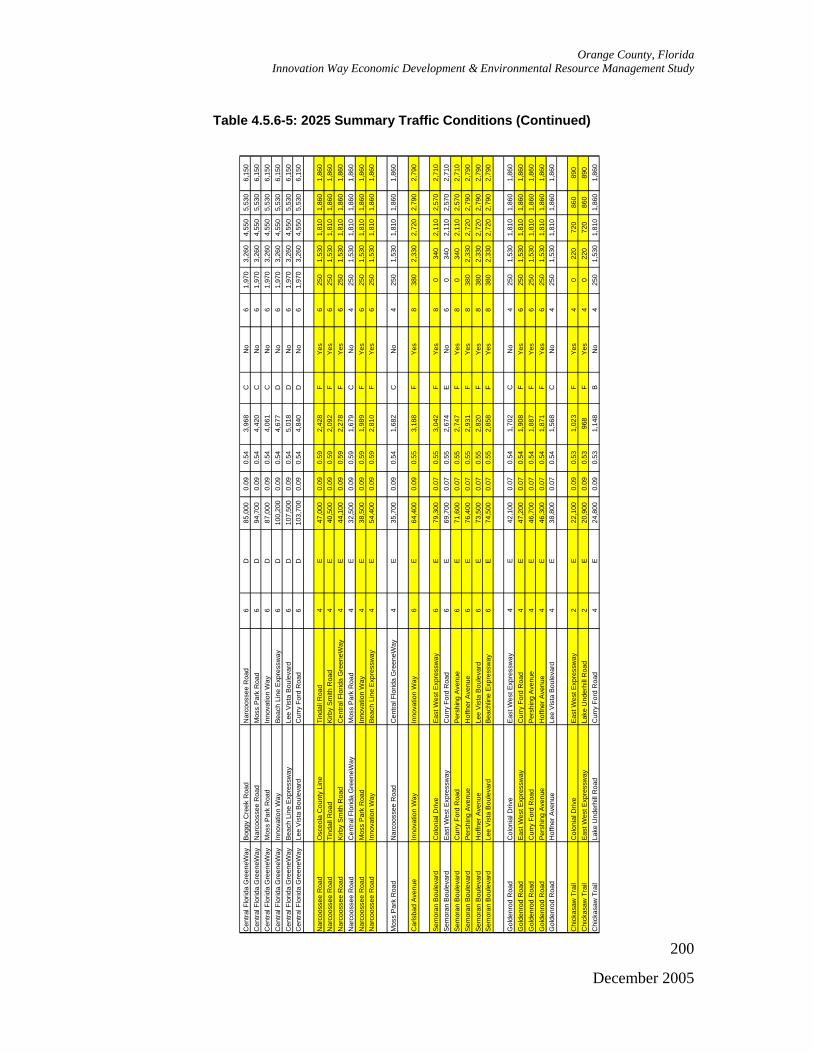
Orange County, Florida Innovation Way Economic Development & Environmental Resource Management Study
December 2005
200
Table 4.5.6-5: 2025 Summary Traffic Conditions (Continued)
Cen
tral F
lorid
a G
reen
eWay
Bogg
y C
reek
Roa
dN
arco
osse
e R
oad
6D
85,0
000.
090.
543,
968
CN
o6
1,97
03,
260
4,55
05,
530
6,15
0C
entra
l Flo
rida
Gre
eneW
ayN
arco
osse
e R
oad
Mos
s Pa
rk R
oad
6D
94,7
000.
090.
544,
420
CN
o6
1,97
03,
260
4,55
05,
530
6,15
0C
entra
l Flo
rida
Gre
eneW
ayM
oss
Park
Roa
dIn
nova
tion
Way
6D
87,0
000.
090.
544,
061
CN
o6
1,97
03,
260
4,55
05,
530
6,15
0C
entra
l Flo
rida
Gre
eneW
ayIn
nova
tion
Way
Beac
h Li
ne E
xpre
ssw
ay6
D10
0,20
00.
090.
544,
677
DN
o6
1,97
03,
260
4,55
05,
530
6,15
0C
entra
l Flo
rida
Gre
eneW
ayBe
ach
Line
Exp
ress
way
Lee
Vist
a Bo
ulev
ard
6D
107,
500
0.09
0.54
5,01
8D
No
61,
970
3,26
04,
550
5,53
06,
150
Cen
tral F
lorid
a G
reen
eWay
Lee
Vis
ta B
oule
vard
Cur
ry F
ord
Roa
d6
D10
3,70
00.
090.
544,
840
DN
o6
1,97
03,
260
4,55
05,
530
6,15
0
Nar
coos
see
Roa
dO
sceo
la C
ount
y Li
neTi
ndal
l Roa
d4
E47
,000
0.09
0.59
2,42
8F
Yes
625
01,
530
1,81
01,
860
1,86
0N
arco
osse
e R
oad
Tind
all R
oad
Kirb
y Sm
ith R
oad
4E
40,5
000.
090.
592,
092
FYe
s6
250
1,53
01,
810
1,86
01,
860
Nar
coos
see
Roa
dKi
rby
Sm
ith R
oad
Cen
tral F
lorid
a G
reen
eWay
4E
44,1
000.
090.
592,
278
FYe
s6
250
1,53
01,
810
1,86
01,
860
Nar
coos
see
Roa
dC
entra
l Flo
rida
Gre
eneW
ayM
oss
Park
Roa
d4
E32
,500
0.09
0.59
1,67
9C
No
425
01,
530
1,81
01,
860
1,86
0N
arco
osse
e R
oad
Mos
s Pa
rk R
oad
Inno
vatio
n W
ay4
E38
,500
0.09
0.59
1,98
9F
Yes
625
01,
530
1,81
01,
860
1,86
0N
arco
osse
e R
oad
Inno
vatio
n W
ayBe
ach
Line
Exp
ress
way
4E
54,4
000.
090.
592,
810
FYe
s6
250
1,53
01,
810
1,86
01,
860
Mos
s Pa
rk R
oad
Nar
coos
see
Roa
dC
entra
l Flo
rida
Gre
eneW
ay4
E35
,700
0.09
0.54
1,68
2C
No
425
01,
530
1,81
01,
860
1,86
0
Car
lsba
d Av
enue
Inno
vatio
n W
ayIn
nova
tion
Way
6E
64,4
000.
090.
553,
188
FYe
s8
380
2,33
02,
720
2,79
02,
790
Sem
oran
Bou
leva
rdC
olon
ial D
rive
East
Wes
t Exp
ress
way
6E
79,3
000.
070.
553,
042
FYe
s8
034
02,
110
2,57
02,
710
Sem
oran
Bou
leva
rdEa
st W
est E
xpre
ssw
ayC
urry
For
d R
oad
6E
69,7
000.
070.
552,
674
EN
o6
034
02,
110
2,57
02,
710
Sem
oran
Bou
leva
rdC
urry
For
d R
oad
Pers
hing
Ave
nue
6E
71,6
000.
070.
552,
747
FYe
s8
034
02,
110
2,57
02,
710
Sem
oran
Bou
leva
rdPe
rshi
ng A
venu
eH
offn
er A
venu
e6
E76
,400
0.07
0.55
2,93
1F
Yes
838
02,
330
2,72
02,
790
2,79
0Se
mor
an B
oule
vard
Hof
fner
Ave
nue
Lee
Vist
a Bo
ulev
ard
6E
73,5
000.
070.
552,
820
FYe
s8
380
2,33
02,
720
2,79
02,
790
Sem
oran
Bou
leva
rdLe
e V
ista
Bou
leva
rdBe
achl
ine
Expr
essw
ay6
E74
,500
0.07
0.55
2,85
8F
Yes
838
02,
330
2,72
02,
790
2,79
0
Gol
denr
od R
oad
Col
onia
l Driv
eEa
st W
est E
xpre
ssw
ay4
E42
,100
0.07
0.54
1,70
2C
No
425
01,
530
1,81
01,
860
1,86
0G
olde
nrod
Roa
dEa
st W
est E
xpre
ssw
ayC
urry
For
d R
oad
4E
47,2
000.
070.
541,
908
FYe
s6
250
1,53
01,
810
1,86
01,
860
Gol
denr
od R
oad
Cur
ry F
ord
Roa
dPe
rshi
ng A
venu
e4
E46
,700
0.07
0.54
1,88
7F
Yes
625
01,
530
1,81
01,
860
1,86
0G
olde
nrod
Roa
dPe
rshi
ng A
venu
eH
offn
er A
venu
e4
E46
,300
0.07
0.54
1,87
1F
Yes
625
01,
530
1,81
01,
860
1,86
0G
olde
nrod
Roa
dH
offn
er A
venu
eLe
e Vi
sta
Boul
evar
d4
E38
,800
0.07
0.54
1,56
8C
No
425
01,
530
1,81
01,
860
1,86
0
Chi
ckas
aw T
rail
Col
onia
l Driv
eEa
st W
est E
xpre
ssw
ay2
E22
,100
0.09
0.53
1,02
3F
Yes
40
220
720
860
890
Chi
ckas
aw T
rail
East
Wes
t Exp
ress
way
Lake
Und
erhi
ll R
oad
2E
20,9
000.
090.
5396
8F
Yes
40
220
720
860
890
Chi
ckas
aw T
rail
Lake
Und
erhi
ll R
oad
Cur
ry F
ord
Roa
d4
E24
,800
0.09
0.53
1,14
8B
No
425
01,
530
1,81
01,
860
1,86
0

Orange County, Florida Innovation Way Economic Development & Environmental Resource Management Study
December 2005
201
Table 4.5.6-5: 2025 Summary Traffic Conditions (Continued)
Chi
ckas
aw T
rail
Cur
ry F
ord
Roa
dLe
e Vi
sta
Boul
evar
d4
E29
,400
0.09
0.53
1,36
1B
No
425
01,
530
1,81
01,
860
1,86
0
Econ
lock
hatc
hee
Trai
l C
olon
ial D
rive
Vale
ncia
Col
lege
Lan
e4
E35
,100
0.08
0.52
1,47
7B
No
425
01,
530
1,81
01,
860
1,86
0Ec
onlo
ckha
tche
e Tr
ail
Vale
ncia
Col
lege
Lan
eLa
ke U
nder
hill
Roa
d4
E20
,800
0.08
0.52
876
BN
o4
250
1,53
01,
810
1,86
01,
860
Econ
lock
hatc
hee
Trai
l La
ke U
nder
hill
Roa
dC
urry
For
d R
oad
4E
25,7
000.
080.
521,
082
BN
o4
250
1,53
01,
810
1,86
01,
860
Econ
lock
hatc
hee
Trai
l C
urry
For
d R
oad
Lee
Vist
a Bo
ulev
ard
4E
33,8
000.
080.
521,
423
BN
o4
250
1,53
01,
810
1,86
01,
860
Dea
n R
oad
Col
onia
l Driv
eEa
st W
est E
xpre
ssw
ay4
E31
,600
0.08
0.53
1,34
9B
No
425
01,
530
1,81
01,
860
1,86
0D
ean
Roa
dEa
st W
est E
xpre
ssw
ayLa
ke U
nder
hill
Roa
d4
E39
,100
0.08
0.53
1,67
0C
No
425
01,
530
1,81
01,
860
1,86
0D
ean
Roa
dLa
ke U
nder
hill
Roa
dC
urry
For
d R
oad
4E
37,2
000.
080.
531,
589
CN
o4
250
1,53
01,
810
1,86
01,
860
Rou
se R
oad
Col
onia
l Driv
eEa
st W
est E
xpre
ssw
ay4
E23
,000
0.09
0.54
1,12
4B
No
425
01,
530
1,81
01,
860
1,86
0
Col
onia
l Driv
eSe
mor
an B
oule
vard
Gol
denr
od R
oad
6E
67,9
000.
070.
542,
636
CN
o6
380
2,33
02,
720
2,79
02,
790
Col
onia
l Driv
eG
olde
nrod
Roa
dC
entra
l Flo
rida
Gre
eneW
ay6
E64
,700
0.07
0.54
2,51
2C
No
638
02,
330
2,72
02,
790
2,79
0C
olon
ial D
rive
Cen
tral F
lorid
a G
reen
eWay
Econ
lock
hatc
hee
Trai
l 6
E65
,700
0.07
0.54
2,55
1C
No
638
02,
330
2,72
02,
790
2,79
0C
olon
ial D
rive
Econ
lock
hatc
hee
Trai
l D
ean
Roa
d6
E73
,500
0.07
0.54
2,85
4F
Yes
838
02,
330
2,72
02,
790
2,79
0C
olon
ial D
rive
Dea
n R
oad
Rou
se R
oad
6E
76,3
000.
070.
542,
962
FYe
s8
380
2,33
02,
720
2,79
02,
790
Col
onia
l Driv
eR
ouse
Roa
dAl
afay
a Tr
ail
6E
66,8
000.
070.
542,
594
CN
o6
380
2,33
02,
720
2,79
02,
790
Col
onia
l Driv
eAl
afay
a Tr
ail
East
Wes
t Exp
ress
way
6E
57,2
000.
070.
542,
221
DN
o6
00
1,02
02,
330
2,58
0C
olon
ial D
rive
East
Wes
t Exp
ress
way
Aval
on R
oad
6E
71,3
000.
070.
542,
768
FYe
s8
034
02,
110
2,57
02,
710
Col
onia
l Driv
eAv
alon
Roa
dSR
520
4E
61,9
000.
080.
562,
788
DN
o4
980
1,59
02,
300
2,98
03,
390
Col
onia
l Driv
eEa
st o
f SR
520
4E
33,6
000.
080.
561,
513
BN
o4
980
1,59
02,
300
2,98
03,
390
Pers
hing
Ave
.Se
mor
an B
oule
vard
Gol
denr
od R
oad
4E
30,5
000.
090.
621,
595
DN
o4
022
01,
360
1,71
01,
800
Hof
fner
Ave
.Se
mor
an B
oule
vard
Gol
denr
od R
oad
4E
30,2
000.
080.
531,
210
BN
o4
250
1,53
01,
810
1,86
01,
860
Lee
Vist
a Bo
ulev
ard
Sem
oran
Bou
leva
rdG
olde
nrod
Roa
d4
E46
,000
0.09
0.54
2,16
7F
Yes
625
01,
530
1,81
01,
860
1,86
0Le
e Vi
sta
Boul
evar
dG
olde
nrod
Roa
dH
offn
er R
oad
4E
39,9
000.
090.
541,
880
FYe
s6
250
1,53
01,
810
1,86
01,
860
Lee
Vist
a Bo
ulev
ard
Hof
fner
Roa
dEc
onlo
ckha
tche
e Tr
ail
4E
36,6
000.
090.
541,
725
CN
o4
250
1,53
01,
810
1,86
01,
860
Lee
Vist
a Bo
ulev
ard
Econ
lock
hatc
hee
Trai
lC
entra
l Flo
rida
Gre
eneW
ay4
E19
,900
0.09
0.54
938
BN
o4
250
1,53
01,
810
1,86
01,
860
Lake
Non
a N
/S R
oad
Gol
denr
od R
oad
Exte
nsio
nN
arco
osse
e R
oad
4E
14,8
000.
090.
5573
3B
No
425
01,
530
1,81
01,
860
1,86
0
Not
e: 1
. Th
e m
inim
um L
OS
stan
dard
was
obt
aine
d fro
m O
rang
e C
ount
y Tr
ansp
orta
tion
Ele
men
t.2.
The
AA
DT
was
obt
aine
d by
mul
tiply
ing
the
daily
mod
el v
olum
es (P
SWAD
T) w
ith a
Mod
el O
utpu
t Cor
rect
ion
Fact
or (M
OC
F) o
f 0.9
8. In
the
inst
ance
s w
hen
the
mod
el v
olum
es w
ere
low
er th
an e
xist
ing
cond
ition
s,
grow
th ra
tes
wer
e ap
plie
d.3.
The
pea
k ho
ur p
eak
dire
ctio
n vo
lum
es w
ere
obta
ined
by
mul
tiply
ing
the
AAD
T w
ith th
e K
and
D fa
ctor
s.
4. T
he p
eak
hour
pea
k di
rect
ion
LOS
obta
ined
by
com
parin
g th
e pe
ak h
our p
eak
dire
ctio
n vo
lum
es to
the
peak
hou
r pea
k di
rect
ion
capa
citie
s fro
m F
DO
T 20
02 Q
ualit
y/LO
S H
andb
ook.
5. K
100 a
nd D
100
wer
e ob
tain
ed fr
om O
rang
e C
ount
y Tr
ansp
orta
tion
Elem
ent.
6. T
he h
ighl
ight
ed ro
ws
indi
cate
d th
at th
e ro
adw
ay s
egm
ent f
ails
at d
aily
or p
eak
hour
pea
k di
rect
ion
cond
ition
.
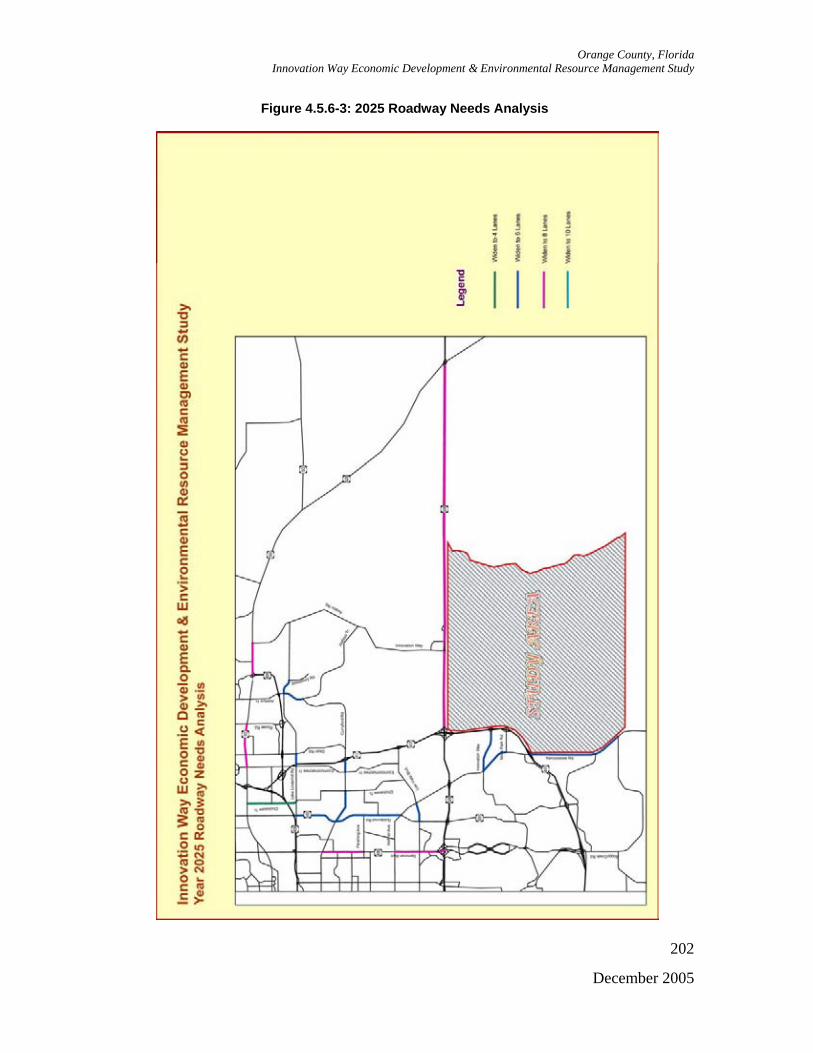
Orange County, Florida Innovation Way Economic Development & Environmental Resource Management Study
December 2005
202
Figure 4.5.6-3: 2025 Roadway Needs Analysis
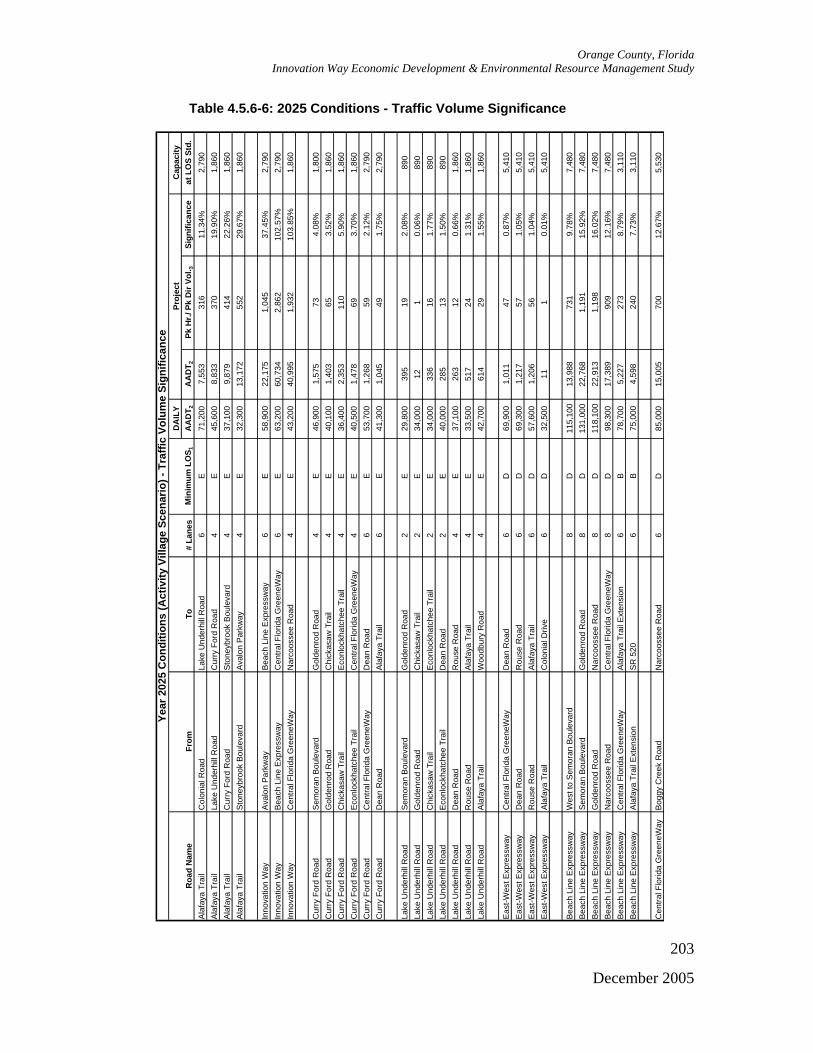
Orange County, Florida Innovation Way Economic Development & Environmental Resource Management Study
December 2005
203
Cap
acity
AA
DT 2
AA
DT 2
Pk H
r./ P
k D
ir Vo
l. 3Si
gnifi
canc
eat
LO
S St
d.Al
afay
a Tr
ail
Col
onia
l Roa
dLa
ke U
nder
hill
Roa
d6
E71
,200
7,55
331
611
.34%
2,79
0Al
afay
a Tr
ail
Lake
Und
erhi
ll R
oad
Cur
ry F
ord
Roa
d4
E45
,600
8,83
337
019
.90%
1,86
0Al
afay
a Tr
ail
Cur
ry F
ord
Roa
dS
tone
ybro
ok B
oule
vard
4E
37,1
009,
879
414
22.2
6%1,
860
Alaf
aya
Trai
l S
tone
ybro
ok B
oule
vard
Ava
lon
Par
kway
4E
32,3
0013
,172
552
29.6
7%1,
860
Inno
vatio
n W
ayA
valo
n Pa
rkw
ayB
each
Lin
e E
xpre
ssw
ay6
E58
,900
22,1
751,
045
37.4
5%2,
790
Inno
vatio
n W
ayB
each
Lin
e Ex
pres
sway
Cen
tral F
lorid
a G
reen
eWay
6E
63,2
0060
,734
2,86
210
2.57
%2,
790
Inno
vatio
n W
ayC
entra
l Flo
rida
Gre
eneW
ayN
arco
osse
e R
oad
4E
43,2
0040
,995
1,93
210
3.85
%1,
860
Cur
ry F
ord
Roa
dS
emor
an B
oule
vard
Gol
denr
od R
oad
4E
46,9
001,
575
734.
08%
1,80
0C
urry
For
d R
oad
Gol
denr
od R
oad
Chi
ckas
aw T
rail
4E
40,1
001,
403
653.
52%
1,86
0C
urry
For
d R
oad
Chi
ckas
aw T
rail
Eco
nloc
khat
chee
Tra
il4
E36
,400
2,35
311
05.
90%
1,86
0C
urry
For
d R
oad
Eco
nloc
khat
chee
Tra
ilC
entra
l Flo
rida
Gre
eneW
ay4
E40
,500
1,47
869
3.70
%1,
860
Cur
ry F
ord
Roa
dC
entra
l Flo
rida
Gre
eneW
ayD
ean
Roa
d6
E53
,700
1,26
859
2.12
%2,
790
Cur
ry F
ord
Roa
dD
ean
Roa
dA
lafa
ya T
rail
6E
41,3
001,
045
491.
75%
2,79
0
Lake
Und
erhi
ll R
oad
Sem
oran
Bou
leva
rdG
olde
nrod
Roa
d2
E29
,800
395
192.
08%
890
Lake
Und
erhi
ll R
oad
Gol
denr
od R
oad
Chi
ckas
aw T
rail
2E
34,0
0012
10.
06%
890
Lake
Und
erhi
ll R
oad
Chi
ckas
aw T
rail
Eco
nloc
khat
chee
Tra
il2
E34
,000
336
161.
77%
890
Lake
Und
erhi
ll R
oad
Eco
nloc
khat
chee
Tra
ilD
ean
Roa
d2
E40
,000
285
131.
50%
890
Lake
Und
erhi
ll R
oad
Dea
n R
oad
Rou
se R
oad
4E
37,1
0026
312
0.66
%1,
860
Lake
Und
erhi
ll R
oad
Rou
se R
oad
Ala
faya
Tra
il4
E33
,500
517
241.
31%
1,86
0La
ke U
nder
hill
Roa
dA
lafa
ya T
rail
Woo
dbur
y R
oad
4E
42,7
0061
429
1.55
%1,
860
East
-Wes
t Exp
ress
way
Cen
tral F
lorid
a G
reen
eWay
Dea
n R
oad
6D
69,9
001,
011
470.
87%
5,41
0Ea
st-W
est E
xpre
ssw
ayD
ean
Roa
dR
ouse
Roa
d6
D69
,300
1,21
757
1.05
%5,
410
East
-Wes
t Exp
ress
way
Rou
se R
oad
Ala
faya
Tra
il6
D57
,600
1,20
656
1.04
%5,
410
East
-Wes
t Exp
ress
way
Ala
faya
Tra
ilC
olon
ial D
rive
6D
32,5
0011
10.
01%
5,41
0
Beac
h Li
ne E
xpre
ssw
ayW
est t
o Se
mor
an B
oule
vard
8D
115,
100
13,9
8873
19.
78%
7,48
0Be
ach
Line
Exp
ress
way
Sem
oran
Bou
leva
rdG
olde
nrod
Roa
d8
D13
1,00
022
,768
1,19
115
.92%
7,48
0Be
ach
Line
Exp
ress
way
Gol
denr
od R
oad
Nar
coos
see
Roa
d8
D11
8,10
022
,913
1,19
816
.02%
7,48
0Be
ach
Line
Exp
ress
way
Nar
coos
see
Roa
dC
entra
l Flo
rida
Gre
eneW
ay8
D98
,300
17,3
8990
912
.16%
7,48
0Be
ach
Line
Exp
ress
way
Cen
tral F
lorid
a G
reen
eWay
Ala
faya
Tra
il E
xten
sion
6B
78,7
005,
227
273
8.79
%3,
110
Beac
h Li
ne E
xpre
ssw
ayA
lafa
ya T
rail
Ext
ensi
onS
R 5
206
B75
,000
4,59
824
07.
73%
3,11
0
Cen
tral F
lorid
a G
reen
eWay
Bog
gy C
reek
Roa
dN
arco
osse
e R
oad
6D
85,0
0015
,005
700
12.6
7%5,
530
Proj
ect
Year
202
5 C
ondi
tions
(Act
ivity
Vill
age
Scen
ario
) - T
raffi
c Vo
lum
e Si
gnifi
canc
e
Min
imum
LO
S 1D
AIL
YR
oad
Nam
eFr
omTo
# La
nes
Table 4.5.6-6: 2025 Conditions - Traffic Volume Significance
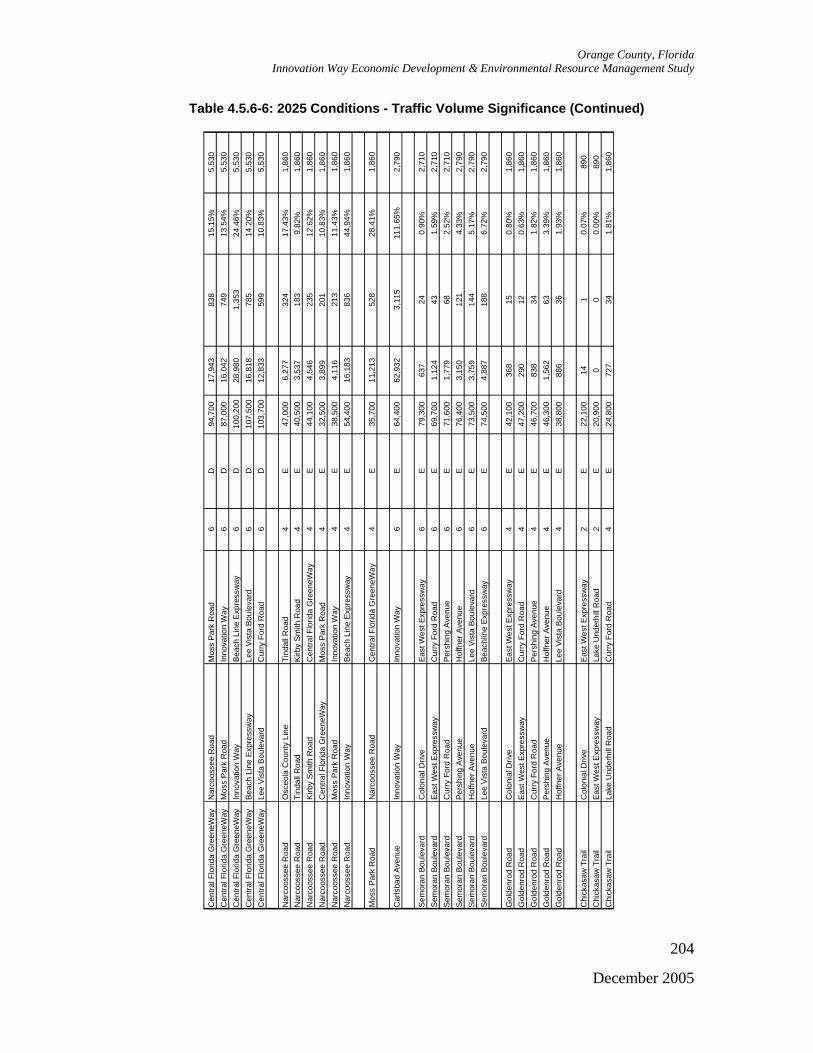
Orange County, Florida Innovation Way Economic Development & Environmental Resource Management Study
December 2005
204
Cen
tral F
lorid
a G
reen
eWay
Nar
coos
see
Roa
dM
oss
Park
Roa
d6
D94
,700
17,9
4383
815
.15%
5,53
0C
entra
l Flo
rida
Gre
eneW
ayM
oss
Park
Roa
dIn
nova
tion
Way
6D
87,0
0016
,042
749
13.5
4%5,
530
Cen
tral F
lorid
a G
reen
eWay
Inno
vatio
n W
ayBe
ach
Line
Exp
ress
way
6D
100,
200
28,9
801,
353
24.4
6%5,
530
Cen
tral F
lorid
a G
reen
eWay
Beac
h Li
ne E
xpre
ssw
ayLe
e Vi
sta
Bou
leva
rd6
D10
7,50
016
,818
785
14.2
0%5,
530
Cen
tral F
lorid
a G
reen
eWay
Lee
Vis
ta B
oule
vard
Cur
ry F
ord
Roa
d6
D10
3,70
012
,833
599
10.8
3%5,
530
Nar
coos
see
Roa
dO
sceo
la C
ount
y Li
neTi
ndal
l Roa
d4
E47
,000
6,27
732
417
.43%
1,86
0N
arco
osse
e R
oad
Tind
all R
oad
Kirb
y S
mith
Roa
d4
E40
,500
3,53
718
39.
82%
1,86
0N
arco
osse
e R
oad
Kirb
y Sm
ith R
oad
Cen
tral F
lorid
a G
reen
eWay
4E
44,1
004,
546
235
12.6
2%1,
860
Nar
coos
see
Roa
dC
entra
l Flo
rida
Gre
eneW
ayM
oss
Park
Roa
d4
E32
,500
3,89
920
110
.83%
1,86
0N
arco
osse
e R
oad
Mos
s Pa
rk R
oad
Inno
vatio
n W
ay4
E38
,500
4,11
621
311
.43%
1,86
0N
arco
osse
e R
oad
Inno
vatio
n W
ayBe
ach
Line
Exp
ress
way
4E
54,4
0016
,183
836
44.9
4%1,
860
Mos
s P
ark
Roa
dN
arco
osse
e R
oad
Cen
tral F
lorid
a G
reen
eWay
4E
35,7
0011
,213
528
28.4
1%1,
860
Car
lsba
d A
venu
eIn
nova
tion
Way
Inno
vatio
n W
ay6
E64
,400
62,9
323,
115
111.
65%
2,79
0
Sem
oran
Bou
leva
rdC
olon
ial D
rive
East
Wes
t Exp
ress
way
6E
79,3
0063
724
0.90
%2,
710
Sem
oran
Bou
leva
rdEa
st W
est E
xpre
ssw
ayC
urry
For
d R
oad
6E
69,7
001,
124
431.
59%
2,71
0S
emor
an B
oule
vard
Cur
ry F
ord
Roa
dPe
rshi
ng A
venu
e6
E71
,600
1,77
968
2.52
%2,
710
Sem
oran
Bou
leva
rdPe
rshi
ng A
venu
eH
offn
er A
venu
e6
E76
,400
3,15
012
14.
33%
2,79
0S
emor
an B
oule
vard
Hof
fner
Ave
nue
Lee
Vist
a B
oule
vard
6E
73,5
003,
759
144
5.17
%2,
790
Sem
oran
Bou
leva
rdLe
e V
ista
Bou
leva
rdBe
achl
ine
Exp
ress
way
6E
74,5
004,
887
188
6.72
%2,
790
Gol
denr
od R
oad
Col
onia
l Driv
eEa
st W
est E
xpre
ssw
ay4
E42
,100
368
150.
80%
1,86
0G
olde
nrod
Roa
dEa
st W
est E
xpre
ssw
ayC
urry
For
d R
oad
4E
47,2
0029
012
0.63
%1,
860
Gol
denr
od R
oad
Cur
ry F
ord
Roa
dPe
rshi
ng A
venu
e4
E46
,700
838
341.
82%
1,86
0G
olde
nrod
Roa
dPe
rshi
ng A
venu
eH
offn
er A
venu
e4
E46
,300
1,56
263
3.39
%1,
860
Gol
denr
od R
oad
Hof
fner
Ave
nue
Lee
Vist
a B
oule
vard
4E
38,8
0088
636
1.93
%1,
860
Chi
ckas
aw T
rail
Col
onia
l Driv
eEa
st W
est E
xpre
ssw
ay2
E22
,100
141
0.07
%89
0C
hick
asaw
Tra
ilEa
st W
est E
xpre
ssw
ayLa
ke U
nder
hill
Roa
d2
E20
,900
00
0.00
%89
0C
hick
asaw
Tra
ilLa
ke U
nder
hill
Roa
dC
urry
For
d R
oad
4E
24,8
0072
734
1.81
%1,
860
Table 4.5.6-6: 2025 Conditions - Traffic Volume Significance (Continued)

Orange County, Florida Innovation Way Economic Development & Environmental Resource Management Study
December 2005
205
Chi
ckas
aw T
rail
Cur
ry F
ord
Roa
dLe
e Vi
sta
Boul
evar
d4
E29
,400
616
291.
53%
1,86
0
Econ
lock
hatc
hee
Trai
l C
olon
ial D
rive
Val
enci
a C
olle
ge L
ane
4E
35,1
0056
20.
13%
1,86
0Ec
onlo
ckha
tche
e Tr
ail
Vale
ncia
Col
lege
Lan
eLa
ke U
nder
hill
Roa
d4
E20
,800
834
0.19
%1,
860
Econ
lock
hatc
hee
Trai
l La
ke U
nder
hill
Roa
dC
urry
For
d R
oad
4E
25,7
0079
533
1.80
%1,
860
Econ
lock
hatc
hee
Trai
l C
urry
For
d R
oad
Lee
Vist
a Bo
ulev
ard
4E
33,8
002,
630
111
5.95
%1,
860
Dea
n R
oad
Col
onia
l Driv
eE
ast W
est E
xpre
ssw
ay4
E31
,600
945
402.
17%
1,86
0D
ean
Roa
dEa
st W
est E
xpre
ssw
ayLa
ke U
nder
hill
Roa
d4
E39
,100
692
301.
59%
1,86
0D
ean
Roa
dLa
ke U
nder
hill
Roa
dC
urry
For
d R
oad
4E
37,2
001,
039
442.
39%
1,86
0
Rou
se R
oad
Col
onia
l Driv
eE
ast W
est E
xpre
ssw
ay4
E23
,000
446
221.
17%
1,86
0
Col
onia
l Driv
eS
emor
an B
oule
vard
Gol
denr
od R
oad
6E
67,9
001,
166
451.
62%
2,79
0C
olon
ial D
rive
Gol
denr
od R
oad
Cen
tral F
lorid
a G
reen
eWay
6E
64,7
002,
652
103
3.69
%2,
790
Col
onia
l Driv
eC
entra
l Flo
rida
Gre
eneW
ayEc
onlo
ckha
tche
e Tr
ail
6E
65,7
0063
024
0.88
%2,
790
Col
onia
l Driv
eE
conl
ockh
atch
ee T
rail
Dea
n R
oad
6E
73,5
001,
170
451.
63%
2,79
0C
olon
ial D
rive
Dea
n R
oad
Rou
se R
oad
6E
76,3
001,
413
551.
97%
2,79
0C
olon
ial D
rive
Rou
se R
oad
Alaf
aya
Trai
l6
E66
,800
2,10
482
2.93
%2,
790
Col
onia
l Driv
eA
lafa
ya T
rail
Eas
t Wes
t Exp
ress
way
6E
57,2
0085
233
1.28
%2,
580
Col
onia
l Driv
eE
ast W
est E
xpre
ssw
ayAv
alon
Roa
d6
E71
,300
1,63
764
2.35
%2,
710
Col
onia
l Driv
eA
valo
n R
oad
SR 5
204
E61
,900
525
240.
70%
3,39
0C
olon
ial D
rive
Eas
t of S
R 5
204
E33
,600
553
250.
73%
3,39
0
Pers
hing
Ave
.Se
mor
an B
oule
vard
Gol
denr
od R
oad
4E
30,5
0056
429
1.64
%1,
800
Hof
fner
Ave
.Se
mor
an B
oule
vard
Gol
denr
od R
oad
4E
30,2
001,
673
673.
60%
1,86
0
Lee
Vist
a Bo
ulev
ard
Sem
oran
Bou
leva
rdG
olde
nrod
Roa
d4
E46
,000
1,20
557
3.05
%1,
860
Lee
Vist
a Bo
ulev
ard
Gol
denr
od R
oad
Hof
fner
Roa
d4
E39
,900
1,02
248
2.59
%1,
860
Lee
Vist
a Bo
ulev
ard
Hof
fner
Roa
dEc
onlo
ckha
tche
e Tr
ail
4E
36,6
0065
931
1.67
%1,
860
Lee
Vist
a Bo
ulev
ard
Eco
nloc
khat
chee
Tra
ilC
entra
l Flo
rida
Gre
eneW
ay4
E19
,900
3,98
618
810
.10%
1,86
0
Lake
Non
a N
/S R
oad
Gol
denr
od R
oad
Exte
nsio
nN
arco
osse
e R
oad
4E
14,8
006,
889
341
18.3
3%1,
860
Lake
Non
a N
/S R
oad
Nar
coos
see
Roa
dC
entra
l Flo
rida
Gre
eneW
ay4
E25
,800
6,88
934
118
.33%
1,86
0
Not
e: 1
. Th
e m
inim
um L
OS
stan
dard
was
obt
aine
d fro
m O
rang
e C
ount
y Tr
ansp
orta
tion
Elem
ent.
2. T
he A
AD
T w
as o
btai
ned
by m
ultip
lyin
g th
e da
ily m
odel
vol
umes
(PSW
ADT)
with
a M
odel
Out
put C
orre
ctio
n Fa
ctor
(MO
CF)
of 0
.98.
3. T
he p
eak
hour
pea
k di
rect
ion
volu
mes
wer
e ob
tain
ed b
y m
ultip
lyin
g th
e AA
DT
with
the
K an
d D
fact
ors.
Table 4.5.6-6: 2025 Conditions - Traffic Volume Significance (Continued)

Orange County, Florida Innovation Way Economic Development & Environmental Resource Management Study
December 2005
206
4.5.7 Internal Transportation System Innovation Way was envisioned as a community emphasizing high tech employment opportunities with residential neighborhoods built around retail, and a preplanned “green infrastructure”. Innovation Way provides internal facilities in which residents and corridor employees rely less on the use of automobiles as the primary means of travel for work, shop, recreational, and school activities. Performance standards are proposed to encourage the use of non-auto travel modes. Internal Roadways Performance Standards Level of service performance standards for the Innovation Way internal roadway system is presented in Table 4.5.7-1. The roadway performance standards will be measured based on travel speed, consistent with the standards adopted for Horizon West.
VILLAGE/LOS CATEGORY COLLECTOR NEIGHBORHOOD
Range of Free Flow Speeds (mph) 45 to 35 mph 35 to 30 mph
Typical Free Flow Speeds (mph) 40 to 45 mph 30 to 35 mph
LEVEL OF SERVICEA >35 >30B >28 >24C >22 >18D >17 >14E >13 >10F <13 <10
RECOMMENDED STANDARDS:Collector Roads: LOS DVillage/Neighborhood Roads: LOS E
AVERAGE TRAVEL SPEED (MPH)
Internal Roadway Performance Standards and LOS
Because travel speeds are impossible to predict using traffic projections, the analysis completed for the 2010, 2015 and 2025 future conditions, based on a comparison of volume to capacity, indicated that all the internal roads are anticipated to operate at acceptable operating conditions. The major arterial roads comprising the internal roadway network system serving the Innovation Way corridor consists of:
• Innovation Way from SR 417 to SR 528 – 6-lane urban divided arterial, and • Carlsbad Road from Innovation Way to Moss Park Road – 6-lane urban arterial.
Figure 4.5.7-1: Internal Roadway Performance Standards and LOS

Orange County, Florida Innovation Way Economic Development & Environmental Resource Management Study
December 2005
207
The alignment and configuration for all these major internal roads shall be determined when Orange County proceeds into the Roadway Conceptual Analysis phase. All other internal roads will be determined as part of future specific area plans approval. The Innovation Way corridor will be served by a network of multi-purpose roadways that will be classified according to functional hierarchy. Roads classified as arterials are designed to provide high capacity connectivity between the major on-site facilities and off-site locations. These roads have a posted speed limit of at least 40 miles per hour, thereby promoting mobility and assuring the high-speed movement of vehicular traffic flow. Accessibility to adjoining areas is not the primary function of arterial roads. As such, access to these facilities is limited and controlled. Innovation Way and Carlsbad Road are examples of on-site roads classified as arterial. Roads classified as collectors are designed to provide transition of vehicular movements between arterials and local roads. Accessibility to adjoining areas and other roadways is not as strictly controlled as in arterial roads. Posted speeds range from 30 to 40 miles per hour. Figures 4.5.7-1 and 4.5.7-2 illustrate typical sections for collectors with exclusive bike trails or on-street bicycle lanes. Roads classified as local roads provide maximum accessibility and connectivity to residential sites, employee work sites and designated parking zones. Posted speeds range from 25 to 30 miles per hour. Traffic flow is frequently interrupted because of the disruptions caused by vehicular traffic entering and exiting the local roads. As such, the need to maintain a high level of traffic flow quality on local roads is not as critical as on arterials and collectors. For this reason, local roads were excluded in the detailed analysis. Figures 4.5.7-4 through 4.5.7-5 are sample typical sections for local roads. Bicycle and Pedestrian Performance Standards Level of service standards for bicycle and pedestrian facilities are presented in Tables 4.5.7-2 and 4.5.7-3. Performance standards for bicycle facilities are measured in terms of several factors such as design amenities, conflicts with other travel modes, travel speeds and LOS of adjacent roadways. Performance standards for pedestrian facilities are measured to account for system continuity, conflicts with other modes of travel, and amenities. The Study Area internal roads will accommodate either on-street or off-road bicycle facilities. Off-road facilities will be at least 14-ft. wide and will function as a multi-purpose path serving bicyclists, roller-blade/inline skaters, and pedestrians. In essence, a multi-purpose 14-ft. wide path will form a beltway around the core center to facilitate and promote the use of non-motorized modes of travel. All village and neighborhood roadway facilities will be designed as urban curb and gutter sections with pedestrian sidewalks on both sides of the road. Where right-of-way is not a constraint, a greenway or utility strip will separate the back of curb from the sidewalk.

Orange County, Florida Innovation Way Economic Development & Environmental Resource Management Study
December 2005
208
Where the right-of-way is constrained as in the urban core section, the pedestrian sidewalk will be at least 6-ft. wide adjacent to the curb.
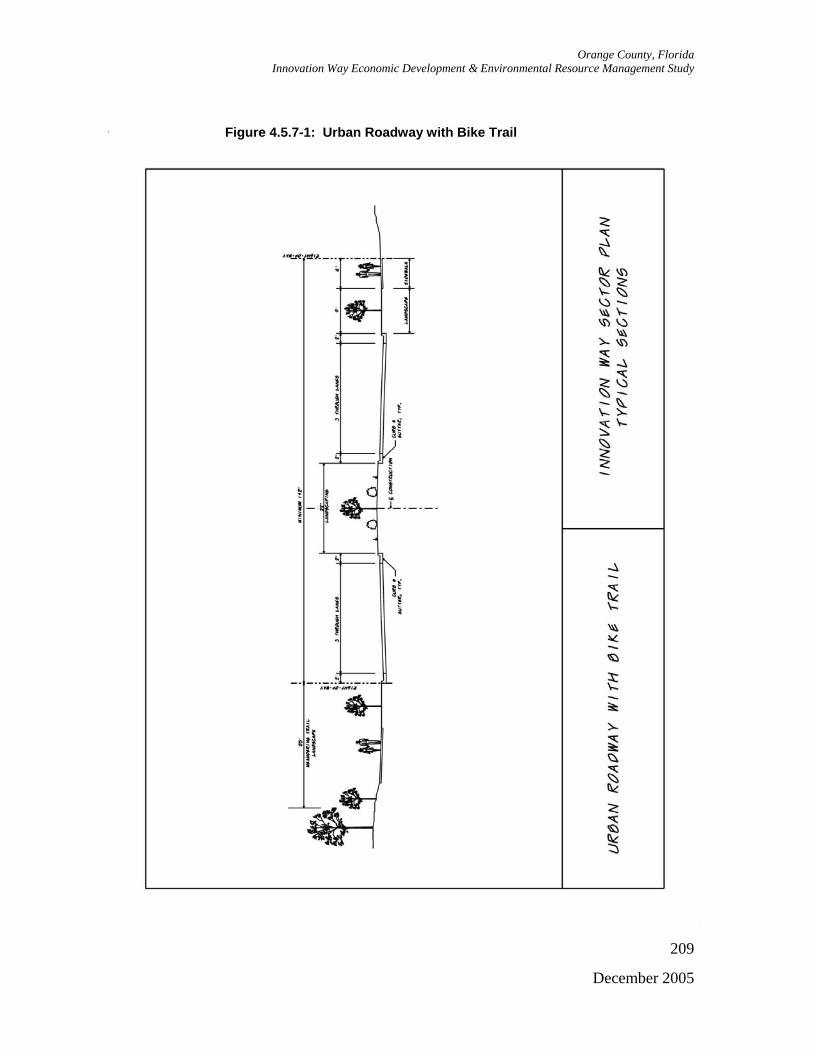
Orange County, Florida Innovation Way Economic Development & Environmental Resource Management Study
December 2005
209
Figure 4.5.7-1: Urban Roadway with Bike Trail
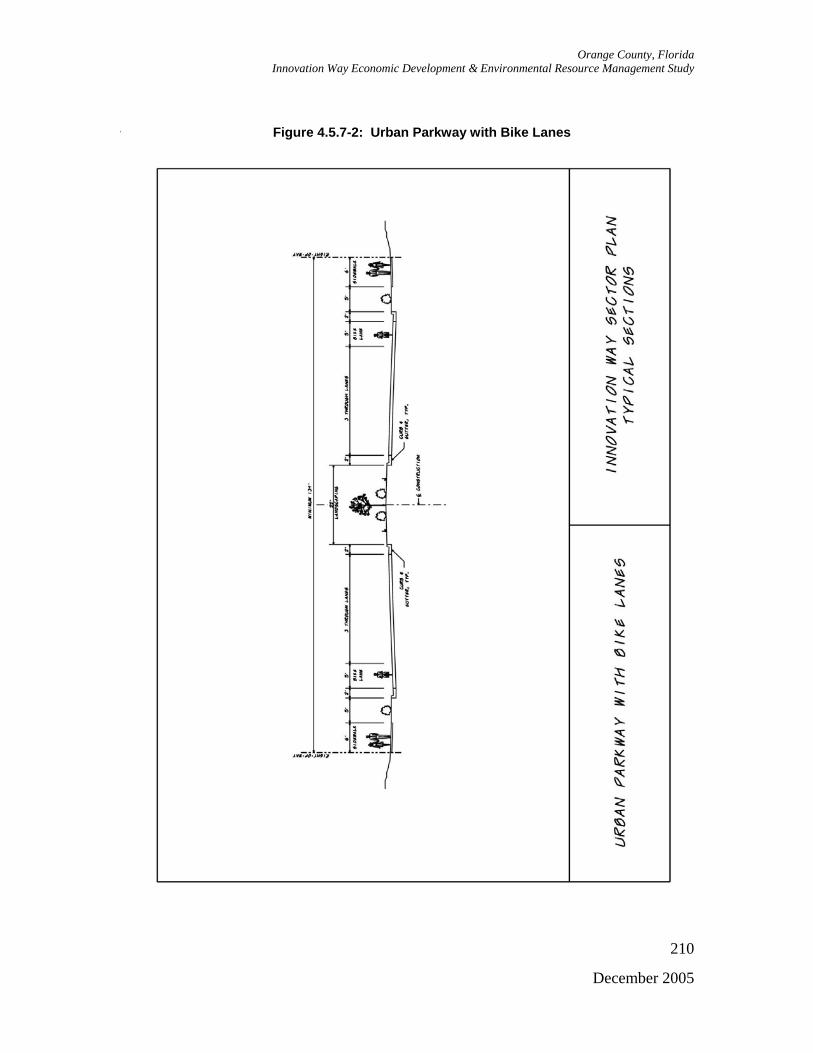
Orange County, Florida Innovation Way Economic Development & Environmental Resource Management Study
December 2005
210
Figure 4.5.7-2: Urban Parkway with Bike Lanes

Orange County, Florida Innovation Way Economic Development & Environmental Resource Management Study
December 2005
211
Figure 4.5.7-3: Traditional Town Center Circulator
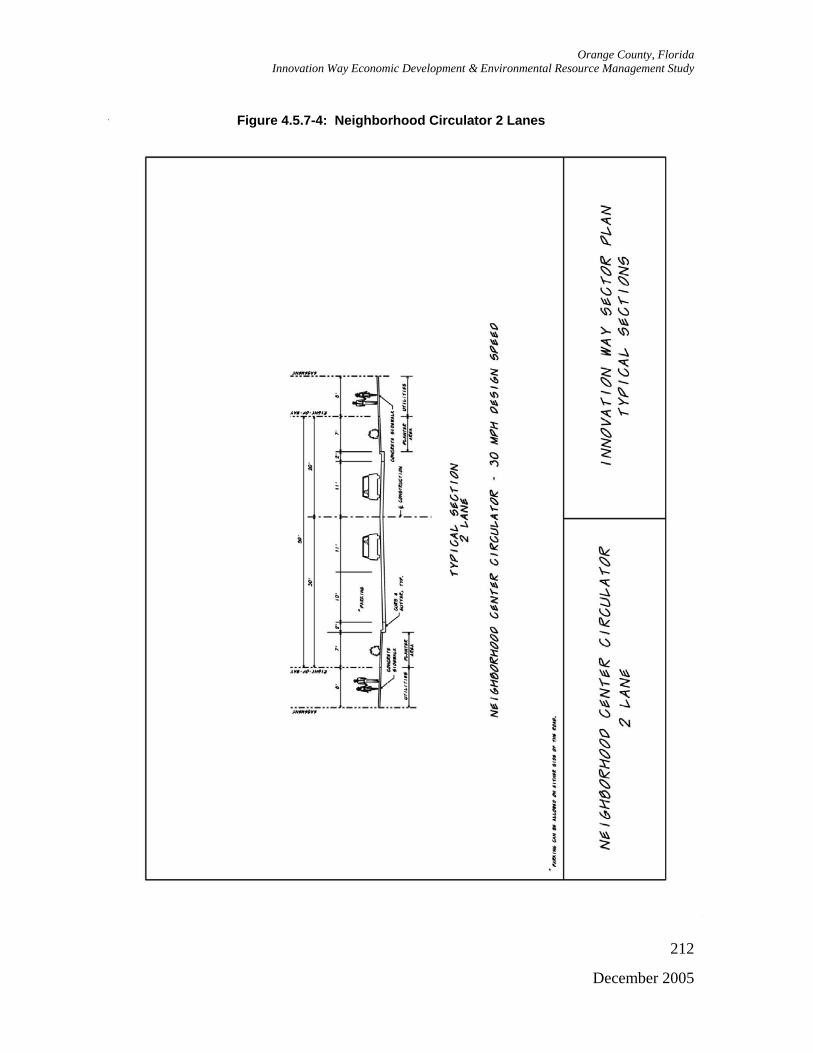
Orange County, Florida Innovation Way Economic Development & Environmental Resource Management Study
December 2005
212
Figure 4.5.7-4: Neighborhood Circulator 2 Lanes
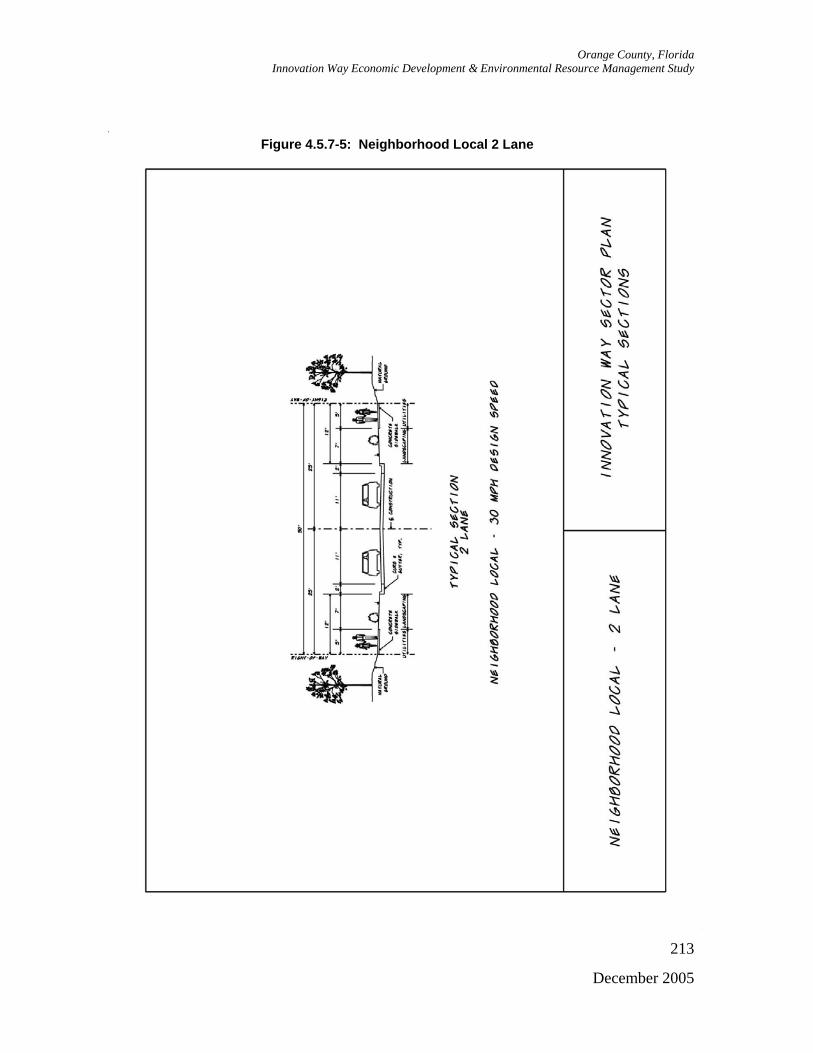
Orange County, Florida Innovation Way Economic Development & Environmental Resource Management Study
December 2005
213
Figure 4.5.7-5: Neighborhood Local 2 Lane
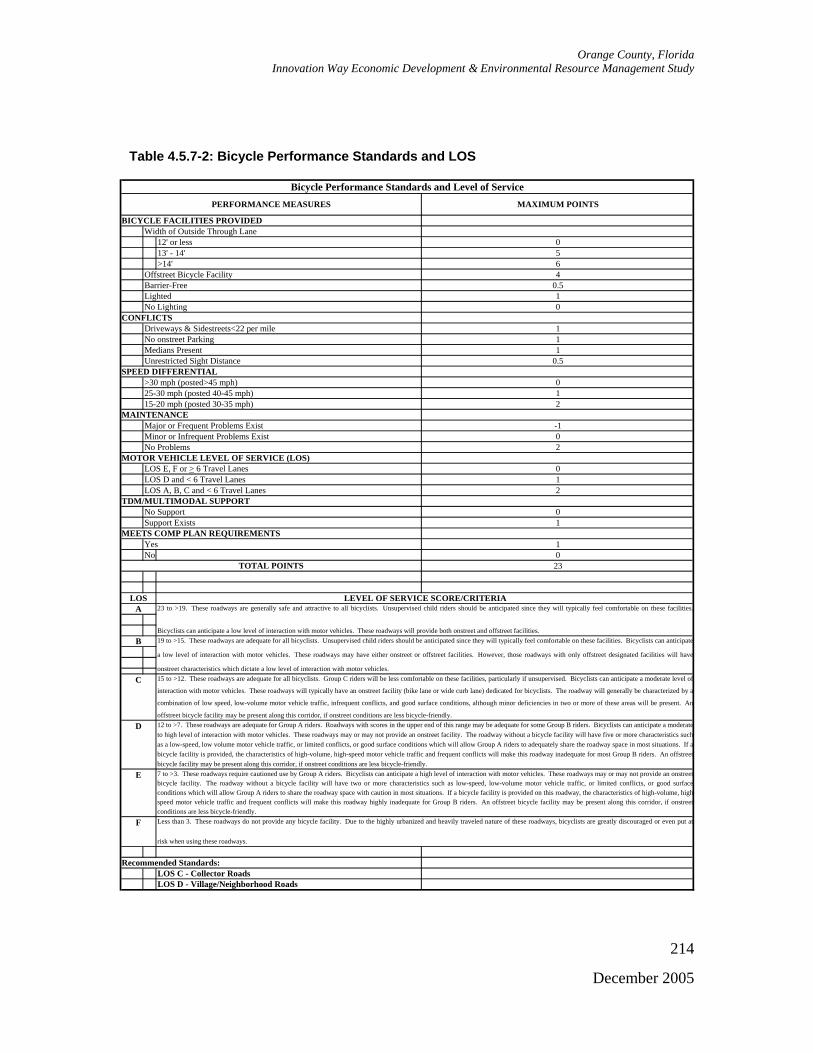
Orange County, Florida Innovation Way Economic Development & Environmental Resource Management Study
December 2005
214
BICYCLE FACILITIES PROVIDEDWidth of Outside Through Lane
12' or less 013' - 14' 5>14' 6
Offstreet Bicycle Facility 4Barrier-Free 0.5Lighted 1No Lighting 0
CONFLICTSDriveways & Sidestreets<22 per mile 1No onstreet Parking 1Medians Present 1Unrestricted Sight Distance 0.5
SPEED DIFFERENTIAL>30 mph (posted>45 mph) 025-30 mph (posted 40-45 mph) 115-20 mph (posted 30-35 mph) 2
MAINTENANCEMajor or Frequent Problems Exist -1Minor or Infrequent Problems Exist 0No Problems 2
MOTOR VEHICLE LEVEL OF SERVICE (LOS)LOS E, F or > 6 Travel Lanes 0LOS D and < 6 Travel Lanes 1LOS A, B, C and < 6 Travel Lanes 2
TDM/MULTIMODAL SUPPORTNo Support 0Support Exists 1
MEETS COMP PLAN REQUIREMENTSYes 1No 0
23
Recommended Standards:LOS C - Collector RoadsLOS D - Village/Neighborhood Roads
Bicycle Performance Standards and Level of ServicePERFORMANCE MEASURES MAXIMUM POINTS
TOTAL POINTS
A 23 to >19. These roadways are generally safe and attractive to all bicyclists. Unsupervised child riders should be anticipated since they will typically feel comfortable on these facilities.
Bicyclists can anticipate a low level of interaction with motor vehicles. These roadways will provide both onstreet and offstreet facilities.
C 15 to >12. These roadways are adequate for all bicyclists. Group C riders will be less comfortable on these facilities, particularly if unsupervised. Bicyclists can anticipate a moderate level of
interaction with motor vehicles. These roadways will typically have an onstreet facility (bike lane or wide curb lane) dedicated for bicyclists. The roadway will generally be characterized by a
combination of low speed, low-volume motor vehicle traffic, infrequent conflicts, and good surface conditions, although minor deficiencies in two or more of these areas will be present. An
offstreet bicycle facility may be present along this corridor, if onstreet conditions are less bicycle-friendly.
B 19 to >15. These roadways are adequate for all bicyclists. Unsupervised child riders should be anticipated since they will typically feel comfortable on these facilities. Bicyclists can anticipate
a low level of interaction with motor vehicles. These roadways may have either onstreet or offstreet facilities. However, those roadways with only offstreet designated facilities will have
onstreet characteristics which dictate a low level of interaction with motor vehicles.
LOS LEVEL OF SERVICE SCORE/CRITERIA
F Less than 3. These roadways do not provide any bicycle facility. Due to the highly urbanized and heavily traveled nature of these roadways, bicyclists are greatly discouraged or even put at
risk when using these roadways.
D 12 to >7. These roadways are adequate for Group A riders. Roadways with scores in the upper end of this range may be adequate for some Group B riders. Bicyclists can anticipate a moderateto high level of interaction with motor vehicles. These roadways may or may not provide an onstreet facility. The roadway without a bicycle facility will have five or more characteristics suchas a low-speed, low volume motor vehicle traffic, or limited conflicts, or good surface conditions which will allow Group A riders to adequately share the roadway space in most situations. If abicycle facility is provided, the characteristics of high-volume, high-speed motor vehicle traffic and frequent conflicts will make this roadway inadequate for most Group B riders. An offstreetbicycle facility may be present along this corridor, if onstreet conditions are less bicycle-friendly.
E 7 to >3. These roadways require cautioned use by Group A riders. Bicyclists can anticipate a high level of interaction with motor vehicles. These roadways may or may not provide an onstreetbicycle facility. The roadway without a bicycle facility will have two or more characteristics such as low-speed, low-volume motor vehicle traffic, or limited conflicts, or good surfaceconditions which will allow Group A riders to share the roadway space with caution in most situations. If a bicycle facility is provided on this roadway, the characteristics of high-volume, highspeed motor vehicle traffic and frequent conflicts will make this roadway highly inadequate for Group B riders. An offstreet bicycle facility may be present along this corridor, if onstreetconditions are less bicycle-friendly.
Table 4.5.7-2: Bicycle Performance Standards and LOS
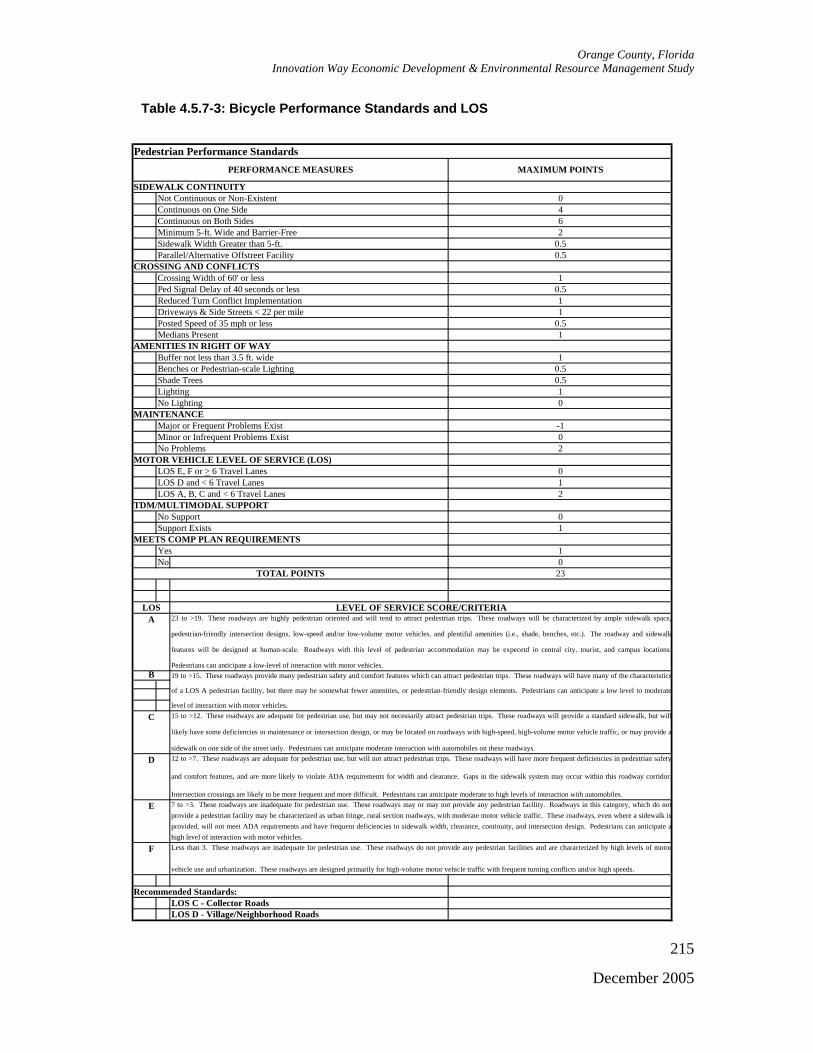
Orange County, Florida Innovation Way Economic Development & Environmental Resource Management Study
December 2005
215
SIDEWALK CONTINUITYNot Continuous or Non-Existent 0Continuous on One Side 4Continuous on Both Sides 6Minimum 5-ft. Wide and Barrier-Free 2Sidewalk Width Greater than 5-ft. 0.5Parallel/Alternative Offstreet Facility 0.5
CROSSING AND CONFLICTSCrossing Width of 60' or less 1
0.51
Driveways & Side Streets < 22 per mile 1Posted Speed of 35 mph or less 0.5Medians Present 1
AMENITIES IN RIGHT OF WAYBuffer not less than 3.5 ft. wide 1Benches or Pedestrian-scale Lighting 0.5
0.510
MAINTENANCEMajor or Frequent Problems Exist -1Minor or Infrequent Problems Exist 0No Problems 2
MOTOR VEHICLE LEVEL OF SERVICE (LOS)LOS E, F or > 6 Travel Lanes 0LOS D and < 6 Travel Lanes 1LOS A, B, C and < 6 Travel Lanes 2
TDM/MULTIMODAL SUPPORTNo Support 0Support Exists 1
MEETS COMP PLAN REQUIREMENTSYes 1No 0
23
Recommended Standards:LOS C - Collector RoadsLOS D - Village/Neighborhood Roads
F Less than 3. These roadways are inadequate for pedestrian use. These roadways do not provide any pedestrian facilities and are characterized by high levels of motor
vehicle use and urbanization. These roadways are designed primarily for high-volume motor vehicle traffic with frequent turning conflicts and/or high speeds.
D 12 to >7. These roadways are adequate for pedestrian use, but will not attract pedestrian trips. These roadways will have more frequent deficiencies in pedestrian safety
and comfort features, and are more likely to violate ADA requirements for width and clearance. Gaps in the sidewalk system may occur within this roadway corridor.
Intersection crossings are likely to be more frequent and more difficult. Pedestrians can anticipate moderate to high levels of interaction with automobiles.
E 7 to >3. These roadways are inadequate for pedestrian use. These roadways may or may not provide any pedestrian facility. Roadways in this category, which do notprovide a pedestrian facility may be characterized as urban fringe, rural section roadways, with moderate motor vehicle traffic. These roadways, even where a sidewalk isprovided, will not meet ADA requirements and have frequent deficiencies in sidewalk width, clearance, continuity, and intersection design. Pedestrians can anticipate ahigh level of interaction with motor vehicles.
TOTAL POINTS
23 to >19. These roadways are highly pedestrian oriented and will tend to attract pedestrian trips. These roadways will be characterized by ample sidewalk space,
pedestrian-friendly intersection designs, low-speed and/or low-volume motor vehicles, and plentiful amenities (i.e., shade, benches, etc.). The roadway and sidewalk
features will be designed at human-scale. Roadways with this level of pedestrian accommodation may be expecetd in central city, tourist, and campus locations.
Pedestrians can anticipate a low-level of interaction with motor vehicles.
C 15 to >12. These roadways are adequate for pedestrian use, but may not necessarily attract pedestrian trips. These roadways will provide a standard sidewalk, but will
likely have some deficiencies in maintenance or intersection design, or may be located on roadways with high-speed, high-volume motor vehicle traffic, or may provide a
sidewalk on one side of the street only. Pedestrians can anticipate moderate interaction with automobiles on these roadways.
B 19 to >15. These roadways provide many pedestrian safety and comfort features which can attract pedestrian trips. These roadways will have many of the characteristics
of a LOS A pedestrian facility, but there may be somewhat fewer amenities, or pedestrian-friendly design elements. Pedestrians can anticipate a low level to moderate
level of interaction with motor vehicles.
LOS LEVEL OF SERVICE SCORE/CRITERIAA
Pedestrian Performance StandardsPERFORMANCE MEASURES MAXIMUM POINTS
Shade TreesLightingNo Lighting
Ped Signal Delay of 40 seconds or lessReduced Turn Conflict Implementation
Table 4.5.7-3: Bicycle Performance Standards and LOS
Orange County, Florida Innovation Way Economic Development & Environmental Resource Management Study
December 2005
216
Transit Performance Standards Innovation Way is envisioned to accommodate a major hub for transit service, fixed route service, and/or park and ride facilities. The high concentration of employment within the Sector Plan makes it a viable area to introduce mass transit service when the appropriate employment density is reached. Mass transit service in the form of light rail, commuter rail, rapid rail, bus ways, or fixed route bus service shall be considered by Orange County, Lynx, the MPO, FDOT, City of Orlando, and other public agencies to provide alternative modes of travel and supplement the movement of the residents, employees and goods of Innovation Way. A potentially good location for Park and Ride facilities would be a site in close proximity to either SR 417 or SR 528. The Park and Ride sites should be located near interchanges where users have convenient access to a limited access facility. Provisions for a park and ride facility and other transit service amenities, such as bus shelters and stops, should be incorporated into the design criteria. Evaluation of transit service will be governed by the level of service performance standards provided in Table 4.5.7-4.
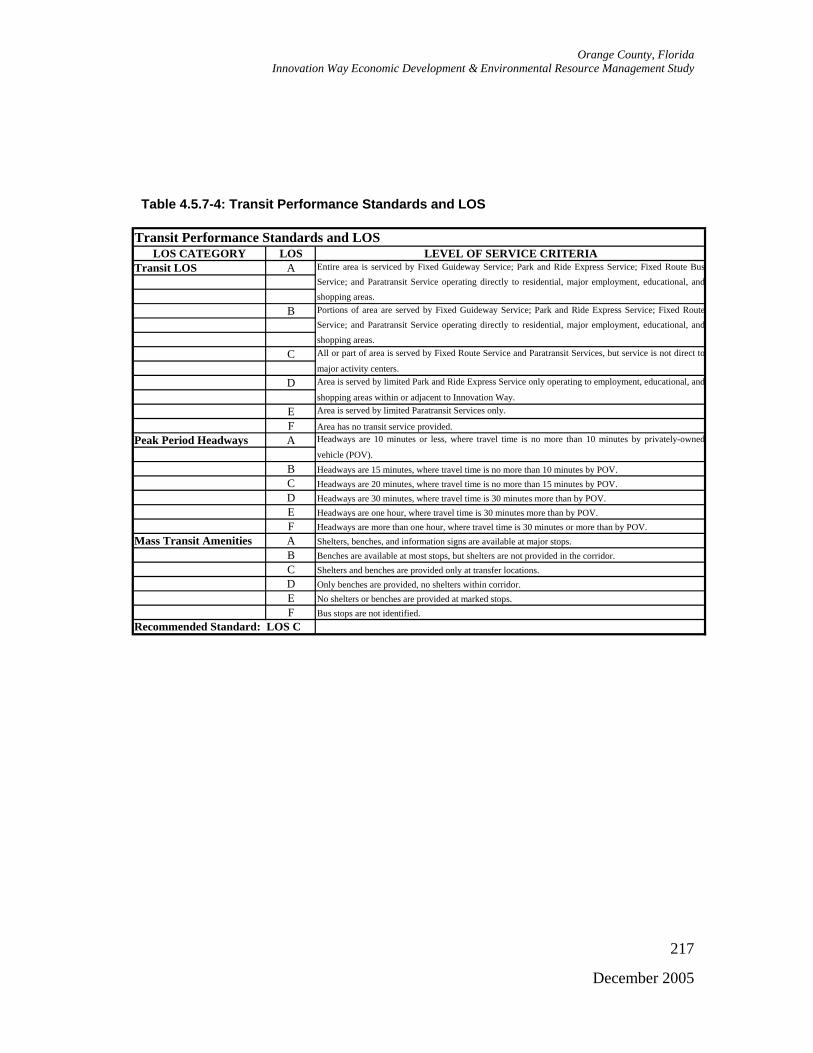
Orange County, Florida Innovation Way Economic Development & Environmental Resource Management Study
December 2005
217
LOS CATEGORY LOS LEVEL OF SERVICE CRITERIATransit LOS A
B
C
D
E Area is served by limited Paratransit Services only.
F Area has no transit service provided.Peak Period Headways A
B Headways are 15 minutes, where travel time is no more than 10 minutes by POV.C Headways are 20 minutes, where travel time is no more than 15 minutes by POV.D Headways are 30 minutes, where travel time is 30 minutes more than by POV.E Headways are one hour, where travel time is 30 minutes more than by POV.F Headways are more than one hour, where travel time is 30 minutes or more than by POV.
Mass Transit Amenities A Shelters, benches, and information signs are available at major stops.B Benches are available at most stops, but shelters are not provided in the corridor.C Shelters and benches are provided only at transfer locations.D Only benches are provided, no shelters within corridor.E No shelters or benches are provided at marked stops.F Bus stops are not identified.
Recommended Standard: LOS C
Area is served by limited Park and Ride Express Service only operating to employment, educational, and
shopping areas within or adjacent to Innovation Way.
Headways are 10 minutes or less, where travel time is no more than 10 minutes by privately-owned
vehicle (POV).
Transit Performance Standards and LOS
Entire area is serviced by Fixed Guideway Service; Park and Ride Express Service; Fixed Route BusService; and Paratransit Service operating directly to residential, major employment, educational, andshopping areas.Portions of area are served by Fixed Guideway Service; Park and Ride Express Service; Fixed RouteService; and Paratransit Service operating directly to residential, major employment, educational, and
shopping areas.All or part of area is served by Fixed Route Service and Paratransit Services, but service is not direct to
major activity centers.
Table 4.5.7-4: Transit Performance Standards and LOS
Orange County, Florida Innovation Way Economic Development & Environmental Resource Management Study
December 2005
218
4.5.8 Cost of Transportation Improvements Estimates of construction cost to mitigate capacity deficiencies on the surrounding roadway system are provided in Table 4.5.8-1. The cost to mitigate LOS deficiencies in the interim year 2010 condition is estimated at $200.8 million. The cost to mitigate the mid-year 2015 LOS deficiencies is estimated at $78.5 million. The cost to mitigate LOS deficiencies in the year 2025 condition is estimated at $66.2 million. In total, the roadway construction cost to support the Innovation Way Sector Plan is estimated at $345.5 million. Transportation Impact Fee Calculations Transportation impact fee revenues generated by a hypothetical Innovation Way are calculated and shown in Table 4.5.8-2. Innovation Way is expected to generate road impact fee revenues for Orange County in the amount of $168 million. The cost and revenue analysis described above indicates that revenues from the Orange County road impact fees represent almost 48.6 percent of the off-site capacity deficiencies attributed to the Innovation Way.
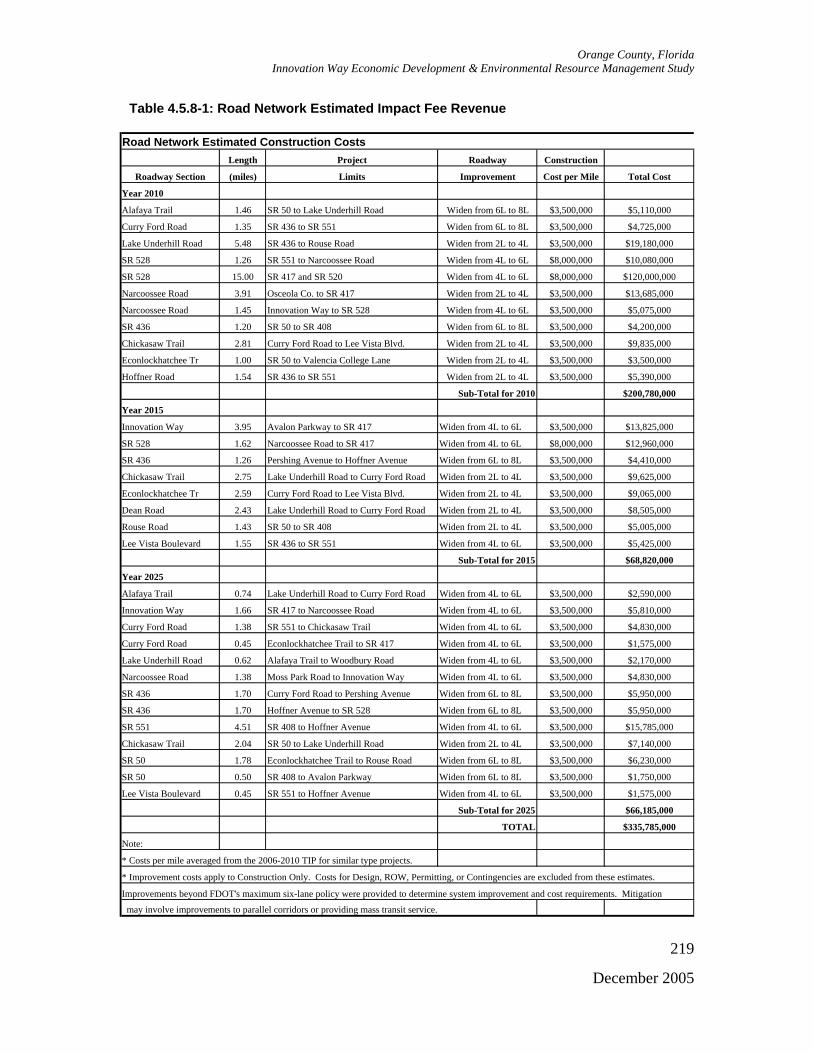
Orange County, Florida Innovation Way Economic Development & Environmental Resource Management Study
December 2005
219
Length Project Roadway Construction
Roadway Section (miles) Limits Improvement Cost per Mile Total Cost
Year 2010
Alafaya Trail 1.46 SR 50 to Lake Underhill Road Widen from 6L to 8L $3,500,000 $5,110,000
Curry Ford Road 1.35 SR 436 to SR 551 Widen from 6L to 8L $3,500,000 $4,725,000
Lake Underhill Road 5.48 SR 436 to Rouse Road Widen from 2L to 4L $3,500,000 $19,180,000
SR 528 1.26 SR 551 to Narcoossee Road Widen from 4L to 6L $8,000,000 $10,080,000
SR 528 15.00 SR 417 and SR 520 Widen from 4L to 6L $8,000,000 $120,000,000
Narcoossee Road 3.91 Osceola Co. to SR 417 Widen from 2L to 4L $3,500,000 $13,685,000
Narcoossee Road 1.45 Innovation Way to SR 528 Widen from 4L to 6L $3,500,000 $5,075,000
SR 436 1.20 SR 50 to SR 408 Widen from 6L to 8L $3,500,000 $4,200,000
Chickasaw Trail 2.81 Curry Ford Road to Lee Vista Blvd. Widen from 2L to 4L $3,500,000 $9,835,000
Econlockhatchee Tr 1.00 SR 50 to Valencia College Lane Widen from 2L to 4L $3,500,000 $3,500,000
Hoffner Road 1.54 SR 436 to SR 551 Widen from 2L to 4L $3,500,000 $5,390,000
Sub-Total for 2010 $200,780,000
Year 2015
Innovation Way 3.95 Avalon Parkway to SR 417 Widen from 4L to 6L $3,500,000 $13,825,000
SR 528 1.62 Narcoossee Road to SR 417 Widen from 4L to 6L $8,000,000 $12,960,000
SR 436 1.26 Pershing Avenue to Hoffner Avenue Widen from 6L to 8L $3,500,000 $4,410,000
Chickasaw Trail 2.75 Lake Underhill Road to Curry Ford Road Widen from 2L to 4L $3,500,000 $9,625,000
Econlockhatchee Tr 2.59 Curry Ford Road to Lee Vista Blvd. Widen from 2L to 4L $3,500,000 $9,065,000
Dean Road 2.43 Lake Underhill Road to Curry Ford Road Widen from 2L to 4L $3,500,000 $8,505,000
Rouse Road 1.43 SR 50 to SR 408 Widen from 2L to 4L $3,500,000 $5,005,000
Lee Vista Boulevard 1.55 SR 436 to SR 551 Widen from 4L to 6L $3,500,000 $5,425,000
Sub-Total for 2015 $68,820,000
Year 2025
Alafaya Trail 0.74 Lake Underhill Road to Curry Ford Road Widen from 4L to 6L $3,500,000 $2,590,000
Innovation Way 1.66 SR 417 to Narcoossee Road Widen from 4L to 6L $3,500,000 $5,810,000
Curry Ford Road 1.38 SR 551 to Chickasaw Trail Widen from 4L to 6L $3,500,000 $4,830,000
Curry Ford Road 0.45 Econlockhatchee Trail to SR 417 Widen from 4L to 6L $3,500,000 $1,575,000
Lake Underhill Road 0.62 Alafaya Trail to Woodbury Road Widen from 4L to 6L $3,500,000 $2,170,000
Narcoossee Road 1.38 Moss Park Road to Innovation Way Widen from 4L to 6L $3,500,000 $4,830,000
SR 436 1.70 Curry Ford Road to Pershing Avenue Widen from 6L to 8L $3,500,000 $5,950,000
SR 436 1.70 Hoffner Avenue to SR 528 Widen from 6L to 8L $3,500,000 $5,950,000
SR 551 4.51 SR 408 to Hoffner Avenue Widen from 4L to 6L $3,500,000 $15,785,000
Chickasaw Trail 2.04 SR 50 to Lake Underhill Road Widen from 2L to 4L $3,500,000 $7,140,000
SR 50 1.78 Econlockhatchee Trail to Rouse Road Widen from 6L to 8L $3,500,000 $6,230,000
SR 50 0.50 SR 408 to Avalon Parkway Widen from 6L to 8L $3,500,000 $1,750,000
Lee Vista Boulevard 0.45 SR 551 to Hoffner Avenue Widen from 4L to 6L $3,500,000 $1,575,000
Sub-Total for 2025 $66,185,000
TOTAL $335,785,000
Note:
* Costs per mile averaged from the 2006-2010 TIP for similar type projects.
* Improvement costs apply to Construction Only. Costs for Design, ROW, Permitting, or Contingencies are excluded from these estimates.
Improvements beyond FDOT's maximum six-lane policy were provided to determine system improvement and cost requirements. Mitigation
may involve improvements to parallel corridors or providing mass transit service.
Road Network Estimated Construction Costs
Table 4.5.8-1: Road Network Estimated Impact Fee Revenue
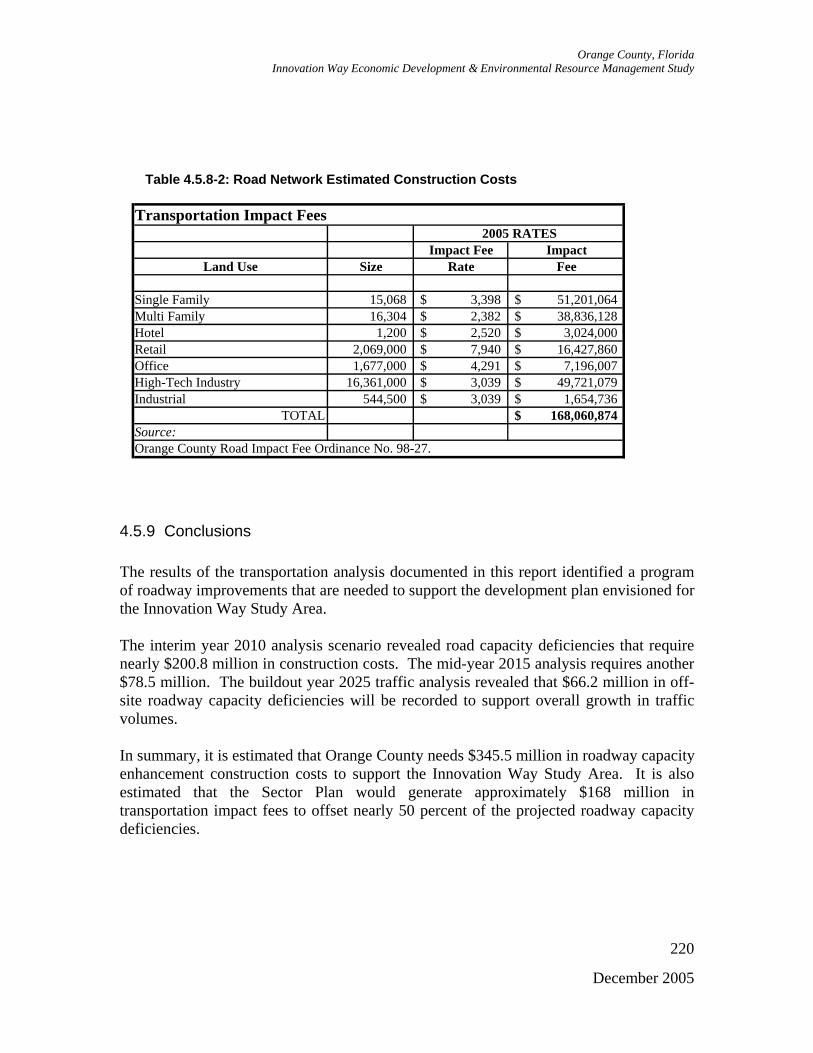
Orange County, Florida Innovation Way Economic Development & Environmental Resource Management Study
December 2005
220
4.5.9 Conclusions The results of the transportation analysis documented in this report identified a program of roadway improvements that are needed to support the development plan envisioned for the Innovation Way Study Area. The interim year 2010 analysis scenario revealed road capacity deficiencies that require nearly $200.8 million in construction costs. The mid-year 2015 analysis requires another $78.5 million. The buildout year 2025 traffic analysis revealed that $66.2 million in off-site roadway capacity deficiencies will be recorded to support overall growth in traffic volumes. In summary, it is estimated that Orange County needs $345.5 million in roadway capacity enhancement construction costs to support the Innovation Way Study Area. It is also estimated that the Sector Plan would generate approximately $168 million in transportation impact fees to offset nearly 50 percent of the projected roadway capacity deficiencies.
Table 4.5.8-2: Road Network Estimated Construction Costs
Impact Fee ImpactLand Use Size Rate Fee
Single Family 15,068 3,398$ 51,201,064$ Multi Family 16,304 2,382$ 38,836,128$ Hotel 1,200 2,520$ 3,024,000$ Retail 2,069,000 7,940$ 16,427,860$ Office 1,677,000 4,291$ 7,196,007$ High-Tech Industry 16,361,000 3,039$ 49,721,079$ Industrial 544,500 3,039$ 1,654,736$
TOTAL 168,060,874$ Source:
2005 RATESTransportation Impact Fees
Orange County Road Impact Fee Ordinance No. 98-27.

Orange County, Florida Innovation Way Economic Development & Environmental Resource Management Study
December 2005
221
4.6 Scenario Evaluation As part of the final analysis of this study the five scenarios were evaluated using criteria based on public comment and sound planning principles. First, it should be noted that the criteria and the evaluation of the scenarios is not a scientific study. The criteria and the method of evaluation were based on professional opinion; this analysis is meant to be a tool to further illustrate the benefits and costs of each of the scenarios. A copy of a blank evaluation matrix is attached as part of the appendix, this matrix may be filled out and used as part of analysis used to identify those issues and priorities of each of the scenarios that seem most important to the implementation of Innovation Way. This analysis may also help in the future planning and decision making process made by the County when considering the implementation of Innovation Way. A final caveat, the scenarios and the analysis of the scenarios are in many instances contingent on how well regulatory measures and incentives direct growth to desired places. Currently, building and development entitlements exist for much of the Study Area, without proactive measures none of the planning scenarios will come to fruition. The evaluation criteria and a short description of each are listed as follows. A discussion of the scenarios using the criteria is also included after the evaluation criteria.
4.6.1 Evaluation Criteria
• Cluster Development Cluster development patterns can produce cost effective and attractive places by grouping buildings to preserve remaining land for open space or conservation. Cluster development patterns offer the opportunity to create communities that acknowledge the existing natural topography and terrain. The scenarios were evaluated in terms of how well development was clustered in such a way that important natural areas could be preserved. This could mean on both a local scale and on a more regional scale. • Optimization of Alternative Modes of Transportation and Internalization of Trips Optimizing multimodal forms of transportation (pedestrian, bicycle, bus, light rail, automobile) means providing the greatest number of transportation options at the least cost. Scenarios were evaluated on how well their design provides opportunity for an effective transportation system. Scenarios were evaluated to determine the highest trip generation and internal capture. • Diverse Housing Choices The development of residential communities with the Innovation Way corridor should support a diverse array of housing opportunities. Housing should range in price, type, and density. It is important to build affordable as well as upscale or executive

Orange County, Florida Innovation Way Economic Development & Environmental Resource Management Study
December 2005
222
housing. The scenarios were evaluated on the range of housing opportunities they provided. • Limited Access to Innovation Way This criteria was used to evaluate scenarios on how well they did limit access to Innovation Way. • Develop High Tech/High Value Jobs The scenarios were evaluated on how well they accommodated land for high tech businesses. Highest rankings were given to the scenarios that offered the highest number of high tech jobs. • Parks/Wildlife Corridors Parks and wildlife corridors are an important part of the overall development of Innovation Way. The scenarios were evaluated on how well they maintained a system of interconnecting parks and wildlife corridors. • Long term Maintenance of Environmental Quality The scenarios were evaluated on how well they provide a long term solution to environmental quality. Those scenarios that connected and preserved environmentally fragile land were given a high rating as well as creating opportunities for common maintenance or dedication to the public.
• Public Infrastructure Efficiency (water, sewer, roads) The scenarios were evaluated on how well they could provide an efficient design of public infrastructure. • Build-out for Study Area This criteria was used to evaluate how well the scenarios provided a complete build-out of the Study Area.
4.6.2 Scenario One Current Trends Scenario one scored poorly on most of the criteria. Scenario one through its low density uniform building program creates a sprawling building pattern, which by its very definition is the opposite of a cluster development pattern. Scenario One does not optimize alternative modes of transportation. In this case, the automobile is given the primary role with little or no consideration for other forms of transportation. Scenario One does not plan for a diverse set of housing choices. The uniform low density building pattern favors lower density building options, eliminating many other housing types. Scenario One does not satisfactorily provide the land development opportunity to develop high tech/high value jobs.
Orange County, Florida Innovation Way Economic Development & Environmental Resource Management Study
December 2005
223
The uniform low density building pattern also severely limits park, wildlife, and open space options and Scenario One does not adequately plan for the long term maintenance of environmental quality. Since Scenario One does not adequately plan for high tech businesses, it would provide a poor transportation network to the Innovation Way corridor. Scenario One does score high in providing a build-out for the entire Study Area. Its uniform low density building pattern covers most of the undeveloped space. Scenario One may also poorly provide public infrastructure. For example, the low density building pattern may require the use of septic tanks which in turn may leak and cause groundwater and surface water contaminants. This scenario also heavily relies on the automobile requiring a disproportionate amount of roads to be built.
4.6.3 Scenario Two Compact Edge Scenario Two, the Compact Edge scenario does well for cluster development. For the most part development is contained in tight band around the two mile Innovation Way corridor. This scenario does however hinge on the effectiveness of incentives to relieve development pressures in the south east quadrant of the Study Area. This scenario does optimize alternative modes of transportation. By clustering development in compact nodes in the Innovation Way corridor, alternative forms of transportation may be realized. Compact development patterns create a built environment, which may be more readily adapted to bicycling, light rail, and pedestrian friendly streets. The Compact Edge scenario performs adequately in its provision of diverse housing choices. The Compact Edge scenario provides a range of density options from high to low. It does not, however, provide the opportunity for large expanses of low density development. Scenario number two does provide satisfactory space requirements for the development of high tech/high value businesses and jobs. The Compact Edge scenario adequately provides for parks, wildlife, and open space as well as long term maintenance of the environment. How well the compact edge model of urban development performs is again a question of how well incentives work to direct development to the Innovation Way corridor edge. The creation of new park and open space as well as long term maintenance of the environment is largely contingent on this factor in the regional context. The Compact Edge scenario does an excellent job of limiting access to the Innovation Way corridor. The Compact Edge performs only adequately in providing for a build-out of the entire Study Area. Since, this scenario clusters development around the corridor edge it would not provide a build-out of the entire Study Area. The Compact Edge scenario may do an excellent job of providing for an efficient use of public infrastructure. This may also hinge on how well incentives direct development to the corridor edge. If development is directed to the edge, an extremely effective use of public infrastructure could be realized. If development is allowed to proceed at low densities, this scenario and its implementation would be less effective.

Orange County, Florida Innovation Way Economic Development & Environmental Resource Management Study
December 2005
224
4.6.4 Scenario Three Village Scenario three adequately clusters development away from environmentally valuable land. It does provide for more development over more land, but does cluster development away from the Econlockhatchee River. The Village scenario adequately provides for an optimization of transportation modes. Since the Village scenario does cluster development in compact building pattern, the opportunity does arise for creating a viable alternative transportation network. The Village scenario does provide an excellent opportunity for a range of diverse housing options. The Village scenario does create an optimal situation for the development of high tech/high value jobs. The Village scenario may perform adequately on the provision for parks, wildlife, and open space. Since development may be allowed west of the Econlockhatchee River, some open space may not be preserved as parks. The same can largely be said of long term maintenance of environmental quality. The Village scenario performs well in limiting access to Innovation Way. The Village scenario does an adequate job of providing for a build-out of the entire Study Area, since it does allow development near the Econlockhatchee River. The Village scenario does provide a compact development pattern, which may maximize public infrastructure.
4.6.5 Scenario Four Activity Village Scenario four satisfactorily provides a more compact cluster development pattern. Scenario four clusters development away from environmentally sensitive land towards villages and village centers. Scenario four provides the framework for an excellent opportunity to optimize transportation alternatives. Scenario four links identifiable village centers in a transportation network, which may be used for dedicated transit, bicycle, and pedestrian transportation routes. Scenario four provides an optimal opportunity for a diverse array of housing choices. Residential development options vary and may range from high to low density. Scenario four also provides an optimal framework for the development of high tech/high value jobs. Scenario four provides an optimal framework for the development of parks, wildlife, and open spaces as well as maintenance of environmental quality. By clustering development in compact nodes with a village center, the Activity Village provides the opportunity for development while protecting valuable resources. This scenario differs from the Village scenario by concentrating development towards the village “activity” center and increasing density in this center. This may decrease development pressures in environmentally sensitive lands, while still providing the opportunity for development. This scenario provides an optimal opportunity for limited access to Innovation Way. This scenario provides an adequate framework for build-out of the entire Study Area. This scenario provides an optimal opportunity for providing public infrastructure in the Study Area all on sewer.
4.6.6 Scenario Five Scenario five provides an optimal opportunity for cluster development. It clusters development away from environmentally sensitive land. Scenario five provides for an

Orange County, Florida Innovation Way Economic Development & Environmental Resource Management Study
December 2005
225
excellent development plan to maximize alternative transportation options. Scenario five provides an adequate array of housing choices. Scenario five provides an optimal framework for the development of high tech/high value jobs. Scenario five provides an optimal opportunity for the preservation of parks, wildlife, and open space as well as the long term maintenance of environment quality (contingent on effectiveness of incentives to direct development) slightly less compact than scenario two. Scenario five provides an optimal situation for limited access to Innovation Way. Scenario five does not provide an adequate opportunity for build-out unless incentives are provided for property owners in the southeast quadrant of the Study Area to leave their property in a rural state. Since this scenario clusters development along the corridor much of the land near the Econlockhatchee River is preserved. Scenario five may do an excellent job of providing for an efficient use of public infrastructure. This scenario also hinges on how well incentives direct development to the corridor edge. If development is guided to the edge, an extremely effective use of public infrastructure could be realized.
4.7 Draft Principles and Master Planning Guidelines These principles address the basic requirements to implement the vision and goals of developing a high technology/high value park supported by a comprehensively planned mixed use master plan that provides equal stature to environmental values. The purpose of providing the goals and principles identified below is to provide direction for a future plan amendment and the attendant Goals, Objectives and Policies. The goals, principles and objectives for implementation of the Innovation Way Sector Plan are as follows:
4.7.1 Goal 1: Provide Sufficient Land for a High Tech/High Value Corridor This report advocates creating a high tech corridor approximately two miles wide and 5.7 miles long. The report estimates that, if developed at medium intensity floor area ratios, the land inventory should last a minimum of 25 years assuming a moderately aggressive absorption rate. To achieve this goal, high tech land uses and uses that support high tech land uses, must be encouraged and other uses discouraged. 4.7.1.1 Innovation Way Corridor Designation Principle The Future Land Use Map of Orange County should be amended to reflect the Innovation Way Corridor and the Comprehensive Plan text should be amended to include a definition of the High Tech/High Value Corridor to delineate permitted and prohibited uses. Objective 4.7.1.1.1: The land development code should be amended to establish development standards, permitted uses, conditional uses, and prohibited uses to guide the design of development within the corridor.

Orange County, Florida Innovation Way Economic Development & Environmental Resource Management Study
December 2005
226
Objective 4.7.1.1.2: The Orange County Comprehensive Plan and Land Development Code should make reference to the completed Innovation Way Study as a resource to define the purpose and intent of the corridor. The final study may serve as a tool to guide decision making and interpretation of the Comprehensive Plan and Land Development Code as it relates to the Innovation Way study area. 4.7.1.2 Diverse Mix of Land Uses Principle Provide a diverse mix of land uses to support the high/tech corridor including housing, institutional, parks and recreation, retail commercial and support office within and adjacent to the corridor. Mixed use development encourages flexible and creative design as well as reduces the cost of pubic infrastructure. It is essential to have available land within and around the corridor to develop with a mix of support land uses to provide shopping, recreational and cultural uses in close proximity to residents and employees. Therefore, Orange County should adopt policies and establish design standards that require the incorporation of the following land uses within development plans of target industries and business. Housing Innovation Way should promote residential development in the surrounding areas. The housing inventory for Innovation Way will be diverse providing a wide variety of housing types, price ranges, and densities. Objective 4.7.1.2.1: Orange County will use environmental data to determine appropriate densities for housing within the Innovation Way Study Area. Only low densities will be supported within the OFW setbacks. Higher densities will be strongly encouraged north of Innovation Way within the Study Area. Objective 4.7.1.2.2: Orange County will promote the provision of affordable housing units within the Study Area. Granny flats and garage apartments will not be included in unit or density calculations. Loft apartments and rental units over retail or office will be exempt from unit calculations for density purposes provided that rental rates do not exceed household wage thresholds established by Florida Administrative Code, or by the Affordable Housing Methodology adopted by the East Central Florida Regional Planning Council for low income affordability. Any exemptions associated with this objective do not pertain to school impact calculations or school impact fees. Objective 4.7.1.2.3: Transfer of Development Rights and environmental crediting will be encouraged to increase densities in appropriate areas in order to achieve protection of key environmental areas within the corridor. Objective 4.7.1.2.4: Orange County will evaluate the feasibility of developing an inclusionary zoning ordinance to encourage a mix of housing by income level.

Orange County, Florida Innovation Way Economic Development & Environmental Resource Management Study
December 2005
227
Parks & Recreation Park and recreation facilities are a necessary component of a high quality community. The creation of a high tech research/office corridor and surrounding communities will require the integration of a well planned park and recreation system. High technology companies seek those sites that offer the most amenities; providing a park and recreation system that offers aesthetic, recreational, and alternative transportation options increases the overall rate of success for Innovation Way. Therefore, in order to promote a high quality of life for residents of the area and employees of the high/tech corridor, Orange County should adopt policies and regulations that ensure development will provide adequate park and recreational facilities within the high/tech corridor and surrounding residential neighborhoods. Objective 4.7.1.2.5: Orange County should adopt policies that require new parks and open space developed as part of the Innovation Way Corridor to be tied into the pre-existing park system of South East Orange County including Moss Park and Crosby Island Marsh.
Objective 4.7.1.2.6: Orange County should adopt policies and regulations that encourage the development and integration of a parks and recreational system with the Innovation Way Corridor and the Econlockhatchee River. Objective 4.7.1.2.7: Orange County should adopt polices and regulations that require the development of neighborhood scale parks, greenways, bicycle trails, and walking trails as part of local park system. This neighborhood park system should extend to other neighborhoods and the regional system of parks and trails. Objective 4.7.1.2.8: Orange County should coordinate with the Florida Department of Historical Resources to identify and protect significant historical or cultural resources. Retail, Hotel, and Support Office Retail commercial establishments and support office are essential to the successful function of a high tech corridor. Support office uses such as dentists, doctors, attorneys, and accountants are needed to provide their services to the residents and employees of the corridor as well as the target industries and businesses themselves. Retail commercial such as restaurants, clothing stores, grocery stores are also necessary to support the residents and employees of the area. A limited number of hotel uses should be allowed abutting Innovation Way. These hotels should be business oriented hotels rather than destination resorts. Objective 4.7.1.2.8 The Orange County Comprehensive Plan should adopt policies that establish minimum and maximum percentages of land within and around the corridor to be set aside for retail and support office land uses.
Orange County, Florida Innovation Way Economic Development & Environmental Resource Management Study
December 2005
228
Institutional Uses Institutional uses will be necessary within and around the high tech corridor to support the residents and employees of the area. Objective 4.7.1.2.9 The Orange County Comprehensive Plan should adopt policies to require development plans to incorporate land to be developed with institutional uses such as parks, fire stations, transit stops, and libraries, etc.
4.7.2 Goal 2: Provide and Maintain Sufficient Entitlements and Infrastructure It is anticipated that roadway capacity will present a significant challenge in achieving this goal. Therefore, the study and the guidelines provided below suggest that successful implementation of Innovation Way will require a commitment to multi-modal transportation systems both internal and external to the park. All reasonable alternatives to automobile transportation are encouraged. In addition, access to Innovation Way (the roadway) will need to be controlled. Another long term concern will be the provision of a reliable water supply. Water supply is a function of not just consumption but also conservation. Principles are provided below that are intended to address water supply, water conservation, and continuance of roadway capacity. Objective 4.7.2.1 Orange County should continue to plan for, budget and construct adequate water, wastewater and reclaimed water treatment, storage and transmission capacity before the demand actually exists within the Study area. Objective 4.7.2.2 Orange County should continue to require water distribution, wastewater collection and reclaimed water distribution systems constructed in conjunction with new development. Objective 4.7.2.3 Orange County should require reclaimed water distribution systems to be constructed in all developments within the Study area, and should require all irrigation to be performed with reclaimed water, where feasible. 4.7.2.1 Transportation Principle
Orange County Comprehensive Plan will identify and implement alternative forms of transportation to the automobile and will implement a master plan designed to maximize roadway capacity within the Innovation Way Study Area. Objective 4.7.2.1.1 The principal corridor within Innovation Way will be limited access. Objective 4.7.2.1.2 Parallel roadway facilities will be developed to Innovation Way. Innovation Way will move thru traffic and will accommodate project traffic originating

Orange County, Florida Innovation Way Economic Development & Environmental Resource Management Study
December 2005
229
or ending in other parts of the region. The parallel road network will be intended to move project trips around and through the project site. Objective 4.7.2.1.3: Right- of-Way width for Innovation will be sufficient to accommodate a six lane divided section at build out as well as rail and/or dedicated bus/transit lines. Objective 4.7.2.1.4: The master plan for Innovation Way will accommodate at least two multi modal stations. The purpose of the multi modal stations will be to allow commuters and/or residents to change transportation modes (e.g. from bicycle to shuttle to bus). Objective 4.7.2.1.5: The master plan for Innovation Way will include a system of bicycle and pedestrian paths that will not only serve commuters as a viable transportation option but also serve the recreational bicyclist through a unified park/greenway system. Objective 4.7.2.1.6: Orange County will coordinate with the OOCEA to identify options for waiving tolls for workers within the Innovation Way Park. Objective 4.7.2.1.7: Innovation Way will be master planned with a loop transit system that will be designed to move residents to employment centers within the corridor and to allow easy transit access to Innovation Way schools. Objective 4.7.2.1.8: The loop transit system will itself be multi modal, accommodating pedestrians, bicyclists and shuttles. Objective 4.7.2.1.9: Orange County should explore the possibilities of providing credits against impact fees for non residential developers who assist in the implementation of transportation management policies within Innovation Way. Such policies include provision of right of way for transit facilities, bike and pedestrian systems, and the provision of lockers and showers at the work place. Objective 4.7.2.1.10: Orange County should coordinate with the Greater Orlando Aviation Authority to integrate Innovation Way into the airport’s transportation systems and into include future light rail. If such a link is established, Orange County should promote extension of the light rail system from Innovation Way to UCF. 4.7.2.2 Infrastructure Principle
Orange County will provide a reliable water supply for the Innovation Way Study Area and will provide adequate central sewer disposal capacities. Objective 4.7.2.2.1: Orange County will reserve water capacity for qualified high tech users. This capacity may be obtained from a variety of sources to include withdrawal from surficial sources as may be appropriately permitted.

Orange County, Florida Innovation Way Economic Development & Environmental Resource Management Study
December 2005
230
Objective 4.7.2.2.2: Orange County will reserve capacity for an equivalent seven year inventory of high tech square footage. Objective 4.7.2.2.3: Orange County will require connection to central water and sewer and reclaimed water for any increases in density that may be granted in the Study Area.
4.6.3 Goal 3: Recognize and Protect Ecological Systems and Corridors The Innovation Way Study Area includes the Split Oak Nature Preserve, which is part of the headwaters of the Kissimmee River and the Econlockhatchee River which is a major tributary of the St. Johns River. A variety of plant and animal species are found in these areas. The study addresses principles that are intended to protect valuable floodplain, water quality, and wildlife assets of these resources. Key recommendations include providing for a major wildlife corridor linking these two regionally significant river basins. Pre-development wildlife inventories are suggested as well as on-going monitoring of natural systems. 4.7.3.1 Environmental Principle
Sustain viable environmental communities during and after development of the Innovation Way corridor while maintaining the Goals and Objectives of the Conservation, Open Space, and Recreation Elements of the County Comprehensive Plan. Principle 4.7.3.1.1: Provide wildlife corridors through Innovation Way such that wildlife can move through needed habitat types, north to south, generally following or paralleling the Econlockhatchee River. New crossings of these corridors should be prohibited. If additional “capacity” is needed to move vehicles east/west or west/east, then capacity should be provided in a transportation corridor paralleling and immediately abutting the Beachline. In addition, effective wildlife crossings would have to be provided to maintain the wildlife corridor. Principle 4.7.3.1.2: Preserve environmentally sensitive lands through acquisition and/or conservation easement. Acquisition of fee simple ownership or easement will be facilitated by developer incentives to provide such control through the award of density credits and bonuses. Lands that should be protected include key wildlife corridors and key habitat for endangered or threatened plant and animal species. Principle 4.7.3.1.3: Maintain and monitor a baseline of data on species number and species diversity over the planning period of Innovation Way. The purpose of the baseline is to recognize the effect that development of Innovation Way is having on species diversity and habitat over time. With data, the County can determine if further policies are needed to protect species by protecting habitat type.

Orange County, Florida Innovation Way Economic Development & Environmental Resource Management Study
December 2005
231
Principle 4.7.3.1.4: Minimize damage to the 100-year floodplain and wetland areas by ensuring that public and private roads avoid crossings, floodplains, and wetlands or require such crossings to be at the narrowest point of a floodplain or wetland system. Principle 4.7.3.1.5: Lands acquired for the preservation of wildlife should be protected by a management plan that promotes maintenance of native species diversity and where practical, be used to offset development impacts elsewhere within Innovation Way. As an example, uplands should be used, where appropriate, for receiving gopher tortoises that can be relocated. Principle 4.7.3.1.6: The County will collaborate with the Florida Fish and Wildlife Conservation Commission to develop site development standards that promote preservation of wildlife during construction and focus on the provision of useable habitat post development. Principle 4.7.3.1.7: The County will develop standards to promote Xeriscape landscaping for residential uses. Standards should be established to minimize land clearing for residential lots and identify maximum percentages for lawns in single family residential development. Principle 4.7.3.1.8: Utilize the County’s clustering policies to encourage the preservation of native uplands and to further minimize wetland and floodplain impacts. Principle 4.7.3.1.9: Innovation Way anticipates the need for a variety of housing types, offered at a variety of densities. Orange County should identify density zones that establish appropriate densities for lands within and abutting the Econlockhatchee River Riparian Habitat Protection Zone (RHPZ) and other regionally significant wetlands. The density zones would be implemented through continued use of low density land use designations, or through environmental overlay areas. Principle 4.7.3.1.10: The County will collaborate with the Florida Fish and Wildlife Conservation Commission, the U.S. Fish and Wildlife Service, the Orlando-Orange County Expressway Authority, and Florida Department of Transportation to ensure that wildlife crossings are provided at public roads which cross river systems, wetlands, and other potential wildlife corridors. Principle 4.7.3.1.11: Innovation Way will use ecologically friendly design at the neighborhood level by promoting conservation, creating nature trails and boardwalks, providing educational opportunities, and promoting early design approvals for projects that are environmentally friendly. Designs will create a friendlier pedestrian environment (walking and biking), create wider variety of active and passive recreational uses, maintain large patches of natural vegetation, and minimize fragmentation of natural resources. Designs will identify ecologically important areas and incorporate these areas into meaningful open space and conservation areas (including rare upland habitats,

Orange County, Florida Innovation Way Economic Development & Environmental Resource Management Study
December 2005
232
floodplains and inaccessible lands) while maintaining connectivity of this open space within and adjacent to future developments. Principal 4.7.3.1.12: The County shall coordinate with the St. Johns River Water Management District in order to promote the protection of OFW water quality standards in the Econlockhatchee River
4.7.4 Goal 4: Stimulate and Stabilize Orange County’s Long Term Economy and Employment Base with High Tech Sector Eastern Orange County has experienced success in economic diversification offering advanced educational facilities and programs, research and development and many of the support uses needed. The implementation of Innovation Way should supplement these efforts (vs. compete with them) such that the high tech corridor extends from the Orlando International Airport to the University of Central Florida. 4.7.4.1 Economic Principle
Promote the development of a high tech/high value park, to be known as Innovation Way, which creates economic diversification and increased average annual salaries while making Orange County a recognized national leader in merging development need with transportation system availability and environmental sustainability. Principle 4.7.4.1.1: Provide adequate land inventory for high tech/high value users for a 25 to 50 year time frame. Except Scenario One, all scenarios provide an adequate land supply for 25 years. Principle 4.7.4.1.2: Provide incentives to promote Innovation Way to include: Economic incentives, Regulatory incentives, and Employment incentives. Principle 4.7.4.1.3: Provide Orange County with a more diversified employment base. Principle 4.7.4.1.4: Promote and attract companies that provide jobs with salaries that exceed the existing median income by 15%. Principle 4.7.4.1.5: To the maximum extent practical, provide pre approvals and expedited review for industries/park users that meet the profile of high tech/high value. Principle 4.7.4.1.6: Coordinate with the State of Florida to identify master permitting opportunities for the Innovation Way Study Area. Principle 4.7.4.1.7: Coordinate with the FDOT and the FDCA to identify appropriate transportation management solutions that would extend acceptable levels of service to accommodate high tech users.

Orange County, Florida Innovation Way Economic Development & Environmental Resource Management Study
December 2005
233
Principle 4.7.4.8: Orange County should ensure that the corridor is dedicated to high tech use and those commercial uses that support high tech use vs. those uses that do not contribute to the economic goals of creating a high tech park for higher than average wages and continued diversification of the County’s economic base. 4.7.4.2 Education (Schools) Principle
Residential areas will surround Innovation Way and should provide housing for workers in a variety of income groups. Recognizing that public schools are one of the key recruiting assets for new businesses in any area, Orange County should continue to work with the School Board to provide an excellent school system for Innovation Way and surrounding parts of Orange County. The proposed building program for Innovation Way identifies a potential population of 105,537 (Scenario 5 and Activity Village). From conversations with the school board, this population equates to 26,753 students who, in turn, would be distributed between 16.5 elementary schools, 5.0 middle schools, and 2.9 high schools. The demand for school sites is expected to be approximately 578 acres. The goal will be to provide adequate resources to ensure that schools are provided in a timely manner to accommodate the anticipated school age children. To achieve this goal, the following are proposed: Objective 4.7.4.2.1.: While the primary purpose of Innovation Way is to provide high tech/high quality jobs, the County should permit elementary schools within the corridor. This would allow Elementary school age children to be close to the parents’ work place. Elementary schools require less acreage than middle or high schools. Elementary schools may also be permitted within villages and the town, or Innovation Center. Objective 4.7.4.2.2: Orange County should provide assistance to the School Board and developers in ensuring that school sites are reserved during project master planning. Objective 4.7.4.2.3: Middle and high schools sites should be located in lands outside of the primary corridor, preferably on the edge of the corridor with direct access to the bike/green system. Objective 4.7.4.2.4: Orange County should coordinate with the School Board and business/industries locating within the Innovation Way to provide professional development and mentoring programs.
4.7.5 Goal 5: Ensure the Effectiveness and Efficiency of Government Services and Programs by Fostering Intergovernmental Coordination 4.7.5.1 Coordination of Plans and Programs Principle

Orange County, Florida Innovation Way Economic Development & Environmental Resource Management Study
December 2005
234
Orange County should coordinate its programs and Innovation Way Master Plan with the programs and plans of adjacent local governments and regulatory agencies including Osceola County, the City of Orlando, Orlando International Airport, the Orange County School Board, the Expressway Authority, the Water Management Districts, and the University of Central Florida to ensure consistency, expedite facility improvements, and reduce public cost. Orange County should utilize Joint Planning Area Agreements to ensure the effective and efficient delivery of public services and the development of compatible land uses in order to implement the Innovation Way Corridor. Objective 4.7.5.1.1: Orange County should provide advance notice of all land use applications within the Innovation Way Corridor to all applicable regulatory agencies and affected local governments a minimum of 30 days prior to any public hearing. Applications and support documents should also be provided to these agencies for their review and comment. Objective 4.7.5.1.2: A Planning Coordination Committee should be created with all applicable local governments and regulatory agencies to assure the synchronization and integration of all infrastructure and development plans with the plans and programs of Orange County and with the Innovation Way Corridor Study.
4.7.6 Goal 6: Design an Attractive High Quality Environment. Integrate High Technology Businesses with Communities Based on a Compact Development Pattern, Traditional Neighborhood Design, and Transit Oriented Design. 4.7.6.1 Urban Design Principle High Tech businesses require a high quality environment. The creation of lively mixed use communities based on high tech businesses necessitates careful planning. Urban design guidelines can help to achieve a high quality environment that stresses diverse opportunities for business, recreation, entertainment, and aids in the preservation of the environment. Orange County should adopt urban design guidelines to create an attractive, efficient, and effective Innovation Way corridor and surrounding community. For a more detailed description of acceptable urban design guidelines please see the conceptual profiles Figures: 4.1.3-2, 4.1.5-2, 4.1.7-2. Objective 4.7.6.1.1 Orange County should adopt policies to ensure a compact development pattern for the Innovation Way Corridor. A compact development pattern may help curb sprawl, aid in the creation of civic space, and provide more opportunities for transit and alternative forms of transportation. Mixed used communities based on cluster development can also offer more flexibility to conserve open space and fragile environmental systems. Orange County should use many of the community building design ideas elaborated in A Village Land Use Classification and Horizon West Study Report in the creation of mixed use village communities.

Orange County, Florida Innovation Way Economic Development & Environmental Resource Management Study
December 2005
235
Objective 4.7.6.1.2 Orange County should adopt urban design guidelines to promote Traditional Neighborhood Design (TND) and Transit Oriented Design (TOD) to address the urban form of Innovation Way. Principles and ideas associated with TND and TOD may improve the overall aesthetic quality, effectiveness of transportation, and conservation of natural resources. Objective 4.7.6.1.2 Orange County should create and adopt architectural design standards for each of the village concepts. Orange County may wish to create designs based on a theme for each village/community.

Orange County, Florida Innovation Way Economic Development & Environmental Resource Management Study
December 2005
236
5.0 SUMMARY In summary, this report provides the blueprint for a high tech corridor in southeast Orange County generally located between Narcoosee Road and the Beachline. This corridor is part of a larger corridor extending from the University of Central Florida to the Orlando International Airport. The study proposes a master development framework which promotes economic development, private property rights, and long-term flexibility of land use while protecting the environmental assets of the area. The study supplies guidelines and policy recommendations for the successful implementation of the public’s vision for this area. The conclusions contained herein resulted from many hours of public input that started in July, 2005. Those workshops and visioning sessions clearly identified the building blocks of a successful development framework for Innovation Way Study Area. Through public involvement, the building blocks of preserved environmental resources, high tech/high value jobs, well-planned Innovation Way infrastructure (including multi-modal facilities) and diverse housing opportunities. Utilizing the ideas of the public and sound planning principles, Ivey Planning Group, (IPG), the consultant team, and County Staff studied five development scenarios for the 32,000 acres. Each scenario budgeted land for preservation, stormwater retention, open space, roads, committed projects and the necessary mix of land uses anticipated for the Study Area. IPG and County staff analyzed the development program data from each scenario. The five scenarios included a current trend analysis, a village plan, a compact edge theme, an activity village program, and a modified compact edge. The current trend plan applied a historical building program to the area which would be predominantly residential in nature with a fragmented development pattern. The other three scenarios planned for a two-mile wide corridor centered on the alignment of Innovation Way with the village concept supplying housing opportunities southeast and northwest of the corridor. The compact edge concept tightly concentrated all urban development in the corridor and immediately adjacent to it leaving greater opportunities for preservation along the Econlockhatchee River. The Activity Village Plan combines the best aspects of the Village scenario and the Compact Edge plan to provide housing opportunities outside the high tech corridor, but more tightly clustering the village developments so that preservation around and between the villages became highlighted. To pursue the implementation of any of the development programs discussed in the report (except for current trends), the next step is to choose a development program and to prepare amendments to the County’s Comprehensive Plan to create and Innovation Way overlay. The amendments will be expressed as Goals, Objectives and Policies in the various elements of the County’s Comprehensive Plan. After the Comprehensive Plan is

Orange County, Florida Innovation Way Economic Development & Environmental Resource Management Study
December 2005
237
amended, the County’s land development regulations will require some changes. Both processes will provide further opportunities for public comment and review.

Orange County, Florida Innovation Way Economic Development & Environmental Resource Management Study
December 2005
238
6.0 APPENDIX
Population HouseholdsHousehold
SizeTotal
Employment
Annual Population
ChangeAnnual Employment
Change2000 902.32 338.59 2.61 742.532001 926.50 348.92 2.60 734.47 2.68% -1.08%2002 944.74 357.20 2.59 727.21 1.97% -0.99%2003 964.87 366.00 2.59 748.38 2.13% 2.91%2004 986.13 375.30 2.58 769.56 2.20% 2.83%2005 1,007.94 384.85 2.57 790.75 2.21% 2.75%2006 1,029.29 394.20 2.57 811.93 2.12% 2.68%2007 1,051.19 403.71 2.56 833.12 2.13% 2.61%2008 1,073.07 413.17 2.56 854.30 2.08% 2.54%2009 1,094.81 422.53 2.55 875.48 2.03% 2.48%2010 1,116.57 431.87 2.55 896.67 1.99% 2.42%2011 1,138.56 441.23 2.54 917.84 1.97% 2.36%2012 1,160.77 450.62 2.54 939.02 1.95% 2.31%2013 1,183.25 460.00 2.54 960.20 1.94% 2.26%2014 1,205.50 469.15 2.54 981.37 1.88% 2.21%2015 1,228.20 478.37 2.54 1,002.55 1.88% 2.16%2016 1,250.87 487.43 2.54 1,023.73 1.85% 2.11%2017 1,273.76 496.42 2.54 1,044.90 1.83% 2.07%2018 1,296.62 505.28 2.54 1,066.08 1.79% 2.03%2019 1,319.27 513.92 2.54 1,087.25 1.75% 1.99%2020 1,342.14 522.54 2.54 1,108.43 1.73% 1.95%2021 1,365.14 531.09 2.54 1,129.60 1.71% 1.91%2022 1,388.38 539.63 2.55 1,150.77 1.70% 1.87%2023 1,412.00 548.16 2.55 1,171.94 1.70% 1.84%2024 1,435.55 556.51 2.55 1,193.12 1.67% 1.81%2025 1,459.43 564.84 2.56 1,214.29 1.66% 1.77%2026 1,483.48 573.08 2.56 1,235.46 1.65% 1.74%2027 1,507.92 581.32 2.57 1,256.63 1.65% 1.71%2028 1,532.51 589.45 2.58 1,277.80 1.63% 1.68%2029 1,557.24 597.48 2.58 1,298.97 1.61% 1.66%2030 1,582.34 605.51 2.59 1,320.13 1.61% 1.63%
Source: Woods & Poole Economics, Inc.
ORANGE COUNTY, FLORIDA POPULATION, HOUSEHOLD AND EMPLOYMENT FORECAST 2000 - 2003
Appendix 1: Orange County Population and Employment Forecast
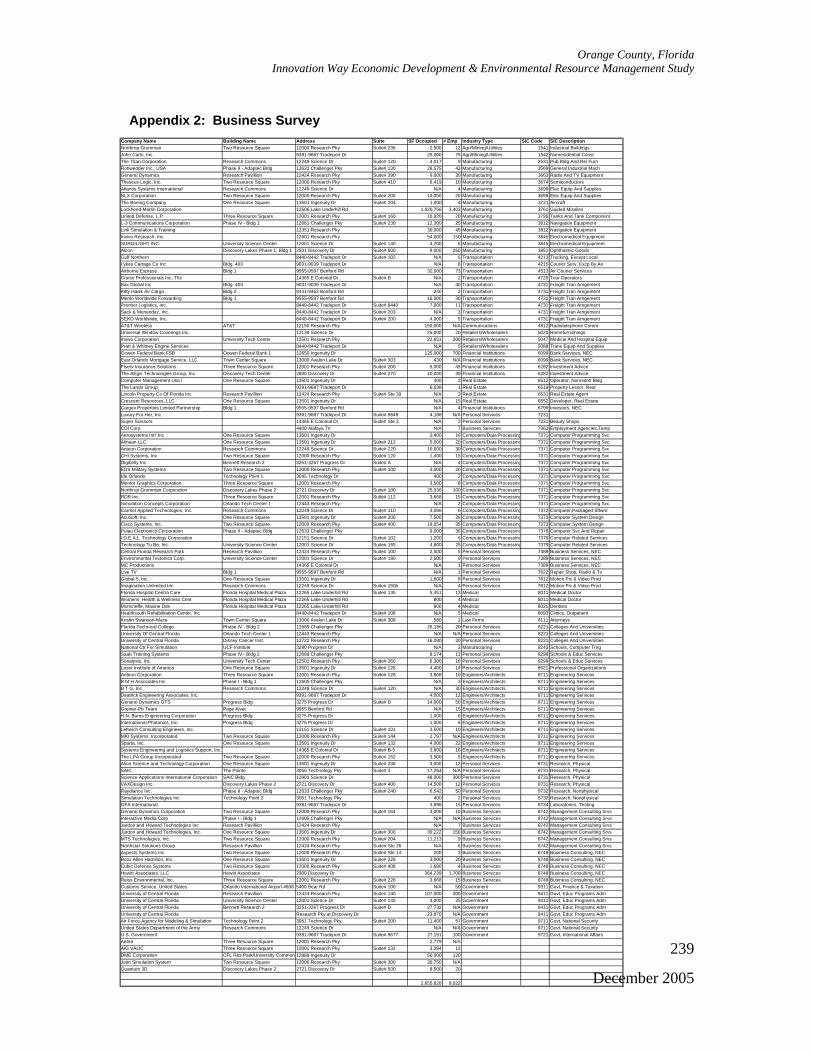
Orange County, Florida Innovation Way Economic Development & Environmental Resource Management Study
December 2005
239
Company Name Building Name Address Suite SF Occupied # Emp Industry Type SIC Code SIC DescriptionNorthrop Grumman Two Resource Square 12000 Research Pky Suite# 236 2,500 12 Agri/Mining/Utilities 1541 Industrial BuildingsJohn Carlo, Inc. 9391-9687 Tradeport Dr 25,000 75 Agri/Mining/Utilities 1542 Nonresidential ConstThe Titan Corporation Research Commons 12249 Science Dr Suite# 120 4,017 9 Manufacturing 2531 Pub Bldg And Rel FurnRohwedder Inc., USA Phase II - Adaptec Bldg 12633 Challenger Pky Suite# 130 26,575 43 Manufacturing 3569 General Industrial MachGeneral Dynamics Research Pavillion 12424 Research Pky Suite# 390 9,000 30 Manufacturing 3663 Radio And TV EquipmentTheseus Logic, Inc. Two Resource Square 12000 Research Pky Suite# 410 6,419 10 Manufacturing 3674 SemiconductorsAtlantis Systems International Research Commons 12249 Science Dr N/A 4 Manufacturing 3699 Elec Equip And SuppliesNLX Corporation Two Resource Square 12000 Research Pky Suite# 200 10,050 20 Manufacturing 3699 Elec Equip And SuppliesThe Boeing Company One Resource Square 13501 Ingenuity Dr Suite# 204 1,000 4 Manufacturing 3721 AircraftLockheed Martin Corporation 12506 Lake Underhill Rd 1,020,756 3,403 Manufacturing 3761 Guided MissilesUnited Defense, L.P. Three Resource Square 12001 Research Pky Suite# 160 10,920 20 Manufacturing 3795 Tanks And Tank ComponentL-3 Communications Corporation Phase IV - Bldg 1 12661 Challenger Pky Suite# 230 12,300 25 Manufacturing 3812 Navigation EquipmentLink Simulation & Training 12351 Research Pky 30,000 45 Manufacturing 3812 Navigation EquipmentInvivo Research, Inc. 12601 Research Pky 54,000 150 Manufacturing 3845 Electromedical EquipmentSURGILIGHT INC. University Science Center 12001 Science Dr Suite# 140 4,200 6 Manufacturing 3845 Electromedical EquipmentAlcon Discovery Lakes Phase 1, Bldg 1 2501 Discovery Dr Suite# 500 9,000 250 Manufacturing 3851 Ophthalmic GoodsGulf Northern 8440-8442 Tradeport Dr Suite# 102 N/A 5 Transportation 4213 Trucking, Except LocalLykes Cartage Co Inc Bldg. 403 9031-9039 Tradeport Dr N/A 8 Transportation 4215 Courier Serv, Excp By AirAirborne Express Bldg 1 9555-9597 Benford Rd 32,000 73 Transportation 4513 Air Courier ServicesCruise Professionals Inc, The 14365 E Colonial Dr Suite# B N/A 2 Transportation 4725 Tour OperatorsBax Global Inc Bldg. 403 9031-9039 Tradeport Dr N/A 40 Transportation 4731 Freight Tran ArngementKitty Hawk Air Cargo Bldg 2 9441-9463 Benford Rd 240 2 Transportation 4731 Freight Tran ArngementMenlo Worldwide Forwarding Bldg 1 9555-9597 Benford Rd 16,000 30 Transportation 4731 Freight Tran ArngementPremier Logistics, Inc. 8440-8442 Tradeport Dr Suite# 8440 7,000 11 Transportation 4731 Freight Tran ArngementSack & Menendez, Inc. 8440-8442 Tradeport Dr Suite# 203 N/A 3 Transportation 4731 Freight Tran ArngementSEKO Worldwide, Inc. 8440-8442 Tradeport Dr Suite# 200 4,000 5 Transportation 4731 Freight Tran ArngementAT&T Wireless AT&T 12150 Research Pky 150,000 N/A Communications 4812 Radiotelephone CommUniversal Window Coverings Inc. 12139 Science Dr 25,000 20 Retailers/Wholesalers 5023 HomefurnishingsInvivo Corporation University Tech Center 12501 Research Pky 22,651 200 Retailers/Wholesalers 5047 Medical And Hospital EquipPratt & Whitney Engine Services 8440-8442 Tradeport Dr N/A 5 Retailers/Wholesalers 5088 Trans Equip And SuppliesOcwen Federal Bank FSB Ocwen Federal Bank 1 12650 Ingenuity Dr 125,000 700 Financial Institutions 6099 Bank Services, NECEast Orlando Mortgage Service, LLC Town Center Square 13000 Avalon Lake Dr Suite# 303 430 N/A Financial Institutions 6099 Bank Services, NECFiserv Insurance Solutions Three Resource Square 12001 Research Pky Suite# 200 5,000 45 Financial Institutions 6282 Investment AdviceThe AEgis Technologies Group, Inc. Discovery Tech Center 2800 Discovery Dr Suite# 270 10,000 39 Financial Institutions 6282 Investment AdviceComputer Management Usa I One Resource Square 13501 Ingenuity Dr 400 2 Real Estate 6512 Operator, Nonrsdntl BldgThe Lando Group 9391-9687 Tradeport Dr 6,038 1 Real Estate 6519 Property Lessor, RealLincoln Property Co Of Florida Inc Research Pavillion 12424 Research Pky Suite# Ste 39 N/A 3 Real Estate 6531 Real Estate AgentCrescent Resources, LLC One Resource Square 13501 Ingenuity Dr N/A 15 Real Estate 6552 Developer, Real EstateCargex Properties Limited Partnership Bldg 1 9555-9597 Benford Rd N/A 4 Financial Institutions 6799 Investors, NECLuxury For Her, Inc 9391-9687 Tradeport Dr Suite# 9649 4,188 N/A Personal Services 7231Super Scissors 14365 E Colonial Dr Suite# Ste 2 N/A 2 Personal Services 7231 Beauty ShopsCDI Corp 4400 Alafaya Trl N/A 7 Business Services 7363 Employment Agencies,TempAerosystems Int'l Inc One Resource Square 13501 Ingenuity Dr 2,400 16 Computers/Data Processing 7371 Computer Programming SvcAlinean LLC One Resource Square 13501 Ingenuity Dr Suite# 212 5,000 20 Computers/Data Processing 7371 Computer Programming SvcAnteon Corporation Research Commons 12249 Science Dr Suite# 220 10,000 30 Computers/Data Processing 7371 Computer Programming SvcCHI Systems, Inc. Two Resource Square 12000 Research Pky Suite# 120 1,400 15 Computers/Data Processing 7371 Computer Programming SvcDigibelly Inc Bennett Research 2 3251-3267 Progress Dr Suite# A N/A 4 Computers/Data Processing 7371 Computer Programming SvcEDS Military Systems Two Resource Square 12000 Research Pky Suite# 100 3,000 20 Computers/Data Processing 7371 Computer Programming SvcIde Orlando Technology Point 1 3045 Technology Dr 400 2 Computers/Data Processing 7371 Computer Programming SvcMentor Graphics Corporation Three Resource Square 12001 Research Pky 3,500 8 Computers/Data Processing 7371 Computer Programming SvcNorthrop Grumman Corporation Discovery Lakes Phase 2 2721 Discovery Dr Suite# 100 25,036 100 Computers/Data Processing 7371 Computer Programming SvcRDR Inc. Three Resource Square 12001 Research Pky Suite# 112 3,668 15 Computers/Data Processing 7371 Computer Programming SvcSimulation Concepts Corporation Orlando Tech Center 1 12443 Research Pky N/A 2 Computers/Data Processing 7371 Computer Programming SvcCarmel Applied Technologies, Inc. Research Commons 12249 Science Dr Suite# 110 3,066 6 Computers/Data Processing 7372 Computer,Packaged SftwreAcuSoft, Inc. One Resource Square 13501 Ingenuity Dr Suite# 200 7,500 28 Computers/Data Processing 7373 Computer System DesignCisco Systems, Inc. Two Resource Square 12000 Research Pky Suite# 400 19,054 35 Computers/Data Processing 7373 Computer System DesignPulau Electronics Corporation Phase II - Adaptec Bldg 12633 Challenger Pky 9,000 36 Computers/Data Processing 7378 Computer Svc And RepairI.D.E.A.L. Technology Corporation 12151 Science Dr Suite# 102 1,200 6 Computers/Data Processing 7379 Computer Related ServicesTechnology To Be, Inc. University Science Center 12001 Science Dr Suite# 165 4,800 25 Computers/Data Processing 7379 Computer Related ServicesCentral Florida Research Park Research Pavillion 12424 Research Pky Suite# 100 2,500 5 Personal Services 7389 Business Services, NECEnvironmental Tectonics Corp. University Science Center 12001 Science Dr Suite# 180 2,500 9 Personal Services 7389 Business Services, NECMC Productions 14365 E Colonial Dr N/A 1 Personal Services 7389 Business Services, NECLive TV Bldg 1 9555-9597 Benford Rd N/A 1 Personal Services 7622 Repair Shop, Radio & TvGlobal-5, Inc. One Resource Square 13501 Ingenuity Dr 1,600 8 Personal Services 7812 Motion Pic & Video ProdImagination Unlimited Inc Research Commons 12249 Science Dr Suite# 150b N/A 4 Personal Services 7812 Motion Pic & Video ProdFlorida Hospital Centra Care Florida Hospital Medical Plaza 12265 Lake Underhill Rd Suite# 135 5,451 13 Medical 8011 Medical DoctorWomens Health & Wellness Cent Florida Hospital Medical Plaza 12265 Lake Underhill Rd 800 4 Medical 8011 Medical DoctorMoncrieffe, Maxine Dds Florida Hospital Medical Plaza 12265 Lake Underhill Rd 800 4 Medical 8021 DentistsHealthsouth Rehabilitation Center, Inc 8440-8442 Tradeport Dr Suite# 108 N/A 5 Medical 8093 Clinics, OutpatientKristin Swanson-Mace Town Center Square 13000 Avalon Lake Dr Suite# 308 580 2 Law Firms 8111 AttorneysFlorida Technical College Phase IV - Bldg 2 12689 Challenger Pky 26,186 20 Personal Services 8221 Colleges And UniversitiesUniversity Of Central Florida Orlando Tech Center 1 12443 Research Pky N/A N/A Personal Services 8221 Colleges And UniversitiesUniversity of Central Florida Disney Cancer Inst. 12722 Research Pky 16,080 20 Personal Services 8221 Colleges And UniversitiesNational Ctr For Simulation UCF Institute 3280 Progress Dr N/A 2 Manufacturing 8243 Schools, Computer TrngSaab Training Systems Phase IV - Bldg 2 12689 Challenger Pky 8,174 13 Personal Services 8299 Schools & Educ ServicesSonalysts, Inc. University Tech Center 12501 Research Pky Suite# 260 6,300 16 Personal Services 8299 Schools & Educ ServicesLaser Institute of America One Resource Square 13501 Ingenuity Dr Suite# 128 4,400 14 Personal Services 8621 Professional OrganizationsAnteon Corporation Three Resource Square 12001 Research Pky Suite# 128 3,808 10 Engineers/Architects 8711 Engineering ServicesB M H Associates Inc Phase I - Bldg 1 12605 Challenger Pky N/A 3 Engineers/Architects 8711 Engineering ServicesB T G, Inc Research Commons 12249 Science Dr Suite# 120 N/A 30 Engineers/Architects 8711 Engineering ServicesDeatrick Engineering Associates, Inc. 9391-9687 Tradeport Dr 4,000 12 Engineers/Architects 8711 Engineering ServicesGeneral Dynamics OTS Progress Bldg 3275 Progress Dr Suite# D 14,000 50 Engineers/Architects 8711 Engineering ServicesGreiner-Pb Team Page Ajvet 9955 Benford Rd N/A 15 Engineers/Architects 8711 Engineering ServicesH.N. Burns Engineering Corporation Progress Bldg 3275 Progress Dr 1,000 6 Engineers/Architects 8711 Engineering ServicesInternational Photonics, Inc. Progress Bldg 3275 Progress Dr 1,000 6 Engineers/Architects 8711 Engineering ServicesLeftwich Consulting Engineers, Inc. 12151 Science Dr Suite# 101 3,500 10 Engineers/Architects 8711 Engineering ServicesMKI Systems, Incorporated Two Resource Square 12000 Research Pky Suite# 144 2,797 N/A Engineers/Architects 8711 Engineering ServicesSparta, Inc. One Resource Square 13501 Ingenuity Dr Suite# 132 4,000 22 Engineers/Architects 8711 Engineering ServicesSystems Engineering and Logistics Support, Inc. 14365 E Colonial Dr Suite# B-5 3,600 16 Engineers/Architects 8711 Engineering ServicesThe LPA Group Incorporated Two Resource Square 12000 Research Pky Suite# 152 3,500 5 Engineers/Architects 8711 Engineering ServicesAlion Science and Technology Corporation One Resource Square 13501 Ingenuity Dr Suite# 236 3,000 12 Personal Services 8731 Research, PhysicalSAIC The Pointe 3050 Technology Pky Suite# 3 17,264 N/A Personal Services 8731 Research, PhysicalScience Applications International Corporation SAIC Bldg 12901 Science Dr 48,000 300 Personal Services 8731 Research, PhysicalVAXDesign Inc. Discovery Lakes Phase 2 2721 Discovery Dr Suite# 400 14,500 12 Personal Services 8731 Research, PhysicalRaydiance Inc. Phase II - Adaptec Bldg 12633 Challenger Pky Suite# 240 6,542 50 Personal Services 8732 Research, NonphysicalSimulation Technologies Inc Technology Point 2 3051 Technology Pky 400 2 Personal Services 8732 Research, NonphysicalGFA International 9391-9687 Tradeport Dr 3,998 15 Personal Services 8734 Laboratories, TestingGeneral Dynamics Corporation Two Resource Square 12000 Research Pky Suite# 164 3,000 10 Business Services 8742 Management Consulting SrvsInteractive Media Corp Phase I - Bldg 1 12605 Challenger Pky N/A N/A Business Services 8742 Management Consulting SrvsJardon and Howard Technologies Inc Research Pavillion 12424 Research Pky N/A 7 Business Services 8742 Management Consulting SrvsJardon and Howard Technologies, Inc. One Resource Square 13501 Ingenuity Dr Suite# 300 30,222 150 Business Services 8742 Management Consulting SrvsMTS Technologies, Inc. Two Resource Square 12000 Research Pky Suite# 204 11,213 9 Business Services 8742 Management Consulting SrvsNorthstar Solutions Group Research Pavillion 12424 Research Pky Suite# Ste 26 N/A 6 Business Services 8742 Management Consulting SrvsAspects Systems Inc Two Resource Square 12000 Research Pky Suite# Ste 14 200 3 Business Services 8748 Business Consulting, NECBooz Allen Hamilton, Inc. One Resource Square 13501 Ingenuity Dr Suite# 228 3,000 20 Business Services 8748 Business Consulting, NECCubic Defense Systems Two Resource Square 12000 Research Pky Suite# 408 1,680 4 Business Services 8748 Business Consulting, NECHewitt Associates, LLC Hewitt Associates 2300 Discovery Dr 364,239 1,700 Business Services 8748 Business Consulting, NECReiss Environmental, Inc. Three Resource Square 12001 Research Pky Suite# 228 3,668 15 Business Services 8748 Business Consulting, NECCustoms Service, United States Orlando International Airport #608 5400 Bear Rd Suite# 100 N/A 50 Government 9311 Govt, Finance & TaxationUniversity of Central Florida Research Pavillion 12424 Research Pky Suite# 140 107,000 300 Government 9411 Govt, Educ Programs AdmUniversity of Central Florida University Science Center 12001 Science Dr Suite# 145 3,000 25 Government 9411 Govt, Educ Programs AdmUniversity of Central Florida Bennett Research 2 3251-3267 Progress Dr Suite# D 27,732 N/A Government 9411 Govt, Educ Programs AdmUniversity of Central Florida Research Pky at Discovery Dr 23,870 N/A Government 9411 Govt, Educ Programs AdmAir Force Agency for Modeling & Simulation Technology Point 2 3051 Technology Pky Suite# 200 11,400 57 Government 9711 Govt, National SecurityUnited States Department of the Army Research Commons 12249 Science Dr N/A N/A Government 9711 Govt, National SecurityU.S. Government 9391-9687 Tradeport Dr Suite# 9677 27,191 100 Government 9721 Govt, International AffairsAetna Three Resource Square 12001 Research Pky 2,779 N/AAIG VALIC Three Resource Square 12001 Research Pky Suite# 132 3,394 13DME Corporation CFL Res Park/University Commons12889 Ingenuity Dr 50,000 120Joint Simulation System Two Resource Square 12000 Research Pky Suite# 300 30,750 N/AQuantum 3D Discovery Lakes Phase 2 2721 Discovery Dr Suite# 500 8,500 20
2,655,826 9,022
Appendix 2: Business Survey

Orange County, Florida Innovation Way Economic Development & Environmental Resource Management Study
December 2005
240
Appendix 3: Scenario Evaluation Criteria Matrix

Orange County, Florida Innovation Way Economic Development & Environmental Resource Management Study
December 2005
241
Appendix 4: ACP Report
Orange County, Florida Innovation Way Economic Development & Environmental Resource Management Study
December 2005
242
7.0 REFERENCE LIST Alles, David L. Western Washington University. Biodiversity Hot Spots: The Florida Everglades. December 2004. Association of University Research Parks http://www.aurp.net/ 2005. Bureau of Wildlife Diversity Conservation. Florida Panther Genetic Restoration and Management Annual Report. September 2000 Canin Associates, Inc. Vision Northwest Plan. Data Collection Report to the Orange County Planning Department. October 1996. Central Florida Research Park: http://www.ucf.edu/catalog/9899/UCF_Section/central_florida_research_park.html City of Riverside http://www.riversideca.gov/devdept/econdev/eblitz/0506-high-tech-co.htm Cowardin, L.M., V. Carter, F.C. Golet, and E.T. LaRoe. 1979. Classification of Wetlands and Deepwater Habitats of the United States. U.S. Department of the Interior, Fish and Wildlife Service. FWS/OBS-79/31. 103 pp. Cox, J.A. and Kautz, R.S. 2000. Habitat Conservation Needs of Rare and Imperiled Wildlife in Florida. Office of Environmental Services, Florida Game & Fresh Water Fish Commission, Tallahassee, Florida. Cox, J.; R. Kautz, M. MacLaughlin, and T. Gilbert. 1994. Closing the Gaps in Florida’s Wildlife Habitat Conservation System. Florida Fish and Wildlife Conservation Commission, Tallahassee, Florida. Department of Environmental Protection, Standards and Monitoring Section, 1995, Listing of Outstanding Florida Waters by County. Florida Geographic Data Library (FGDL). http:// www.fgdl.org. University of Florida. Florida State University, Tallahassee, FL. Florida Natural Areas Inventory. http://www.fnai.org/gis_data.cfm. 2005. Florida Natural Areas Inventory. Florida Forever Conservation Needs Assessment – Technical Report: Version 2. July 2005. Florida Natural Areas Inventory. FNAI Tracking List for Orange County, Florida. April 2005

Orange County, Florida Innovation Way Economic Development & Environmental Resource Management Study
December 2005
243
Florida Natural Areas Inventory.. Florida Natural Areas Inventory Conservation Areas Zone B. 2001. Florida Natural Areas Inventory. 2000. Florida Natural Areas Inventory Conservation Areas Zone A. Tallahassee, Florida. Florida State University. Florida Natural Areas Inventory: Florida Managed Areas. September 2004. Florida State University, Tallahassee, FL. Florida Natural Areas Inventory: Conservation and Recreation Lands 1999. November 2002. Florida State University. Florida Natural Areas Inventory: Conservation and Recreation Lands 1998. November 2002. Florida State University. Florida Natural Areas Inventory: Guide to the Natural Communities of Florida. 1990. HDR Engineering, Orange County, Florida. Environmental Constraints Analysis & Development Suitability Mapping.. March 31, 1995. Howe, Douglas and Shawn Perry. “Biotech on Spec.” Development Magazine Summer 2005: p.43-48. Kasarda, John. “Aerotropolis: Airport Drive Urban Development.” Urban Land Institute, ULI on the Future, Cities in the 21st Century Special Publication 2000: 32-41. Kautz, R., R. Kawula, H. Robert, T. Hoctor, J. Comiskey, D. Jansen, D. Jennings, J. Kasbohm, F. Mazzotti, R. McBride, L. Richardson, and K. Root. How Much is Enough? Landscape-Scale Conservation for the Florida Panther. Mike Dennis, PhD of Breedlove, Dennis & Associates. Personal communications. 2005 McBride, Roy. Florida Panther Current Verified Population, Distribution, and Highlights of Field Work. Fall 2001 – Winter 2002. Orange County, Florida. GIS Databases. 2005. Orange County Growth Management, 2005, GIS databases. Orange County Government, Florida. Orange County Environmental Protection Division Annual Report. 2004. Orlando International Airport:

Orange County, Florida Innovation Way Economic Development & Environmental Resource Management Study
December 2005
244
http://www.orlandoairports.net/goaa/reports/summary/quickfacts.pdf 2005. Orlando's Central Florida Technology Park has found success http://www.jacksonville.com/tu-online/stories/062705/bus_19077011.shtml 2005. Platt, Kevin and Patrick Curran. “Green Land Planning.” Urban Land Magazine July 2003: 30-35. Soil Conservation Society of America. Revised 1987. 26 Ecological Communities of Florida. South Florida Water Management District. Palatka, Florida. GIS Databases. 2005. St. Johns River Water Management District. 2005 GIS Databases. St. Johns River Water Management District, Palatka, Florida. St. Johns River Water Management District Lands. January 2001. State of Florida Administrative Code, Chapter 40C-4, Environmental Resource Permits: Surface Water Management Systems, St. Johns River Water Management District. State of Florida Administrative Code, Chapter 40E-4, Environmental Resource Permits: Surface Water Management Systems, South Florida Water Management District. State of Florida. Department of Environmental Protection in cooperation with the Acquisition & Restoration Council. Florida Forever Five Year Plan. 2005 State of Florida. Department of Environmental Protection in cooperation with the Acquisition & Restoration Council. Florida Forever Five Year Plan. 2004 State of Florida. Department of Environmental Protection and Bureau of Submerged Lands and Environmental Resources Information Management Section (ERIS). Final Report - Ecological Integrity Grant (CD994085-92-0). January 1997. State of Florida. Department of Transportation. Florida Land Use, Cover and Forms Classification System. 1999. State of Florida. Fish & Wildlife Conservation Commission. News Release: Panther Struck by I-95 Motorist. June 2005. State of Florida. Fish & Wildlife Conservation Commission. Strategic Habitat Conservation Areas. 2001. State of Florida. Fish & Wildlife Conservation Commission. . Use of Least Cost Pathways to Identify Key Highway Segments for Panther Conservation. February 2005.
Orange County, Florida Innovation Way Economic Development & Environmental Resource Management Study
December 2005
245
State of Florida. Fish & Wildlife Conservation Commission. Habitat and Landcover Dataset. March 2004. State of Florida. Fish & Wildlife Conservation Commission. Florida’s Endangered Species, Threatened Species, and Species of Special Concern. January 2004. State of Florida. Fish & Wildlife Conservation Commission. Biodiversity Hotspots. November 2002. United States. Department of Agriculture, Soil Conservation Service. August 1989. Soil Survey of Orange County, Florida. United States. Fish and Wildlife Service and SubTeam of MERIT and U.S. Alpine, Texas. September 2002. United States. Fish & Wildlife Service. Orange County Federally Listed Species. North Florida Field Office. USFWS website. 2005 United States. Fish & Wildlife Service. Personal communication with Allen Webb regarding the Florida panther. 2005. United States. Fish & Wildlife Service. South Florida Ecological Services Office. Standard Local Operating Procedures for Endangered Species. Audubon’s Crested Caracara.. June 2005. United States. Fish & Wildlife Service. South Florida Ecological Services Office. Standard Local Operating Procedures for Endangered Species: Bald Eagles. July 2003. United States. Fish & Wildlife Service. South Florida Ecological Services. Standard Local Operating Procedures for Endangered Species. Red-cockaded Woodpecker. Office. July 2003. United States. Fish & Wildlife Service. South Florida Ecological Services Office. Standard Local Operating Procedures for Endangered Species.: Scrub Jays. April 2002. United States. Fish & Wildlife Service. 50 CFR Ch. 1, Section 17.11 Endangered and threatened wildlife and Section 17.12: Endangered and Threatened Plants. 2000. United States. Fish & Wildlife Service. National Wetlands Inventory. 2002. United States. U.S. Fish & Wildlife Service. South Florida Multi-Species Recovery Plan. Atlanta, Georgia. May 1999.
Orange County, Florida Innovation Way Economic Development & Environmental Resource Management Study
December 2005
246
United States. Fish and Wildlife Service. Recovery Plan for the Red-cockaded Woodpecker. 1985. University of Central Florida: http://www.iroffice.ucf.edu/character/current.html University of Central Florida. Personal communication with Read Noss, PhD regarding the Florida panther. 2005 University of Florida. Geoplan Center. Florida Ecological Greenways Network Critical Linkages and Prioritization Results. 2002 Valencia Community College: http://valencia.cc.fl.us/AboutUs/whoweare/documents/FastFacts.pdf Wikipedia, the free encyclopedia http://en.wikipedia.org/wiki/University_of_Central_Florida Wilson, Alex, et al., Green Development: Integrating Ecology and Real Estate. New York: John Wiley & Sons, Inc., 1998.