table 5.a.1. evidence table - ahrq
TRANSCRIPT

TABLE V.A.1 – Evidence table
Type of Evidence Findings Citations
Use of Trigger Tools to Identify Patient Harm
Prospective Investigators developed an automated Classen DC, Pestotnik
Study computerized method to improve the
detection and characterization of adverse
drug events (ADEs) in hospitalized patients.
Over 18 months, a total of 36,653 patients
were monitored at LDS Hospital, Salt Lake
City, Utah. The computerized ADE
monitoring program consisted of two
components: automated detection of
potential ADEs and enhanced voluntary
reporting at all computer terminals
throughout the hospital. Verified ADEs were
permanently stored in patients’ medical
records.
Over the 18-month study period, 648
patients were found to have ADEs (731
total ADEs), resulting in an overall ADE rate
of 1.67%. 90 of 731 ADEs were detected by
enhanced voluntary reporting, while 641
were detected through automated methods.
Analgesics and narcotics, antibiotics,
cardiovascular agents, and anticoagulants
accounted for 31%, 23.3%, 19.4%, and
9.3% of ADEs, respectively. Traditional
voluntary reporting only identified 9 ADEs.
SL, Evans RS, Burke JP.
Computerized
surveillance of adverse
drug events in hospital
patients. JAMA
1991;266(20):2847
2851.51
Prospective Investigators developed a computer-based Jha AK, Kuperman GJ,
Study monitoring system that identified “alerts”
that possibly indicated an adverse drug
event (ADE).
The study population consisted of all
patients admitted to nine medical and
surgical units at Brigham and Women’s
Hospital from October 1994 to May 1995.
Medical records flagged with an alert were
reviewed to determine whether an ADE had
occurred. This computer-based monitoring
program was compared to more traditional
Teich JM, Leape L, Shea
B, Rittenberg E, Burdick
E, Seger DL, Vander Vliet
M, Bates DW. Identifying
adverse drug events:
development of a
computer-based monitor
and comparison with chart
review and stimulated
voluntary report. J Am
Med Inform Assoc JAMIA.

methods of monitoring ADEs: intensive
chart review and voluntary reporting.
The computer monitoring program identified
275 ADEs, chart review 398 ADEs, and
voluntary report only 23 ADEs. There was
an overlap of 76 ADEs identified by the
computer monitor and chart review.
Although chart review detected more ADEs
overall, the computer monitor identified
more ADEs in the “severe” category.
Computer review required 20 percent as
much time (11 person-hours/week) as chart
review did (55 person-hours/week).
1998;5(3):305-314.62
Prospective Investigators evaluated a semi-automated Kaiser AM, de Jong E,
Study electronic surveillance system (ESS) with
triggers to detect ventilator-associated
pneumonia (VAP) and central line-
associated blood stream infections
(CLABSIs) in intensive care.
553 patients from October 2009 to October
2010 were screened, with patients with
pneumonia at admission excluded.
Whenever a trigger occurred, the data
management system automatically sent an
alert, leading reviewers to check the
patient’s chest X-rays and microbiology
culture results. The semi-automated ESS
was compared with traditional manual
screening, which does not include trigger
use. Therefore, reviewers had to screen
chest X-rays and culture results for all
hospitalization days for patients.
For VAP, the trigger-based screening had a
sensitivity of 92.3%, a specificity of 100%,
and a negative predictive value of 99.8%
compared to manual screening of all
patients, and results for CLABSI were very
similar. The trigger-based screening was
only slightly less accurate and thus
accurate enough to be used as a quality
indicator over time. Based on an
Evelein-Brugman SF,
Peppink JM,
Vandenbroucke-Grauls
CM, Girbes AR.
Development of trigger-
based semi-automated
surveillance of ventilator-
associated pneumonia
and central line-
associated bloodstream
infections in a Dutch
intensive care. Ann
Intensive Care.
2014;4:40.
doi:10.1186/s13613-014
0040-x. 61
approximate estimation of saved time, the
trigger-based screening reduced workload
by 90%.
Prospective Investigators developed an electronic Kirkendall ES, Spires WL,
Study trigger report system to detect patients at
risk for nephrotoxic medication-associated
acute kidney injury (NTMx-AKI) before the
injury occurs. This system was developed
using manual trigger screening protocols as
a guide.
After evaluating NTMx exposure trigger
reports at Cincinnati Children’s Hospital
Medical Center from September 2011 to
September 2013, sensitivity, specificity,
positive and negative predictive values for
NTMx exposure triggers were found to
achieve ≥0.95. Although investigators
encountered challenges with defining
trigger logic and incorporating clinical work-
flows, the electronic system was a
technical, clinical, and quality improvement
success. The automated trigger-based
system proved much more efficient than
manual screening since it reduced the time
spent on manual data entry and
transcription processes. The system also
showed a higher ability to detect NTMx
exposure.
Mottes TA, Schaffzin JK,
Barclay C, Goldstein SL.
Development and
Performance of Electronic
Acute Kidney Injury
Triggers to Identify
Pediatric Patients at Risk
for Nephrotoxic
Medication-Associated
Harm. Appl Clin Inform.
2014;5(2):313-333.
doi:10.4338/ACI-2013-12
RA-0102.64
Cross-Sectional Investigators developed and tested a Agarwal S, Classen D,
Study pediatric intensive care unit- (PICU) specific
trigger tool to identify adverse events,
including adverse drug events (ADEs).
The study population consisted of randomly
selected patients from 15 hospitals across
the U.S., who were in the PICU for a
minimum of two days and were discharged,
transferred out, or died between September
1 and December 31, 2005. 734 medical
records were reviewed.
Chart reviews identified a total of 1,488
Larsen G, Tofil NM,
Hayes LW, Sullivan JE,
Storgion SA, Coopes BJ,
Craig V, Jaderlund C,
Bisarya H, Parast L,
Sharek P. Prevalence of
adverse events in
pediatric intensive care
units in the United States.
Pediatr Crit Care Med J
Soc Crit Care Med World
Fed Pediatr Intensive Crit
Care Soc.
adverse events, including 256 ADEs. The 2010;11(5):568-578.
trigger tool was responsible for the doi:10.1097/PCC.0b013e
identification of 2,816 triggers and 1,250
(84%) of the total adverse events. The
positive predictive value of the overall tool
was 0.44, with a range of 0.2 to 1.25 for
individual triggers. Use of the trigger tool
resulted in a mean chart review time of 24.7
minutes per reviewer. Only 4% of the
identified adverse events were also
identified via incident reports.
3181d8e405.12
Cross-Sectional Investigators estimated the incidence of Baker GR, Norton PG,
Study adverse events (AEs) in acute care hospital
patients.
The study population consisted of a random
sample of adult (≥18 years) admissions to
hospitals in five Canadian provinces. Chart
reviews were conducted in a 2-stage
process. In stage 1, nurses or health
records professionals screened each chart
for the presence of 1 or more of 18 criteria
deemed to be associated with AEs. In stage
2, physicians reviewed charts in which at
least one criteria was identified. Inter-rater
reliability was assessed on a 10% random
sample of charts during the chart review
training process.
Nurses and health records professionals
had moderate agreement for the 10%
sample of charts (Kappa = 0.70; 95%
confidence interval [CI] 0.63 to 0.76) and
physicians had moderate agreement for
various aspects of AE assessment, such as
whether an AE occurred (Kappa = 0.47;
95% CI 0.35 to 0.58) and the preventability
of the event (Kappa = 0.69; 95% CI 0.55 to
0.83). A total of 289 AEs were found in 858
charts.
Flintoft V, Blais R, Brown
A, Cox J, Etchells E, Ghali
WA, Hébert P, Majumdar
SR, O’Beirne M, Palacios-
Derflingher L, Reid RJ,
Sheps S, Tamblyn R. The
Canadian Adverse Events
Study: the incidence of
adverse events among
hospital patients in
Canada. Can Med Assoc
J 2004;170(11):1678
1686.29
Cross-Sectional
Study
Investigators examined the utility of a
trigger tool to detect adverse drug events
(ADEs) in pediatric oncology and
Call RJ, Burlison JD,
Robertson JJ, Scott JR,
Baker DK, Rossi MG,
hematology patients.
The study population consisted of patients
from Saint Jude Children’s Research
Hospital, which participates in the
Automated Adverse Event Detection
Collaborative (AAEDC). An electronic
trigger tool package was used to analyze
electronic health records from February
2009 to February 2013. Chart review
determined whether the trigger had an
associated ADE.
A total of 706 trigger occurrences were
detected in 390 patients by 6 triggers. 33
ADEs were identified. Chart reviewers took
an average of three minutes per event to
determine if a trigger was associated with
an ADE. The positive predictive value
(PPV) of individual triggers ranged from 0 to
60%, while the overall tool had a PPV of
16%. The most successful trigger was
hyaluronidase (PPV 60%). Of the 21 ADEs
detected via trigger tool that were deemed
preventable, 3 were identified through
voluntary reports.
Howard SC, Hoffman JM.
Adverse Drug Event
Detection in Pediatric
Oncology and
Hematology Patients:
Using Medication Triggers
to Identify Patient Harm in
a Specialized Pediatric
Patient Population. J
Pediatr. 2014.
doi:10.1016/j.jpeds.2014.
03.033.52
Cross-Sectional Investigators evaluated the adverse event Classen DC, Resar R,
Study (AE) detection ability of three different
detection methods: the Institute for
Healthcare Improvement’s (IHI) Global
Trigger Tool (GTT), each hospital’s
voluntary reporting system, and the Agency
for Healthcare Research and Quality’s
(AHRQ) Patient Safety Indicators (PSIs).
The study population consisted of randomly
selected adult (≥18 years) inpatients who
were admitted to three U.S. tertiary care
centers during the period of October 1-31,
2004. A total of 795 randomly selected
medical records were reviewed from the
three hospitals. To evaluate sensitivity,
specificity, and positive and negative
predictive value, a physician-led expert
Griffin F, Federico F,
Frankel T, Kimmel N,
Whittington JC, Frankel A,
Seger A, James BC.
“Global Trigger Tool”
Shows That Adverse
Events In Hospitals May
Be Ten Times Greater
Than Previously
Measured. Health Aff
(Millwood).
2011;30(4):581-589.
doi:10.1377/hlthaff.2011.0
190.39
review team independently conducted
complete hospital record reviews for all
patients included in the study from one of
the hospital sites.
The three methods combined detected 393
AEs. The IHI GTT methodology identified
354 AEs (90.1% of total AEs; 94.9%
sensitivity, 100% specificity), voluntary
hospital reporting identified 4 AEs (1%; 0%
sensitivity, 100% specificity), and the PSIs
identified 35 AEs (8.99%; 5.8% sensitivity,
98.5% specificity).
Cross-Sectional Investigators used an automated electronic Dickerman MJ, Jacobs
Study health record adverse event (AE) detection
system to identify and categorize
hypoglycemia-related AEs in pediatric
inpatients.
Hypoglycemia-related triggers (glucose
level ≤50 mg/dL) that were generated over
a 1-year period at Children’s National
Medical Center were retrospectively
reviewed. Data were collected from the
Emergency Department (ED) and all
inpatient clinical areas. An AE was defined
as hypoglycemia that resulted from medical
therapy or lack of appropriate medical
therapy. The electronic health records of all
patients admitted to the hospital from
September 2007 to August 2008 were
reviewed; however, weekend days from
September 2007 to February 2008 were
excluded due to investigator resource
limitations. AE rates were calculated using
data from March to August 2008.
A total of 1,254 triggers were detected, of
which 198 were determined to be AEs
(positive predictive value (PPV) 15.8%).
The 198 AEs were attributed to 68 patients.
The majority of AEs occurred in the
neonatal intensive care unit (13.4 AEs per
1000 patient-days; 28.2 AEs per 100
BR, Vinodrao H,
Stockwell DC.
Recognizing
hypoglycemia in children
through automated
adverse-event detection.
Pediatrics.
2011;127(4):e1035-1041.
doi:10.1542/peds.2009
3432.75

patient admissions).
Cross-Sectional Investigators compared computerized Ferranti J, Horvath MM,
Study surveillance, which used triggers, and
voluntary reporting of adverse drug event
(ADE) detection. For each system, they
also analyzed the number of ADEs resulting
from medications most likely to cause harm.
The study population consisted of adult
inpatients at a large, tertiary care academic
medical system from December 1, 2006 to
June 30, 2007. Medication safety
pharmacists evaluated and scored ADEs
from that period, and investigators
calculated ADEs/1,000 patient days.
Computerized surveillance detected 710
ADEs and voluntary reporting 205 ADEs.
40 ADEs were found by both systems. The
two systems showed significantly different
ADE rates for different drug categories.
Computerized surveillance mostly detected
hypoglycemia-related ADEs (68.2%) while
voluntary reporting were detected
“miscellaneous” ADEs (49.8%).
Computerized surveillance is better at
estimating the ADE rate, but voluntary
reporting provides qualitative details not
available from computerized surveillance.
Cozart H, Whitehurst J,
Eckstrand J, Pietrobon R,
Rajgor D, Ahmad A. A
Multifaceted Approach to
Safety: The Synergistic
Detection of Adverse
Drug Events in Adult
Inpatients. J Patient Saf.
2008;4(3):184-190.
doi:10.1097/PTS.0b013e3
18184a9d5.56
Cross-Sectional Investigators developed and tested a trigger Griffin FA, Classen DC.
Study tool for the detection of adverse events
(AEs) among surgical inpatients.
In 2003, the initial surgical trigger tool was
tested in five hospitals that had prior
experience with the Institute for Healthcare
Improvement (IHI) trigger tools, resulting in
a final tool with 23 triggers. The resulting
tool was tested in 31 hospitals from October
2003 to October 2004. 11 hospitals
provided de-identified patient-level data. A
total of 854 records were reviewed from
these 11 hospitals.
Detection of adverse
events in surgical patients
using the Trigger Tool
approach. Qual Saf
Health Care.
2008;17(4):253-258.
doi:10.1136/qshc.2007.02
5080.53

Over the course of one year, AEs were
identified in 125 medical records (138 AEs
total), resulting in a rate of 16 surgical AEs
per 100 patients. Many participating
hospitals reported that the trigger tool was
more effective at identifying surgical AEs
than existing reporting systems.
Cross-Sectional Investigators evaluated the utility of a Hooper AJ, Tibballs J.
Study trigger tool to assess and classify adverse
events (AEs) compared to voluntary
reporting.
The study population consisted of 60
randomly selected intensive care patients
from a pediatric university hospital. Two
independent investigators classified each
AE detected by the trigger tool as
insignificant, minor, moderate, major, or
catastrophic.
Each record took an average of 40 minutes
to review. A total of 98 AEs (59.9 AEs per
100 patient days) were identified.
Investigator 1 found 66 AEs, and
Investigator 2 found 93 AEs, (inter-rater
reliability Kappa = 0.63). Of the 61 AEs
identified by both investigators, the
agreement for severity classification was
very good (Kappa = 0.89).
Comparison of a Trigger
Tool and voluntary
reporting to identify
adverse events in a
paediatric intensive care
unit. Anaesth Intensive
Care. 2014;42(2):199
206.54
Cross-Sectional Investigators used an enhanced version of Kennerly DA, Kudyakov
Study the Institute for Healthcare Improvement’s
(IHI) Global Trigger Tool (GTT) to report
five years of adverse events (AEs) in a
large health care system.
The study population consisted of a random
sample of adults (≥18 years) admitted to
eight Baylor Health Care System acute care
hospitals from 2007 to 2011 with a
minimum length of stay of three days. A
total of 9,017 records were reviewed by
professional nurse reviewers. Medical
record/account numbers were matched to
R, da Graca B, Saldaña
M, Compton J,
Nicewander D, Gilder R.
Characterization of
Adverse Events Detected
in a Large Health Care
Delivery System Using an
Enhanced Global Trigger
Tool over a Five-Year
Interval. Health Serv Res.
2014. doi:10.1111/1475
6773.12163.44

identify overlapping voluntary reports or the
Agency for Healthcare Research and
Quality’s (AHRQ) Patient Safety Indicators
(PSIs).
A total of 3,430 AEs were identified. AE
rates were estimated to be 61.4 AEs per
1,000 patient days. Of the hospital-acquired
AEs, a majority were deemed to be possibly
preventable. Of the 1,186 hospital-acquired
AEs identified by the GTT between October
2008 and December 2011, 42 (3.5%) were
identified via voluntary reporting, and 18
(1.5%) had a PSI detected via analysis of
administrative data.
Cross-Sectional Investigators sought to adapt the Institute Kennerly DA, Saldaña M,
Study for Healthcare Improvement’s (IHI) Global
Trigger Tool (GTT) for use as a sustainable
monitoring tool.
The study population consisted of patients
from the Baylor Health Care System over a
four-year period. To reduce costs,
investigators limited the eligible patients to
those with a length of stay >3 days,
adapted the sample size and frequency of
review, and used a single nurse reviewer
followed by quality assurance review with
the Office of Patient Safety. A total of
16,172 records were reviewed.
14,184 records had positive triggers, of
which 17.1% were associated with adverse
events (AEs). Most AEs were identified
using the surgical and patient care trigger
tool modules. Chart reviewers had fair to
good agreement (Kappa = 0.62).
Kudyakov R, da Graca B,
Nicewander D, Compton
J. Description and
evaluation of adaptations
to the global trigger tool to
enhance value to adverse
event reduction efforts. J
Patient Saf. 2013;9(2):87
95.
doi:10.1097/PTS.0b013e3
1827cdc3b.45
Cross-Sectional Investigators evaluated the utility of the Kirkendall ES,
Study Institute for Healthcare Improvement’s (IHI)
Global Trigger Tool (GTT) for adverse
event (AE) detection in pediatric
populations.
The study population consisted of randomly
Kloppenborg E, Papp J,
White D, Frese C, Hacker
D, Schoettker PJ,
Muething S, Kotagal U.
Measuring adverse
selected patients from Cincinnati Children’s
Hospital Medical Center, a large, urban,
academic tertiary care center. A total of 240
charts were reviewed by nurses, followed
by a physician validation check for the
presence of AEs. Inter-rater reliability was
assessed on a 3-month sample of charts.
Nurse reviewers had an inter-rater reliability
of Kappa = 0.63 for the presence of AEs,
and the agreement between nurse and
physician reviewers was Kappa = 0.85. A
total of 404 triggers and 88 AEs were
identified, resulting in a mean rate of 36.7
AEs per 100 patients and 76.3 AEs per
1,000 patient days. Twenty-nine of the
identified AEs (33%) were discovered
without a particular GTT trigger being
identified (an “Other” trigger), indicating that
many pediatric AEs are not captured by
adult triggers and that additional pediatric
triggers may be required. No AEs were
detected by triggers from the Emergency
Department (ED), Intensive Care, and
Perinatal modules. Modifications to the GTT
to address pediatric-specific issues could
increase its test characteristics.
events and levels of harm
in pediatric inpatients with
the Global Trigger Tool.
Pediatrics.
2012;130(5):e1206-1214.
doi:10.1542/peds.2012
0179.13
Cross-Sectional Investigators developed and tested a trigger Lander L, Roberson DW,
Study tool to identify errors and adverse events
(AEs) that affect pediatric otolaryngology
(ORL) patients.
The study population consisted of 48
patients who were randomly selected from
the ORL service discharge list at Boston
Children’s Hospital. The trigger tool was
used by two non-clinicians to screen charts.
Detailed chart reviews performed by two
board-certified otolaryngologists served as
the gold standard for error and AE
detection.
Chart review using the trigger tool took
approximately 25 minutes per chart. A total
Plummer KM, Forbes PW,
Healy GB, Shah RK. A
trigger tool fails to identify
serious errors and
adverse events in
pediatric otolaryngology.
Otolaryngol--Head Neck
Surg Off J Am Acad
Otolaryngol-Head Neck
Surg. 2010;143(4):480
486.
doi:10.1016/j.otohns.2010
.06.820.59
of 236 triggers were identified. Inter-rater
reliability, assessed using Kappa statistics,
ranged from 0.35 (Admission trigger
category) to 0.90 (Medication trigger
category). Physician review identified 587
errors or AEs (553 errors and 34 AEs). The
trigger tool identified 92 errors and AEs.
The trigger tool had a sensitivity of 17%
(95% CI 14% to 20%), a specificity of 82%
(95% CI 79% to 84%), a positive predictive
value of 39% (95% CI 33% to 46%), and a
negative predictive value of 59% (95% CI
56% to 62%).
Cross-Sectional Investigators used the Canadian Paediatric Matlow AG, Baker GR,
Study Trigger Tool to determine incidence, type,
severity, and preventability of adverse
events (AEs) among children admitted to
academic and community hospitals in
Canada.
The study population consisted of randomly
selected patients from 0 to 18 years old. A
2-stage review process was used to screen
medical records. A nurse or health record
technologist first reviewed charts for
triggers. A physician then reviewed all the
charts in which a trigger was identified.
Inter-rater reliability was assessed on a
sample of 19 anonymized charts during the
chart review training process.
The percent agreement among nurses for
the presence of a trigger was 87% (95% CI
83% to 90%). The percent agreement
among physician reviewers for AEs was
66% (95% CI 57% to 76%). Overall, 9.2%
of children admitted to the hospital
experience AEs.
Flintoft V, Cochrane D,
Coffey M, Cohen E,
Cronin CMG, Damignani
R, Dubé R, Galbraith R,
Hartfield D, Newhook LA,
Nijssen-Jordan C.
Adverse events among
children in Canadian
hospitals: the Canadian
Paediatric Adverse
Events Study. Can Med
Assoc J
2012;184(13):E709-718.
doi:10.1503/cmaj.112153. 19
Cross-Sectional Investigators examined the inter-rater Naessens JM, O’Byrne
Study reliability of the Institute for Healthcare
Improvement’s (IHI) Global Trigger Tool
(GTT) and explored the value of individual
TJ, Johnson MG,
Vansuch MB, McGlone
CM, Huddleston JM.
Measuring hospital

triggers.
The study population consisted of 1,138
randomly selected adult patients who had
been discharged from three Mayo Clinic
practices. Charts were reviewed by two
nurse reviewers, with final reconciliation
performed by a physician. Review of each
record was capped at 20 minutes.
The positive predictive value of triggers
varied. For triggers identified in at least 20
cases, 80.6% of cases with the “Return to
Surgery” trigger had an adverse event (AE),
while 25.5% of cases with the “X-Ray intra-
op or in PACU” trigger had an AE. Overall
agreement between nurse reviewers on the
presence of any trigger (Kappa = 0.63; 95%
CI 0.58 to 0.68) was higher than overall
agreement between nurse reviewers on the
presence of AEs (Kappa = 0.51; 95% CI
0.45 to 0.57). The overall agreement
between nurse and physician assessment
of AEs was higher (Kappa = 0.71; 95% CI
0.68 to 0.74).
adverse events:
assessing inter-rater
reliability and trigger
performance of the Global
Trigger Tool. Int J Qual
Health Care J Int Soc
Qual Health Care ISQua.
2010;22(4):266-274.
doi:10.1093/intqhc/mzq02
6.57
Cross-Sectional Investigators examined the rate of adverse Resar RK, Rozich JD,
Study events (AEs) using a trigger tool specific to
intensive care units (ICUs).
The study population consisted of adult
(≥18 years) patients with an inpatient stay
>48 hours. Patients were randomly
selected from 62 ICUs in 54 U.S. academic
and community hospitals participating in the
Institute for Healthcare Improvement (IHI)
critical care collaboratives between 2001
and 2004. A total of 12,074 charts were
reviewed. Analyses were also conducted on
a subgroup of 1,294 charts from 13 pilot
ICUs in 10 hospitals.
The prevalence of AEs across all 62 ICUs
was 11.3 events per 100 ICU days (range
3.2 to 27.36 AEs). The AE prevalence in
the pilot subgroup was 16.4 events per 100
Simmonds T, Haraden
CR. A trigger tool to
identify adverse events in
the intensive care unit. Jt
Comm J Qual Patient Saf
Jt Comm Resour.
2006;32(10):585-590.58

ICU days. Among the pilot subgroup, 10 of
23 triggers were associated with 1,064 of
1,450 AEs. The positive blood culture
trigger had the highest percent yield for AE
detection. A small number of triggers led to
the detection of a majority of the AEs.
Cross-Sectional Investigators developed and tested a trigger Rozich JD, Haraden CR,
Study tool to identify adverse drug events (ADEs).
The primary objectives were to: (1) assess
the feasibility of training individuals to use
the tool; (2) clarify training requirements;
and (3) describe the extent and scope of
ADEs in inpatient settings.
The study population consisted of patients
with a minimum hospital stay of two days
who were discharged from 86 hospitals in
four different medication safety
collaboratives. Hospitals were recruited
over an 18-month period starting in June
1999. A total of 2,837 charts were reviewed
using a tool that comprised 24 triggers.
Training new reviewers took approximately
30 to 60 minutes. An average of 2.68 ADEs
per 1000 doses of medication was
identified. In a subset of 1,704 charts, the
trigger with the highest percentage yield
was “abrupt medication stop”, which was
found 248 times and was associated with
86 ADEs. In another subset of hospitals,
only 5 of 274 (1.8%) ADEs found using the
trigger tool were identified using traditional
reporting methods.
Resar RK. Adverse drug
event trigger tool: a
practical methodology for
measuring medication
related harm. Qual Saf
Health Care.
2003;12(3):194-200.
doi:10.1136/qhc.12.3.194. 41
Cross-Sectional Investigators developed and tested a Sharek PJ, Horbar JD,
Study neonatal intensive care unit- (NICU)
specific trigger tool designed to identify
adverse events (AEs).
The study population consisted of patients
who were hospitalized for a minimum of two
days and were discharged, transferred out,
or died between November 1, 2004 and
Mason W, Bisarya H,
Thurm CW, Suresh G,
Gray JE, Edwards WH,
Goldmann D, Classen D.
Adverse events in the
neonatal intensive care
unit: development, testing,
and findings of an NICU
January 31, 2005. The trigger tool was
used to retrospectively review 749
randomly selected charts of patients
discharged from 15 NICUs (14 in the U.S.
and 1 in Canada).
Chart reviews revealed a total of 2,218
triggers (2.96 triggers per patient) and 554
unique AEs (0.74 AEs per patient). Only
6.1% of the unique AEs identified did not
have an associated trigger. Of the 554
detected unique AEs, only 8% were
identified by voluntary occurrence reports.
The NICU trigger tool resulted in a median
chart review time of 15 minutes, a mean
chart review time of 20.5 minutes, and had
a mean positive predictive value (PPV) of
0.38 (range of PPVs for each individual
independent trigger 0.08 to 1.0). The most
common AEs identified were nosocomial
infections, catheter infiltrates, and abnormal
cranial imaging.
focused trigger tool to
identify harm in North
American NICUs.
Pediatrics.
2006;118(4):1332-1340.
doi:10.1542/peds.2006
0565.15
Cross-Sectional Investigators assessed the performance Sharek PJ, Parry G,
Study characteristics of the Institute for
Healthcare Improvement’s (IHI) Global
Trigger Tool (GTT) to determine its
reliability at regional and national levels.
Chart reviews were conducted at 10
stratified, randomly selected acute care
hospitals in North Carolina. Eligible patients
were ≥18 years on admission and were
discharged between January 1, 2002 and
December 31, 2007. A total of 2,400
randomly selected charts (240 per hospital:
10 per hospital per quarter) were reviewed
by internal (hospital-affiliated) and external
(unaffiliated) reviewers. Additionally, an
expert review team reviewed a 10%
random sample of charts. A total of 202
charts were reviewed by all three review
teams.
The trigger tool’s reliability to detect the
Goldmann D, Bones K,
Hackbarth A, Resar R,
Griffin FA, Rhoda D,
Murphy C, Landrigan CP.
Performance
characteristics of a
methodology to quantify
adverse events over time
in hospitalized patients.
Health Serv Res.
2011;46(2):654-678.
doi:10.1111/j.1475
6773.2010.01156.x.50

presence, number, and severity of adverse
events (AEs) ranged from Kappa = 0.4 to
0.6. The internal reviewers, external
reviewers, and expert reviewers identified
49, 32, and 74 AEs, respectively. Using the
expert team as a comparison group, the
internal review team had a higher sensitivity
and specificity (49% and 94%, respectively)
than did the external review team (34% and
93%, respectively).
Cross-Sectional Investigators from the Automated Adverse Stockwell DC, Kirkendall
Study Event Detection Collaborative (AAEDC), a
group of academic pediatric organizations
that conduct research on automated
adverse event (AE) detection, compared
data from two academic children’s
hospitals’ use of an automated trigger tool
system.
Records were pulled from September 2007
to October 2010 for Children’s National
Medical Center, and from July 2006 to
October 2010 for Cincinnati Children’s
Hospital Medical Center. Medical records
flagged with triggers by the EHR system
were manually reviewed to determine
whether an AE had occurred, and if it had
occurred, the event’s preventability and
severity.
Triggers associated with opioid and
benzodiazepine toxicity, intravenous
infiltration, hypoglycemia, coagulation
disturbances, and renal dysfunction had
good positive predictive values. Reviewers
identified a total of 3,264 AEs, of which
57.3% were preventable. The automated
system proved to be more accurate than
traditional voluntary reporting, which only
accounted for 492 AEs.
E, Muething SE,
Kloppenborg E, Vinodrao
H, Jacobs BR. Automated
adverse event detection
collaborative: electronic
adverse event
identification,
classification, and
corrective actions across
academic pediatric
institutions. J Patient Saf.
2013;9(4):203-210.
doi:10.1097/PTS.0000000
000000055.46
Cross-Sectional
Study
Investigators developed and tested a
pediatric-specific trigger tool for adverse
drug event (ADE) detection, adapted from
Takata GS, Mason W,
Taketomo C, Logsdon T,
Sharek PJ. Development,
the existing adult Institute for Healthcare
Improvement (IHI) ADE tool.
The study population consisted of patients
selected from 12 freestanding U.S.
children’s hospitals, who were in the
hospital for a minimum of two days and
were discharged, transferred out, or died
between March 18 and May 28, 2002. The
first 30 days of hospitalization from a total
of 960 randomly selected charts (80 per
site) were reviewed.
A total of 2,388 triggers and 107 ADEs
were identified, producing a mean rate of
2.49 triggers per patient and 11.1 ADEs per
100 patients (95% CI 2.39 to 2.59 and 9.13
to 13.5, respectively), 15.7 ADEs per 1,000
patient days (95% CI 12.9 to 19.0), and
1.23 ADEs per 1,000 medication doses
(95% CI 1.01 to 1.49). The positive
predictive value (PPV) of individual triggers
ranged from 0% to 20%, with a PPV of
3.7% for the trigger tool overall. 18 of 107
identified ADEs (16.8%) did not have an
associated trigger. The trigger tool
specifically identified 89 of the total 107
ADEs (83.2%), while hospital occurrence
reports identified 4 ADEs (3.7%). The
trigger tool identified approximately 22
times more ADEs than occurrence reports.
testing, and findings of a
pediatric-focused trigger
tool to identify medication-
related harm in US
children’s hospitals.
Pediatrics.
2008;121(4):e927-935.
doi:10.1542/peds.2007
1779.9
Cross-Sectional Investigators assessed the incidence and Thomas EJ, Studdert DM,
Study type of adverse events (AEs) and negligent
AEs in Utah and Colorado.
The study population consisted of 15,000
randomly selected non-psychiatric patients
who were discharged from 28 hospitals in
Utah and Colorado in 1992. Trained nurse
reviewers screened a total of 14,700
records (4,943 from Utah; 9,757 from
Colorado) for 1 of 18 criteria associated
with AEs. Physicians reviewed records in
which at least one criteria was present. To
Burstin HR, Orav EJ,
Zeena T, Williams EJ,
Howard KM, Weiler PC,
Brennan TA. Incidence
and types of adverse
events and negligent care
in Utah and Colorado.
Med Care.
2000;38(3):261-271.47

test for reliability, 500 records were chosen
for re-review.
AEs were identified in 418 records in
Colorado (21.1% of records reviewed by
both nurses and physicians) and 169
records (20.1% of records reviewed by both
nurses and physicians) in Utah. Operative
AEs comprised 44.9% of the total AEs,
while drugs, especially antibiotics and
cardiovascular agents, were the second
leading cause of AEs (19.3%). The percent
agreement for AEs during the re-review
was 79% (Kappa = 0.4, 95% CI 0.3 to 0.5).
Cross-Sectional Investigators evaluated the feasibility and Unbeck M, Schildmeijer
Study capability of two retrospective chart review
methods (the Harvard Medical Practice
Study [HMPS] and the Institute for
Healthcare Improvement’s [IHI] Global
Trigger Tool [GTT]) to detect adverse
events (AEs) in orthopaedic inpatients.
The study population consisted of a random
sample of 350 adult orthopaedic
admissions in 2009 at a Swedish university
hospital. Two teams, each consisting of a
registered nurse and two physicians, were
assigned to each chart review method.
Primary reviews were conducted by nurses.
Records with suspected AEs were sent to
the physicians, who independently
reviewed the charts
In total, 160 unique AEs were identified in
105 records. The median record review
time was three (range 1 to 35) versus eight
(range 1 to 20) minutes for the HMPS and
GTT methods, respectively. Both tools
demonstrated a learning curve for nurse
reviewers. The positive predictive value for
HMPS criteria and GTT triggers ranged
from 0% to 80% and 0% to 100%,
respectively.
K, Henriksson P,
Jürgensen U, Muren O,
Nilsson L, Pukk
Härenstam K. Is detection
of adverse events
affected by record review
methodology? an
evaluation of the “Harvard
Medical Practice Study”
method and the “Global
Trigger Tool.” Patient Saf
Surg. 2013;7(1):10.
doi:10.1186/1754-9493-7
10.60
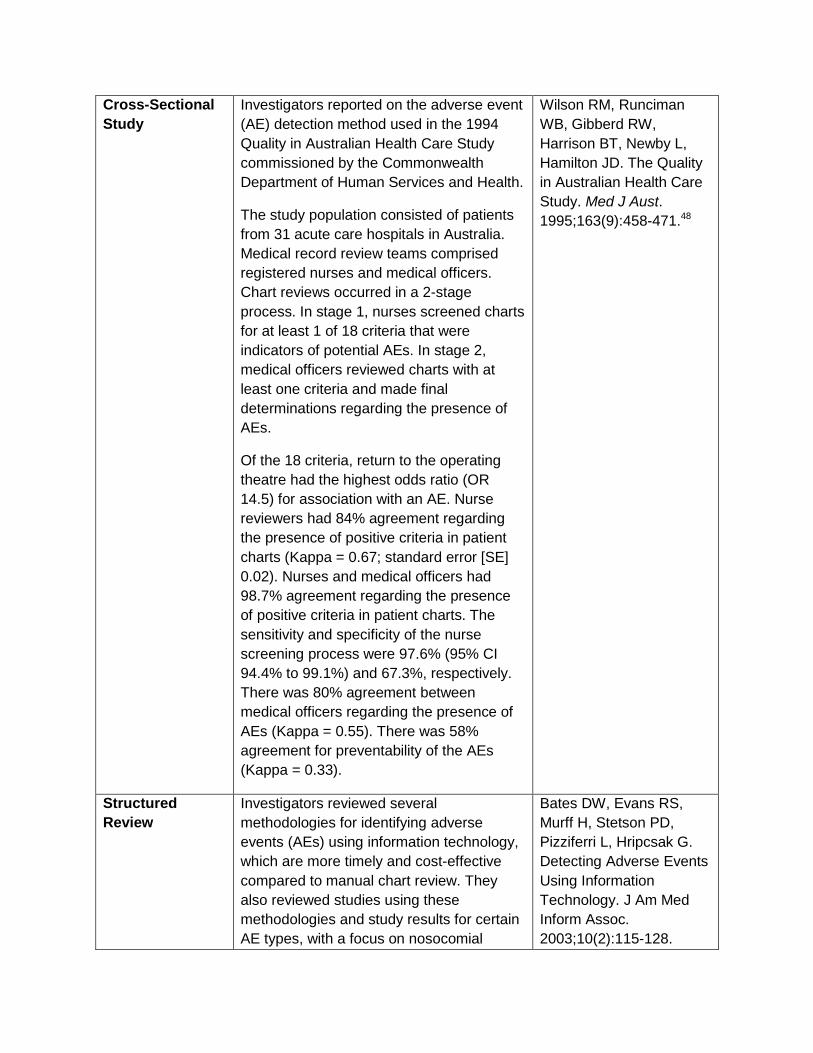
Cross-Sectional Investigators reported on the adverse event Wilson RM, Runciman
Study (AE) detection method used in the 1994
Quality in Australian Health Care Study
commissioned by the Commonwealth
Department of Human Services and Health.
The study population consisted of patients
from 31 acute care hospitals in Australia.
Medical record review teams comprised
registered nurses and medical officers.
Chart reviews occurred in a 2-stage
process. In stage 1, nurses screened charts
for at least 1 of 18 criteria that were
indicators of potential AEs. In stage 2,
medical officers reviewed charts with at
least one criteria and made final
determinations regarding the presence of
AEs.
Of the 18 criteria, return to the operating
theatre had the highest odds ratio (OR
14.5) for association with an AE. Nurse
reviewers had 84% agreement regarding
the presence of positive criteria in patient
charts (Kappa = 0.67; standard error [SE]
0.02). Nurses and medical officers had
98.7% agreement regarding the presence
of positive criteria in patient charts. The
sensitivity and specificity of the nurse
screening process were 97.6% (95% CI
94.4% to 99.1%) and 67.3%, respectively.
There was 80% agreement between
medical officers regarding the presence of
AEs (Kappa = 0.55). There was 58%
agreement for preventability of the AEs
(Kappa = 0.33).
WB, Gibberd RW,
Harrison BT, Newby L,
Hamilton JD. The Quality
in Australian Health Care
Study. Med J Aust.
1995;163(9):458-471.48
Structured Investigators reviewed several Bates DW, Evans RS,
Review methodologies for identifying adverse
events (AEs) using information technology,
which are more timely and cost-effective
compared to manual chart review. They
also reviewed studies using these
methodologies and study results for certain
AE types, with a focus on nosocomial
Murff H, Stetson PD,
Pizziferri L, Hripcsak G.
Detecting Adverse Events
Using Information
Technology. J Am Med
Inform Assoc.
2003;10(2):115-128.
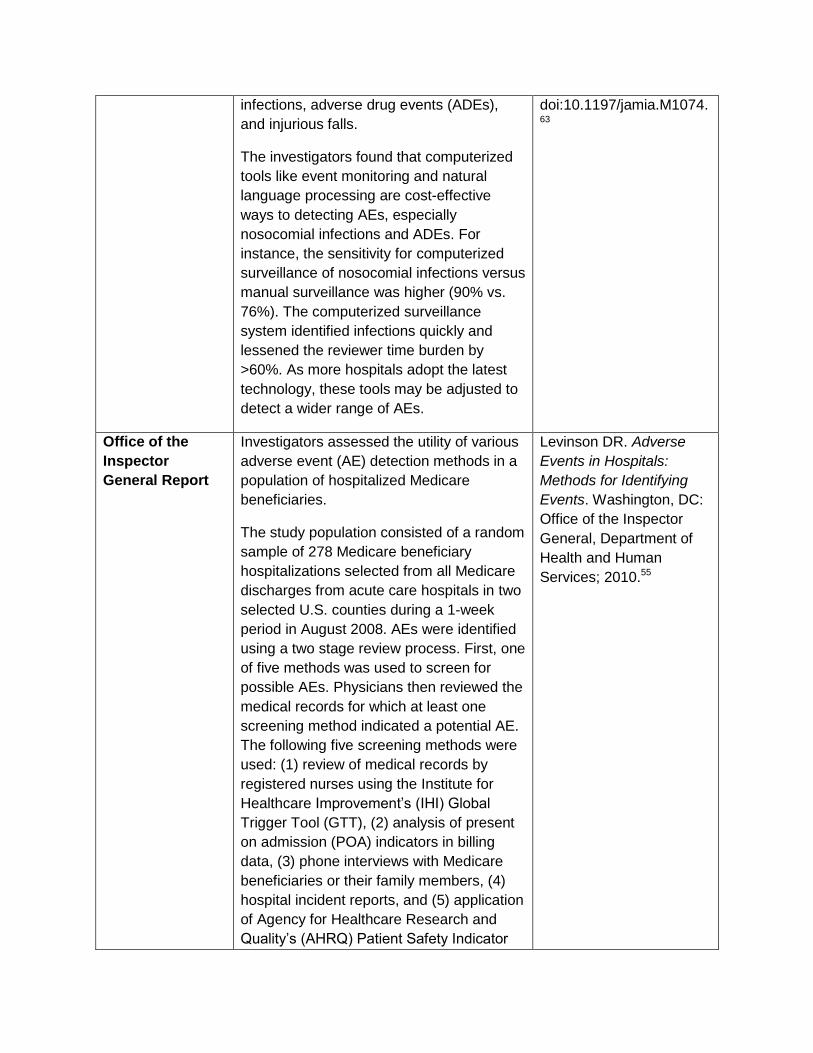
infections, adverse drug events (ADEs),
and injurious falls.
The investigators found that computerized
tools like event monitoring and natural
language processing are cost-effective
ways to detecting AEs, especially
nosocomial infections and ADEs. For
instance, the sensitivity for computerized
surveillance of nosocomial infections versus
manual surveillance was higher (90% vs.
76%). The computerized surveillance
system identified infections quickly and
lessened the reviewer time burden by
>60%. As more hospitals adopt the latest
technology, these tools may be adjusted to
detect a wider range of AEs.
doi:10.1197/jamia.M1074. 63
Office of the Investigators assessed the utility of various Levinson DR. Adverse
Inspector adverse event (AE) detection methods in a Events in Hospitals:
General Report population of hospitalized Medicare
beneficiaries.
The study population consisted of a random
sample of 278 Medicare beneficiary
hospitalizations selected from all Medicare
discharges from acute care hospitals in two
selected U.S. counties during a 1-week
period in August 2008. AEs were identified
using a two stage review process. First, one
of five methods was used to screen for
possible AEs. Physicians then reviewed the
medical records for which at least one
screening method indicated a potential AE.
The following five screening methods were
used: (1) review of medical records by
registered nurses using the Institute for
Healthcare Improvement’s (IHI) Global
Trigger Tool (GTT), (2) analysis of present
on admission (POA) indicators in billing
data, (3) phone interviews with Medicare
beneficiaries or their family members, (4)
hospital incident reports, and (5) application
of Agency for Healthcare Research and
Quality’s (AHRQ) Patient Safety Indicator
Methods for Identifying
Events. Washington, DC:
Office of the Inspector
General, Department of
Health and Human
Services; 2010.55

(PSI) software program to administrative
billing data.
The five screening methods identified 662
flags for potential AEs in total, of which 256
were determined to be associated with
events by physician review. The 256 flags
detected a total of 114 AEs. Nurse reviews
identified 93 of 120 events (78%), POA
analysis identified 61 events (51%),
interviews identified 22 events (18%),
incident reports identified 8 events (7%),
and PSI analysis identified 8 events (7%).
Relationship Between Patient Harm and Other Aspects of Quality
Prospective Investigators examined potential Calder L, Tierney S, Jiang
Study associations between evidence-based care
and the occurrence of adverse events
(AEs) in heart failure and chronic
obstructive pulmonary disease (COPD)
patients.
The study population consisted of patients
>50 years old who were discharged from
five Emergency Departments (EDs)
between September 2007 and April 2010
with a final diagnosis of heart failure or
acute exacerbation of COPD. An expert
panel of experienced staff emergency
physicians created a list of evidence-based
clinical practice guidelines for ED care.
Trained data abstractors analyzed health
records for guideline adherence. AEs were
defined as the following outcomes
associated with the index ED admission:
return to the ED within 14 days with
subsequent discharge, admission, or death.
Trained emergency physicians reviewed
patient case summaries to identify AEs.
Overall, 21.1% of patients returned to the
ED within 14 days. 12 AEs were identified,
all of which were deemed to be
preventable. Heart failure patients who died
were significantly less likely to have
Y, Gagné A, Gee A,
Hobden E, Vaillancourt C,
Perry J, Stiell I, Forster A.
Patient safety analysis of
the ED care of patients
with heart failure and
COPD exacerbations: a
multicenter prospective
cohort study. Am J Emerg
Med. 2014;32(1):29-35.
doi:10.1016/j.ajem.2013.0
9.013.65
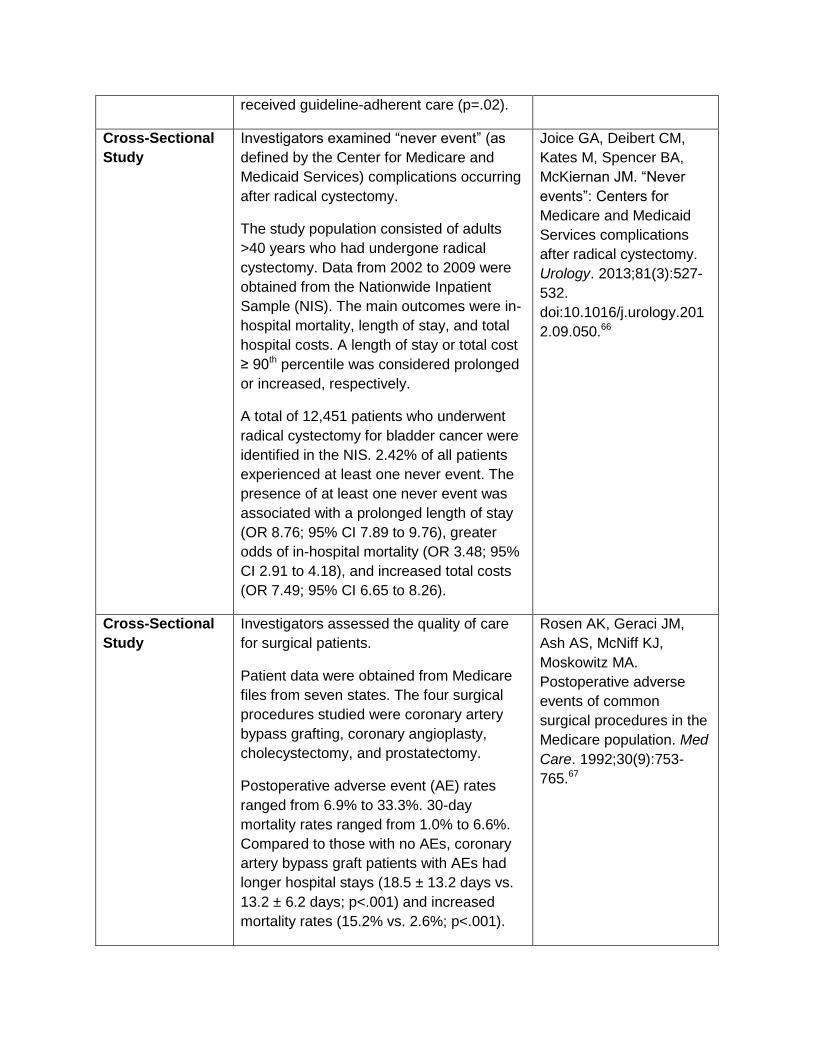
received guideline-adherent care (p=.02).
Cross-Sectional Investigators examined “never event” (as Joice GA, Deibert CM,
Study defined by the Center for Medicare and
Medicaid Services) complications occurring
after radical cystectomy.
The study population consisted of adults
>40 years who had undergone radical
cystectomy. Data from 2002 to 2009 were
obtained from the Nationwide Inpatient
Sample (NIS). The main outcomes were in-
hospital mortality, length of stay, and total
hospital costs. A length of stay or total cost
≥ 90th percentile was considered prolonged
or increased, respectively.
A total of 12,451 patients who underwent
radical cystectomy for bladder cancer were
identified in the NIS. 2.42% of all patients
experienced at least one never event. The
presence of at least one never event was
associated with a prolonged length of stay
(OR 8.76; 95% CI 7.89 to 9.76), greater
odds of in-hospital mortality (OR 3.48; 95%
CI 2.91 to 4.18), and increased total costs
(OR 7.49; 95% CI 6.65 to 8.26).
Kates M, Spencer BA,
McKiernan JM. “Never
events”: Centers for
Medicare and Medicaid
Services complications
after radical cystectomy.
Urology. 2013;81(3):527
532.
doi:10.1016/j.urology.201
2.09.050.66
Cross-Sectional Investigators assessed the quality of care Rosen AK, Geraci JM,
Study for surgical patients.
Patient data were obtained from Medicare
files from seven states. The four surgical
procedures studied were coronary artery
bypass grafting, coronary angioplasty,
cholecystectomy, and prostatectomy.
Postoperative adverse event (AE) rates
ranged from 6.9% to 33.3%. 30-day
mortality rates ranged from 1.0% to 6.6%.
Compared to those with no AEs, coronary
artery bypass graft patients with AEs had
longer hospital stays (18.5 ± 13.2 days vs.
13.2 ± 6.2 days; p<.001) and increased
mortality rates (15.2% vs. 2.6%; p<.001).
Ash AS, McNiff KJ,
Moskowitz MA.
Postoperative adverse
events of common
surgical procedures in the
Medicare population. Med
Care. 1992;30(9):753
765.67
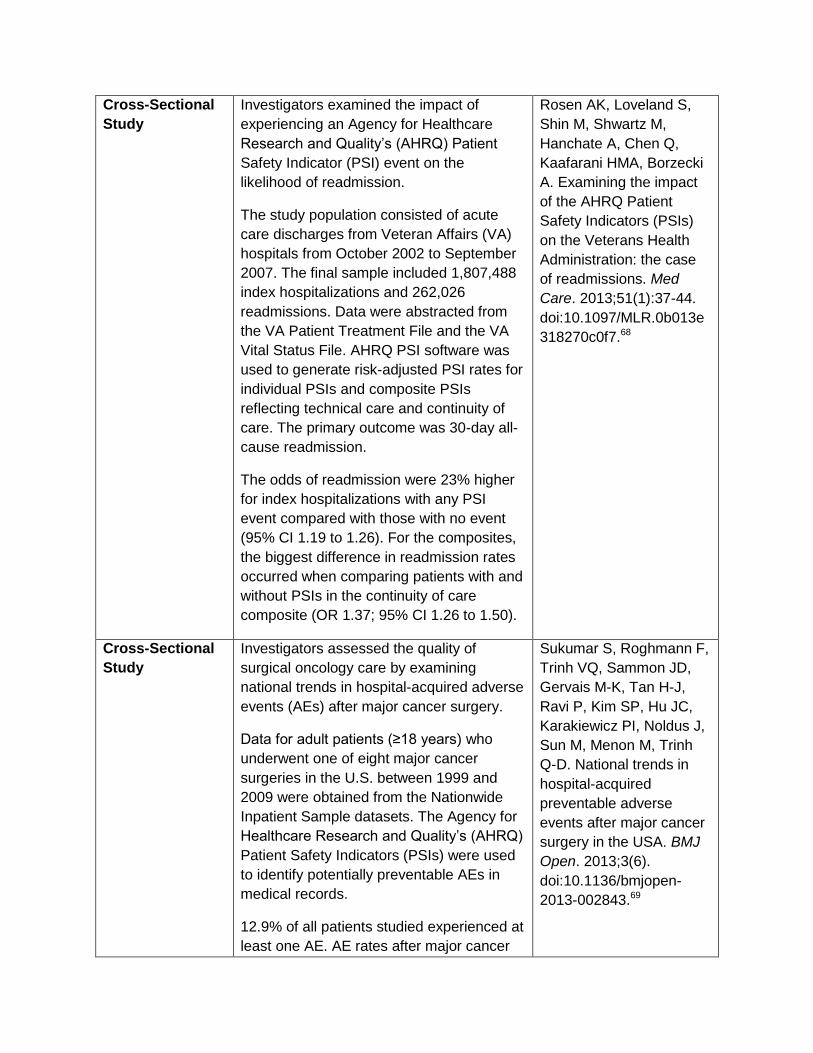
Cross-Sectional Investigators examined the impact of Rosen AK, Loveland S,
Study experiencing an Agency for Healthcare
Research and Quality’s (AHRQ) Patient
Safety Indicator (PSI) event on the
likelihood of readmission.
The study population consisted of acute
care discharges from Veteran Affairs (VA)
hospitals from October 2002 to September
2007. The final sample included 1,807,488
index hospitalizations and 262,026
readmissions. Data were abstracted from
the VA Patient Treatment File and the VA
Vital Status File. AHRQ PSI software was
used to generate risk-adjusted PSI rates for
individual PSIs and composite PSIs
reflecting technical care and continuity of
care. The primary outcome was 30-day all-
cause readmission.
The odds of readmission were 23% higher
for index hospitalizations with any PSI
event compared with those with no event
(95% CI 1.19 to 1.26). For the composites,
the biggest difference in readmission rates
occurred when comparing patients with and
without PSIs in the continuity of care
composite (OR 1.37; 95% CI 1.26 to 1.50).
Shin M, Shwartz M,
Hanchate A, Chen Q,
Kaafarani HMA, Borzecki
A. Examining the impact
of the AHRQ Patient
Safety Indicators (PSIs)
on the Veterans Health
Administration: the case
of readmissions. Med
Care. 2013;51(1):37-44.
doi:10.1097/MLR.0b013e
318270c0f7.68
Cross-Sectional Investigators assessed the quality of Sukumar S, Roghmann F,
Study surgical oncology care by examining
national trends in hospital-acquired adverse
events (AEs) after major cancer surgery.
Data for adult patients (≥18 years) who
underwent one of eight major cancer
surgeries in the U.S. between 1999 and
2009 were obtained from the Nationwide
Inpatient Sample datasets. The Agency for
Healthcare Research and Quality’s (AHRQ)
Patient Safety Indicators (PSIs) were used
to identify potentially preventable AEs in
medical records.
12.9% of all patients studied experienced at
least one AE. AE rates after major cancer
Trinh VQ, Sammon JD,
Gervais M-K, Tan H-J,
Ravi P, Kim SP, Hu JC,
Karakiewicz PI, Noldus J,
Sun M, Menon M, Trinh
Q-D. National trends in
hospital-acquired
preventable adverse
events after major cancer
surgery in the USA. BMJ
Open. 2013;3(6).
doi:10.1136/bmjopen
2013-002843.69
surgery increased over the study period
time frame (estimated annual percentage
change 3.5%; 95% CI 2.8% to 4.1%;
p<.001). Patients with one or more AEs
experienced higher rates of in-hospital
mortality (OR 19.38; 95% CI 18.44 to 20.37;
p<.001), prolonged length of stay (OR 4.43;
95% CI 4.31 to 4.54; p<.001), and
excessive hospital charges (OR 5.21; 95%
CI 5.10 to 5.32; p<.001).
Measuring Patient Safety to Drive Quality Improvement
Prospective Investigators examined the impact of Evans RS, Pestotnik SL,
Study computerized adverse drug event (ADE)
surveillance on the ability to prevent future
ADEs.
Signals for potential ADEs were monitored
using the LDS Hospital information system,
installed in May 1989, which constantly
monitors patients for potential ADEs. In the
first year of computerized surveillance,
physicians were only notified of verified
ADEs that were considered severe or life-
threatening. In the second year of
surveillance, physicians were notified of all
verified ADEs.
In the first year of surveillance, 15% of
identified ADEs were due to allergic or
idiosyncratic reactions. In the second year,
during which physicians received notification
of drug allergies, only 1.4% of ADEs were
due to allergic or idiosyncratic reactions,
indicating a significant reduction (p<0.001).
Timely identification of ADEs allowed
physicians to intervene before the ADE
became severe.
Classen DC, Bass SB,
Burke JP. Prevention of
adverse drug events
through computerized
surveillance. Proc Annu
Symp Comput Appl Sic
Med Care Symp Comput
Appl Med Care.
1992:437-441.70
Prospective Investigators assessed the impact of a Garrett PR Jr, Sammer
Study hospital based patient safety program on
adverse drug event (ADE) rates.
The study population consisted of patients
discharged from Missouri Baptist Medical
C, Nelson A, Paisley KA,
Jones C, Shapiro E,
Tonkel J, Housman M.
Developing and
implementing a
Center, a non-teaching community hospital.
Data were collected from January 2001 to
December 2003 via manual review of
randomly selected charts using a trigger
tool. The patient safety program intervention
included formation of a patient safety
council, hiring of a full-time patient safety
specialist, new event reporting systems, as
well as additional interventions
recommended by the Institute for Safe
Medication Practices, the American Society
of Health System Pharmacists, the Institute
for Healthcare Improvement, the Joint
Commission for the Accreditation of
Healthcare Organizations, and the Agency
for Healthcare Research and Quality. The
transition period (time during which
interventions were instituted) lasted from
July 2001 to March 2002.
Median ADEs per 1000 doses of medication
declined from 2.04 to 0.65 (p<.001) from the
baseline to post-intervention period.
Similarly, median ADEs per 100 patient days
declined from 5.07 to 1.30 (p<.001). There
was a threefold reduction in risk of an ADE
(p<.001) comparing the baseline and post-
intervention period. The incidence of
category F-I harms as defined by the
National Coordinating Council for Medication
Error Reporting and Prevention (NCC
MERP) declined eightfold from the baseline
to post-intervention period (p<.001).
standardized process for
global trigger tool
application across a
large health system. Jt
Comm J Qual Patient Saf
Jt Comm Resour.
2013;39(7):292-297.74
Prospective Investigators measured occurrences of Kaufman J, Rannie M,
Study unplanned extubations in pediatric critical
care units and assessed the impact of
coordinated interdisciplinary interventions on
unplanned extubation rates.
The study population consisted of patients in
the cardiac intensive care unit (CICU) and
pediatric intensive care unit (PICU) at
Children’s Hospital Colorado, a free
standing pediatric academic center. From
Kahn MG, Vitaska M,
Wathen B, Peyton C,
Judd J, Quinby Z, da
Cruz EM, Dobyns E. An
interdisciplinary initiative
to reduce unplanned
extubations in pediatric
critical care units.
Pediatrics.
2012;129(6):e1594-1600.

January 2009 to December 2010, all
incidences of unplanned extubations were
documented by respiratory therapists and
bedside nurses via electronic medical
record.
Interventions were implemented from
October 2009 to May 2010. Interventions
included: (1) standardized re-taping of
endotracheal tubes for all patients admitted
to the ICU; (2) standardized handoffs from
the cardiovascular operating room to the
CICU; (3) root-cause analysis of all
unplanned extubations; (4) re-examination of
sedation practices; and (5) public displaying
of days since the last adverse event.
The PICU had 21 events in the nine-month
pre-intervention period, 14 events in the
eight-month intervention period, and 5
events in the seven-month post-intervention
period. The CICU experienced 11, 4, and 0
events in the pre-intervention, intervention,
and post-intervention periods, respectively.
Mean unplanned extubation rates per 100
patient days for each interval were 0.8, 0.5,
and 0.29 for the PICU, and 0.74, 0.44, and 0
for the CICU.
doi:10.1542/peds.2011
2642.71
Prospective Investigators examined the effect of an Piontek F, Kohli R,
Study adverse drug event (ADE) alert system on
cost and quality outcomes in community
hospitals.
The intervention involved implementation of
an ADE alert system that is triggered in real
time, allowing for immediate pharmacy
intervention. The intervention study
population consisted of medical and surgical
patients admitted to one of seven Trinity
Health hospitals. Patients admitted to these
hospitals prior to the intervention served as
an internal control group. Another set of
hospitals without an ADE alert system
served as the external control group.
Conlon P, Ellis JJ,
Jablonski J, Kini N.
Effects of an adverse-
drug-event alert system
on cost and quality
outcomes in community
hospitals. Am J Health-
Syst Pharm AJHP Off J
Am Soc Health-Syst
Pharm. 2010;67(8):613
620.
doi:10.2146/ajhp090056. 72

Primary outcomes included pharmacy
department costs, variable drug costs, and
mortality rates. Secondary outcomes
included total hospitalization costs, length of
stay, readmission rate, and case-mix index.
Mean pharmacy department costs and drug
costs decreased significantly from pre
implementation to post-implementation
(p<.001), while these costs increased
significantly in the external control group
(p=.029). Statistically significant decreases
in severity adjusted mortality and length of
stay were only seen in the study group
(p<0.001).
Cross-Sectional Investigators developed a centralized Cohen MM, Kimmel NL,
Study Institute for Healthcare Improvement’s (IHI)
Global Trigger Tool (GTT) process to
generate uniform estimates of the number,
type, and severity of adverse events (AEs)
across a large health system.
The study population consisted of adult
patients (≥18 years) with a hospital stay >24
hours from 25 hospitals in the Adventist
Health System (AHS) that used common
electronic medical records. Investigators
used a centralized web-based data
collection system, which randomized patient
charts from each hospital and selected
charts for manual review using the IHI GTT.
AHS sent quarterly reports and case studies
of the worst harms to each participating
hospital. Recipients of case studies were
encouraged to identify opportunities for
quality improvement. A total of 17,295 charts
were reviewed between January 2009 and
December 2011.
Use of the GTT revealed a mean of 98 AEs
per 1,000 patient days in the last six months
of 2009 compared with a mean of 67 AEs in
the last six months of 2011. System wide
reduction in AEs rates were attributed to
Benage MK, Cox MJ,
Sanders N, Spence D,
Chen J. Medication
safety program reduces
adverse drug events in a
community hospital. Qual
Saf Health Care.
2005;14(3):169-174.
doi:10.1136/qshc.2004.0
10942.73

safety improvement projects instituted by
AHS.
Cross-Sectional The investigators applied the Agency for Miller MR, Zhan C.
Study Healthcare Research and Quality’s (AHRQ)
Patient Safety Indicators (PSI) to hospital
discharge data and examined prevalence of
PSI events.
They found that 16 of the 20 PSIs examined
had rates of >100 pediatric cases per 10,000
pediatric discharges across the nation in
2000. PSIs also led to significant increases
in length of stay, costs, charges, and in-
hospital death. Furthermore, they discovered
that PSI events happened more often
among the very young (<1 year) and those
on Medicaid insurance. Finally, the authors
estimated that the events cost >$1 billion in
extra charges for children in 2000.
Pediatric Patient Safety
in Hospitals: A National
Picture in 2000.
Pediatrics.
2004;113(6):1741
1746.24
Institute of The IOM identified patient safety as an area Kohn LT, Corrigan JM,
Medicine Report of national priority for quality improvement of
the U.S. healthcare system. The IOM
recommendations for improving patient
safety comprise a four-tiered approach,
which include (1) establishing a national
focus to create leadership, research, tools
and protocols to enhance the knowledge
base about safety, (2) identifying and
learning from errors through immediate and
strong mandatory reporting efforts, as well
as the encouragement of voluntary efforts,
(3) raising standards and expectations for
improvements in safety through the actions
of oversight organizations, group
purchasers, and professional groups, and
(4) creating safety systems inside health
care organizations through the
implementation of safe practices at the
delivery level. This level is the ultimate target
of all the recommendations.
Donaldson MS. To Err Is
Human: Building a Safer
Health System.
Washington, DC:
Institute of Medicine
Committee on the Quality
of Health Care in
America;1999.2