table 3: total rainfall statistics over all months and
TRANSCRIPT

41
Table 3: Total rainfall statistics over all months and years for all stations
Address Statistic 1639 Caoura Rd 1582 Caoura Rd 1095 Caoura
Rd 593 Caoura Rd Kettles Lane Tallong Village 1183 Highland
Way 957 Highland
Way
Name Charles Onslow Black Darda Kettle BOM Woods Leese
Monthly Mean 79.6 62.7 64.5 59.7 57.4 59.9 63.4 61.3
Median 52.5 43.7 47.9 45.5 41.6 45.6 49.8 45.5
Maximum 595.6 479.0 305.2 260.1 261.5 470.6 308.0 254.5
Max Date May 1943 March 1995 June 2013 June 2007 June 2007 May 1925 June 2007 June 2007
Decile 1 10.9 8.5 14.07 15.8 14.0 9.6 16.5 17.0
Decile 9 177.5 129.8 130.3 128.5 110.5 124.7 123.0 139.6
Annual Mean 965.2 863.2 774.1 691.1 688.6 719.3 760.9 735.4
Median 910.6 834.1 748.8 663.6 654.8 668.0 735.5 699.0
Maximum 2028.2 1609.1 998.7 983.3 951.5 1187.6 1097.0 1046.5
Max Year 1950 1978 2013 2007 2007 1900 2007 2007
Database
1919 to 1991 1991 to 2009 2004 to 2013 1999 to 2013 1992 to 2013 1895 to 1936 2002 to 2013 2001 to 2013

42
Table 3 continued: Total rainfall statistics over all months and years for all stations
Address Statistic 432 Longpoint
Rd 66 Railway
Parade 100 Mulwaree
Dr 467 Mulwaree
Dr BOM_Caoura
Rd Boral_ Wingello
Name Montgomery Botticchio Eyers Clark
South Marulan
Monthly Mean 62.2 64.7 63.9 60.8 77.6 58.1 77.4
Median 47.1 51.0 49.5 45.9 52.0 44.8 62.5
Maximum 403.6 271.5 263.0 268.7 567.4 228.5 320.0
Max Date March 1978 June 2013 June 2007 June 2007 February 1960 June 2013 February 2013
Decile 1 13.4 15.1 16.0 20.6 9.0 19.6 20.5
Decile 9 142.6 131.7 116.9 128.3 168.9 108.5 144.5
Annual Mean 740.1 776.6 696.7 729.5 931.0 726.7 929.3
Median 734.1 712.8 693.0 728.0 851.0 739.3 864.0
Maximum 1372.1 1064.3 911.0 943.3 1734.9 917.0 1087.0
Max Year 1974 2007 2007 2007 1950 2010 2013
Database
1966 to 2013 1998 to 2013 2003 to 2011 2006 to 2013 1919 to 1974 2008-2013 2011-2013

43
Table 4: Monthly rainfall statistics over all years for all stations
Month Observation Jan Feb Mar Apr May June July August Sept Oct Nov Dec
Station Name Duration
Statistic Mean
Charles 1919 to 1991 95.2 105.4 96.2 83.9 85.2 92.5 58.2 52.9 55.5 78.3 72.4 79.9
Onslow 1991 to 2009 76.8 107.7 81.7 32.4 42.6 79.2 36.6 48.9 59.2 54.0 74.6 61.0
Black 2004 to 2013 72.6 115.0 64.5 58.2 29.6 107.2 30.6 28.5 39.1 57.8 88.9 82.2
Darda 1999 to 2013 59.3 111.9 70.1 35.8 27.9 75.4 36.0 36.6 43.3 59.1 76.8 82.1
Kettle 1992 to 2013 61.1 104.5 61.1 40.0 37.2 69.7 39.0 37.4 38.8 53.4 73.7 72.6 Tallong Village - BOM 1895 to 1936 67.7 60.5 70.5 53.7 62.4 64.1 70.7 44.5 46.8 52.3 46.9 70.7
Eyers 2003 to 2011 58.9 107.3 50.7 30.0 41.3 73.1 34.0 31.0 41.1 60.2 85.9 83.1
Clark 2006 to 2013 59.4 132.5 66.4 39.1 35.7 103.4 34.6 30.5 37.5 43.6 68.9 78.0
Botticchio 1998 to 2013 64.1 130.5 79.4 43.6 32.3 79.6 44.6 36.3 43.7 67.1 79.8 81.8
Leese 2001 to 2013 59.9 125.0 77.5 37.2 33.5 72.2 37.6 31.1 40.5 62.4 79.3 79.3
Woods 2002 to 2013 70.3 146.4 69.6 37.5 36.9 84.5 36.0 34.7 42.8 48.3 82.5 71.5
Montgomery 1966 to 2013 74.4 84.6 72.0 59.0 54.1 64.1 40.0 51.0 46.2 60.4 73.3 60.5
South Marulan 2008 to 2013 66.6 132.3 72.3 45.4 38.3 72.8 26.1 32.7 38.6 55.2 58.5 88.0
Wingello 2011 to 2013 65.3 251.0 85.7 63.3 48.7 158.0 27.3 27.3 47.0 44.0 73.0 38.7
Statistic Median
Charles 1919 to 1991 86.7 80.8 68.6 65.3 45.5 48.0 34.0 31.5 40.6 54.9 56.4 61.5
Onslow 1991 to 2009 81.5 109.8 58.5 23.0 21.3 41.5 27.5 27.0 52.0 37.5 70.8 53.0
Black 2004 to 2013 77.4 108.2 50.8 40.4 21.9 73.6 29.2 21.8 42.9 58.2 58.2 77.3
Darda 1999 to 2013 56.8 99.7 55.0 32.9 22.5 45.8 27.8 33.6 39.6 45.8 65.8 63.0
Kettle 1992 to 2013 65.0 93.0 50.5 30.0 28.0 51.0 29.5 30.0 39.0 41.3 70.0 62.5 Tallong Village - BOM 1895 to 1936 50.6 38.8 47.8 49.6 34.1 48.7 43.3 28.9 39.5 40.1 46.4 70.3
44
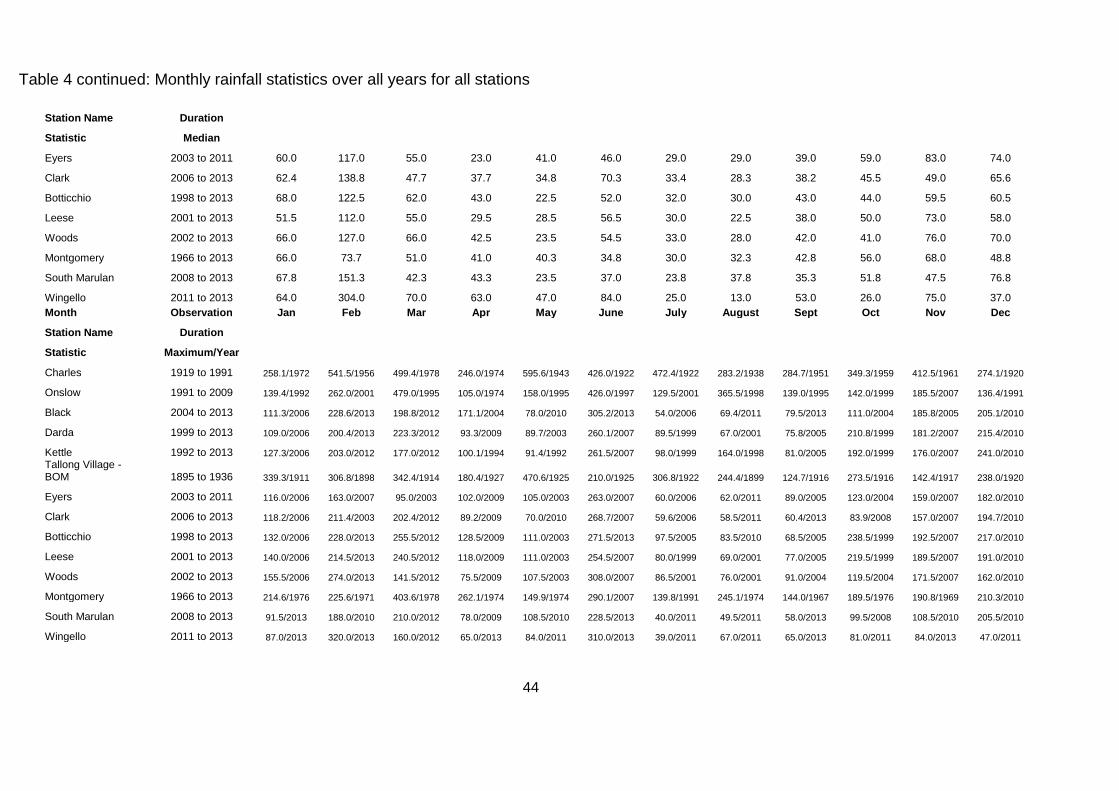
Table 4 continued: Monthly rainfall statistics over all years for all stations
Station Name Duration
Statistic Median
Eyers 2003 to 2011 60.0 117.0 55.0 23.0 41.0 46.0 29.0 29.0 39.0 59.0 83.0 74.0
Clark 2006 to 2013 62.4 138.8 47.7 37.7 34.8 70.3 33.4 28.3 38.2 45.5 49.0 65.6
Botticchio 1998 to 2013 68.0 122.5 62.0 43.0 22.5 52.0 32.0 30.0 43.0 44.0 59.5 60.5
Leese 2001 to 2013 51.5 112.0 55.0 29.5 28.5 56.5 30.0 22.5 38.0 50.0 73.0 58.0
Woods 2002 to 2013 66.0 127.0 66.0 42.5 23.5 54.5 33.0 28.0 42.0 41.0 76.0 70.0
Montgomery 1966 to 2013 66.0 73.7 51.0 41.0 40.3 34.8 30.0 32.3 42.8 56.0 68.0 48.8
South Marulan 2008 to 2013 67.8 151.3 42.3 43.3 23.5 37.0 23.8 37.8 35.3 51.8 47.5 76.8
Wingello 2011 to 2013 64.0 304.0 70.0 63.0 47.0 84.0 25.0 13.0 53.0 26.0 75.0 37.0
Month Observation Jan Feb Mar Apr May June July August Sept Oct Nov Dec
Station Name Duration
Statistic Maximum/Year
Charles 1919 to 1991 258.1/1972 541.5/1956 499.4/1978 246.0/1974 595.6/1943 426.0/1922 472.4/1922 283.2/1938 284.7/1951 349.3/1959 412.5/1961 274.1/1920
Onslow 1991 to 2009 139.4/1992 262.0/2001 479.0/1995 105.0/1974 158.0/1995 426.0/1997 129.5/2001 365.5/1998 139.0/1995 142.0/1999 185.5/2007 136.4/1991
Black 2004 to 2013 111.3/2006 228.6/2013 198.8/2012 171.1/2004 78.0/2010 305.2/2013 54.0/2006 69.4/2011 79.5/2013 111.0/2004 185.8/2005 205.1/2010
Darda 1999 to 2013 109.0/2006 200.4/2013 223.3/2012 93.3/2009 89.7/2003 260.1/2007 89.5/1999 67.0/2001 75.8/2005 210.8/1999 181.2/2007 215.4/2010
Kettle 1992 to 2013 127.3/2006 203.0/2012 177.0/2012 100.1/1994 91.4/1992 261.5/2007 98.0/1999 164.0/1998 81.0/2005 192.0/1999 176.0/2007 241.0/2010
Tallong Village - BOM 1895 to 1936 339.3/1911 306.8/1898 342.4/1914 180.4/1927 470.6/1925 210.0/1925 306.8/1922 244.4/1899 124.7/1916 273.5/1916 142.4/1917 238.0/1920
Eyers 2003 to 2011 116.0/2006 163.0/2007 95.0/2003 102.0/2009 105.0/2003 263.0/2007 60.0/2006 62.0/2011 89.0/2005 123.0/2004 159.0/2007 182.0/2010
Clark 2006 to 2013 118.2/2006 211.4/2003 202.4/2012 89.2/2009 70.0/2010 268.7/2007 59.6/2006 58.5/2011 60.4/2013 83.9/2008 157.0/2007 194.7/2010
Botticchio 1998 to 2013 132.0/2006 228.0/2013 255.5/2012 128.5/2009 111.0/2003 271.5/2013 97.5/2005 83.5/2010 68.5/2005 238.5/1999 192.5/2007 217.0/2010
Leese 2001 to 2013 140.0/2006 214.5/2013 240.5/2012 118.0/2009 111.0/2003 254.5/2007 80.0/1999 69.0/2001 77.0/2005 219.5/1999 189.5/2007 191.0/2010
Woods 2002 to 2013 155.5/2006 274.0/2013 141.5/2012 75.5/2009 107.5/2003 308.0/2007 86.5/2001 76.0/2001 91.0/2004 119.5/2004 171.5/2007 162.0/2010
Montgomery 1966 to 2013 214.6/1976 225.6/1971 403.6/1978 262.1/1974 149.9/1974 290.1/2007 139.8/1991 245.1/1974 144.0/1967 189.5/1976 190.8/1969 210.3/2010
South Marulan 2008 to 2013 91.5/2013 188.0/2010 210.0/2012 78.0/2009 108.5/2010 228.5/2013 40.0/2011 49.5/2011 58.0/2013 99.5/2008 108.5/2010 205.5/2010
Wingello 2011 to 2013 87.0/2013 320.0/2013 160.0/2012 65.0/2013 84.0/2011 310.0/2013 39.0/2011 67.0/2011 65.0/2013 81.0/2011 84.0/2013 47.0/2011

45
Table 5: The frequency if occurrence of rainfall rates (mm/hr) in the Tallong region
Date
Station Start End Rainfall Rates (mm/hr) Number
0.0-0.5 0.5-1.0 1.0-1.5 1.5-2.0 2.0-3.0 3.0-4.0 4.0-5.0 5.0-6.0 > 6. of Observations
Peppertree Quarry 230212 170414 47.46 16.82 8.72 7.06 8.52 4.47 1.56 1.77 3.63 963 Boral South Marulan 010108 030414 52.12 15.93 9.30 6.06 5.99 3.84 1.95 1.36 3.44 3020
Mulwaree Drive 121211 130414 56.86 16.90 5.81 5.75 6.29 2.64 1.68 1.80 2.28 1669
Table 6: Statistics on the high rainfall rates (> 6 mm/hr)
Rainfall rates (mm/hr)
Station
Statistic Peppertree
Quarry Boral South Marulan Mulwaree
Drive
Average 9.5 10.6 9.4
Median 8.0 9.3 7.2
Decile 1 7.0 6.5 6.6
Decile 9 13.8 16.5 12.6
Maximum 24.0 34.5 35.0
46
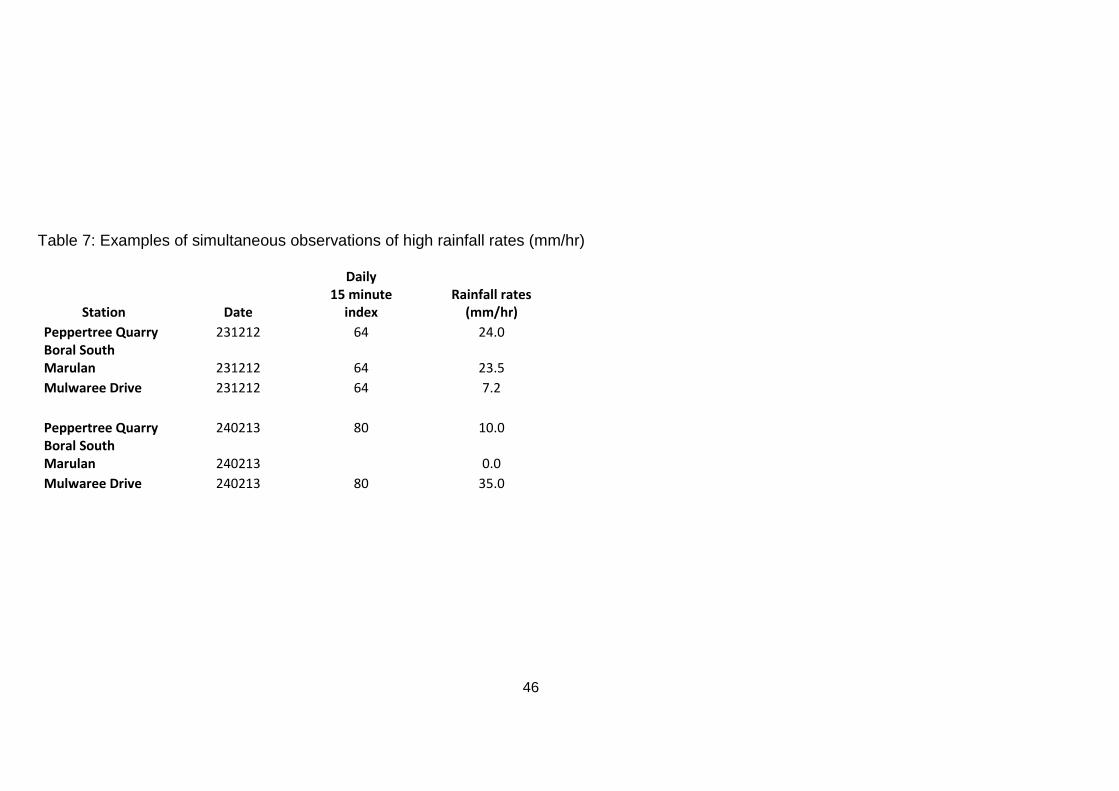
Table 7: Examples of simultaneous observations of high rainfall rates (mm/hr)
Daily
Station Date
15 minute index
Rainfall rates (mm/hr)
Peppertree Quarry 231212 64 24.0 Boral South Marulan 231212 64 23.5
Mulwaree Drive 231212 64 7.2
Peppertree Quarry 240213 80 10.0 Boral South Marulan 240213
0.0
Mulwaree Drive 240213 80 35.0
47
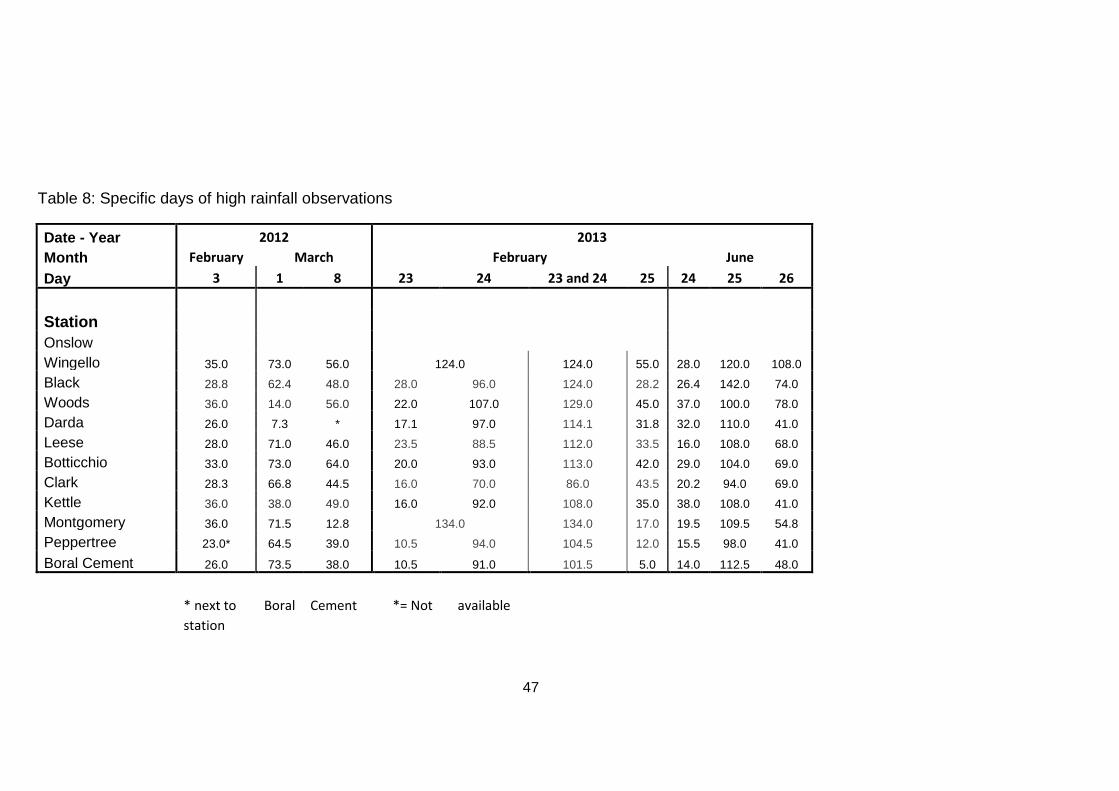
Table 8: Specific days of high rainfall observations
Date - Year 2012 2013
Month February March February June
Day 3 1 8 23 24 23 and 24 25 24 25 26
Station
Onslow
Wingello 35.0 73.0 56.0 124.0 124.0 55.0 28.0 120.0 108.0
Black 28.8 62.4 48.0 28.0 96.0 124.0 28.2 26.4 142.0 74.0
Woods 36.0 14.0 56.0 22.0 107.0 129.0 45.0 37.0 100.0 78.0
Darda 26.0 7.3 * 17.1 97.0 114.1 31.8 32.0 110.0 41.0
Leese 28.0 71.0 46.0 23.5 88.5 112.0 33.5 16.0 108.0 68.0
Botticchio 33.0 73.0 64.0 20.0 93.0 113.0 42.0 29.0 104.0 69.0
Clark 28.3 66.8 44.5 16.0 70.0 86.0 43.5 20.2 94.0 69.0
Kettle 36.0 38.0 49.0 16.0 92.0 108.0 35.0 38.0 108.0 41.0
Montgomery 36.0 71.5 12.8 134.0 134.0 17.0 19.5 109.5 54.8
Peppertree 23.0* 64.5 39.0 10.5 94.0 104.5 12.0 15.5 98.0 41.0
Boral Cement 26.0 73.5 38.0 10.5 91.0 101.5 5.0 14.0 112.5 48.0
* next to Boral Cement *= Not available
station
48
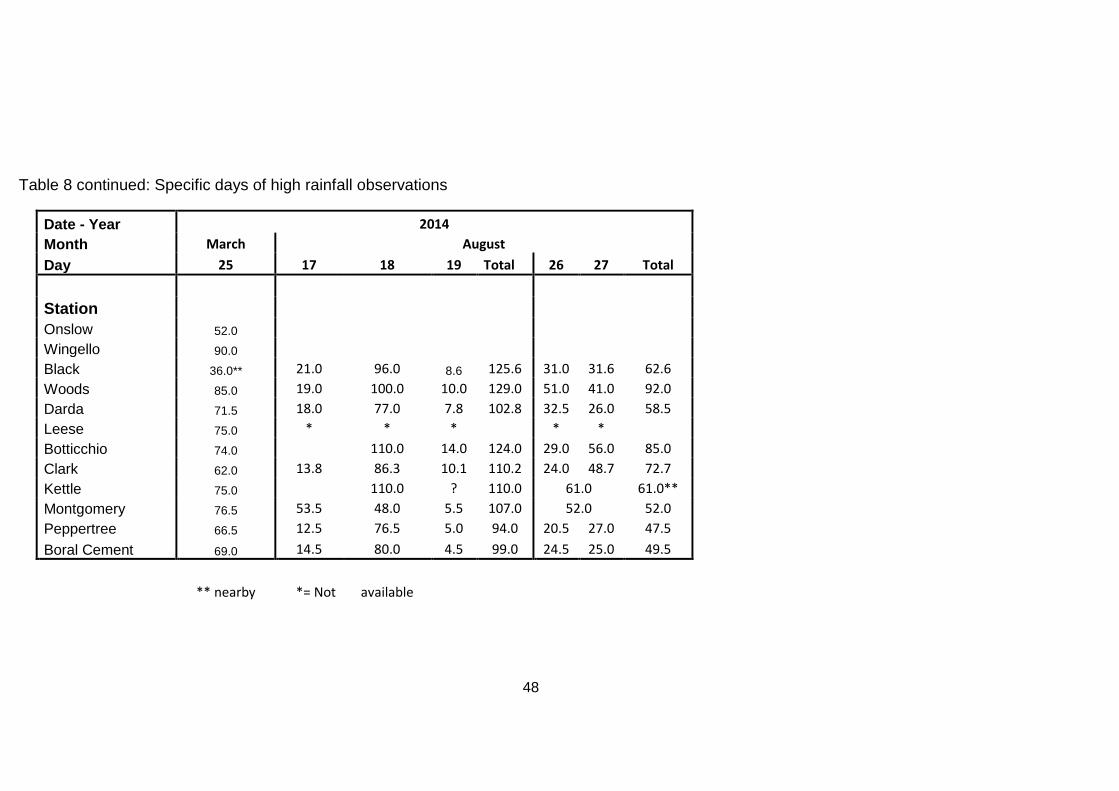
Table 8 continued: Specific days of high rainfall observations
Date - Year 2014
Month March August
Day 25 17 18 19 Total 26 27 Total
Station
Onslow 52.0
Wingello 90.0
Black 36.0** 21.0 96.0 8.6 125.6 31.0 31.6 62.6
Woods 85.0 19.0 100.0 10.0 129.0 51.0 41.0 92.0
Darda 71.5 18.0 77.0 7.8 102.8 32.5 26.0 58.5
Leese 75.0 * * * * *
Botticchio 74.0 110.0 14.0 124.0 29.0 56.0 85.0
Clark 62.0 13.8 86.3 10.1 110.2 24.0 48.7 72.7
Kettle 75.0
110.0 ? 110.0 61.0 61.0**
Montgomery 76.5 53.5 48.0 5.5 107.0 52.0 52.0
Peppertree 66.5 12.5 76.5 5.0 94.0 20.5 27.0 47.5
Boral Cement 69.0 14.5 80.0 4.5 99.0 24.5 25.0 49.5
** nearby *= Not available
49
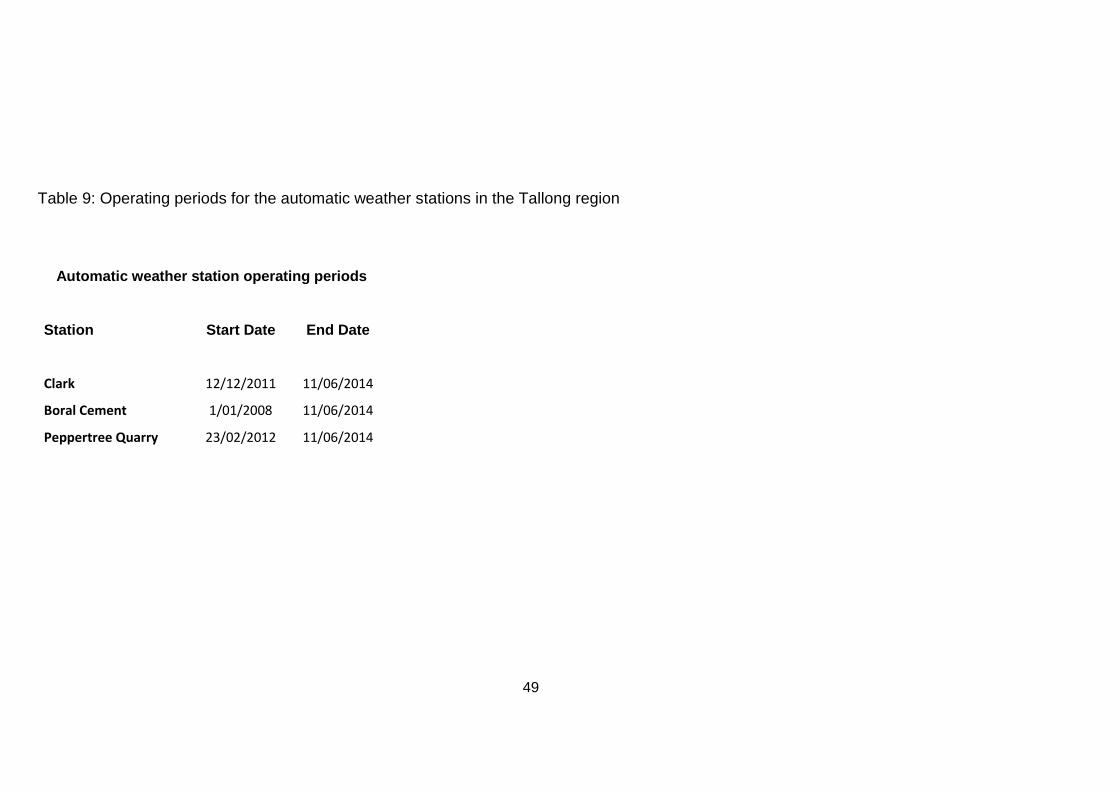
Table 9: Operating periods for the automatic weather stations in the Tallong region
Automatic weather station operating periods
Station Start Date End Date
Clark 12/12/2011 11/06/2014
Boral Cement 1/01/2008 11/06/2014
Peppertree Quarry 23/02/2012 11/06/2014
50
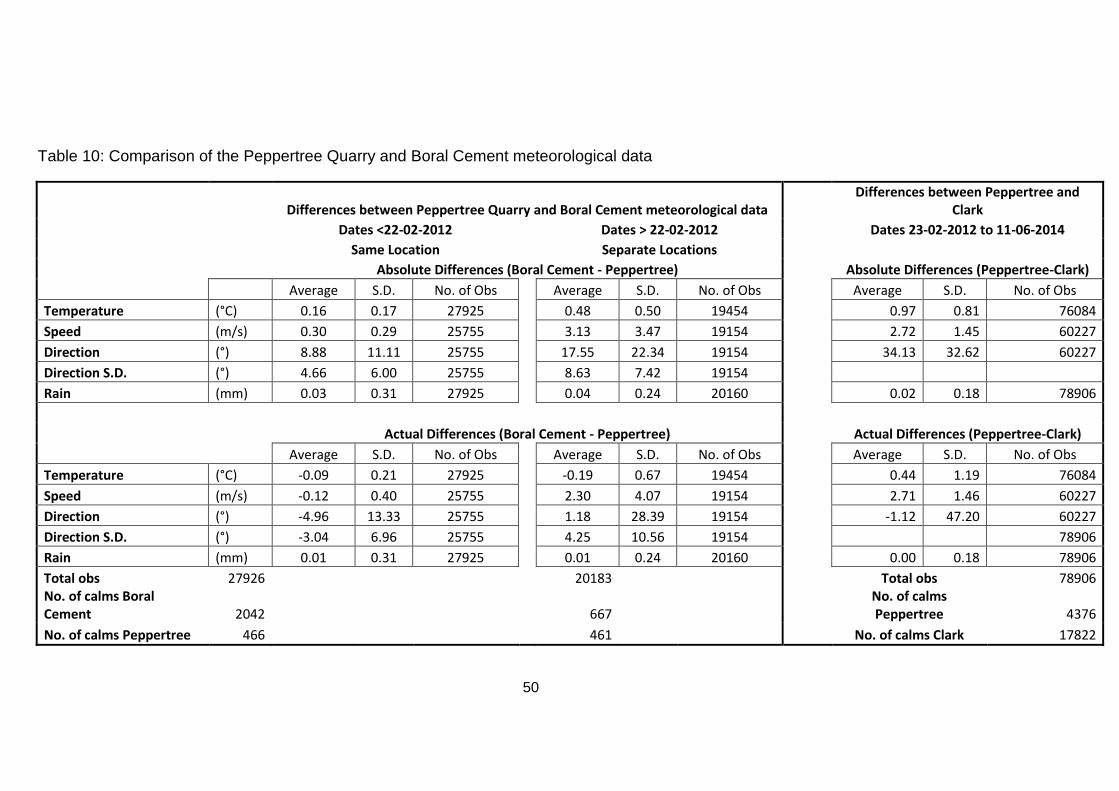
Table 10: Comparison of the Peppertree Quarry and Boral Cement meteorological data
Differences between Peppertree Quarry and Boral Cement meteorological data Differences between Peppertree and
Clark
Dates <22-02-2012
Dates > 22-02-2012 Dates 23-02-2012 to 11-06-2014
Same Location
Separate Locations
Absolute Differences (Boral Cement - Peppertree) Absolute Differences (Peppertree-Clark)
Average S.D. No. of Obs
Average S.D. No. of Obs Average S.D. No. of Obs
Temperature (°C) 0.16 0.17 27925
0.48 0.50 19454 0.97 0.81 76084
Speed (m/s) 0.30 0.29 25755
3.13 3.47 19154 2.72 1.45 60227
Direction (°) 8.88 11.11 25755
17.55 22.34 19154 34.13 32.62 60227
Direction S.D. (°) 4.66 6.00 25755
8.63 7.42 19154
Rain (mm) 0.03 0.31 27925
0.04 0.24 20160 0.02 0.18 78906
Actual Differences (Boral Cement - Peppertree) Actual Differences (Peppertree-Clark)
Average S.D. No. of Obs
Average S.D. No. of Obs Average S.D. No. of Obs
Temperature (°C) -0.09 0.21 27925
-0.19 0.67 19454 0.44 1.19 76084
Speed (m/s) -0.12 0.40 25755
2.30 4.07 19154 2.71 1.46 60227
Direction (°) -4.96 13.33 25755
1.18 28.39 19154 -1.12 47.20 60227
Direction S.D. (°) -3.04 6.96 25755
4.25 10.56 19154 78906
Rain (mm) 0.01 0.31 27925
0.01 0.24 20160 0.00 0.18 78906
Total obs 27926
20183
Total obs 78906 No. of calms Boral Cement 2042
667
No. of calms Peppertree 4376
No. of calms Peppertree 466 461 No. of calms Clark 17822
51
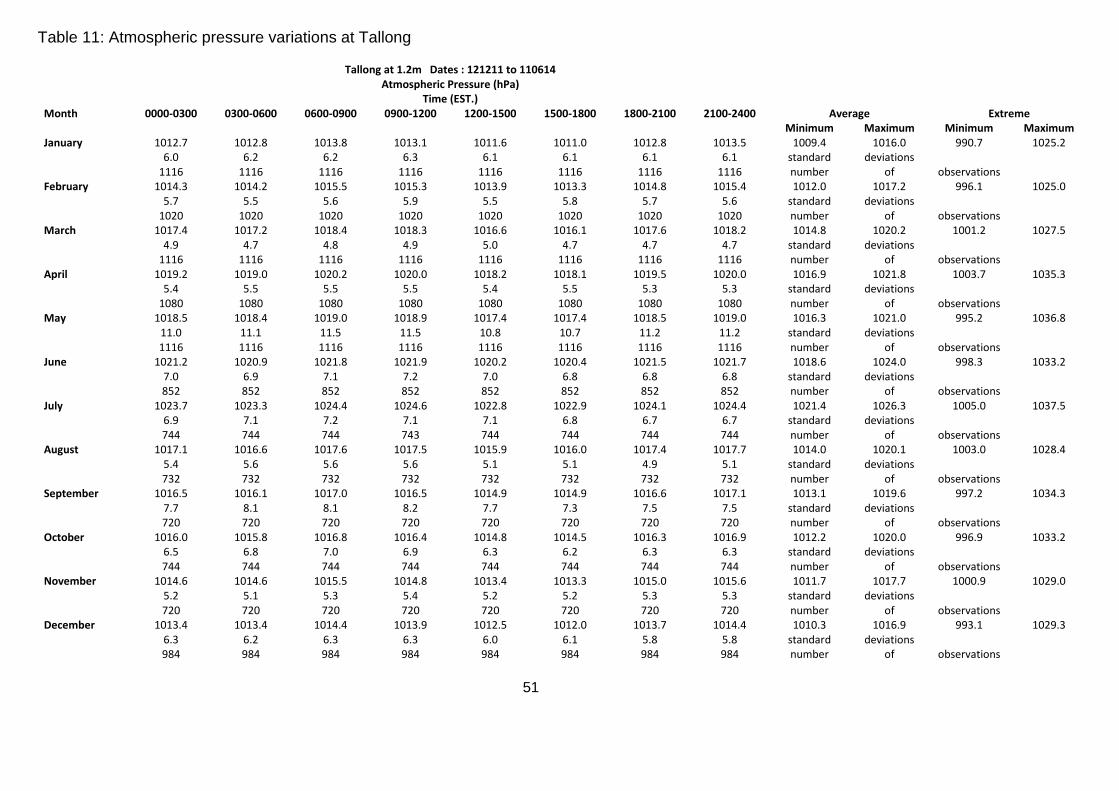
Table 11: Atmospheric pressure variations at Tallong
Tallong at 1.2m Dates : 121211 to 110614
Atmospheric Pressure (hPa)
Time (EST.)
Month 0000-0300 0300-0600 0600-0900 0900-1200 1200-1500 1500-1800 1800-2100 2100-2400 Average Extreme
Minimum Maximum Minimum Maximum
January 1012.7 1012.8 1013.8 1013.1 1011.6 1011.0 1012.8 1013.5 1009.4 1016.0 990.7 1025.2
6.0 6.2 6.2 6.3 6.1 6.1 6.1 6.1 standard deviations
1116 1116 1116 1116 1116 1116 1116 1116 number of observations February 1014.3 1014.2 1015.5 1015.3 1013.9 1013.3 1014.8 1015.4 1012.0 1017.2 996.1 1025.0
5.7 5.5 5.6 5.9 5.5 5.8 5.7 5.6 standard deviations
1020 1020 1020 1020 1020 1020 1020 1020 number of observations March 1017.4 1017.2 1018.4 1018.3 1016.6 1016.1 1017.6 1018.2 1014.8 1020.2 1001.2 1027.5
4.9 4.7 4.8 4.9 5.0 4.7 4.7 4.7 standard deviations
1116 1116 1116 1116 1116 1116 1116 1116 number of observations April 1019.2 1019.0 1020.2 1020.0 1018.2 1018.1 1019.5 1020.0 1016.9 1021.8 1003.7 1035.3
5.4 5.5 5.5 5.5 5.4 5.5 5.3 5.3 standard deviations
1080 1080 1080 1080 1080 1080 1080 1080 number of observations May 1018.5 1018.4 1019.0 1018.9 1017.4 1017.4 1018.5 1019.0 1016.3 1021.0 995.2 1036.8
11.0 11.1 11.5 11.5 10.8 10.7 11.2 11.2 standard deviations
1116 1116 1116 1116 1116 1116 1116 1116 number of observations June 1021.2 1020.9 1021.8 1021.9 1020.2 1020.4 1021.5 1021.7 1018.6 1024.0 998.3 1033.2
7.0 6.9 7.1 7.2 7.0 6.8 6.8 6.8 standard deviations
852 852 852 852 852 852 852 852 number of observations July 1023.7 1023.3 1024.4 1024.6 1022.8 1022.9 1024.1 1024.4 1021.4 1026.3 1005.0 1037.5
6.9 7.1 7.2 7.1 7.1 6.8 6.7 6.7 standard deviations
744 744 744 743 744 744 744 744 number of observations August 1017.1 1016.6 1017.6 1017.5 1015.9 1016.0 1017.4 1017.7 1014.0 1020.1 1003.0 1028.4
5.4 5.6 5.6 5.6 5.1 5.1 4.9 5.1 standard deviations
732 732 732 732 732 732 732 732 number of observations September 1016.5 1016.1 1017.0 1016.5 1014.9 1014.9 1016.6 1017.1 1013.1 1019.6 997.2 1034.3
7.7 8.1 8.1 8.2 7.7 7.3 7.5 7.5 standard deviations
720 720 720 720 720 720 720 720 number of observations October 1016.0 1015.8 1016.8 1016.4 1014.8 1014.5 1016.3 1016.9 1012.2 1020.0 996.9 1033.2
6.5 6.8 7.0 6.9 6.3 6.2 6.3 6.3 standard deviations
744 744 744 744 744 744 744 744 number of observations November 1014.6 1014.6 1015.5 1014.8 1013.4 1013.3 1015.0 1015.6 1011.7 1017.7 1000.9 1029.0
5.2 5.1 5.3 5.4 5.2 5.2 5.3 5.3 standard deviations
720 720 720 720 720 720 720 720 number of observations December 1013.4 1013.4 1014.4 1013.9 1012.5 1012.0 1013.7 1014.4 1010.3 1016.9 993.1 1029.3
6.3 6.2 6.3 6.3 6.0 6.1 5.8 5.8 standard deviations
984 984 984 984 984 984 984 984 number of observations

52
Table 12: Dry Bulb Temperature variations at Tallong
Tallong Dates: 121211 to 110614
Dry Bulb Temperature at 1.2m (°C)
Time (EST) Month 0000-0300 0300-0600 0600-0900 0900-1200 1200-1500 1500-1800 1800-2100 2100-2400 Average Extreme
Minimum Maximum Minimum Maximum
January 14.9 14.0 17.7 23.9 26.6 24.7 19.4 16.4 12.8 28.2 2.5 40.1
3.1 3.4 4.3 5.9 6.4 6.4 4.8 3.6 standard deviations
1116 1116 1116 1116 1116 1116 1116 1116 number of observations
February 14.6 13.9 15.9 20.9 22.8 21.3 17.4 15.5 12.7 24.6 5.7 39.4
2.7 2.8 3.3 4.6 5.7 5.5 3.7 2.8 standard deviations
1020 1020 1020 1020 1020 1020 1020 1020 number of observations March 13.3 12.6 14.0 19.1 21.3 20.0 15.9 14.1 11.4 22.6 3.6 30.1
2.8 2.9 3.1 3.6 4.1 4.1 2.8 2.5 standard deviations
1116 1116 1116 1116 1116 1116 1116 1116 number of observations
April 9.9 9.1 10.3 16.4 18.8 16.9 12.7 10.9 7.7 20.0 -0.2 28.0
3.5 3.9 3.7 3.5 3.7 3.8 3.0 3.1 standard deviations
1080 1080 1080 1080 1080 1080 1080 1080 number of observations
May 5.5 4.8 5.8 12.9 15.7 13.3 8.5 6.8 3.2 16.5 -2.7 23.3
3.3 3.5 3.6 3.6 3.4 3.6 2.7 3.0 standard deviations
912 912 902 900 900 900 900 911 number of observations
June 5.3 5.0 5.3 9.3 11.4 9.8 6.7 5.5 3.1 12.4 -4.3 16.5
3.3 3.5 3.5 2.4 2.1 2.4 2.5 2.9 standard deviations
852 852 852 852 852 852 852 852 number of observations July 3.7 3.3 3.8 9.1 12.0 9.9 5.9 4.6 1.4 12.9 -5.3 17.4
3.1 3.5 3.7 2.7 2.2 2.9 2.6 2.9 standard deviations
744 744 744 743 744 744 744 744 number of observations
August 4.1 3.4 4.9 10.9 12.9 11.1 6.8 5.0 1.3 14.1 -4.5 20.3
3.6 3.7 4.2 3.0 3.1 3.3 2.9 3.1 standard deviations
732 732 732 732 732 732 732 732 number of observations
September 7.0 6.0 8.6 15.5 17.9 16.1 11.1 8.7 4.4 19.2 -3.9 25.6
4.1 4.3 4.7 3.9 4.1 4.3 3.6 3.8 standard deviations
720 720 720 720 720 720 720 720 number of observations
October 8.3 6.9 11.7 18.1 20.4 18.6 12.8 9.9 5.1 21.8 -2.6 32.1
4.3 4.6 5.2 5.0 4.8 5.1 4.3 4.0 standard deviations
744 744 744 744 744 744 743 744 number of observations November 10.9 9.9 14.5 20.0 22.1 19.8 14.9 12.4 8.8 23.5 1.2 36.0
3.4 3.5 4.6 5.7 5.7 5.7 4.5 3.7 standard deviations
720 720 720 720 720 720 720 720 number of observations
December 13.0 12.3 16.3 21.5 23.9 22 17.1 14.3 10.9 25.5 1.6 38.2
3.7 3.7 4.1 5.2 5.6 5.9 4.8 3.8 standard deviations
972 972 972 972 981 984 984 984 number of observations
53
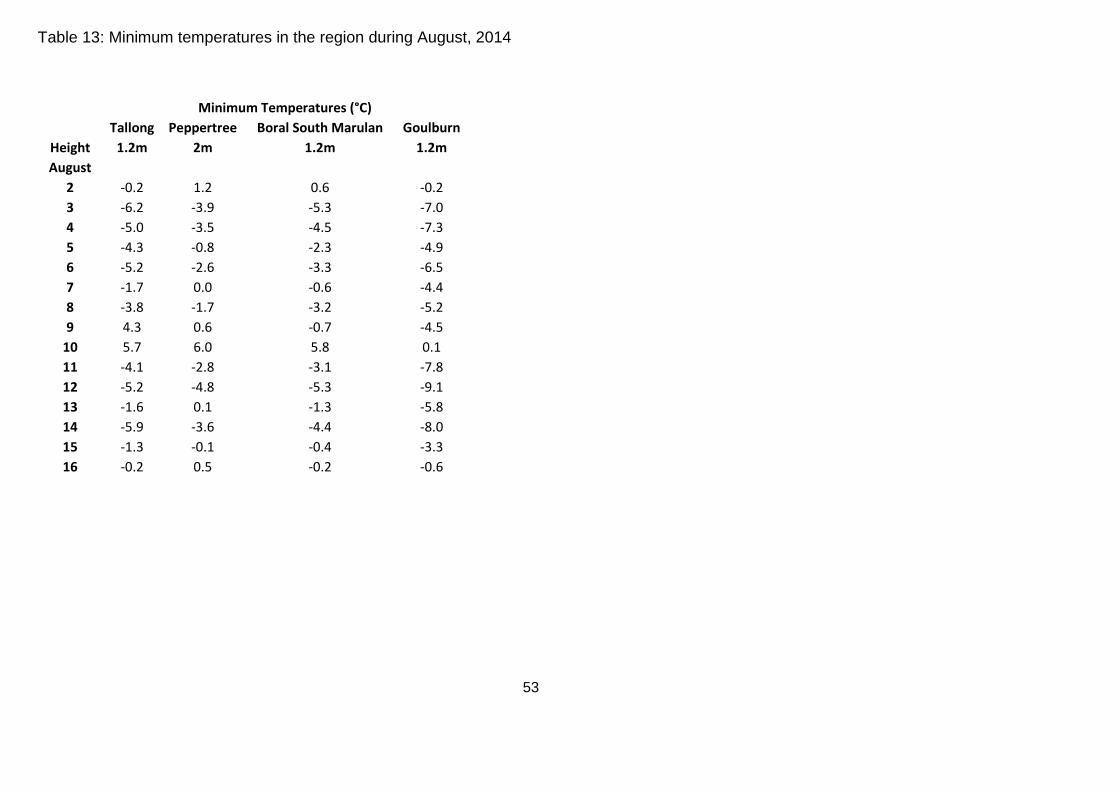
Table 13: Minimum temperatures in the region during August, 2014
Minimum Temperatures (°C)
Tallong Peppertree Boral South Marulan Goulburn
Height 1.2m 2m 1.2m 1.2m
August 2 -0.2 1.2 0.6 -0.2
3 -6.2 -3.9 -5.3 -7.0
4 -5.0 -3.5 -4.5 -7.3
5 -4.3 -0.8 -2.3 -4.9
6 -5.2 -2.6 -3.3 -6.5
7 -1.7 0.0 -0.6 -4.4
8 -3.8 -1.7 -3.2 -5.2
9 4.3 0.6 -0.7 -4.5
10 5.7 6.0 5.8 0.1
11 -4.1 -2.8 -3.1 -7.8
12 -5.2 -4.8 -5.3 -9.1
13 -1.6 0.1 -1.3 -5.8
14 -5.9 -3.6 -4.4 -8.0
15 -1.3 -0.1 -0.4 -3.3
16 -0.2 0.5 -0.2 -0.6

54
Table 14: Temperature difference (2-10m) data from Peppertree Quarry
Peppertree Quarry Dates :230212 to 110614
Dry Bulb Temperature Difference (°C)
Time (EST.)
Month 0000-0300 0300-0600 0600-0900 0900-1200 1200-1500 1500-1800 1800-2100 2100-2400 Average Extreme
Minimum Maximum Minimum Maximum
January 0.3 0.4 -0.1 -0.7 -0.8 -0.4 0.2 0.3 -1.1 0.9 -1.6 3.4
0.4 0.5 0.4 0.3 0.3 0.3 0.3 0.4 standard deviations
720 693 730 742 744 744 744 738 number of observations February 0.3 0.3 0.0 -0.4 -0.4 -0.1 0.2 0.3 -0.7 0.8 -1.5 4.0
0.3 0.3 0.3 0.3 0.3 0.3 0.2 0.3 standard deviations
692 652 692 756 756 755 740 726 number of observations March 0.4 0.4 0.1 -0.3 -0.3 0.0 0.4 0.4 -0.6 0.9 -1.5 2.8
0.3 0.3 0.3 0.3 0.3 0.3 0.4 0.4 standard deviations
967 883 948 1095 1114 1104 1094 1017 number of observations April 0.6 0.6 0.3 -0.2 -0.3 0.2 0.6 0.6 -0.5 1.3 -1.3 3.9
0.5 0.5 0.4 0.3 0.4 0.3 0.4 0.5 standard deviations
857 862 858 1064 1079 1075 1037 912 number of observations May 0.9 0.9 0.5 -0.1 -0.3 0.3 0.8 0.9 -0.5 1.8 -1.3 4.7
0.6 0.6 0.5 0.3 0.3 0.4 0.6 0.6 standard deviations
707 687 740 887 893 879 842 784 number of observations June 0.6 0.5 0.4 0.0 -0.1 0.3 0.6 0.6 -0.4 1.3 -1.1 3.1
0.5 0.4 0.4 0.3 0.3 0.3 0.5 0.6 standard deviations
576 561 640 704 703 685 636 605 number of observations July 0.8 0.7 0.5 -0.1 -0.2 0.3 0.7 0.7 -0.4 1.6 -1.0 3.2
0.5 0.4 0.5 0.3 0.3 0.4 0.4 0.4 standard deviations
693 679 695 740 742 742 714 699 number of observations August 0.8 0.8 0.5 -0.3 -0.3 0.2 0.7 0.8 -0.6 1.7 -1.2 3.9
0.5 0.6 0.5 0.3 0.3 0.3 0.5 0.6 standard deviations
709 703 705 732 732 732 723 722 number of observations September 0.8 0.8 0.3 -0.4 -0.4 0.1 0.6 0.8 -0.7 1.6 -1.4 3.1
0.6 0.6 0.5 0.3 0.3 0.3 0.5 0.6 standard deviations
680 659 688 720 720 719 717 700 number of observations October 0.7 0.8 0.0 -0.5 -0.5 0.0 0.6 0.7 -0.8 1.6 -1.4 3.2
0.5 0.5 0.4 0.3 0.3 0.3 0.5 0.6 standard deviations
723 719 731 744 744 743 736 722 number of observations November 0.5 0.5 -0.2 -0.7 -0.7 -0.2 0.3 0.4 -1.0 1.1 -2.0 2.8
0.5 0.5 0.3 0.4 0.4 0.3 0.3 0.4 standard deviations
660 662 708 720 720 720 720 707 number of observations December 0.4 0.4 -0.2 -0.7 -0.8 -0.4 0.3 0.4 -1.1 1.1 -1.6 3.2
0.4 0.4 0.4 0.3 0.4 0.4 0.3 0.5 standard deviations
717 683 738 744 744 744 742 738 number of observations

55
Table 15: Temperature inversions (2-10m) vs wind directions at Peppertree Quarry
Peppertree Quarry Dates :230212 to 110614
Temperature Inversions (°C) (2-10m) vs.Wind directions
DIRECTION 0.0-0.2 0.2-0.4 0.4-0.6 0.6-0.8 0.8-1.0 1.0-1.2 1.2-1.4 >1.4 TOTAL
N 0.83 1.2 0.79 0.48 0.2 0.2 0.05 0.11 3.87
NNE 0.83 0.97 0.31 0.15 0.03 0.03 0.01 0.01 2.36
NE 0.76 0.84 0.25 0.1 0.02 0.02 0.01 0.01 2.02
ENE 1.55 1.37 0.48 0.25 0.08 0.06 0.01 0.02 3.83
E 3.63 2.32 0.91 0.42 0.13 0.09 0.02 0.04 7.55
ESE 3.64 1.24 0.41 0.2 0.11 0.08 0.05 0.06 5.78
SE 2.81 1.15 0.48 0.23 0.07 0.06 0.04 0.03 4.88
SSE 2.1 0.99 0.35 0.11 0.07 0.03 0.01 0.03 3.69
S 0.92 0.54 0.26 0.1 0.06 0.06 0.02 0.05 2.01
SSW 0.63 0.56 0.39 0.1 0.04 0.03 0.04 0.05 1.84
SW 0.52 0.46 0.29 0.14 0.1 0.07 0.02 0.07 1.68
WSW 0.95 1.75 1.52 0.57 0.21 0.15 0.09 0.18 5.42
W 2.6 4.43 5.15 1.71 0.84 0.81 0.38 0.96 16.88
WNW 1.61 2.65 3.03 2.69 1.89 2.24 1.05 2.44 17.59
NW 1.23 1.66 1.75 2.08 1.6 1.87 1.08 2.08 13.35
NNW 0.99 1.5 1.2 1.45 0.72 0.67 0.27 0.47 7.27
TOTAL 25.62 23.64 17.54 10.79 6.19 6.47 3.15 6.61 44526
Number of calm periods = 4204

56
Table 16: Frequency of occurrence of Pasquill stability categories at Peppertree Quarry
Dates : 230212 to 110614
Frequency (%) of occurrence of
Pasquill stability categories
Stability
Category Night Day
A 0.00 8.89
B 0.00 11.81
C 0.02 27.84
D 51.96 51.46
E 34.67 0.00
F 9.49 0.00
G 3.87 0.00
Night = Starts in the 15 minute period in which Sunset occurs
Day = Starts in the 15 minute period in which Sunrise occurs
57
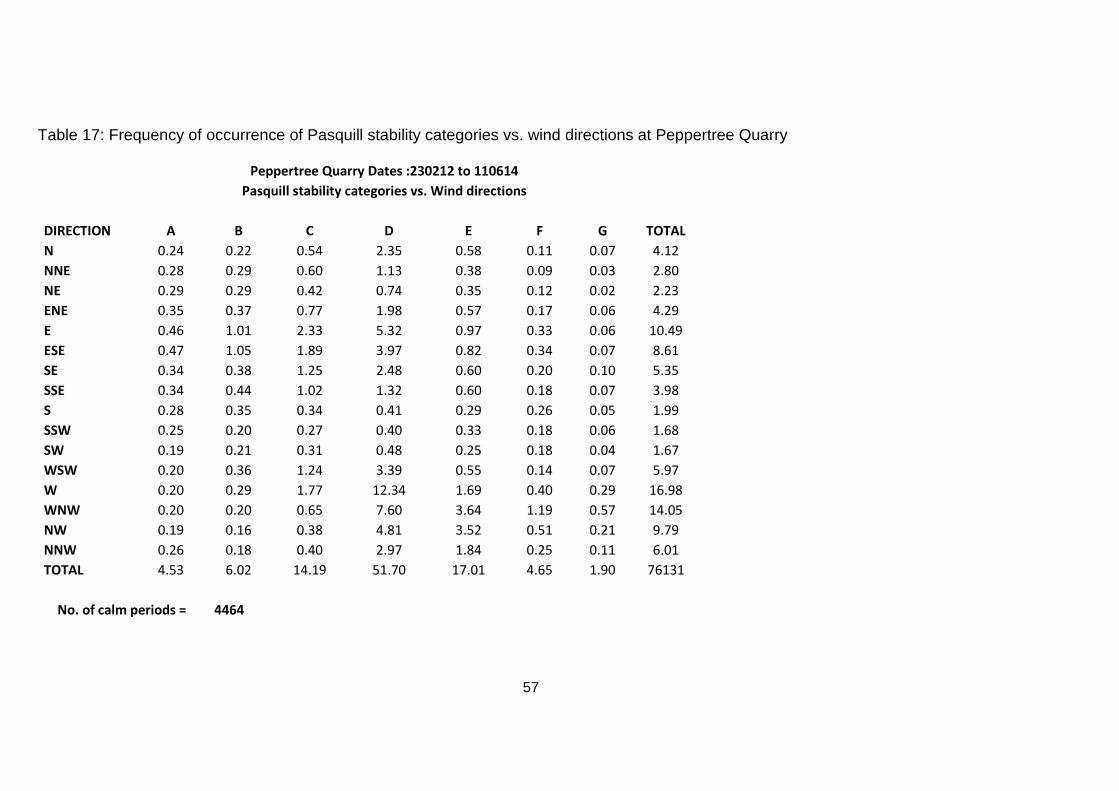
Table 17: Frequency of occurrence of Pasquill stability categories vs. wind directions at Peppertree Quarry
Peppertree Quarry Dates :230212 to 110614
Pasquill stability categories vs. Wind directions
DIRECTION A B C D E F G TOTAL
N 0.24 0.22 0.54 2.35 0.58 0.11 0.07 4.12
NNE 0.28 0.29 0.60 1.13 0.38 0.09 0.03 2.80
NE 0.29 0.29 0.42 0.74 0.35 0.12 0.02 2.23
ENE 0.35 0.37 0.77 1.98 0.57 0.17 0.06 4.29
E 0.46 1.01 2.33 5.32 0.97 0.33 0.06 10.49
ESE 0.47 1.05 1.89 3.97 0.82 0.34 0.07 8.61
SE 0.34 0.38 1.25 2.48 0.60 0.20 0.10 5.35
SSE 0.34 0.44 1.02 1.32 0.60 0.18 0.07 3.98
S 0.28 0.35 0.34 0.41 0.29 0.26 0.05 1.99
SSW 0.25 0.20 0.27 0.40 0.33 0.18 0.06 1.68
SW 0.19 0.21 0.31 0.48 0.25 0.18 0.04 1.67
WSW 0.20 0.36 1.24 3.39 0.55 0.14 0.07 5.97
W 0.20 0.29 1.77 12.34 1.69 0.40 0.29 16.98
WNW 0.20 0.20 0.65 7.60 3.64 1.19 0.57 14.05
NW 0.19 0.16 0.38 4.81 3.52 0.51 0.21 9.79
NNW 0.26 0.18 0.40 2.97 1.84 0.25 0.11 6.01
TOTAL 4.53 6.02 14.19 51.70 17.01 4.65 1.90 76131
No. of calm periods = 4464

58
Table 18: Solar radiation at Peppertree Quarry, South Marulan
Peppertree Quarry
230212 to 110614
Solar radiaton (W/m**2)
Time EST
Month 0600 0700 0800 0900 1000 1100 1200 1300 1400 1500 1600 1700 1800 1900 2000
January 0.029 0.140 0.298 0.459 0.645 0.748 0.808 0.799 0.764 0.634 0.505 0.350 0.180 0.046 0.001
February 0.002 0.067 0.187 0.339 0.487 0.580 0.642 0.656 0.613 0.520 0.392 0.248 0.118 0.024 0
March 0 0.035 0.146 0.302 0.444 0.552 0.599 0.593 0.559 0.476 0.364 0.212 0.072 0.003 0
April 0 0.010 0.110 0.242 0.384 0.514 0.558 0.545 0.477 0.374 0.249 0.111 0.017 0 0
May 0 0 0.068 0.214 0.343 0.437 0.492 0.464 0.420 0.329 0.192 0.058 0 0 0
June 0 0 0.021 0.116 0.222 0.299 0.345 0.337 0.312 0.236 0.135 0.035 0 0 0
July 0 0 0.031 0.163 0.291 0.387 0.434 0.441 0.381 0.292 0.178 0.060 0 0 0
August 0 0.003 0.100 0.250 0.392 0.501 0.531 0.534 0.474 0.395 0.262 0.115 0.012 0 0
September 0 0.055 0.208 0.359 0.491 0.590 0.643 0.642 0.592 0.471 0.321 0.171 0.039 0 0
October 0.026 0.174 0.354 0.527 0.663 0.767 0.795 0.756 0.686 0.571 0.405 0.231 0.077 0.002 0
November 0.060 0.183 0.339 0.473 0.573 0.695 0.722 0.700 0.623 0.475 0.370 0.244 0.101 0.015 0
December 0.055 0.178 0.331 0.507 0.637 0.705 0.754 0.770 0.736 0.606 0.486 0.305 0.155 0.035 0