table 29. pad district 3 - imports of crude oil and ... · table 29. pad district 3 - imports of...
TRANSCRIPT

1. TABLE29.PDFTable 29. PAD District 3 - Imports of Crude Oil and Petroleum Products by Country of Origin, January 2016
(Thousand Barrels)
Country of Origin
Crude Oil1,2
NaturalGas
LiquidsRefineryOlefins
UnfinishedOils1
Finished Motor Gasoline Motor Gasoline Blending Components
Reform-ulated
Conven-tional Total
Reform- ulated
Conven- tional Total
OPEC ..................................... 51,215 – – 4,206 – – – – – –Algeria ................................ – – – 3,896 – – – – – –
Angola ................................ 2,266 – – – – – – – – –
Ecuador .............................. 2,525 – – – – – – – – –
Iran ..................................... – – – – – – – – – –
Iraq ..................................... 5,211 – – – – – – – – –
Kuwait ................................. 3,851 – – – – – – – – –
Libya ................................... – – – 310 – – – – – –
Nigeria ................................ – – – – – – – – – –
Qatar ................................... – – – – – – – – – –
Saudi Arabia ....................... 18,568 – – – – – – – – –
United Arab Emirates ......... – – – – – – – – – –
Venezuela ........................... 18,794 – – – – – – – – –
Non-OPEC ............................. 42,244 330 36 12,282 – – – – 144 144Argentina ............................ – – – – – – – – 90 90
Aruba .................................. – – – – – – – – – –
Australia .............................. – – – – – – – – – –
Bahamas ............................ – – – – – – – – – –
Bahrain ............................... – – – – – – – – – –
Belgium ............................... – – – 1,999 – – – – – –
Brazil ................................... 4,426 – – – – – – – 23 23
Brunei ................................. – – – – – – – – – –
Cameroon ........................... – – – – – – – – – –
Canada ............................... 10,935 – – – – – – – 1 1
Chad ................................... 907 – – – – – – – – –
China .................................. – – – – – – – – – –
Colombia ............................ 7,406 – – 196 – – – – – –
Congo (Brazzaville) ............ – – – – – – – – – –
Denmark ............................. – – – – – – – – – –
Egypt .................................. – – – 199 – – – – – –
Equatorial Guinea ............... – – – – – – – – – –
Estonia ................................ – – – – – – – – – –
Finland ................................ – – – – – – – – – –
France ................................ – – – 234 – – – – – –
Gabon ................................. – – – – – – – – – –
Germany ............................. – – – 73 – – – – – –
Guatemala .......................... 270 – – – – – – – – –
India .................................... – – – – – – – – – –
Indonesia ............................ – – – – – – – – – –
Italy ..................................... – – – – – – – – 30 30
Korea, South ....................... – – – – – – – – – –
Latvia .................................. – – – – – – – – – –
Lithuania ............................. – – – – – – – – – –
Malaysia ............................. – – – – – – – – – –
Mexico ................................ 17,533 – 36 – – – – – – –
Netherlands ........................ – – – 623 – – – – – –
Netherlands Antilles ............ – – – – – – – – – –
Norway ............................... – – – 434 – – – – – –
Oman .................................. – – – – – – – – – –
Portugal .............................. – – – – – – – – – –
Russia ................................. – – – 8,277 – – – – – –
Spain .................................. – – – – – – – – – –
Sweden ............................... – – – – – – – – – –
Syria ................................... – – – – – – – – – –
Trinidad and Tobago .......... 240 – – – – – – – – –
United Kingdom .................. 527 – – – – – – – – –
Vietnam .............................. – – – – – – – – – –
Virgin Islands, U.S. ............. – – – – – – – – – –
Yemen ................................ – – – – – – – – – –
Other ................................... 0 330 0 247 – – – – 0 0
Total ....................................... 93,459 330 36 16,488 – – – – 144 144
Persian Gulf3 ......................... 27,630 – – – – – – – – –
See footnotes at end of table.
U. S. Energy Information Administration/Petroleum Supply Annual 2016, Volume 2

Table 29. PAD District 3 - Imports of Crude Oil and Petroleum Products by Country of Origin, January 2016(Thousand Barrels) — Continued
Country of Origin
Oxygenates Renewable Fuels Distillate Fuel Oil
MethylTertiary
ButylEther
(MTBE)
OtherOxygen-
atesFuel
Ethanol
Biomass-BasedDiesel
OtherRenewable
Diesel
OtherRenewable
Fuels
15 ppmsulfur and
under
Greaterthan 15ppm to 500 ppm
sulfur501 to
2000 ppm
Greaterthan 2000
ppm Total
OPEC ..................................... – – – – – – – – – – –Algeria ................................ – – – – – – – – – – –
Angola ................................ – – – – – – – – – – –
Ecuador .............................. – – – – – – – – – – –
Iran ..................................... – – – – – – – – – – –
Iraq ..................................... – – – – – – – – – – –
Kuwait ................................. – – – – – – – – – – –
Libya ................................... – – – – – – – – – – –
Nigeria ................................ – – – – – – – – – – –
Qatar ................................... – – – – – – – – – – –
Saudi Arabia ....................... – – – – – – – – – – –
United Arab Emirates ......... – – – – – – – – – – –
Venezuela ........................... – – – – – – – – – – –
Non-OPEC ............................. 121 – – – – – – – 520 126 646Argentina ............................ – – – – – – – – – – –
Aruba .................................. – – – – – – – – – – –
Australia .............................. – – – – – – – – – – –
Bahamas ............................ – – – – – – – – – – –
Bahrain ............................... – – – – – – – – – – –
Belgium ............................... – – – – – – – – – – –
Brazil ................................... 121 – – – – – – – – – –
Brunei ................................. – – – – – – – – – – –
Cameroon ........................... – – – – – – – – – – –
Canada ............................... – – – – – – – – 300 – 300
Chad ................................... – – – – – – – – – – –
China .................................. – – – – – – – – – – –
Colombia ............................ – – – – – – – – – – –
Congo (Brazzaville) ............ – – – – – – – – – – –
Denmark ............................. – – – – – – – – – – –
Egypt .................................. – – – – – – – – – – –
Equatorial Guinea ............... – – – – – – – – – – –
Estonia ................................ – – – – – – – – – – –
Finland ................................ – – – – – – – – – – –
France ................................ – – – – – – – – 25 – 25
Gabon ................................. – – – – – – – – – – –
Germany ............................. – – – – – – – – 51 – 11
Guatemala .......................... – – – – – – – – – – –
India .................................... – – – – – – – – – – –
Indonesia ............................ – – – – – – – – – – –
Italy ..................................... – – – – – – – – – – 220
Korea, South ....................... – – – – – – – – – – –
Latvia .................................. – – – – – – – – – – –
Lithuania ............................. – – – – – – – – – – –
Malaysia ............................. – – – – – – – – – – –
Mexico ................................ – – – – – – – – – – –
Netherlands ........................ – – – – – – – – 12 – 115
Netherlands Antilles ............ – – – – – – – – – – –
Norway ............................... – – – – – – – – – – –
Oman .................................. – – – – – – – – – – –
Portugal .............................. – – – – – – – – – – –
Russia ................................. – – – – – – – – 27 – 27
Spain .................................. – – – – – – – – – – –
Sweden ............................... – – – – – – – – – – –
Syria ................................... – – – – – – – – – – –
Trinidad and Tobago .......... – – – – – – – – – – –
United Kingdom .................. – – – – – – – – – – –
Vietnam .............................. – – – – – – – – – – –
Virgin Islands, U.S. ............. – – – – – – – – – – –
Yemen ................................ – – – – – – – – – – –
Other ................................... 0 – – – – – – – 105 126 -52
Total ....................................... 121 – – – – – – – 520 126 646
Persian Gulf3 ......................... – – – – – – – – – – –
See footnotes at end of table.
U. S. Energy Information Administration/Petroleum Supply Annual 2016, Volume 2

Table 29. PAD District 3 - Imports of Crude Oil and Petroleum Products by Country of Origin, January 2016(Thousand Barrels) — Continued
Country of Origin
Kerosene
FinishedAviationGasoline
AviationGasolineBlending
Components
Kerosene-Type Jet
FuelSpecial
Naphthas
Residual Fuel Oil
Less than 0.31 % sulfur
0.31 to 1.00 % sulfur
Greater than1.00 % sulfur Total
OPEC ..................................... – – – – – 12 – 295 307Algeria ................................ – – – – – – – – –
Angola ................................ – – – – – – – – –
Ecuador .............................. – – – – – – – – –
Iran ..................................... – – – – – – – – –
Iraq ..................................... – – – – – – – – –
Kuwait ................................. – – – – – – – – –
Libya ................................... – – – – – – – – –
Nigeria ................................ – – – – – 12 – – 12
Qatar ................................... – – – – – – – – –
Saudi Arabia ....................... – – – – – – – – –
United Arab Emirates ......... – – – – – – – – –
Venezuela ........................... – – – – – – – 295 295
Non-OPEC ............................. – – – – 294 746 299 1,869 2,914Argentina ............................ – – – – – – – – –
Aruba .................................. – – – – – – – – –
Australia .............................. – – – – – – – – –
Bahamas ............................ – – – – – – – – –
Bahrain ............................... – – – – – – – – –
Belgium ............................... – – – – – – – 129 129
Brazil ................................... – – – – – – – – –
Brunei ................................. – – – – – – – – –
Cameroon ........................... – – – – – – – – –
Canada ............................... – – – – 83 77 – – 77
Chad ................................... – – – – – – – – –
China .................................. – – – – – – – – –
Colombia ............................ – – – – – – – – –
Congo (Brazzaville) ............ – – – – – – – – –
Denmark ............................. – – – – – – – – –
Egypt .................................. – – – – – – – – –
Equatorial Guinea ............... – – – – – – – – –
Estonia ................................ – – – – – – – – –
Finland ................................ – – – – – – – – –
France ................................ – – – – – – – – –
Gabon ................................. – – – – – – – – –
Germany ............................. – – – – – – – – –
Guatemala .......................... – – – – – – – – –
India .................................... – – – – – – – – –
Indonesia ............................ – – – – – – – – –
Italy ..................................... – – – – 42 – – – –
Korea, South ....................... – – – – 128 – – – –
Latvia .................................. – – – – – – – – –
Lithuania ............................. – – – – – – – – –
Malaysia ............................. – – – – – – – – –
Mexico ................................ – – – – – – – 596 596
Netherlands ........................ – – – – – – – – –
Netherlands Antilles ............ – – – – – – – – –
Norway ............................... – – – – – 340 – – 340
Oman .................................. – – – – – – – – –
Portugal .............................. – – – – – – – – –
Russia ................................. – – – – – 31 – 613 644
Spain .................................. – – – – – – – 178 178
Sweden ............................... – – – – – – – – –
Syria ................................... – – – – – – – – –
Trinidad and Tobago .......... – – – – – – – – –
United Kingdom .................. – – – – – – – – –
Vietnam .............................. – – – – – – – – –
Virgin Islands, U.S. ............. – – – – – – – – –
Yemen ................................ – – – – – – – – –
Other ................................... – – – – 41 298 299 353 950
Total ....................................... – – – – 294 758 299 2,164 3,221
Persian Gulf3 ......................... – – – – – – – – –
See footnotes at end of table.
U. S. Energy Information Administration/Petroleum Supply Annual 2016, Volume 2

Table 29. PAD District 3 - Imports of Crude Oil and Petroleum Products by Country of Origin, January 2016(Thousand Barrels) — Continued
Country of Origin
Petrochemical Feedstocks
WaxesPetroleum
Coke
Asphaltand Road
Oil Lubricants
Miscellan-eous
ProductsTotal
Products
TotalCrudeOil and
Products
Daily Average
Crude Oil Products TotalNaphtha
OtherOils
OPEC ..................................... – – – – – 329 – 4,842 56,057 1,652 156 1,808Algeria ................................ – – – – – – – 3,896 3,896 – 126 126
Angola ................................ – – – – – – – – 2,266 73 – 73
Ecuador .............................. – – – – – – – – 2,525 81 – 81
Iran ..................................... – – – – – – – – – – – –
Iraq ..................................... – – – – – – – – 5,211 168 – 168
Kuwait ................................. – – – – – – – – 3,851 124 – 124
Libya ................................... – – – – – – – 310 310 – 10 10
Nigeria ................................ – – – – – – – 12 12 – 0 0
Qatar ................................... – – – – – 261 – 261 261 – 8 8
Saudi Arabia ....................... – – – – – – – – 18,568 599 – 599
United Arab Emirates ......... – – – – – – – – – – – –
Venezuela ........................... – – – – – – – 295 19,089 606 10 616
Non-OPEC ............................. 892 29 15 14 – 375 – 18,094 60,338 1,363 584 1,946Argentina ............................ 17 – – – – 2 – 109 109 – 4 4
Aruba .................................. – – – – – – – – – – – –
Australia .............................. – – – – – – – – – – – –
Bahamas ............................ – – – – – – – – – – – –
Bahrain ............................... – – – – – 15 – 15 15 – 0 0
Belgium ............................... – – – – – 24 – 2,152 2,152 – 69 69
Brazil ................................... – – – – – – – 144 4,570 143 5 147
Brunei ................................. – – – – – – – – – – – –
Cameroon ........................... – – – – – – – – – – – –
Canada ............................... – 28 – – – – – 461 11,396 353 15 368
Chad ................................... – – – – – – – – 907 29 – 29
China .................................. – – – – – – – – – – – –
Colombia ............................ – – – – – – – 196 7,602 239 6 245
Congo (Brazzaville) ............ – – – – – – – – – – – –
Denmark ............................. – – – – – – – – – – – –
Egypt .................................. – – – – – – – 199 199 – 6 6
Equatorial Guinea ............... – – – – – – – – – – – –
Estonia ................................ – – – – – – – – – – – –
Finland ................................ – – – – – – – – – – – –
France ................................ – 20 – – – 1 – 255 255 – 8 8
Gabon ................................. – – – – – – – – – – – –
Germany ............................. – – – – – 8 – 92 92 – 3 3
Guatemala .......................... – – – – – – – – 270 9 – 9
India .................................... – – 1 – – – – 1 1 – 0 0
Indonesia ............................ – – – – – – – 68 68 – 2 2
Italy ..................................... – – – – – 6 – 299 299 – 10 10
Korea, South ....................... 298 – – – – 292 – 718 718 – 23 23
Latvia .................................. – – – – – – – – – – – –
Lithuania ............................. – – – – – – – – – – – –
Malaysia ............................. – – 2 – – – – 2 2 – 0 0
Mexico ................................ 502 – – – – – – 1,134 18,667 566 37 602
Netherlands ........................ 51 – – – – – – 789 789 – 25 25
Netherlands Antilles ............ – – – – – – – – – – – –
Norway ............................... – – – – – – – 774 774 – 25 25
Oman .................................. – – – – – – – – – – – –
Portugal .............................. – – – – – – – – – – – –
Russia ................................. – – – – – – – 8,922 8,922 – 288 288
Spain .................................. – – – – – – – 178 178 – 6 6
Sweden ............................... – – – – – – – – – – – –
Syria ................................... – – – – – – – – – – – –
Trinidad and Tobago .......... – – – – – – – – 240 8 – 8
United Kingdom .................. 24 – – 8 – 8 – 40 567 17 1 18
Vietnam .............................. – – – – – – – – – – – –
Virgin Islands, U.S. ............. – – – – – – – – – – – –
Yemen ................................ – – – – – – – – – – – –
Other ................................... 0 -19 12 6 – 19 – 1,546 1,546 -1 51 51
Total ....................................... 892 29 15 14 – 704 – 22,936 116,395 3,015 740 3,755
Persian Gulf3 ......................... – – – – – 276 – 276 27,906 891 9 900
–= No Data Reported.
1Crude oil and unfinished oils are reported by the PAD District in which they are to be processed; all other products are reported by the PAD District of entry.
2 Includes crude oil imported for storage in the Strategic Petroleum Reserve.
3 Includes Bahrain, Iran, Iraq, Kuwait, Qatar, Saudi Arabia, and United Arab Emirates.
Note: Totals may not equal sum of components due to independent rounding.
Source: Energy Information Administration (EIA) Form EIA-814, "Monthly Imports Report."
U. S. Energy Information Administration/Petroleum Supply Annual 2016, Volume 2

2. TABLE29.PDFTable 29. PAD District 3 - Imports of Crude Oil and Petroleum Products by Country of Origin, February 2016
(Thousand Barrels)
Country of Origin
Crude Oil1,2
NaturalGas
LiquidsRefineryOlefins
UnfinishedOils1
Finished Motor Gasoline Motor Gasoline Blending Components
Reform-ulated
Conven-tional Total
Reform- ulated
Conven- tional Total
OPEC ..................................... 51,960 – – 4,359 – – – – – –Algeria ................................ 1,064 – – 3,978 – – – – – –
Angola ................................ 1,342 – – 381 – – – – – –
Ecuador .............................. 1,660 – – – – – – – – –
Iran ..................................... – – – – – – – – – –
Iraq ..................................... 5,188 – – – – – – – – –
Kuwait ................................. 7,653 – – – – – – – – –
Libya ................................... – – – – – – – – – –
Nigeria ................................ 479 – – – – – – – – –
Qatar ................................... – – – – – – – – – –
Saudi Arabia ....................... 14,268 – – – – – – – – –
United Arab Emirates ......... – – – – – – – – – –
Venezuela ........................... 20,306 – – – – – – – – –
Non-OPEC ............................. 39,613 287 – 10,814 – – – – 18 18Argentina ............................ – – – – – – – – – –
Aruba .................................. – – – – – – – – – –
Australia .............................. – – – – – – – – – –
Bahamas ............................ – – – – – – – – – –
Bahrain ............................... – – – – – – – – – –
Belgium ............................... – – – 1,162 – – – – – –
Brazil ................................... 2,676 – – – – – – – 18 18
Brunei ................................. – – – – – – – – – –
Cameroon ........................... – – – 237 – – – – – –
Canada ............................... 10,957 – – – – – – – – –
Chad ................................... 2,809 – – – – – – – – –
China .................................. – – – – – – – – – –
Colombia ............................ 8,558 – – 207 – – – – – –
Congo (Brazzaville) ............ – – – – – – – – – –
Denmark ............................. – – – – – – – – – –
Egypt .................................. – – – – – – – – – –
Equatorial Guinea ............... – – – – – – – – – –
Estonia ................................ – – – – – – – – – –
Finland ................................ – – – – – – – – – –
France ................................ – – – 362 – – – – – –
Gabon ................................. – – – 195 – – – – – –
Germany ............................. – – – 108 – – – – – –
Guatemala .......................... 272 – – – – – – – – –
India .................................... – – – – – – – – – –
Indonesia ............................ – – – – – – – – – –
Italy ..................................... – – – – – – – – – –
Korea, South ....................... – – – – – – – – – –
Latvia .................................. – – – – – – – – – –
Lithuania ............................. – – – – – – – – – –
Malaysia ............................. – – – – – – – – – –
Mexico ................................ 13,971 – – 36 – – – – – –
Netherlands ........................ – – – 50 – – – – – –
Netherlands Antilles ............ – – – – – – – – – –
Norway ............................... – – – 412 – – – – – –
Oman .................................. – – – – – – – – – –
Portugal .............................. – – – – – – – – – –
Russia ................................. 250 – – 7,957 – – – – – –
Spain .................................. – – – – – – – – – –
Sweden ............................... – – – – – – – – – –
Syria ................................... – – – – – – – – – –
Trinidad and Tobago .......... 120 – – – – – – – – –
United Kingdom .................. – – – – – – – – – –
Vietnam .............................. – – – – – – – – – –
Virgin Islands, U.S. ............. – – – – – – – – – –
Yemen ................................ – – – – – – – – – –
Other ................................... 0 287 – 88 – – – – 0 0
Total ....................................... 91,573 287 – 15,173 – – – – 18 18
Persian Gulf3 ......................... 27,109 – – – – – – – – –
See footnotes at end of table.
U. S. Energy Information Administration/Petroleum Supply Annual 2016, Volume 2

Table 29. PAD District 3 - Imports of Crude Oil and Petroleum Products by Country of Origin, February 2016(Thousand Barrels) — Continued
Country of Origin
Oxygenates Renewable Fuels Distillate Fuel Oil
MethylTertiary
ButylEther
(MTBE)
OtherOxygen-
atesFuel
Ethanol
Biomass-BasedDiesel
OtherRenewable
Diesel
OtherRenewable
Fuels
15 ppmsulfur and
under
Greaterthan 15ppm to 500 ppm
sulfur501 to
2000 ppm
Greaterthan 2000
ppm Total
OPEC ..................................... 111 – – – – – – – – – –Algeria ................................ – – – – – – – – – – –
Angola ................................ – – – – – – – – – – –
Ecuador .............................. – – – – – – – – – – –
Iran ..................................... – – – – – – – – – – –
Iraq ..................................... – – – – – – – – – – –
Kuwait ................................. – – – – – – – – – – –
Libya ................................... – – – – – – – – – – –
Nigeria ................................ – – – – – – – – – – –
Qatar ................................... – – – – – – – – – – –
Saudi Arabia ....................... – – – – – – – – – – –
United Arab Emirates ......... 111 – – – – – – – – – –
Venezuela ........................... – – – – – – – – – – –
Non-OPEC ............................. 276 44 – 142 – – – 313 530 – 843Argentina ............................ – – – 142 – – – – – – –
Aruba .................................. – – – – – – – – – – –
Australia .............................. – – – – – – – – – – –
Bahamas ............................ – – – – – – – – – – –
Bahrain ............................... – – – – – – – – – – –
Belgium ............................... – – – – – – – – – – –
Brazil ................................... 76 44 – – – – – – – – –
Brunei ................................. – – – – – – – – – – –
Cameroon ........................... – – – – – – – – – – –
Canada ............................... – – – – – – – – – – –
Chad ................................... – – – – – – – – – – –
China .................................. – – – – – – – – – – –
Colombia ............................ – – – – – – – – – – –
Congo (Brazzaville) ............ – – – – – – – – – – –
Denmark ............................. – – – – – – – – – – –
Egypt .................................. – – – – – – – – – – –
Equatorial Guinea ............... – – – – – – – – – – –
Estonia ................................ – – – – – – – – – – –
Finland ................................ – – – – – – – – – – –
France ................................ – – – – – – – – 25 – 25
Gabon ................................. – – – – – – – – – – –
Germany ............................. – – – – – – – – 51 – 51
Guatemala .......................... – – – – – – – – – – –
India .................................... – – – – – – – – – – –
Indonesia ............................ – – – – – – – – – – –
Italy ..................................... – – – – – – – – – – –
Korea, South ....................... – – – – – – – – – – –
Latvia .................................. – – – – – – – – – – –
Lithuania ............................. – – – – – – – – – – –
Malaysia ............................. – – – – – – – – – – –
Mexico ................................ – – – – – – – – – – –
Netherlands ........................ 200 – – – – – – – 12 – 12
Netherlands Antilles ............ – – – – – – – – – – –
Norway ............................... – – – – – – – – – – –
Oman .................................. – – – – – – – – – – –
Portugal .............................. – – – – – – – – – – –
Russia ................................. – – – – – – – – 153 – 153
Spain .................................. – – – – – – – – – – –
Sweden ............................... – – – – – – – – 289 – 289
Syria ................................... – – – – – – – – – – –
Trinidad and Tobago .......... – – – – – – – – – – –
United Kingdom .................. – – – – – – – – – – –
Vietnam .............................. – – – – – – – – – – –
Virgin Islands, U.S. ............. – – – – – – – – – – –
Yemen ................................ – – – – – – – – – – –
Other ................................... 0 0 – 0 – – – 313 0 – 313
Total ....................................... 387 44 – 142 – – – 313 530 – 843
Persian Gulf3 ......................... 111 – – – – – – – – – –
See footnotes at end of table.
U. S. Energy Information Administration/Petroleum Supply Annual 2016, Volume 2
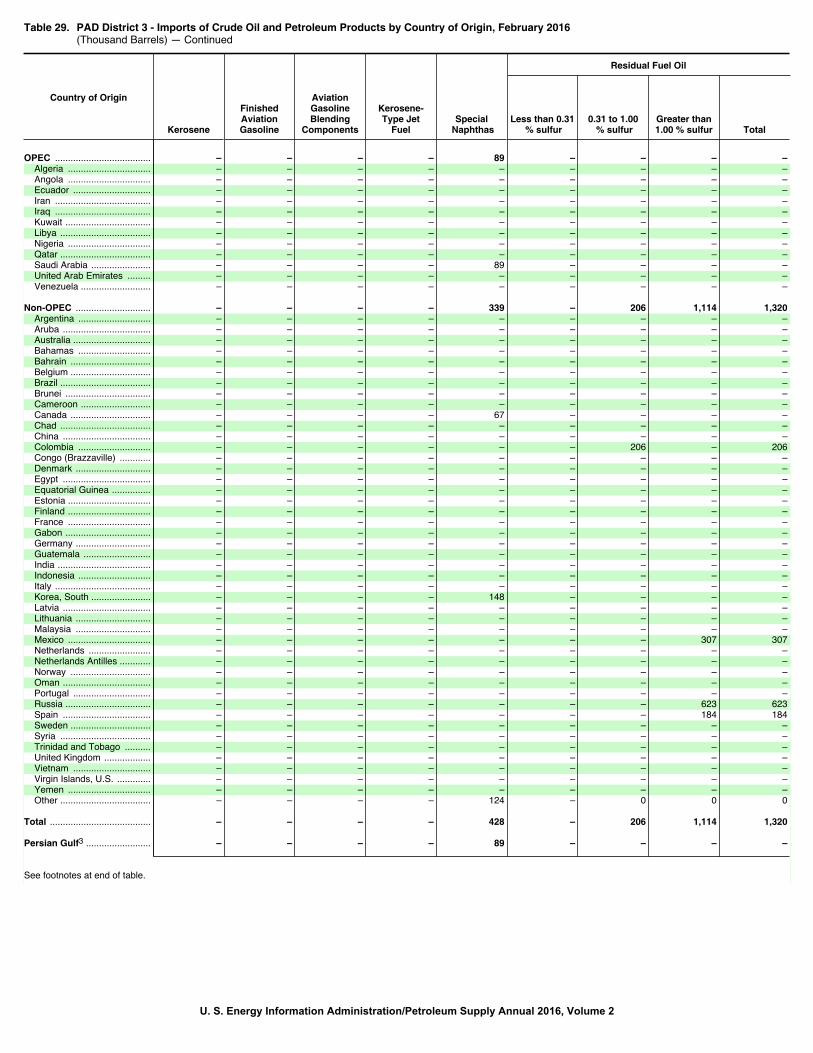
Table 29. PAD District 3 - Imports of Crude Oil and Petroleum Products by Country of Origin, February 2016(Thousand Barrels) — Continued
Country of Origin
Kerosene
FinishedAviationGasoline
AviationGasolineBlending
Components
Kerosene-Type Jet
FuelSpecial
Naphthas
Residual Fuel Oil
Less than 0.31 % sulfur
0.31 to 1.00 % sulfur
Greater than1.00 % sulfur Total
OPEC ..................................... – – – – 89 – – – –Algeria ................................ – – – – – – – – –
Angola ................................ – – – – – – – – –
Ecuador .............................. – – – – – – – – –
Iran ..................................... – – – – – – – – –
Iraq ..................................... – – – – – – – – –
Kuwait ................................. – – – – – – – – –
Libya ................................... – – – – – – – – –
Nigeria ................................ – – – – – – – – –
Qatar ................................... – – – – – – – – –
Saudi Arabia ....................... – – – – 89 – – – –
United Arab Emirates ......... – – – – – – – – –
Venezuela ........................... – – – – – – – – –
Non-OPEC ............................. – – – – 339 – 206 1,114 1,320Argentina ............................ – – – – – – – – –
Aruba .................................. – – – – – – – – –
Australia .............................. – – – – – – – – –
Bahamas ............................ – – – – – – – – –
Bahrain ............................... – – – – – – – – –
Belgium ............................... – – – – – – – – –
Brazil ................................... – – – – – – – – –
Brunei ................................. – – – – – – – – –
Cameroon ........................... – – – – – – – – –
Canada ............................... – – – – 67 – – – –
Chad ................................... – – – – – – – – –
China .................................. – – – – – – – – –
Colombia ............................ – – – – – – 206 – 206
Congo (Brazzaville) ............ – – – – – – – – –
Denmark ............................. – – – – – – – – –
Egypt .................................. – – – – – – – – –
Equatorial Guinea ............... – – – – – – – – –
Estonia ................................ – – – – – – – – –
Finland ................................ – – – – – – – – –
France ................................ – – – – – – – – –
Gabon ................................. – – – – – – – – –
Germany ............................. – – – – – – – – –
Guatemala .......................... – – – – – – – – –
India .................................... – – – – – – – – –
Indonesia ............................ – – – – – – – – –
Italy ..................................... – – – – – – – – –
Korea, South ....................... – – – – 148 – – – –
Latvia .................................. – – – – – – – – –
Lithuania ............................. – – – – – – – – –
Malaysia ............................. – – – – – – – – –
Mexico ................................ – – – – – – – 307 307
Netherlands ........................ – – – – – – – – –
Netherlands Antilles ............ – – – – – – – – –
Norway ............................... – – – – – – – – –
Oman .................................. – – – – – – – – –
Portugal .............................. – – – – – – – – –
Russia ................................. – – – – – – – 623 623
Spain .................................. – – – – – – – 184 184
Sweden ............................... – – – – – – – – –
Syria ................................... – – – – – – – – –
Trinidad and Tobago .......... – – – – – – – – –
United Kingdom .................. – – – – – – – – –
Vietnam .............................. – – – – – – – – –
Virgin Islands, U.S. ............. – – – – – – – – –
Yemen ................................ – – – – – – – – –
Other ................................... – – – – 124 – 0 0 0
Total ....................................... – – – – 428 – 206 1,114 1,320
Persian Gulf3 ......................... – – – – 89 – – – –
See footnotes at end of table.
U. S. Energy Information Administration/Petroleum Supply Annual 2016, Volume 2

Table 29. PAD District 3 - Imports of Crude Oil and Petroleum Products by Country of Origin, February 2016(Thousand Barrels) — Continued
Country of Origin
Petrochemical Feedstocks
WaxesPetroleum
Coke
Asphaltand Road
Oil Lubricants
Miscellan-eous
ProductsTotal
Products
TotalCrudeOil and
Products
Daily Average
Crude Oil Products TotalNaphtha
OtherOils
OPEC ..................................... – – – – – 49 – 4,608 56,568 1,792 159 1,951Algeria ................................ – – – – – – – 3,978 5,042 37 137 174
Angola ................................ – – – – – – – 381 1,723 46 13 59
Ecuador .............................. – – – – – – – – 1,660 57 – 57
Iran ..................................... – – – – – – – – – – – –
Iraq ..................................... – – – – – – – – 5,188 179 – 179
Kuwait ................................. – – – – – – – – 7,653 264 – 264
Libya ................................... – – – – – – – – – – – –
Nigeria ................................ – – – – – – – – 479 17 – 17
Qatar ................................... – – – – – – – – – – – –
Saudi Arabia ....................... – – – – – – – 89 14,357 492 3 495
United Arab Emirates ......... – – – – – – – 111 111 – 4 4
Venezuela ........................... – – – – – – – – 20,306 700 – 700
Non-OPEC ............................. 843 181 68 – – 469 – 15,647 55,260 1,366 540 1,906Argentina ............................ – 148 – – – 2 – 292 292 – 10 10
Aruba .................................. – – – – – – – – – – – –
Australia .............................. – – – – – – – – – – – –
Bahamas ............................ – – – – – – – – – – – –
Bahrain ............................... – – – – – 95 – 95 95 – 3 3
Belgium ............................... – – – – – 43 – 1,205 1,205 – 42 42
Brazil ................................... – – – – – – – 138 2,814 92 5 97
Brunei ................................. – – – – – – – – – – – –
Cameroon ........................... – – – – – – – 237 237 – 8 8
Canada ............................... 3 30 – – – – – 67 11,024 378 2 380
Chad ................................... – – – – – – – – 2,809 97 – 97
China .................................. – – 36 – – – – 36 36 – 1 1
Colombia ............................ – – – – – – – 413 8,971 295 14 309
Congo (Brazzaville) ............ – – – – – – – – – – – –
Denmark ............................. – – – – – – – – – – – –
Egypt .................................. – – – – – – – – – – – –
Equatorial Guinea ............... – – – – – – – – – – – –
Estonia ................................ – – – – – – – – – – – –
Finland ................................ – – – – – – – – – – – –
France ................................ – 24 – – – 3 – 414 414 – 14 14
Gabon ................................. – – – – – – – 195 195 – 7 7
Germany ............................. – – – – – 16 – 175 175 – 6 6
Guatemala .......................... – – – – – – – – 272 9 – 9
India .................................... – – – – – – – – – – – –
Indonesia ............................ – – – – – – – 49 49 – 2 2
Italy ..................................... – – – – – 39 – 41 41 – 1 1
Korea, South ....................... 353 – – – – 233 – 734 734 – 25 25
Latvia .................................. – – – – – – – – – – – –
Lithuania ............................. – – – – – – – – – – – –
Malaysia ............................. – – 32 – – – – 32 32 – 1 1
Mexico ................................ 444 – – – – – – 787 14,758 482 27 509
Netherlands ........................ 19 – – – – – – 281 281 – 10 10
Netherlands Antilles ............ – – – – – – – – – – – –
Norway ............................... – – – – – – – 412 412 – 14 14
Oman .................................. – – – – – – – – – – – –
Portugal .............................. – – – – – – – – – – – –
Russia ................................. – – – – – – – 8,734 8,984 9 301 310
Spain .................................. – – – – – – – 184 184 – 6 6
Sweden ............................... – – – – – – – 289 289 – 10 10
Syria ................................... – – – – – – – – – – – –
Trinidad and Tobago .......... – – – – – – – – 120 4 – 4
United Kingdom .................. 4 – – – – 24 – 28 28 – 1 1
Vietnam .............................. – – – – – – – – – – – –
Virgin Islands, U.S. ............. – – – – – – – – – – – –
Yemen ................................ – – – – – – – – – – – –
Other ................................... 20 -21 0 – – 14 – 809 809 0 30 30
Total ....................................... 843 181 68 – – 518 – 20,255 111,828 3,158 698 3,856
Persian Gulf3 ......................... – – – – – 95 – 295 27,404 935 10 945
–= No Data Reported.
1Crude oil and unfinished oils are reported by the PAD District in which they are to be processed; all other products are reported by the PAD District of entry.
2 Includes crude oil imported for storage in the Strategic Petroleum Reserve.
3 Includes Bahrain, Iran, Iraq, Kuwait, Qatar, Saudi Arabia, and United Arab Emirates.
Note: Totals may not equal sum of components due to independent rounding.
Source: Energy Information Administration (EIA) Form EIA-814, "Monthly Imports Report."
U. S. Energy Information Administration/Petroleum Supply Annual 2016, Volume 2

3. TABLE29.PDFTable 29. PAD District 3 - Imports of Crude Oil and Petroleum Products by Country of Origin, March 2016
(Thousand Barrels)
Country of Origin
Crude Oil1,2
NaturalGas
LiquidsRefineryOlefins
UnfinishedOils1
Finished Motor Gasoline Motor Gasoline Blending Components
Reform-ulated
Conven-tional Total
Reform- ulated
Conven- tional Total
OPEC ..................................... 68,980 – – 4,473 – – – – – –Algeria ................................ 604 – – 3,151 – – – – – –
Angola ................................ 2,438 – – 372 – – – – – –
Ecuador .............................. 1,074 – – – – – – – – –
Iran ..................................... – – – – – – – – – –
Iraq ..................................... 8,980 – – – – – – – – –
Kuwait ................................. 2,787 – – – – – – – – –
Libya ................................... – – – – – – – – – –
Nigeria ................................ 4,030 – – – – – – – – –
Qatar ................................... – – – – – – – – – –
Saudi Arabia ....................... 25,660 – – 950 – – – – – –
United Arab Emirates ......... – – – – – – – – – –
Venezuela ........................... 23,407 – – – – – – – – –
Non-OPEC ............................. 43,434 – 32 7,917 – 4 4 – 1,061 1,061Argentina ............................ 526 – – – – – – – – –
Aruba .................................. – – – – – – – – – –
Australia .............................. – – – – – – – – – –
Bahamas ............................ – – – – – – – – – –
Bahrain ............................... – – – – – – – – – –
Belgium ............................... – – – 1,315 – – – – – –
Brazil ................................... 2,257 – – – – – – – – –
Brunei ................................. – – – – – – – – – –
Cameroon ........................... – – – – – – – – – –
Canada ............................... 9,958 – – – – – – – – –
Chad ................................... 1,875 – – – – – – – – –
China .................................. – – – – – – – – – –
Colombia ............................ 8,546 – – – – – – – 187 187
Congo (Brazzaville) ............ – – – – – – – – – –
Denmark ............................. – – – – – – – – – –
Egypt .................................. – – – – – – – – – –
Equatorial Guinea ............... – – – – – – – – – –
Estonia ................................ – – – – – – – – – –
Finland ................................ – – – – – – – – – –
France ................................ – – – 86 – – – – – –
Gabon ................................. – – – 200 – – – – – –
Germany ............................. – – – – – – – – – –
Guatemala .......................... 260 – – – – – – – – –
India .................................... – – – – – – – – – –
Indonesia ............................ – – – – – – – – – –
Italy ..................................... – – – – – – – – 191 191
Korea, South ....................... – – – – – 4 4 – – –
Latvia .................................. – – – – – – – – – –
Lithuania ............................. – – – – – – – – – –
Malaysia ............................. – – – – – – – – – –
Mexico ................................ 17,630 – 32 – – – – – 300 300
Netherlands ........................ – – – 40 – – – – – –
Netherlands Antilles ............ – – – – – – – – – –
Norway ............................... 1,025 – – 747 – – – – – –
Oman .................................. – – – – – – – – – –
Portugal .............................. – – – – – – – – 286 286
Russia ................................. – – – 5,405 – – – – – –
Spain .................................. – – – – – – – – – –
Sweden ............................... – – – – – – – – – –
Syria ................................... – – – – – – – – – –
Trinidad and Tobago .......... – – – – – – – – – –
United Kingdom .................. 997 – – – – – – – – –
Vietnam .............................. – – – – – – – – – –
Virgin Islands, U.S. ............. – – – – – – – – – –
Yemen ................................ – – – – – – – – – –
Other ................................... 360 – 0 124 – 0 0 – 97 97
Total ....................................... 112,414 – 32 12,390 – 4 4 – 1,061 1,061
Persian Gulf3 ......................... 37,427 – – 950 – – – – – –
See footnotes at end of table.
U. S. Energy Information Administration/Petroleum Supply Annual 2016, Volume 2

Table 29. PAD District 3 - Imports of Crude Oil and Petroleum Products by Country of Origin, March 2016(Thousand Barrels) — Continued
Country of Origin
Oxygenates Renewable Fuels Distillate Fuel Oil
MethylTertiary
ButylEther
(MTBE)
OtherOxygen-
atesFuel
Ethanol
Biomass-BasedDiesel
OtherRenewable
Diesel
OtherRenewable
Fuels
15 ppmsulfur and
under
Greaterthan 15ppm to 500 ppm
sulfur501 to
2000 ppm
Greaterthan 2000
ppm Total
OPEC ..................................... 151 – – 99 – – – – – – –Algeria ................................ – – – – – – – – – – –
Angola ................................ – – – – – – – – – – –
Ecuador .............................. – – – – – – – – – – –
Iran ..................................... – – – – – – – – – – –
Iraq ..................................... – – – – – – – – – – –
Kuwait ................................. – – – – – – – – – – –
Libya ................................... – – – – – – – – – – –
Nigeria ................................ – – – – – – – – – – –
Qatar ................................... – – – – – – – – – – –
Saudi Arabia ....................... – – – – – – – – – – –
United Arab Emirates ......... 151 – – – – – – – – – –
Venezuela ........................... – – – – – – – – – – –
Non-OPEC ............................. 268 88 – 168 – – 216 – 312 – 528Argentina ............................ – – – 128 – – – – – – –
Aruba .................................. – – – – – – – – – – –
Australia .............................. – – – – – – – – – – –
Bahamas ............................ – – – – – – – – – – –
Bahrain ............................... – – – – – – – – – – –
Belgium ............................... – – – – – – – – – – –
Brazil ................................... 99 88 – – – – – – – – –
Brunei ................................. – – – – – – – – – – –
Cameroon ........................... – – – – – – – – – – –
Canada ............................... – – – 40 – – – – – – –
Chad ................................... – – – – – – – – – – –
China .................................. – – – – – – – – – – –
Colombia ............................ – – – – – – – – – – –
Congo (Brazzaville) ............ – – – – – – – – – – –
Denmark ............................. – – – – – – – – – – –
Egypt .................................. – – – – – – – – – – –
Equatorial Guinea ............... – – – – – – – – – – –
Estonia ................................ – – – – – – – – – – –
Finland ................................ – – – – – – – – – – –
France ................................ – – – – – – – – – – –
Gabon ................................. – – – – – – – – – – –
Germany ............................. 18 – – – – – – – – – –
Guatemala .......................... – – – – – – – – – – –
India .................................... – – – – – – – – – – –
Indonesia ............................ – – – 99 – – – – – – –
Italy ..................................... – – – – – – – – – – –
Korea, South ....................... – – – – – – – – – – –
Latvia .................................. – – – – – – – – – – –
Lithuania ............................. – – – – – – – – – – –
Malaysia ............................. – – – – – – – – – – –
Mexico ................................ – – – – – – – – – – –
Netherlands ........................ 151 – – – – – – – – – –
Netherlands Antilles ............ – – – – – – – – – – –
Norway ............................... – – – – – – – – – – –
Oman .................................. – – – – – – – – – – –
Portugal .............................. – – – – – – – – – – –
Russia ................................. – – – – – – 216 – 312 – 528
Spain .................................. – – – – – – – – – – –
Sweden ............................... – – – – – – – – – – –
Syria ................................... – – – – – – – – – – –
Trinidad and Tobago .......... – – – – – – – – – – –
United Kingdom .................. – – – – – – – – – – –
Vietnam .............................. – – – – – – – – – – –
Virgin Islands, U.S. ............. – – – – – – – – – – –
Yemen ................................ – – – – – – – – – – –
Other ................................... 0 0 – -99 – – 0 – 0 – 0
Total ....................................... 419 88 – 267 – – 216 – 312 – 528
Persian Gulf3 ......................... 151 – – – – – – – – – –
See footnotes at end of table.
U. S. Energy Information Administration/Petroleum Supply Annual 2016, Volume 2

Table 29. PAD District 3 - Imports of Crude Oil and Petroleum Products by Country of Origin, March 2016(Thousand Barrels) — Continued
Country of Origin
Kerosene
FinishedAviationGasoline
AviationGasolineBlending
Components
Kerosene-Type Jet
FuelSpecial
Naphthas
Residual Fuel Oil
Less than 0.31 % sulfur
0.31 to 1.00 % sulfur
Greater than1.00 % sulfur Total
OPEC ..................................... – – – – 45 – 309 868 1,177Algeria ................................ – – – – – – – – –
Angola ................................ – – – – – – – – –
Ecuador .............................. – – – – – – – – –
Iran ..................................... – – – – – – – – –
Iraq ..................................... – – – – – – – – –
Kuwait ................................. – – – – – – – – –
Libya ................................... – – – – – – – – –
Nigeria ................................ – – – – – – 309 – 309
Qatar ................................... – – – – – – – – –
Saudi Arabia ....................... – – – – 45 – – 155 155
United Arab Emirates ......... – – – – – – – – –
Venezuela ........................... – – – – – – – 713 713
Non-OPEC ............................. – – – – 484 – 278 2,423 2,701Argentina ............................ – – – – – – – – –
Aruba .................................. – – – – – – – – –
Australia .............................. – – – – – – – – –
Bahamas ............................ – – – – – – – – –
Bahrain ............................... – – – – – – – – –
Belgium ............................... – – – – – – – 14 14
Brazil ................................... – – – – – – 204 – 204
Brunei ................................. – – – – – – – – –
Cameroon ........................... – – – – – – – – –
Canada ............................... – – – – 56 – 3 – 3
Chad ................................... – – – – – – – – –
China .................................. – – – – – – – – –
Colombia ............................ – – – – – – – 248 248
Congo (Brazzaville) ............ – – – – – – – – –
Denmark ............................. – – – – – – – 14 14
Egypt .................................. – – – – – – – – –
Equatorial Guinea ............... – – – – – – – – –
Estonia ................................ – – – – – – – – –
Finland ................................ – – – – – – – 6 6
France ................................ – – – – – – – 58 58
Gabon ................................. – – – – – – – – –
Germany ............................. – – – – – – – – –
Guatemala .......................... – – – – – – – – –
India .................................... – – – – – – – – –
Indonesia ............................ – – – – – – – – –
Italy ..................................... – – – – – – – – –
Korea, South ....................... – – – – 342 – – – –
Latvia .................................. – – – – – – – – –
Lithuania ............................. – – – – – – – – –
Malaysia ............................. – – – – – – – – –
Mexico ................................ – – – – – – – 563 563
Netherlands ........................ – – – – – – – – –
Netherlands Antilles ............ – – – – – – – – –
Norway ............................... – – – – – – 6 – 6
Oman .................................. – – – – – – – – –
Portugal .............................. – – – – – – – – –
Russia ................................. – – – – – – – 1,109 1,109
Spain .................................. – – – – – – – – –
Sweden ............................... – – – – – – – – –
Syria ................................... – – – – – – – – –
Trinidad and Tobago .......... – – – – – – – 349 349
United Kingdom .................. – – – – – – – 62 62
Vietnam .............................. – – – – – – – – –
Virgin Islands, U.S. ............. – – – – – – – – –
Yemen ................................ – – – – – – – – –
Other ................................... – – – – 86 – 65 0 65
Total ....................................... – – – – 529 – 587 3,291 3,878
Persian Gulf3 ......................... – – – – 45 – – 155 155
See footnotes at end of table.
U. S. Energy Information Administration/Petroleum Supply Annual 2016, Volume 2

Table 29. PAD District 3 - Imports of Crude Oil and Petroleum Products by Country of Origin, March 2016(Thousand Barrels) — Continued
Country of Origin
Petrochemical Feedstocks
WaxesPetroleum
Coke
Asphaltand Road
Oil Lubricants
Miscellan-eous
ProductsTotal
Products
TotalCrudeOil and
Products
Daily Average
Crude Oil Products TotalNaphtha
OtherOils
OPEC ..................................... – – – – – 571 – 6,516 75,496 2,225 210 2,435Algeria ................................ – – – – – – – 3,151 3,755 19 102 121
Angola ................................ – – – – – – – 372 2,810 79 12 91
Ecuador .............................. – – – – – – – – 1,074 35 – 35
Iran ..................................... – – – – – – – – – – – –
Iraq ..................................... – – – – – – – – 8,980 290 – 290
Kuwait ................................. – – – – – – – – 2,787 90 – 90
Libya ................................... – – – – – – – – – – – –
Nigeria ................................ – – – – – – – 309 4,339 130 10 140
Qatar ................................... – – – – – 518 – 518 518 – 17 17
Saudi Arabia ....................... – – – – – – – 1,150 26,810 828 37 865
United Arab Emirates ......... – – – – – – – 151 151 – 5 5
Venezuela ........................... – – – – – – – 713 24,120 755 23 778
Non-OPEC ............................. 579 297 24 – – 399 – 14,556 57,990 1,401 470 1,871Argentina ............................ – 134 – – – 3 – 265 791 17 9 26
Aruba .................................. – – – – – – – – – – – –
Australia .............................. – – – – – – – – – – – –
Bahamas ............................ – – – – – – – – – – – –
Bahrain ............................... – – – – – 34 – 34 34 – 1 1
Belgium ............................... – – – – – 3 – 1,332 1,332 – 43 43
Brazil ................................... – – – – – – – 391 2,648 73 13 85
Brunei ................................. – – – – – – – – – – – –
Cameroon ........................... – – – – – – – – – – – –
Canada ............................... 12 – – – – – – 99 10,057 321 3 324
Chad ................................... – – – – – – – – 1,875 60 – 60
China .................................. – – – – – – – – – – – –
Colombia ............................ – – – – – – – 435 8,981 276 14 290
Congo (Brazzaville) ............ – – – – – – – – – – – –
Denmark ............................. – – – – – – – 14 14 – 0 0
Egypt .................................. – – – – – 1 – 1 1 – 0 0
Equatorial Guinea ............... – – – – – – – – – – – –
Estonia ................................ – – – – – – – – – – – –
Finland ................................ – – – – – – – 6 6 – 0 0
France ................................ – 37 – – – 3 – 184 184 – 6 6
Gabon ................................. – – – – – – – 200 200 – 6 6
Germany ............................. – – – – – 5 – 23 23 – 1 1
Guatemala .......................... – – – – – – – – 260 8 – 8
India .................................... – – – – – – – – – – – –
Indonesia ............................ – – – – – – – 152 152 – 5 5
Italy ..................................... – – – – – 17 – 210 210 – 7 7
Korea, South ....................... 38 – – – – 285 – 669 669 – 22 22
Latvia .................................. – – – – – – – – – – – –
Lithuania ............................. – – – – – – – – – – – –
Malaysia ............................. – – 20 – – – – 20 20 – 1 1
Mexico ................................ 457 – – – – – – 1,352 18,982 569 44 612
Netherlands ........................ 9 – – – – – – 200 200 – 6 6
Netherlands Antilles ............ – – – – – – – – – – – –
Norway ............................... – – – – – – – 753 1,778 33 24 57
Oman .................................. – – – – – – – – – – – –
Portugal .............................. – – – – – – – 286 286 – 9 9
Russia ................................. – – – – – – – 7,042 7,042 – 227 227
Spain .................................. – – – – – 14 – 14 14 – 0 0
Sweden ............................... – – – – – – – – – – – –
Syria ................................... – – – – – – – – – – – –
Trinidad and Tobago .......... – – – – – – – 349 349 – 11 11
United Kingdom .................. 29 – – – – – – 91 1,088 32 3 35
Vietnam .............................. – – – – – – – – – – – –
Virgin Islands, U.S. ............. – – – – – – – – – – – –
Yemen ................................ – – – – – – – – – – – –
Other ................................... 34 126 4 – – 34 – 434 794 12 15 29
Total ....................................... 579 297 24 – – 970 – 21,072 133,486 3,626 680 4,306
Persian Gulf3 ......................... – – – – – 552 – 1,853 39,280 1,207 60 1,267
–= No Data Reported.
1Crude oil and unfinished oils are reported by the PAD District in which they are to be processed; all other products are reported by the PAD District of entry.
2 Includes crude oil imported for storage in the Strategic Petroleum Reserve.
3 Includes Bahrain, Iran, Iraq, Kuwait, Qatar, Saudi Arabia, and United Arab Emirates.
Note: Totals may not equal sum of components due to independent rounding.
Source: Energy Information Administration (EIA) Form EIA-814, "Monthly Imports Report."
U. S. Energy Information Administration/Petroleum Supply Annual 2016, Volume 2
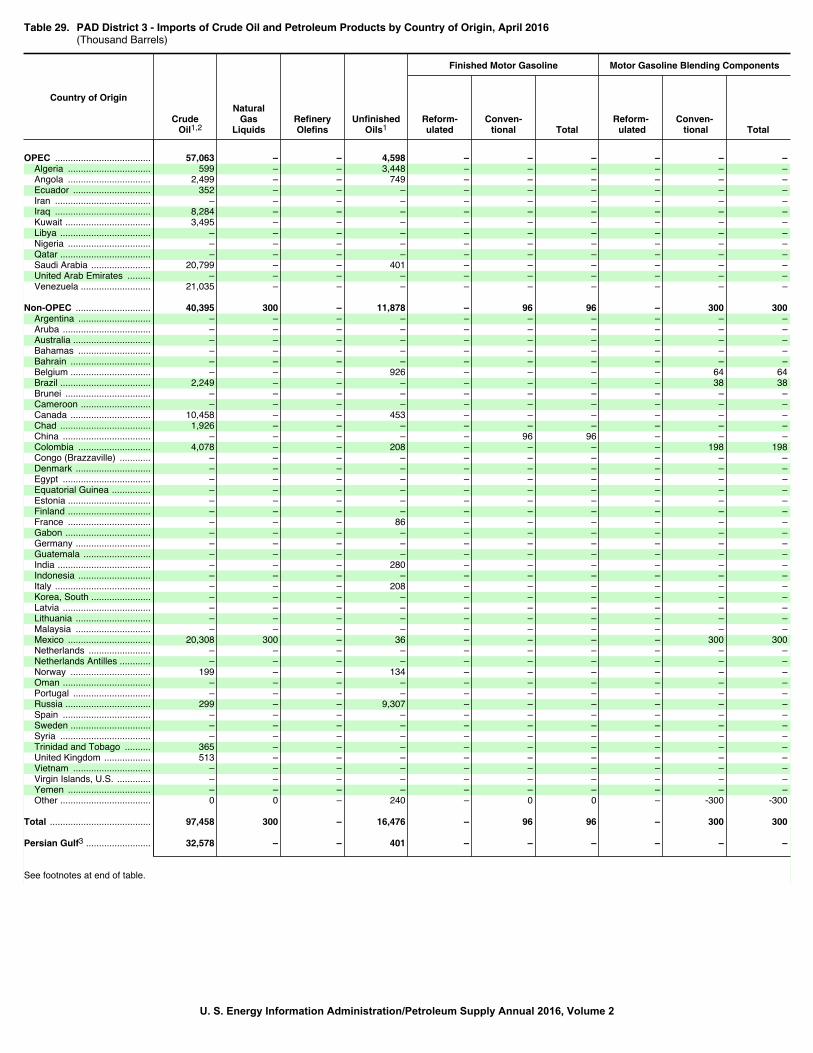
4. TABLE29.PDFTable 29. PAD District 3 - Imports of Crude Oil and Petroleum Products by Country of Origin, April 2016
(Thousand Barrels)
Country of Origin
Crude Oil1,2
NaturalGas
LiquidsRefineryOlefins
UnfinishedOils1
Finished Motor Gasoline Motor Gasoline Blending Components
Reform-ulated
Conven-tional Total
Reform- ulated
Conven- tional Total
OPEC ..................................... 57,063 – – 4,598 – – – – – –Algeria ................................ 599 – – 3,448 – – – – – –
Angola ................................ 2,499 – – 749 – – – – – –
Ecuador .............................. 352 – – – – – – – – –
Iran ..................................... – – – – – – – – – –
Iraq ..................................... 8,284 – – – – – – – – –
Kuwait ................................. 3,495 – – – – – – – – –
Libya ................................... – – – – – – – – – –
Nigeria ................................ – – – – – – – – – –
Qatar ................................... – – – – – – – – – –
Saudi Arabia ....................... 20,799 – – 401 – – – – – –
United Arab Emirates ......... – – – – – – – – – –
Venezuela ........................... 21,035 – – – – – – – – –
Non-OPEC ............................. 40,395 300 – 11,878 – 96 96 – 300 300Argentina ............................ – – – – – – – – – –
Aruba .................................. – – – – – – – – – –
Australia .............................. – – – – – – – – – –
Bahamas ............................ – – – – – – – – – –
Bahrain ............................... – – – – – – – – – –
Belgium ............................... – – – 926 – – – – 64 64
Brazil ................................... 2,249 – – – – – – – 38 38
Brunei ................................. – – – – – – – – – –
Cameroon ........................... – – – – – – – – – –
Canada ............................... 10,458 – – 453 – – – – – –
Chad ................................... 1,926 – – – – – – – – –
China .................................. – – – – – 96 96 – – –
Colombia ............................ 4,078 – – 208 – – – – 198 198
Congo (Brazzaville) ............ – – – – – – – – – –
Denmark ............................. – – – – – – – – – –
Egypt .................................. – – – – – – – – – –
Equatorial Guinea ............... – – – – – – – – – –
Estonia ................................ – – – – – – – – – –
Finland ................................ – – – – – – – – – –
France ................................ – – – 86 – – – – – –
Gabon ................................. – – – – – – – – – –
Germany ............................. – – – – – – – – – –
Guatemala .......................... – – – – – – – – – –
India .................................... – – – 280 – – – – – –
Indonesia ............................ – – – – – – – – – –
Italy ..................................... – – – 208 – – – – – –
Korea, South ....................... – – – – – – – – – –
Latvia .................................. – – – – – – – – – –
Lithuania ............................. – – – – – – – – – –
Malaysia ............................. – – – – – – – – – –
Mexico ................................ 20,308 300 – 36 – – – – 300 300
Netherlands ........................ – – – – – – – – – –
Netherlands Antilles ............ – – – – – – – – – –
Norway ............................... 199 – – 134 – – – – – –
Oman .................................. – – – – – – – – – –
Portugal .............................. – – – – – – – – – –
Russia ................................. 299 – – 9,307 – – – – – –
Spain .................................. – – – – – – – – – –
Sweden ............................... – – – – – – – – – –
Syria ................................... – – – – – – – – – –
Trinidad and Tobago .......... 365 – – – – – – – – –
United Kingdom .................. 513 – – – – – – – – –
Vietnam .............................. – – – – – – – – – –
Virgin Islands, U.S. ............. – – – – – – – – – –
Yemen ................................ – – – – – – – – – –
Other ................................... 0 0 – 240 – 0 0 – -300 -300
Total ....................................... 97,458 300 – 16,476 – 96 96 – 300 300
Persian Gulf3 ......................... 32,578 – – 401 – – – – – –
See footnotes at end of table.
U. S. Energy Information Administration/Petroleum Supply Annual 2016, Volume 2

Table 29. PAD District 3 - Imports of Crude Oil and Petroleum Products by Country of Origin, April 2016(Thousand Barrels) — Continued
Country of Origin
Oxygenates Renewable Fuels Distillate Fuel Oil
MethylTertiary
ButylEther
(MTBE)
OtherOxygen-
atesFuel
Ethanol
Biomass-BasedDiesel
OtherRenewable
Diesel
OtherRenewable
Fuels
15 ppmsulfur and
under
Greaterthan 15ppm to 500 ppm
sulfur501 to
2000 ppm
Greaterthan 2000
ppm Total
OPEC ..................................... – – – 214 – – – – – – –Algeria ................................ – – – – – – – – – – –
Angola ................................ – – – – – – – – – – –
Ecuador .............................. – – – – – – – – – – –
Iran ..................................... – – – – – – – – – – –
Iraq ..................................... – – – – – – – – – – –
Kuwait ................................. – – – – – – – – – – –
Libya ................................... – – – – – – – – – – –
Nigeria ................................ – – – – – – – – – – –
Qatar ................................... – – – – – – – – – – –
Saudi Arabia ....................... – – – – – – – – – – –
United Arab Emirates ......... – – – – – – – – – – –
Venezuela ........................... – – – – – – – – – – –
Non-OPEC ............................. 211 44 – 282 – – – – – – –Argentina ............................ – – – 252 – – – – – – –
Aruba .................................. – – – – – – – – – – –
Australia .............................. – – – 30 – – – – – – –
Bahamas ............................ – – – – – – – – – – –
Bahrain ............................... – – – – – – – – – – –
Belgium ............................... – – – – – – – – – – –
Brazil ................................... 32 44 – – – – – – – – –
Brunei ................................. – – – – – – – – – – –
Cameroon ........................... – – – – – – – – – – –
Canada ............................... – – – – – – – – – – –
Chad ................................... – – – – – – – – – – –
China .................................. – – – – – – – – – – –
Colombia ............................ – – – – – – – – – – –
Congo (Brazzaville) ............ – – – – – – – – – – –
Denmark ............................. – – – – – – – – – – –
Egypt .................................. – – – – – – – – – – –
Equatorial Guinea ............... – – – – – – – – – – –
Estonia ................................ – – – – – – – – – – –
Finland ................................ – – – – – – – – – – –
France ................................ – – – – – – – – – – –
Gabon ................................. – – – – – – – – – – –
Germany ............................. – – – – – – – – – – –
Guatemala .......................... – – – – – – – – – – –
India .................................... – – – – – – – – – – –
Indonesia ............................ – – – 214 – – – – – – –
Italy ..................................... – – – – – – – – – – –
Korea, South ....................... – – – – – – – – – – –
Latvia .................................. – – – – – – – – – – –
Lithuania ............................. – – – – – – – – – – –
Malaysia ............................. – – – – – – – – – – –
Mexico ................................ – – – – – – – – – – –
Netherlands ........................ – – – – – – – – – – –
Netherlands Antilles ............ – – – – – – – – – – –
Norway ............................... – – – – – – – – – – –
Oman .................................. – – – – – – – – – – –
Portugal .............................. – – – – – – – – – – –
Russia ................................. 179 – – – – – – – – – –
Spain .................................. – – – – – – – – – – –
Sweden ............................... – – – – – – – – – – –
Syria ................................... – – – – – – – – – – –
Trinidad and Tobago .......... – – – – – – – – – – –
United Kingdom .................. – – – – – – – – – – –
Vietnam .............................. – – – – – – – – – – –
Virgin Islands, U.S. ............. – – – – – – – – – – –
Yemen ................................ – – – – – – – – – – –
Other ................................... 0 0 – -214 – – – – – – –
Total ....................................... 211 44 – 496 – – – – – – –
Persian Gulf3 ......................... – – – – – – – – – – –
See footnotes at end of table.
U. S. Energy Information Administration/Petroleum Supply Annual 2016, Volume 2

Table 29. PAD District 3 - Imports of Crude Oil and Petroleum Products by Country of Origin, April 2016(Thousand Barrels) — Continued
Country of Origin
Kerosene
FinishedAviationGasoline
AviationGasolineBlending
Components
Kerosene-Type Jet
FuelSpecial
Naphthas
Residual Fuel Oil
Less than 0.31 % sulfur
0.31 to 1.00 % sulfur
Greater than1.00 % sulfur Total
OPEC ..................................... – – – – 45 – 292 548 840Algeria ................................ – – – – – – – – –
Angola ................................ – – – – – – – – –
Ecuador .............................. – – – – – – – – –
Iran ..................................... – – – – – – – – –
Iraq ..................................... – – – – – – – – –
Kuwait ................................. – – – – – – – – –
Libya ................................... – – – – – – 292 – 292
Nigeria ................................ – – – – – – – – –
Qatar ................................... – – – – – – – – –
Saudi Arabia ....................... – – – – 45 – – – –
United Arab Emirates ......... – – – – – – – – –
Venezuela ........................... – – – – – – – 548 548
Non-OPEC ............................. – – – – 264 40 247 1,314 1,601Argentina ............................ – – – – – – – – –
Aruba .................................. – – – – – – – – –
Australia .............................. – – – – – – – – –
Bahamas ............................ – – – – – – – – –
Bahrain ............................... – – – – – – – – –
Belgium ............................... – – – – – 40 – – 40
Brazil ................................... – – – – – – 28 – 28
Brunei ................................. – – – – – – – – –
Cameroon ........................... – – – – – – – – –
Canada ............................... – – – – 48 – – – –
Chad ................................... – – – – – – – – –
China .................................. – – – – – – – – –
Colombia ............................ – – – – – – – 439 439
Congo (Brazzaville) ............ – – – – – – – – –
Denmark ............................. – – – – – – – – –
Egypt .................................. – – – – – – – – –
Equatorial Guinea ............... – – – – – – – – –
Estonia ................................ – – – – – – – – –
Finland ................................ – – – – – – – – –
France ................................ – – – – – – – – –
Gabon ................................. – – – – – – – – –
Germany ............................. – – – – – – – – –
Guatemala .......................... – – – – – – – – –
India .................................... – – – – – – – – –
Indonesia ............................ – – – – – – – – –
Italy ..................................... – – – – – – – 295 295
Korea, South ....................... – – – – 87 – – – –
Latvia .................................. – – – – – – – – –
Lithuania ............................. – – – – – – – – –
Malaysia ............................. – – – – – – – – –
Mexico ................................ – – – – – – – 580 580
Netherlands ........................ – – – – – – – – –
Netherlands Antilles ............ – – – – – – – – –
Norway ............................... – – – – – – 219 – 219
Oman .................................. – – – – – – – – –
Portugal .............................. – – – – – – – – –
Russia ................................. – – – – – – – – –
Spain .................................. – – – – – – – – –
Sweden ............................... – – – – – – – – –
Syria ................................... – – – – – – – – –
Trinidad and Tobago .......... – – – – – – – – –
United Kingdom .................. – – – – – – – – –
Vietnam .............................. – – – – – – – – –
Virgin Islands, U.S. ............. – – – – – – – – –
Yemen ................................ – – – – – – – – –
Other ................................... – – – – 129 0 0 0 0
Total ....................................... – – – – 309 40 539 1,862 2,441
Persian Gulf3 ......................... – – – – 45 – – – –
See footnotes at end of table.
U. S. Energy Information Administration/Petroleum Supply Annual 2016, Volume 2

Table 29. PAD District 3 - Imports of Crude Oil and Petroleum Products by Country of Origin, April 2016(Thousand Barrels) — Continued
Country of Origin
Petrochemical Feedstocks
WaxesPetroleum
Coke
Asphaltand Road
Oil Lubricants
Miscellan-eous
ProductsTotal
Products
TotalCrudeOil and
Products
Daily Average
Crude Oil Products TotalNaphtha
OtherOils
OPEC ..................................... – 210 – – 72 122 – 6,101 63,164 1,902 203 2,105Algeria ................................ – – – – – – – 3,448 4,047 20 115 135
Angola ................................ – – – – – – – 749 3,248 83 25 108
Ecuador .............................. – – – – – – – – 352 12 – 12
Iran ..................................... – – – – – – – – – – – –
Iraq ..................................... – – – – – – – – 8,284 276 – 276
Kuwait ................................. – – – – – – – – 3,495 117 – 117
Libya ................................... – – – – – – – 292 292 – 10 10
Nigeria ................................ – 210 – – – – – 210 210 – 7 7
Qatar ................................... – – – – – – – – – – – –
Saudi Arabia ....................... – – – – – – – 446 21,245 693 15 708
United Arab Emirates ......... – – – – – – – – – – – –
Venezuela ........................... – – – – 72 – – 620 21,655 701 21 722
Non-OPEC ............................. 464 51 94 103 – 710 – 16,404 56,799 1,347 547 1,893Argentina ............................ – 19 – 95 – 2 – 368 368 – 12 12
Aruba .................................. – – – – – – – – – – – –
Australia .............................. – – – – – – – 30 30 – 1 1
Bahamas ............................ – – – – – – – – – – – –
Bahrain ............................... – – – – – 138 – 138 138 – 5 5
Belgium ............................... – – – – – 2 – 1,032 1,032 – 34 34
Brazil ................................... – – – – – – – 142 2,391 75 5 80
Brunei ................................. – – – – – – – – – – – –
Cameroon ........................... – – – – – – – – – – – –
Canada ............................... 3 24 – – – – – 525 10,983 349 18 366
Chad ................................... – – – – – – – – 1,926 64 – 64
China .................................. – – 55 – – – – 151 151 – 5 5
Colombia ............................ – – – – – – – 845 4,923 136 28 164
Congo (Brazzaville) ............ – – – – – – – – – – – –
Denmark ............................. – – – – – – – – – – – –
Egypt .................................. – – – – – – – – – – – –
Equatorial Guinea ............... – – – – – – – – – – – –
Estonia ................................ – – – – – – – – – – – –
Finland ................................ – – – – – – – – – – – –
France ................................ – 8 – – – 4 – 98 98 – 3 3
Gabon ................................. – – – – – – – – – – – –
Germany ............................. – – – – – 4 – 5 5 – 0 0
Guatemala .......................... – – – – – – – – – – – –
India .................................... – – – – – – – 280 280 – 9 9
Indonesia ............................ – – – – – – – 336 336 – 11 11
Italy ..................................... – – – – – 24 – 529 529 – 18 18
Korea, South ....................... – – – – – 486 – 573 573 – 19 19
Latvia .................................. – – – – – – – – – – – –
Lithuania ............................. – – – – – – – – – – – –
Malaysia ............................. – – 22 – – – – 22 22 – 1 1
Mexico ................................ 436 – – – – – – 1,352 21,660 677 45 722
Netherlands ........................ 28 – – – – – – 28 28 – 1 1
Netherlands Antilles ............ – – – – – – – – – – – –
Norway ............................... – – – – – – – 353 552 7 12 18
Oman .................................. – – – – – – – – – – – –
Portugal .............................. – – – – – – – – – – – –
Russia ................................. – – – – – – – 9,486 9,785 10 316 326
Spain .................................. – – 1 – – 21 – 22 22 – 1 1
Sweden ............................... – – – – – – – – – – – –
Syria ................................... – – – – – – – – – – – –
Trinidad and Tobago .......... – – – – – – – – 365 12 – 12
United Kingdom .................. – – – 8 – 13 – 21 534 17 1 18
Vietnam .............................. – – – – – – – – – – – –
Virgin Islands, U.S. ............. – – – – – – – – – – – –
Yemen ................................ – – – – – – – – – – – –
Other ................................... -3 0 16 0 0 16 – 68 68 0 2 3
Total ....................................... 464 261 94 103 72 832 – 22,505 119,963 3,249 750 3,999
Persian Gulf3 ......................... – – – – – 138 – 584 33,162 1,086 19 1,105
–= No Data Reported.
1Crude oil and unfinished oils are reported by the PAD District in which they are to be processed; all other products are reported by the PAD District of entry.
2 Includes crude oil imported for storage in the Strategic Petroleum Reserve.
3 Includes Bahrain, Iran, Iraq, Kuwait, Qatar, Saudi Arabia, and United Arab Emirates.
Note: Totals may not equal sum of components due to independent rounding.
Source: Energy Information Administration (EIA) Form EIA-814, "Monthly Imports Report."
U. S. Energy Information Administration/Petroleum Supply Annual 2016, Volume 2

5. TABLE29.PDFTable 29. PAD District 3 - Imports of Crude Oil and Petroleum Products by Country of Origin, May 2016
(Thousand Barrels)
Country of Origin
Crude Oil1,2
NaturalGas
LiquidsRefineryOlefins
UnfinishedOils1
Finished Motor Gasoline Motor Gasoline Blending Components
Reform-ulated
Conven-tional Total
Reform- ulated
Conven- tional Total
OPEC ..................................... 66,358 – – 3,296 – – – – 604 604Algeria ................................ – – – 2,788 – – – – – –
Angola ................................ 2,140 – – – – – – – – –
Ecuador .............................. 684 – – – – – – – – –
Iran ..................................... – – – – – – – – – –
Iraq ..................................... 12,484 – – – – – – – – –
Kuwait ................................. 2,742 – – – – – – – – –
Libya ................................... – – – 508 – – – – – –
Nigeria ................................ 942 – – – – – – – 209 209
Qatar ................................... – – – – – – – – – –
Saudi Arabia ....................... 24,498 – – – – – – – – –
United Arab Emirates ......... – – – – – – – – – –
Venezuela ........................... 22,868 – – – – – – – 395 395
Non-OPEC ............................. 45,398 600 30 12,765 – – – – 635 635Argentina ............................ – – – – – – – – – –
Aruba .................................. – – – – – – – – – –
Australia .............................. – – – – – – – – – –
Bahamas ............................ – – – – – – – – – –
Bahrain ............................... – – – – – – – – – –
Belgium ............................... – – – 1,345 – – – – 262 262
Brazil ................................... 1,983 – – 96 – – – – 53 53
Brunei ................................. – – – – – – – – – –
Cameroon ........................... – – – 178 – – – – – –
Canada ............................... 11,889 – – 54 – – – – 217 217
Chad ................................... 3,315 – – – – – – – – –
China .................................. – – – – – – – – – –
Colombia ............................ 8,481 – – – – – – – 103 103
Congo (Brazzaville) ............ – – – – – – – – – –
Denmark ............................. – – – – – – – – – –
Egypt .................................. 918 – – – – – – – – –
Equatorial Guinea ............... – – – – – – – – – –
Estonia ................................ – – – – – – – – – –
Finland ................................ – – – – – – – – – –
France ................................ – – – 903 – – – – – –
Gabon ................................. – – – – – – – – – –
Germany ............................. – – – – – – – – – –
Guatemala .......................... 542 – – – – – – – – –
India .................................... – – – 185 – – – – – –
Indonesia ............................ – – – – – – – – – –
Italy ..................................... – – – 442 – – – – – –
Korea, South ....................... – – – – – – – – – –
Latvia .................................. – – – – – – – – – –
Lithuania ............................. – – – – – – – – – –
Malaysia ............................. – – – – – – – – – –
Mexico ................................ 17,043 600 30 – – – – – – –
Netherlands ........................ – – – – – – – – – –
Netherlands Antilles ............ – – – – – – – – – –
Norway ............................... – – – 352 – – – – – –
Oman .................................. – – – – – – – – – –
Portugal .............................. – – – – – – – – – –
Russia ................................. 356 – – 8,801 – – – – – –
Spain .................................. – – – – – – – – – –
Sweden ............................... – – – – – – – – – –
Syria ................................... – – – – – – – – – –
Trinidad and Tobago .......... 360 – – – – – – – – –
United Kingdom .................. – – – – – – – – – –
Vietnam .............................. – – – – – – – – – –
Virgin Islands, U.S. ............. – – – – – – – – – –
Yemen ................................ – – – – – – – – – –
Other ................................... 511 0 0 409 – – – – 0 0
Total ....................................... 111,756 600 30 16,061 – – – – 1,239 1,239
Persian Gulf3 ......................... 39,724 – – – – – – – – –
See footnotes at end of table.
U. S. Energy Information Administration/Petroleum Supply Annual 2016, Volume 2

Table 29. PAD District 3 - Imports of Crude Oil and Petroleum Products by Country of Origin, May 2016(Thousand Barrels) — Continued
Country of Origin
Oxygenates Renewable Fuels Distillate Fuel Oil
MethylTertiary
ButylEther
(MTBE)
OtherOxygen-
atesFuel
Ethanol
Biomass-BasedDiesel
OtherRenewable
Diesel
OtherRenewable
Fuels
15 ppmsulfur and
under
Greaterthan 15ppm to 500 ppm
sulfur501 to
2000 ppm
Greaterthan 2000
ppm Total
OPEC ..................................... – – – 320 – – – – – – –Algeria ................................ – – – – – – – – – – –
Angola ................................ – – – – – – – – – – –
Ecuador .............................. – – – – – – – – – – –
Iran ..................................... – – – – – – – – – – –
Iraq ..................................... – – – – – – – – – – –
Kuwait ................................. – – – – – – – – – – –
Libya ................................... – – – – – – – – – – –
Nigeria ................................ – – – – – – – – – – –
Qatar ................................... – – – – – – – – – – –
Saudi Arabia ....................... – – – – – – – – – – –
United Arab Emirates ......... – – – – – – – – – – –
Venezuela ........................... – – – – – – – – – – –
Non-OPEC ............................. 101 88 – 256 – – – – 220 – 220Argentina ............................ – – – 256 – – – – – – –
Aruba .................................. – – – – – – – – – – –
Australia .............................. – – – – – – – – – – –
Bahamas ............................ – – – – – – – – – – –
Bahrain ............................... – – – – – – – – – – –
Belgium ............................... – – – – – – – – – – –
Brazil ................................... 10 88 – – – – – – – – –
Brunei ................................. – – – – – – – – – – –
Cameroon ........................... – – – – – – – – – – –
Canada ............................... – – – – – – – – – – –
Chad ................................... – – – – – – – – – – –
China .................................. – – – – – – – – – – –
Colombia ............................ – – – – – – – – – – –
Congo (Brazzaville) ............ – – – – – – – – – – –
Denmark ............................. – – – – – – – – – – –
Egypt .................................. – – – – – – – – – – –
Equatorial Guinea ............... – – – – – – – – – – –
Estonia ................................ – – – – – – – – – – –
Finland ................................ – – – – – – – – – – –
France ................................ – – – – – – – – – – –
Gabon ................................. – – – – – – – – – – –
Germany ............................. – – – – – – – – – – –
Guatemala .......................... – – – – – – – – – – –
India .................................... – – – – – – – – – – –
Indonesia ............................ – – – 320 – – – – – – –
Italy ..................................... – – – – – – – – – – –
Korea, South ....................... – – – – – – – – – – –
Latvia .................................. – – – – – – – – – – –
Lithuania ............................. – – – – – – – – – – –
Malaysia ............................. – – – – – – – – – – –
Mexico ................................ – – – – – – – – 220 – 220
Netherlands ........................ – – – – – – – – – – –
Netherlands Antilles ............ – – – – – – – – – – –
Norway ............................... – – – – – – – – – – –
Oman .................................. – – – – – – – – – – –
Portugal .............................. – – – – – – – – – – –
Russia ................................. 91 – – – – – – – – – –
Spain .................................. – – – – – – – – – – –
Sweden ............................... – – – – – – – – – – –
Syria ................................... – – – – – – – – – – –
Trinidad and Tobago .......... – – – – – – – – – – –
United Kingdom .................. – – – – – – – – – – –
Vietnam .............................. – – – – – – – – – – –
Virgin Islands, U.S. ............. – – – – – – – – – – –
Yemen ................................ – – – – – – – – – – –
Other ................................... 0 0 – -320 – – – – 0 – 0
Total ....................................... 101 88 – 576 – – – – 220 – 220
Persian Gulf3 ......................... – – – – – – – – – – –
See footnotes at end of table.
U. S. Energy Information Administration/Petroleum Supply Annual 2016, Volume 2

Table 29. PAD District 3 - Imports of Crude Oil and Petroleum Products by Country of Origin, May 2016(Thousand Barrels) — Continued
Country of Origin
Kerosene
FinishedAviationGasoline
AviationGasolineBlending
Components
Kerosene-Type Jet
FuelSpecial
Naphthas
Residual Fuel Oil
Less than 0.31 % sulfur
0.31 to 1.00 % sulfur
Greater than1.00 % sulfur Total
OPEC ..................................... – – – – 43 – – – –Algeria ................................ – – – – – – – – –
Angola ................................ – – – – – – – – –
Ecuador .............................. – – – – – – – – –
Iran ..................................... – – – – – – – – –
Iraq ..................................... – – – – – – – – –
Kuwait ................................. – – – – – – – – –
Libya ................................... – – – – – – – – –
Nigeria ................................ – – – – – – – – –
Qatar ................................... – – – – – – – – –
Saudi Arabia ....................... – – – – 43 – – – –
United Arab Emirates ......... – – – – – – – – –
Venezuela ........................... – – – – – – – – –
Non-OPEC ............................. – – – – 547 – 205 1,577 1,782Argentina ............................ – – – – – – – – –
Aruba .................................. – – – – – – – – –
Australia .............................. – – – – – – – – –
Bahamas ............................ – – – – – – – – –
Bahrain ............................... – – – – – – – – –
Belgium ............................... – – – – – – – – –
Brazil ................................... – – – – – – 95 – 95
Brunei ................................. – – – – – – – – –
Cameroon ........................... – – – – – – – – –
Canada ............................... – – – – 82 – – – –
Chad ................................... – – – – – – – – –
China .................................. – – – – – – – – –
Colombia ............................ – – – – – – – – –
Congo (Brazzaville) ............ – – – – – – – – –
Denmark ............................. – – – – – – – – –
Egypt .................................. – – – – – – – – –
Equatorial Guinea ............... – – – – – – – – –
Estonia ................................ – – – – – – – – –
Finland ................................ – – – – – – – – –
France ................................ – – – – – – 110 – 110
Gabon ................................. – – – – – – – – –
Germany ............................. – – – – – – – – –
Guatemala .......................... – – – – – – – – –
India .................................... – – – – – – – – –
Indonesia ............................ – – – – – – – – –
Italy ..................................... – – – – – – – – –
Korea, South ....................... – – – – 209 – – – –
Latvia .................................. – – – – – – – – –
Lithuania ............................. – – – – – – – – –
Malaysia ............................. – – – – – – – – –
Mexico ................................ – – – – – – – 670 670
Netherlands ........................ – – – – – – – – –
Netherlands Antilles ............ – – – – – – – – –
Norway ............................... – – – – – – – – –
Oman .................................. – – – – – – – – –
Portugal .............................. – – – – – – – – –
Russia ................................. – – – – – – – 907 907
Spain .................................. – – – – – – – – –
Sweden ............................... – – – – – – – – –
Syria ................................... – – – – – – – – –
Trinidad and Tobago .......... – – – – – – – – –
United Kingdom .................. – – – – – – – – –
Vietnam .............................. – – – – – – – – –
Virgin Islands, U.S. ............. – – – – – – – – –
Yemen ................................ – – – – – – – – –
Other ................................... – – – – 256 – 0 0 0
Total ....................................... – – – – 590 – 205 1,577 1,782
Persian Gulf3 ......................... – – – – 43 – – – –
See footnotes at end of table.
U. S. Energy Information Administration/Petroleum Supply Annual 2016, Volume 2

Table 29. PAD District 3 - Imports of Crude Oil and Petroleum Products by Country of Origin, May 2016(Thousand Barrels) — Continued
Country of Origin
Petrochemical Feedstocks
WaxesPetroleum
Coke
Asphaltand Road
Oil Lubricants
Miscellan-eous
ProductsTotal
Products
TotalCrudeOil and
Products
Daily Average
Crude Oil Products TotalNaphtha
OtherOils
OPEC ..................................... – – – – – 317 – 4,580 70,938 2,141 148 2,288Algeria ................................ – – – – – – – 2,788 2,788 – 90 90
Angola ................................ – – – – – – – – 2,140 69 – 69
Ecuador .............................. – – – – – – – – 684 22 – 22
Iran ..................................... – – – – – – – – – – – –
Iraq ..................................... – – – – – – – – 12,484 403 – 403
Kuwait ................................. – – – – – – – – 2,742 88 – 88
Libya ................................... – – – – – – – 508 508 – 16 16
Nigeria ................................ – – – – – – – 209 1,151 30 7 37
Qatar ................................... – – – – – 317 – 317 317 – 10 10
Saudi Arabia ....................... – – – – – – – 43 24,541 790 1 792
United Arab Emirates ......... – – – – – – – – – – – –
Venezuela ........................... – – – – – – – 395 23,263 738 13 750
Non-OPEC ............................. 560 63 29 – – 551 – 18,233 63,631 1,464 588 2,053Argentina ............................ – 32 – – – 2 – 290 290 – 9 9
Aruba .................................. – – – – – – – – – – – –
Australia .............................. – – – – – – – – – – – –
Bahamas ............................ – – – – – – – – – – – –
Bahrain ............................... – – – – – 135 – 135 135 – 4 4
Belgium ............................... – – – – – 6 – 1,613 1,613 – 52 52
Brazil ................................... 40 – – – – – – 382 2,365 64 12 76
Brunei ................................. – – – – – – – – – – – –
Cameroon ........................... – – – – – – – 178 178 – 6 6
Canada ............................... 22 42 – – – – – 353 12,242 384 11 395
Chad ................................... – – – – – – – – 3,315 107 – 107
China .................................. – – 5 – – – – 5 5 – 0 0
Colombia ............................ – – – – – – – 103 8,584 274 3 277
Congo (Brazzaville) ............ – – – – – – – – – – – –
Denmark ............................. – – – – – – – – – – – –
Egypt .................................. – – – – – – – – 918 30 – 30
Equatorial Guinea ............... – – – – – – – – – – – –
Estonia ................................ – – – – – – – – – – – –
Finland ................................ – – – – – – – – – – – –
France ................................ 15 9 – – – 4 – 1,041 1,041 – 34 34
Gabon ................................. – – – – – – – – – – – –
Germany ............................. – – – – – 3 – 5 5 – 0 0
Guatemala .......................... – – – – – – – – 542 17 – 17
India .................................... – – – – – – – 185 185 – 6 6
Indonesia ............................ – – – – – – – 320 320 – 10 10
Italy ..................................... – – – – – 5 – 448 448 – 14 14
Korea, South ....................... – – – – – 351 – 560 560 – 18 18
Latvia .................................. – – – – – – – – – – – –
Lithuania ............................. – – – – – – – – – – – –
Malaysia ............................. – – 24 – – – – 24 24 – 1 1
Mexico ................................ 430 – – – – – – 1,950 18,993 550 63 613
Netherlands ........................ 7 22 – – – – – 22 22 – 1 1
Netherlands Antilles ............ – – – – – – – – – – – –
Norway ............................... – – – – – – – 352 352 – 11 11
Oman .................................. – – – – – – – – – – – –
Portugal .............................. – – – – – – – – – – – –
Russia ................................. – – – – – – – 9,799 10,155 11 316 328
Spain .................................. – – – – – 27 – 27 27 – 1 1
Sweden ............................... – – – – – – – – – – – –
Syria ................................... – – – – – – – – – – – –
Trinidad and Tobago .......... – – – – – – – – 360 12 – 12
United Kingdom .................. 6 – – – – 5 – 11 11 – 0 0
Vietnam .............................. – – – – – – – – – – – –
Virgin Islands, U.S. ............. – – – – – – – – – – – –
Yemen ................................ – – – – – – – – – – – –
Other ................................... 40 -42 0 – – 13 – 430 941 15 16 31
Total ....................................... 560 63 29 – – 868 – 22,813 134,569 3,605 736 4,341
Persian Gulf3 ......................... – – – – – 452 – 495 40,219 1,281 16 1,297
–= No Data Reported.
1Crude oil and unfinished oils are reported by the PAD District in which they are to be processed; all other products are reported by the PAD District of entry.
2 Includes crude oil imported for storage in the Strategic Petroleum Reserve.
3 Includes Bahrain, Iran, Iraq, Kuwait, Qatar, Saudi Arabia, and United Arab Emirates.
Note: Totals may not equal sum of components due to independent rounding.
Source: Energy Information Administration (EIA) Form EIA-814, "Monthly Imports Report."
U. S. Energy Information Administration/Petroleum Supply Annual 2016, Volume 2

6. TABLE29.PDFTable 29. PAD District 3 - Imports of Crude Oil and Petroleum Products by Country of Origin, June 2016
(Thousand Barrels)
Country of Origin
Crude Oil1,2
NaturalGas
LiquidsRefineryOlefins
UnfinishedOils1
Finished Motor Gasoline Motor Gasoline Blending Components
Reform-ulated
Conven-tional Total
Reform- ulated
Conven- tional Total
OPEC ..................................... 55,521 – – 3,240 – – – – 696 696Algeria ................................ 1,253 – – 3,240 – – – – – –
Angola ................................ 1,804 – – – – – – – – –
Ecuador .............................. 523 – – – – – – – – –
Iran ..................................... – – – – – – – – – –
Iraq ..................................... 8,958 – – – – – – – – –
Kuwait ................................. 1,962 – – – – – – – – –
Libya ................................... – – – – – – – – – –
Nigeria ................................ – – – – – – – – 258 258
Qatar ................................... – – – – – – – – – –
Saudi Arabia ....................... 21,676 – – – – – – – – –
United Arab Emirates ......... – – – – – – – – – –
Venezuela ........................... 19,345 – – – – – – – 438 438
Non-OPEC ............................. 43,370 1,522 43 11,751 – 65 65 – 545 545Argentina ............................ 358 – – – – – – – – –
Aruba .................................. – – – – – – – – – –
Australia .............................. – – – – – – – – – –
Bahamas ............................ – – – – – – – – – –
Bahrain ............................... – – – – – – – – – –
Belgium ............................... – – – 926 – – – – – –
Brazil ................................... 2,781 – – – – 65 65 – 351 351
Brunei ................................. – – – – – – – – – –
Cameroon ........................... – – – – – – – – – –
Canada ............................... 10,296 – – – – – – – – –
Chad ................................... 1,146 – – – – – – – – –
China .................................. – – – – – – – – – –
Colombia ............................ 10,363 – – – – – – – 114 114
Congo (Brazzaville) ............ – – – – – – – – – –
Denmark ............................. – – – – – – – – – –
Egypt .................................. – – – – – – – – – –
Equatorial Guinea ............... – – – – – – – – – –
Estonia ................................ – – – – – – – – – –
Finland ................................ – – – – – – – – – –
France ................................ – – – 700 – – – – 25 25
Gabon ................................. – – – 2 – – – – – –
Germany ............................. – – – – – – – – – –
Guatemala .......................... – – – – – – – – – –
India .................................... – – – – – – – – – –
Indonesia ............................ – – – – – – – – – –
Italy ..................................... – – – – – – – – – –
Korea, South ....................... – – – 214 – – – – – –
Latvia .................................. – – – – – – – – – –
Lithuania ............................. – – – – – – – – – –
Malaysia ............................. – – – – – – – – – –
Mexico ................................ 17,946 1,522 – 180 – – – – 1,522 1,522
Netherlands ........................ – – 43 – – – – – – –
Netherlands Antilles ............ – – – – – – – – – –
Norway ............................... – – – 369 – – – – – –
Oman .................................. – – – – – – – – – –
Portugal .............................. – – – – – – – – – –
Russia ................................. 181 – – 8,157 – – – – – –
Spain .................................. – – – 228 – – – – – –
Sweden ............................... – – – – – – – – – –
Syria ................................... – – – – – – – – – –
Trinidad and Tobago .......... – – – – – – – – – –
United Kingdom .................. 299 – – 37 – – – – – –
Vietnam .............................. – – – – – – – – – –
Virgin Islands, U.S. ............. – – – – – – – – – –
Yemen ................................ – – – – – – – – – –
Other ................................... 0 0 0 938 – 0 0 – -1,467 -1,467
Total ....................................... 98,891 1,522 43 14,991 – 65 65 – 1,241 1,241
Persian Gulf3 ......................... 32,596 – – – – – – – – –
See footnotes at end of table.
U. S. Energy Information Administration/Petroleum Supply Annual 2016, Volume 2

Table 29. PAD District 3 - Imports of Crude Oil and Petroleum Products by Country of Origin, June 2016(Thousand Barrels) — Continued
Country of Origin
Oxygenates Renewable Fuels Distillate Fuel Oil
MethylTertiary
ButylEther
(MTBE)
OtherOxygen-
atesFuel
Ethanol
Biomass-BasedDiesel
OtherRenewable
Diesel
OtherRenewable
Fuels
15 ppmsulfur and
under
Greaterthan 15ppm to 500 ppm
sulfur501 to
2000 ppm
Greaterthan 2000
ppm Total
OPEC ..................................... – – – 301 – – – – – – –Algeria ................................ – – – – – – – – – – –
Angola ................................ – – – – – – – – – – –
Ecuador .............................. – – – – – – – – – – –
Iran ..................................... – – – – – – – – – – –
Iraq ..................................... – – – – – – – – – – –
Kuwait ................................. – – – – – – – – – – –
Libya ................................... – – – – – – – – – – –
Nigeria ................................ – – – – – – – – – – –
Qatar ................................... – – – – – – – – – – –
Saudi Arabia ....................... – – – – – – – – – – –
United Arab Emirates ......... – – – – – – – – – – –
Venezuela ........................... – – – – – – – – – – –
Non-OPEC ............................. 323 87 – 341 – – – – – – –Argentina ............................ – – – 341 – – – – – – –
Aruba .................................. – – – – – – – – – – –
Australia .............................. – – – – – – – – – – –
Bahamas ............................ – – – – – – – – – – –
Bahrain ............................... – – – – – – – – – – –
Belgium ............................... 53 – – – – – – – – – –
Brazil ................................... 149 87 – – – – – – – – –
Brunei ................................. – – – – – – – – – – –
Cameroon ........................... – – – – – – – – – – –
Canada ............................... – – – – – – – – – – –
Chad ................................... – – – – – – – – – – –
China .................................. – – – – – – – – – – –
Colombia ............................ – – – – – – – – – – –
Congo (Brazzaville) ............ – – – – – – – – – – –
Denmark ............................. – – – – – – – – – – –
Egypt .................................. – – – – – – – – – – –
Equatorial Guinea ............... – – – – – – – – – – –
Estonia ................................ – – – – – – – – – – –
Finland ................................ – – – – – – – – – – –
France ................................ – – – – – – – – – – –
Gabon ................................. – – – – – – – – – – –
Germany ............................. 61 – – – – – – – – – –
Guatemala .......................... – – – – – – – – – – –
India .................................... – – – – – – – – – – –
Indonesia ............................ – – – 301 – – – – – – –
Italy ..................................... – – – – – – – – – – –
Korea, South ....................... – – – – – – – – – – –
Latvia .................................. – – – – – – – – – – –
Lithuania ............................. – – – – – – – – – – –
Malaysia ............................. – – – – – – – – – – –
Mexico ................................ – – – – – – – – – – –
Netherlands ........................ 60 – – – – – – – – – –
Netherlands Antilles ............ – – – – – – – – – – –
Norway ............................... – – – – – – – – – – –
Oman .................................. – – – – – – – – – – –
Portugal .............................. – – – – – – – – – – –
Russia ................................. – – – – – – – – – – –
Spain .................................. – – – – – – – – – – –
Sweden ............................... – – – – – – – – – – –
Syria ................................... – – – – – – – – – – –
Trinidad and Tobago .......... – – – – – – – – – – –
United Kingdom .................. – – – – – – – – – – –
Vietnam .............................. – – – – – – – – – – –
Virgin Islands, U.S. ............. – – – – – – – – – – –
Yemen ................................ – – – – – – – – – – –
Other ................................... 0 0 – -301 – – – – – – –
Total ....................................... 323 87 – 642 – – – – – – –
Persian Gulf3 ......................... – – – – – – – – – – –
See footnotes at end of table.
U. S. Energy Information Administration/Petroleum Supply Annual 2016, Volume 2

Table 29. PAD District 3 - Imports of Crude Oil and Petroleum Products by Country of Origin, June 2016(Thousand Barrels) — Continued
Country of Origin
Kerosene
FinishedAviationGasoline
AviationGasolineBlending
Components
Kerosene-Type Jet
FuelSpecial
Naphthas
Residual Fuel Oil
Less than 0.31 % sulfur
0.31 to 1.00 % sulfur
Greater than1.00 % sulfur Total
OPEC ..................................... – – – – 75 – 5 1,066 1,071Algeria ................................ – – – – – – – – –
Angola ................................ – – – – – – – – –
Ecuador .............................. – – – – – – – – –
Iran ..................................... – – – – – – – – –
Iraq ..................................... – – – – – – – – –
Kuwait ................................. – – – – – – – – –
Libya ................................... – – – – – – – – –
Nigeria ................................ – – – – – – – – –
Qatar ................................... – – – – – – – – –
Saudi Arabia ....................... – – – – 75 – 5 – 5
United Arab Emirates ......... – – – – – – – – –
Venezuela ........................... – – – – – – – 1,066 1,066
Non-OPEC ............................. – – – – 233 18 334 2,100 2,452Argentina ............................ – – – – – – – – –
Aruba .................................. – – – – – – – – –
Australia .............................. – – – – – – – – –
Bahamas ............................ – – – – – – – – –
Bahrain ............................... – – – – – – – – –
Belgium ............................... – – – – – – – – –
Brazil ................................... – – – – 28 – – – –
Brunei ................................. – – – – – – – – –
Cameroon ........................... – – – – – – – – –
Canada ............................... – – – – 164 – – – –
Chad ................................... – – – – – – – – –
China .................................. – – – – – – – – –
Colombia ............................ – – – – – – – 806 806
Congo (Brazzaville) ............ – – – – – – – – –
Denmark ............................. – – – – – – – – –
Egypt .................................. – – – – – – – – –
Equatorial Guinea ............... – – – – – – – – –
Estonia ................................ – – – – – – – – –
Finland ................................ – – – – – – – – –
France ................................ – – – – – – – – –
Gabon ................................. – – – – – – – – –
Germany ............................. – – – – – – – – –
Guatemala .......................... – – – – – – – – –
India .................................... – – – – – – – – –
Indonesia ............................ – – – – – – – – –
Italy ..................................... – – – – – – – – –
Korea, South ....................... – – – – 41 – – – –
Latvia .................................. – – – – – – – – –
Lithuania ............................. – – – – – – – – –
Malaysia ............................. – – – – – – – – –
Mexico ................................ – – – – – – – 856 856
Netherlands ........................ – – – – – – – – –
Netherlands Antilles ............ – – – – – – – – –
Norway ............................... – – – – – – – – –
Oman .................................. – – – – – – – – –
Portugal .............................. – – – – – – – – –
Russia ................................. – – – – – – 64 438 502
Spain .................................. – – – – – – – – –
Sweden ............................... – – – – – – – – –
Syria ................................... – – – – – – – – –
Trinidad and Tobago .......... – – – – – – – – –
United Kingdom .................. – – – – – – – – –
Vietnam .............................. – – – – – – – – –
Virgin Islands, U.S. ............. – – – – – – – – –
Yemen ................................ – – – – – – – – –
Other ................................... – – – – 0 18 270 0 288
Total ....................................... – – – – 308 18 339 3,166 3,523
Persian Gulf3 ......................... – – – – 75 – 5 – 5
See footnotes at end of table.
U. S. Energy Information Administration/Petroleum Supply Annual 2016, Volume 2

Table 29. PAD District 3 - Imports of Crude Oil and Petroleum Products by Country of Origin, June 2016(Thousand Barrels) — Continued
Country of Origin
Petrochemical Feedstocks
WaxesPetroleum
Coke
Asphaltand Road
Oil Lubricants
Miscellan-eous
ProductsTotal
Products
TotalCrudeOil and
Products
Daily Average
Crude Oil Products TotalNaphtha
OtherOils
OPEC ..................................... 380 – – – – 399 – 6,162 61,683 1,851 205 2,056Algeria ................................ – – – – – – – 3,240 4,493 42 108 150
Angola ................................ – – – – – – – – 1,804 60 – 60
Ecuador .............................. – – – – – – – – 523 17 – 17
Iran ..................................... – – – – – – – – – – – –
Iraq ..................................... – – – – – – – – 8,958 299 – 299
Kuwait ................................. – – – – – – – – 1,962 65 – 65
Libya ................................... – – – – – – – – – – – –
Nigeria ................................ – – – – – – – 258 258 – 9 9
Qatar ................................... – – – – – 300 – 300 300 – 10 10
Saudi Arabia ....................... 380 – – – – – – 460 22,136 723 15 738
United Arab Emirates ......... – – – – – – – – – – – –
Venezuela ........................... – – – – – – – 1,504 20,849 645 50 695
Non-OPEC ............................. 402 11 15 84 – 386 – 18,263 61,633 1,446 609 2,054Argentina ............................ – – – – – 2 – 343 701 12 11 23
Aruba .................................. – – – – – – – – – – – –
Australia .............................. – – – – – – – – – – – –
Bahamas ............................ – – – – – – – – – – – –
Bahrain ............................... – – – – – – – – – – – –
Belgium ............................... – – – – – 8 – 987 987 – 33 33
Brazil ................................... – – – – – – – 680 3,461 93 23 115
Brunei ................................. – – – – – – – – – – – –
Cameroon ........................... – – – – – – – – – – – –
Canada ............................... – – – – – – – 164 10,460 343 5 349
Chad ................................... – – – – – – – – 1,146 38 – 38
China .................................. – – – – – – – – – – – –
Colombia ............................ – – – – – – – 920 11,283 345 31 376
Congo (Brazzaville) ............ – – – – – – – – – – – –
Denmark ............................. – – – – – – – – – – – –
Egypt .................................. – – – – – – – – – – – –
Equatorial Guinea ............... – – – – – – – – – – – –
Estonia ................................ – – – – – – – – – – – –
Finland ................................ – – – – – – – – – – – –
France ................................ – 11 – – – 2 – 738 738 – 25 25
Gabon ................................. – – – – – – – 2 2 – 0 0
Germany ............................. – – – – – 4 – 65 65 – 2 2
Guatemala .......................... – – – – – – – – – – – –
India .................................... – – – – – – – – – – – –
Indonesia ............................ – – – – – – – 400 400 – 13 13
Italy ..................................... – – – – – 36 – 37 37 – 1 1
Korea, South ....................... – – – – – 296 – 551 551 – 18 18
Latvia .................................. – – – – – – – – – – – –
Lithuania ............................. – – – – – – – – – – – –
Malaysia ............................. – – 15 – – – – 15 15 – 1 1
Mexico ................................ 373 – – – – – – 2,931 20,877 598 98 696
Netherlands ........................ – – – – – – – 103 103 – 3 3
Netherlands Antilles ............ – – – – – – – – – – – –
Norway ............................... – – – 84 – – – 453 453 – 15 15
Oman .................................. – – – – – – – – – – – –
Portugal .............................. – – – – – – – – – – – –
Russia ................................. – – – – – – – 8,659 8,840 6 289 295
Spain .................................. – – – – – – – 228 228 – 8 8
Sweden ............................... – – – – – – – – – – – –
Syria ................................... – – – – – – – – – – – –
Trinidad and Tobago .......... – – – – – – – – – – – –
United Kingdom .................. 29 – – – – 14 – 80 379 10 3 13
Vietnam .............................. – – – – – – – – – – – –
Virgin Islands, U.S. ............. – – – – – – – – – – – –
Yemen ................................ – – – – – – – – – – – –
Other ................................... 0 0 0 0 – 24 – 907 907 1 30 30
Total ....................................... 782 11 15 84 – 785 – 24,425 123,316 3,296 814 4,111
Persian Gulf3 ......................... 380 – – – – 300 – 760 33,356 1,087 25 1,112
–= No Data Reported.
1Crude oil and unfinished oils are reported by the PAD District in which they are to be processed; all other products are reported by the PAD District of entry.
2 Includes crude oil imported for storage in the Strategic Petroleum Reserve.
3 Includes Bahrain, Iran, Iraq, Kuwait, Qatar, Saudi Arabia, and United Arab Emirates.
Note: Totals may not equal sum of components due to independent rounding.
Source: Energy Information Administration (EIA) Form EIA-814, "Monthly Imports Report."
U. S. Energy Information Administration/Petroleum Supply Annual 2016, Volume 2

7. TABLE29.PDFTable 29. PAD District 3 - Imports of Crude Oil and Petroleum Products by Country of Origin, July 2016
(Thousand Barrels)
Country of Origin
Crude Oil1,2
NaturalGas
LiquidsRefineryOlefins
UnfinishedOils1
Finished Motor Gasoline Motor Gasoline Blending Components
Reform-ulated
Conven-tional Total
Reform- ulated
Conven- tional Total
OPEC ..................................... 69,031 – – 4,542 – – – – 536 536Algeria ................................ 1,191 – – 2,782 – – – – – –
Angola ................................ 2,935 – – 385 – – – – – –
Ecuador .............................. 854 – – – – – – – – –
Iran ..................................... – – – – – – – – – –
Iraq ..................................... 9,629 – – 323 – – – – – –
Kuwait ................................. 6,948 – – – – – – – – –
Libya ................................... – – – – – – – – – –
Nigeria ................................ 1,603 – – – – – – – 100 100
Qatar ................................... – – – – – – – – – –
Saudi Arabia ....................... 19,887 – – – – – – – – –
United Arab Emirates ......... – – – 531 – – – – – –
Venezuela ........................... 25,984 – – 521 – – – – 436 436
Non-OPEC ............................. 44,602 700 33 11,633 – 290 290 – 872 872Argentina ............................ – – – – – – – – 38 38
Aruba .................................. – – – – – – – – – –
Australia .............................. 656 – – – – – – – – –
Bahamas ............................ – – – – – – – – – –
Bahrain ............................... – – – – – – – – – –
Belgium ............................... – – – 1,725 – – – – – –
Brazil ................................... 2,582 – – – – – – – 49 49
Brunei ................................. – – – – – – – – – –
Cameroon ........................... – – – – – – – – – –
Canada ............................... 10,100 – – – – 290 290 – – –
Chad ................................... – – – – – – – – – –
China .................................. – – – – – – – – – –
Colombia ............................ 8,204 – – – – – – – – –
Congo (Brazzaville) ............ – – – – – – – – – –
Denmark ............................. 627 – – – – – – – – –
Egypt .................................. 1,396 – – – – – – – – –
Equatorial Guinea ............... – – – – – – – – – –
Estonia ................................ – – – – – – – – – –
Finland ................................ – – – – – – – – – –
France ................................ – – – 671 – – – – – –
Gabon ................................. – – – – – – – – – –
Germany ............................. – – – 174 – – – – – –
Guatemala .......................... 257 – – – – – – – – –
India .................................... – – – 288 – – – – 90 90
Indonesia ............................ – – – – – – – – – –
Italy ..................................... – – – – – – – – – –
Korea, South ....................... – – – – – – – – – –
Latvia .................................. – – – – – – – – – –
Lithuania ............................. – – – – – – – – – –
Malaysia ............................. – – – – – – – – – –
Mexico ................................ 19,369 700 33 – – – – – – –
Netherlands ........................ – – – 485 – – – – – –
Netherlands Antilles ............ – – – – – – – – – –
Norway ............................... – – – 370 – – – – 9 9
Oman .................................. – – – – – – – – – –
Portugal .............................. – – – – – – – – – –
Russia ................................. 529 – – 7,234 – – – – 258 258
Spain .................................. – – – – – – – – – –
Sweden ............................... – – – 166 – – – – – –
Syria ................................... – – – – – – – – – –
Trinidad and Tobago .......... – – – – – – – – – –
United Kingdom .................. – – – – – – – – 78 78
Vietnam .............................. – – – – – – – – – –
Virgin Islands, U.S. ............. – – – – – – – – – –
Yemen ................................ – – – – – – – – – –
Other ................................... 882 0 0 520 – 0 0 – 350 350
Total ....................................... 113,633 700 33 16,175 – 290 290 – 1,408 1,408
Persian Gulf3 ......................... 36,464 – – 854 – – – – – –
See footnotes at end of table.
U. S. Energy Information Administration/Petroleum Supply Annual 2016, Volume 2

Table 29. PAD District 3 - Imports of Crude Oil and Petroleum Products by Country of Origin, July 2016(Thousand Barrels) — Continued
Country of Origin
Oxygenates Renewable Fuels Distillate Fuel Oil
MethylTertiary
ButylEther
(MTBE)
OtherOxygen-
atesFuel
Ethanol
Biomass-BasedDiesel
OtherRenewable
Diesel
OtherRenewable
Fuels
15 ppmsulfur and
under
Greaterthan 15ppm to 500 ppm
sulfur501 to
2000 ppm
Greaterthan 2000
ppm Total
OPEC ..................................... – – – 73 – – – – – – –Algeria ................................ – – – – – – – – – – –
Angola ................................ – – – – – – – – – – –
Ecuador .............................. – – – – – – – – – – –
Iran ..................................... – – – – – – – – – – –
Iraq ..................................... – – – – – – – – – – –
Kuwait ................................. – – – – – – – – – – –
Libya ................................... – – – – – – – – – – –
Nigeria ................................ – – – – – – – – – – –
Qatar ................................... – – – – – – – – – – –
Saudi Arabia ....................... – – – – – – – – – – –
United Arab Emirates ......... – – – – – – – – – – –
Venezuela ........................... – – – – – – – – – – –
Non-OPEC ............................. 229 88 63 484 – – – – – – –Argentina ............................ 43 – – 484 – – – – – – –
Aruba .................................. – – – – – – – – – – –
Australia .............................. – – – – – – – – – – –
Bahamas ............................ – – – – – – – – – – –
Bahrain ............................... – – – – – – – – – – –
Belgium ............................... – – – – – – – – – – –
Brazil ................................... – 88 63 – – – – – – – –
Brunei ................................. – – – – – – – – – – –
Cameroon ........................... – – – – – – – – – – –
Canada ............................... – – – – – – – – – – –
Chad ................................... – – – – – – – – – – –
China .................................. – – – – – – – – – – –
Colombia ............................ – – – – – – – – – – –
Congo (Brazzaville) ............ – – – – – – – – – – –
Denmark ............................. – – – – – – – – – – –
Egypt .................................. – – – – – – – – – – –
Equatorial Guinea ............... – – – – – – – – – – –
Estonia ................................ – – – – – – – – – – –
Finland ................................ – – – – – – – – – – –
France ................................ – – – – – – – – – – –
Gabon ................................. – – – – – – – – – – –
Germany ............................. 7 – – – – – – – – – –
Guatemala .......................... – – – – – – – – – – –
India .................................... – – – – – – – – – – –
Indonesia ............................ – – – 73 – – – – – – –
Italy ..................................... – – – – – – – – – – –
Korea, South ....................... – – – – – – – – – – –
Latvia .................................. – – – – – – – – – – –
Lithuania ............................. – – – – – – – – – – –
Malaysia ............................. – – – – – – – – – – –
Mexico ................................ – – – – – – – – – – –
Netherlands ........................ 179 – – – – – – – – – –
Netherlands Antilles ............ – – – – – – – – – – –
Norway ............................... – – – – – – – – – – –
Oman .................................. – – – – – – – – – – –
Portugal .............................. – – – – – – – – – – –
Russia ................................. – – – – – – – – – – –
Spain .................................. – – – – – – – – – – –
Sweden ............................... – – – – – – – – – – –
Syria ................................... – – – – – – – – – – –
Trinidad and Tobago .......... – – – – – – – – – – –
United Kingdom .................. – – – – – – – – – – –
Vietnam .............................. – – – – – – – – – – –
Virgin Islands, U.S. ............. – – – – – – – – – – –
Yemen ................................ – – – – – – – – – – –
Other ................................... 0 0 0 -73 – – – – – – –
Total ....................................... 229 88 63 557 – – – – – – –
Persian Gulf3 ......................... – – – – – – – – – – –
See footnotes at end of table.
U. S. Energy Information Administration/Petroleum Supply Annual 2016, Volume 2

Table 29. PAD District 3 - Imports of Crude Oil and Petroleum Products by Country of Origin, July 2016(Thousand Barrels) — Continued
Country of Origin
Kerosene
FinishedAviationGasoline
AviationGasolineBlending
Components
Kerosene-Type Jet
FuelSpecial
Naphthas
Residual Fuel Oil
Less than 0.31 % sulfur
0.31 to 1.00 % sulfur
Greater than1.00 % sulfur Total
OPEC ..................................... – – – – 40 – 130 854 984Algeria ................................ – – – – – – – – –
Angola ................................ – – – – – – – – –
Ecuador .............................. – – – – – – – – –
Iran ..................................... – – – – – – – – –
Iraq ..................................... – – – – – – – 342 342
Kuwait ................................. – – – – – – – – –
Libya ................................... – – – – – – – – –
Nigeria ................................ – – – – – – – – –
Qatar ................................... – – – – – – – – –
Saudi Arabia ....................... – – – – 40 – – – –
United Arab Emirates ......... – – – – – – – – –
Venezuela ........................... – – – – – – 130 512 642
Non-OPEC ............................. – – – – 376 347 432 836 1,615Argentina ............................ – – – – – – – – –
Aruba .................................. – – – – – – – – –
Australia .............................. – – – – – – – – –
Bahamas ............................ – – – – – – – – –
Bahrain ............................... – – – – – – – – –
Belgium ............................... – – – – – – – – –
Brazil ................................... – – – – – – – – –
Brunei ................................. – – – – – – – – –
Cameroon ........................... – – – – – – – – –
Canada ............................... – – – – – – – – –
Chad ................................... – – – – – – – – –
China .................................. – – – – – – – – –
Colombia ............................ – – – – – – 50 – 50
Congo (Brazzaville) ............ – – – – – – – – –
Denmark ............................. – – – – – – – – –
Egypt .................................. – – – – – – – – –
Equatorial Guinea ............... – – – – – – – – –
Estonia ................................ – – – – – – – – –
Finland ................................ – – – – – – – – –
France ................................ – – – – – – 5 – 5
Gabon ................................. – – – – – – – – –
Germany ............................. – – – – – – – – –
Guatemala .......................... – – – – – – – – –
India .................................... – – – – – – – – –
Indonesia ............................ – – – – – – – – –
Italy ..................................... – – – – – – – – –
Korea, South ....................... – – – – 163 – – – –
Latvia .................................. – – – – – – – – –
Lithuania ............................. – – – – – – – – –
Malaysia ............................. – – – – – – – – –
Mexico ................................ – – – – – – – 488 488
Netherlands ........................ – – – – – – – – –
Netherlands Antilles ............ – – – – – – – – –
Norway ............................... – – – – – – – – –
Oman .................................. – – – – – – – – –
Portugal .............................. – – – – – – – – –
Russia ................................. – – – – – 347 377 207 931
Spain .................................. – – – – – – – – –
Sweden ............................... – – – – – – – 141 141
Syria ................................... – – – – – – – – –
Trinidad and Tobago .......... – – – – – – – – –
United Kingdom .................. – – – – – – – – –
Vietnam .............................. – – – – – – – – –
Virgin Islands, U.S. ............. – – – – – – – – –
Yemen ................................ – – – – – – – – –
Other ................................... – – – – 213 0 0 0 0
Total ....................................... – – – – 416 347 562 1,690 2,599
Persian Gulf3 ......................... – – – – 40 – – 342 342
See footnotes at end of table.
U. S. Energy Information Administration/Petroleum Supply Annual 2016, Volume 2

Table 29. PAD District 3 - Imports of Crude Oil and Petroleum Products by Country of Origin, July 2016(Thousand Barrels) — Continued
Country of Origin
Petrochemical Feedstocks
WaxesPetroleum
Coke
Asphaltand Road
Oil Lubricants
Miscellan-eous
ProductsTotal
Products
TotalCrudeOil and
Products
Daily Average
Crude Oil Products TotalNaphtha
OtherOils
OPEC ..................................... – – – – – 366 – 6,541 75,572 2,227 211 2,438Algeria ................................ – – – – – – – 2,782 3,973 38 90 128
Angola ................................ – – – – – – – 385 3,320 95 12 107
Ecuador .............................. – – – – – – – – 854 28 – 28
Iran ..................................... – – – – – – – – – – – –
Iraq ..................................... – – – – – – – 665 10,294 311 21 332
Kuwait ................................. – – – – – – – – 6,948 224 – 224
Libya ................................... – – – – – – – – – – – –
Nigeria ................................ – – – – – – – 100 1,703 52 3 55
Qatar ................................... – – – – – 313 – 313 313 – 10 10
Saudi Arabia ....................... – – – – – – – 40 19,927 642 1 643
United Arab Emirates ......... – – – – – – – 531 531 – 17 17
Venezuela ........................... – – – – – – – 1,599 27,583 838 52 890
Non-OPEC ............................. 537 81 9 8 – 585 – 17,649 62,251 1,439 569 2,008Argentina ............................ – 44 – – – 2 – 611 611 – 20 20
Aruba .................................. – – – – – – – – – – – –
Australia .............................. – – – – – – – – 656 21 – 21
Bahamas ............................ – – – – – – – – – – – –
Bahrain ............................... – – – – – 124 – 124 124 – 4 4
Belgium ............................... – – – – – 4 – 1,729 1,729 – 56 56
Brazil ................................... 21 – – – – – – 238 2,820 83 8 91
Brunei ................................. – – – – – – – – – – – –
Cameroon ........................... – – – – – – – – – – – –
Canada ............................... – – – – – – – 290 10,390 326 9 335
Chad ................................... – – – – – – – – – – – –
China .................................. – – – – – – – – – – – –
Colombia ............................ – – – – – – – 50 8,254 265 2 266
Congo (Brazzaville) ............ – – – – – – – – – – – –
Denmark ............................. – – – – – – – – 627 20 – 20
Egypt .................................. – – – – – – – – 1,396 45 – 45
Equatorial Guinea ............... – – – – – – – – – – – –
Estonia ................................ – – – – – – – – – – – –
Finland ................................ – – – – – – – – – – – –
France ................................ – 37 – – – 1 – 714 714 – 23 23
Gabon ................................. – – – – – – – – – – – –
Germany ............................. – – – – – 7 – 188 188 – 6 6
Guatemala .......................... – – – – – – – – 257 8 – 8
India .................................... – – – – – – – 378 378 – 12 12
Indonesia ............................ – – – – – – – 126 126 – 4 4
Italy ..................................... – – – – – 13 – 13 13 – 0 0
Korea, South ....................... – – – – – 372 – 549 549 – 18 18
Latvia .................................. – – – – – – – – – – – –
Lithuania ............................. – – – – – – – – – – – –
Malaysia ............................. – – 9 – – – – 9 9 – 0 0
Mexico ................................ 378 – – – – – – 1,599 20,968 625 52 676
Netherlands ........................ 5 – – – – – – 680 680 – 22 22
Netherlands Antilles ............ – – – – – – – – – – – –
Norway ............................... – – – – – – – 379 379 – 12 12
Oman .................................. – – – – – – – – – – – –
Portugal .............................. – – – – – – – – – – – –
Russia ................................. – – – – – – – 8,423 8,952 17 272 289
Spain .................................. – – – – – 30 – 30 30 – 1 1
Sweden ............................... – – – – – – – 307 307 – 10 10
Syria ................................... – – – – – – – – – – – –
Trinidad and Tobago .......... – – – – – – – – – – – –
United Kingdom .................. 17 – – – – 7 – 102 102 – 3 3
Vietnam .............................. – – – – – – – – – – – –
Virgin Islands, U.S. ............. – – – – – – – – – – – –
Yemen ................................ – – – – – – – – – – – –
Other ................................... 116 0 0 8 – 25 – 1,110 1,992 29 35 66
Total ....................................... 537 81 9 8 – 951 – 24,190 137,823 3,666 780 4,446
Persian Gulf3 ......................... – – – – – 437 – 1,673 38,137 1,176 54 1,230
–= No Data Reported.
1Crude oil and unfinished oils are reported by the PAD District in which they are to be processed; all other products are reported by the PAD District of entry.
2 Includes crude oil imported for storage in the Strategic Petroleum Reserve.
3 Includes Bahrain, Iran, Iraq, Kuwait, Qatar, Saudi Arabia, and United Arab Emirates.
Note: Totals may not equal sum of components due to independent rounding.
Source: Energy Information Administration (EIA) Form EIA-814, "Monthly Imports Report."
U. S. Energy Information Administration/Petroleum Supply Annual 2016, Volume 2

8. TABLE29.PDFTable 29. PAD District 3 - Imports of Crude Oil and Petroleum Products by Country of Origin, August 2016
(Thousand Barrels)
Country of Origin
Crude Oil1,2
NaturalGas
LiquidsRefineryOlefins
UnfinishedOils1
Finished Motor Gasoline Motor Gasoline Blending Components
Reform-ulated
Conven-tional Total
Reform- ulated
Conven- tional Total
OPEC ..................................... 59,416 – – 3,826 – – – – 196 196Algeria ................................ – – – 3,307 – – – – 196 196
Angola ................................ 950 – – 371 – – – – – –
Ecuador .............................. 990 – – – – – – – – –
Iran ..................................... – – – – – – – – – –
Iraq ..................................... 12,039 – – – – – – – – –
Kuwait ................................. 2,453 – – – – – – – – –
Libya ................................... – – – 148 – – – – – –
Nigeria ................................ 474 – – – – – – – – –
Qatar ................................... – – – – – – – – – –
Saudi Arabia ....................... 22,045 – – – – – – – – –
United Arab Emirates ......... – – – – – – – – – –
Venezuela ........................... 20,465 – – – – – – – – –
Non-OPEC ............................. 49,053 668 – 11,339 – 296 296 – 2,498 2,498Argentina ............................ – – – – – – – – 25 25
Aruba .................................. – – – – – – – – – –
Australia .............................. – – – – – – – – – –
Bahamas ............................ – – – – – – – – – –
Bahrain ............................... – – – – – – – – – –
Belgium ............................... – – – 1,208 – – – – – –
Brazil ................................... 5,368 – – – – – – – 95 95
Brunei ................................. – – – – – – – – – –
Cameroon ........................... – – – 110 – – – – – –
Canada ............................... 12,627 8 – – – 279 279 – 280 280
Chad ................................... 953 – – – – – – – – –
China .................................. – – – – – – – – – –
Colombia ............................ 10,141 – – 196 – – – – – –
Congo (Brazzaville) ............ – – – 45 – – – – – –
Denmark ............................. – – – – – – – – – –
Egypt .................................. – – – – – – – – – –
Equatorial Guinea ............... – – – – – – – – – –
Estonia ................................ – – – – – – – – – –
Finland ................................ – – – – – – – – – –
France ................................ – – – 305 – – – – – –
Gabon ................................. – – – – – – – – – –
Germany ............................. – – – 35 – – – – – –
Guatemala .......................... 278 – – – – – – – – –
India .................................... – – – – – – – – – –
Indonesia ............................ – – – – – – – – – –
Italy ..................................... – – – – – – – – – –
Korea, South ....................... – – – – – – – – – –
Latvia .................................. – – – – – – – – – –
Lithuania ............................. – – – – – – – – – –
Malaysia ............................. – – – – – – – – – –
Mexico ................................ 17,416 660 – – – – – – 882 882
Netherlands ........................ – – – 62 – – – – – –
Netherlands Antilles ............ – – – – – – – – – –
Norway ............................... – – – 353 – – – – 85 85
Oman .................................. – – – – – – – – – –
Portugal .............................. – – – – – – – – – –
Russia ................................. 930 – – 8,436 – – – – 279 279
Spain .................................. – – – – – 17 17 – 302 302
Sweden ............................... – – – 62 – – – – – –
Syria ................................... – – – – – – – – – –
Trinidad and Tobago .......... 360 – – – – – – – – –
United Kingdom .................. 980 – – 67 – – – – 364 364
Vietnam .............................. – – – – – – – – – –
Virgin Islands, U.S. ............. – – – – – – – – – –
Yemen ................................ – – – – – – – – – –
Other ................................... 0 0 – 460 – 0 0 – 186 186
Total ....................................... 108,469 668 – 15,165 – 296 296 – 2,694 2,694
Persian Gulf3 ......................... 36,537 – – – – – – – – –
See footnotes at end of table.
U. S. Energy Information Administration/Petroleum Supply Annual 2016, Volume 2

Table 29. PAD District 3 - Imports of Crude Oil and Petroleum Products by Country of Origin, August 2016(Thousand Barrels) — Continued
Country of Origin
Oxygenates Renewable Fuels Distillate Fuel Oil
MethylTertiary
ButylEther
(MTBE)
OtherOxygen-
atesFuel
Ethanol
Biomass-BasedDiesel
OtherRenewable
Diesel
OtherRenewable
Fuels
15 ppmsulfur and
under
Greaterthan 15ppm to 500 ppm
sulfur501 to
2000 ppm
Greaterthan 2000
ppm Total
OPEC ..................................... – – – 86 – – – – – – –Algeria ................................ – – – – – – – – – – –
Angola ................................ – – – – – – – – – – –
Ecuador .............................. – – – – – – – – – – –
Iran ..................................... – – – – – – – – – – –
Iraq ..................................... – – – – – – – – – – –
Kuwait ................................. – – – – – – – – – – –
Libya ................................... – – – – – – – – – – –
Nigeria ................................ – – – – – – – – – – –
Qatar ................................... – – – – – – – – – – –
Saudi Arabia ....................... – – – – – – – – – – –
United Arab Emirates ......... – – – – – – – – – – –
Venezuela ........................... – – – – – – – – – – –
Non-OPEC ............................. 248 177 – 602 – – – – 99 362 461Argentina ............................ – – – 602 – – – – – – –
Aruba .................................. – – – – – – – – – – –
Australia .............................. – – – – – – – – – – –
Bahamas ............................ – – – – – – – – – – –
Bahrain ............................... – – – – – – – – – – –
Belgium ............................... 26 – – – – – – – – – –
Brazil ................................... 71 177 – – – – – – – – –
Brunei ................................. – – – – – – – – – – –
Cameroon ........................... – – – – – – – – – – 162
Canada ............................... – – – – – – – – – – –
Chad ................................... – – – – – – – – – – –
China .................................. – – – – – – – – – – –
Colombia ............................ – – – – – – – – – – –
Congo (Brazzaville) ............ – – – – – – – – – – –
Denmark ............................. – – – – – – – – – – –
Egypt .................................. – – – – – – – – – – –
Equatorial Guinea ............... – – – – – – – – – – –
Estonia ................................ – – – – – – – – – – –
Finland ................................ – – – – – – – – – – –
France ................................ – – – – – – – – – – –
Gabon ................................. – – – – – – – – – – –
Germany ............................. 8 – – – – – – – – – –
Guatemala .......................... – – – – – – – – – – –
India .................................... – – – – – – – – – – –
Indonesia ............................ – – – 86 – – – – – – –
Italy ..................................... – – – – – – – – – – –
Korea, South ....................... – – – – – – – – – – –
Latvia .................................. – – – – – – – – – – –
Lithuania ............................. – – – – – – – – – – –
Malaysia ............................. – – – – – – – – – – –
Mexico ................................ – – – – – – – – – – –
Netherlands ........................ 143 – – – – – – – – – –
Netherlands Antilles ............ – – – – – – – – – – –
Norway ............................... – – – – – – – – – – –
Oman .................................. – – – – – – – – – – –
Portugal .............................. – – – – – – – – – – –
Russia ................................. – – – – – – – – – – –
Spain .................................. – – – – – – – – – – –
Sweden ............................... – – – – – – – – 99 – 299
Syria ................................... – – – – – – – – – – –
Trinidad and Tobago .......... – – – – – – – – – – –
United Kingdom .................. – – – – – – – – – – –
Vietnam .............................. – – – – – – – – – – –
Virgin Islands, U.S. ............. – – – – – – – – – – –
Yemen ................................ – – – – – – – – – – –
Other ................................... 0 0 – -86 – – – – 0 362 0
Total ....................................... 248 177 – 688 – – – – 99 362 461
Persian Gulf3 ......................... – – – – – – – – – – –
See footnotes at end of table.
U. S. Energy Information Administration/Petroleum Supply Annual 2016, Volume 2

Table 29. PAD District 3 - Imports of Crude Oil and Petroleum Products by Country of Origin, August 2016(Thousand Barrels) — Continued
Country of Origin
Kerosene
FinishedAviationGasoline
AviationGasolineBlending
Components
Kerosene-Type Jet
FuelSpecial
Naphthas
Residual Fuel Oil
Less than 0.31 % sulfur
0.31 to 1.00 % sulfur
Greater than1.00 % sulfur Total
OPEC ..................................... – – – – – – 328 538 866Algeria ................................ – – – – – – – – –
Angola ................................ – – – – – – – – –
Ecuador .............................. – – – – – – – – –
Iran ..................................... – – – – – – – – –
Iraq ..................................... – – – – – – – – 328
Kuwait ................................. – – – – – – – – –
Libya ................................... – – – – – – – – –
Nigeria ................................ – – – – – – – – –
Qatar ................................... – – – – – – – – –
Saudi Arabia ....................... – – – – – – – – –
United Arab Emirates ......... – – – – – – – – –
Venezuela ........................... – – – – – – – 538 538
Non-OPEC ............................. – – – – 222 – 598 236 834Argentina ............................ – – – – – – – – –
Aruba .................................. – – – – – – – – –
Australia .............................. – – – – – – – – –
Bahamas ............................ – – – – – – – – –
Bahrain ............................... – – – – – – – – –
Belgium ............................... – – – – – – – – –
Brazil ................................... – – – – 22 – 142 – 142
Brunei ................................. – – – – – – – – –
Cameroon ........................... – – – – – – – – –
Canada ............................... – – – – 159 – – – –
Chad ................................... – – – – – – – – –
China .................................. – – – – – – – – –
Colombia ............................ – – – – – – – – –
Congo (Brazzaville) ............ – – – – – – – – –
Denmark ............................. – – – – – – – – –
Egypt .................................. – – – – – – – – –
Equatorial Guinea ............... – – – – – – – – –
Estonia ................................ – – – – – – – – –
Finland ................................ – – – – – – – – –
France ................................ – – – – – – 61 – 61
Gabon ................................. – – – – – – – – –
Germany ............................. – – – – – – – – –
Guatemala .......................... – – – – – – – – –
India .................................... – – – – – – – – –
Indonesia ............................ – – – – – – – – –
Italy ..................................... – – – – – – – – –
Korea, South ....................... – – – – 41 – – – –
Latvia .................................. – – – – – – – – –
Lithuania ............................. – – – – – – – – –
Malaysia ............................. – – – – – – – – –
Mexico ................................ – – – – – – – 236 236
Netherlands ........................ – – – – – – – – –
Netherlands Antilles ............ – – – – – – – – –
Norway ............................... – – – – – – – – –
Oman .................................. – – – – – – – – –
Portugal .............................. – – – – – – – – –
Russia ................................. – – – – – – – – –
Spain .................................. – – – – – – – – –
Sweden ............................... – – – – – – – – –
Syria ................................... – – – – – – – – –
Trinidad and Tobago .......... – – – – – – – – –
United Kingdom .................. – – – – – – – – –
Vietnam .............................. – – – – – – – – –
Virgin Islands, U.S. ............. – – – – – – – – –
Yemen ................................ – – – – – – – – –
Other ................................... – – – – 0 – 395 0 395
Total ....................................... – – – – 222 – 926 774 1,700
Persian Gulf3 ......................... – – – – – – 328 – 328
See footnotes at end of table.
U. S. Energy Information Administration/Petroleum Supply Annual 2016, Volume 2

Table 29. PAD District 3 - Imports of Crude Oil and Petroleum Products by Country of Origin, August 2016(Thousand Barrels) — Continued
Country of Origin
Petrochemical Feedstocks
WaxesPetroleum
Coke
Asphaltand Road
Oil Lubricants
Miscellan-eous
ProductsTotal
Products
TotalCrudeOil and
Products
Daily Average
Crude Oil Products TotalNaphtha
OtherOils
OPEC ..................................... – – – – – 433 – 5,407 64,823 1,917 174 2,091Algeria ................................ – – – – – – – 3,503 3,503 – 113 113
Angola ................................ – – – – – – – 371 1,321 31 12 43
Ecuador .............................. – – – – – – – – 990 32 – 32
Iran ..................................... – – – – – – – – – – – –
Iraq ..................................... – – – – – – – 328 12,367 388 11 399
Kuwait ................................. – – – – – – – – 2,453 79 – 79
Libya ................................... – – – – – – – 148 148 – 5 5
Nigeria ................................ – – – – – – – – 474 15 – 15
Qatar ................................... – – – – – 323 – 323 323 – 10 10
Saudi Arabia ....................... – – – – – – – – 22,045 711 – 711
United Arab Emirates ......... – – – – – – – – – – – –
Venezuela ........................... – – – – – – – 538 21,003 660 17 678
Non-OPEC ............................. 396 24 9 340 30 457 – 18,603 67,656 1,582 600 2,182Argentina ............................ – – – 190 – 2 – 819 819 – 26 26
Aruba .................................. – – – – – – – – – – – –
Australia .............................. – – – – – – – – – – – –
Bahamas ............................ – – – – – – – – – – – –
Bahrain ............................... – – – – – 63 – 63 63 – 2 2
Belgium ............................... – – – – – 11 – 1,245 1,245 – 40 40
Brazil ................................... – – – – – – – 507 5,875 173 16 190
Brunei ................................. – – – – – – – – – – – –
Cameroon ........................... – – – – – – – 272 272 – 9 9
Canada ............................... – – – – – – – 726 13,353 407 23 431
Chad ................................... – – – – – – – – 953 31 – 31
China .................................. – – – – – – – – – – – –
Colombia ............................ – – – – – – – 196 10,337 327 6 333
Congo (Brazzaville) ............ – – – – – – – 45 45 – 1 1
Denmark ............................. – – – – – – – – – – – –
Egypt .................................. – – – – – – – – – – – –
Equatorial Guinea ............... – – – – – – – – – – – –
Estonia ................................ – – – – – – – – – – – –
Finland ................................ – – – – – – – – – – – –
France ................................ – 24 – – – – – 390 390 – 13 13
Gabon ................................. – – – – – – – – – – – –
Germany ............................. – – – – – 6 – 50 50 – 2 2
Guatemala .......................... – – – – – – – – 278 9 – 9
India .................................... – – – – – – – – – – – –
Indonesia ............................ – – – – – – – 196 196 – 6 6
Italy ..................................... – – – – – 38 – 39 39 – 1 1
Korea, South ....................... – – – – – 274 – 315 315 – 10 10
Latvia .................................. – – – – – – – – – – – –
Lithuania ............................. – – – – – – – – – – – –
Malaysia ............................. – – 9 – – – – 9 9 – 0 0
Mexico ................................ 369 – – – – – – 2,147 19,563 562 69 631
Netherlands ........................ 27 – – – – 12 – 244 244 – 8 8
Netherlands Antilles ............ – – – – – – – – – – – –
Norway ............................... – – – – – – – 438 438 – 14 14
Oman .................................. – – – – – – – – – – – –
Portugal .............................. – – – – – – – – – – – –
Russia ................................. – – – – – – – 8,715 9,645 30 281 311
Spain .................................. – – – – – – – 319 319 – 10 10
Sweden ............................... – – – – – – – 361 361 – 12 12
Syria ................................... – – – – – – – – – – – –
Trinidad and Tobago .......... – – – – – – – – 360 12 – 12
United Kingdom .................. – – – 142 – 23 – 596 1,576 32 19 51
Vietnam .............................. – – – – – – – – – – – –
Virgin Islands, U.S. ............. – – – – – – – – – – – –
Yemen ................................ – – – – – – – – – – – –
Other ................................... 0 0 0 8 30 28 – 911 911 -1 32 29
Total ....................................... 396 24 9 340 30 890 – 24,010 132,479 3,499 775 4,274
Persian Gulf3 ......................... – – – – – 386 – 714 37,251 1,179 23 1,202
–= No Data Reported.
1Crude oil and unfinished oils are reported by the PAD District in which they are to be processed; all other products are reported by the PAD District of entry.
2 Includes crude oil imported for storage in the Strategic Petroleum Reserve.
3 Includes Bahrain, Iran, Iraq, Kuwait, Qatar, Saudi Arabia, and United Arab Emirates.
Note: Totals may not equal sum of components due to independent rounding.
Source: Energy Information Administration (EIA) Form EIA-814, "Monthly Imports Report."
U. S. Energy Information Administration/Petroleum Supply Annual 2016, Volume 2

9. TABLE29.PDFTable 29. PAD District 3 - Imports of Crude Oil and Petroleum Products by Country of Origin, September 2016
(Thousand Barrels)
Country of Origin
Crude Oil1,2
NaturalGas
LiquidsRefineryOlefins
UnfinishedOils1
Finished Motor Gasoline Motor Gasoline Blending Components
Reform-ulated
Conven-tional Total
Reform- ulated
Conven- tional Total
OPEC ..................................... 64,220 – – 3,210 – – – – 319 319Algeria ................................ – – – 2,808 – – – – 319 319
Angola ................................ 1,440 – – 402 – – – – – –
Ecuador .............................. 1,630 – – – – – – – – –
Iran ..................................... – – – – – – – – – –
Iraq ..................................... 11,269 – – – – – – – – –
Kuwait ................................. 5,383 – – – – – – – – –
Libya ................................... – – – – – – – – – –
Nigeria ................................ 592 – – – – – – – – –
Qatar ................................... – – – – – – – – – –
Saudi Arabia ....................... 22,494 – – – – – – – – –
United Arab Emirates ......... – – – – – – – – – –
Venezuela ........................... 21,412 – – – – – – – – –
Non-OPEC ............................. 37,207 312 – 10,554 – 57 57 – 1,682 1,682Argentina ............................ 252 – – 166 – – – – 66 66
Aruba .................................. – – – – – – – – – –
Australia .............................. – – – – – – – – – –
Bahamas ............................ – – – – – – – – – –
Bahrain ............................... – – – – – – – – – –
Belgium ............................... – – – 1,494 – – – – – –
Brazil ................................... 2,211 – – 200 – – – – – –
Brunei ................................. – – – – – – – – – –
Cameroon ........................... – – – – – – – – – –
Canada ............................... 11,393 11 – 414 – – – – – –
Chad ................................... – – – – – – – – – –
China .................................. – – – – – – – – 72 72
Colombia ............................ 5,786 – – 183 – – – – – –
Congo (Brazzaville) ............ – – – – – – – – – –
Denmark ............................. – – – – – – – – – –
Egypt .................................. – – – – – – – – – –
Equatorial Guinea ............... – – – – – – – – – –
Estonia ................................ – – – – – – – – – –
Finland ................................ – – – – – – – – – –
France ................................ – – – 343 – – – – – –
Gabon ................................. – – – – – – – – – –
Germany ............................. – – – 60 – – – – – –
Guatemala .......................... 277 – – – – – – – – –
India .................................... – – – – – – – – 349 349
Indonesia ............................ – – – – – – – – – –
Italy ..................................... – – – 360 – – – – 29 29
Korea, South ....................... – – – – – – – – 27 27
Latvia .................................. – – – – – – – – – –
Lithuania ............................. – – – – – – – – – –
Malaysia ............................. – – – – – – – – – –
Mexico ................................ 15,481 – – 245 – – – – 437 437
Netherlands ........................ – – – 136 – 57 57 – – –
Netherlands Antilles ............ – – – – – – – – – –
Norway ............................... – – – 361 – – – – 100 100
Oman .................................. – – – – – – – – 36 36
Portugal .............................. – – – – – – – – – –
Russia ................................. – – – 6,272 – – – – – –
Spain .................................. – – – 141 – – – – 488 488
Sweden ............................... – – – – – – – – – –
Syria ................................... – – – – – – – – – –
Trinidad and Tobago .......... 759 – – – – – – – – –
United Kingdom .................. 1,048 – – – – – – – 78 78
Vietnam .............................. – – – – – – – – – –
Virgin Islands, U.S. ............. – – – – – – – – – –
Yemen ................................ – – – – – – – – – –
Other ................................... 0 301 – 179 – 0 0 – 0 0
Total ....................................... 101,427 312 – 13,764 – 57 57 – 2,001 2,001
Persian Gulf3 ......................... 39,146 – – – – – – – – –
See footnotes at end of table.
U. S. Energy Information Administration/Petroleum Supply Annual 2016, Volume 2

Table 29. PAD District 3 - Imports of Crude Oil and Petroleum Products by Country of Origin, September 2016(Thousand Barrels) — Continued
Country of Origin
Oxygenates Renewable Fuels Distillate Fuel Oil
MethylTertiary
ButylEther
(MTBE)
OtherOxygen-
atesFuel
Ethanol
Biomass-BasedDiesel
OtherRenewable
Diesel
OtherRenewable
Fuels
15 ppmsulfur and
under
Greaterthan 15ppm to 500 ppm
sulfur501 to
2000 ppm
Greaterthan 2000
ppm Total
OPEC ..................................... – – – 228 – – – – – – –Algeria ................................ – – – – – – – – – – –
Angola ................................ – – – – – – – – – – –
Ecuador .............................. – – – – – – – – – – –
Iran ..................................... – – – – – – – – – – –
Iraq ..................................... – – – – – – – – – – –
Kuwait ................................. – – – – – – – – – – –
Libya ................................... – – – – – – – – – – –
Nigeria ................................ – – – – – – – – – – –
Qatar ................................... – – – – – – – – – – –
Saudi Arabia ....................... – – – – – – – – – – –
United Arab Emirates ......... – – – – – – – – – – –
Venezuela ........................... – – – – – – – – – – –
Non-OPEC ............................. 209 130 31 499 – – – – 83 – 83Argentina ............................ 41 – – 499 – – – – – – –
Aruba .................................. – – – – – – – – – – –
Australia .............................. – – – – – – – – – – –
Bahamas ............................ – – – – – – – – – – –
Bahrain ............................... – – – – – – – – – – –
Belgium ............................... 101 – – – – – – – – – –
Brazil ................................... – 130 31 – – – – – – – –
Brunei ................................. – – – – – – – – – – –
Cameroon ........................... – – – – – – – – – – –
Canada ............................... – – – – – – – – – – –
Chad ................................... – – – – – – – – – – –
China .................................. – – – – – – – – – – –
Colombia ............................ – – – – – – – – 83 – 83
Congo (Brazzaville) ............ – – – – – – – – – – –
Denmark ............................. – – – – – – – – – – –
Egypt .................................. – – – – – – – – – – –
Equatorial Guinea ............... – – – – – – – – – – –
Estonia ................................ – – – – – – – – – – –
Finland ................................ – – – – – – – – – – –
France ................................ – – – – – – – – – – –
Gabon ................................. – – – – – – – – – – –
Germany ............................. 18 – – – – – – – – – –
Guatemala .......................... – – – – – – – – – – –
India .................................... – – – – – – – – – – –
Indonesia ............................ – – – 228 – – – – – – –
Italy ..................................... – – – – – – – – – – –
Korea, South ....................... – – – – – – – – – – –
Latvia .................................. – – – – – – – – – – –
Lithuania ............................. – – – – – – – – – – –
Malaysia ............................. – – – – – – – – – – –
Mexico ................................ – – – – – – – – – – –
Netherlands ........................ 49 – – – – – – – – – –
Netherlands Antilles ............ – – – – – – – – – – –
Norway ............................... – – – – – – – – – – –
Oman .................................. – – – – – – – – – – –
Portugal .............................. – – – – – – – – – – –
Russia ................................. – – – – – – – – – – –
Spain .................................. – – – – – – – – – – –
Sweden ............................... – – – – – – – – – – –
Syria ................................... – – – – – – – – – – –
Trinidad and Tobago .......... – – – – – – – – – – –
United Kingdom .................. – – – – – – – – – – –
Vietnam .............................. – – – – – – – – – – –
Virgin Islands, U.S. ............. – – – – – – – – – – –
Yemen ................................ – – – – – – – – – – –
Other ................................... 0 0 0 -228 – – – – 0 – 0
Total ....................................... 209 130 31 727 – – – – 83 – 83
Persian Gulf3 ......................... – – – – – – – – – – –
See footnotes at end of table.
U. S. Energy Information Administration/Petroleum Supply Annual 2016, Volume 2

Table 29. PAD District 3 - Imports of Crude Oil and Petroleum Products by Country of Origin, September 2016(Thousand Barrels) — Continued
Country of Origin
Kerosene
FinishedAviationGasoline
AviationGasolineBlending
Components
Kerosene-Type Jet
FuelSpecial
Naphthas
Residual Fuel Oil
Less than 0.31 % sulfur
0.31 to 1.00 % sulfur
Greater than1.00 % sulfur Total
OPEC ..................................... – – – – 45 – – 507 507Algeria ................................ – – – – – – – – –
Angola ................................ – – – – – – – – –
Ecuador .............................. – – – – – – – – –
Iran ..................................... – – – – – – – – –
Iraq ..................................... – – – – – – – – –
Kuwait ................................. – – – – – – – – –
Libya ................................... – – – – – – – – –
Nigeria ................................ – – – – – – – – –
Qatar ................................... – – – – – – – – –
Saudi Arabia ....................... – – – – 45 – – – –
United Arab Emirates ......... – – – – – – – 1 1
Venezuela ........................... – – – – – – – 506 506
Non-OPEC ............................. – – – – 444 49 134 612 795Argentina ............................ – – – – – – – – –
Aruba .................................. – – – – – – – – –
Australia .............................. – – – – – – – – –
Bahamas ............................ – – – – – – – – –
Bahrain ............................... – – – – – – – – –
Belgium ............................... – – – – – – – – –
Brazil ................................... – – – – – – – – –
Brunei ................................. – – – – – – – – –
Cameroon ........................... – – – – – – – – –
Canada ............................... – – – – 127 49 134 – 183
Chad ................................... – – – – – – – – –
China .................................. – – – – – – – – –
Colombia ............................ – – – – – – – 8 8
Congo (Brazzaville) ............ – – – – – – – – –
Denmark ............................. – – – – – – – – –
Egypt .................................. – – – – – – – – –
Equatorial Guinea ............... – – – – – – – – –
Estonia ................................ – – – – – – – – –
Finland ................................ – – – – – – – – –
France ................................ – – – – – – – – –
Gabon ................................. – – – – – – – – –
Germany ............................. – – – – – – – – –
Guatemala .......................... – – – – – – – – –
India .................................... – – – – – – – – –
Indonesia ............................ – – – – – – – – –
Italy ..................................... – – – – – – – – –
Korea, South ....................... – – – – 146 – – – –
Latvia .................................. – – – – – – – – –
Lithuania ............................. – – – – – – – – –
Malaysia ............................. – – – – – – – – –
Mexico ................................ – – – – – – – 402 402
Netherlands ........................ – – – – – – – – –
Netherlands Antilles ............ – – – – – – – – –
Norway ............................... – – – – – – – – –
Oman .................................. – – – – – – – – –
Portugal .............................. – – – – – – – – –
Russia ................................. – – – – – – – 202 202
Spain .................................. – – – – – – – – –
Sweden ............................... – – – – – – – – –
Syria ................................... – – – – – – – – –
Trinidad and Tobago .......... – – – – – – – – –
United Kingdom .................. – – – – – – – – –
Vietnam .............................. – – – – – – – – –
Virgin Islands, U.S. ............. – – – – – – – – –
Yemen ................................ – – – – – – – – –
Other ................................... – – – – 171 0 0 0 0
Total ....................................... – – – – 489 49 134 1,119 1,302
Persian Gulf3 ......................... – – – – 45 – – 1 1
See footnotes at end of table.
U. S. Energy Information Administration/Petroleum Supply Annual 2016, Volume 2

Table 29. PAD District 3 - Imports of Crude Oil and Petroleum Products by Country of Origin, September 2016(Thousand Barrels) — Continued
Country of Origin
Petrochemical Feedstocks
WaxesPetroleum
Coke
Asphaltand Road
Oil Lubricants
Miscellan-eous
ProductsTotal
Products
TotalCrudeOil and
Products
Daily Average
Crude Oil Products TotalNaphtha
OtherOils
OPEC ..................................... – – – 138 – 476 – 4,923 69,143 2,141 164 2,305Algeria ................................ – – – – – – – 3,127 3,127 – 104 104
Angola ................................ – – – – – – – 402 1,842 48 13 61
Ecuador .............................. – – – – – – – – 1,630 54 – 54
Iran ..................................... – – – – – – – – – – – –
Iraq ..................................... – – – – – – – – 11,269 376 – 376
Kuwait ................................. – – – 138 – – – 138 5,521 179 5 184
Libya ................................... – – – – – – – – – – – –
Nigeria ................................ – – – – – – – – 592 20 – 20
Qatar ................................... – – – – – 404 – 404 404 – 13 13
Saudi Arabia ....................... – – – – – – – 45 22,539 750 2 751
United Arab Emirates ......... – – – – – – – 1 1 – 0 0
Venezuela ........................... – – – – – – – 506 21,918 714 17 731
Non-OPEC ............................. 507 12 22 16 – 451 – 15,809 53,016 1,240 527 1,767Argentina ............................ – – – – – 2 – 774 1,026 8 26 34
Aruba .................................. – – – – – – – – – – – –
Australia .............................. – – – – – – – – – – – –
Bahamas ............................ – – – – – – – – – – – –
Bahrain ............................... – – – – – 80 – 80 80 – 3 3
Belgium ............................... – – – – – 4 – 1,599 1,599 – 53 53
Brazil ................................... – – – – – – – 361 2,572 74 12 86
Brunei ................................. – – – – – – – – – – – –
Cameroon ........................... – – – – – – – – – – – –
Canada ............................... – – – – – – – 735 12,128 380 25 404
Chad ................................... – – – – – – – – – – – –
China .................................. – – 15 – – – – 87 87 – 3 3
Colombia ............................ – – – – – – – 274 6,060 193 9 202
Congo (Brazzaville) ............ – – – – – – – – – – – –
Denmark ............................. – – – – – – – – – – – –
Egypt .................................. – – – – – – – – – – – –
Equatorial Guinea ............... – – – – – – – – – – – –
Estonia ................................ – – – – – – – – – – – –
Finland ................................ – – – – – – – – – – – –
France ................................ – 12 – – – 1 – 356 356 – 12 12
Gabon ................................. – – – – – – – – – – – –
Germany ............................. – – 1 – – 6 – 86 86 – 3 3
Guatemala .......................... – – – – – – – – 277 9 – 9
India .................................... – – – – – – – 349 349 – 12 12
Indonesia ............................ – – – – – – – 300 300 – 10 10
Italy ..................................... – – – – – 1 – 391 391 – 13 13
Korea, South ....................... – – – – – 287 – 460 460 – 15 15
Latvia .................................. – – – – – – – – – – – –
Lithuania ............................. – – – – – – – – – – – –
Malaysia ............................. – – 6 – – – – 6 6 – 0 0
Mexico ................................ 418 – – – – – – 1,502 16,983 516 50 566
Netherlands ........................ 16 – – – – – – 258 258 – 9 9
Netherlands Antilles ............ – – – – – – – – – – – –
Norway ............................... – – – – – – – 461 461 – 15 15
Oman .................................. – – – – – – – 36 36 – 1 1
Portugal .............................. – – – – – – – – – – – –
Russia ................................. – – – – – – – 6,474 6,474 – 216 216
Spain .................................. – – – – – 38 – 667 667 – 22 22
Sweden ............................... – – – – – – – – – – – –
Syria ................................... – – – – – – – – – – – –
Trinidad and Tobago .......... – – – – – – – – 759 25 – 25
United Kingdom .................. 27 – – – – 13 – 118 1,166 35 4 39
Vietnam .............................. – – – – – – – – – – – –
Virgin Islands, U.S. ............. – – – – – – – – – – – –
Yemen ................................ – – – – – – – – – – – –
Other ................................... 46 0 0 16 – 19 – 435 435 0 14 15
Total ....................................... 507 12 22 154 – 927 – 20,732 122,159 3,381 691 4,072
Persian Gulf3 ......................... – – – 138 – 484 – 668 39,814 1,305 22 1,327
–= No Data Reported.
1Crude oil and unfinished oils are reported by the PAD District in which they are to be processed; all other products are reported by the PAD District of entry.
2 Includes crude oil imported for storage in the Strategic Petroleum Reserve.
3 Includes Bahrain, Iran, Iraq, Kuwait, Qatar, Saudi Arabia, and United Arab Emirates.
Note: Totals may not equal sum of components due to independent rounding.
Source: Energy Information Administration (EIA) Form EIA-814, "Monthly Imports Report."
U. S. Energy Information Administration/Petroleum Supply Annual 2016, Volume 2

10. TABLE29.PDFTable 29. PAD District 3 - Imports of Crude Oil and Petroleum Products by Country of Origin, October 2016
(Thousand Barrels)
Country of Origin
Crude Oil1,2
NaturalGas
LiquidsRefineryOlefins
UnfinishedOils1
Finished Motor Gasoline Motor Gasoline Blending Components
Reform-ulated
Conven-tional Total
Reform- ulated
Conven- tional Total
OPEC ..................................... 61,701 – – 3,300 – – – – – –Algeria ................................ – – – 3,300 – – – – – –
Angola ................................ 473 – – – – – – – – –
Ecuador .............................. 1,612 – – – – – – – – –
Iran ..................................... – – – – – – – – – –
Iraq ..................................... 12,659 – – – – – – – – –
Kuwait ................................. 2,528 – – – – – – – – –
Libya ................................... – – – – – – – – – –
Nigeria ................................ 497 – – – – – – – – –
Qatar ................................... – – – – – – – – – –
Saudi Arabia ....................... 23,471 – – – – – – – – –
United Arab Emirates ......... – – – – – – – – – –
Venezuela ........................... 20,461 – – – – – – – – –
Non-OPEC ............................. 34,866 3 77 10,040 – – – 638 1,773 1,773Argentina ............................ – – – – – – – – – –
Aruba .................................. – – – – – – – – – –
Australia .............................. – – – – – – – – – –
Bahamas ............................ – – – – – – – – – –
Bahrain ............................... – – – – – – – – – –
Belgium ............................... – – – 307 – – – – 32 32
Brazil ................................... 3,848 – – – – – – – 378 378
Brunei ................................. – – – – – – – – – –
Cameroon ........................... – – – – – – – – – –
Canada ............................... 10,283 3 – – – – – – – –
Chad ................................... – – – – – – – – – –
China .................................. – – – – – – – – 228 228
Colombia ............................ 4,038 – – – – – – – – –
Congo (Brazzaville) ............ – – – – – – – – – –
Denmark ............................. – – – 37 – – – – – –
Egypt .................................. – – – – – – – – – –
Equatorial Guinea ............... – – – – – – – – – –
Estonia ................................ – – – – – – – – – –
Finland ................................ – – – – – – – – 30 30
France ................................ – – – 341 – – – – – –
Gabon ................................. – – – – – – – – – –
Germany ............................. – – – – – – – – – –
Guatemala .......................... – – – – – – – – – –
India .................................... – – – – – – – – 391 391
Indonesia ............................ – – – – – – – – – –
Italy ..................................... – – 45 96 – – – – 29 29
Korea, South ....................... – – – – – – – – 55 55
Latvia .................................. – – – – – – – – – –
Lithuania ............................. – – – – – – – – – –
Malaysia ............................. – – – – – – – – 315 315
Mexico ................................ 16,697 – 32 – – – – – 315 315
Netherlands ........................ – – – 225 – – – – – –
Netherlands Antilles ............ – – – – – – – – – –
Norway ............................... – – – – – – – – – –
Oman .................................. – – – – – – – – – –
Portugal .............................. – – – – – – – – – –
Russia ................................. – – – 8,433 – – – – – –
Spain .................................. – – – – – – – – – –
Sweden ............................... – – – 579 – – – – – –
Syria ................................... – – – – – – – – – –
Trinidad and Tobago .......... – – – – – – – – – –
United Kingdom .................. – – – – – – – 638 – 638
Vietnam .............................. – – – – – – – – – –
Virgin Islands, U.S. ............. – – – – – – – – – –
Yemen ................................ – – – – – – – – – –
Other ................................... 0 0 0 22 – – – 0 0 -638
Total ....................................... 96,567 3 77 13,340 – – – 638 1,773 1,773
Persian Gulf3 ......................... 38,658 – – – – – – – – –
See footnotes at end of table.
U. S. Energy Information Administration/Petroleum Supply Annual 2016, Volume 2

Table 29. PAD District 3 - Imports of Crude Oil and Petroleum Products by Country of Origin, October 2016(Thousand Barrels) — Continued
Country of Origin
Oxygenates Renewable Fuels Distillate Fuel Oil
MethylTertiary
ButylEther
(MTBE)
OtherOxygen-
atesFuel
Ethanol
Biomass-BasedDiesel
OtherRenewable
Diesel
OtherRenewable
Fuels
15 ppmsulfur and
under
Greaterthan 15ppm to 500 ppm
sulfur501 to
2000 ppm
Greaterthan 2000
ppm Total
OPEC ..................................... – – – 210 – – – – – – –Algeria ................................ – – – – – – – – – – –
Angola ................................ – – – – – – – – – – –
Ecuador .............................. – – – – – – – – – – –
Iran ..................................... – – – – – – – – – – –
Iraq ..................................... – – – – – – – – – – –
Kuwait ................................. – – – – – – – – – – –
Libya ................................... – – – – – – – – – – –
Nigeria ................................ – – – – – – – – – – –
Qatar ................................... – – – – – – – – – – –
Saudi Arabia ....................... – – – – – – – – – – –
United Arab Emirates ......... – – – – – – – – – – –
Venezuela ........................... – – – – – – – – – – –
Non-OPEC ............................. 230 44 – 675 – – – – – – –Argentina ............................ 50 – – 675 – – – – – – –
Aruba .................................. – – – – – – – – – – –
Australia .............................. – – – – – – – – – – –
Bahamas ............................ – – – – – – – – – – –
Bahrain ............................... – – – – – – – – – – –
Belgium ............................... 79 – – – – – – – – – –
Brazil ................................... 79 44 – – – – – – – – –
Brunei ................................. – – – – – – – – – – –
Cameroon ........................... – – – – – – – – – – –
Canada ............................... – – – – – – – – – – –
Chad ................................... – – – – – – – – – – –
China .................................. – – – – – – – – – – –
Colombia ............................ – – – – – – – – – – –
Congo (Brazzaville) ............ – – – – – – – – – – –
Denmark ............................. – – – – – – – – – – –
Egypt .................................. – – – – – – – – – – –
Equatorial Guinea ............... – – – – – – – – – – –
Estonia ................................ – – – – – – – – – – –
Finland ................................ – – – – – – – – – – –
France ................................ – – – – – – – – – – –
Gabon ................................. – – – – – – – – – – –
Germany ............................. 17 – – – – – – – – – –
Guatemala .......................... – – – – – – – – – – –
India .................................... – – – – – – – – – – –
Indonesia ............................ – – – 210 – – – – – – –
Italy ..................................... – – – – – – – – – – –
Korea, South ....................... – – – – – – – – – – –
Latvia .................................. – – – – – – – – – – –
Lithuania ............................. – – – – – – – – – – –
Malaysia ............................. – – – – – – – – – – –
Mexico ................................ – – – – – – – – – – –
Netherlands ........................ 5 – – – – – – – – – –
Netherlands Antilles ............ – – – – – – – – – – –
Norway ............................... – – – – – – – – – – –
Oman .................................. – – – – – – – – – – –
Portugal .............................. – – – – – – – – – – –
Russia ................................. – – – – – – – – – – –
Spain .................................. – – – – – – – – – – –
Sweden ............................... – – – – – – – – – – –
Syria ................................... – – – – – – – – – – –
Trinidad and Tobago .......... – – – – – – – – – – –
United Kingdom .................. – – – – – – – – – – –
Vietnam .............................. – – – – – – – – – – –
Virgin Islands, U.S. ............. – – – – – – – – – – –
Yemen ................................ – – – – – – – – – – –
Other ................................... 0 0 – -210 – – – – – – –
Total ....................................... 230 44 – 885 – – – – – – –
Persian Gulf3 ......................... – – – – – – – – – – –
See footnotes at end of table.
U. S. Energy Information Administration/Petroleum Supply Annual 2016, Volume 2

Table 29. PAD District 3 - Imports of Crude Oil and Petroleum Products by Country of Origin, October 2016(Thousand Barrels) — Continued
Country of Origin
Kerosene
FinishedAviationGasoline
AviationGasolineBlending
Components
Kerosene-Type Jet
FuelSpecial
Naphthas
Residual Fuel Oil
Less than 0.31 % sulfur
0.31 to 1.00 % sulfur
Greater than1.00 % sulfur Total
OPEC ..................................... – – – – 74 – – – –Algeria ................................ – – – – – – – – –
Angola ................................ – – – – – – – – –
Ecuador .............................. – – – – – – – – –
Iran ..................................... – – – – – – – – –
Iraq ..................................... – – – – – – – – –
Kuwait ................................. – – – – – – – – –
Libya ................................... – – – – – – – – –
Nigeria ................................ – – – – – – – – –
Qatar ................................... – – – – – – – – –
Saudi Arabia ....................... – – – – 74 – – – –
United Arab Emirates ......... – – – – – – – – –
Venezuela ........................... – – – – – – – – –
Non-OPEC ............................. – – – – 81 – 220 506 726Argentina ............................ – – – – – – – – –
Aruba .................................. – – – – – – – – –
Australia .............................. – – – – – – – – –
Bahamas ............................ – – – – – – – – –
Bahrain ............................... – – – – – – – – –
Belgium ............................... – – – – – – – – –
Brazil ................................... – – – – 52 – 220 – 220
Brunei ................................. – – – – – – – – –
Cameroon ........................... – – – – – – – – –
Canada ............................... – – – – – – – – –
Chad ................................... – – – – – – – – –
China .................................. – – – – – – – – –
Colombia ............................ – – – – – – – – –
Congo (Brazzaville) ............ – – – – – – – – –
Denmark ............................. – – – – – – – – –
Egypt .................................. – – – – – – – – –
Equatorial Guinea ............... – – – – – – – – –
Estonia ................................ – – – – – – – – –
Finland ................................ – – – – – – – – –
France ................................ – – – – – – – – –
Gabon ................................. – – – – – – – – –
Germany ............................. – – – – – – – – –
Guatemala .......................... – – – – – – – – –
India .................................... – – – – – – – – –
Indonesia ............................ – – – – – – – – –
Italy ..................................... – – – – – – – – –
Korea, South ....................... – – – – – – – – –
Latvia .................................. – – – – – – – – –
Lithuania ............................. – – – – – – – – –
Malaysia ............................. – – – – – – – – –
Mexico ................................ – – – – – – – 506 506
Netherlands ........................ – – – – 29 – – – –
Netherlands Antilles ............ – – – – – – – – –
Norway ............................... – – – – – – – – –
Oman .................................. – – – – – – – – –
Portugal .............................. – – – – – – – – –
Russia ................................. – – – – – – – – –
Spain .................................. – – – – – – – – –
Sweden ............................... – – – – – – – – –
Syria ................................... – – – – – – – – –
Trinidad and Tobago .......... – – – – – – – – –
United Kingdom .................. – – – – – – – – –
Vietnam .............................. – – – – – – – – –
Virgin Islands, U.S. ............. – – – – – – – – –
Yemen ................................ – – – – – – – – –
Other ................................... – – – – 0 – 0 0 0
Total ....................................... – – – – 155 – 220 506 726
Persian Gulf3 ......................... – – – – 74 – – – –
See footnotes at end of table.
U. S. Energy Information Administration/Petroleum Supply Annual 2016, Volume 2

Table 29. PAD District 3 - Imports of Crude Oil and Petroleum Products by Country of Origin, October 2016(Thousand Barrels) — Continued
Country of Origin
Petrochemical Feedstocks
WaxesPetroleum
Coke
Asphaltand Road
Oil Lubricants
Miscellan-eous
ProductsTotal
Products
TotalCrudeOil and
Products
Daily Average
Crude Oil Products TotalNaphtha
OtherOils
OPEC ..................................... 320 – – – – 357 – 4,261 65,962 1,990 137 2,128Algeria ................................ 320 – – – – – – 3,620 3,620 – 117 117
Angola ................................ – – – – – – – – 473 15 – 15
Ecuador .............................. – – – – – – – – 1,612 52 – 52
Iran ..................................... – – – – – – – – – – – –
Iraq ..................................... – – – – – – – – 12,659 408 – 408
Kuwait ................................. – – – – – – – – 2,528 82 – 82
Libya ................................... – – – – – – – – – – – –
Nigeria ................................ – – – – – – – – 497 16 – 16
Qatar ................................... – – – – – 300 – 300 300 – 10 10
Saudi Arabia ....................... – – – – – – – 74 23,545 757 2 760
United Arab Emirates ......... – – – – – – – – – – – –
Venezuela ........................... – – – – – – – – 20,461 660 – 660
Non-OPEC ............................. 516 10 6 204 – 376 – 14,767 49,633 1,125 476 1,601Argentina ............................ – – – 112 – 1 – 838 838 – 27 27
Aruba .................................. – – – – – – – – – – – –
Australia .............................. – – – – – – – – – – – –
Bahamas ............................ – – – – – – – – – – – –
Bahrain ............................... – – – – – 69 – 69 69 – 2 2
Belgium ............................... – – – – – 7 – 425 425 – 14 14
Brazil ................................... – – – – – – – 773 4,621 124 25 149
Brunei ................................. – – – – – – – – – – – –
Cameroon ........................... – – – – – – – – – – – –
Canada ............................... – – – – – – – 3 10,286 332 0 332
Chad ................................... – – – – – – – – – – – –
China .................................. – – – – – – – 228 228 – 7 7
Colombia ............................ – – – – – – – – 4,038 130 – 130
Congo (Brazzaville) ............ – – – – – – – – – – – –
Denmark ............................. – – – – – – – 37 37 – 1 1
Egypt .................................. – – – – – – – – – – – –
Equatorial Guinea ............... – – – – – – – – – – – –
Estonia ................................ – – – – – – – – – – – –
Finland ................................ – – – – – – – 30 30 – 1 1
France ................................ – 10 – – – – – 351 351 – 11 11
Gabon ................................. – – – – – – – – – – – –
Germany ............................. – – – – – 7 – 25 25 – 1 1
Guatemala .......................... – – – – – – – – – – – –
India .................................... – – – – – – – 391 391 – 13 13
Indonesia ............................ – – – – – – – 267 267 – 9 9
Italy ..................................... – – – – – 8 – 179 179 – 6 6
Korea, South ....................... – – – – – 243 – 298 298 – 10 10
Latvia .................................. – – – – – – – – – – – –
Lithuania ............................. – – – – – – – – – – – –
Malaysia ............................. – – 6 – – – – 321 321 – 10 10
Mexico ................................ 345 – – – – – – 1,198 17,895 539 39 577
Netherlands ........................ 18 – – – – – – 277 277 – 9 9
Netherlands Antilles ............ – – – – – – – – – – – –
Norway ............................... – – – 92 – – – 92 92 – 3 3
Oman .................................. – – – – – – – – – – – –
Portugal .............................. – – – – – – – – – – – –
Russia ................................. – – – – – – – 8,433 8,433 – 272 272
Spain .................................. – – – – – – – – – – – –
Sweden ............................... – – – – – – – 579 579 – 19 19
Syria ................................... – – – – – – – – – – – –
Trinidad and Tobago .......... – – – – – – – – – – – –
United Kingdom .................. 111 – – – – 39 – 150 150 – 5 5
Vietnam .............................. – – – – – – – – – – – –
Virgin Islands, U.S. ............. – – – – – – – – – – – –
Yemen ................................ – – – – – – – – – – – –
Other ................................... 42 0 0 0 – 2 – -197 -197 0 -8 -7
Total ....................................... 836 10 6 204 – 733 – 19,028 115,595 3,115 614 3,729
Persian Gulf3 ......................... – – – – – 369 – 443 39,101 1,247 14 1,261
–= No Data Reported.
1Crude oil and unfinished oils are reported by the PAD District in which they are to be processed; all other products are reported by the PAD District of entry.
2 Includes crude oil imported for storage in the Strategic Petroleum Reserve.
3 Includes Bahrain, Iran, Iraq, Kuwait, Qatar, Saudi Arabia, and United Arab Emirates.
Note: Totals may not equal sum of components due to independent rounding.
Source: Energy Information Administration (EIA) Form EIA-814, "Monthly Imports Report."
U. S. Energy Information Administration/Petroleum Supply Annual 2016, Volume 2

11. TABLE29.PDFTable 29. PAD District 3 - Imports of Crude Oil and Petroleum Products by Country of Origin, November 2016
(Thousand Barrels)
Country of Origin
Crude Oil1,2
NaturalGas
LiquidsRefineryOlefins
UnfinishedOils1
Finished Motor Gasoline Motor Gasoline Blending Components
Reform-ulated
Conven-tional Total
Reform- ulated
Conven- tional Total
OPEC ..................................... 62,023 – – 4,597 – – – – 124 124Algeria ................................ 1,581 – – 3,623 – – – – – –
Angola ................................ – – – 376 – – – – – –
Ecuador .............................. 343 – – – – – – – – –
Iran ..................................... – – – – – – – – – –
Iraq ..................................... 10,337 – – 598 – – – – – –
Kuwait ................................. 3,919 – – – – – – – – –
Libya ................................... – – – – – – – – – –
Nigeria ................................ 502 – – – – – – – – –
Qatar ................................... – – – – – – – – – –
Saudi Arabia ....................... 22,909 – – – – – – – – –
United Arab Emirates ......... – – – – – – – – – –
Venezuela ........................... 22,432 – – – – – – – 124 124
Non-OPEC ............................. 42,456 5 – 7,201 – – – – 1,192 1,192Argentina ............................ 261 – – – – – – – – –
Aruba .................................. – – – – – – – – – –
Australia .............................. – – – – – – – – – –
Bahamas ............................ – – – – – – – – – –
Bahrain ............................... – – – – – – – – – –
Belgium ............................... – – – 802 – – – – – –
Brazil ................................... 4,932 – – – – – – – 69 69
Brunei ................................. – – – – – – – – – –
Cameroon ........................... – – – – – – – – – –
Canada ............................... 12,390 5 – – – – – – – –
Chad ................................... 947 – – – – – – – – –
China .................................. – – – – – – – – – –
Colombia ............................ 4,634 – – – – – – – 201 201
Congo (Brazzaville) ............ – – – – – – – – – –
Denmark ............................. – – – – – – – – – –
Egypt .................................. 524 – – – – – – – – –
Equatorial Guinea ............... – – – – – – – – – –
Estonia ................................ – – – – – – – – – –
Finland ................................ – – – – – – – – – –
France ................................ – – – 106 – – – – – –
Gabon ................................. – – – – – – – – – –
Germany ............................. – – – – – – – – – –
Guatemala .......................... 278 – – – – – – – – –
India .................................... – – – – – – – – – –
Indonesia ............................ – – – – – – – – – –
Italy ..................................... – – – – – – – – 30 30
Korea, South ....................... – – – – – – – – – –
Latvia .................................. – – – – – – – – – –
Lithuania ............................. – – – – – – – – – –
Malaysia ............................. – – – – – – – – – –
Mexico ................................ 18,129 – – 65 – – – – 567 567
Netherlands ........................ – – – 65 – – – – – –
Netherlands Antilles ............ – – – – – – – – – –
Norway ............................... – – – – – – – – – –
Oman .................................. – – – – – – – – – –
Portugal .............................. – – – – – – – – – –
Russia ................................. – – – 5,478 – – – – – –
Spain .................................. – – – – – – – – – –
Sweden ............................... – – – – – – – – – –
Syria ................................... – – – – – – – – – –
Trinidad and Tobago .......... 361 – – – – – – – – –
United Kingdom .................. – – – 233 – – – – – –
Vietnam .............................. – – – – – – – – – –
Virgin Islands, U.S. ............. – – – – – – – – – –
Yemen ................................ – – – – – – – – – –
Other ................................... 0 0 – 452 – – – – 325 325
Total ....................................... 104,479 5 – 11,798 – – – – 1,316 1,316
Persian Gulf3 ......................... 37,165 – – 598 – – – – – –
See footnotes at end of table.
U. S. Energy Information Administration/Petroleum Supply Annual 2016, Volume 2

Table 29. PAD District 3 - Imports of Crude Oil and Petroleum Products by Country of Origin, November 2016(Thousand Barrels) — Continued
Country of Origin
Oxygenates Renewable Fuels Distillate Fuel Oil
MethylTertiary
ButylEther
(MTBE)
OtherOxygen-
atesFuel
Ethanol
Biomass-BasedDiesel
OtherRenewable
Diesel
OtherRenewable
Fuels
15 ppmsulfur and
under
Greaterthan 15ppm to 500 ppm
sulfur501 to
2000 ppm
Greaterthan 2000
ppm Total
OPEC ..................................... – – – 147 – – – – – – –Algeria ................................ – – – – – – – – – – –
Angola ................................ – – – – – – – – – – –
Ecuador .............................. – – – – – – – – – – –
Iran ..................................... – – – – – – – – – – –
Iraq ..................................... – – – – – – – – – – –
Kuwait ................................. – – – – – – – – – – –
Libya ................................... – – – – – – – – – – –
Nigeria ................................ – – – – – – – – – – –
Qatar ................................... – – – – – – – – – – –
Saudi Arabia ....................... – – – – – – – – – – –
United Arab Emirates ......... – – – – – – – – – – –
Venezuela ........................... – – – – – – – – – – –
Non-OPEC ............................. 378 44 – 488 – – – – 693 – 693Argentina ............................ 15 – – 488 – – – – – – –
Aruba .................................. – – – – – – – – – – –
Australia .............................. – – – – – – – – – – –
Bahamas ............................ – – – – – – – – – – –
Bahrain ............................... – – – – – – – – – – –
Belgium ............................... 224 – – – – – – – – – –
Brazil ................................... – 44 – – – – – – 254 – 254
Brunei ................................. – – – – – – – – – – –
Cameroon ........................... – – – – – – – – – – –
Canada ............................... – – – – – – – – – – –
Chad ................................... – – – – – – – – – – –
China .................................. – – – – – – – – – – –
Colombia ............................ – – – – – – – – – – –
Congo (Brazzaville) ............ – – – – – – – – – – –
Denmark ............................. – – – – – – – – – – –
Egypt .................................. – – – – – – – – – – –
Equatorial Guinea ............... – – – – – – – – – – –
Estonia ................................ – – – – – – – – – – –
Finland ................................ – – – – – – – – – – –
France ................................ – – – – – – – – – – –
Gabon ................................. – – – – – – – – – – –
Germany ............................. 53 – – – – – – – – – –
Guatemala .......................... – – – – – – – – – – –
India .................................... – – – – – – – – – – –
Indonesia ............................ – – – 147 – – – – – – –
Italy ..................................... – – – – – – – – – – –
Korea, South ....................... – – – – – – – – – – –
Latvia .................................. – – – – – – – – – – –
Lithuania ............................. – – – – – – – – – – –
Malaysia ............................. – – – – – – – – – – –
Mexico ................................ – – – – – – – – – – –
Netherlands ........................ 77 – – – – – – – 30 – 30
Netherlands Antilles ............ – – – – – – – – – – –
Norway ............................... – – – – – – – – – – –
Oman .................................. – – – – – – – – – – –
Portugal .............................. – – – – – – – – – – –
Russia ................................. – – – – – – – – 409 – 409
Spain .................................. – – – – – – – – – – –
Sweden ............................... – – – – – – – – – – –
Syria ................................... – – – – – – – – – – –
Trinidad and Tobago .......... – – – – – – – – – – –
United Kingdom .................. 9 – – – – – – – – – –
Vietnam .............................. – – – – – – – – – – –
Virgin Islands, U.S. ............. – – – – – – – – – – –
Yemen ................................ – – – – – – – – – – –
Other ................................... 0 0 – -147 – – – – 0 – 0
Total ....................................... 378 44 – 635 – – – – 693 – 693
Persian Gulf3 ......................... – – – – – – – – – – –
See footnotes at end of table.
U. S. Energy Information Administration/Petroleum Supply Annual 2016, Volume 2

Table 29. PAD District 3 - Imports of Crude Oil and Petroleum Products by Country of Origin, November 2016(Thousand Barrels) — Continued
Country of Origin
Kerosene
FinishedAviationGasoline
AviationGasolineBlending
Components
Kerosene-Type Jet
FuelSpecial
Naphthas
Residual Fuel Oil
Less than 0.31 % sulfur
0.31 to 1.00 % sulfur
Greater than1.00 % sulfur Total
OPEC ..................................... – – – – 71 – 91 554 645Algeria ................................ – – – – – – 91 – 91
Angola ................................ – – – – – – – – –
Ecuador .............................. – – – – – – – – –
Iran ..................................... – – – – – – – – –
Iraq ..................................... – – – – – – – – –
Kuwait ................................. – – – – – – – – –
Libya ................................... – – – – – – – – –
Nigeria ................................ – – – – – – – – –
Qatar ................................... – – – – – – – – –
Saudi Arabia ....................... – – – – 71 – – – –
United Arab Emirates ......... – – – – – – – – –
Venezuela ........................... – – – – – – – 554 554
Non-OPEC ............................. – – – – 442 723 318 1,503 2,544Argentina ............................ – – – – – – – – –
Aruba .................................. – – – – – – – – –
Australia .............................. – – – – – – – – –
Bahamas ............................ – – – – – – – – –
Bahrain ............................... – – – – – – – – –
Belgium ............................... – – – – – – – – –
Brazil ................................... – – – – 22 – – – –
Brunei ................................. – – – – – – – – –
Cameroon ........................... – – – – – – – – –
Canada ............................... – – – – 151 – – – –
Chad ................................... – – – – – – – – –
China .................................. – – – – – – – – –
Colombia ............................ – – – – – – – – –
Congo (Brazzaville) ............ – – – – – – – – –
Denmark ............................. – – – – – – – – –
Egypt .................................. – – – – – – – – –
Equatorial Guinea ............... – – – – – – – – –
Estonia ................................ – – – – – – – – –
Finland ................................ – – – – – – – – –
France ................................ – – – – – – – – –
Gabon ................................. – – – – – – – – –
Germany ............................. – – – – – – – – –
Guatemala .......................... – – – – – – – – –
India .................................... – – – – – – – – –
Indonesia ............................ – – – – – – – – –
Italy ..................................... – – – – – – – – –
Korea, South ....................... – – – – 179 – – – –
Latvia .................................. – – – – – – – – –
Lithuania ............................. – – – – – – – – –
Malaysia ............................. – – – – – – – – –
Mexico ................................ – – – – – – – 402 402
Netherlands ........................ – – – – – – – – –
Netherlands Antilles ............ – – – – – – – – –
Norway ............................... – – – – – – – – –
Oman .................................. – – – – – – – – –
Portugal .............................. – – – – – – – – –
Russia ................................. – – – – – 469 266 1,101 1,836
Spain .................................. – – – – – – – – –
Sweden ............................... – – – – – – – – –
Syria ................................... – – – – – – – – –
Trinidad and Tobago .......... – – – – – – – – –
United Kingdom .................. – – – – – – – – –
Vietnam .............................. – – – – – – – – –
Virgin Islands, U.S. ............. – – – – – – – – –
Yemen ................................ – – – – – – – – –
Other ................................... – – – – 90 254 52 0 306
Total ....................................... – – – – 513 723 409 2,057 3,189
Persian Gulf3 ......................... – – – – 71 – – – –
See footnotes at end of table.
U. S. Energy Information Administration/Petroleum Supply Annual 2016, Volume 2

Table 29. PAD District 3 - Imports of Crude Oil and Petroleum Products by Country of Origin, November 2016(Thousand Barrels) — Continued
Country of Origin
Petrochemical Feedstocks
WaxesPetroleum
Coke
Asphaltand Road
Oil Lubricants
Miscellan-eous
ProductsTotal
Products
TotalCrudeOil and
Products
Daily Average
Crude Oil Products TotalNaphtha
OtherOils
OPEC ..................................... 732 – – – – 288 – 6,604 68,627 2,067 220 2,288Algeria ................................ 632 – – – – – – 4,346 5,927 53 145 198
Angola ................................ – – – – – – – 376 376 – 13 13
Ecuador .............................. – – – – – – – – 343 11 – 11
Iran ..................................... – – – – – – – – – – – –
Iraq ..................................... – – – – – – – 598 10,935 345 20 365
Kuwait ................................. – – – – – – – – 3,919 131 – 131
Libya ................................... – – – – – – – – – – – –
Nigeria ................................ – – – – – – – – 502 17 – 17
Qatar ................................... – – – – – 265 – 265 265 – 9 9
Saudi Arabia ....................... – – – – – – – 71 22,980 764 2 766
United Arab Emirates ......... – – – – – – – – – – – –
Venezuela ........................... 100 – – – – – – 778 23,210 748 26 774
Non-OPEC ............................. 455 12 2 156 – 391 – 14,004 56,460 1,415 467 1,882Argentina ............................ – – – – – 1 – 504 765 9 17 26
Aruba .................................. – – – – – – – – – – – –
Australia .............................. – – – – – – – – – – – –
Bahamas ............................ – – – – – – – – – – – –
Bahrain ............................... – – – – – 54 – 54 54 – 2 2
Belgium ............................... – – – – – 3 – 1,029 1,029 – 34 34
Brazil ................................... – – – – – – – 389 5,321 164 13 177
Brunei ................................. – – – – – – – – – – – –
Cameroon ........................... – – – – – – – – – – – –
Canada ............................... – – – – – – – 156 12,546 413 5 418
Chad ................................... – – – – – – – – 947 32 – 32
China .................................. – – – – – – – – – – – –
Colombia ............................ – – – – – – – 201 4,835 154 7 161
Congo (Brazzaville) ............ – – – – – – – – – – – –
Denmark ............................. – – – – – – – – – – – –
Egypt .................................. – – – – – – – – 524 17 – 17
Equatorial Guinea ............... – – – – – – – – – – – –
Estonia ................................ – – – – – – – – – – – –
Finland ................................ – – – – – – – – – – – –
France ................................ – 12 – – – 1 – 119 119 – 4 4
Gabon ................................. – – – – – – – – – – – –
Germany ............................. – – 1 – – 6 – 60 60 – 2 2
Guatemala .......................... – – – – – – – – 278 9 – 9
India .................................... – – – – – – – – – – – –
Indonesia ............................ – – – – – – – 170 170 – 6 6
Italy ..................................... – – – – – 6 – 37 37 – 1 1
Korea, South ....................... – – – – – 232 – 411 411 – 14 14
Latvia .................................. – – – – – – – – – – – –
Lithuania ............................. – – – – – – – – – – – –
Malaysia ............................. – – 1 – – – – 1 1 – 0 0
Mexico ................................ 317 – – – – – – 1,351 19,480 604 45 649
Netherlands ........................ 15 – – – – – – 187 187 – 6 6
Netherlands Antilles ............ – – – – – – – – – – – –
Norway ............................... – – – – – – – – – – – –
Oman .................................. – – – – – – – – – – – –
Portugal .............................. – – – – – – – – – – – –
Russia ................................. – – – – – – – 7,723 7,723 – 257 257
Spain .................................. – – – – – 31 – 31 31 – 1 1
Sweden ............................... – – – – – – – – – – – –
Syria ................................... – – – – – – – – – – – –
Trinidad and Tobago .......... – – – – – – – – 361 12 – 12
United Kingdom .................. 76 – – 156 – 47 – 521 521 – 17 17
Vietnam .............................. – – – – – – – – – – – –
Virgin Islands, U.S. ............. – – – – – – – – – – – –
Yemen ................................ – – – – – – – – – – – –
Other ................................... 47 0 0 0 – 10 – 1,060 1,060 1 36 37
Total ....................................... 1,187 12 2 156 – 679 – 20,608 125,087 3,483 687 4,170
Persian Gulf3 ......................... – – – – – 319 – 988 38,153 1,239 33 1,272
–= No Data Reported.
1Crude oil and unfinished oils are reported by the PAD District in which they are to be processed; all other products are reported by the PAD District of entry.
2 Includes crude oil imported for storage in the Strategic Petroleum Reserve.
3 Includes Bahrain, Iran, Iraq, Kuwait, Qatar, Saudi Arabia, and United Arab Emirates.
Note: Totals may not equal sum of components due to independent rounding.
Source: Energy Information Administration (EIA) Form EIA-814, "Monthly Imports Report."
U. S. Energy Information Administration/Petroleum Supply Annual 2016, Volume 2

12. TABLE29.PDFTable 29. PAD District 3 - Imports of Crude Oil and Petroleum Products by Country of Origin, December 2016
(Thousand Barrels)
Country of Origin
Crude Oil1,2
NaturalGas
LiquidsRefineryOlefins
UnfinishedOils1
Finished Motor Gasoline Motor Gasoline Blending Components
Reform-ulated
Conven-tional Total
Reform- ulated
Conven- tional Total
OPEC ..................................... 64,605 – – 2,476 – – – – – –Algeria ................................ 1,577 – – 2,411 – – – – – –
Angola ................................ 908 – – – – – – – – –
Ecuador .............................. 515 – – – – – – – – –
Iran ..................................... – – – – – – – – – –
Iraq ..................................... 15,210 – – – – – – – – –
Kuwait ................................. 4,796 – – – – – – – – –
Libya ................................... – – – – – – – – – –
Nigeria ................................ – – – – – – – – – –
Qatar ................................... – – – – – – – – – –
Saudi Arabia ....................... 21,379 – – – – – – – – –
United Arab Emirates ......... – – – – – – – – – –
Venezuela ........................... 20,220 – – – – – – – – –
Non-OPEC ............................. 37,645 8 36 8,692 – – – – 967 967Argentina ............................ 187 – – – – – – – – –
Aruba .................................. – – – – – – – – – –
Australia .............................. – – – – – – – – – –
Bahamas ............................ – – – – – – – – – –
Bahrain ............................... – – – – – – – – – –
Belgium ............................... – – – 582 – – – – 326 326
Brazil ................................... 3,125 – – – – – – – – –
Brunei ................................. – – – – – – – – – –
Cameroon ........................... – – – – – – – – – –
Canada ............................... 12,038 8 – – – – – – – –
Chad ................................... – – – – – – – – – –
China .................................. – – – – – – – – – –
Colombia ............................ 5,701 – – – – – – – 415 415
Congo (Brazzaville) ............ – – – – – – – – – –
Denmark ............................. – – – 169 – – – – – –
Egypt .................................. – – – – – – – – – –
Equatorial Guinea ............... – – – – – – – – – –
Estonia ................................ – – – – – – – – – –
Finland ................................ – – – – – – – – – –
France ................................ – – – – – – – – – –
Gabon ................................. – – – 65 – – – – – –
Germany ............................. – – – 48 – – – – – –
Guatemala .......................... 277 – – – – – – – – –
India .................................... – – – 1,033 – – – – – –
Indonesia ............................ – – – – – – – – – –
Italy ..................................... – – – – – – – – – –
Korea, South ....................... – – – – – – – – – –
Latvia .................................. – – – – – – – – – –
Lithuania ............................. – – – – – – – – – –
Malaysia ............................. – – – – – – – – – –
Mexico ................................ 15,405 – 36 125 – – – – 175 175
Netherlands ........................ – – – 145 – – – – – –
Netherlands Antilles ............ – – – – – – – – – –
Norway ............................... – – – – – – – – – –
Oman .................................. 15 – – – – – – – – –
Portugal .............................. – – – – – – – – – –
Russia ................................. – – – 6,344 – – – – – –
Spain .................................. – – – – – – – – – –
Sweden ............................... – – – – – – – – – –
Syria ................................... – – – – – – – – – –
Trinidad and Tobago .......... 380 – – – – – – – – –
United Kingdom .................. 517 – – – – – – – – –
Vietnam .............................. – – – – – – – – – –
Virgin Islands, U.S. ............. – – – – – – – – – –
Yemen ................................ – – – – – – – – – –
Other ................................... 0 0 0 181 – – – – 51 51
Total ....................................... 102,250 8 36 11,168 – – – – 967 967
Persian Gulf3 ......................... 41,385 – – – – – – – – –
See footnotes at end of table.
U. S. Energy Information Administration/Petroleum Supply Annual 2016, Volume 2

Table 29. PAD District 3 - Imports of Crude Oil and Petroleum Products by Country of Origin, December 2016(Thousand Barrels) — Continued
Country of Origin
Oxygenates Renewable Fuels Distillate Fuel Oil
MethylTertiary
ButylEther
(MTBE)
OtherOxygen-
atesFuel
Ethanol
Biomass-BasedDiesel
OtherRenewable
Diesel
OtherRenewable
Fuels
15 ppmsulfur and
under
Greaterthan 15ppm to 500 ppm
sulfur501 to
2000 ppm
Greaterthan 2000
ppm Total
OPEC ..................................... – – – 68 – – – – 150 – 150Algeria ................................ – – – – – – – – – – –
Angola ................................ – – – – – – – – – – –
Ecuador .............................. – – – – – – – – – – –
Iran ..................................... – – – – – – – – – – –
Iraq ..................................... – – – – – – – – – – –
Kuwait ................................. – – – – – – – – – – –
Libya ................................... – – – – – – – – – – –
Nigeria ................................ – – – – – – – – – – –
Qatar ................................... – – – – – – – – – – –
Saudi Arabia ....................... – – – – – – – – – – –
United Arab Emirates ......... – – – – – – – – – – –
Venezuela ........................... – – – – – – – – 150 – 150
Non-OPEC ............................. 221 70 – 979 – – – – – 18 18Argentina ............................ 44 – – 816 – – – – – – –
Aruba .................................. – – – – – – – – – – –
Australia .............................. – – – – – – – – – – –
Bahamas ............................ – – – – – – – – – – –
Bahrain ............................... – – – – – – – – – – –
Belgium ............................... 70 – – – – – – – – – –
Brazil ................................... – 70 – – – – – – – – –
Brunei ................................. – – – – – – – – – – –
Cameroon ........................... – – – – – – – – – – –
Canada ............................... – – – 95 – – – – – – –
Chad ................................... – – – – – – – – – – –
China .................................. – – – – – – – – – – –
Colombia ............................ – – – – – – – – – – –
Congo (Brazzaville) ............ – – – – – – – – – – –
Denmark ............................. – – – – – – – – – – –
Egypt .................................. – – – – – – – – – – –
Equatorial Guinea ............... – – – – – – – – – – –
Estonia ................................ – – – – – – – – – – –
Finland ................................ – – – – – – – – – – –
France ................................ – – – – – – – – – – –
Gabon ................................. – – – – – – – – – – –
Germany ............................. 17 – – – – – – – – – –
Guatemala .......................... – – – – – – – – – – –
India .................................... – – – – – – – – – 18 18
Indonesia ............................ – – – 68 – – – – – – –
Italy ..................................... – – – – – – – – – – –
Korea, South ....................... – – – – – – – – – – –
Latvia .................................. – – – – – – – – – – –
Lithuania ............................. – – – – – – – – – – –
Malaysia ............................. – – – – – – – – – – –
Mexico ................................ – – – – – – – – – – –
Netherlands ........................ 90 – – – – – – – – – –
Netherlands Antilles ............ – – – – – – – – – – –
Norway ............................... – – – – – – – – – – –
Oman .................................. – – – – – – – – – – –
Portugal .............................. – – – – – – – – – – –
Russia ................................. – – – – – – – – – – –
Spain .................................. – – – – – – – – – – –
Sweden ............................... – – – – – – – – – – –
Syria ................................... – – – – – – – – – – –
Trinidad and Tobago .......... – – – – – – – – – – –
United Kingdom .................. – – – – – – – – – – –
Vietnam .............................. – – – – – – – – – – –
Virgin Islands, U.S. ............. – – – – – – – – – – –
Yemen ................................ – – – – – – – – – – –
Other ................................... 0 0 – 0 – – – – 0 0 0
Total ....................................... 221 70 – 979 – – – – 150 18 168
Persian Gulf3 ......................... – – – – – – – – – – –
See footnotes at end of table.
U. S. Energy Information Administration/Petroleum Supply Annual 2016, Volume 2

Table 29. PAD District 3 - Imports of Crude Oil and Petroleum Products by Country of Origin, December 2016(Thousand Barrels) — Continued
Country of Origin
Kerosene
FinishedAviationGasoline
AviationGasolineBlending
Components
Kerosene-Type Jet
FuelSpecial
Naphthas
Residual Fuel Oil
Less than 0.31 % sulfur
0.31 to 1.00 % sulfur
Greater than1.00 % sulfur Total
OPEC ..................................... – – – – – – – 402 402Algeria ................................ – – – – – – – – –
Angola ................................ – – – – – – – – –
Ecuador .............................. – – – – – – – – –
Iran ..................................... – – – – – – – – –
Iraq ..................................... – – – – – – – – –
Kuwait ................................. – – – – – – – – –
Libya ................................... – – – – – – – – –
Nigeria ................................ – – – – – – – – –
Qatar ................................... – – – – – – – – –
Saudi Arabia ....................... – – – – – – – – –
United Arab Emirates ......... – – – – – – – – –
Venezuela ........................... – – – – – – – 402 402
Non-OPEC ............................. – 28 – – 254 199 – 812 1,011Argentina ............................ – – – – – – – – –
Aruba .................................. – – – – – – – – –
Australia .............................. – – – – – – – – –
Bahamas ............................ – – – – – – – – –
Bahrain ............................... – – – – – – – – –
Belgium ............................... – – – – – – – – –
Brazil ................................... – – – – 23 – – – –
Brunei ................................. – – – – – – – – –
Cameroon ........................... – – – – – – – – –
Canada ............................... – – – – – – – – –
Chad ................................... – – – – – – – – –
China .................................. – – – – – – – – –
Colombia ............................ – – – – – – – – –
Congo (Brazzaville) ............ – – – – – – – – –
Denmark ............................. – – – – – – – – –
Egypt .................................. – – – – – – – – –
Equatorial Guinea ............... – – – – – – – – –
Estonia ................................ – – – – – – – – –
Finland ................................ – – – – – – – – –
France ................................ – – – – – – – – –
Gabon ................................. – – – – – – – – –
Germany ............................. – 28 – – – – – – –
Guatemala .......................... – – – – – – – – –
India .................................... – – – – – – – – –
Indonesia ............................ – – – – – – – – –
Italy ..................................... – – – – – – – – –
Korea, South ....................... – – – – 123 – – – –
Latvia .................................. – – – – – – – – –
Lithuania ............................. – – – – – – – – –
Malaysia ............................. – – – – – – – – –
Mexico ................................ – – – – – – – 752 752
Netherlands ........................ – – – – – – – – –
Netherlands Antilles ............ – – – – – – – – –
Norway ............................... – – – – – – – – –
Oman .................................. – – – – – – – – –
Portugal .............................. – – – – – – – – –
Russia ................................. – – – – – 199 – 60 259
Spain .................................. – – – – – – – – –
Sweden ............................... – – – – – – – – –
Syria ................................... – – – – – – – – –
Trinidad and Tobago .......... – – – – – – – – –
United Kingdom .................. – – – – – – – – –
Vietnam .............................. – – – – – – – – –
Virgin Islands, U.S. ............. – – – – – – – – –
Yemen ................................ – – – – – – – – –
Other ................................... – 0 – – 108 0 – 0 0
Total ....................................... – 28 – – 254 199 – 1,214 1,413
Persian Gulf3 ......................... – – – – – – – – –
See footnotes at end of table.
U. S. Energy Information Administration/Petroleum Supply Annual 2016, Volume 2

Table 29. PAD District 3 - Imports of Crude Oil and Petroleum Products by Country of Origin, December 2016(Thousand Barrels) — Continued
Country of Origin
Petrochemical Feedstocks
WaxesPetroleum
Coke
Asphaltand Road
Oil Lubricants
Miscellan-eous
ProductsTotal
Products
TotalCrudeOil and
Products
Daily Average
Crude Oil Products TotalNaphtha
OtherOils
OPEC ..................................... – – – – – 269 – 3,297 67,902 2,084 106 2,190Algeria ................................ – – – – – – – 2,411 3,988 51 78 129
Angola ................................ – – – – – – – – 908 29 – 29
Ecuador .............................. – – – – – – – – 515 17 – 17
Iran ..................................... – – – – – – – – – – – –
Iraq ..................................... – – – – – – – – 15,210 491 – 491
Kuwait ................................. – – – – – – – – 4,796 155 – 155
Libya ................................... – – – – – – – – – – – –
Nigeria ................................ – – – – – – – – – – – –
Qatar ................................... – – – – – 269 – 269 269 – 9 9
Saudi Arabia ....................... – – – – – – – – 21,379 690 – 690
United Arab Emirates ......... – – – – – – – – – – – –
Venezuela ........................... – – – – – – – 552 20,772 652 18 670
Non-OPEC ............................. 707 5 51 113 – 413 – 13,578 51,223 1,214 438 1,652Argentina ............................ – – – 113 – – – 973 1,160 6 31 37
Aruba .................................. – – – – – – – – – – – –
Australia .............................. – – – – – – – – – – – –
Bahamas ............................ – – – – – – – – – – – –
Bahrain ............................... – – – – – 43 – 43 43 – 1 1
Belgium ............................... – – – – – 2 – 980 980 – 32 32
Brazil ................................... – – – – – – – 93 3,218 101 3 104
Brunei ................................. – – – – – – – – – – – –
Cameroon ........................... – – – – – – – – – – – –
Canada ............................... – – – – – – – 103 12,141 388 3 392
Chad ................................... – – – – – – – – – – – –
China .................................. – – 26 – – – – 26 26 – 1 1
Colombia ............................ – – – – – – – 415 6,116 184 13 197
Congo (Brazzaville) ............ – – – – – – – – – – – –
Denmark ............................. – – – – – – – 169 169 – 5 5
Egypt .................................. – – – – – – – – – – – –
Equatorial Guinea ............... – – – – – – – – – – – –
Estonia ................................ – – – – – – – – – – – –
Finland ................................ – – – – – 6 – 6 6 – 0 0
France ................................ – 5 – – – 12 – 17 17 – 1 1
Gabon ................................. – – – – – – – 65 65 – 2 2
Germany ............................. – – – – – 4 – 98 98 – 3 3
Guatemala .......................... – – – – – – – – 277 9 – 9
India .................................... – – – – – – – 1,051 1,051 – 34 34
Indonesia ............................ – – – – – – – 140 140 – 5 5
Italy ..................................... – – – – – 2 – 3 3 – 0 0
Korea, South ....................... – – – – – 244 – 367 367 – 12 12
Latvia .................................. – – – – – – – – – – – –
Lithuania ............................. – – – – – – – – – – – –
Malaysia ............................. – – 9 – – – – 9 9 – 0 0
Mexico ................................ 316 – – – – – – 1,404 16,809 497 45 542
Netherlands ........................ 14 – – – – – – 249 249 – 8 8
Netherlands Antilles ............ – – – – – – – – – – – –
Norway ............................... – – – – – – – – – – – –
Oman .................................. – – – – – – – – 15 0 – 0
Portugal .............................. – – – – – – – – – – – –
Russia ................................. – – – – – – – 6,603 6,603 – 213 213
Spain .................................. – – – – – – – – – – – –
Sweden ............................... – – – – – – – – – – – –
Syria ................................... – – – – – – – – – – – –
Trinidad and Tobago .......... – – – – – – – – 380 12 – 12
United Kingdom .................. 186 – – – – 16 – 202 719 17 7 23
Vietnam .............................. – – – – – – – – – – – –
Virgin Islands, U.S. ............. – – – – – – – – – – – –
Yemen ................................ – – – – – – – – – – – –
Other ................................... 191 0 16 0 – 84 – 562 562 0 19 19
Total ....................................... 707 5 51 113 – 682 – 16,875 119,125 3,298 544 3,843
Persian Gulf3 ......................... – – – – – 312 – 312 41,697 1,335 10 1,345
–= No Data Reported.
1Crude oil and unfinished oils are reported by the PAD District in which they are to be processed; all other products are reported by the PAD District of entry.
2 Includes crude oil imported for storage in the Strategic Petroleum Reserve.
3 Includes Bahrain, Iran, Iraq, Kuwait, Qatar, Saudi Arabia, and United Arab Emirates.
Note: Totals may not equal sum of components due to independent rounding.
Source: Energy Information Administration (EIA) Form EIA-814, "Monthly Imports Report."
U. S. Energy Information Administration/Petroleum Supply Annual 2016, Volume 2