table 1. number and percent distribution of nursing homes ... · table 3. number and rate per 100...
TRANSCRIPT

Nursing Home Facilities [ December 2006 [ Page 1
Table 1. Number and percent distribution of nursing homes by selected facility characteristics, according to number of beds, beds per nursing home, current residents, and occupancy rate: United States, 2004
Nursing homes Beds Current residents
Facility characteristic Number Percent
distribution Number
Beds per nursing home Number
Occupancy rate1
Total . . . . . . . . . . . . . . . . . . . . . . . . . . . . . . .
Ownership
Proprietary . . . . . . . . . . . . . . . . . . . . . . . . . . . Voluntary nonprofit . . . . . . . . . . . . . . . . . . . . . . Government and other. . . . . . . . . . . . . . . . . . . .
Certification2
Certified. . . . . . . . . . . . . . . . . . . . . . . . . . . . . Medicare and Medicaid . . . . . . . . . . . . . . . . . . . Medicare only . . . . . . . . . . . . . . . . . . . . . . . . . Medicaid only . . . . . . . . . . . . . . . . . . . . . . . . .
Beds
Fewer than 50 beds . . . . . . . . . . . . . . . . . . . . . 50–99 beds . . . . . . . . . . . . . . . . . . . . . . . . . . 100–199 beds . . . . . . . . . . . . . . . . . . . . . . . . . 200 beds or more. . . . . . . . . . . . . . . . . . . . . . .
Geographic region
Northeast . . . . . . . . . . . . . . . . . . . . . . . . . . . . Midwest. . . . . . . . . . . . . . . . . . . . . . . . . . . . . South . . . . . . . . . . . . . . . . . . . . . . . . . . . . . . West. . . . . . . . . . . . . . . . . . . . . . . . . . . . . . .
Location
Metropolitan statistical area. . . . . . . . . . . . . . . . . Micropolitan statistical area . . . . . . . . . . . . . . . . . Other location . . . . . . . . . . . . . . . . . . . . . . . .
Affiliation
Chain . . . . . . . . . . . . . . . . . . . . . . . . . . . . . . Independent . . . . . . . . . . . . . . . . . . . . . . . . . .
16,100
9,900 5,000 1,200
15,800 14,100
*700 1,100
2,200 6,000 6,800 1,000
2,800 5,300 5,400 2,600
10,900 2,600 2,600
8,700 7,400
100.0
61.5 30.8 7.7
98.5 87.6 *4.1 6.9
13.9 37.3 42.5 6.2
17.4 33.0 33.6 16.0
67.7 16.2 16.0
54.2 45.8
1,730,000
1,074,200 503,600 152,200
1,708,900 1,599,600
*33,100 76,200
75,800 454,700 903,100 296,400
381,500 526,600 585,600 236,200
1,290,900 242,200 196,900
939,400 790,600
107.6
108.6 101.6 123.6
107.8 113.5 *50.6 69.0
33.8 75.7
132.0 298.2
136.0 99.4
108.3 92.1
118.5 92.9 76.3
107.9 107.2
1,492,200
918,000 440,300 133,900
1,475,600 1,379,700
28,100 67,900
62,200 422,600 788,500 218,900
331,300 448,000 501,500 211,400
1,127,800 202,000 162,400
812,500 679,700
86.3
85.5 87.4 88.0
86.4 86.3 85.0 89.1
82.1 92.9 87.3 73.9
86.8 85.1 85.6 89.5
87.4 83.4 82.5
86.5 86.0
* Estimate does not meet standard of reliability or precision because the sample size is less than 30. Estimates accompanied by an asterisk (*) indicate that the sample size is between 30 and 59, orthe sample size is greater than 59 but has a relative standard error of 30 percent or more.1Occupancy rate is calculated by dividing residents by available beds.2Estimates for nursing homes that are not certified are not shown because the sample size was less than 30 and figures are unreliable.
NOTES: Numbers may not add to totals because of rounding. Percentages and rates are based on the unrounded numbers.

Table 2. Number of full-time equivalents by type of nursing staff and employment status and selected facility characteristics: United States, 2004
Facility characteristic Total
Totalnursing
staffContractworkers
Registered nurses Licensed practical nurses Certified nursing assistants Nurse aides and orderlies
Total1 On staff2 Total1 On staff2 Total1 On staff2 Total1 On staff
Total . . . . . . . . . . . . . . . . . . . . . . . . . . 936,000 917,400 18,600 122,400 119,500 192,100 184,600 608,900 600,800 12,500 12,500
Type of ownership
Proprietary . . . . . . . . . . . . . . . . . . . . . . 556,500 548,200 8,200 67,400 66,200 118,600 114,700 362,900 359,900 7,500 7,400Voluntary nonprofit . . . . . . . . . . . . . . . . . 286,500 279,200 7,300 41,200 40,000 55,200 52,700 186,100 182,500 4,000 4,000Government and other . . . . . . . . . . . . . . . 93,100 89,900 3,100 13,800 13,300 18,300 17,200 59,900 58,400 *1,000 *1,000
Beds
Fewer than 50 beds . . . . . . . . . . . . . . . . 44,800 43,600 *1,200 6,900 6,700 8,500 8,300 28,700 27,900 *700 *70050–99 . . . . . . . . . . . . . . . . . . . . . . . . . 243,300 240,800 2,500 32,800 32,300 48,000 47,100 157,300 156,200 5,200 5,200100–199 . . . . . . . . . . . . . . . . . . . . . . . 488,000 478,800 9,200 61,500 60,200 103,100 98,600 318,300 314,900 5,100 5,100200 beds or more . . . . . . . . . . . . . . . . . . 159,900 154,300 5,600 21,300 20,300 32,500 30,600 104,600 101,900 *1,600 *1,600
Geographic region
Northeast . . . . . . . . . . . . . . . . . . . . . . . 222,400 214,900 7,500 34,400 32,900 45,000 41,700 140,900 138,200 *2,100 *2,100Midwest . . . . . . . . . . . . . . . . . . . . . . . . 267,700 263,700 4,000 35,900 35,200 51,000 49,300 176,300 174,700 4,400 4,400South . . . . . . . . . . . . . . . . . . . . . . . . . 316,500 311,100 5,400 33,800 33,500 71,100 69,200 208,200 205,000 3,500 3,400West . . . . . . . . . . . . . . . . . . . . . . . . . . 129,400 127,800 *1,600 18,300 18,000 25,100 24,400 83,500 82,900 *2,600 *2,600
Location
Metropolitan statistical area . . . . . . . . . . . . 702,400 686,900 15,500 93,900 91,200 145,800 138,800 455,300 449,400 7,500 7,400Micropolitan statistical area . . . . . . . . . . . . 131,400 129,800 *1,600 15,500 15,300 27,300 26,900 85,400 84,300 3,300 3,300Other location . . . . . . . . . . . . . . . . . . . . 102,200 100,700 *1,500 13,100 13,000 19,000 18,800 68,300 67,100 *1800 *1800
Affiliation
Chain . . . . . . . . . . . . . . . . . . . . . . . . . 487,600 482,300 5,300 62,800 61,700 102,900 100,100 316,700 315,300 5,200 5,200Independent . . . . . . . . . . . . . . . . . . . . . 448,500 435,200 13,300 59,600 57,800 89,300 84,500 292,200 285,500 7,300 7,300
* Estimate does not meet standard of reliability or precision because the sample size is less than 30. Estimates accompanied by an asterisk (*)indicate that the sample size is between 30 and 59, or the sample size is greater than 59, but has a relativestandard error of 30 percent or more.1Includes contract workers. Contract workers not shown separately due to low estimates.2Full-time equivalents (FTEs) for employee (on staff) registered nurses (RNs), licensed practical nurses (LPNs), and certified nursing assistants (CNAs) were imputed in cases where facilities had missing or outlier values. The threshold of FTEs per 100beds used to identify outliers for RNs and LPNs was a ratio greater than 30 and, for CNAs, a ratio greater than 100. For each type of nursing staff, imputation for missing and outlier cases was the number of beds at a facility times the mean number ofFTEs per bed calculated for the cases with usable data.
NOTE: Numbers may not add to totals because of rounding.
Nursing
Hom
eF
acilities[
Decem
ber2006
[P
age2
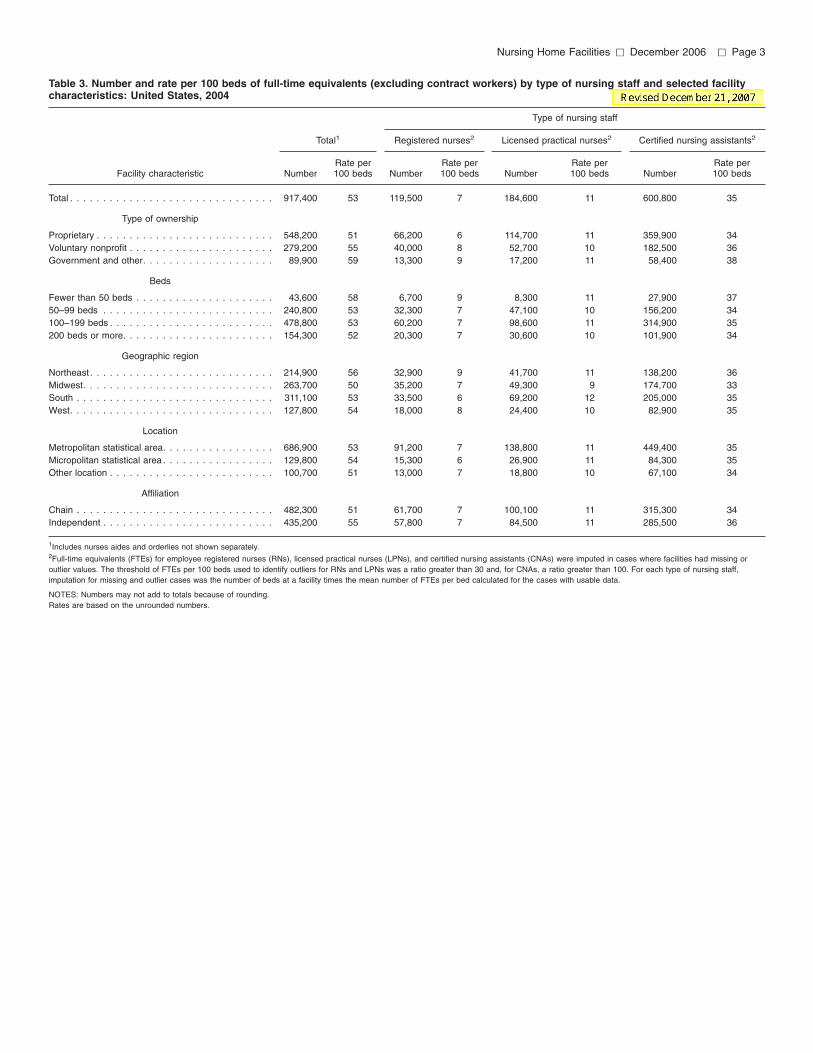
Table 3. Number and rate per 100 beds of full-time equivalents (excluding contract workers) by type of nursing staff and selected facilitycharacteristics: United States, 2004
Facility characteristic
Total1
Type of nursing staff
Registered nurses2 Licensed practical nurses2 Certified nursing assistants2
NumberRate per100 beds Number
Rate per100 beds Number
Rate per100 beds Number
Rate per100 beds
Total . . . . . . . . . . . . . . . . . . . . . . . . . . . . . . . 917,400 53 119,500 7 184,600 11 600,800 35
Type of ownership
Proprietary . . . . . . . . . . . . . . . . . . . . . . . . . . . 548,200 51 66,200 6 114,700 11 359,900 34Voluntary nonprofit . . . . . . . . . . . . . . . . . . . . . . 279,200 55 40,000 8 52,700 10 182,500 36Government and other. . . . . . . . . . . . . . . . . . . . 89,900 59 13,300 9 17,200 11 58,400 38
Beds
Fewer than 50 beds . . . . . . . . . . . . . . . . . . . . . 43,600 58 6,700 9 8,300 11 27,900 3750–99 beds . . . . . . . . . . . . . . . . . . . . . . . . . . 240,800 53 32,300 7 47,100 10 156,200 34100–199 beds . . . . . . . . . . . . . . . . . . . . . . . . . 478,800 53 60,200 7 98,600 11 314,900 35200 beds or more. . . . . . . . . . . . . . . . . . . . . . . 154,300 52 20,300 7 30,600 10 101,900 34
Geographic region
Northeast . . . . . . . . . . . . . . . . . . . . . . . . . . . . 214,900 56 32,900 9 41,700 11 138,200 36Midwest. . . . . . . . . . . . . . . . . . . . . . . . . . . . . 263,700 50 35,200 7 49,300 9 174,700 33South . . . . . . . . . . . . . . . . . . . . . . . . . . . . . . 311,100 53 33,500 6 69,200 12 205,000 35West. . . . . . . . . . . . . . . . . . . . . . . . . . . . . . . 127,800 54 18,000 8 24,400 10 82,900 35
Location
Metropolitan statistical area. . . . . . . . . . . . . . . . . 686,900 53 91,200 7 138,800 11 449,400 35Micropolitan statistical area . . . . . . . . . . . . . . . . . 129,800 54 15,300 6 26,900 11 84,300 35Other location . . . . . . . . . . . . . . . . . . . . . . . . . 100,700 51 13,000 7 18,800 10 67,100 34
Affiliation
Chain . . . . . . . . . . . . . . . . . . . . . . . . . . . . . . 482,300 51 61,700 7 100,100 11 315,300 34Independent . . . . . . . . . . . . . . . . . . . . . . . . . . 435,200 55 57,800 7 84,500 11 285,500 36
1Includes nurses aides and orderlies not shown separately.2Full-time equivalents (FTEs) for employee registered nurses (RNs), licensed practical nurses (LPNs), and certified nursing assistants (CNAs) were imputed in cases where facilities had missing oroutlier values. The threshold of FTEs per 100 beds used to identify outliers for RNs and LPNs was a ratio greater than 30 and, for CNAs, a ratio greater than 100. For each type of nursing staff,imputation for missing and outlier cases was the number of beds at a facility times the mean number of FTEs per bed calculated for the cases with usable data.
NOTES: Numbers may not add to totals because of rounding.Rates are based on the unrounded numbers.
Nursing Home Facilities [ December 2006 [ Page 3

Nursing Home Facilities [ December 2006 [ Page 4
Table 4. Number and percentage of nursing homes by arrangements for providing medical services and selected facility characteristics: United States, 2004
Private physicians from community Contracts with physician group practices Physicians on staff
Facility characteristic Total Number Percent Number Percent Number Percent
All facilities . . . . . . . . . . . . . . . . . . . . . . 16,100 13,800 85.9 4,800 30.1 3,200 19.6
Ownership
Proprietary . . . . . . . . . . . . . . . . . . . . . . Voluntary nonprofit and other1 . . . . . . . . . .
9,900 6,200
8,800 5,000
88.9 81.0
3,000 1,800
30.6 29.5
1,600 1,500
16.7 24.3
Beds
Fewer than 50 beds . . . . . . . . . . . . . . . . 50–99 beds. . . . . . . . . . . . . . . . . . . . . . 100 beds or more . . . . . . . . . . . . . . . . . .
2,200 6,000 7,800
1,700 5,300 6,800
76.9 88.2 86.6
*700 1,900 2,300
*14.0 31.1 29.3
*700 900
1,500
*22.0 15.6 19.2
Geographic region
Northeast . . . . . . . . . . . . . . . . . . . . . . . Midwest . . . . . . . . . . . . . . . . . . . . . . . . South . . . . . . . . . . . . . . . . . . . . . . . . . West . . . . . . . . . . . . . . . . . . . . . . . . . .
2,800 5,300 5,400 2,600
2,300 4,600 4,600 2,200
82.0 87.4 85.6 87.6
*1000 1,500 1,500 *800
*20.0 28.9 27.6
*17.0
*800 900
1,100 *500
*23.0 16.5 19.4
*15.0
Location
Metropolitan statistical area . . . . . . . . . . . . Micropolitan statistical area . . . . . . . . . . . . Other location . . . . . . . . . . . . . . . . . . . .
10,900 2,600 2,600
9,300 2,400 2,200
85.2 90.7 83.7
3,700 *600 *600
33.7 *23.3 *11.0
2,200 *500 *500
20.0 *16.0 *14.0
Affiliation
Chain . . . . . . . . . . . . . . . . . . . . . . . . . Independent . . . . . . . . . . . . . . . . . . . . .
8,700 7,400
7,400 6,400
85.3 86.6
2,800 2,000
32.6 27.1
1,600 1,600
17.8 21.7
* Estimate does not meet standard of reliability or precision because the sample size is less than 30. Estimates accompanied by an asterisk (*) indicate that the sample size is between 30 and 59, orthe sample size is greater than 59, but has a relative standard error of 30 percent or more.1Includes state and local government owned facilities.
NOTES: Numbers may not add to totals because of rounding. Percentages are based on the unrounded numbers.
Nursing Home Facilities [ December 2006 [ Page 5
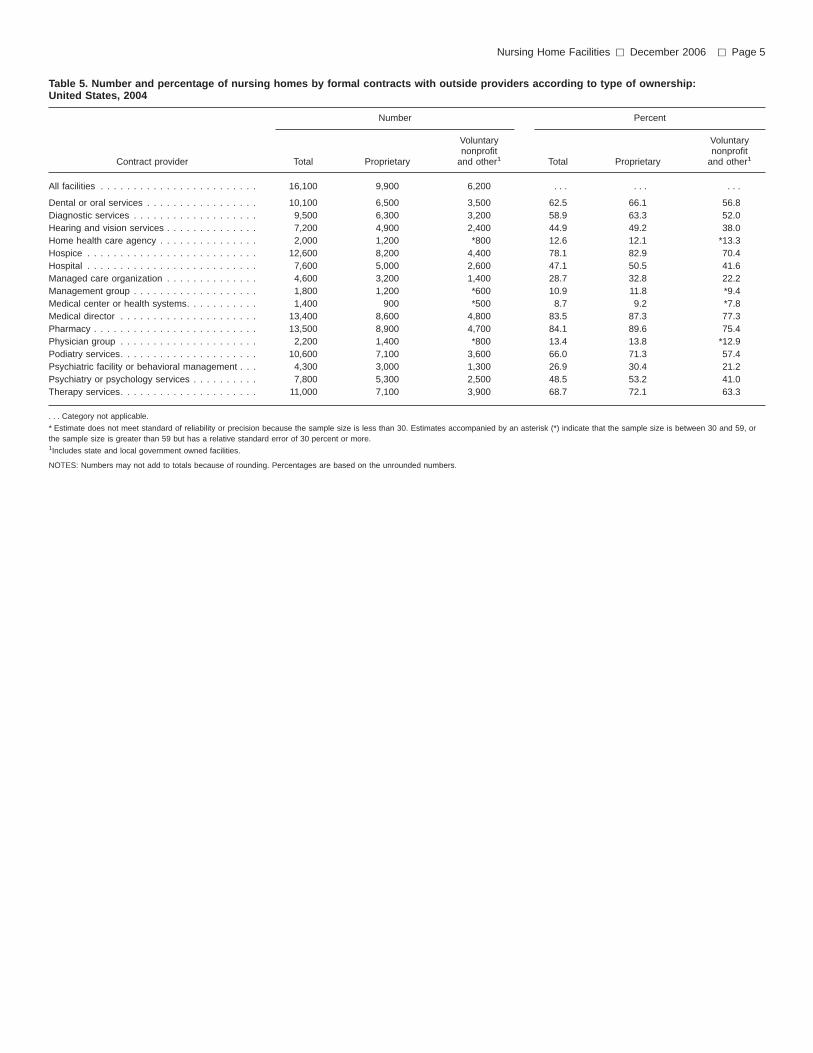
Table 5. Number and percentage of nursing homes by formal contracts with outside providers according to type of ownership: United States, 2004
Number Percent
Voluntary Voluntary nonprofit nonprofit
Contract provider Total Proprietary and other1 Total Proprietary and other1
All facilities . . . . . . . . . . . . . . . . . . . . . . . . 16,100 9,900 6,200 . . . . . . . . .
Dental or oral services . . . . . . . . . . . . . . . . . 10,100 6,500 3,500 62.5 66.1 56.8 Diagnostic services . . . . . . . . . . . . . . . . . . . 9,500 6,300 3,200 58.9 63.3 52.0 Hearing and vision services . . . . . . . . . . . . . . 7,200 4,900 2,400 44.9 49.2 38.0 Home health care agency . . . . . . . . . . . . . . . 2,000 1,200 *800 12.6 12.1 *13.3 Hospice . . . . . . . . . . . . . . . . . . . . . . . . . . 12,600 8,200 4,400 78.1 82.9 70.4 Hospital . . . . . . . . . . . . . . . . . . . . . . . . . . 7,600 5,000 2,600 47.1 50.5 41.6 Managed care organization . . . . . . . . . . . . . . 4,600 3,200 1,400 28.7 32.8 22.2 Management group . . . . . . . . . . . . . . . . . . . 1,800 1,200 *600 10.9 11.8 *9.4 Medical center or health systems. . . . . . . . . . . 1,400 900 *500 8.7 9.2 *7.8 Medical director . . . . . . . . . . . . . . . . . . . . . 13,400 8,600 4,800 83.5 87.3 77.3 Pharmacy . . . . . . . . . . . . . . . . . . . . . . . . . 13,500 8,900 4,700 84.1 89.6 75.4 Physician group . . . . . . . . . . . . . . . . . . . . . 2,200 1,400 *800 13.4 13.8 *12.9 Podiatry services. . . . . . . . . . . . . . . . . . . . . 10,600 7,100 3,600 66.0 71.3 57.4 Psychiatric facility or behavioral management . . . 4,300 3,000 1,300 26.9 30.4 21.2Psychiatry or psychology services . . . . . . . . . . 7,800 5,300 2,500 48.5 53.2 41.0 Therapy services. . . . . . . . . . . . . . . . . . . . . 11,000 7,100 3,900 68.7 72.1 63.3
. . . Category not applicable.
* Estimate does not meet standard of reliability or precision because the sample size is less than 30. Estimates accompanied by an asterisk (*) indicate that the sample size is between 30 and 59, orthe sample size is greater than 59 but has a relative standard error of 30 percent or more.1Includes state and local government owned facilities.
NOTES: Numbers may not add to totals because of rounding. Percentages are based on the unrounded numbers.

Nursing Home Facilities [ December 2006 [ Page 6
Table 6. Number and percentage of nursing homes by contracts with outside providers and chain affiliation: United States, 2004
Affiliation
Number Percent
Contract provider Total Chain Independent Total Chain Independent
All facilities . . . . . . . . . . . . . . . . . . . . . . . . . . . 16,100 8,700 7,400 . . . . . . . . .
Dental or oral services. . . . . . . . . . . . . . . . . . . . 10,100 5,600 4,500 62.5 64.1 60.7 Diagnostic services. . . . . . . . . . . . . . . . . . . . . . 9,900 5,500 4,000 58.9 63.4 53.6 Hearing and vision services . . . . . . . . . . . . . . . . 7,200 4,200 3,000 44.9 48.2 41.0 Home health care agency. . . . . . . . . . . . . . . . . . 2,000 1,100 900 12.6 12.5 12.6 Hospice. . . . . . . . . . . . . . . . . . . . . . . . . . . . . 12,600 7,100 5,500 78.1 81.5 74.1 Hospital . . . . . . . . . . . . . . . . . . . . . . . . . . . . . 7,600 4,300 3,300 47.1 49.1 44.7 Managed care organization. . . . . . . . . . . . . . . . . 4,600 3,000 1,600 28.7 34.6 21.7 Management group. . . . . . . . . . . . . . . . . . . . . . 1,800 900 *800 10.9 10.8 *11.0 Medical center or health systems . . . . . . . . . . . . . 1,400 *800 *600 8.7 *9.0 *8.3 Medical director . . . . . . . . . . . . . . . . . . . . . . . . 13,400 7,600 5,900 83.5 86.9 79.4 Pharmacy . . . . . . . . . . . . . . . . . . . . . . . . . . . 13,500 7,700 5,900 84.1 88.0 79.6 Physician group . . . . . . . . . . . . . . . . . . . . . . . . 2,200 1,300 900 13.4 14.8 11.8 Podiatry services . . . . . . . . . . . . . . . . . . . . . . . 10,600 6,100 4,500 66.0 70.4 60.7 Psychiatric facility or behavioral management . . . . . 4,300 2,500 1,800 26.9 29.1 24.3 Psychiatry or psychology services . . . . . . . . . . . . 7,800 4,500 3,300 48.5 52.1 44.3 Therapy services . . . . . . . . . . . . . . . . . . . . . . . 11,000 6,000 5,100 68.7 68.4 69.1
. . . Category not applicable.
* Estimate does not meet standard of reliability or precision because the sample size is less than 30. Estimates accompanied by an asterisk (*) indicate that the sample size is between 30 and 59, or the sample size is greater than 59 but has a relative standard error of 30 percent or more.
NOTES: Numbers may not add to totals because of rounding. Percentages are based on the unrounded numbers.

Nursing Home Facilities [ December 2006 [ Page 7
Table 7. Number of nursing homes by selected resident care electronic information systems and facility characteristics: United States, 2004
Resident care electronic information systems
Admission Medication Patient Medication Daily personal discharge Physician dispensing Laboratory medical administration Dietary care by nursing
Facility characteristic Total orders orders orders procedures records information information assistants
All facilities. . . . . . . . . . . . . . . . . . . . 16,100 12,800 7,800 8,200 6,600 6,900 6,100 8,200 2,800
Ownership
Proprietary . . . . . . . . . . . . . . . . . . . . 9,900 7,900 5,000 5,000 3,800 4,300 3,800 5,400 1,900 Voluntary nonprofit and other1 . . . . . . . . 6,200 4,900 2,800 3,200 2,800 2,500 2,300 2,900 1,000
Beds
Fewer than 50 beds . . . . . . . . . . . . . . 2,200 1,600 1,100 1,200 1,100 900 1,000 900 *400 50–99 beds . . . . . . . . . . . . . . . . . . . 6,000 4,500 2,900 2,900 2,200 2,800 2,200 2,800 1,100 100 beds or more . . . . . . . . . . . . . . . 7,800 6,700 3,800 4,100 3,400 3,100 3,000 4,500 1,300
Geographic region
Northeast . . . . . . . . . . . . . . . . . . . . 2,800 2,000 *800 1,100 1,100 *800 *700 1,200 * Midwest . . . . . . . . . . . . . . . . . . . . . 5,300 4,200 2,300 2,600 2,200 2,400 2,000 2,600 1,000 South . . . . . . . . . . . . . . . . . . . . . . . 5,400 4,400 2,900 2,900 2,200 2,200 2,100 3,100 1,100 West . . . . . . . . . . . . . . . . . . . . . . . 2,600 2,100 1,700 1,700 1,200 1,500 1,400 1,300 *600
Location
Metropolitan statistical area . . . . . . . . . 10,900 8,600 4,900 5,400 4,500 4,400 3,800 5,700 1,700 Micropolitan statistical area . . . . . . . . . 2,600 2,100 1,600 1,500 1,100 1,300 1,300 1,400 700 Other location . . . . . . . . . . . . . . . . . 2,600 2,100 1,300 1,400 1,000 1,200 1,100 1,100 *500
Affiliation
Chain . . . . . . . . . . . . . . . . . . . . . . . 8,700 7,200 4,300 4,400 3,500 3,900 3,300 5,000 1,700 Independent . . . . . . . . . . . . . . . . . . . 7,400 5,600 3,500 3,800 3,200 3,000 2,800 3,300 1,100
* Estimate does not meet standard of reliability or precision because the sample size is less than 30. Estimates accompanied by an asterisk (*) indicate that the sample size is between 30 and 59, or the sample size is greater than 59, but has a relative standard error of 30 percent or more. 1Includes state and local government owned facilities.
NOTE: Numbers may not add to totals because of rounding.
2004
Nursing Home Facilities [ December 2006 [ Page 8
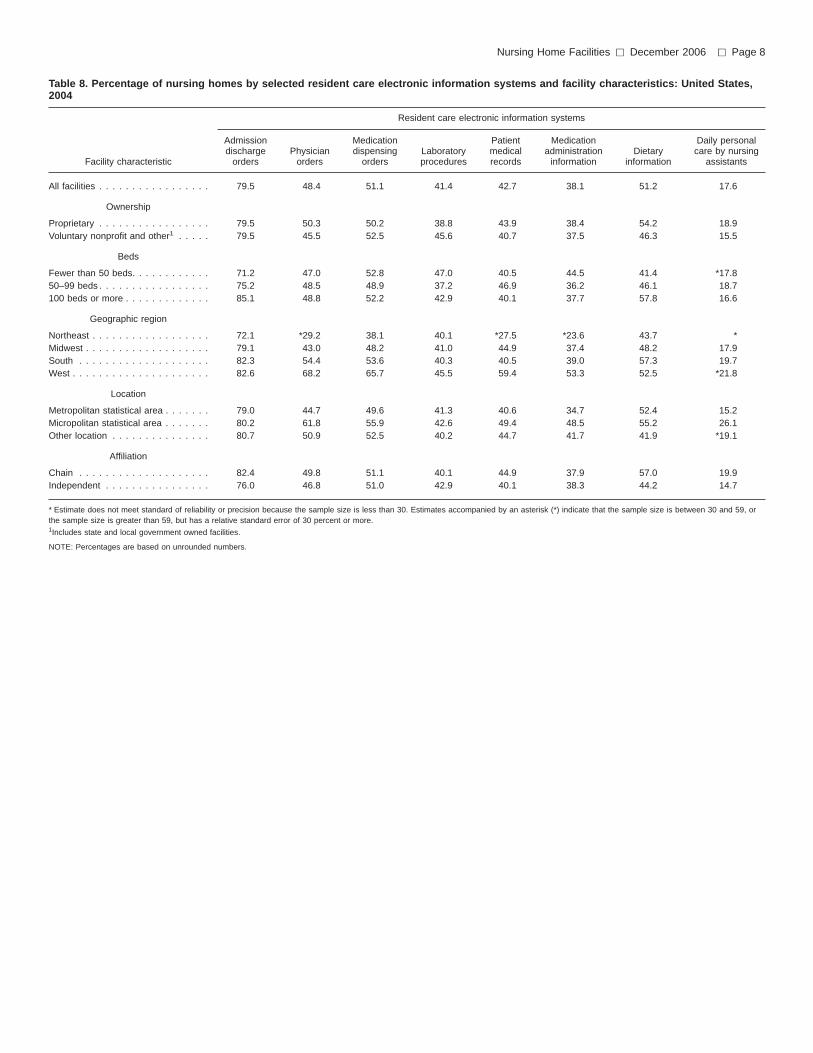
Table 8. Percentage of nursing homes by selected resident care electronic information systems and facility characteristics: United States,
Resident care electronic information systems
Admission Medication Patient Medication Daily personal discharge Physician dispensing Laboratory medical administration Dietary care by nursing
Facility characteristic orders orders orders procedures records information information assistants
All facilities . . . . . . . . . . . . . . . . . 79.5 48.4 51.1 41.4 42.7 38.1 51.2 17.6
Ownership
Proprietary . . . . . . . . . . . . . . . . . 79.5 50.3 50.2 38.8 43.9 38.4 54.2 18.9 Voluntary nonprofit and other1 . . . . . 79.5 45.5 52.5 45.6 40.7 37.5 46.3 15.5
Beds
Fewer than 50 beds. . . . . . . . . . . . 71.2 47.0 52.8 47.0 40.5 44.5 41.4 *17.8 50–99 beds . . . . . . . . . . . . . . . . . 75.2 48.5 48.9 37.2 46.9 36.2 46.1 18.7 100 beds or more . . . . . . . . . . . . . 85.1 48.8 52.2 42.9 40.1 37.7 57.8 16.6
Geographic region
Northeast . . . . . . . . . . . . . . . . . . 72.1 *29.2 38.1 40.1 *27.5 *23.6 43.7 * Midwest . . . . . . . . . . . . . . . . . . . 79.1 43.0 48.2 41.0 44.9 37.4 48.2 17.9 South . . . . . . . . . . . . . . . . . . . . 82.3 54.4 53.6 40.3 40.5 39.0 57.3 19.7 West . . . . . . . . . . . . . . . . . . . . . 82.6 68.2 65.7 45.5 59.4 53.3 52.5 *21.8
Location
Metropolitan statistical area . . . . . . . 79.0 44.7 49.6 41.3 40.6 34.7 52.4 15.2 Micropolitan statistical area . . . . . . . 80.2 61.8 55.9 42.6 49.4 48.5 55.2 26.1 Other location . . . . . . . . . . . . . . . 80.7 50.9 52.5 40.2 44.7 41.7 41.9 *19.1
Affiliation
Chain . . . . . . . . . . . . . . . . . . . . 82.4 49.8 51.1 40.1 44.9 37.9 57.0 19.9 Independent . . . . . . . . . . . . . . . . 76.0 46.8 51.0 42.9 40.1 38.3 44.2 14.7
* Estimate does not meet standard of reliability or precision because the sample size is less than 30. Estimates accompanied by an asterisk (*) indicate that the sample size is between 30 and 59, or the sample size is greater than 59, but has a relative standard error of 30 percent or more. 1Includes state and local government owned facilities.
NOTE: Percentages are based on unrounded numbers.
2004
Nursing Home Facilities [ December 2006 [ Page 9
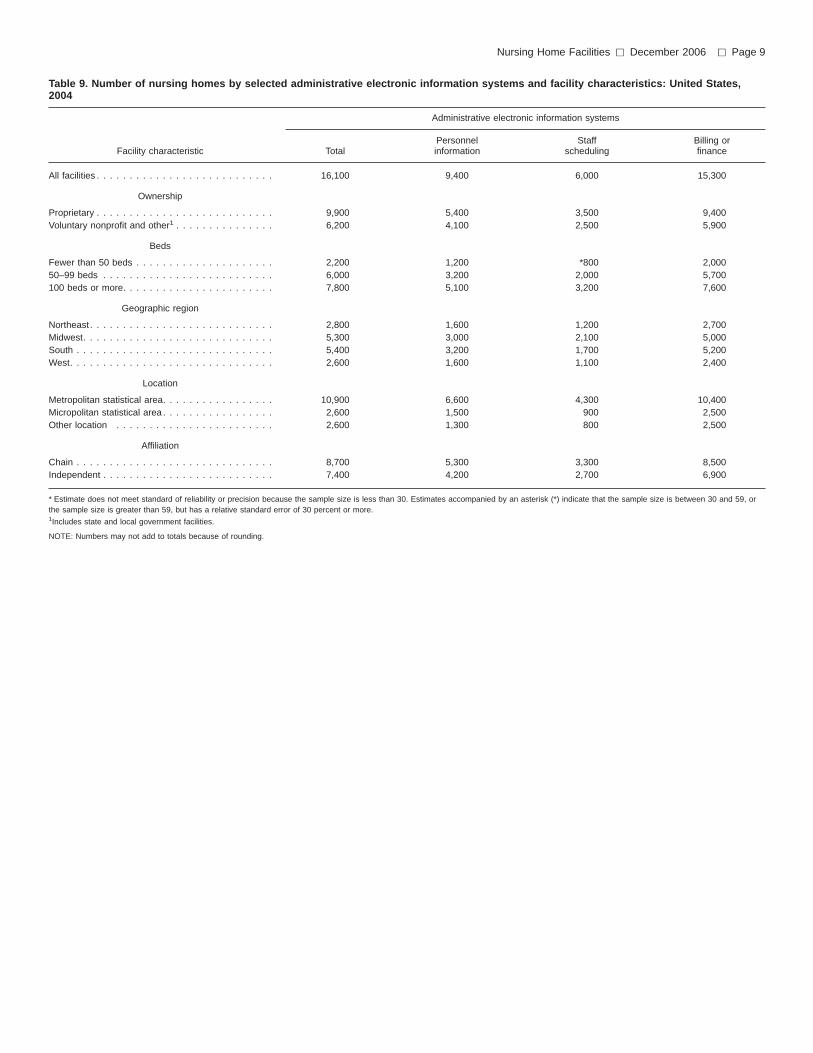
Table 9. Number of nursing homes by selected administrative electronic information systems and facility characteristics: United States,
Administrative electronic information systems
Personnel Staff Billing or Facility characteristic Total information scheduling finance
All facilities . . . . . . . . . . . . . . . . . . . . . . . . . . . 16,100 9,400 6,000 15,300
Ownership
Proprietary . . . . . . . . . . . . . . . . . . . . . . . . . . . 9,900 5,400 3,500 9,400 Voluntary nonprofit and other1 . . . . . . . . . . . . . . . 6,200 4,100 2,500 5,900
Beds
Fewer than 50 beds . . . . . . . . . . . . . . . . . . . . . 2,200 1,200 *800 2,000 50–99 beds . . . . . . . . . . . . . . . . . . . . . . . . . . 6,000 3,200 2,000 5,700 100 beds or more. . . . . . . . . . . . . . . . . . . . . . . 7,800 5,100 3,200 7,600
Geographic region
Northeast . . . . . . . . . . . . . . . . . . . . . . . . . . . . 2,800 1,600 1,200 2,700 Midwest. . . . . . . . . . . . . . . . . . . . . . . . . . . . . 5,300 3,000 2,100 5,000 South . . . . . . . . . . . . . . . . . . . . . . . . . . . . . . 5,400 3,200 1,700 5,200 West. . . . . . . . . . . . . . . . . . . . . . . . . . . . . . . 2,600 1,600 1,100 2,400
Location
Metropolitan statistical area. . . . . . . . . . . . . . . . . 10,900 6,600 4,300 10,400 Micropolitan statistical area . . . . . . . . . . . . . . . . . 2,600 1,500 900 2,500 Other location . . . . . . . . . . . . . . . . . . . . . . . . 2,600 1,300 800 2,500
Affiliation
Chain . . . . . . . . . . . . . . . . . . . . . . . . . . . . . . 8,700 5,300 3,300 8,500 Independent . . . . . . . . . . . . . . . . . . . . . . . . . . 7,400 4,200 2,700 6,900
* Estimate does not meet standard of reliability or precision because the sample size is less than 30. Estimates accompanied by an asterisk (*) indicate that the sample size is between 30 and 59, orthe sample size is greater than 59, but has a relative standard error of 30 percent or more.1Includes state and local government facilities.
NOTE: Numbers may not add to totals because of rounding.

2004
Nursing Home Facilities [ December 2006 [ Page 10
Table 10. Percentage of nursing homes by selected administrative electronic information systems and facility characteristics: United States,
Administrative electronic information systems
Personnel Staff Billing Facility characteristic information scheduling finance
All facilities. . . . . . . . . . . . . . . . . . . . . . . . . . . . . . . . 58.6 37.1 95.2
Ownership
Proprietary . . . . . . . . . . . . . . . . . . . . . . . . . . . . . . . . 54.2 35.1 94.8 Voluntary nonprofit and other1 . . . . . . . . . . . . . . . . . . . . 65.8 40.2 95.8
Beds
Fewer than 50 beds . . . . . . . . . . . . . . . . . . . . . . . . . . 52.3 *33.6 89.3 50–99 beds . . . . . . . . . . . . . . . . . . . . . . . . . . . . . . . 53.0 33.9 94.5 100 beds or more . . . . . . . . . . . . . . . . . . . . . . . . . . . 64.8 40.6 97.4
Geographic region
Northeast . . . . . . . . . . . . . . . . . . . . . . . . . . . . . . . . 58.1 41.0 95.8 Midwest . . . . . . . . . . . . . . . . . . . . . . . . . . . . . . . . . 56.7 39.1 94.8 South . . . . . . . . . . . . . . . . . . . . . . . . . . . . . . . . . . . 59.6 31.1 95.8 West . . . . . . . . . . . . . . . . . . . . . . . . . . . . . . . . . . . 61.1 41.4 94.3
Location
Metropolitan statistical area . . . . . . . . . . . . . . . . . . . . . 60.6 39.1 95.1 Micropolitan statistical area . . . . . . . . . . . . . . . . . . . . . 59.1 35.2 95.3 Other location . . . . . . . . . . . . . . . . . . . . . . . . . . . . . 49.7 30.6 95.6
Affiliation
Chain . . . . . . . . . . . . . . . . . . . . . . . . . . . . . . . . . . . 60.4 37.9 97.0 Independent . . . . . . . . . . . . . . . . . . . . . . . . . . . . . . . 56.6 36.2 93.0
* Estimate does not meet standard of reliability or precision because the sample size is less than 30. Estimates accompanied by an asterisk (*) indicate that the sample size is between 30 and 59, orthe sample size is greater than 59, but has a relative standard error of 30 percent or more.1Includes state and local government facilities.
NOTE: Percentages are based on unrounded numbers.

Nursing Home Facilities [ December 2006 [ Page 11
Table 11. Number and percent distribution of nursing homes by availability of dental health services, according to selected facility characteristics: United States, 2004
Dental services
Where provided How provided
Percent Both At Outside Percent Both Scheduled On call or Facility characteristic Total distribution location facility facility Total1 distribution arrangements times as needed
All facilities . . . . . . . . . . . . . . . . . . . . . . 16,100 100.0 35.1 30.0 34.0 15,900 100.0 29.0 25.9 45.0
Ownership
Proprietary . . . . . . . . . . . . . . . . . . . . . . 9,900 100.0 36.0 29.5 33.9 9,800 100.0 28.8 26.7 44.3 Voluntary nonprofit and other2 . . . . . . . . . . 6,200 100.0 33.7 30.9 34.2 6,100 100.0 29.3 24.5 46.2
Beds
Fewer than 50 beds . . . . . . . . . . . . . . . . 2,200 100.0 *35.8 *20.7 41.6 2,200 100.0 *22.6 *16.9 60.5 50–99 beds. . . . . . . . . . . . . . . . . . . . . . 6,000 100.0 29.7 27.9 41.4 5,900 100.0 26.7 23.7 49.3 100 beds or more . . . . . . . . . . . . . . . . . . 7,800 100.0 39.0 34.4 26.2 7,800 100.0 32.6 30.0 37.4
Geographic region
Northeast . . . . . . . . . . . . . . . . . . . . . . . 2,800 100.0 47.2 40.1 * 2,800 100.0 38.4 36.9 *24.7 Midwest . . . . . . . . . . . . . . . . . . . . . . . . 5,300 100.0 39.8 24.1 35.5 5,300 100.0 29.4 29.2 41.4 South . . . . . . . . . . . . . . . . . . . . . . . . . 5,400 100.0 27.3 27.1 45.1 5,400 100.0 24.5 18.7 56.3 West . . . . . . . . . . . . . . . . . . . . . . . . . . 2,600 100.0 *28.4 37.5 32.2 2,500 100.0 *27.4 *21.8 50.7
Location
Metropolitan statistical area . . . . . . . . . . . . 10,900 100.0 37.6 36.9 24.6 10,800 100.0 31.2 29.1 39.5 Micropolitan statistical area . . . . . . . . . . . . 2,600 100.0 31.8 *20.4 46.8 2,600 100.0 29.7 *18.2 52.1 Other location . . . . . . . . . . . . . . . . . . . . 2,600 100.0 27.8 * 61.0 2,600 100.0 *19.3 *19.8 60.9
Affiliation
Chain . . . . . . . . . . . . . . . . . . . . . . . . . 8,700 100.0 34.6 30.8 34.1 8,700 100.0 28.1 26.8 44.8 Independent . . . . . . . . . . . . . . . . . . . . . 7,400 100.0 35.7 29.2 34.0 7,300 100.0 30.0 24.7 45.2
* Estimate does not meet standard of reliability or precision because the sample size is less than 30. Estimates accompanied by an asterisk (*) indicate that the sample size is between 30 and 59, orthe sample size is greater than 59, but has a relative standard error of 30 percent or more.1Includes only facilities that provide dental health services.2Includes state and local government owned facilities.
NOTES: Number may not add to totals because of rounding. Percentages are based on the unrounded numbers.
Nursing Home Facilities [ December 2006 [ Page 12
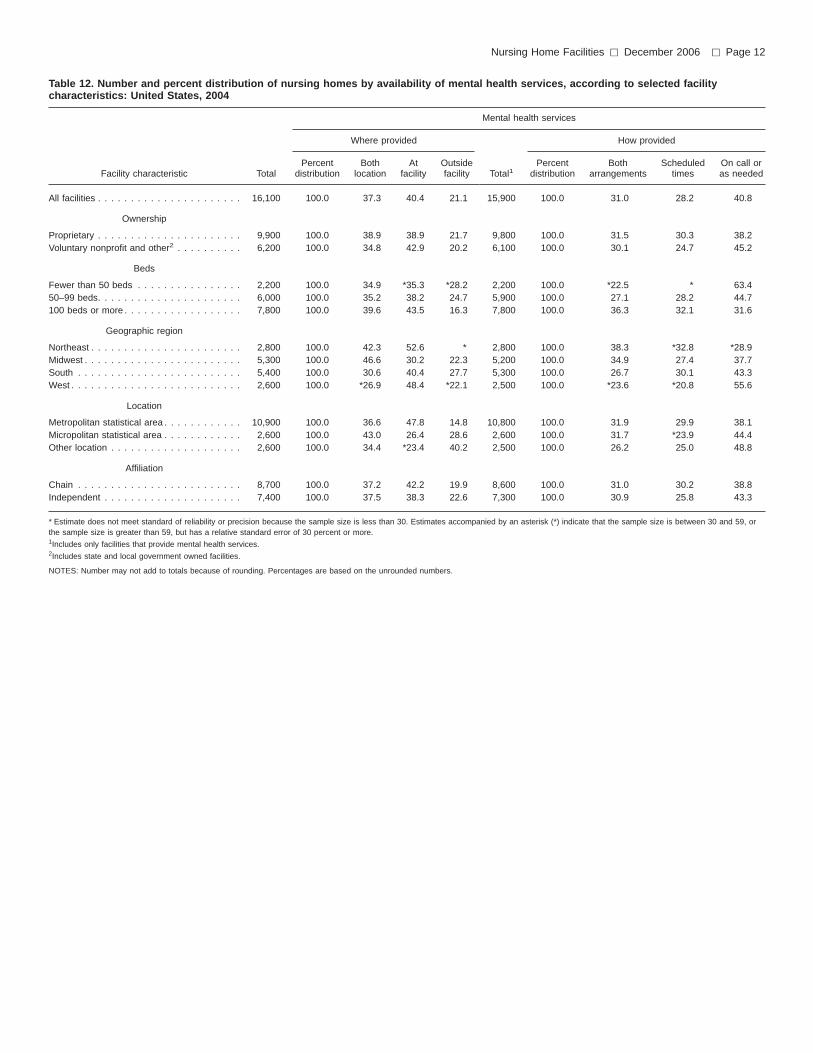
Table 12. Number and percent distribution of nursing homes by availability of mental health services, according to selected facility characteristics: United States, 2004
Mental health services
Where provided How provided
Percent Both At Outside Percent Both Scheduled On call or Facility characteristic Total distribution location facility facility Total1 distribution arrangements times as needed
All facilities . . . . . . . . . . . . . . . . . . . . . . 16,100 100.0 37.3 40.4 21.1 15,900 100.0 31.0 28.2 40.8
Ownership
Proprietary . . . . . . . . . . . . . . . . . . . . . . 9,900 100.0 38.9 38.9 21.7 9,800 100.0 31.5 30.3 38.2 Voluntary nonprofit and other2 . . . . . . . . . . 6,200 100.0 34.8 42.9 20.2 6,100 100.0 30.1 24.7 45.2
Beds
Fewer than 50 beds . . . . . . . . . . . . . . . . 2,200 100.0 34.9 *35.3 *28.2 2,200 100.0 *22.5 * 63.4 50–99 beds. . . . . . . . . . . . . . . . . . . . . . 6,000 100.0 35.2 38.2 24.7 5,900 100.0 27.1 28.2 44.7 100 beds or more . . . . . . . . . . . . . . . . . . 7,800 100.0 39.6 43.5 16.3 7,800 100.0 36.3 32.1 31.6
Geographic region
Northeast . . . . . . . . . . . . . . . . . . . . . . . 2,800 100.0 42.3 52.6 * 2,800 100.0 38.3 *32.8 *28.9 Midwest . . . . . . . . . . . . . . . . . . . . . . . . 5,300 100.0 46.6 30.2 22.3 5,200 100.0 34.9 27.4 37.7 South . . . . . . . . . . . . . . . . . . . . . . . . . 5,400 100.0 30.6 40.4 27.7 5,300 100.0 26.7 30.1 43.3 West . . . . . . . . . . . . . . . . . . . . . . . . . . 2,600 100.0 *26.9 48.4 *22.1 2,500 100.0 *23.6 *20.8 55.6
Location
Metropolitan statistical area . . . . . . . . . . . . 10,900 100.0 36.6 47.8 14.8 10,800 100.0 31.9 29.9 38.1 Micropolitan statistical area . . . . . . . . . . . . 2,600 100.0 43.0 26.4 28.6 2,600 100.0 31.7 *23.9 44.4 Other location . . . . . . . . . . . . . . . . . . . . 2,600 100.0 34.4 *23.4 40.2 2,500 100.0 26.2 25.0 48.8
Affiliation
Chain . . . . . . . . . . . . . . . . . . . . . . . . . 8,700 100.0 37.2 42.2 19.9 8,600 100.0 31.0 30.2 38.8 Independent . . . . . . . . . . . . . . . . . . . . . 7,400 100.0 37.5 38.3 22.6 7,300 100.0 30.9 25.8 43.3
* Estimate does not meet standard of reliability or precision because the sample size is less than 30. Estimates accompanied by an asterisk (*) indicate that the sample size is between 30 and 59, orthe sample size is greater than 59, but has a relative standard error of 30 percent or more.1Includes only facilities that provide mental health services.2Includes state and local government owned facilities.
NOTES: Number may not add to totals because of rounding. Percentages are based on the unrounded numbers.
Nursing Home Facilities [ December 2006 [ Page 13
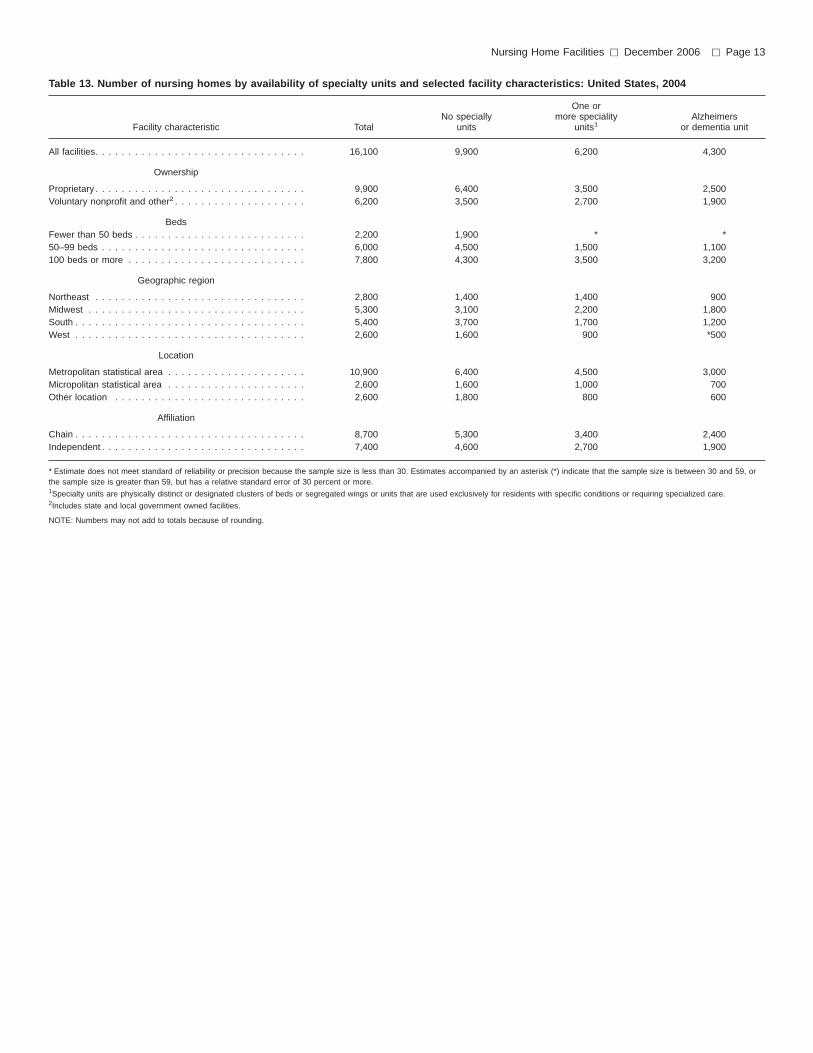
Table 13. Number of nursing homes by availability of specialty units and selected facility characteristics: United States, 2004
One or No specially more speciality Alzheimers
Facility characteristic Total units units1 or dementia unit
All facilities. . . . . . . . . . . . . . . . . . . . . . . . . . . . . . . . 16,100 9,900 6,200 4,300
Ownership
Proprietary . . . . . . . . . . . . . . . . . . . . . . . . . . . . . . . . 9,900 6,400 3,500 2,500 Voluntary nonprofit and other2 . . . . . . . . . . . . . . . . . . . . 6,200 3,500 2,700 1,900
Beds Fewer than 50 beds . . . . . . . . . . . . . . . . . . . . . . . . . . 2,200 1,900 * * 50–99 beds . . . . . . . . . . . . . . . . . . . . . . . . . . . . . . . 6,000 4,500 1,500 1,100 100 beds or more . . . . . . . . . . . . . . . . . . . . . . . . . . . 7,800 4,300 3,500 3,200
Geographic region
Northeast . . . . . . . . . . . . . . . . . . . . . . . . . . . . . . . . 2,800 1,400 1,400 900 Midwest . . . . . . . . . . . . . . . . . . . . . . . . . . . . . . . . . 5,300 3,100 2,200 1,800 South . . . . . . . . . . . . . . . . . . . . . . . . . . . . . . . . . . . 5,400 3,700 1,700 1,200 West . . . . . . . . . . . . . . . . . . . . . . . . . . . . . . . . . . . 2,600 1,600 900 *500
Location
Metropolitan statistical area . . . . . . . . . . . . . . . . . . . . . 10,900 6,400 4,500 3,000 Micropolitan statistical area . . . . . . . . . . . . . . . . . . . . . 2,600 1,600 1,000 700 Other location . . . . . . . . . . . . . . . . . . . . . . . . . . . . . 2,600 1,800 800 600
Affiliation
Chain . . . . . . . . . . . . . . . . . . . . . . . . . . . . . . . . . . . 8,700 5,300 3,400 2,400 Independent . . . . . . . . . . . . . . . . . . . . . . . . . . . . . . . 7,400 4,600 2,700 1,900
* Estimate does not meet standard of reliability or precision because the sample size is less than 30. Estimates accompanied by an asterisk (*) indicate that the sample size is between 30 and 59, orthe sample size is greater than 59, but has a relative standard error of 30 percent or more.1Specialty units are physically distinct or designated clusters of beds or segregated wings or units that are used exclusively for residents with specific conditions or requiring specialized care.2Includes state and local government owned facilities.
NOTE: Numbers may not add to totals because of rounding.

Nursing Home Facilities [ December 2006 [ Page 14
Table 14. Percentage of nursing homes by availability of specialty units and selected facility characteristics: United States, 2004
One or No specialty more specialty Alzheimers or
Facility characteristic units units1 dementia unit
All facilities . . . . . . . . . . . . . . . . . . . . . . . . . . . . . . . . . . . . . . . 61.5 38.5 26.9
Ownership
Proprietary . . . . . . . . . . . . . . . . . . . . . . . . . . . . . . . . . . . . . . . 64.7 35.3 24.8 Voluntary nonprofit and other2 . . . . . . . . . . . . . . . . . . . . . . . . . . . 56.3 43.7 30.4
Beds
Fewer than 50 beds . . . . . . . . . . . . . . . . . . . . . . . . . . . . . . . . . 83.5 * * 50–99 beds . . . . . . . . . . . . . . . . . . . . . . . . . . . . . . . . . . . . . . 74.4 25.6 17.5 100 beds or more. . . . . . . . . . . . . . . . . . . . . . . . . . . . . . . . . . . 54.8 45.2 40.5
Geographic region
Northeast . . . . . . . . . . . . . . . . . . . . . . . . . . . . . . . . . . . . . . . . 50.1 49.9 31.9 Midwest. . . . . . . . . . . . . . . . . . . . . . . . . . . . . . . . . . . . . . . . . 58.7 41.3 33.5 South . . . . . . . . . . . . . . . . . . . . . . . . . . . . . . . . . . . . . . . . . . 69.2 30.8 21.3 West. . . . . . . . . . . . . . . . . . . . . . . . . . . . . . . . . . . . . . . . . . . 63.4 36.6 *19.0
Location
Metropolitan statistical area. . . . . . . . . . . . . . . . . . . . . . . . . . . . . 59.0 41.0 27.8 Micropolitan statistical area . . . . . . . . . . . . . . . . . . . . . . . . . . . . . 62.2 37.8 28.0 Other location . . . . . . . . . . . . . . . . . . . . . . . . . . . . . . . . . . . . 70.9 29.1 22.3
Affiliation
Chain . . . . . . . . . . . . . . . . . . . . . . . . . . . . . . . . . . . . . . . . . . 60.4 39.6 27.5 Independent . . . . . . . . . . . . . . . . . . . . . . . . . . . . . . . . . . . . . . 62.7 37.3 26.3
* Estimate does not meet standard of reliability or precision because the sample size is less than 30. Estimates accompanied by an asterisk (*) indicate that the sample size is between 30 and 59, orthe sample size is greater than 59 but has a relative standard error of 30 percent or more.1Specialty units are physically distinct or designated clusters of beds or segregated wings or units that are used exclusively for residents with specific conditions or or requiring specialized care.2Includes state and local government facilities.
NOTE: Percentages are based on unrounded numbers.

2004
Nursing Home Facilities [ December 2006 [ Page 15
Table 15. Number of nursing homes with selected therapeutic or diagnostic procedures, by selected facility characteristics: United States,
Peripherally Infusion inserted Parenteral
Facility characteristic Total therapy central lines nutrition Other1
All facilities . . . . . . . . . . . . . . . . . . . . . . . . . . . 16,100 6,800 3,700 7,500 3,800
Ownership
Proprietary . . . . . . . . . . . . . . . . . . . . . . . . . . . 9,900 4,200 2,000 4,400 1,900 Voluntary nonprofit and other2 . . . . . . . . . . . . . . . 6,200 2,600 1,700 3,100 2,000
Beds
Fewer than 50 beds . . . . . . . . . . . . . . . . . . . . . 2,200 1,000 *600 1,000 800 50–99 beds . . . . . . . . . . . . . . . . . . . . . . . . . . 6,000 2,100 1,000 2,600 900 100 beds or more. . . . . . . . . . . . . . . . . . . . . . . 7,800 3,700 2,000 3,900 2,200
Geographic region
Northeast . . . . . . . . . . . . . . . . . . . . . . . . . . . . 2,800 1,600 *1000 1,500 *700 Midwest. . . . . . . . . . . . . . . . . . . . . . . . . . . . . 5,300 2,200 1,200 2,600 1,600 South . . . . . . . . . . . . . . . . . . . . . . . . . . . . . . 5,400 2,200 900 2,200 800 West. . . . . . . . . . . . . . . . . . . . . . . . . . . . . . . 2,600 800 *600 1,200 *700
Location
Metropolitan statistical area. . . . . . . . . . . . . . . . . 10,900 4,800 2,800 5,200 2,700 Micropolitan statistical area . . . . . . . . . . . . . . . . . 2,600 1,200 *600 1,200 600 Other location . . . . . . . . . . . . . . . . . . . . . . . . 2,600 800 * 1,000 *500
Affiliation
Chain . . . . . . . . . . . . . . . . . . . . . . . . . . . . . . 8,700 4,000 1,900 4,100 2,000 Independent . . . . . . . . . . . . . . . . . . . . . . . . . . 7,400 2,800 1,800 3,400 1,900
* Estimate does not meet standard of reliability or precision because the sample size is less than 30. Estimates accompanied by an asterisk (*) indicate that the sample size is between 30 and 59, orthe sample size is greater than 59 but has a relative standard error of 30 percent or more.1Includes peritoneal dialysis, ventilator or pulmonary therapy, bladder scanner, and blood transfusions.2Includes state and local government owned facilities.
NOTE: Numbers may not add to totals because of rounding.

Nursing Home Facilities [ December 2006 [ Page 16
Table 16. Percentage of nursing homes with selected therapeutic or diagnostic procedures, by selected facility characteristics: United States, 2004
Peripherally Infusion inserted Parenteral
Facility characteristic therapy central lines nutrition Other1
All facilities. . . . . . . . . . . . . . . . . . . . . . . . . . . . . . . . 42.2 23.1 46.4 23.9
Ownership
Proprietary . . . . . . . . . . . . . . . . . . . . . . . . . . . . . . . . 42.0 20.6 44.1 19.0 Voluntary nonprofit and other2 . . . . . . . . . . . . . . . . . . . . 42.7 27.1 50.1 31.8
Beds
Fewer than 50 beds . . . . . . . . . . . . . . . . . . . . . . . . . . 44.2 *27.8 46.3 36.6 50–99 beds . . . . . . . . . . . . . . . . . . . . . . . . . . . . . . . 34.2 17.5 42.7 14.2 100 beds or more . . . . . . . . . . . . . . . . . . . . . . . . . . . 47.8 26.0 49.2 27.8
Geographic region
Northeast . . . . . . . . . . . . . . . . . . . . . . . . . . . . . . . . 56.0 *34.8 51.9 *26.1 Midwest . . . . . . . . . . . . . . . . . . . . . . . . . . . . . . . . . 41.7 22.5 49.2 29.8 South . . . . . . . . . . . . . . . . . . . . . . . . . . . . . . . . . . . 40.3 17.4 39.9 14.6 West . . . . . . . . . . . . . . . . . . . . . . . . . . . . . . . . . . . 32.3 *23.3 48.4 *29.0
Location
Metropolitan statistical area . . . . . . . . . . . . . . . . . . . . . 44.1 25.8 47.7 24.9 Micropolitan statistical area . . . . . . . . . . . . . . . . . . . . . 44.4 *23.1 47.9 24.6 Other location . . . . . . . . . . . . . . . . . . . . . . . . . . . . . 32.2 * 39.4 *19.1
Affiliation
Chain . . . . . . . . . . . . . . . . . . . . . . . . . . . . . . . . . . . 45.6 22.4 47.2 22.5 Independent . . . . . . . . . . . . . . . . . . . . . . . . . . . . . . . 38.3 23.9 45.5 25.6
* Estimate does not meet standard of reliability or precision because the sample size is less than 30. Estimates accompanied by an asterisk (*) indicate that the sample size is between 30 and 59, orthe sample size is greater than 59 but has a relative standard error of 30 percent or more.1Includes peritoneal dialysis, ventilator or pulmonary therapy, bladder scanner, and blood transfusions.2Includes state and local government owned facilities.
NOTE: Percentages are based on unrounded numbers.

Nursing Home Facilities [ December 2006 [ Page 17
Table 17. Number of nursing homes by availability of selected special programs and facility characteristics: United States, 2004
Type of program
One or more No special special Hospice Palliative Dementia Restorative Behavior Pain Continence Skin
Facility characteristic Total programs programs1 end of life care care care problems management management wounds
All facilities. . . . . . . . . . . . . . 16,100 3,300 12,800 3,000 2,700 5,100 11,100 3,800 4,100 3,500 8,600
Ownership
Proprietary . . . . . . . . . . . . . . 9,900 2,000 7,900 1,600 1,400 2,800 7,100 2,400 2,300 2,200 5,300 Voluntary nonprofit and other2 . . 6,200 1,300 4,800 1,400 1,200 2,300 4,000 1,500 1,800 1,300 3,300
Beds
Fewer than 50 beds . . . . . . . . 2,200 800 1,400 * * * 1,000 * *400 * 800 50–99 beds . . . . . . . . . . . . . 6,000 1,300 4,700 1,100 900 1,500 4,200 1,500 1,500 1,400 3,000 100 beds or more . . . . . . . . . 7,800 1,100 6,700 1,700 1,500 3,200 5,800 2,000 2,200 1,900 4,800
Geographic region
Northeast . . . . . . . . . . . . . . 2,800 *700 2,100 *500 *600 1,000 1,700 *600 *800 * 1,400 Midwest . . . . . . . . . . . . . . . 5,300 1,000 4,300 800 900 2,000 3,900 1,600 1,400 1,200 2,800 South . . . . . . . . . . . . . . . . . 5,400 1,000 4,400 1,300 900 1,500 3,800 1,200 1,300 1,300 3,200 West . . . . . . . . . . . . . . . . . 2,600 *600 1,900 * * *600 1,700 *500 *600 *600 1,200
Location
Metropolitan statistical area . . . 10,900 2,100 8,800 2,100 1,900 3,500 7,600 2,600 2,900 2,500 6,100 Micropolitan statistical area . . . 2,600 *600 2,000 *400 *400 900 1,700 *600 *600 *500 1,200 Other location . . . . . . . . . . . 2,600 *600 2,000 *600 *400 700 1,800 700 600 *500 1,200
Affiliation
Chain . . . . . . . . . . . . . . . . . 8,700 1,700 7,000 1,600 1,500 2,800 6,300 2,000 2,300 2,100 4,900 Independent . . . . . . . . . . . . . 7,400 1,600 5,700 1,400 1,200 2,300 4,800 1,900 1,900 1,400 3,700
* Estimate does not meet standard of reliability or precision because the sample size is less than 30. Estimates accompanied by an asterisk (*) indicate that the sample size is between 30 and 59, orthe sample size is greater than 59 but has a relative standard error of 30 percent or more.1Includes any of the programs listed where the facility has specially trained personnel dedicated to the program. Special programs do not include special training that is provided to all personnel.2Includes state and local government facilities.
NOTE: Numbers may not add to totals because of rounding.
Nursing Home Facilities [ December 2006 [ Page 18
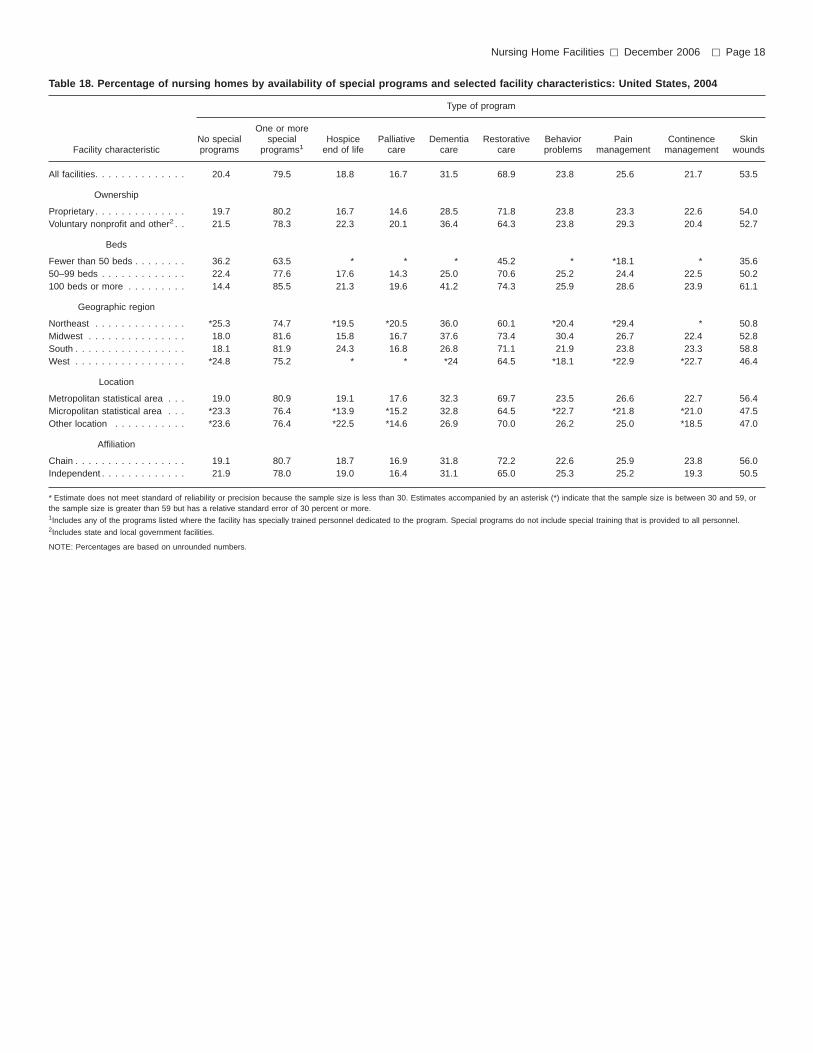
Table 18. Percentage of nursing homes by availability of special programs and selected facility characteristics: United States, 2004
Type of program
One or more No special special Hospice Palliative Dementia Restorative Behavior Pain Continence Skin
Facility characteristic programs programs1 end of life care care care problems management management wounds
All facilities. . . . . . . . . . . . . . 20.4 79.5 18.8 16.7 31.5 68.9 23.8 25.6 21.7 53.5
Ownership
Proprietary . . . . . . . . . . . . . . 19.7 80.2 16.7 14.6 28.5 71.8 23.8 23.3 22.6 54.0 Voluntary nonprofit and other2 . . 21.5 78.3 22.3 20.1 36.4 64.3 23.8 29.3 20.4 52.7
Beds
Fewer than 50 beds . . . . . . . . 36.2 63.5 * * * 45.2 * *18.1 * 35.6 50–99 beds . . . . . . . . . . . . . 22.4 77.6 17.6 14.3 25.0 70.6 25.2 24.4 22.5 50.2 100 beds or more . . . . . . . . . 14.4 85.5 21.3 19.6 41.2 74.3 25.9 28.6 23.9 61.1
Geographic region
Northeast . . . . . . . . . . . . . . *25.3 74.7 *19.5 *20.5 36.0 60.1 *20.4 *29.4 * 50.8 Midwest . . . . . . . . . . . . . . . 18.0 81.6 15.8 16.7 37.6 73.4 30.4 26.7 22.4 52.8 South . . . . . . . . . . . . . . . . . 18.1 81.9 24.3 16.8 26.8 71.1 21.9 23.8 23.3 58.8 West . . . . . . . . . . . . . . . . . *24.8 75.2 * * *24 64.5 *18.1 *22.9 *22.7 46.4
Location
Metropolitan statistical area . . . 19.0 80.9 19.1 17.6 32.3 69.7 23.5 26.6 22.7 56.4 Micropolitan statistical area . . . *23.3 76.4 *13.9 *15.2 32.8 64.5 *22.7 *21.8 *21.0 47.5 Other location . . . . . . . . . . . *23.6 76.4 *22.5 *14.6 26.9 70.0 26.2 25.0 *18.5 47.0
Affiliation
Chain . . . . . . . . . . . . . . . . . 19.1 80.7 18.7 16.9 31.8 72.2 22.6 25.9 23.8 56.0 Independent . . . . . . . . . . . . . 21.9 78.0 19.0 16.4 31.1 65.0 25.3 25.2 19.3 50.5
* Estimate does not meet standard of reliability or precision because the sample size is less than 30. Estimates accompanied by an asterisk (*) indicate that the sample size is between 30 and 59, or the sample size is greater than 59 but has a relative standard error of 30 percent or more. 1Includes any of the programs listed where the facility has specially trained personnel dedicated to the program. Special programs do not include special training that is provided to all personnel. 2Includes state and local government facilities.
NOTE: Percentages are based on unrounded numbers.

Nursing Home Facilities [ December 2006 [ Page 19
Table 19. Number of nursing homes with selected types of recreational activities, by selected facility characteristics: United States, 2004
Off site Evening Weekend Outdoor Pet Intergenerational Facility characteristic Total activities activities activities activities Gardening therapy activities
All facilities . . . . . . . . . . . . . . . . . 16,100 14,500 15,300 15,700 15,200 12,200 14,000 13,700
Ownership
Proprietary . . . . . . . . . . . . . . . . . 9,900 9,100 9,400 9,700 9,500 7,300 8,400 8,400 Voluntary nonprofit and other1 . . . . . 6,200 5,400 5,900 6,000 5,700 4,900 5,500 5,300
Beds
Fewer than 50 beds. . . . . . . . . . . . 2,200 1,600 1,900 2,100 1,900 1,400 1,800 1,700 50–99 beds . . . . . . . . . . . . . . . . . 6,000 5,600 5,700 5,900 5,800 4,400 5,200 5,300 100 beds or more . . . . . . . . . . . . . 7,800 7,300 7,700 7,800 7,600 6,400 7,000 6,800
Geographic region
Northeast . . . . . . . . . . . . . . . . . . 2,800 2,500 2,700 2,800 2,700 2,400 2,500 2,600 Midwest . . . . . . . . . . . . . . . . . . . 5,300 4,800 5,100 5,200 5,000 4,300 4,700 4,700 South . . . . . . . . . . . . . . . . . . . . 5,400 4,900 5,200 5,300 5,100 3,700 4,600 4,500 West . . . . . . . . . . . . . . . . . . . . . 2,600 2,300 2,200 2,500 2,500 1,900 2,100 2,000
Location
Metropolitan statistical area . . . . . . . 10,900 9,700 10,400 10,600 10,300 8,400 9,500 9,200 Micropolitan statistical area . . . . . . . 2,600 2,400 2,500 2,600 2,400 1,900 2,300 2,300 Other location . . . . . . . . . . . . . . . 2,600 2,400 2,400 2,500 2,500 2,000 2,200 2,300
Affiliation
Chain . . . . . . . . . . . . . . . . . . . . 8,700 8,100 8,300 8,500 8,400 6,500 7,400 7,400 Independent . . . . . . . . . . . . . . . . 7,400 6,400 7,000 7,200 6,800 5,800 6,600 6,300
* Estimate does not meet standard of reliability or precision because the sample size is less than 30. Estimates accompanied by an asterisk (*) indicate that the sample size is between 30 and 59, orthe sample size is greater than 59, but has a relative standard error of 30 percent or more.1Includes state and local government owned facilities.
NOTE: Numbers may not add to totals because of rounding.

Nursing Home Facilities [ December 2006 [ Page 20
Table 20. Percentage of nursing homes with selected types of recreational activities, by selected facility characteristics: United States, 2004
Evening Weekend Outdoor Pet Intergenerational Facility characteristic Off site activities activities activities Gardening therapy activities
All facilities . . . . . . . . . . . . . . . . . . . . . . . . . . . 90.4 95.2 97.8 94.8 76.1 86.8 85.4
Ownership
Proprietary . . . . . . . . . . . . . . . . . . . . . . . . . . . 92.0 95.2 98.0 96.1 74.0 85.1 84.9 Voluntary nonprofit and other1 . . . . . . . . . . . . . . . 87.7 95.2 97.6 92.7 79.5 89.6 86.2
Beds
Fewer than 50 beds . . . . . . . . . . . . . . . . . . . . . 72.6 85.5 92.3 84.7 63.3 81.0 74.6 50–99 beds . . . . . . . . . . . . . . . . . . . . . . . . . . 92.9 94.8 98.4 96.0 73.5 86.1 87.8 100 beds or more. . . . . . . . . . . . . . . . . . . . . . . 93.5 98.3 99.0 96.8 81.7 89.1 86.7
Geographic region
Northeast . . . . . . . . . . . . . . . . . . . . . . . . . . . . 90.2 97.7 98.2 95.8 85.3 88.9 91.2 Midwest. . . . . . . . . . . . . . . . . . . . . . . . . . . . . 91.4 96.6 98.3 94.7 80.4 88.8 88.5 South . . . . . . . . . . . . . . . . . . . . . . . . . . . . . . 89.8 96.2 97.7 94.0 68.4 85.4 82.8 West. . . . . . . . . . . . . . . . . . . . . . . . . . . . . . . 89.6 87.4 96.7 95.5 73.3 83.6 78.4
Location
Metropolitan statistical area. . . . . . . . . . . . . . . . . 89.3 95.2 97.6 94.2 76.7 87.6 84.5 Micropolitan statistical area . . . . . . . . . . . . . . . . . 90.8 96.5 98.0 93.8 71.7 87.0 87.2 Other location . . . . . . . . . . . . . . . . . . . . . . . . 94.5 94.0 98.5 98.0 77.8 83.6 87.6
Affiliation
Chain . . . . . . . . . . . . . . . . . . . . . . . . . . . . . . 93.0 95.5 97.6 96.8 74.3 85.1 85.2 Independent . . . . . . . . . . . . . . . . . . . . . . . . . . 87.3 94.9 98.1 92.4 78.2 88.9 85.7
* Estimate does not meet standard of reliability or precision because the sample size is less than 30. Estimates accompanied by an asterisk (*) indicate that the sample size is between 30 and 59, orthe sample size is greater than 59, but has a relative standard error of 30 percent or more.1Includes state and local government owned facilities.
NOTE: Percentages are based on unrounded numbers.

Nursing Home Facilities [ December 2006 [ Page 21
Table 21. Number and percent distribution of nursing homes by percentage of employees who received influenza vaccination during last flu season, according to selected facility characteristics: United States, 2004
Percentage of employees with flu vaccination
Facility characteristic Total1 1–40 41–80 81–100 Total 1–40 41–80 81–100
Number Percent distribution
All facilities . . . . . . . . . . . . . . . . . . . . . . . . . . . 16,100 5,400 7,500 2,200 100.0 33.7 46.6 13.5
Ownership
Proprietary . . . . . . . . . . . . . . . . . . . . . . . . . . . 9,900 3,800 4,200 1,200 100.0 38.5 42.2 12.1 Voluntary nonprofit and other2 . . . . . . . . . . . . . . . 6,200 1,600 3,300 1,000 100.0 25.9 53.5 15.8
Beds
Fewer than 50 beds . . . . . . . . . . . . . . . . . . . . . 2,200 *600 1,000 *500 100.0 *11.7 46.6 *20.7 50–99 beds . . . . . . . . . . . . . . . . . . . . . . . . . . 6,000 1,900 2,900 900 100.0 31.8 47.5 15.2 100 beds or more. . . . . . . . . . . . . . . . . . . . . . . 7,800 2,900 3,600 800 100.0 36.6 45.8 10.3
Geographic region
Northeast . . . . . . . . . . . . . . . . . . . . . . . . . . . . 2,800 1,000 1,500 * 100.0 33.9 54.4 * Midwest. . . . . . . . . . . . . . . . . . . . . . . . . . . . . 5,300 1,700 2,500 700 100.0 31.4 47.4 14.0 South . . . . . . . . . . . . . . . . . . . . . . . . . . . . . . 5,400 1,900 2,300 900 100.0 35.9 42.2 16.9 West. . . . . . . . . . . . . . . . . . . . . . . . . . . . . . . 2,600 *900 1,200 * 100.0 *15.9 45.4 *
Location
Metropolitan statistical area. . . . . . . . . . . . . . . . . 10,900 3,900 5,000 1,200 100.0 35.8 45.9 11.2 Micropolitan statistical area . . . . . . . . . . . . . . . . . 2,600 800 1,300 *300 100.0 29.9 50.5 *15.8 Other location . . . . . . . . . . . . . . . . . . . . . . . . 2,600 700 1,200 *600 100.0 28.7 45.3 *28.0
Affiliation
Chain . . . . . . . . . . . . . . . . . . . . . . . . . . . . . . 8,700 3,100 3,900 1,100 100.0 35.3 44.7 12.9 Independent . . . . . . . . . . . . . . . . . . . . . . . . . . 7,400 2,300 3,600 1,100 100.0 31.8 48.8 14.2
* Estimate does not meet standard of reliability or precision because the sample size is less than 30. Estimates accompanied by an asterisk (*) indicate that the sample size is between 30 and 59, orthe sample size is greater than 59, but has a relative standard error of 30 percent or more.1Includes none and unknown.2Includes state and local government owned facilities.
NOTES: Numbers may not add to totals because of rounding. Percentages are based on unrounded numbers.

Nursing Home Facilities [ December 2006 [ Page 22
Table 22. Number of nursing homes with strategies to encourage employee influenza vaccinations by selected facility characteristics: United States, 2004
Employee influenza vaccination strategy
Offered Vaccinations Offered for free or
Facility characteristic Total recommended on site reduced cost Other1
All facilities . . . . . . . . . . . . . . . . . . . . . . . . . . . . . 16,100 13,300 13,800 14,200 6,600
Ownership
Proprietary . . . . . . . . . . . . . . . . . . . . . . . . . . . . . 9,900 7,900 8,200 8,300 3,900 Voluntary nonprofit and other2 . . . . . . . . . . . . . . . . . 6,200 5,400 5,600 5,900 2,800
Beds
Fewer than 50 beds. . . . . . . . . . . . . . . . . . . . . . . . 2,200 2,000 2,000 2,100 900 50–99 beds . . . . . . . . . . . . . . . . . . . . . . . . . . . . . 6,000 4,900 5,200 5,400 2,400 100 beds or more . . . . . . . . . . . . . . . . . . . . . . . . . 7,800 6,400 6,600 6,700 3,400
Geographic region
Northeast . . . . . . . . . . . . . . . . . . . . . . . . . . . . . . 2,800 2,600 2,500 2,500 1,300 Midwest . . . . . . . . . . . . . . . . . . . . . . . . . . . . . . . 5,300 4,400 4,600 4,800 2,000 South . . . . . . . . . . . . . . . . . . . . . . . . . . . . . . . . 5,400 4,100 4,400 4,600 2,300 West . . . . . . . . . . . . . . . . . . . . . . . . . . . . . . . . . 2,600 2,200 2,300 2,300 1,000
Location
Metropolitan statistical area . . . . . . . . . . . . . . . . . . . 10,900 9,000 9,300 9,600 4,400 Micropolitan statistical area . . . . . . . . . . . . . . . . . . . 2,600 2,200 2,200 2,300 1,000 Other location . . . . . . . . . . . . . . . . . . . . . . . . . . . 2,600 2,100 2,300 2,300 1,100
Affiliation
Chain . . . . . . . . . . . . . . . . . . . . . . . . . . . . . . . . 8,700 7,100 7,400 7,700 3,400 Independent . . . . . . . . . . . . . . . . . . . . . . . . . . . . 7,400 6,200 6,400 6,500 3,200
* Estimate does not meet standard of reliability or precision because the sample size is less than 30. Estimates accompanied by an asterisk (*) indicate that the sample size is between 30 and 59, orthe sample size is greater than 59 but has a relative standard error of 30 percent or more.1Other vaccination methods include staff incentives, proof of vaccination (or contraindication) a work requirement, and work/patient restriction policy of employees with influenza-like illness.2Includes state and local government owned facilities.
NOTE: Numbers may not add to totals because of rounding.

Nursing Home Facilities [ December 2006 [ Page 23
Table 23. Percentage of nursing homes with strategies to encourage employee influenza vaccinations, by selected facility characteristics: United States, 2004
Employee influenza vaccination strategy
Offered Vaccinations Offered for free or
Facility characteristic recommended on site reduced cost Other1
All facilities . . . . . . . . . . . . . . . . . . . . . . . . . . . 82.7 85.9 88.3 41.1
Ownership
Proprietary . . . . . . . . . . . . . . . . . . . . . . . . . . . 79.7 82.5 84.4 38.9 Voluntary nonprofit and other2 . . . . . . . . . . . . . . . 87.5 91.3 94.6 44.5
Beds
Fewer than 50 beds . . . . . . . . . . . . . . . . . . . . . 88.6 90.6 94.2 39.7 50–99 beds . . . . . . . . . . . . . . . . . . . . . . . . . . 81.3 86.7 89.2 39.3 100 beds or more. . . . . . . . . . . . . . . . . . . . . . . 82.1 83.9 86.0 42.9
Geographic region
Northeast . . . . . . . . . . . . . . . . . . . . . . . . . . . . 92.1 90.1 90.4 45.6 Midwest. . . . . . . . . . . . . . . . . . . . . . . . . . . . . 83.3 87.4 89.6 38.5 South . . . . . . . . . . . . . . . . . . . . . . . . . . . . . . 75.9 81.2 85.5 42.2 West. . . . . . . . . . . . . . . . . . . . . . . . . . . . . . . 85.6 88.0 89.1 39.1
Location
Metropolitan statistical area. . . . . . . . . . . . . . . . . 82.6 85.6 87.8 40.7 Micropolitan statistical area . . . . . . . . . . . . . . . . . 83.4 83.3 89.5 40.0 Other location . . . . . . . . . . . . . . . . . . . . . . . . 82.6 89.5 89.2 43.6
Affiliation
Chain . . . . . . . . . . . . . . . . . . . . . . . . . . . . . . 81.6 85.3 88.3 38.8 Independent . . . . . . . . . . . . . . . . . . . . . . . . . . 84.0 86.6 88.3 43.7
* Estimate does not meet standard of reliability or precision because the sample size is less than 30. Estimates accompanied by an asterisk (*) indicate that the sample size is between 30 and 59, orthe sample size is greater than 59 but has a relative standard error of 30 percent or more.1Other vaccination methods include staff incentives, proof of vaccination (or contraindication) a work requirement, and work or patient restriction policy of employees with influenza-like illness.2Includes state and local government facilities.
NOTE: Percentages are based on unrounded numbers.