table 1. list of the 14 fish and invertebrate species ... · black sea bass centropristis ... open...
TRANSCRIPT

15
Table 1. List of the 14 fish and invertebrate species groups (in bold), with species group abbreviations in parentheses and scientific names in italics, and the species that compose these groups, corresponding to the 13 federal fishery management plans implemented in the waters off the northeastern United States.
Species Group Scientific name ATLANTIC SALMON (SAL) Salmo salar BLUEFISH (BLUE) Pomatomus saltatrix FLUKE - SCUP - BLACK SEA BASS (FSB) Black sea bass Centropristis striata Fluke Paralichthys dentatus Scup Stenotomus chrysops HERRING, ATLANTIC (HERR) Clupea harengus LARGE MESH GROUNDFISH (GFL) American plaice Hippoglossoides platessoides Atlantic cod Gadus morhua Atlantic halibut Hippoglossus hippoglossus Atlantic wolffish Anarhichas lupus Haddock Melanogrammus aeglefinus Ocean pout Zoarces americanus Pollock Pollachius virens Redfish Sebastes fasciatus White hake Urophycis tenuis Windowpane flounder Scophthalmus aquosus Winter flounder Pseudopleuronectes americanus Witch flounder Glyptocephalus cynoglossus Yellowtail flounder Limanda ferruginea MONKFISH (MONK) Lophius americanus RED DEEPSEA CRAB (RCRAB)20 Chaceon quinquedens SEA SCALLOP (SCAL) Placopecten magellanicus SKATE COMPLEX21 (SKATE) Rajidae Barndoor skate Dipturus laevis Clearnose skate Raja eglanteria Little skate Leucoraja erinacea Rosette skate Leucoraja garmani Smooth skate Malacoraja senta Thorny skate Amblyraja radiate Winter skate Leucoraja ocellata SMALL MESH GROUNDFISH (GFS) Offshore hake Merluccius albidus Red hake Urophycis chuss Silver hake Merluccius bilinearis SPINY DOGFISH (DOG) Squalus acanthias SQUID22 - BUTTERFISH - MACKEREL (SBM) Atlantic mackerel Scomber scombrus Butterfish Peprilus triacanthus Northern shortfin squid Illex illecebrosus Longfin inshore squid Doryteuthis (Amerigo) pealeii SURFCLAM - OCEAN QUAHOG (SCOQ)23 Surfclam Spisula solidissima Ocean quahog Arctica islandica TILEFISH (TILE) Lopholatilus chamaeleonticeps
20 In previous documents (e.g., Wigley et al. 2014; Wigley et al. 2013) red deepsea crab was referred to as red crab. 21 Skate complex is composed of 7 species as well as skate, unknown, and little/winter mixed skate. Individual species are not summarized separately. 22 Squid, unclassified is included in this species group. Longfin inshore squid and northern shortfin squid are also known as Loligo squid and Illex squid, respectively. 23 In this analysis, surfclams and ocean quahogs compose the species group and are not reported separately.

See text for fleet abbreviations. 16
Table 2. Number of Northeast Fisheries Observer Program (NEFOP) and Vessel Trip Report (VTR) trips, by fleet and calendar quarter (Q) based on July 2015 through June 2016 data. "P" indicates fleets with "pilot" designation.
FLEET NEFOP VTR
Row Gear Type Access Trip Region Mesh Area Category Group Q3 Q4 Q1 Q2 TOTAL Q3 Q4 Q1 Q2 TOTAL Pilot
1 Longline OPEN all MA all 2 1 2 3 8 50 47 24 42 163
2 Longline OPEN all NE all 1 . . 8 9 554 135 7 156 852
3 Hand Line OPEN all MA all 1 1 1 . 3 1,404 627 96 742 2,869 P
4 Hand Line OPEN all NE all 13 9 1 7 30 1,543 673 33 453 2,702
5 Otter Trawl OPEN all MA sm 91 79 92 125 387 1,037 841 532 901 3,311
6 Otter Trawl OPEN all MA lg 55 29 41 47 172 1,405 743 816 1,041 4,005
7 Otter Trawl OPEN all NE sm 127 62 50 86 325 1,477 771 393 1,332 3,973
8 Otter Trawl OPEN all NE lg 238 171 170 155 734 1,835 1,187 1,110 1,307 5,439
9 Scallop Trawl AA GEN MA all . . . 6 6 41 . . 117 158
10 Scallop Trawl AA LIM MA all . . . . . . . 1 . 1 P
11 Scallop Trawl OPEN GEN MA all 3 1 2 4 10 38 2 1 23 64
12 Scallop Trawl OPEN LIM MA all . . . . . . 3 5 . 8 P
13 Otter Trawl, Twin OPEN all MA all 3 . 2 . 5 47 24 31 31 133 P
14 Otter Trawl, Twin OPEN all NE all 2 1 . . 3 7 8 4 3 22 P
15 Otter Trawl, Ruhle OPEN all MA lg . . . . . . . 4 . 4 P
16 Otter Trawl, Ruhle OPEN all NE sm . 1 . . 1 . 6 21 . 27 P
17 Otter Trawl, Ruhle OPEN all NE lg . . . . . 1 . 1 8 10 P
18 Otter Trawl, Haddock Separator OPEN all NE lg 9 5 6 8 28 46 37 30 58 171
19 Shrimp Trawl OPEN all MA all 1 . . . 1 55 37 2 6 100 P
20 Shrimp Trawl OPEN all NE all . . . . . 33 3 22 19 77 P
21 Floating Trap OPEN all MA all . . . . . 29 1 . 46 76 P
22 Floating Trap OPEN all NE all . . . . . 15 . . . 15 P
23 Sink, Anchor, Drift Gillnet OPEN all MA sm 67 50 58 58 233 488 339 528 283 1,638
24 Sink, Anchor, Drift Gillnet OPEN all MA lg 25 85 68 59 237 328 903 546 435 2,212
25 Sink, Anchor, Drift Gillnet OPEN all MA xlg 3 40 24 85 152 102 465 299 841 1,707
26 Sink, Anchor, Drift Gillnet OPEN all NE sm . . . . . 1 1 . 2 4 P
27 Sink, Anchor, Drift Gillnet OPEN all NE lg 286 96 19 59 460 1,385 480 150 599 2,614
28 Sink, Anchor, Drift Gillnet OPEN all NE xlg 282 80 14 32 408 1,388 711 379 943 3,421
29 Purse Seine OPEN all MA all . . . . . 31 . . 190 221 P
30 Purse Seine OPEN all NE all 6 1 . 2 9 180 29 . 28 237

See text for fleet abbreviations. 17
Table 2, continued. Number of Northeast Fisheries Observer Program (NEFOP) and Vessel Trip Report (VTR) trips, by fleet and calendar quarter (Q) based on July 2015 through June 2016 data. "P" indicates fleets with "pilot" designation.
FLEET NEFOP VTR
Row Gear Type Access Trip Region Mesh Area Category Group Q3 Q4 Q1 Q2 TOTAL Q3 Q4 Q1 Q2 TOTAL Pilot
31 Scallop Dredge AA GEN MA all 28 1 3 58 90 655 19 15 1,361 2,050
32 Scallop Dredge AA GEN NE all . . . 37 37 4 9 1 416 430
33 Scallop Dredge AA LIM MA all 18 14 3 32 67 178 118 32 219 547
34 Scallop Dredge AA LIM NE all 26 21 6 35 88 232 181 35 177 625
35 Scallop Dredge OPEN GEN MA all 22 20 29 9 80 734 390 347 407 1,878
36 Scallop Dredge OPEN GEN NE all 23 19 32 17 91 554 508 1,028 816 2,906
37 Scallop Dredge OPEN LIM MA all 11 2 6 21 40 152 61 57 179 449
38 Scallop Dredge OPEN LIM NE all 27 8 24 45 104 297 101 181 354 933
39 Danish Seine OPEN all MA all . . . . . 16 1 . 28 45 P
40 Mid-water Paired & Single Trawl AA all NE all 5 . . 2 7 5 . . 3 8
41 Mid-water Paired & Single Trawl OPEN all MA all . . . . . . 1 10 . 11 P
42 Mid-water Paired & Single Trawl OPEN all NE all 1 5 5 7 18 79 125 97 63 364
43 Pots and Traps, Fish OPEN all MA all 4 3 . 4 11 234 155 50 238 677
44 Pots and Traps, Fish OPEN all NE all 14 . . 2 16 410 36 1 150 597
45 Pots and Traps, Conch OPEN all MA all 2 13 . 13 28 188 602 77 282 1,149
46 Pots and Traps, Conch OPEN all NE all 8 7 . 3 18 421 516 . 360 1,297
47 Pots and Traps, Hagfish OPEN all NE all . . . . . 13 11 6 9 39 P
48 Pots and Traps, Lobster OPEN all MA all 5 4 . 7 16 672 344 146 322 1,484
49 Pots and Traps, Lobster OPEN all NE all 114 82 25 4 225 12,210 8,723 1,989 5,034 27,956
50 Pots and Traps, Crab OPEN all MA all . . . . . 9 16 2 25 52 P
51 Pots and Traps, Crab OPEN all NE all . . . . . 13 16 11 9 49 P
52 Beam Trawl OPEN all MA all . . . . . 42 13 19 35 109 P
53 Beam Trawl OPEN all NE all . . . . . 66 6 7 23 102 P
54 Dredge, Other OPEN all MA all . . . . . . 95 180 30 305 P
55 Ocean Quahog/Surfclam Dredge OPEN all MA all 2 6 8 6 22 446 412 419 481 1,758
56 Ocean Quahog/Surfclam Dredge OPEN all NE all 7 8 5 3 23 742 417 404 612 2,175
Total 1,532 925 696 1,049 4,202 31,892 20,949 10,149 21,239 84,229

See text for fleet abbreviations. 18
Table 3. Number of Northeast Fisheries Observer Program (NEFOP) and Vessel Trip Report (VTR) sea days, by fleet and calendar quarter (Q) based on July 2015 through June 2016 data. "P" indicates fleets with "pilot" designation.
FLEET NEFOP VTR
Row Gear Type Access Trip Region Mesh Area Category Group Q3 Q4 Q1 Q2 TOTAL Q3 Q4 Q1 Q2 TOTAL Pilot
1 Longline OPEN all MA all 11 12 25 26 74 404 290 222 330 1,246
2 Longline OPEN all NE all 1 . . 9 10 554 135 12 160 861
3 Hand Line OPEN all MA all 1 1 12 . 14 1,626 687 114 774 3,201 P
4 Hand Line OPEN all NE all 52 9 1 9 71 1,845 790 33 518 3,186
5 Otter Trawl OPEN all MA sm 177 215 363 222 977 1,768 1,684 2,174 1,413 7,039
6 Otter Trawl OPEN all MA lg 98 83 158 103 442 2,217 2,058 3,168 1,867 9,310
7 Otter Trawl OPEN all NE sm 309 257 229 256 1,051 3,679 1,925 1,746 3,093 10,443
8 Otter Trawl OPEN all NE lg 802 609 661 416 2,488 4,546 3,587 3,931 3,814 15,878
9 Scallop Trawl AA GEN MA all . . . 14 14 84 . . 251 335
10 Scallop Trawl AA LIM MA all . . . . . . . 4 . 4 P
11 Scallop Trawl OPEN GEN MA all 7 1 3 4 15 75 5 2 42 124
12 Scallop Trawl OPEN LIM MA all . . . . . . 17 26 . 43 P
13 Otter Trawl, Twin OPEN all MA all 4 . 10 . 14 50 73 144 43 310 P
14 Otter Trawl, Twin OPEN all NE all 17 8 . . 25 56 70 25 20 171 P
15 Otter Trawl, Ruhle OPEN all MA lg . . . . . . . 5 . 5 P
16 Otter Trawl, Ruhle OPEN all NE sm . 4 . . 4 . 16 42 . 58 P
17 Otter Trawl, Ruhle OPEN all NE lg . . . . . 8 . 2 64 74 P
18 Otter Trawl, Haddock Separator OPEN all NE lg 81 38 53 62 234 407 315 250 489 1,461
19 Shrimp Trawl OPEN all MA all 5 . . . 5 248 237 11 35 531 P
20 Shrimp Trawl OPEN all NE all . . . . . 45 21 32 24 122 P
21 Floating Trap OPEN all MA all . . . . . 29 1 . 46 76 P
22 Floating Trap OPEN all NE all . . . . . 15 . . . 15 P
23 Sink, Anchor, Drift Gillnet OPEN all MA sm 81 50 59 73 263 491 340 534 286 1,651
24 Sink, Anchor, Drift Gillnet OPEN all MA lg 33 85 69 60 247 382 914 551 438 2,285
25 Sink, Anchor, Drift Gillnet OPEN all MA xlg 7 49 31 95 182 118 547 376 965 2,006
26 Sink, Anchor, Drift Gillnet OPEN all NE sm . . . . . 1 1 . 2 4 P
27 Sink, Anchor, Drift Gillnet OPEN all NE lg 408 149 41 74 672 1,886 902 357 858 4,003
28 Sink, Anchor, Drift Gillnet OPEN all NE xlg 370 112 28 57 567 1,728 934 788 1,657 5,107
29 Purse Seine OPEN all MA all . . . . . 33 . . 190 223 P
30 Purse Seine OPEN all NE all 14 3 . 5 22 383 69 . 72 524

See text for fleet abbreviations. 19
Table 3, continued. Number of Northeast Fisheries Observer Program (NEFOP) and Vessel Trip Report (VTR) sea days, by fleet and calendar quarter (Q) based on July 2015 through June 2016 data. "P" indicates fleets with "pilot" designation.
FLEET NEFOP VTR
Row Gear Type Access Trip Region Mesh Area Category Group Q3 Q4 Q1 Q2 TOTAL Q3 Q4 Q1 Q2 TOTAL Pilot
31 Scallop Dredge AA GEN MA all 49 3 7 116 175 1,104 46 42 2,602 3,794
32 Scallop Dredge AA GEN NE all . . . 72 72 12 26 3 808 849
33 Scallop Dredge AA LIM MA all 115 99 21 280 515 1,177 848 207 1,767 3,999
34 Scallop Dredge AA LIM NE all 185 152 57 300 694 1,657 1,364 278 1,481 4,780
35 Scallop Dredge OPEN GEN MA all 38 43 64 16 161 1,452 921 801 755 3,929
36 Scallop Dredge OPEN GEN NE all 39 38 60 30 167 880 797 1,413 1,154 4,244
37 Scallop Dredge OPEN LIM MA all 116 19 42 238 415 1,416 411 338 1,831 3,996
38 Scallop Dredge OPEN LIM NE all 259 84 193 466 1,002 2,908 786 1,498 3,688 8,880
39 Danish Seine OPEN all MA all . . . . . 19 1 . 29 49 P
40 Mid-water Paired & Single Trawl AA all NE all 25 . . 8 33 25 . . 10 35
41 Mid-water Paired & Single Trawl OPEN all MA all . . . . . . 3 42 . 45 P
42 Mid-water Paired & Single Trawl OPEN all NE all 5 13 17 27 62 353 347 229 241 1,170
43 Pots and Traps, Fish OPEN all MA all 4 3 . 4 11 252 170 51 244 717
44 Pots and Traps, Fish OPEN all NE all 14 . . 2 16 413 44 1 159 617
45 Pots and Traps, Conch OPEN all MA all 2 13 . 13 28 188 612 81 284 1,165
46 Pots and Traps, Conch OPEN all NE all 8 7 . 3 18 422 516 . 360 1,298
47 Pots and Traps, Hagfish OPEN all NE all . . . . . 114 90 37 84 325 P
48 Pots and Traps, Lobster OPEN all MA all 5 5 . 9 19 818 430 180 406 1,834
49 Pots and Traps, Lobster OPEN all NE all 271 183 27 4 485 14,657 11,094 3,815 6,827 36,393
50 Pots and Traps, Crab OPEN all MA all . . . . . 49 19 12 69 149 P
51 Pots and Traps, Crab OPEN all NE all . . . . . 92 147 88 31 358 P
52 Beam Trawl OPEN all MA all . . . . . 74 37 73 69 253 P
53 Beam Trawl OPEN all NE all . . . . . 79 6 7 23 115 P
54 Dredge, Other OPEN all MA all . . . . . . 95 180 39 314 P
55 Ocean Quahog/Surfclam Dredge OPEN all MA all 5 18 24 19 66 688 724 714 1,021 3,147
56 Ocean Quahog/Surfclam Dredge OPEN all NE all 19 25 18 9 71 855 533 549 885 2,822
Total 3,637 2,390 2,273 3,101 11,401 52,382 35,685 25,188 42,317 155,573

See text for fleet abbreviations 20
Table 4. Vessel Trip Report kept weight of all species (live mt), percentage of kept weight of all species across all fleets, kept weight of all species (live mt) with Northeast Fisheries Observer Program (NEFOP) coverage from statistical areas and quarters with at least 1 observed trip and at least 3 observed trips in the fleet and quarter, and percentage of kept weight of all species with observer coverage, by fleet based on July 2015 through June 2016 data.
Fleet Row Gear Type Access Trip Region Mesh Area Category Group
Kept Weight (mt)
Percentage of Kept Weight
Kept Weight with NEFOP
coverage (mt)
Percentage of Kept Weight with NEFOP coverage
1 Longline OPEN all MA all 542 0.1 136 25.1
2 Longline OPEN all NE all 1,469 0.3 40 2.7
3 Hand Line OPEN all MA all 224 <0.1 0 0.0
4 Hand Line OPEN all NE all 1,205 0.2 587 48.7
5 Otter Trawl OPEN all MA sm 11,523 2.1 10,651 92.4
6 Otter Trawl OPEN all MA lg 7,383 1.4 6,576 89.1
7 Otter Trawl OPEN all NE sm 24,158 4.5 23,635 97.8
8 Otter Trawl OPEN all NE lg 22,936 4.2 22,803 99.4
9 Scallop Trawl AA GEN MA all 350 0.1 256 73.3
11 Scallop Trawl OPEN GEN MA all 43 <0.1 22 52.1
12 Scallop Trawl OPEN LIM MA all 30 <0.1 0 0.0
13 Otter Trawl, Twin OPEN all MA all 931 0.2 60 6.4
14 Otter Trawl, Twin OPEN all NE all 438 0.1 0 0.0
16 Otter Trawl, Ruhle OPEN all NE sm 583 0.1 0 0.0
17 Otter Trawl, Ruhle OPEN all NE lg 38 <0.1 0 0.0
18 Otter Trawl, Haddock Separator OPEN all NE lg 1,884 0.3 1,840 97.7
19 Shrimp Trawl OPEN all MA all 273 0.1 0 0.0
20 Shrimp Trawl OPEN all NE all 107 <0.1 0 0.0
22 Floating Trap OPEN all NE all 2 <0.1 0 0.0
23 Sink, Anchor, Drift Gillnet OPEN all MA sm 1,723 0.3 1,686 97.8
24 Sink, Anchor, Drift Gillnet OPEN all MA lg 3,041 0.6 2,843 93.5
25 Sink, Anchor, Drift Gillnet OPEN all MA xlg 2,576 0.5 2,506 97.3
26 Sink, Anchor, Drift Gillnet OPEN all NE sm 1 <0.1 0 0.0
27 Sink, Anchor, Drift Gillnet OPEN all NE lg 3,358 0.6 3,130 93.2
28 Sink, Anchor, Drift Gillnet OPEN all NE xlg 8,556 1.6 8,240 96.3
29 Purse Seine OPEN all MA all 18,946 3.5 0 0.0
30 Purse Seine OPEN all NE all 25,340 4.7 16,288 64.3
31 Scallop Dredge AA GEN MA all 4,974 0.9 4,835 97.2
32 Scallop Dredge AA GEN NE all 1,089 0.2 938 86.2
33 Scallop Dredge AA LIM MA all 25,863 4.8 25,640 99.1
34 Scallop Dredge AA LIM NE all 32,870 6.1 32,569 99.1
35 Scallop Dredge OPEN GEN MA all 3,096 0.6 2,622 84.7
36 Scallop Dredge OPEN GEN NE all 3,132 0.6 2,728 87.1
37 Scallop Dredge OPEN LIM MA all 17,714 3.3 14,950 84.4
38 Scallop Dredge OPEN LIM NE all 46,770 8.6 42,524 90.9
39 Danish Seine OPEN all MA all 1,050 0.2 0 0.0
40 Mid-water Paired & Single Trawl AA all NE all 1,277 0.2 776 60.8
42 Mid-water Paired & Single Trawl OPEN all NE all 41,636 7.7 23,749 57.0
43 Pots and Traps, Fish OPEN all MA all 195 <0.1 63 32.2

See text for fleet abbreviations. 21
Table 4, continued. Vessel Trip Report kept weight of all species (live mt), percentage of kept weight of all species across all fleets, kept weight of all species (live mt) with Northeast Fisheries Observer Program (NEFOP) coverage from statistical areas and quarters with at least 1 observed trip and at least 3 observed trips in the fleet and quarter, and percentage of kept weight of all species with observer coverage, by fleet based on July 2015 through June 2016 data.
Fleet Row Gear Type Access Trip Region Mesh Area Category Group
Kept Weight (mt)
Percentage of Kept Weight
Kept Weight with NEFOP
coverage (mt)
Percentage of Kept Weight with NEFOP coverage
44 Pots and Traps, Fish OPEN all NE all 127 <0.1 66 51.8
45 Pots and Traps, Conch OPEN all MA all 720 0.1 519 72.1
46 Pots and Traps, Conch OPEN all NE all 366 0.1 314 85.8
47 Pots and Traps, Hagfish OPEN all NE all 808 0.1 0 0.0
48 Pots and Traps, Lobster OPEN all MA all 762 0.1 221 29.1
49 Pots and Traps, Lobster OPEN all NE all 14,118 2.6 10,881 77.1
50 Pots and Traps, Crab OPEN all MA all 154 <0.1 0 0.0
51 Pots and Traps, Crab OPEN all NE all 1,199 0.2 0 0.0
52 Beam Trawl OPEN all MA all 121 <0.1 0 0.0
53 Beam Trawl OPEN all NE all 113 <0.1 0 0.0
54 Dredge, Other OPEN all MA all 100 <0.1 0 0.0
55 Ocean Quahog/Surfclam Dredge OPEN all MA all 112,702 20.8 68,248 60.6
56 Ocean Quahog/Surfclam Dredge OPEN all NE all 90,078 16.6 56,557 62.8
Confidential fleets 2,281 0.4 0 0.0
Other minor fleets 791 0.1 0 0.0
Total 541,766 100.0 389,498 71.9

See text for fleet abbreviations 22
Table 5A. Total catch (live lb), Vessel Trip Report landings (kept; live lb), estimated discards (live lb), associated coefficient of variation (CV), and standard error of the estimated discards (SE; live lb) for 14 fish and invertebrate species groups, by fleet, based on July 2015 through June 2016 data. Dark shading indicates fleets not considered or with no Northeast Fisheries Observer Program trips in the annual analysis. Light shading indicates that the variance of the discard estimate was not used in the annual sample size analysis. Blank CV indicates either no discards or discards equals 0. "P" indicates fleets with "pilot" designation.
Species Group: ATLANTIC SALMON (Salmo salar) Fleet Row Gear Type Access Trip Region Mesh Area Category Group Total Kept Discarded CV SE Pilot
1 Longline OPEN all MA all 0 0 0
2 Longline OPEN all NE all 0 0 0
3 Hand Line OPEN all MA all 0 0 0 P
4 Hand Line OPEN all NE all 0 0 0
5 Otter Trawl OPEN all MA sm 0 0 0
6 Otter Trawl OPEN all MA lg 0 0 0
7 Otter Trawl OPEN all NE sm 0 0 0
8 Otter Trawl OPEN all NE lg 0 0 0
9 Scallop Trawl AA GEN MA all 0 0 0
11 Scallop Trawl OPEN GEN MA all 0 0 0
12 Scallop Trawl OPEN LIM MA all 0 0 P
13 Otter Trawl, Twin OPEN all MA all 0 0 0 P
14 Otter Trawl, Twin OPEN all NE all 0 0 0 P
16 Otter Trawl, Ruhle OPEN all NE sm 0 0 0 P
17 Otter Trawl, Ruhle OPEN all NE lg 0 0 P
18 Otter Trawl, Haddock Separator OPEN all NE lg 0 0 0
19 Shrimp Trawl OPEN all MA all 0 0 0 P
20 Shrimp Trawl OPEN all NE all 0 0 P
22 Floating Trap OPEN all NE all 0 0 P
23 Sink, Anchor, Drift Gillnet OPEN all MA sm 0 0 0
24 Sink, Anchor, Drift Gillnet OPEN all MA lg 0 0 0
25 Sink, Anchor, Drift Gillnet OPEN all MA xlg 0 0 0
26 Sink, Anchor, Drift Gillnet OPEN all NE sm 0 0 P
27 Sink, Anchor, Drift Gillnet OPEN all NE lg 0 0 0
28 Sink, Anchor, Drift Gillnet OPEN all NE xlg 0 0 0
29 Purse Seine OPEN all MA all 0 0 P
30 Purse Seine OPEN all NE all 0 0 0
See text for fleet abbreviations. 23
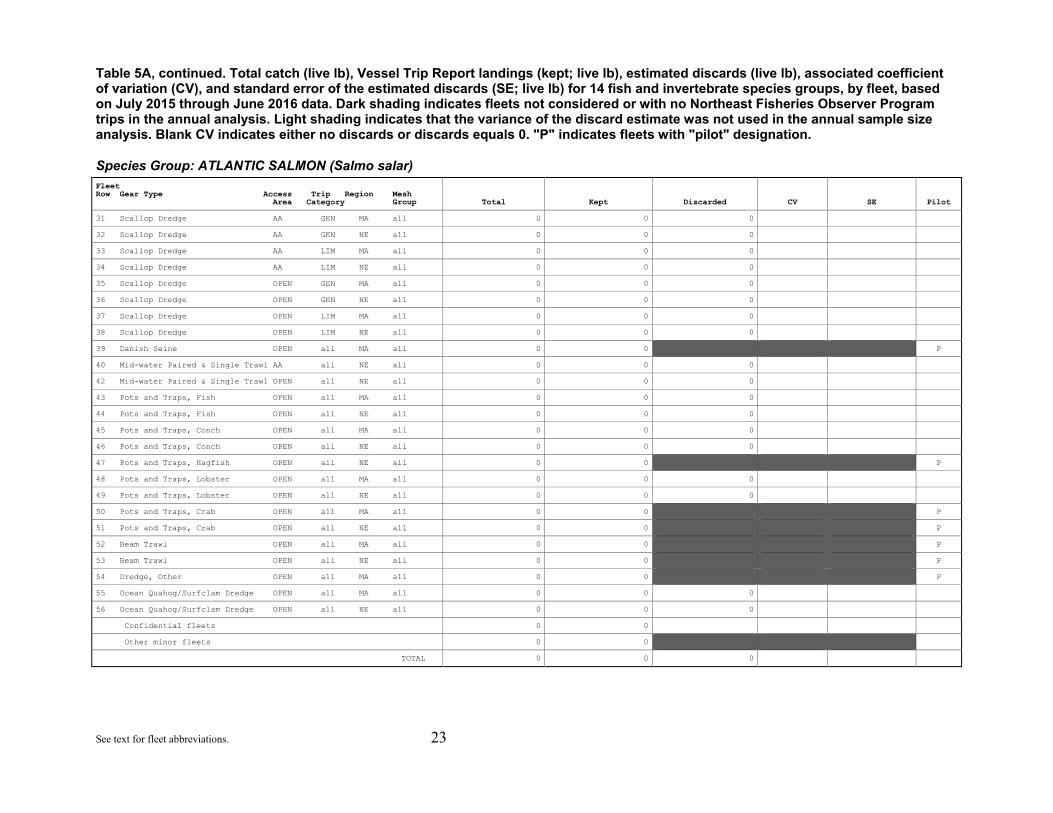
Table 5A, continued. Total catch (live lb), Vessel Trip Report landings (kept; live lb), estimated discards (live lb), associated coefficient of variation (CV), and standard error of the estimated discards (SE; live lb) for 14 fish and invertebrate species groups, by fleet, based on July 2015 through June 2016 data. Dark shading indicates fleets not considered or with no Northeast Fisheries Observer Program trips in the annual analysis. Light shading indicates that the variance of the discard estimate was not used in the annual sample size analysis. Blank CV indicates either no discards or discards equals 0. "P" indicates fleets with "pilot" designation.
Species Group: ATLANTIC SALMON (Salmo salar) Fleet Row Gear Type Access Trip Region Mesh Area Category Group Total Kept Discarded CV SE Pilot
31 Scallop Dredge AA GEN MA all 0 0 0
32 Scallop Dredge AA GEN NE all 0 0 0
33 Scallop Dredge AA LIM MA all 0 0 0
34 Scallop Dredge AA LIM NE all 0 0 0
35 Scallop Dredge OPEN GEN MA all 0 0 0
36 Scallop Dredge OPEN GEN NE all 0 0 0
37 Scallop Dredge OPEN LIM MA all 0 0 0
38 Scallop Dredge OPEN LIM NE all 0 0 0
39 Danish Seine OPEN all MA all 0 0 P
40 Mid-water Paired & Single Trawl AA all NE all 0 0 0
42 Mid-water Paired & Single Trawl OPEN all NE all 0 0 0
43 Pots and Traps, Fish OPEN all MA all 0 0 0
44 Pots and Traps, Fish OPEN all NE all 0 0 0
45 Pots and Traps, Conch OPEN all MA all 0 0 0
46 Pots and Traps, Conch OPEN all NE all 0 0 0
47 Pots and Traps, Hagfish OPEN all NE all 0 0 P
48 Pots and Traps, Lobster OPEN all MA all 0 0 0
49 Pots and Traps, Lobster OPEN all NE all 0 0 0
50 Pots and Traps, Crab OPEN all MA all 0 0 P
51 Pots and Traps, Crab OPEN all NE all 0 0 P
52 Beam Trawl OPEN all MA all 0 0 P
53 Beam Trawl OPEN all NE all 0 0 P
54 Dredge, Other OPEN all MA all 0 0 P
55 Ocean Quahog/Surfclam Dredge OPEN all MA all 0 0 0
56 Ocean Quahog/Surfclam Dredge OPEN all NE all 0 0 0
Confidential fleets 0 0
Other minor fleets 0 0
TOTAL 0 0 0

See text for fleet abbreviations. 24
Table 5A, continued. Total catch (live lb), Vessel Trip Report landings (kept; live lb), estimated discards (live lb), associated coefficient of variation (CV), and standard error of the estimated discards (SE; live lb) for 14 fish and invertebrate species groups, by fleet, based on July 2015 through June 2016 data. Dark shading indicates fleets not considered or with no Northeast Fisheries Observer Program trips in the annual analysis. Light shading indicates that the variance of the discard estimate was not used in the annual sample size analysis. Blank CV indicates either no discards or discards equals 0. "P" indicates fleets with "pilot" designation.
Species Group: BLUEFISH (Pomatomus saltatrix) Fleet Row Gear Type Access Trip Region Mesh Area Category Group Total Kept Discarded CV SE Pilot
1 Longline OPEN all MA all 290 210 80 1.153 92
2 Longline OPEN all NE all 0 0 0
3 Hand Line OPEN all MA all 107,499 107,499 0 P
4 Hand Line OPEN all NE all 22,510 22,510 0
5 Otter Trawl OPEN all MA sm 168,228 163,538 4,690 0.373 1,750
6 Otter Trawl OPEN all MA lg 102,362 102,295 67 0.865 58
7 Otter Trawl OPEN all NE sm 95,792 89,239 6,553 0.364 2,388
8 Otter Trawl OPEN all NE lg 32,191 28,931 3,260 0.337 1,098
9 Scallop Trawl AA GEN MA all 0 0 0
11 Scallop Trawl OPEN GEN MA all 20 20 0
12 Scallop Trawl OPEN LIM MA all 0 0 P
13 Otter Trawl, Twin OPEN all MA all 0 0 0 P
14 Otter Trawl, Twin OPEN all NE all 683 630 53 0.861 45 P
16 Otter Trawl, Ruhle OPEN all NE sm 50 50 0 P
17 Otter Trawl, Ruhle OPEN all NE lg 0 0 P
18 Otter Trawl, Haddock Separator OPEN all NE lg 0 0 0
19 Shrimp Trawl OPEN all MA all 10 10 0 P
20 Shrimp Trawl OPEN all NE all 254 254 P
22 Floating Trap OPEN all NE all 600 600 P
23 Sink, Anchor, Drift Gillnet OPEN all MA sm 79,298 77,185 2,113 0.303 640
24 Sink, Anchor, Drift Gillnet OPEN all MA lg 694,287 680,625 13,662 0.584 7,978
25 Sink, Anchor, Drift Gillnet OPEN all MA xlg 38,899 33,548 5,351 0.315 1,684
26 Sink, Anchor, Drift Gillnet OPEN all NE sm 800 800 P
27 Sink, Anchor, Drift Gillnet OPEN all NE lg 189,133 187,840 1,293 0.339 438
28 Sink, Anchor, Drift Gillnet OPEN all NE xlg 26,604 15,932 10,672 0.174 1,853
29 Purse Seine OPEN all MA all 0 0 P
30 Purse Seine OPEN all NE all 0 0 0

See text for fleet abbreviations. 25
Table 5A, continued. Total catch (live lb), Vessel Trip Report landings (kept; live lb), estimated discards (live lb), associated coefficient of variation (CV), and standard error of the estimated discards (SE; live lb) for 14 fish and invertebrate species groups, by fleet, based on July 2015 through June 2016 data. Dark shading indicates fleets not considered or with no Northeast Fisheries Observer Program trips in the annual analysis. Light shading indicates that the variance of the discard estimate was not used in the annual sample size analysis. Blank CV indicates either no discards or discards equals 0. "P" indicates fleets with "pilot" designation.
Species Group: BLUEFISH (Pomatomus saltatrix) Fleet Row Gear Type Access Trip Region Mesh Area Category Group Total Kept Discarded CV SE Pilot
31 Scallop Dredge AA GEN MA all 0 0 0
32 Scallop Dredge AA GEN NE all 0 0 0
33 Scallop Dredge AA LIM MA all 0 0 0
34 Scallop Dredge AA LIM NE all 0 0 0
35 Scallop Dredge OPEN GEN MA all 0 0 0
36 Scallop Dredge OPEN GEN NE all 0 0 0
37 Scallop Dredge OPEN LIM MA all 0 0 0
38 Scallop Dredge OPEN LIM NE all 0 0 0
39 Danish Seine OPEN all MA all 0 0 P
40 Mid-water Paired & Single Trawl AA all NE all 0 0 0
42 Mid-water Paired & Single Trawl OPEN all NE all 0 0 0
43 Pots and Traps, Fish OPEN all MA all 2,338 2,338 0
44 Pots and Traps, Fish OPEN all NE all 0 0 0
45 Pots and Traps, Conch OPEN all MA all 31 31 0
46 Pots and Traps, Conch OPEN all NE all 0 0 0
47 Pots and Traps, Hagfish OPEN all NE all 0 0 P
48 Pots and Traps, Lobster OPEN all MA all 1,591 1,591 0
49 Pots and Traps, Lobster OPEN all NE all 226 226 0
50 Pots and Traps, Crab OPEN all MA all 0 0 P
51 Pots and Traps, Crab OPEN all NE all 0 0 P
52 Beam Trawl OPEN all MA all 772 772 P
53 Beam Trawl OPEN all NE all 60 60 P
54 Dredge, Other OPEN all MA all 0 0 P
55 Ocean Quahog/Surfclam Dredge OPEN all MA all 333 0 333 1.109 369
56 Ocean Quahog/Surfclam Dredge OPEN all NE all 0 0 0
Confidential fleets 84,307 84,307
Other minor fleets 1,884 1,884
TOTAL 1,651,050 1,602,925 48,125 0.187 8,980
See text for fleet abbreviations. 26
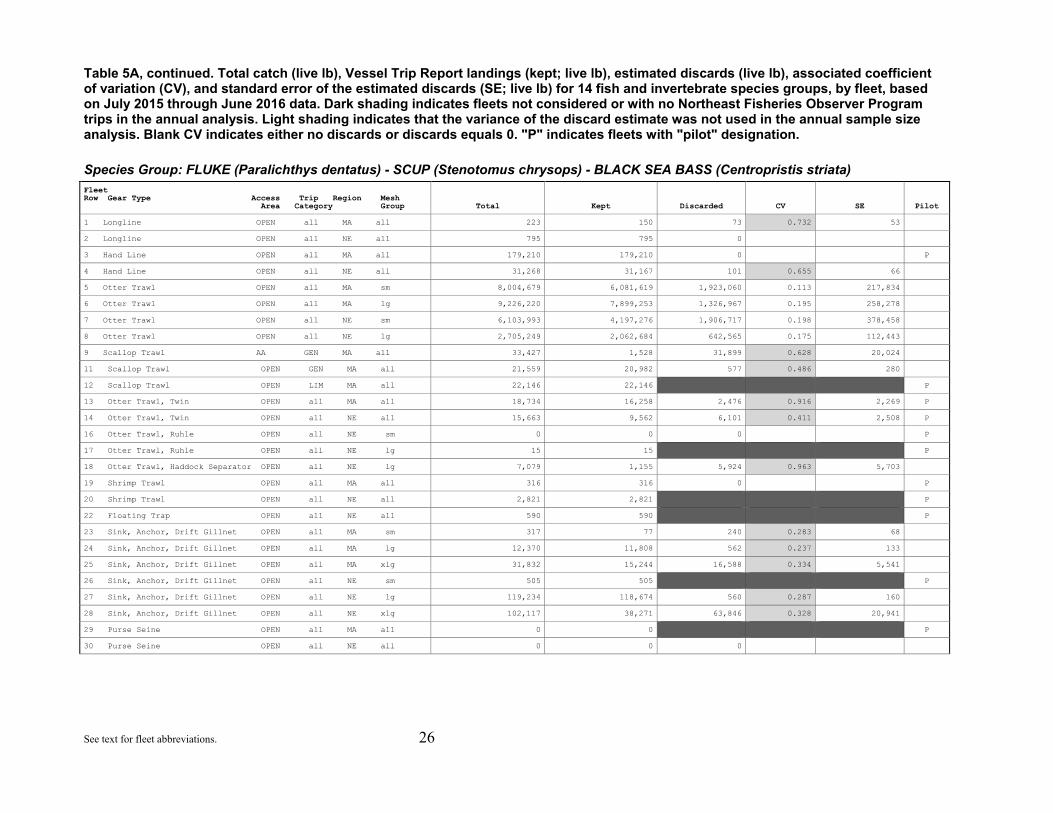
Table 5A, continued. Total catch (live lb), Vessel Trip Report landings (kept; live lb), estimated discards (live lb), associated coefficient of variation (CV), and standard error of the estimated discards (SE; live lb) for 14 fish and invertebrate species groups, by fleet, based on July 2015 through June 2016 data. Dark shading indicates fleets not considered or with no Northeast Fisheries Observer Program trips in the annual analysis. Light shading indicates that the variance of the discard estimate was not used in the annual sample size analysis. Blank CV indicates either no discards or discards equals 0. "P" indicates fleets with "pilot" designation.
Species Group: FLUKE (Paralichthys dentatus) - SCUP (Stenotomus chrysops) - BLACK SEA BASS (Centropristis striata) Fleet Row Gear Type Access Trip Region Mesh Area Category Group Total Kept Discarded CV SE Pilot
1 Longline OPEN all MA all 223 150 73 0.732 53
2 Longline OPEN all NE all 795 795 0
3 Hand Line OPEN all MA all 179,210 179,210 0 P
4 Hand Line OPEN all NE all 31,268 31,167 101 0.655 66
5 Otter Trawl OPEN all MA sm 8,004,679 6,081,619 1,923,060 0.113 217,834
6 Otter Trawl OPEN all MA lg 9,226,220 7,899,253 1,326,967 0.195 258,278
7 Otter Trawl OPEN all NE sm 6,103,993 4,197,276 1,906,717 0.198 378,458
8 Otter Trawl OPEN all NE lg 2,705,249 2,062,684 642,565 0.175 112,443
9 Scallop Trawl AA GEN MA all 33,427 1,528 31,899 0.628 20,024
11 Scallop Trawl OPEN GEN MA all 21,559 20,982 577 0.486 280
12 Scallop Trawl OPEN LIM MA all 22,146 22,146 P
13 Otter Trawl, Twin OPEN all MA all 18,734 16,258 2,476 0.916 2,269 P
14 Otter Trawl, Twin OPEN all NE all 15,663 9,562 6,101 0.411 2,508 P
16 Otter Trawl, Ruhle OPEN all NE sm 0 0 0 P
17 Otter Trawl, Ruhle OPEN all NE lg 15 15 P
18 Otter Trawl, Haddock Separator OPEN all NE lg 7,079 1,155 5,924 0.963 5,703
19 Shrimp Trawl OPEN all MA all 316 316 0 P
20 Shrimp Trawl OPEN all NE all 2,821 2,821 P
22 Floating Trap OPEN all NE all 590 590 P
23 Sink, Anchor, Drift Gillnet OPEN all MA sm 317 77 240 0.283 68
24 Sink, Anchor, Drift Gillnet OPEN all MA lg 12,370 11,808 562 0.237 133
25 Sink, Anchor, Drift Gillnet OPEN all MA xlg 31,832 15,244 16,588 0.334 5,541
26 Sink, Anchor, Drift Gillnet OPEN all NE sm 505 505 P
27 Sink, Anchor, Drift Gillnet OPEN all NE lg 119,234 118,674 560 0.287 160
28 Sink, Anchor, Drift Gillnet OPEN all NE xlg 102,117 38,271 63,846 0.328 20,941
29 Purse Seine OPEN all MA all 0 0 P
30 Purse Seine OPEN all NE all 0 0 0

See text for fleet abbreviations. 27
Table 5A, continued. Total catch (live lb), Vessel Trip Report landings (kept; live lb), estimated discards (live lb), associated coefficient of variation (CV), and standard error of the estimated discards (SE; live lb) for 14 fish and invertebrate species groups, by fleet, based on July 2015 through June 2016 data. Dark shading indicates fleets not considered or with no Northeast Fisheries Observer Program trips in the annual analysis. Light shading indicates that the variance of the discard estimate was not used in the annual sample size analysis. Blank CV indicates either no discards or discards equals 0. "P" indicates fleets with "pilot" designation.
Species Group: FLUKE (Paralichthys dentatus) - SCUP (Stenotomus chrysops) - BLACK SEA BASS (Centropristis striata) Fleet Row Gear Type Access Trip Region Mesh Area Category Group Total Kept Discarded CV SE Pilot
31 Scallop Dredge AA GEN MA all 15,393 4,296 11,097 0.166 1,843
32 Scallop Dredge AA GEN NE all 754 0 754 0.210 158
33 Scallop Dredge AA LIM MA all 94,532 5,176 89,356 0.190 17,016
34 Scallop Dredge AA LIM NE all 111,994 70 111,924 0.154 17,289
35 Scallop Dredge OPEN GEN MA all 64,212 11,867 52,345 0.194 10,151
36 Scallop Dredge OPEN GEN NE all 27,423 3,071 24,352 0.372 9,054
37 Scallop Dredge OPEN LIM MA all 102,155 9,920 92,235 0.287 26,429
38 Scallop Dredge OPEN LIM NE all 163,722 50 163,672 0.220 35,981
39 Danish Seine OPEN all MA all 2,961 2,961 P
40 Mid-water Paired & Single Trawl AA all NE all 0 0 0
42 Mid-water Paired & Single Trawl OPEN all NE all 6,000 6,000 0
43 Pots and Traps, Fish OPEN all MA all 396,350 293,436 102,914 0.834 85,810
44 Pots and Traps, Fish OPEN all NE all 267,230 160,629 106,601 0.215 22,970
45 Pots and Traps, Conch OPEN all MA all 1,900 1,316 584 0.401 234
46 Pots and Traps, Conch OPEN all NE all 2,761 250 2,511 0.983 2,468
47 Pots and Traps, Hagfish OPEN all NE all 0 0 P
48 Pots and Traps, Lobster OPEN all MA all 163,146 118,785 44,361 0.676 29,999
49 Pots and Traps, Lobster OPEN all NE all 84,722 25,810 58,912 0.460 27,111
50 Pots and Traps, Crab OPEN all MA all 0 0 P
51 Pots and Traps, Crab OPEN all NE all 0 0 P
52 Beam Trawl OPEN all MA all 120,713 120,713 P
53 Beam Trawl OPEN all NE all 20,255 20,255 P
54 Dredge, Other OPEN all MA all 0 0 P
55 Ocean Quahog/Surfclam Dredge OPEN all MA all 18,950 0 18,950 0.367 6,957
56 Ocean Quahog/Surfclam Dredge OPEN all NE all 2,106 0 2,106 0.675 1,422
Confidential fleets 11,604 11,604
Other minor fleets 50,731 50,731
TOTAL 28,369,977 21,559,046 6,810,931 0.078 532,259
See text for fleet abbreviations. 28
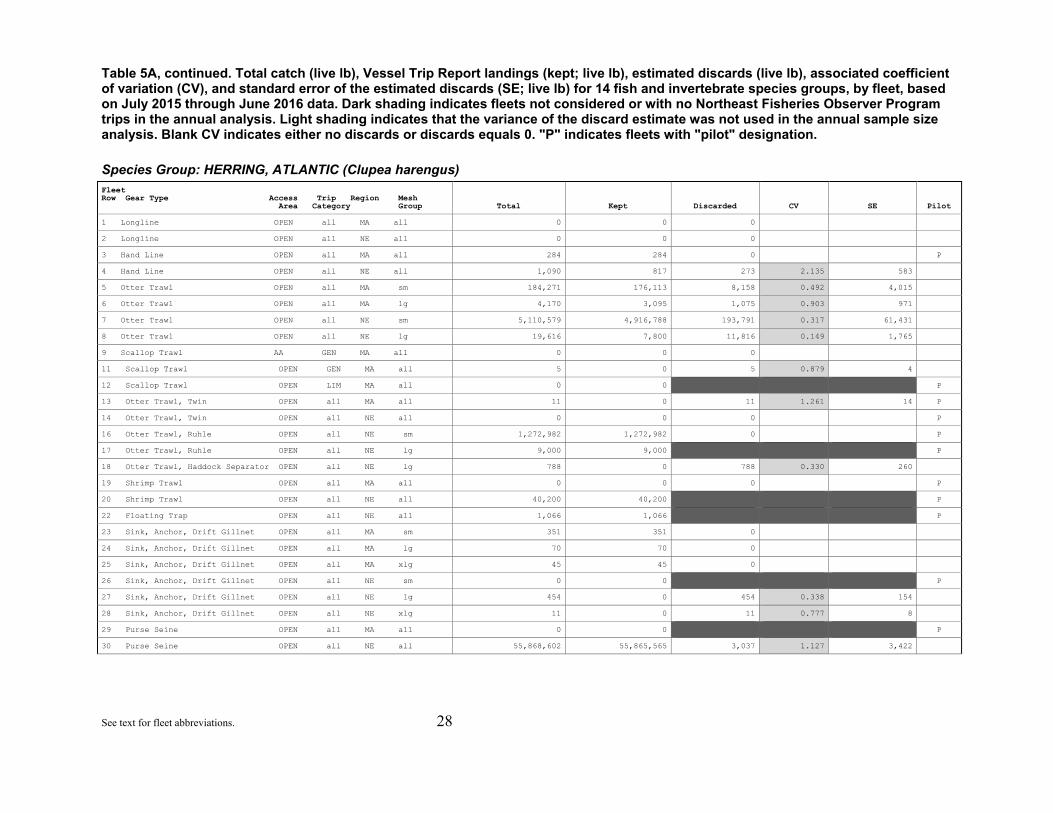
Table 5A, continued. Total catch (live lb), Vessel Trip Report landings (kept; live lb), estimated discards (live lb), associated coefficient of variation (CV), and standard error of the estimated discards (SE; live lb) for 14 fish and invertebrate species groups, by fleet, based on July 2015 through June 2016 data. Dark shading indicates fleets not considered or with no Northeast Fisheries Observer Program trips in the annual analysis. Light shading indicates that the variance of the discard estimate was not used in the annual sample size analysis. Blank CV indicates either no discards or discards equals 0. "P" indicates fleets with "pilot" designation.
Species Group: HERRING, ATLANTIC (Clupea harengus) Fleet Row Gear Type Access Trip Region Mesh Area Category Group Total Kept Discarded CV SE Pilot
1 Longline OPEN all MA all 0 0 0
2 Longline OPEN all NE all 0 0 0
3 Hand Line OPEN all MA all 284 284 0 P
4 Hand Line OPEN all NE all 1,090 817 273 2.135 583
5 Otter Trawl OPEN all MA sm 184,271 176,113 8,158 0.492 4,015
6 Otter Trawl OPEN all MA lg 4,170 3,095 1,075 0.903 971
7 Otter Trawl OPEN all NE sm 5,110,579 4,916,788 193,791 0.317 61,431
8 Otter Trawl OPEN all NE lg 19,616 7,800 11,816 0.149 1,765
9 Scallop Trawl AA GEN MA all 0 0 0
11 Scallop Trawl OPEN GEN MA all 5 0 5 0.879 4
12 Scallop Trawl OPEN LIM MA all 0 0 P
13 Otter Trawl, Twin OPEN all MA all 11 0 11 1.261 14 P
14 Otter Trawl, Twin OPEN all NE all 0 0 0 P
16 Otter Trawl, Ruhle OPEN all NE sm 1,272,982 1,272,982 0 P
17 Otter Trawl, Ruhle OPEN all NE lg 9,000 9,000 P
18 Otter Trawl, Haddock Separator OPEN all NE lg 788 0 788 0.330 260
19 Shrimp Trawl OPEN all MA all 0 0 0 P
20 Shrimp Trawl OPEN all NE all 40,200 40,200 P
22 Floating Trap OPEN all NE all 1,066 1,066 P
23 Sink, Anchor, Drift Gillnet OPEN all MA sm 351 351 0
24 Sink, Anchor, Drift Gillnet OPEN all MA lg 70 70 0
25 Sink, Anchor, Drift Gillnet OPEN all MA xlg 45 45 0
26 Sink, Anchor, Drift Gillnet OPEN all NE sm 0 0 P
27 Sink, Anchor, Drift Gillnet OPEN all NE lg 454 0 454 0.338 154
28 Sink, Anchor, Drift Gillnet OPEN all NE xlg 11 0 11 0.777 8
29 Purse Seine OPEN all MA all 0 0 P
30 Purse Seine OPEN all NE all 55,868,602 55,865,565 3,037 1.127 3,422

See text for fleet abbreviations. 29
Table 5A, continued. Total catch (live lb), Vessel Trip Report landings (kept; live lb), estimated discards (live lb), associated coefficient of variation (CV), and standard error of the estimated discards (SE; live lb) for 14 fish and invertebrate species groups, by fleet, based on July 2015 through June 2016 data. Dark shading indicates fleets not considered or with no Northeast Fisheries Observer Program trips in the annual analysis. Light shading indicates that the variance of the discard estimate was not used in the annual sample size analysis. Blank CV indicates either no discards or discards equals 0. "P" indicates fleets with "pilot" designation.
Species Group: HERRING, ATLANTIC (Clupea harengus) Fleet Row Gear Type Access Trip Region Mesh Area Category Group Total Kept Discarded CV SE Pilot
31 Scallop Dredge AA GEN MA all 0 0 0
32 Scallop Dredge AA GEN NE all 0 0 0
33 Scallop Dredge AA LIM MA all 0 0 0
34 Scallop Dredge AA LIM NE all 0 0 0
35 Scallop Dredge OPEN GEN MA all 9 0 9 0.775 7
36 Scallop Dredge OPEN GEN NE all 0 0 0
37 Scallop Dredge OPEN LIM MA all 0 0 0
38 Scallop Dredge OPEN LIM NE all 16 0 16 0.604 10
39 Danish Seine OPEN all MA all 0 0 P
40 Mid-water Paired & Single Trawl AA all NE all 2,812,872 2,812,675 197 0.411 81
42 Mid-water Paired & Single Trawl OPEN all NE all 85,410,882 85,410,628 254 0.536 136
43 Pots and Traps, Fish OPEN all MA all 0 0 0
44 Pots and Traps, Fish OPEN all NE all 0 0 0
45 Pots and Traps, Conch OPEN all MA all 0 0 0
46 Pots and Traps, Conch OPEN all NE all 0 0 0
47 Pots and Traps, Hagfish OPEN all NE all 0 0 P
48 Pots and Traps, Lobster OPEN all MA all 0 0 0
49 Pots and Traps, Lobster OPEN all NE all 30 0 30 0.532 16
50 Pots and Traps, Crab OPEN all MA all 0 0 P
51 Pots and Traps, Crab OPEN all NE all 0 0 P
52 Beam Trawl OPEN all MA all 0 0 P
53 Beam Trawl OPEN all NE all 209,510 209,510 P
54 Dredge, Other OPEN all MA all 0 0 P
55 Ocean Quahog/Surfclam Dredge OPEN all MA all 0 0 0
56 Ocean Quahog/Surfclam Dredge OPEN all NE all 0 0 0
Confidential fleets 3,077,000 3,077,000
Other minor fleets 28,435 28,435
TOTAL 154,052,349 153,832,424 219,925 0.281 61,694
See text for fleet abbreviations. 30
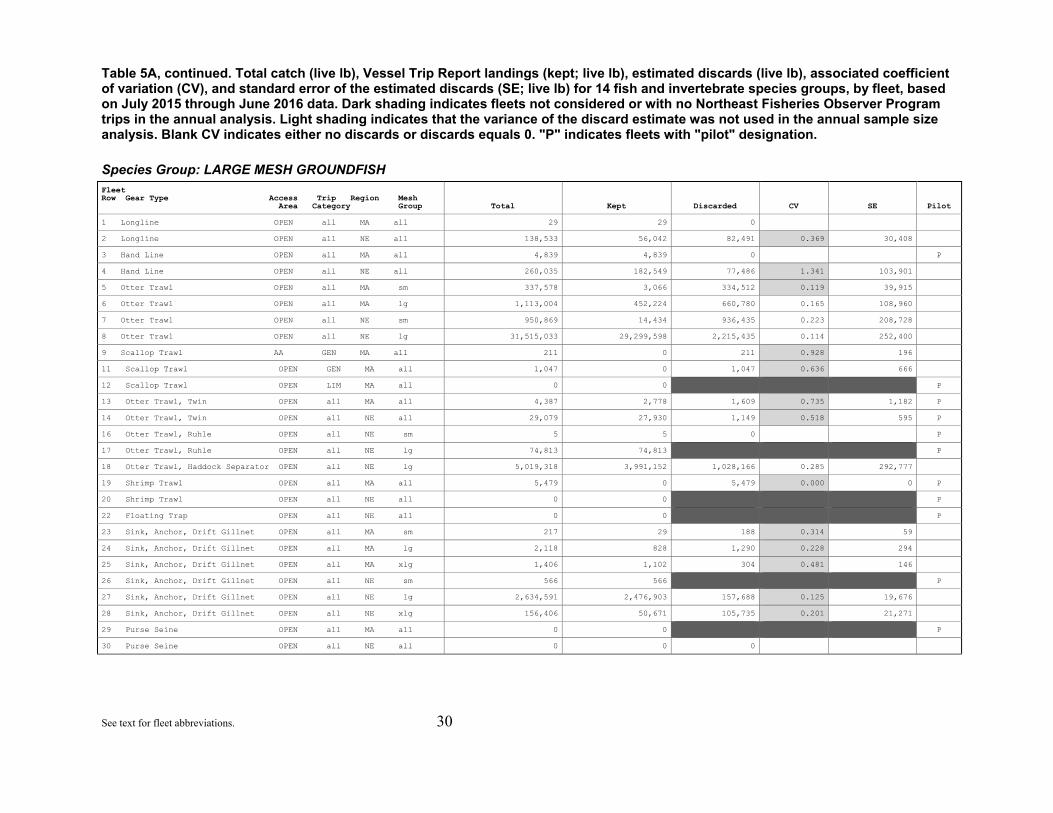
Table 5A, continued. Total catch (live lb), Vessel Trip Report landings (kept; live lb), estimated discards (live lb), associated coefficient of variation (CV), and standard error of the estimated discards (SE; live lb) for 14 fish and invertebrate species groups, by fleet, based on July 2015 through June 2016 data. Dark shading indicates fleets not considered or with no Northeast Fisheries Observer Program trips in the annual analysis. Light shading indicates that the variance of the discard estimate was not used in the annual sample size analysis. Blank CV indicates either no discards or discards equals 0. "P" indicates fleets with "pilot" designation.
Species Group: LARGE MESH GROUNDFISH
Fleet Row Gear Type Access Trip Region Mesh Area Category Group Total Kept Discarded CV SE Pilot
1 Longline OPEN all MA all 29 29 0
2 Longline OPEN all NE all 138,533 56,042 82,491 0.369 30,408
3 Hand Line OPEN all MA all 4,839 4,839 0 P
4 Hand Line OPEN all NE all 260,035 182,549 77,486 1.341 103,901
5 Otter Trawl OPEN all MA sm 337,578 3,066 334,512 0.119 39,915
6 Otter Trawl OPEN all MA lg 1,113,004 452,224 660,780 0.165 108,960
7 Otter Trawl OPEN all NE sm 950,869 14,434 936,435 0.223 208,728
8 Otter Trawl OPEN all NE lg 31,515,033 29,299,598 2,215,435 0.114 252,400
9 Scallop Trawl AA GEN MA all 211 0 211 0.928 196
11 Scallop Trawl OPEN GEN MA all 1,047 0 1,047 0.636 666
12 Scallop Trawl OPEN LIM MA all 0 0 P
13 Otter Trawl, Twin OPEN all MA all 4,387 2,778 1,609 0.735 1,182 P
14 Otter Trawl, Twin OPEN all NE all 29,079 27,930 1,149 0.518 595 P
16 Otter Trawl, Ruhle OPEN all NE sm 5 5 0 P
17 Otter Trawl, Ruhle OPEN all NE lg 74,813 74,813 P
18 Otter Trawl, Haddock Separator OPEN all NE lg 5,019,318 3,991,152 1,028,166 0.285 292,777
19 Shrimp Trawl OPEN all MA all 5,479 0 5,479 0.000 0 P
20 Shrimp Trawl OPEN all NE all 0 0 P
22 Floating Trap OPEN all NE all 0 0 P
23 Sink, Anchor, Drift Gillnet OPEN all MA sm 217 29 188 0.314 59
24 Sink, Anchor, Drift Gillnet OPEN all MA lg 2,118 828 1,290 0.228 294
25 Sink, Anchor, Drift Gillnet OPEN all MA xlg 1,406 1,102 304 0.481 146
26 Sink, Anchor, Drift Gillnet OPEN all NE sm 566 566 P
27 Sink, Anchor, Drift Gillnet OPEN all NE lg 2,634,591 2,476,903 157,688 0.125 19,676
28 Sink, Anchor, Drift Gillnet OPEN all NE xlg 156,406 50,671 105,735 0.201 21,271
29 Purse Seine OPEN all MA all 0 0 P
30 Purse Seine OPEN all NE all 0 0 0

See text for fleet abbreviations. 31
Table 5A, continued. Total catch (live lb), Vessel Trip Report landings (kept; live lb), estimated discards (live lb), associated coefficient of variation (CV), and standard error of the estimated discards (SE; live lb) for 14 fish and invertebrate species groups, by fleet, based on July 2015 through June 2016 data. Dark shading indicates fleets not considered or with no Northeast Fisheries Observer Program trips in the annual analysis. Light shading indicates that the variance of the discard estimate was not used in the annual sample size analysis. Blank CV indicates either no discards or discards equals 0. "P" indicates fleets with "pilot" designation.
Species Group: LARGE MESH GROUNDFISH
Fleet Row Gear Type Access Trip Region Mesh Area Category Group Total Kept Discarded CV SE Pilot
31 Scallop Dredge AA GEN MA all 1,411 0 1,411 0.256 361
32 Scallop Dredge AA GEN NE all 1,675 0 1,675 0.123 207
33 Scallop Dredge AA LIM MA all 5,738 5 5,733 0.218 1,249
34 Scallop Dredge AA LIM NE all 4,230 0 4,230 0.246 1,040
35 Scallop Dredge OPEN GEN MA all 35,726 34 35,692 0.145 5,190
36 Scallop Dredge OPEN GEN NE all 76,103 0 76,103 0.156 11,907
37 Scallop Dredge OPEN LIM MA all 26,302 124 26,178 0.229 6,002
38 Scallop Dredge OPEN LIM NE all 644,934 2,397 642,537 0.115 73,662
39 Danish Seine OPEN all MA all 0 0 P
40 Mid-water Paired & Single Trawl AA all NE all 3,070 2,465 605 0.477 289
42 Mid-water Paired & Single Trawl OPEN all NE all 33,666 33,445 221 0.805 178
43 Pots and Traps, Fish OPEN all MA all 6,878 523 6,355 0.501 3,182
44 Pots and Traps, Fish OPEN all NE all 290 290 0
45 Pots and Traps, Conch OPEN all MA all 0 0 0
46 Pots and Traps, Conch OPEN all NE all 0 0 0
47 Pots and Traps, Hagfish OPEN all NE all 0 0 P
48 Pots and Traps, Lobster OPEN all MA all 4,066 1,218 2,848 0.394 1,121
49 Pots and Traps, Lobster OPEN all NE all 122,818 1,048 121,770 0.522 63,616
50 Pots and Traps, Crab OPEN all MA all 0 0 P
51 Pots and Traps, Crab OPEN all NE all 0 0 P
52 Beam Trawl OPEN all MA all 108 108 P
53 Beam Trawl OPEN all NE all 0 0 P
54 Dredge, Other OPEN all MA all 0 0 P
55 Ocean Quahog/Surfclam Dredge OPEN all MA all 1,282 0 1,282 0.441 566
56 Ocean Quahog/Surfclam Dredge OPEN all NE all 6,704 0 6,704 0.361 2,418
Confidential fleets 0 0
Other minor fleets 497 497
TOTAL 43,225,059 36,681,712 6,543,347 0.073 478,244

See text for fleet abbreviations. 32
Table 5A, continued. Total catch (live lb), Vessel Trip Report landings (kept; live lb), estimated discards (live lb), associated coefficient of variation (CV), and standard error of the estimated discards (SE; live lb) for 14 fish and invertebrate species groups, by fleet, based on July 2015 through June 2016 data. Dark shading indicates fleets not considered or with no Northeast Fisheries Observer Program trips in the annual analysis. Light shading indicates that the variance of the discard estimate was not used in the annual sample size analysis. Blank CV indicates either no discards or discards equals 0. "P" indicates fleets with "pilot" designation.
Species Group: MONKFISH (Lophius americanus) Fleet Row Gear Type Access Trip Region Mesh Area Category Group Total Kept Discarded CV SE Pilot
1 Longline OPEN all MA all 876 7 869 1.825 1,586
2 Longline OPEN all NE all 191 191 0
3 Hand Line OPEN all MA all 207 207 0 P
4 Hand Line OPEN all NE all 4,464 4,464 0
5 Otter Trawl OPEN all MA sm 281,426 74,087 207,339 0.214 44,470
6 Otter Trawl OPEN all MA lg 668,015 291,658 376,357 0.201 75,522
7 Otter Trawl OPEN all NE sm 396,020 105,746 290,275 0.481 139,537
8 Otter Trawl OPEN all NE lg 8,498,620 7,389,963 1,108,657 0.108 119,594
9 Scallop Trawl AA GEN MA all 26,895 967 25,928 0.511 13,252
11 Scallop Trawl OPEN GEN MA all 2,812 390 2,422 0.408 989
12 Scallop Trawl OPEN LIM MA all 116 116 P
13 Otter Trawl, Twin OPEN all MA all 22,415 9,412 13,003 0.112 1,458 P
14 Otter Trawl, Twin OPEN all NE all 17,573 1,992 15,581 0.262 4,086 P
16 Otter Trawl, Ruhle OPEN all NE sm 6,365 0 6,365 0.000 0 P
17 Otter Trawl, Ruhle OPEN all NE lg 452 452 P
18 Otter Trawl, Haddock Separator OPEN all NE lg 66,164 63,750 2,414 0.316 763
19 Shrimp Trawl OPEN all MA all 17,482 498 16,984 0.000 0 P
20 Shrimp Trawl OPEN all NE all 616 616 P
22 Floating Trap OPEN all NE all 0 0 P
23 Sink, Anchor, Drift Gillnet OPEN all MA sm 1,901 1,901 0
24 Sink, Anchor, Drift Gillnet OPEN all MA lg 15,129 14,858 271 0.626 170
25 Sink, Anchor, Drift Gillnet OPEN all MA xlg 3,272,566 3,206,515 66,052 0.163 10,794
26 Sink, Anchor, Drift Gillnet OPEN all NE sm 15 15 P
27 Sink, Anchor, Drift Gillnet OPEN all NE lg 263,053 251,110 11,943 0.185 2,208
28 Sink, Anchor, Drift Gillnet OPEN all NE xlg 4,973,266 4,672,038 301,228 0.150 45,285
29 Purse Seine OPEN all MA all 0 0 P
30 Purse Seine OPEN all NE all 0 0 0

See text for fleet abbreviations. 33
Table 5A, continued. Total catch (live lb), Vessel Trip Report landings (kept; live lb), estimated discards (live lb), associated coefficient of variation (CV), and standard error of the estimated discards (SE; live lb) for 14 fish and invertebrate species groups, by fleet, based on July 2015 through June 2016 data. Dark shading indicates fleets not considered or with no Northeast Fisheries Observer Program trips in the annual analysis. Light shading indicates that the variance of the discard estimate was not used in the annual sample size analysis. Blank CV indicates either no discards or discards equals 0. "P" indicates fleets with "pilot" designation.
Species Group: MONKFISH (Lophius americanus) Fleet Row Gear Type Access Trip Region Mesh Area Category Group Total Kept Discarded CV SE Pilot
31 Scallop Dredge AA GEN MA all 82,163 9,986 72,177 0.124 8,984
32 Scallop Dredge AA GEN NE all 19,091 1,214 17,877 0.096 1,724
33 Scallop Dredge AA LIM MA all 332,331 13,839 318,491 0.116 36,890
34 Scallop Dredge AA LIM NE all 391,620 16,741 374,879 0.121 45,468
35 Scallop Dredge OPEN GEN MA all 195,874 71,476 124,397 0.170 21,104
36 Scallop Dredge OPEN GEN NE all 193,611 32,507 161,104 0.164 26,441
37 Scallop Dredge OPEN LIM MA all 935,547 90,063 845,484 0.099 83,364
38 Scallop Dredge OPEN LIM NE all 2,764,432 377,267 2,387,166 0.150 357,427
39 Danish Seine OPEN all MA all 0 0 P
40 Mid-water Paired & Single Trawl AA all NE all 0 0 0
42 Mid-water Paired & Single Trawl OPEN all NE all 0 0 0
43 Pots and Traps, Fish OPEN all MA all 18 18 0
44 Pots and Traps, Fish OPEN all NE all 16,600 16,600 0
45 Pots and Traps, Conch OPEN all MA all 0 0 0
46 Pots and Traps, Conch OPEN all NE all 0 0 0
47 Pots and Traps, Hagfish OPEN all NE all 0 0 P
48 Pots and Traps, Lobster OPEN all MA all 466 388 78 0.508 40
49 Pots and Traps, Lobster OPEN all NE all 1,443 283 1,160 0.353 409
50 Pots and Traps, Crab OPEN all MA all 0 0 P
51 Pots and Traps, Crab OPEN all NE all 0 0 P
52 Beam Trawl OPEN all MA all 1,111 1,111 P
53 Beam Trawl OPEN all NE all 0 0 P
54 Dredge, Other OPEN all MA all 0 0 P
55 Ocean Quahog/Surfclam Dredge OPEN all MA all 125,219 4,550 120,669 0.401 48,403
56 Ocean Quahog/Surfclam Dredge OPEN all NE all 52,003 3,332 48,671 0.370 17,993
Confidential fleets 246 246
Other minor fleets 4,565 4,565
TOTAL 23,652,980 16,735,138 6,917,842 0.062 431,106

See text for fleet abbreviations. 34
Table 5A, continued. Total catch (live lb), Vessel Trip Report landings (kept; live lb), estimated discards (live lb), associated coefficient of variation (CV), and standard error of the estimated discards (SE; live lb) for 14 fish and invertebrate species groups, by fleet, based on July 2015 through June 2016 data. Dark shading indicates fleets not considered or with no Northeast Fisheries Observer Program trips in the annual analysis. Light shading indicates that the variance of the discard estimate was not used in the annual sample size analysis. Blank CV indicates either no discards or discards equals 0. "P" indicates fleets with "pilot" designation.
Species Group: RED DEEPSEA CRAB (Chaceon quinquedens) Fleet Row Gear Type Access Trip Region Mesh Area Category Group Total Kept Discarded CV SE Pilot
1 Longline OPEN all MA all 0 0 0
2 Longline OPEN all NE all 0 0 0
3 Hand Line OPEN all MA all 0 0 0 P
4 Hand Line OPEN all NE all 0 0 0
5 Otter Trawl OPEN all MA sm 14,408 0 14,408 0.520 7,488
6 Otter Trawl OPEN all MA lg 5,694 0 5,694 1.169 6,656
7 Otter Trawl OPEN all NE sm 0 0 0
8 Otter Trawl OPEN all NE lg 77,154 0 77,154 0.530 40,923
9 Scallop Trawl AA GEN MA all 0 0 0
11 Scallop Trawl OPEN GEN MA all 0 0 0
12 Scallop Trawl OPEN LIM MA all 0 0 P
13 Otter Trawl, Twin OPEN all MA all 0 0 0 P
14 Otter Trawl, Twin OPEN all NE all 0 0 0 P
16 Otter Trawl, Ruhle OPEN all NE sm 0 0 0 P
17 Otter Trawl, Ruhle OPEN all NE lg 0 0 P
18 Otter Trawl, Haddock Separator OPEN all NE lg 0 0 0
19 Shrimp Trawl OPEN all MA all 82,181 0 82,181 0.000 0 P
20 Shrimp Trawl OPEN all NE all 0 0 P
22 Floating Trap OPEN all NE all 0 0 P
23 Sink, Anchor, Drift Gillnet OPEN all MA sm 0 0 0
24 Sink, Anchor, Drift Gillnet OPEN all MA lg 0 0 0
25 Sink, Anchor, Drift Gillnet OPEN all MA xlg 0 0 0
26 Sink, Anchor, Drift Gillnet OPEN all NE sm 0 0 P
27 Sink, Anchor, Drift Gillnet OPEN all NE lg 61 0 61 0.377 23
28 Sink, Anchor, Drift Gillnet OPEN all NE xlg 0 0 0
29 Purse Seine OPEN all MA all 0 0 P
30 Purse Seine OPEN all NE all 0 0 0
See text for fleet abbreviations. 35
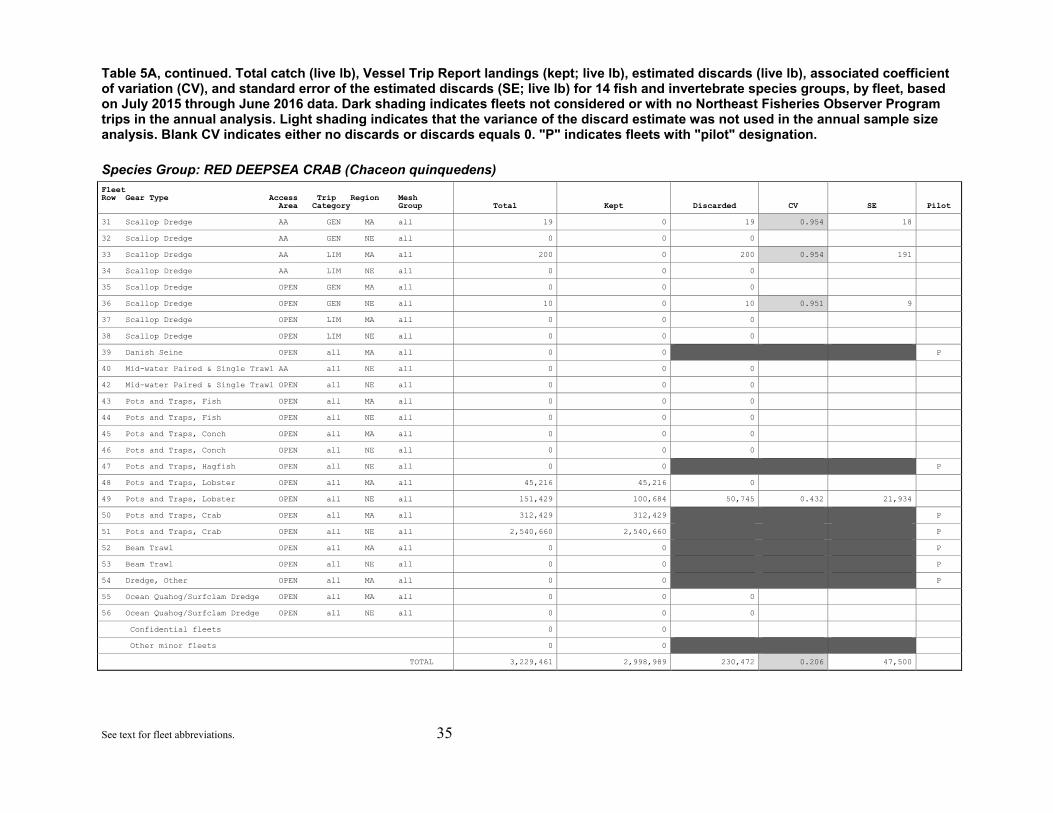
Table 5A, continued. Total catch (live lb), Vessel Trip Report landings (kept; live lb), estimated discards (live lb), associated coefficient of variation (CV), and standard error of the estimated discards (SE; live lb) for 14 fish and invertebrate species groups, by fleet, based on July 2015 through June 2016 data. Dark shading indicates fleets not considered or with no Northeast Fisheries Observer Program trips in the annual analysis. Light shading indicates that the variance of the discard estimate was not used in the annual sample size analysis. Blank CV indicates either no discards or discards equals 0. "P" indicates fleets with "pilot" designation.
Species Group: RED DEEPSEA CRAB (Chaceon quinquedens) Fleet Row Gear Type Access Trip Region Mesh Area Category Group Total Kept Discarded CV SE Pilot
31 Scallop Dredge AA GEN MA all 19 0 19 0.954 18
32 Scallop Dredge AA GEN NE all 0 0 0
33 Scallop Dredge AA LIM MA all 200 0 200 0.954 191
34 Scallop Dredge AA LIM NE all 0 0 0
35 Scallop Dredge OPEN GEN MA all 0 0 0
36 Scallop Dredge OPEN GEN NE all 10 0 10 0.951 9
37 Scallop Dredge OPEN LIM MA all 0 0 0
38 Scallop Dredge OPEN LIM NE all 0 0 0
39 Danish Seine OPEN all MA all 0 0 P
40 Mid-water Paired & Single Trawl AA all NE all 0 0 0
42 Mid-water Paired & Single Trawl OPEN all NE all 0 0 0
43 Pots and Traps, Fish OPEN all MA all 0 0 0
44 Pots and Traps, Fish OPEN all NE all 0 0 0
45 Pots and Traps, Conch OPEN all MA all 0 0 0
46 Pots and Traps, Conch OPEN all NE all 0 0 0
47 Pots and Traps, Hagfish OPEN all NE all 0 0 P
48 Pots and Traps, Lobster OPEN all MA all 45,216 45,216 0
49 Pots and Traps, Lobster OPEN all NE all 151,429 100,684 50,745 0.432 21,934
50 Pots and Traps, Crab OPEN all MA all 312,429 312,429 P
51 Pots and Traps, Crab OPEN all NE all 2,540,660 2,540,660 P
52 Beam Trawl OPEN all MA all 0 0 P
53 Beam Trawl OPEN all NE all 0 0 P
54 Dredge, Other OPEN all MA all 0 0 P
55 Ocean Quahog/Surfclam Dredge OPEN all MA all 0 0 0
56 Ocean Quahog/Surfclam Dredge OPEN all NE all 0 0 0
Confidential fleets 0 0
Other minor fleets 0 0
TOTAL 3,229,461 2,998,989 230,472 0.206 47,500

See text for fleet abbreviations. 36
Table 5A, continued. Total catch (live lb), Vessel Trip Report landings (kept; live lb), estimated discards (live lb), associated coefficient of variation (CV), and standard error of the estimated discards (SE; live lb) for 14 fish and invertebrate species groups, by fleet, based on July 2015 through June 2016 data. Dark shading indicates fleets not considered or with no Northeast Fisheries Observer Program trips in the annual analysis. Light shading indicates that the variance of the discard estimate was not used in the annual sample size analysis. Blank CV indicates either no discards or discards equals 0. "P" indicates fleets with "pilot" designation.
Species Group: SEA SCALLOP (Placopecten magellanicus) Fleet Row Gear Type Access Trip Region Mesh Area Category Group Total Kept Discarded CV SE Pilot
1 Longline OPEN all MA all 0 0 0
2 Longline OPEN all NE all 175 0 175 0.897 157
3 Hand Line OPEN all MA all 0 0 0 P
4 Hand Line OPEN all NE all 17 0 17 6.030 103
5 Otter Trawl OPEN all MA sm 246,649 10,379 236,270 0.248 58,697
6 Otter Trawl OPEN all MA lg 1,474,927 1,168,391 306,536 0.403 123,413
7 Otter Trawl OPEN all NE sm 17,658 2,816 14,843 0.470 6,970
8 Otter Trawl OPEN all NE lg 100,461 61,079 39,382 0.309 12,186
9 Scallop Trawl AA GEN MA all 1,114,212 767,718 346,494 0.287 99,513
11 Scallop Trawl OPEN GEN MA all 57,455 49,522 7,933 0.589 4,673
12 Scallop Trawl OPEN LIM MA all 12,079 12,079 P
13 Otter Trawl, Twin OPEN all MA all 267,276 267,276 0 P
14 Otter Trawl, Twin OPEN all NE all 22 0 22 0.671 15 P
16 Otter Trawl, Ruhle OPEN all NE sm 0 0 0 P
17 Otter Trawl, Ruhle OPEN all NE lg 0 0 P
18 Otter Trawl, Haddock Separator OPEN all NE lg 3,216 2,249 967 1.177 1,138
19 Shrimp Trawl OPEN all MA all 0 0 0 P
20 Shrimp Trawl OPEN all NE all 125 125 P
22 Floating Trap OPEN all NE all 0 0 P
23 Sink, Anchor, Drift Gillnet OPEN all MA sm 0 0 0
24 Sink, Anchor, Drift Gillnet OPEN all MA lg 1 0 1 1.083 1
25 Sink, Anchor, Drift Gillnet OPEN all MA xlg 1,806 0 1,806 0.366 661
26 Sink, Anchor, Drift Gillnet OPEN all NE sm 0 0 P
27 Sink, Anchor, Drift Gillnet OPEN all NE lg 80 0 80 0.560 45
28 Sink, Anchor, Drift Gillnet OPEN all NE xlg 1,175 325 850 0.491 418
29 Purse Seine OPEN all MA all 0 0 P
30 Purse Seine OPEN all NE all 0 0 0

See text for fleet abbreviations. 37
Table 5A, continued. Total catch (live lb), Vessel Trip Report landings (kept; live lb), estimated discards (live lb), associated coefficient of variation (CV), and standard error of the estimated discards (SE; live lb) for 14 fish and invertebrate species groups, by fleet, based on July 2015 through June 2016 data. Dark shading indicates fleets not considered or with no Northeast Fisheries Observer Program trips in the annual analysis. Light shading indicates that the variance of the discard estimate was not used in the annual sample size analysis. Blank CV indicates either no discards or discards equals 0. "P" indicates fleets with "pilot" designation.
Species Group: SEA SCALLOP (Placopecten magellanicus) Fleet Row Gear Type Access Trip Region Mesh Area Category Group Total Kept Discarded CV SE Pilot
31 Scallop Dredge AA GEN MA all 12,867,107 10,937,191 1,929,916 0.159 307,229
32 Scallop Dredge AA GEN NE all 2,532,559 2,403,620 128,939 0.186 24,022
33 Scallop Dredge AA LIM MA all 62,552,248 56,520,745 6,031,504 0.161 970,559
34 Scallop Dredge AA LIM NE all 78,857,596 72,374,888 6,482,707 0.147 955,342
35 Scallop Dredge OPEN GEN MA all 7,128,166 6,710,270 417,896 0.278 116,220
36 Scallop Dredge OPEN GEN NE all 6,980,013 6,689,441 290,572 0.265 77,009
37 Scallop Dredge OPEN LIM MA all 41,791,160 39,428,190 2,362,970 0.227 536,355
38 Scallop Dredge OPEN LIM NE all 106,422,154 102,800,955 3,621,199 0.186 674,006
39 Danish Seine OPEN all MA all 0 0 P
40 Mid-water Paired & Single Trawl AA all NE all 0 0 0
42 Mid-water Paired & Single Trawl OPEN all NE all 0 0 0
43 Pots and Traps, Fish OPEN all MA all 0 0 0
44 Pots and Traps, Fish OPEN all NE all 0 0 0
45 Pots and Traps, Conch OPEN all MA all 0 0 0
46 Pots and Traps, Conch OPEN all NE all 0 0 0
47 Pots and Traps, Hagfish OPEN all NE all 0 0 P
48 Pots and Traps, Lobster OPEN all MA all 0 0 0
49 Pots and Traps, Lobster OPEN all NE all 10,088 10,088 0
50 Pots and Traps, Crab OPEN all MA all 0 0 P
51 Pots and Traps, Crab OPEN all NE all 0 0 P
52 Beam Trawl OPEN all MA all 46,831 46,831 P
53 Beam Trawl OPEN all NE all 13,403 13,403 P
54 Dredge, Other OPEN all MA all 0 0 P
55 Ocean Quahog/Surfclam Dredge OPEN all MA all 951,818 600,918 350,900 0.408 143,074
56 Ocean Quahog/Surfclam Dredge OPEN all NE all 1,289,872 1,148,457 141,415 0.833 117,789
Confidential fleets 0 0
Other minor fleets 261,461 261,461
TOTAL 325,001,810 302,288,416 22,713,394 0.073 1,665,585

See text for fleet abbreviations. 38
Table 5A, continued. Total catch (live lb), Vessel Trip Report landings (kept; live lb), estimated discards (live lb), associated coefficient of variation (CV), and standard error of the estimated discards (SE; live lb) for 14 fish and invertebrate species groups, by fleet, based on July 2015 through June 2016 data. Dark shading indicates fleets not considered or with no Northeast Fisheries Observer Program trips in the annual analysis. Light shading indicates that the variance of the discard estimate was not used in the annual sample size analysis. Blank CV indicates either no discards or discards equals 0. "P" indicates fleets with "pilot" designation.
Species Group: SKATE COMPLEX (Rajidae) Fleet Row Gear Type Access Trip Region Mesh Area Category Group Total Kept Discarded CV SE Pilot
1 Longline OPEN all MA all 193,639 812 192,827 0.347 66,929
2 Longline OPEN all NE all 118,119 6,214 111,905 0.319 35,738
3 Hand Line OPEN all MA all 5 5 0 P
4 Hand Line OPEN all NE all 5,781 5,781 0
5 Otter Trawl OPEN all MA sm 10,003,717 555,776 9,447,941 0.137 1,298,618
6 Otter Trawl OPEN all MA lg 23,963,989 4,939,143 19,024,846 0.132 2,509,527
7 Otter Trawl OPEN all NE sm 2,044,588 280,829 1,763,759 0.212 374,399
8 Otter Trawl OPEN all NE lg 39,171,423 9,504,113 29,667,310 0.113 3,351,659
9 Scallop Trawl AA GEN MA all 488,169 700 487,469 0.510 248,697
11 Scallop Trawl OPEN GEN MA all 98,369 23,634 74,735 0.484 36,145
12 Scallop Trawl OPEN LIM MA all 0 0 P
13 Otter Trawl, Twin OPEN all MA all 185,373 35,227 150,147 1.170 175,736 P
14 Otter Trawl, Twin OPEN all NE all 17,135 0 17,135 0.290 4,967 P
16 Otter Trawl, Ruhle OPEN all NE sm 0 0 0 P
17 Otter Trawl, Ruhle OPEN all NE lg 0 0 P
18 Otter Trawl, Haddock Separator OPEN all NE lg 471,879 69,447 402,432 0.216 86,909
19 Shrimp Trawl OPEN all MA all 82 0 82 0.000 0 P
20 Shrimp Trawl OPEN all NE all 0 0 P
22 Floating Trap OPEN all NE all 0 0 P
23 Sink, Anchor, Drift Gillnet OPEN all MA sm 2,663 827 1,835 0.217 398
24 Sink, Anchor, Drift Gillnet OPEN all MA lg 143,914 80,854 63,060 0.132 8,317
25 Sink, Anchor, Drift Gillnet OPEN all MA xlg 3,407,228 2,326,527 1,080,702 0.124 133,670
26 Sink, Anchor, Drift Gillnet OPEN all NE sm 0 0 P
27 Sink, Anchor, Drift Gillnet OPEN all NE lg 456,646 294,596 162,050 0.127 20,624
28 Sink, Anchor, Drift Gillnet OPEN all NE xlg 15,050,413 12,866,745 2,183,668 0.168 367,293
29 Purse Seine OPEN all MA all 0 0 P
30 Purse Seine OPEN all NE all 0 0 0

See text for fleet abbreviations. 39
Table 5A, continued. Total catch (live lb), Vessel Trip Report landings (kept; live lb), estimated discards (live lb), associated coefficient of variation (CV), and standard error of the estimated discards (SE; live lb) for 14 fish and invertebrate species groups, by fleet, based on July 2015 through June 2016 data. Dark shading indicates fleets not considered or with no Northeast Fisheries Observer Program trips in the annual analysis. Light shading indicates that the variance of the discard estimate was not used in the annual sample size analysis. Blank CV indicates either no discards or discards equals 0. "P" indicates fleets with "pilot" designation.
Species Group: SKATE COMPLEX (Rajidae) Fleet Row Gear Type Access Trip Region Mesh Area Category Group Total Kept Discarded CV SE Pilot
31 Scallop Dredge AA GEN MA all 259,216 196 259,020 0.143 36,992
32 Scallop Dredge AA GEN NE all 35,923 1 35,922 0.198 7,125
33 Scallop Dredge AA LIM MA all 929,027 68 928,959 0.145 134,584
34 Scallop Dredge AA LIM NE all 1,218,752 0 1,218,752 0.108 131,161
35 Scallop Dredge OPEN GEN MA all 1,957,590 29,090 1,928,500 0.090 173,438
36 Scallop Dredge OPEN GEN NE all 903,844 41 903,803 0.197 177,830
37 Scallop Dredge OPEN LIM MA all 4,287,529 2,004 4,285,525 0.085 365,241
38 Scallop Dredge OPEN LIM NE all 8,921,993 3,030 8,918,963 0.103 922,912
39 Danish Seine OPEN all MA all 2,200 2,200 P
40 Mid-water Paired & Single Trawl AA all NE all 0 0 0
42 Mid-water Paired & Single Trawl OPEN all NE all 0 0 0
43 Pots and Traps, Fish OPEN all MA all 9 9 0
44 Pots and Traps, Fish OPEN all NE all 0 0 0
45 Pots and Traps, Conch OPEN all MA all 0 0 0
46 Pots and Traps, Conch OPEN all NE all 0 0 0
47 Pots and Traps, Hagfish OPEN all NE all 0 0 P
48 Pots and Traps, Lobster OPEN all MA all 192 46 146 0.552 81
49 Pots and Traps, Lobster OPEN all NE all 1,397 0 1,397 0.606 847
50 Pots and Traps, Crab OPEN all MA all 0 0 P
51 Pots and Traps, Crab OPEN all NE all 0 0 P
52 Beam Trawl OPEN all MA all 39,199 39,199 P
53 Beam Trawl OPEN all NE all 0 0 P
54 Dredge, Other OPEN all MA all 0 0 P
55 Ocean Quahog/Surfclam Dredge OPEN all MA all 579,024 0 579,024 0.200 115,749
56 Ocean Quahog/Surfclam Dredge OPEN all NE all 902,751 0 902,751 0.272 245,322
Confidential fleets 1,876 1,876
Other minor fleets 0 0
TOTAL 115,863,655 31,068,989 84,794,666 0.054 4,558,043

See text for fleet abbreviations. 40
Table 5A, continued. Total catch (live lb), Vessel Trip Report landings (kept; live lb), estimated discards (live lb), associated coefficient of variation (CV), and standard error of the estimated discards (SE; live lb) for 14 fish and invertebrate species groups, by fleet, based on July 2015 through June 2016 data. Dark shading indicates fleets not considered or with no Northeast Fisheries Observer Program trips in the annual analysis. Light shading indicates that the variance of the discard estimate was not used in the annual sample size analysis. Blank CV indicates either no discards or discards equals 0. "P" indicates fleets with "pilot" designation.
Species Group: SMALL MESH GROUNDFISH
Fleet Row Gear Type Access Trip Region Mesh Area Category Group Total Kept Discarded CV SE Pilot
1 Longline OPEN all MA all 940 283 657 0.605 397
2 Longline OPEN all NE all 284 4 280 0.897 252
3 Hand Line OPEN all MA all 809 809 0 P
4 Hand Line OPEN all NE all 1,657 1,544 113 6.030 684
5 Otter Trawl OPEN all MA sm 3,047,318 2,741,810 305,508 0.337 102,928
6 Otter Trawl OPEN all MA lg 141,037 76,456 64,581 0.316 20,407
7 Otter Trawl OPEN all NE sm 12,071,053 9,844,990 2,226,063 0.230 510,992
8 Otter Trawl OPEN all NE lg 1,328,908 567,955 760,953 0.151 114,628
9 Scallop Trawl AA GEN MA all 154 0 154 0.663 102
11 Scallop Trawl OPEN GEN MA all 282 0 282 0.835 236
12 Scallop Trawl OPEN LIM MA all 0 0 P
13 Otter Trawl, Twin OPEN all MA all 3,527 545 2,982 0.112 334 P
14 Otter Trawl, Twin OPEN all NE all 34,068 3,520 30,548 0.257 7,853 P
16 Otter Trawl, Ruhle OPEN all NE sm 12,620 0 12,620 0.000 0 P
17 Otter Trawl, Ruhle OPEN all NE lg 65 65 P
18 Otter Trawl, Haddock Separator OPEN all NE lg 26,821 3,208 23,613 0.345 8,140
19 Shrimp Trawl OPEN all MA all 39,445 820 38,625 0.000 0 P
20 Shrimp Trawl OPEN all NE all 20,485 20,485 P
22 Floating Trap OPEN all NE all 0 0 P
23 Sink, Anchor, Drift Gillnet OPEN all MA sm 126 126 0
24 Sink, Anchor, Drift Gillnet OPEN all MA lg 323 323 0
25 Sink, Anchor, Drift Gillnet OPEN all MA xlg 191 41 150 0.658 99
26 Sink, Anchor, Drift Gillnet OPEN all NE sm 400 400 P
27 Sink, Anchor, Drift Gillnet OPEN all NE lg 105,267 87,751 17,516 0.169 2,952
28 Sink, Anchor, Drift Gillnet OPEN all NE xlg 17,428 11,942 5,486 0.195 1,068
29 Purse Seine OPEN all MA all 0 0 P
30 Purse Seine OPEN all NE all 0 0 0

See text for fleet abbreviations. 41
Table 5A, continued. Total catch (live lb), Vessel Trip Report landings (kept; live lb), estimated discards (live lb), associated coefficient of variation (CV), and standard error of the estimated discards (SE; live lb) for 14 fish and invertebrate species groups, by fleet, based on July 2015 through June 2016 data. Dark shading indicates fleets not considered or with no Northeast Fisheries Observer Program trips in the annual analysis. Light shading indicates that the variance of the discard estimate was not used in the annual sample size analysis. Blank CV indicates either no discards or discards equals 0. "P" indicates fleets with "pilot" designation.
Species Group: SMALL MESH GROUNDFISH
Fleet Row Gear Type Access Trip Region Mesh Area Category Group Total Kept Discarded CV SE Pilot
31 Scallop Dredge AA GEN MA all 2,075 0 2,075 0.326 675
32 Scallop Dredge AA GEN NE all 765 0 765 0.206 158
33 Scallop Dredge AA LIM MA all 4,970 0 4,970 0.225 1,119
34 Scallop Dredge AA LIM NE all 3,240 0 3,240 0.201 653
35 Scallop Dredge OPEN GEN MA all 6,550 3 6,547 0.791 5,180
36 Scallop Dredge OPEN GEN NE all 9,149 0 9,149 0.333 3,050
37 Scallop Dredge OPEN LIM MA all 20,855 0 20,855 0.318 6,635
38 Scallop Dredge OPEN LIM NE all 160,091 0 160,091 0.205 32,855
39 Danish Seine OPEN all MA all 0 0 P
40 Mid-water Paired & Single Trawl AA all NE all 0 0 0
42 Mid-water Paired & Single Trawl OPEN all NE all 450 450 0
43 Pots and Traps, Fish OPEN all MA all 1,052 1,052 0
44 Pots and Traps, Fish OPEN all NE all 41 41 0
45 Pots and Traps, Conch OPEN all MA all 0 0 0
46 Pots and Traps, Conch OPEN all NE all 0 0 0
47 Pots and Traps, Hagfish OPEN all NE all 0 0 P
48 Pots and Traps, Lobster OPEN all MA all 12,215 9,127 3,088 2.376 7,337
49 Pots and Traps, Lobster OPEN all NE all 115,876 12,264 103,612 0.910 94,290
50 Pots and Traps, Crab OPEN all MA all 0 0 P
51 Pots and Traps, Crab OPEN all NE all 0 0 P
52 Beam Trawl OPEN all MA all 0 0 P
53 Beam Trawl OPEN all NE all 145 145 P
54 Dredge, Other OPEN all MA all 0 0 P
55 Ocean Quahog/Surfclam Dredge OPEN all MA all 230 0 230 0.999 230
56 Ocean Quahog/Surfclam Dredge OPEN all NE all 445 0 445 0.702 312
Confidential fleets 0 0
Other minor fleets 204,366 204,366
TOTAL 17,395,723 13,590,525 3,805,198 0.143 543,607

See text for fleet abbreviations. 42
Table 5A, continued. Total catch (live lb), Vessel Trip Report landings (kept; live lb), estimated discards (live lb), associated coefficient of variation (CV), and standard error of the estimated discards (SE; live lb) for 14 fish and invertebrate species groups, by fleet, based on July 2015 through June 2016 data. Dark shading indicates fleets not considered or with no Northeast Fisheries Observer Program trips in the annual analysis. Light shading indicates that the variance of the discard estimate was not used in the annual sample size analysis. Blank CV indicates either no discards or discards equals 0. "P" indicates fleets with "pilot" designation.
Species Group: SPINY DOGFISH (Squalus acanthias) Fleet Row Gear Type Access Trip Region Mesh Area Category Group Total Kept Discarded CV SE Pilot
1 Longline OPEN all MA all 251,600 208,627 42,973 0.497 21,353
2 Longline OPEN all NE all 3,686,535 3,168,519 518,016 0.531 274,945
3 Hand Line OPEN all MA all 30 30 0 P
4 Hand Line OPEN all NE all 553,622 549,299 4,323 2.944 12,728
5 Otter Trawl OPEN all MA sm 2,563,013 304,160 2,258,853 0.180 406,481
6 Otter Trawl OPEN all MA lg 1,821,436 195,156 1,626,280 0.191 311,109
7 Otter Trawl OPEN all NE sm 1,581,435 216,820 1,364,615 0.218 296,885
8 Otter Trawl OPEN all NE lg 3,912,473 376,446 3,536,027 0.106 373,871
9 Scallop Trawl AA GEN MA all 277,811 0 277,811 0.666 185,100
11 Scallop Trawl OPEN GEN MA all 2,804 0 2,804 0.724 2,030
12 Scallop Trawl OPEN LIM MA all 0 0 P
13 Otter Trawl, Twin OPEN all MA all 2,688 0 2,688 0.112 301 P
14 Otter Trawl, Twin OPEN all NE all 3,035 0 3,035 0.255 774 P
16 Otter Trawl, Ruhle OPEN all NE sm 0 0 0 P
17 Otter Trawl, Ruhle OPEN all NE lg 125 125 P
18 Otter Trawl, Haddock Separator OPEN all NE lg 109,739 2,680 107,059 0.532 56,929
19 Shrimp Trawl OPEN all MA all 5,205 0 5,205 0.000 0 P
20 Shrimp Trawl OPEN all NE all 0 0 P
22 Floating Trap OPEN all NE all 0 0 P
23 Sink, Anchor, Drift Gillnet OPEN all MA sm 2,138,630 2,018,185 120,445 0.441 53,068
24 Sink, Anchor, Drift Gillnet OPEN all MA lg 5,529,753 5,257,224 272,529 0.200 54,415
25 Sink, Anchor, Drift Gillnet OPEN all MA xlg 122,989 53,686 69,303 0.138 9,552
26 Sink, Anchor, Drift Gillnet OPEN all NE sm 0 0 P
27 Sink, Anchor, Drift Gillnet OPEN all NE lg 6,020,426 3,865,328 2,155,098 0.166 358,717
28 Sink, Anchor, Drift Gillnet OPEN all NE xlg 1,332,421 1,170,983 161,438 0.273 44,009
29 Purse Seine OPEN all MA all 0 0 P
30 Purse Seine OPEN all NE all 0 0 0

See text for fleet abbreviations. 43
Table 5A, continued. Total catch (live lb), Vessel Trip Report landings (kept; live lb), estimated discards (live lb), associated coefficient of variation (CV), and standard error of the estimated discards (SE; live lb) for 14 fish and invertebrate species groups, by fleet, based on July 2015 through June 2016 data. Dark shading indicates fleets not considered or with no Northeast Fisheries Observer Program trips in the annual analysis. Light shading indicates that the variance of the discard estimate was not used in the annual sample size analysis. Blank CV indicates either no discards or discards equals 0. "P" indicates fleets with "pilot" designation.
Species Group: SPINY DOGFISH (Squalus acanthias) Fleet Row Gear Type Access Trip Region Mesh Area Category Group Total Kept Discarded CV SE Pilot
31 Scallop Dredge AA GEN MA all 9,211 0 9,211 0.382 3,519
32 Scallop Dredge AA GEN NE all 95 0 95 0.571 54
33 Scallop Dredge AA LIM MA all 57,577 0 57,577 0.476 27,403
34 Scallop Dredge AA LIM NE all 26,303 0 26,303 0.270 7,097
35 Scallop Dredge OPEN GEN MA all 13,407 0 13,407 0.257 3,449
36 Scallop Dredge OPEN GEN NE all 3,790 0 3,790 0.503 1,905
37 Scallop Dredge OPEN LIM MA all 38,168 0 38,168 0.231 8,806
38 Scallop Dredge OPEN LIM NE all 51,389 0 51,389 0.207 10,620
39 Danish Seine OPEN all MA all 0 0 P
40 Mid-water Paired & Single Trawl AA all NE all 1,932 0 1,932 0.244 472
42 Mid-water Paired & Single Trawl OPEN all NE all 1,300 1,300 0
43 Pots and Traps, Fish OPEN all MA all 9 9 0
44 Pots and Traps, Fish OPEN all NE all 0 0 0
45 Pots and Traps, Conch OPEN all MA all 2,500 2,500 0
46 Pots and Traps, Conch OPEN all NE all 0 0 0
47 Pots and Traps, Hagfish OPEN all NE all 0 0 P
48 Pots and Traps, Lobster OPEN all MA all 1,447 0 1,447 1.317 1,907
49 Pots and Traps, Lobster OPEN all NE all 2,978 10 2,968 0.313 929
50 Pots and Traps, Crab OPEN all MA all 0 0 P
51 Pots and Traps, Crab OPEN all NE all 0 0 P
52 Beam Trawl OPEN all MA all 400 400 P
53 Beam Trawl OPEN all NE all 0 0 P
54 Dredge, Other OPEN all MA all 0 0 P
55 Ocean Quahog/Surfclam Dredge OPEN all MA all 80,067 0 80,067 0.448 35,848
56 Ocean Quahog/Surfclam Dredge OPEN all NE all 33,550 0 33,550 0.515 17,287
Confidential fleets 0 0
Other minor fleets 0 0
TOTAL 30,239,893 17,391,487 12,848,406 0.067 861,828

See text for fleet abbreviations. 44
Table 5A, continued. Total catch (live lb), Vessel Trip Report landings (kept; live lb), estimated discards (live lb), associated coefficient of variation (CV), and standard error of the estimated discards (SE; live lb) for 14 fish and invertebrate species groups, by fleet, based on July 2015 through June 2016 data. Dark shading indicates fleets not considered or with no Northeast Fisheries Observer Program trips in the annual analysis. Light shading indicates that the variance of the discard estimate was not used in the annual sample size analysis. Blank CV indicates either no discards or discards equals 0. "P" indicates fleets with "pilot" designation.
Species Group: SQUID (Doryteuthis [Amerigo] pealeii, Illex illecebrosus)- BUTTERFISH (Peprilus triacanthus) - MACKEREL (Scomber scombrus) Fleet Row Gear Type Access Trip Region Mesh Area Category Group Total Kept Discarded CV SE Pilot
1 Longline OPEN all MA all 0 0 0
2 Longline OPEN all NE all 5,000 5,000 0
3 Hand Line OPEN all MA all 1,303 1,303 0 P
4 Hand Line OPEN all NE all 1,622,112 1,622,112 0
5 Otter Trawl OPEN all MA sm 15,743,387 12,668,110 3,075,277 0.277 851,561
6 Otter Trawl OPEN all MA lg 792,854 719,321 73,533 0.330 24,300
7 Otter Trawl OPEN all NE sm 35,184,477 32,734,866 2,449,611 0.182 445,316
8 Otter Trawl OPEN all NE lg 597,803 538,902 58,901 0.187 11,020
9 Scallop Trawl AA GEN MA all 538 0 538 0.752 405
11 Scallop Trawl OPEN GEN MA all 56 8 48 1.124 54
12 Scallop Trawl OPEN LIM MA all 31,520 31,520 P
13 Otter Trawl, Twin OPEN all MA all 1,808,765 1,710,266 98,499 0.110 10,860 P
14 Otter Trawl, Twin OPEN all NE all 1,071,580 913,223 158,357 0.140 22,227 P
16 Otter Trawl, Ruhle OPEN all NE sm 54,108 5,000 49,108 0.000 0 P
17 Otter Trawl, Ruhle OPEN all NE lg 1 1 P
18 Otter Trawl, Haddock Separator OPEN all NE lg 406 5 401 0.295 118
19 Shrimp Trawl OPEN all MA all 77,004 23,038 53,966 0.000 0 P
20 Shrimp Trawl OPEN all NE all 152,247 152,247 P
22 Floating Trap OPEN all NE all 2,150 2,150 P
23 Sink, Anchor, Drift Gillnet OPEN all MA sm 6,122 4,036 2,086 0.772 1,611
24 Sink, Anchor, Drift Gillnet OPEN all MA lg 2,606 2,503 103 0.362 37
25 Sink, Anchor, Drift Gillnet OPEN all MA xlg 258 153 105 0.320 34
26 Sink, Anchor, Drift Gillnet OPEN all NE sm 0 0 P
27 Sink, Anchor, Drift Gillnet OPEN all NE lg 6,732 5,811 921 0.435 400
28 Sink, Anchor, Drift Gillnet OPEN all NE xlg 1,777 1,658 119 0.476 56
29 Purse Seine OPEN all MA all 0 0 P
30 Purse Seine OPEN all NE all 36 0 36 0.668 24

See text for fleet abbreviations. 45
Table 5A, continued. Total catch (live lb), Vessel Trip Report landings (kept; live lb), estimated discards (live lb), associated coefficient of variation (CV), and standard error of the estimated discards (SE; live lb) for 14 fish and invertebrate species groups, by fleet, based on July 2015 through June 2016 data. Dark shading indicates fleets not considered or with no Northeast Fisheries Observer Program trips in the annual analysis. Light shading indicates that the variance of the discard estimate was not used in the annual sample size analysis. Blank CV indicates either no discards or discards equals 0. "P" indicates fleets with "pilot" designation.
Species Group: SQUID (Doryteuthis [Amerigo] pealeii, Illex illecebrosus)- BUTTERFISH (Peprilus triacanthus) - MACKEREL (Scomber scombrus) Fleet Row Gear Type Access Trip Region Mesh Area Category Group Total Kept Discarded CV SE Pilot
31 Scallop Dredge AA GEN MA all 279 0 279 0.247 69
32 Scallop Dredge AA GEN NE all 13 0 13 0.761 10
33 Scallop Dredge AA LIM MA all 3,410 7 3,403 0.237 807
34 Scallop Dredge AA LIM NE all 3,138 0 3,138 0.278 872
35 Scallop Dredge OPEN GEN MA all 1,041 86 955 0.417 398
36 Scallop Dredge OPEN GEN NE all 265 0 265 0.602 159
37 Scallop Dredge OPEN LIM MA all 1,906 24 1,882 0.297 558
38 Scallop Dredge OPEN LIM NE all 2,064 0 2,064 0.246 507
39 Danish Seine OPEN all MA all 0 0 P
40 Mid-water Paired & Single Trawl AA all NE all 12 11 1 0.244 <1
42 Mid-water Paired & Single Trawl OPEN all NE all 6,005,595 6,005,507 88 0.301 26
43 Pots and Traps, Fish OPEN all MA all 9 9 0
44 Pots and Traps, Fish OPEN all NE all 0 0 0
45 Pots and Traps, Conch OPEN all MA all 0 0 0
46 Pots and Traps, Conch OPEN all NE all 0 0 0
47 Pots and Traps, Hagfish OPEN all NE all 0 0 P
48 Pots and Traps, Lobster OPEN all MA all 0 0 0
49 Pots and Traps, Lobster OPEN all NE all 989 959 30 0.774 23
50 Pots and Traps, Crab OPEN all MA all 0 0 P
51 Pots and Traps, Crab OPEN all NE all 0 0 P
52 Beam Trawl OPEN all MA all 37,570 37,570 P
53 Beam Trawl OPEN all NE all 3,863 3,863 P
54 Dredge, Other OPEN all MA all 0 0 P
55 Ocean Quahog/Surfclam Dredge OPEN all MA all 217 0 217 1.028 223
56 Ocean Quahog/Surfclam Dredge OPEN all NE all 0 0 0
Confidential fleets 213,863 213,863
Other minor fleets 537,087 537,087
TOTAL 63,974,159 57,940,219 6,033,940 0.159 961,661

See text for fleet abbreviations. 46
Table 5A, continued. Total catch (live lb), Vessel Trip Report landings (kept; live lb), estimated discards (live lb), associated coefficient of variation (CV), and standard error of the estimated discards (SE; live lb) for 14 fish and invertebrate species groups, by fleet, based on July 2015 through June 2016 data. Dark shading indicates fleets not considered or with no Northeast Fisheries Observer Program trips in the annual analysis. Light shading indicates that the variance of the discard estimate was not used in the annual sample size analysis. Blank CV indicates either no discards or discards equals 0. "P" indicates fleets with "pilot" designation.
Species Group: SURFCLAM (Spisula solidissima) - OCEAN QUAHOG (Arctica islandica) Fleet Row Gear Type Access Trip Region Mesh Area Category Group Total Kept Discarded CV SE Pilot
1 Longline OPEN all MA all 0 0 0
2 Longline OPEN all NE all 0 0 0
3 Hand Line OPEN all MA all 0 0 0 P
4 Hand Line OPEN all NE all 0 0 0
5 Otter Trawl OPEN all MA sm 11,438 0 11,438 0.458 5,234
6 Otter Trawl OPEN all MA lg 5,696 0 5,696 0.697 3,968
7 Otter Trawl OPEN all NE sm 1,184 0 1,184 0.728 862
8 Otter Trawl OPEN all NE lg 3,171 0 3,171 0.431 1,367
9 Scallop Trawl AA GEN MA all 881 0 881 0.804 709
11 Scallop Trawl OPEN GEN MA all 573 0 573 0.879 503
12 Scallop Trawl OPEN LIM MA all 0 0 P
13 Otter Trawl, Twin OPEN all MA all 5 0 5 1.261 7 P
14 Otter Trawl, Twin OPEN all NE all 0 0 0 P
16 Otter Trawl, Ruhle OPEN all NE sm 0 0 0 P
17 Otter Trawl, Ruhle OPEN all NE lg 0 0 P
18 Otter Trawl, Haddock Separator OPEN all NE lg 0 0 0
19 Shrimp Trawl OPEN all MA all 0 0 0 P
20 Shrimp Trawl OPEN all NE all 0 0 P
22 Floating Trap OPEN all NE all 0 0 P
23 Sink, Anchor, Drift Gillnet OPEN all MA sm 0 0 0
24 Sink, Anchor, Drift Gillnet OPEN all MA lg 0 0 0
25 Sink, Anchor, Drift Gillnet OPEN all MA xlg 28 0 28 0.543 15
26 Sink, Anchor, Drift Gillnet OPEN all NE sm 0 0 P
27 Sink, Anchor, Drift Gillnet OPEN all NE lg 0 0 0
28 Sink, Anchor, Drift Gillnet OPEN all NE xlg 0 0 0
29 Purse Seine OPEN all MA all 0 0 P
30 Purse Seine OPEN all NE all 0 0 0

See text for fleet abbreviations. 47
Table 5A, continued. Total catch (live lb), Vessel Trip Report landings (kept; live lb), estimated discards (live lb), associated coefficient of variation (CV), and standard error of the estimated discards (SE; live lb) for 14 fish and invertebrate species groups, by fleet, based on July 2015 through June 2016 data. Dark shading indicates fleets not considered or with no Northeast Fisheries Observer Program trips in the annual analysis. Light shading indicates that the variance of the discard estimate was not used in the annual sample size analysis. Blank CV indicates either no discards or discards equals 0. "P" indicates fleets with "pilot" designation.
Species Group: SURFCLAM (Spisula solidissima) - OCEAN QUAHOG (Arctica islandica) Fleet Row Gear Type Access Trip Region Mesh Area Category Group Total Kept Discarded CV SE Pilot
31 Scallop Dredge AA GEN MA all 320 0 320 0.418 134
32 Scallop Dredge AA GEN NE all 0 0 0
33 Scallop Dredge AA LIM MA all 2,139 0 2,139 0.521 1,115
34 Scallop Dredge AA LIM NE all 4,643 0 4,643 0.817 3,793
35 Scallop Dredge OPEN GEN MA all 25 0 25 0.903 23
36 Scallop Dredge OPEN GEN NE all 13,163 10,690 2,473 0.627 1,550
37 Scallop Dredge OPEN LIM MA all 7,263 0 7,263 0.714 5,182
38 Scallop Dredge OPEN LIM NE all 16,325 0 16,325 0.476 7,778
39 Danish Seine OPEN all MA all 500 500 P
40 Mid-water Paired & Single Trawl AA all NE all 0 0 0
42 Mid-water Paired & Single Trawl OPEN all NE all 0 0 0
43 Pots and Traps, Fish OPEN all MA all 0 0 0
44 Pots and Traps, Fish OPEN all NE all 0 0 0
45 Pots and Traps, Conch OPEN all MA all 0 0 0
46 Pots and Traps, Conch OPEN all NE all 0 0 0
47 Pots and Traps, Hagfish OPEN all NE all 0 0 P
48 Pots and Traps, Lobster OPEN all MA all 0 0 0
49 Pots and Traps, Lobster OPEN all NE all 0 0 0
50 Pots and Traps, Crab OPEN all MA all 0 0 P
51 Pots and Traps, Crab OPEN all NE all 0 0 P
52 Beam Trawl OPEN all MA all 0 0 P
53 Beam Trawl OPEN all NE all 0 0 P
54 Dredge, Other OPEN all MA all 0 0 P
55 Ocean Quahog/Surfclam Dredge OPEN all MA all 250,409,830 247,836,807 2,573,023 0.453 1,164,828
56 Ocean Quahog/Surfclam Dredge OPEN all NE all 197,314,607 197,289,336 25,271 0.723 18,263
Confidential fleets 0 0
Other minor fleets 303,369 303,369
TOTAL 448,095,161 445,440,701 2,654,459 0.439 1,165,037

See text for fleet abbreviations. 48
Table 5A, continued. Total catch (live lb), Vessel Trip Report landings (kept; live lb), estimated discards (live lb), associated coefficient of variation (CV), and standard error of the estimated discards (SE; live lb) for 14 fish and invertebrate species groups, by fleet, based on July 2015 through June 2016 data. Dark shading indicates fleets not considered or with no Northeast Fisheries Observer Program trips in the annual analysis. Light shading indicates that the variance of the discard estimate was not used in the annual sample size analysis. Blank CV indicates either no discards or discards equals 0. "P" indicates fleets with "pilot" designation.
Species Group: TILEFISH (Lopholatilus chamaeleonticeps) Fleet Row Gear Type Access Trip Region Mesh Area Category Group Total Kept Discarded CV SE Pilot
1 Longline OPEN all MA all 948,279 945,835 2,444 0.619 1,512
2 Longline OPEN all NE all 0 0 0
3 Hand Line OPEN all MA all 1,202 1,202 0 P
4 Hand Line OPEN all NE all 0 0 0
5 Otter Trawl OPEN all MA sm 11,441 4,452 6,989 0.520 3,635
6 Otter Trawl OPEN all MA lg 1,678 990 688 0.716 493
7 Otter Trawl OPEN all NE sm 13,373 6,252 7,121 0.442 3,147
8 Otter Trawl OPEN all NE lg 1,222 1,063 159 0.731 116
9 Scallop Trawl AA GEN MA all 0 0 0
11 Scallop Trawl OPEN GEN MA all 0 0 0
12 Scallop Trawl OPEN LIM MA all 0 0 P
13 Otter Trawl, Twin OPEN all MA all 2,064 25 2,039 0.112 229 P
14 Otter Trawl, Twin OPEN all NE all 334 120 214 0.267 57 P
16 Otter Trawl, Ruhle OPEN all NE sm 2,579 0 2,579 0.000 0 P
17 Otter Trawl, Ruhle OPEN all NE lg 0 0 P
18 Otter Trawl, Haddock Separator OPEN all NE lg 0 0 0
19 Shrimp Trawl OPEN all MA all 0 0 0 P
20 Shrimp Trawl OPEN all NE all 40 40 P
22 Floating Trap OPEN all NE all 0 0 P
23 Sink, Anchor, Drift Gillnet OPEN all MA sm 0 0 0
24 Sink, Anchor, Drift Gillnet OPEN all MA lg 0 0 0
25 Sink, Anchor, Drift Gillnet OPEN all MA xlg 0 0 0
26 Sink, Anchor, Drift Gillnet OPEN all NE sm 0 0 P
27 Sink, Anchor, Drift Gillnet OPEN all NE lg 0 0 0
28 Sink, Anchor, Drift Gillnet OPEN all NE xlg 821 821 0
29 Purse Seine OPEN all MA all 0 0 P
30 Purse Seine OPEN all NE all 0 0 0

See text for fleet abbreviations. 49
Table 5A, continued. Total catch (live lb), Vessel Trip Report landings (kept; live lb), estimated discards (live lb), associated coefficient of variation (CV), and standard error of the estimated discards (SE; live lb) for 14 fish and invertebrate species groups, by fleet, based on July 2015 through June 2016 data. Dark shading indicates fleets not considered or with no Northeast Fisheries Observer Program trips in the annual analysis. Light shading indicates that the variance of the discard estimate was not used in the annual sample size analysis. Blank CV indicates either no discards or discards equals 0. "P" indicates fleets with "pilot" designation.
Species Group: TILEFISH (Lopholatilus chamaeleonticeps) Fleet Row Gear Type Access Trip Region Mesh Area Category Group Total Kept Discarded CV SE Pilot
31 Scallop Dredge AA GEN MA all 0 0 0
32 Scallop Dredge AA GEN NE all 0 0 0
33 Scallop Dredge AA LIM MA all 0 0 0
34 Scallop Dredge AA LIM NE all 0 0 0
35 Scallop Dredge OPEN GEN MA all 0 0 0
36 Scallop Dredge OPEN GEN NE all 0 0 0
37 Scallop Dredge OPEN LIM MA all 0 0 0
38 Scallop Dredge OPEN LIM NE all 0 0 0
39 Danish Seine OPEN all MA all 0 0 P
40 Mid-water Paired & Single Trawl AA all NE all 0 0 0
42 Mid-water Paired & Single Trawl OPEN all NE all 0 0 0
43 Pots and Traps, Fish OPEN all MA all 0 0 0
44 Pots and Traps, Fish OPEN all NE all 0 0 0
45 Pots and Traps, Conch OPEN all MA all 0 0 0
46 Pots and Traps, Conch OPEN all NE all 0 0 0
47 Pots and Traps, Hagfish OPEN all NE all 0 0 P
48 Pots and Traps, Lobster OPEN all MA all 0 0 0
49 Pots and Traps, Lobster OPEN all NE all 445 52 393 0.509 200
50 Pots and Traps, Crab OPEN all MA all 0 0 P
51 Pots and Traps, Crab OPEN all NE all 0 0 P
52 Beam Trawl OPEN all MA all 0 0 P
53 Beam Trawl OPEN all NE all 0 0 P
54 Dredge, Other OPEN all MA all 0 0 P
55 Ocean Quahog/Surfclam Dredge OPEN all MA all 0 0 0
56 Ocean Quahog/Surfclam Dredge OPEN all NE all 0 0 0
Confidential fleets 0 0
Other minor fleets 19 19
TOTAL 983,498 960,871 22,627 0.224 5,075

See text for fleet abbreviations 50
Table 5B. Total catch (live lb), Vessel Trip Report landings (kept; live lb), estimated discards (live lb), associated coefficient of variation (CV), and standard error of the estimated discards (SE; live lb) for 23 individual species that compose the 14 species groups, by fleet, based on July 2015 through June 2016 data. Dark shading indicates fleets not considered or with no Northeast Fisheries Observer Program trips in the annual analysis. These CVs were not used in the annual sample size analysis. Blank CV indicates either no discards estimated or discards equals 0. "P" indicates fleets with "pilot" designation.
Species: BLACK SEA BASS (Centropristis striata) Fleet Row Gear Type Access Trip Region Mesh Area Category Group Total Kept Discarded CV SE Pilot
1 Longline OPEN all MA all 223 150 73 0.732 53
2 Longline OPEN all NE all 0 0 0
3 Hand Line OPEN all MA all 57,897 57,897 0 P
4 Hand Line OPEN all NE all 15,319 15,218 101 0.655 66
5 Otter Trawl OPEN all MA sm 986,738 643,343 343,395 0.145 49,855
6 Otter Trawl OPEN all MA lg 738,033 487,156 250,877 0.340 85,357
7 Otter Trawl OPEN all NE sm 376,445 75,329 301,116 0.249 74,905
8 Otter Trawl OPEN all NE lg 96,571 32,266 64,305 0.218 14,011
9 Scallop Trawl AA GEN MA all 5,284 30 5,254 0.978 5,140
11 Scallop Trawl OPEN GEN MA all 165 162 3 0.471 1
12 Scallop Trawl OPEN LIM MA all 1,351 1,351 P
13 Otter Trawl, Twin OPEN all MA all 431 260 171 1.231 211 P
14 Otter Trawl, Twin OPEN all NE all 2,521 500 2,021 0.806 1,629 P
16 Otter Trawl, Ruhle OPEN all NE sm 0 0 0 P
17 Otter Trawl, Ruhle OPEN all NE lg 0 0 P
18 Otter Trawl, Haddock Separator OPEN all NE lg 0 0 0
19 Shrimp Trawl OPEN all MA all 0 0 0 P
20 Shrimp Trawl OPEN all NE all 1,058 1,058 P
22 Floating Trap OPEN all NE all 25 25 P
23 Sink, Anchor, Drift Gillnet OPEN all MA sm 7 7 0
24 Sink, Anchor, Drift Gillnet OPEN all MA lg 818 759 59 0.701 41
25 Sink, Anchor, Drift Gillnet OPEN all MA xlg 1,574 1,486 88 0.751 66
26 Sink, Anchor, Drift Gillnet OPEN all NE sm 0 0 P
27 Sink, Anchor, Drift Gillnet OPEN all NE lg 7,087 6,880 207 0.590 122
28 Sink, Anchor, Drift Gillnet OPEN all NE xlg 1,007 959 48 0.962 46
29 Purse Seine OPEN all MA all 0 0 P
30 Purse Seine OPEN all NE all 0 0 0

See text for fleet abbreviations. 51
Table 5B, continued. Total catch (live lb), Vessel Trip Report landings (kept; live lb), estimated discards (live lb), associated coefficient of variation (CV), and standard error of the estimated discards (SE; live lb) for 23 individual species that compose the 14 species groups, by fleet, based on July 2015 through June 2016 data. Dark shading indicates fleets not considered or with no Northeast Fisheries Observer Program trips in the annual analysis. These CVs were not used in the annual sample size analysis. Blank CV indicates either no discards estimated or discards equals 0. "P" indicates fleets with "pilot" designation.
Species: BLACK SEA BASS (Centropristis striata) Fleet Row Gear Type Access Trip Region Mesh Area Category Group Total Kept Discarded CV SE Pilot
31 Scallop Dredge AA GEN MA all 763 9 754 0.277 209
32 Scallop Dredge AA GEN NE all 0 0 0
33 Scallop Dredge AA LIM MA all 2,448 0 2,448 0.278 680
34 Scallop Dredge AA LIM NE all 2,951 0 2,951 0.231 683
35 Scallop Dredge OPEN GEN MA all 1,059 121 938 0.327 306
36 Scallop Dredge OPEN GEN NE all 500 6 494 0.609 301
37 Scallop Dredge OPEN LIM MA all 1,342 21 1,321 0.344 455
38 Scallop Dredge OPEN LIM NE all 294 0 294 0.363 107
39 Danish Seine OPEN all MA all 4 4 P
40 Mid-water Paired & Single Trawl AA all NE all 0 0 0
42 Mid-water Paired & Single Trawl OPEN all NE all 0 0 0
43 Pots and Traps, Fish OPEN all MA all 381,998 282,152 99,846 0.863 86,124
44 Pots and Traps, Fish OPEN all NE all 163,797 68,608 95,189 0.237 22,545
45 Pots and Traps, Conch OPEN all MA all 1,862 1,283 579 0.404 234
46 Pots and Traps, Conch OPEN all NE all 310 0 310 0.535 166
47 Pots and Traps, Hagfish OPEN all NE all 0 0 P
48 Pots and Traps, Lobster OPEN all MA all 157,969 114,751 43,218 0.670 28,942
49 Pots and Traps, Lobster OPEN all NE all 75,740 23,788 51,952 0.505 26,231
50 Pots and Traps, Crab OPEN all MA all 0 0 P
51 Pots and Traps, Crab OPEN all NE all 0 0 P
52 Beam Trawl OPEN all MA all 15,490 15,490 P
53 Beam Trawl OPEN all NE all 34 34 P
54 Dredge, Other OPEN all MA all 0 0 P
55 Ocean Quahog/Surfclam Dredge OPEN all MA all 2,435 0 2,435 0.518 1,262
56 Ocean Quahog/Surfclam Dredge OPEN all NE all 151 0 151 0.714 108
Confidential fleets 2,615 2,615
Other minor fleets 11,275 11,275
TOTAL 3,115,592 1,844,993 1,270,599 0.125 158,309

See text for fleet abbreviations. 52
Table 5B, continued. Total catch (live lb), Vessel Trip Report landings (kept; live lb), estimated discards (live lb), associated coefficient of variation (CV), and standard error of the estimated discards (SE; live lb) for 23 individual species that compose the 14 species groups, by fleet, based on July 2015 through June 2016 data. Dark shading indicates fleets not considered or with no Northeast Fisheries Observer Program trips in the annual analysis. These CVs were not used in the annual sample size analysis. Blank CV indicates either no discards estimated or discards equals 0. "P" indicates fleets with "pilot" designation.
Species: FLUKE (Paralichthys dentatus) Fleet Row Gear Type Access Trip Region Mesh Area Category Group Total Kept Discarded CV SE Pilot
1 Longline OPEN all MA all 0 0 0
2 Longline OPEN all NE all 795 795 0
3 Hand Line OPEN all MA all 44,320 44,320 0 P
4 Hand Line OPEN all NE all 10,852 10,852 0
5 Otter Trawl OPEN all MA sm 824,297 476,949 347,348 0.146 50,774
6 Otter Trawl OPEN all MA lg 6,262,459 5,689,848 572,611 0.184 105,209
7 Otter Trawl OPEN all NE sm 739,086 529,502 209,584 0.284 59,602
8 Otter Trawl OPEN all NE lg 1,344,819 881,036 463,783 0.195 90,564
9 Scallop Trawl AA GEN MA all 27,979 1,498 26,481 0.660 17,477
11 Scallop Trawl OPEN GEN MA all 21,229 20,689 540 0.494 267
12 Scallop Trawl OPEN LIM MA all 20,780 20,780 P
13 Otter Trawl, Twin OPEN all MA all 13,141 12,148 993 0.830 824 P
14 Otter Trawl, Twin OPEN all NE all 5,100 1,112 3,988 0.257 1,026 P
16 Otter Trawl, Ruhle OPEN all NE sm 0 0 0 P
17 Otter Trawl, Ruhle OPEN all NE lg 15 15 P
18 Otter Trawl, Haddock Separator OPEN all NE lg 7,079 1,155 5,924 0.963 5,703
19 Shrimp Trawl OPEN all MA all 266 266 0 P
20 Shrimp Trawl OPEN all NE all 400 400 P
22 Floating Trap OPEN all NE all 15 15 P
23 Sink, Anchor, Drift Gillnet OPEN all MA sm 195 12 183 0.283 52
24 Sink, Anchor, Drift Gillnet OPEN all MA lg 6,872 6,378 494 0.249 123
25 Sink, Anchor, Drift Gillnet OPEN all MA xlg 29,124 12,709 16,415 0.336 5,524
26 Sink, Anchor, Drift Gillnet OPEN all NE sm 105 105 P
27 Sink, Anchor, Drift Gillnet OPEN all NE lg 24,287 23,973 314 0.248 78
28 Sink, Anchor, Drift Gillnet OPEN all NE xlg 97,582 33,785 63,797 0.328 20,942
29 Purse Seine OPEN all MA all 0 0 P
30 Purse Seine OPEN all NE all 0 0 0

See text for fleet abbreviations. 53
Table 5B, continued. Total catch (live lb), Vessel Trip Report landings (kept; live lb), estimated discards (live lb), associated coefficient of variation (CV), and standard error of the estimated discards (SE; live lb) for 23 individual species that compose the 14 species groups, by fleet, based on July 2015 through June 2016 data. Dark shading indicates fleets not considered or with no Northeast Fisheries Observer Program trips in the annual analysis. These CVs were not used in the annual sample size analysis. Blank CV indicates either no discards estimated or discards equals 0. "P" indicates fleets with "pilot" designation.
Species: FLUKE (Paralichthys dentatus) Fleet Row Gear Type Access Trip Region Mesh Area Category Group Total Kept Discarded CV SE Pilot
31 Scallop Dredge AA GEN MA all 14,604 4,287 10,317 0.167 1,724
32 Scallop Dredge AA GEN NE all 754 0 754 0.210 158
33 Scallop Dredge AA LIM MA all 91,401 5,176 86,225 0.189 16,330
34 Scallop Dredge AA LIM NE all 106,822 70 106,752 0.154 16,421
35 Scallop Dredge OPEN GEN MA all 62,778 11,737 51,041 0.195 9,939
36 Scallop Dredge OPEN GEN NE all 26,805 3,065 23,740 0.373 8,860
37 Scallop Dredge OPEN LIM MA all 100,462 9,894 90,568 0.288 26,044
38 Scallop Dredge OPEN LIM NE all 163,399 50 163,349 0.220 35,979
39 Danish Seine OPEN all MA all 2,955 2,955 P
40 Mid-water Paired & Single Trawl AA all NE all 0 0 0
42 Mid-water Paired & Single Trawl OPEN all NE all 0 0 0
43 Pots and Traps, Fish OPEN all MA all 1,986 368 1,618 0.286 462
44 Pots and Traps, Fish OPEN all NE all 870 836 34 0.837 28
45 Pots and Traps, Conch OPEN all MA all 0 0 0
46 Pots and Traps, Conch OPEN all NE all 250 250 0
47 Pots and Traps, Hagfish OPEN all NE all 0 0 P
48 Pots and Traps, Lobster OPEN all MA all 56 56 0
49 Pots and Traps, Lobster OPEN all NE all 1,273 150 1,123 0.414 465
50 Pots and Traps, Crab OPEN all MA all 0 0 P
51 Pots and Traps, Crab OPEN all NE all 0 0 P
52 Beam Trawl OPEN all MA all 103,049 103,049 P
53 Beam Trawl OPEN all NE all 17,897 17,897 P
54 Dredge, Other OPEN all MA all 0 0 P
55 Ocean Quahog/Surfclam Dredge OPEN all MA all 16,432 0 16,432 0.395 6,492
56 Ocean Quahog/Surfclam Dredge OPEN all NE all 1,955 0 1,955 0.717 1,402
Confidential fleets 8,841 8,841
Other minor fleets 31,978 31,978
TOTAL 10,235,364 7,969,001 2,266,363 0.075 170,129

See text for fleet abbreviations. 54
Table 5B, continued. Total catch (live lb), Vessel Trip Report landings (kept; live lb), estimated discards (live lb), associated coefficient of variation (CV), and standard error of the estimated discards (SE; live lb) for 23 individual species that compose the 14 species groups, by fleet, based on July 2015 through June 2016 data. Dark shading indicates fleets not considered or with no Northeast Fisheries Observer Program trips in the annual analysis. These CVs were not used in the annual sample size analysis. Blank CV indicates either no discards estimated or discards equals 0. "P" indicates fleets with "pilot" designation.
Species: SCUP (Stenotomus chrysops) Fleet Row Gear Type Access Trip Region Mesh Area Category Group Total Kept Discarded CV SE Pilot
1 Longline OPEN all MA all 0 0 0
2 Longline OPEN all NE all 0 0 0
3 Hand Line OPEN all MA all 76,993 76,993 0 P
4 Hand Line OPEN all NE all 5,097 5,097 0
5 Otter Trawl OPEN all MA sm 6,193,644 4,961,327 1,232,317 0.155 191,309
6 Otter Trawl OPEN all MA lg 2,225,728 1,722,249 503,479 0.309 155,769
7 Otter Trawl OPEN all NE sm 4,988,462 3,592,445 1,396,017 0.217 303,130
8 Otter Trawl OPEN all NE lg 1,263,859 1,149,382 114,477 0.424 48,507
9 Scallop Trawl AA GEN MA all 164 0 164 0.982 161
11 Scallop Trawl OPEN GEN MA all 165 131 34 0.444 15
12 Scallop Trawl OPEN LIM MA all 15 15 P
13 Otter Trawl, Twin OPEN all MA all 5,162 3,850 1,312 1.216 1,595 P
14 Otter Trawl, Twin OPEN all NE all 8,042 7,950 92 0.791 73 P
16 Otter Trawl, Ruhle OPEN all NE sm 0 0 0 P
17 Otter Trawl, Ruhle OPEN all NE lg 0 0 P
18 Otter Trawl, Haddock Separator OPEN all NE lg 0 0 0
19 Shrimp Trawl OPEN all MA all 50 50 0 P
20 Shrimp Trawl OPEN all NE all 1,363 1,363 P
22 Floating Trap OPEN all NE all 550 550 P
23 Sink, Anchor, Drift Gillnet OPEN all MA sm 115 58 57 0.558 32
24 Sink, Anchor, Drift Gillnet OPEN all MA lg 4,681 4,671 10 0.845 8
25 Sink, Anchor, Drift Gillnet OPEN all MA xlg 1,134 1,049 85 0.736 62
26 Sink, Anchor, Drift Gillnet OPEN all NE sm 400 400 P
27 Sink, Anchor, Drift Gillnet OPEN all NE lg 87,860 87,821 39 0.489 19
28 Sink, Anchor, Drift Gillnet OPEN all NE xlg 3,527 3,527 0
29 Purse Seine OPEN all MA all 0 0 P
30 Purse Seine OPEN all NE all 0 0 0

See text for fleet abbreviations. 55
Table 5B, continued. Total catch (live lb), Vessel Trip Report landings (kept; live lb), estimated discards (live lb), associated coefficient of variation (CV), and standard error of the estimated discards (SE; live lb) for 23 individual species that compose the 14 species groups, by fleet, based on July 2015 through June 2016 data. Dark shading indicates fleets not considered or with no Northeast Fisheries Observer Program trips in the annual analysis. These CVs were not used in the annual sample size analysis. Blank CV indicates either no discards estimated or discards equals 0. "P" indicates fleets with "pilot" designation.
Species: SCUP (Stenotomus chrysops) Fleet Row Gear Type Access Trip Region Mesh Area Category Group Total Kept Discarded CV SE Pilot
31 Scallop Dredge AA GEN MA all 27 0 27 0.390 10
32 Scallop Dredge AA GEN NE all 0 0 0
33 Scallop Dredge AA LIM MA all 683 0 683 0.508 347
34 Scallop Dredge AA LIM NE all 2,222 0 2,222 0.487 1,082
35 Scallop Dredge OPEN GEN MA all 375 9 366 0.492 180
36 Scallop Dredge OPEN GEN NE all 118 0 118 0.941 111
37 Scallop Dredge OPEN LIM MA all 351 5 346 0.514 178
38 Scallop Dredge OPEN LIM NE all 29 0 29 0.611 18
39 Danish Seine OPEN all MA all 2 2 P
40 Mid-water Paired & Single Trawl AA all NE all 0 0 0
42 Mid-water Paired & Single Trawl OPEN all NE all 6,000 6,000 0
43 Pots and Traps, Fish OPEN all MA all 12,366 10,916 1,450 0.442 641
44 Pots and Traps, Fish OPEN all NE all 102,562 91,185 11,377 0.359 4,090
45 Pots and Traps, Conch OPEN all MA all 38 33 5 1.275 6
46 Pots and Traps, Conch OPEN all NE all 2,200 0 2,200 1.122 2,468
47 Pots and Traps, Hagfish OPEN all NE all 0 0 P
48 Pots and Traps, Lobster OPEN all MA all 5,121 3,978 1,143 1.085 1,240
49 Pots and Traps, Lobster OPEN all NE all 7,709 1,872 5,837 0.457 2,666
50 Pots and Traps, Crab OPEN all MA all 0 0 P
51 Pots and Traps, Crab OPEN all NE all 0 0 P
52 Beam Trawl OPEN all MA all 2,174 2,174 P
53 Beam Trawl OPEN all NE all 2,324 2,324 P
54 Dredge, Other OPEN all MA all 0 0 P
55 Ocean Quahog/Surfclam Dredge OPEN all MA all 83 0 83 0.928 77
56 Ocean Quahog/Surfclam Dredge OPEN all NE all 0 0 0
Confidential fleets 148 148
Other minor fleets 7,478 7,478
TOTAL 15,019,020 11,745,052 3,273,968 0.120 393,878

See text for fleet abbreviations. 56
Table 5B, continued. Total catch (live lb), Vessel Trip Report landings (kept; live lb), estimated discards (live lb), associated coefficient of variation (CV), and standard error of the estimated discards (SE; live lb) for 23 individual species that compose the 14 species groups, by fleet, based on July 2015 through June 2016 data. Dark shading indicates fleets not considered or with no Northeast Fisheries Observer Program trips in the annual analysis. These CVs were not used in the annual sample size analysis. Blank CV indicates either no discards estimated or discards equals 0. "P" indicates fleets with "pilot" designation.
Species: AMERICAN PLAICE (Hippoglossoides platessoides) Fleet Row Gear Type Access Trip Region Mesh Area Category Group Total Kept Discarded CV SE Pilot
1 Longline OPEN all MA all 0 0 0
2 Longline OPEN all NE all 0 0 0
3 Hand Line OPEN all MA all 0 0 0 P
4 Hand Line OPEN all NE all 0 0 0
5 Otter Trawl OPEN all MA sm 478 290 188 0.795 149
6 Otter Trawl OPEN all MA lg 3,351 550 2,801 0.580 1,625
7 Otter Trawl OPEN all NE sm 8,952 500 8,452 0.218 1,844
8 Otter Trawl OPEN all NE lg 2,531,403 2,359,804 171,599 0.093 16,031
9 Scallop Trawl AA GEN MA all 0 0 0
11 Scallop Trawl OPEN GEN MA all 0 0 0
12 Scallop Trawl OPEN LIM MA all 0 0 P
13 Otter Trawl, Twin OPEN all MA all 0 0 0 P
14 Otter Trawl, Twin OPEN all NE all 10 10 0 P
16 Otter Trawl, Ruhle OPEN all NE sm 0 0 0 P
17 Otter Trawl, Ruhle OPEN all NE lg 1,404 1,404 P
18 Otter Trawl, Haddock Separator OPEN all NE lg 52,220 49,118 3,102 0.316 981
19 Shrimp Trawl OPEN all MA all 0 0 0 P
20 Shrimp Trawl OPEN all NE all 0 0 P
22 Floating Trap OPEN all NE all 0 0 P
23 Sink, Anchor, Drift Gillnet OPEN all MA sm 2 0 2 0.819 2
24 Sink, Anchor, Drift Gillnet OPEN all MA lg 0 0 0
25 Sink, Anchor, Drift Gillnet OPEN all MA xlg 0 0 0
26 Sink, Anchor, Drift Gillnet OPEN all NE sm 10 10 P
27 Sink, Anchor, Drift Gillnet OPEN all NE lg 13,356 11,032 2,324 0.250 581
28 Sink, Anchor, Drift Gillnet OPEN all NE xlg 291 272 19 0.540 10
29 Purse Seine OPEN all MA all 0 0 P
30 Purse Seine OPEN all NE all 0 0 0

See text for fleet abbreviations. 57
Table 5B, continued. Total catch (live lb), Vessel Trip Report landings (kept; live lb), estimated discards (live lb), associated coefficient of variation (CV), and standard error of the estimated discards (SE; live lb) for 23 individual species that compose the 14 species groups, by fleet, based on July 2015 through June 2016 data. Dark shading indicates fleets not considered or with no Northeast Fisheries Observer Program trips in the annual analysis. These CVs were not used in the annual sample size analysis. Blank CV indicates either no discards estimated or discards equals 0. "P" indicates fleets with "pilot" designation.
Species: AMERICAN PLAICE (Hippoglossoides platessoides) Fleet Row Gear Type Access Trip Region Mesh Area Category Group Total Kept Discarded CV SE Pilot
31 Scallop Dredge AA GEN MA all 8 0 8 0.952 7
32 Scallop Dredge AA GEN NE all 0 0 0
33 Scallop Dredge AA LIM MA all 0 0 0
34 Scallop Dredge AA LIM NE all 0 0 0
35 Scallop Dredge OPEN GEN MA all 34 0 34 0.743 25
36 Scallop Dredge OPEN GEN NE all 1,138 0 1,138 0.365 415
37 Scallop Dredge OPEN LIM MA all 15 0 15 0.880 13
38 Scallop Dredge OPEN LIM NE all 36,576 30 36,546 0.394 14,417
39 Danish Seine OPEN all MA all 0 0 P
40 Mid-water Paired & Single Trawl AA all NE all 0 0 0
42 Mid-water Paired & Single Trawl OPEN all NE all 0 0 0
43 Pots and Traps, Fish OPEN all MA all 0 0 0
44 Pots and Traps, Fish OPEN all NE all 0 0 0
45 Pots and Traps, Conch OPEN all MA all 0 0 0
46 Pots and Traps, Conch OPEN all NE all 0 0 0
47 Pots and Traps, Hagfish OPEN all NE all 0 0 P
48 Pots and Traps, Lobster OPEN all MA all 0 0 0
49 Pots and Traps, Lobster OPEN all NE all 10 0 10 0.774 8
50 Pots and Traps, Crab OPEN all MA all 0 0 P
51 Pots and Traps, Crab OPEN all NE all 0 0 P
52 Beam Trawl OPEN all MA all 0 0 P
53 Beam Trawl OPEN all NE all 0 0 P
54 Dredge, Other OPEN all MA all 0 0 P
55 Ocean Quahog/Surfclam Dredge OPEN all MA all 0 0 0
56 Ocean Quahog/Surfclam Dredge OPEN all NE all 45 0 45 0.929 42
Confidential fleets 0 0
Other minor fleets 0 0
TOTAL 2,649,301 2,423,020 226,281 0.096 21,734

See text for fleet abbreviations. 58
Table 5B, continued. Total catch (live lb), Vessel Trip Report landings (kept; live lb), estimated discards (live lb), associated coefficient of variation (CV), and standard error of the estimated discards (SE; live lb) for 23 individual species that compose the 14 species groups, by fleet, based on July 2015 through June 2016 data. Dark shading indicates fleets not considered or with no Northeast Fisheries Observer Program trips in the annual analysis. These CVs were not used in the annual sample size analysis. Blank CV indicates either no discards estimated or discards equals 0. "P" indicates fleets with "pilot" designation.
Species: ATLANTIC COD (Gadus morhua) Fleet Row Gear Type Access Trip Region Mesh Area Category Group Total Kept Discarded CV SE Pilot
1 Longline OPEN all MA all 0 0 0
2 Longline OPEN all NE all 12,277 4,214 8,063 0.801 6,458
3 Hand Line OPEN all MA all 4,698 4,698 0 P
4 Hand Line OPEN all NE all 87,358 48,303 39,055 2.019 78,836
5 Otter Trawl OPEN all MA sm 5,041 501 4,540 0.558 2,533
6 Otter Trawl OPEN all MA lg 50,490 48,965 1,525 0.517 788
7 Otter Trawl OPEN all NE sm 5,699 1,764 3,935 0.308 1,212
8 Otter Trawl OPEN all NE lg 2,136,131 2,071,778 64,353 0.192 12,364
9 Scallop Trawl AA GEN MA all 0 0 0
11 Scallop Trawl OPEN GEN MA all 11 0 11 0.859 9
12 Scallop Trawl OPEN LIM MA all 0 0 P
13 Otter Trawl, Twin OPEN all MA all 230 230 0 P
14 Otter Trawl, Twin OPEN all NE all 158 150 8 0.861 7 P
16 Otter Trawl, Ruhle OPEN all NE sm 5 5 0 P
17 Otter Trawl, Ruhle OPEN all NE lg 477 477 P
18 Otter Trawl, Haddock Separator OPEN all NE lg 179,675 172,037 7,638 0.154 1,173
19 Shrimp Trawl OPEN all MA all 0 0 0 P
20 Shrimp Trawl OPEN all NE all 0 0 P
22 Floating Trap OPEN all NE all 0 0 P
23 Sink, Anchor, Drift Gillnet OPEN all MA sm 0 0 0
24 Sink, Anchor, Drift Gillnet OPEN all MA lg 809 477 332 0.673 224
25 Sink, Anchor, Drift Gillnet OPEN all MA xlg 666 453 213 0.548 117
26 Sink, Anchor, Drift Gillnet OPEN all NE sm 15 15 P
27 Sink, Anchor, Drift Gillnet OPEN all NE lg 472,918 446,455 26,463 0.233 6,162
28 Sink, Anchor, Drift Gillnet OPEN all NE xlg 23,663 9,941 13,722 0.284 3,896
29 Purse Seine OPEN all MA all 0 0 P
30 Purse Seine OPEN all NE all 0 0 0

See text for fleet abbreviations. 59
Table 5B, continued. Total catch (live lb), Vessel Trip Report landings (kept; live lb), estimated discards (live lb), associated coefficient of variation (CV), and standard error of the estimated discards (SE; live lb) for 23 individual species that compose the 14 species groups, by fleet, based on July 2015 through June 2016 data. Dark shading indicates fleets not considered or with no Northeast Fisheries Observer Program trips in the annual analysis. These CVs were not used in the annual sample size analysis. Blank CV indicates either no discards estimated or discards equals 0. "P" indicates fleets with "pilot" designation.
Species: ATLANTIC COD (Gadus morhua) Fleet Row Gear Type Access Trip Region Mesh Area Category Group Total Kept Discarded CV SE Pilot
31 Scallop Dredge AA GEN MA all 0 0 0
32 Scallop Dredge AA GEN NE all 0 0 0
33 Scallop Dredge AA LIM MA all 0 0 0
34 Scallop Dredge AA LIM NE all 0 0 0
35 Scallop Dredge OPEN GEN MA all 254 34 220 1.183 260
36 Scallop Dredge OPEN GEN NE all 41 0 41 0.644 26
37 Scallop Dredge OPEN LIM MA all 237 30 207 0.357 74
38 Scallop Dredge OPEN LIM NE all 16,691 185 16,506 0.284 4,696
39 Danish Seine OPEN all MA all 0 0 P
40 Mid-water Paired & Single Trawl AA all NE all 0 0 0
42 Mid-water Paired & Single Trawl OPEN all NE all 0 0 0
43 Pots and Traps, Fish OPEN all MA all 6,816 516 6,300 0.502 3,164
44 Pots and Traps, Fish OPEN all NE all 72 72 0
45 Pots and Traps, Conch OPEN all MA all 0 0 0
46 Pots and Traps, Conch OPEN all NE all 0 0 0
47 Pots and Traps, Hagfish OPEN all NE all 0 0 P
48 Pots and Traps, Lobster OPEN all MA all 1,549 1,216 333 1.317 439
49 Pots and Traps, Lobster OPEN all NE all 68,525 675 67,850 0.282 19,140
50 Pots and Traps, Crab OPEN all MA all 0 0 P
51 Pots and Traps, Crab OPEN all NE all 0 0 P
52 Beam Trawl OPEN all MA all 0 0 P
53 Beam Trawl OPEN all NE all 0 0 P
54 Dredge, Other OPEN all MA all 0 0 P
55 Ocean Quahog/Surfclam Dredge OPEN all MA all 0 0 0
56 Ocean Quahog/Surfclam Dredge OPEN all NE all 0 0 0
Confidential fleets 0 0
Other minor fleets 0 0
TOTAL 3,074,508 2,813,191 261,317 0.317 82,894

See text for fleet abbreviations. 60
Table 5B, continued. Total catch (live lb), Vessel Trip Report landings (kept; live lb), estimated discards (live lb), associated coefficient of variation (CV), and standard error of the estimated discards (SE; live lb) for 23 individual species that compose the 14 species groups, by fleet, based on July 2015 through June 2016 data. Dark shading indicates fleets not considered or with no Northeast Fisheries Observer Program trips in the annual analysis. These CVs were not used in the annual sample size analysis. Blank CV indicates either no discards estimated or discards equals 0. "P" indicates fleets with "pilot" designation.
Species: ATLANTIC HALIBUT (Hippoglossus hippoglossus) Fleet Row Gear Type Access Trip Region Mesh Area Category Group Total Kept Discarded CV SE Pilot
1 Longline OPEN all MA all 0 0 0
2 Longline OPEN all NE all 2,538 2,538 0
3 Hand Line OPEN all MA all 0 0 0 P
4 Hand Line OPEN all NE all 154 154 0
5 Otter Trawl OPEN all MA sm 0 0 0
6 Otter Trawl OPEN all MA lg 0 0 0
7 Otter Trawl OPEN all NE sm 1,581 0 1,581 0.468 739
8 Otter Trawl OPEN all NE lg 67,332 26,099 41,233 0.205 8,450
9 Scallop Trawl AA GEN MA all 0 0 0
11 Scallop Trawl OPEN GEN MA all 0 0 0
12 Scallop Trawl OPEN LIM MA all 0 0 P
13 Otter Trawl, Twin OPEN all MA all 0 0 0 P
14 Otter Trawl, Twin OPEN all NE all 0 0 0 P
16 Otter Trawl, Ruhle OPEN all NE sm 0 0 0 P
17 Otter Trawl, Ruhle OPEN all NE lg 59 59 P
18 Otter Trawl, Haddock Separator OPEN all NE lg 2,537 1,308 1,229 0.345 424
19 Shrimp Trawl OPEN all MA all 0 0 0 P
20 Shrimp Trawl OPEN all NE all 0 0 P
22 Floating Trap OPEN all NE all 0 0 P
23 Sink, Anchor, Drift Gillnet OPEN all MA sm 0 0 0
24 Sink, Anchor, Drift Gillnet OPEN all MA lg 0 0 0
25 Sink, Anchor, Drift Gillnet OPEN all MA xlg 0 0 0
26 Sink, Anchor, Drift Gillnet OPEN all NE sm 0 0 P
27 Sink, Anchor, Drift Gillnet OPEN all NE lg 7,654 2,782 4,872 0.214 1,042
28 Sink, Anchor, Drift Gillnet OPEN all NE xlg 79,246 5,601 73,645 0.249 18,332
29 Purse Seine OPEN all MA all 0 0 P
30 Purse Seine OPEN all NE all 0 0 0

See text for fleet abbreviations. 61
Table 5B, continued. Total catch (live lb), Vessel Trip Report landings (kept; live lb), estimated discards (live lb), associated coefficient of variation (CV), and standard error of the estimated discards (SE; live lb) for 23 individual species that compose the 14 species groups, by fleet, based on July 2015 through June 2016 data. Dark shading indicates fleets not considered or with no Northeast Fisheries Observer Program trips in the annual analysis. These CVs were not used in the annual sample size analysis. Blank CV indicates either no discards estimated or discards equals 0. "P" indicates fleets with "pilot" designation.
Species: ATLANTIC HALIBUT (Hippoglossus hippoglossus) Fleet Row Gear Type Access Trip Region Mesh Area Category Group Total Kept Discarded CV SE Pilot
31 Scallop Dredge AA GEN MA all 0 0 0
32 Scallop Dredge AA GEN NE all 0 0 0
33 Scallop Dredge AA LIM MA all 0 0 0
34 Scallop Dredge AA LIM NE all 0 0 0
35 Scallop Dredge OPEN GEN MA all 0 0 0
36 Scallop Dredge OPEN GEN NE all 120 0 120 0.877 105
37 Scallop Dredge OPEN LIM MA all 0 0 0
38 Scallop Dredge OPEN LIM NE all 626 140 486 0.397 193
39 Danish Seine OPEN all MA all 0 0 P
40 Mid-water Paired & Single Trawl AA all NE all 0 0 0
42 Mid-water Paired & Single Trawl OPEN all NE all 0 0 0
43 Pots and Traps, Fish OPEN all MA all 0 0 0
44 Pots and Traps, Fish OPEN all NE all 0 0 0
45 Pots and Traps, Conch OPEN all MA all 0 0 0
46 Pots and Traps, Conch OPEN all NE all 0 0 0
47 Pots and Traps, Hagfish OPEN all NE all 0 0 P
48 Pots and Traps, Lobster OPEN all MA all 0 0 0
49 Pots and Traps, Lobster OPEN all NE all 301 252 49 0.774 38
50 Pots and Traps, Crab OPEN all MA all 0 0 P
51 Pots and Traps, Crab OPEN all NE all 0 0 P
52 Beam Trawl OPEN all MA all 0 0 P
53 Beam Trawl OPEN all NE all 0 0 P
54 Dredge, Other OPEN all MA all 0 0 P
55 Ocean Quahog/Surfclam Dredge OPEN all MA all 0 0 0
56 Ocean Quahog/Surfclam Dredge OPEN all NE all 0 0 0
Confidential fleets 0 0
Other minor fleets 497 497
TOTAL 162,646 39,430 123,216 0.164 20,232

See text for fleet abbreviations. 62
Table 5B, continued. Total catch (live lb), Vessel Trip Report landings (kept; live lb), estimated discards (live lb), associated coefficient of variation (CV), and standard error of the estimated discards (SE; live lb) for 23 individual species that compose the 14 species groups, by fleet, based on July 2015 through June 2016 data. Dark shading indicates fleets not considered or with no Northeast Fisheries Observer Program trips in the annual analysis. These CVs were not used in the annual sample size analysis. Blank CV indicates either no discards estimated or discards equals 0. "P" indicates fleets with "pilot" designation.
Species: ATLANTIC WOLFFISH (Anarhichas lupus) Fleet Row Gear Type Access Trip Region Mesh Area Category Group Total Kept Discarded CV SE Pilot
1 Longline OPEN all MA all 0 0 0
2 Longline OPEN all NE all 6,065 0 6,065 0.803 4,868
3 Hand Line OPEN all MA all 0 0 0 P
4 Hand Line OPEN all NE all 0 0 0
5 Otter Trawl OPEN all MA sm 0 0 0
6 Otter Trawl OPEN all MA lg 0 0 0
7 Otter Trawl OPEN all NE sm 284 0 284 0.477 135
8 Otter Trawl OPEN all NE lg 33,804 0 33,804 0.145 4,917
9 Scallop Trawl AA GEN MA all 0 0 0
11 Scallop Trawl OPEN GEN MA all 0 0 0
12 Scallop Trawl OPEN LIM MA all 0 0 P
13 Otter Trawl, Twin OPEN all MA all 0 0 0 P
14 Otter Trawl, Twin OPEN all NE all 4 0 4 0.861 4 P
16 Otter Trawl, Ruhle OPEN all NE sm 0 0 0 P
17 Otter Trawl, Ruhle OPEN all NE lg 0 0 P
18 Otter Trawl, Haddock Separator OPEN all NE lg 398 0 398 0.688 274
19 Shrimp Trawl OPEN all MA all 0 0 0 P
20 Shrimp Trawl OPEN all NE all 0 0 P
22 Floating Trap OPEN all NE all 0 0 P
23 Sink, Anchor, Drift Gillnet OPEN all MA sm 0 0 0
24 Sink, Anchor, Drift Gillnet OPEN all MA lg 0 0 0
25 Sink, Anchor, Drift Gillnet OPEN all MA xlg 0 0 0
26 Sink, Anchor, Drift Gillnet OPEN all NE sm 0 0 P
27 Sink, Anchor, Drift Gillnet OPEN all NE lg 4,031 0 4,031 0.173 697
28 Sink, Anchor, Drift Gillnet OPEN all NE xlg 1,412 0 1,412 0.767 1,084
29 Purse Seine OPEN all MA all 0 0 P
30 Purse Seine OPEN all NE all 0 0 0

See text for fleet abbreviations. 63
Table 5B, continued. Total catch (live lb), Vessel Trip Report landings (kept; live lb), estimated discards (live lb), associated coefficient of variation (CV), and standard error of the estimated discards (SE; live lb) for 23 individual species that compose the 14 species groups, by fleet, based on July 2015 through June 2016 data. Dark shading indicates fleets not considered or with no Northeast Fisheries Observer Program trips in the annual analysis. These CVs were not used in the annual sample size analysis. Blank CV indicates either no discards estimated or discards equals 0. "P" indicates fleets with "pilot" designation.
Species: ATLANTIC WOLFFISH (Anarhichas lupus) Fleet Row Gear Type Access Trip Region Mesh Area Category Group Total Kept Discarded CV SE Pilot
31 Scallop Dredge AA GEN MA all 0 0 0
32 Scallop Dredge AA GEN NE all 0 0 0
33 Scallop Dredge AA LIM MA all 0 0 0
34 Scallop Dredge AA LIM NE all 0 0 0
35 Scallop Dredge OPEN GEN MA all 0 0 0
36 Scallop Dredge OPEN GEN NE all 0 0 0
37 Scallop Dredge OPEN LIM MA all 0 0 0
38 Scallop Dredge OPEN LIM NE all 3,635 0 3,635 0.345 1,253
39 Danish Seine OPEN all MA all 0 0 P
40 Mid-water Paired & Single Trawl AA all NE all 0 0 0
42 Mid-water Paired & Single Trawl OPEN all NE all 0 0 0
43 Pots and Traps, Fish OPEN all MA all 0 0 0
44 Pots and Traps, Fish OPEN all NE all 0 0 0
45 Pots and Traps, Conch OPEN all MA all 0 0 0
46 Pots and Traps, Conch OPEN all NE all 0 0 0
47 Pots and Traps, Hagfish OPEN all NE all 0 0 P
48 Pots and Traps, Lobster OPEN all MA all 0 0 0
49 Pots and Traps, Lobster OPEN all NE all 4,832 0 4,832 11.311 54,650
50 Pots and Traps, Crab OPEN all MA all 0 0 P
51 Pots and Traps, Crab OPEN all NE all 0 0 P
52 Beam Trawl OPEN all MA all 108 108 P
53 Beam Trawl OPEN all NE all 0 0 P
54 Dredge, Other OPEN all MA all 0 0 P
55 Ocean Quahog/Surfclam Dredge OPEN all MA all 0 0 0
56 Ocean Quahog/Surfclam Dredge OPEN all NE all 0 0 0
Confidential fleets 0 0
Other minor fleets 0 0
TOTAL 54,573 108 54,465 1.012 55,116
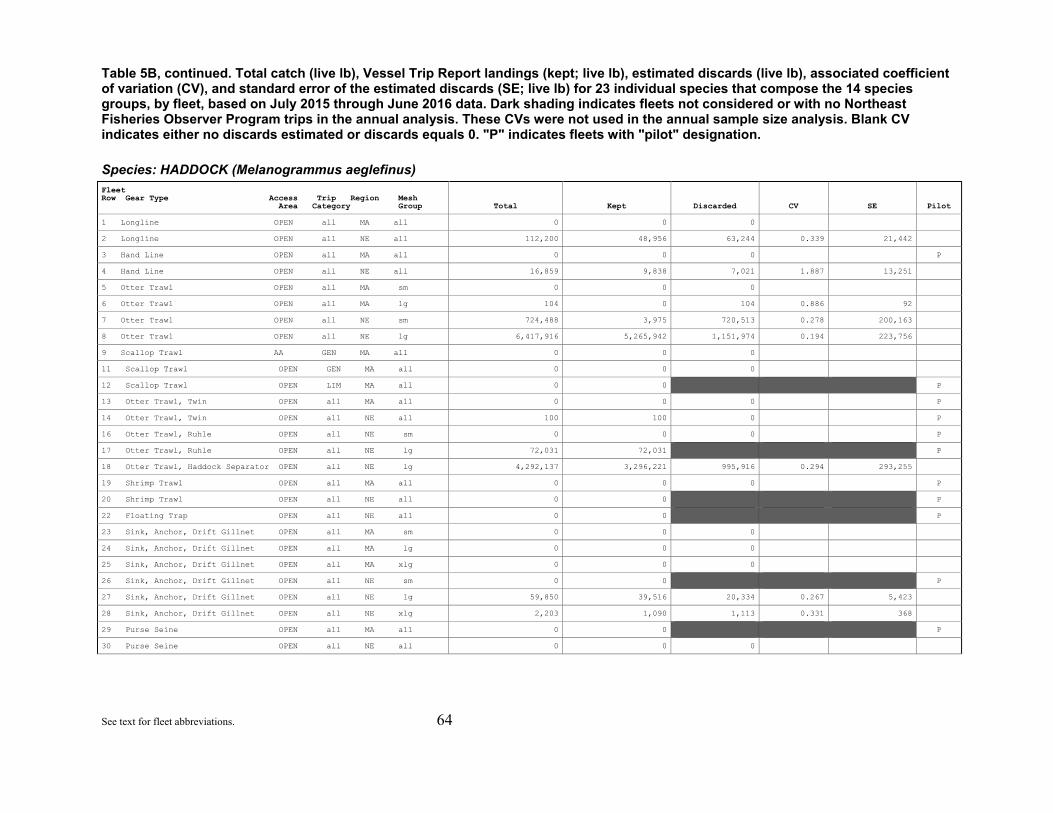
See text for fleet abbreviations. 64
Table 5B, continued. Total catch (live lb), Vessel Trip Report landings (kept; live lb), estimated discards (live lb), associated coefficient of variation (CV), and standard error of the estimated discards (SE; live lb) for 23 individual species that compose the 14 species groups, by fleet, based on July 2015 through June 2016 data. Dark shading indicates fleets not considered or with no Northeast Fisheries Observer Program trips in the annual analysis. These CVs were not used in the annual sample size analysis. Blank CV indicates either no discards estimated or discards equals 0. "P" indicates fleets with "pilot" designation.
Species: HADDOCK (Melanogrammus aeglefinus) Fleet Row Gear Type Access Trip Region Mesh Area Category Group Total Kept Discarded CV SE Pilot
1 Longline OPEN all MA all 0 0 0
2 Longline OPEN all NE all 112,200 48,956 63,244 0.339 21,442
3 Hand Line OPEN all MA all 0 0 0 P
4 Hand Line OPEN all NE all 16,859 9,838 7,021 1.887 13,251
5 Otter Trawl OPEN all MA sm 0 0 0
6 Otter Trawl OPEN all MA lg 104 0 104 0.886 92
7 Otter Trawl OPEN all NE sm 724,488 3,975 720,513 0.278 200,163
8 Otter Trawl OPEN all NE lg 6,417,916 5,265,942 1,151,974 0.194 223,756
9 Scallop Trawl AA GEN MA all 0 0 0
11 Scallop Trawl OPEN GEN MA all 0 0 0
12 Scallop Trawl OPEN LIM MA all 0 0 P
13 Otter Trawl, Twin OPEN all MA all 0 0 0 P
14 Otter Trawl, Twin OPEN all NE all 100 100 0 P
16 Otter Trawl, Ruhle OPEN all NE sm 0 0 0 P
17 Otter Trawl, Ruhle OPEN all NE lg 72,031 72,031 P
18 Otter Trawl, Haddock Separator OPEN all NE lg 4,292,137 3,296,221 995,916 0.294 293,255
19 Shrimp Trawl OPEN all MA all 0 0 0 P
20 Shrimp Trawl OPEN all NE all 0 0 P
22 Floating Trap OPEN all NE all 0 0 P
23 Sink, Anchor, Drift Gillnet OPEN all MA sm 0 0 0
24 Sink, Anchor, Drift Gillnet OPEN all MA lg 0 0 0
25 Sink, Anchor, Drift Gillnet OPEN all MA xlg 0 0 0
26 Sink, Anchor, Drift Gillnet OPEN all NE sm 0 0 P
27 Sink, Anchor, Drift Gillnet OPEN all NE lg 59,850 39,516 20,334 0.267 5,423
28 Sink, Anchor, Drift Gillnet OPEN all NE xlg 2,203 1,090 1,113 0.331 368
29 Purse Seine OPEN all MA all 0 0 P
30 Purse Seine OPEN all NE all 0 0 0

See text for fleet abbreviations. 65
Table 5B, continued. Total catch (live lb), Vessel Trip Report landings (kept; live lb), estimated discards (live lb), associated coefficient of variation (CV), and standard error of the estimated discards (SE; live lb) for 23 individual species that compose the 14 species groups, by fleet, based on July 2015 through June 2016 data. Dark shading indicates fleets not considered or with no Northeast Fisheries Observer Program trips in the annual analysis. These CVs were not used in the annual sample size analysis. Blank CV indicates either no discards estimated or discards equals 0. "P" indicates fleets with "pilot" designation.
Species: HADDOCK (Melanogrammus aeglefinus) Fleet Row Gear Type Access Trip Region Mesh Area Category Group Total Kept Discarded CV SE Pilot
31 Scallop Dredge AA GEN MA all 0 0 0
32 Scallop Dredge AA GEN NE all 156 0 156 0.301 47
33 Scallop Dredge AA LIM MA all 23 0 23 0.891 21
34 Scallop Dredge AA LIM NE all 0 0 0
35 Scallop Dredge OPEN GEN MA all 0 0 0
36 Scallop Dredge OPEN GEN NE all 595 0 595 0.430 256
37 Scallop Dredge OPEN LIM MA all 46 0 46 1.118 51
38 Scallop Dredge OPEN LIM NE all 17,693 0 17,693 0.262 4,639
39 Danish Seine OPEN all MA all 0 0 P
40 Mid-water Paired & Single Trawl AA all NE all 1,907 1,810 97 0.587 57
42 Mid-water Paired & Single Trawl OPEN all NE all 33,646 33,425 221 0.805 178
43 Pots and Traps, Fish OPEN all MA all 0 0 0
44 Pots and Traps, Fish OPEN all NE all 0 0 0
45 Pots and Traps, Conch OPEN all MA all 0 0 0
46 Pots and Traps, Conch OPEN all NE all 0 0 0
47 Pots and Traps, Hagfish OPEN all NE all 0 0 P
48 Pots and Traps, Lobster OPEN all MA all 0 0 0
49 Pots and Traps, Lobster OPEN all NE all 2,634 0 2,634 0.399 1,050
50 Pots and Traps, Crab OPEN all MA all 0 0 P
51 Pots and Traps, Crab OPEN all NE all 0 0 P
52 Beam Trawl OPEN all MA all 0 0 P
53 Beam Trawl OPEN all NE all 0 0 P
54 Dredge, Other OPEN all MA all 0 0 P
55 Ocean Quahog/Surfclam Dredge OPEN all MA all 0 0 0
56 Ocean Quahog/Surfclam Dredge OPEN all NE all 1,978 0 1,978 0.595 1,177
Confidential fleets 0 0
Other minor fleets 0 0
TOTAL 11,756,566 8,772,904 2,983,662 0.141 420,500

See text for fleet abbreviations. 66
Table 5B, continued. Total catch (live lb), Vessel Trip Report landings (kept; live lb), estimated discards (live lb), associated coefficient of variation (CV), and standard error of the estimated discards (SE; live lb) for 23 individual species that compose the 14 species groups, by fleet, based on July 2015 through June 2016 data. Dark shading indicates fleets not considered or with no Northeast Fisheries Observer Program trips in the annual analysis. These CVs were not used in the annual sample size analysis. Blank CV indicates either no discards estimated or discards equals 0. "P" indicates fleets with "pilot" designation.
Species: OCEAN POUT (Zoarces americanus) Fleet Row Gear Type Access Trip Region Mesh Area Category Group Total Kept Discarded CV SE Pilot
1 Longline OPEN all MA all 0 0 0
2 Longline OPEN all NE all 210 0 210 0.897 189
3 Hand Line OPEN all MA all 0 0 0 P
4 Hand Line OPEN all NE all 0 0 0
5 Otter Trawl OPEN all MA sm 14,874 0 14,874 0.445 6,618
6 Otter Trawl OPEN all MA lg 4,888 33 4,855 0.384 1,866
7 Otter Trawl OPEN all NE sm 4,716 0 4,716 0.407 1,918
8 Otter Trawl OPEN all NE lg 86,049 0 86,049 0.279 24,005
9 Scallop Trawl AA GEN MA all 0 0 0
11 Scallop Trawl OPEN GEN MA all 62 0 62 0.445 28
12 Scallop Trawl OPEN LIM MA all 0 0 P
13 Otter Trawl, Twin OPEN all MA all 0 0 0 P
14 Otter Trawl, Twin OPEN all NE all 0 0 0 P
16 Otter Trawl, Ruhle OPEN all NE sm 0 0 0 P
17 Otter Trawl, Ruhle OPEN all NE lg 0 0 P
18 Otter Trawl, Haddock Separator OPEN all NE lg 992 0 992 0.603 599
19 Shrimp Trawl OPEN all MA all 0 0 0 P
20 Shrimp Trawl OPEN all NE all 0 0 P
22 Floating Trap OPEN all NE all 0 0 P
23 Sink, Anchor, Drift Gillnet OPEN all MA sm 0 0 0
24 Sink, Anchor, Drift Gillnet OPEN all MA lg 0 0 0
25 Sink, Anchor, Drift Gillnet OPEN all MA xlg 0 0 0
26 Sink, Anchor, Drift Gillnet OPEN all NE sm 0 0 P
27 Sink, Anchor, Drift Gillnet OPEN all NE lg 82 0 82 0.391 32
28 Sink, Anchor, Drift Gillnet OPEN all NE xlg 16 0 16 0.557 9
29 Purse Seine OPEN all MA all 0 0 P
30 Purse Seine OPEN all NE all 0 0 0

See text for fleet abbreviations. 67
Table 5B, continued. Total catch (live lb), Vessel Trip Report landings (kept; live lb), estimated discards (live lb), associated coefficient of variation (CV), and standard error of the estimated discards (SE; live lb) for 23 individual species that compose the 14 species groups, by fleet, based on July 2015 through June 2016 data. Dark shading indicates fleets not considered or with no Northeast Fisheries Observer Program trips in the annual analysis. These CVs were not used in the annual sample size analysis. Blank CV indicates either no discards estimated or discards equals 0. "P" indicates fleets with "pilot" designation.
Species: OCEAN POUT (Zoarces americanus) Fleet Row Gear Type Access Trip Region Mesh Area Category Group Total Kept Discarded CV SE Pilot
31 Scallop Dredge AA GEN MA all 0 0 0
32 Scallop Dredge AA GEN NE all 64 0 64 0.700 45
33 Scallop Dredge AA LIM MA all 0 0 0
34 Scallop Dredge AA LIM NE all 7 0 7 0.975 7
35 Scallop Dredge OPEN GEN MA all 234 0 234 0.581 136
36 Scallop Dredge OPEN GEN NE all 61 0 61 0.457 28
37 Scallop Dredge OPEN LIM MA all 105 0 105 0.500 53
38 Scallop Dredge OPEN LIM NE all 3,479 0 3,479 0.211 732
39 Danish Seine OPEN all MA all 0 0 P
40 Mid-water Paired & Single Trawl AA all NE all 0 0 0
42 Mid-water Paired & Single Trawl OPEN all NE all 0 0 0
43 Pots and Traps, Fish OPEN all MA all 0 0 0
44 Pots and Traps, Fish OPEN all NE all 0 0 0
45 Pots and Traps, Conch OPEN all MA all 0 0 0
46 Pots and Traps, Conch OPEN all NE all 0 0 0
47 Pots and Traps, Hagfish OPEN all NE all 0 0 P
48 Pots and Traps, Lobster OPEN all MA all 2,456 0 2,456 0.437 1,073
49 Pots and Traps, Lobster OPEN all NE all 19,263 107 19,156 0.285 5,460
50 Pots and Traps, Crab OPEN all MA all 0 0 P
51 Pots and Traps, Crab OPEN all NE all 0 0 P
52 Beam Trawl OPEN all MA all 0 0 P
53 Beam Trawl OPEN all NE all 0 0 P
54 Dredge, Other OPEN all MA all 0 0 P
55 Ocean Quahog/Surfclam Dredge OPEN all MA all 606 0 606 0.748 454
56 Ocean Quahog/Surfclam Dredge OPEN all NE all 379 0 379 0.734 278
Confidential fleets 0 0
Other minor fleets 0 0
TOTAL 138,545 140 138,405 0.186 25,679

See text for fleet abbreviations. 68
Table 5B, continued. Total catch (live lb), Vessel Trip Report landings (kept; live lb), estimated discards (live lb), associated coefficient of variation (CV), and standard error of the estimated discards (SE; live lb) for 23 individual species that compose the 14 species groups, by fleet, based on July 2015 through June 2016 data. Dark shading indicates fleets not considered or with no Northeast Fisheries Observer Program trips in the annual analysis. These CVs were not used in the annual sample size analysis. Blank CV indicates either no discards estimated or discards equals 0. "P" indicates fleets with "pilot" designation.
Species: POLLOCK (Pollachius virens) Fleet Row Gear Type Access Trip Region Mesh Area Category Group Total Kept Discarded CV SE Pilot
1 Longline OPEN all MA all 0 0 0
2 Longline OPEN all NE all 5,085 177 4,908 0.484 2,376
3 Hand Line OPEN all MA all 32 32 0 P
4 Hand Line OPEN all NE all 154,403 123,044 31,359 0.595 18,658
5 Otter Trawl OPEN all MA sm 1,563 0 1,563 1.063 1,661
6 Otter Trawl OPEN all MA lg 0 0 0
7 Otter Trawl OPEN all NE sm 14,911 50 14,861 0.425 6,313
8 Otter Trawl OPEN all NE lg 3,545,494 3,484,669 60,825 0.286 17,416
9 Scallop Trawl AA GEN MA all 0 0 0
11 Scallop Trawl OPEN GEN MA all 0 0 0
12 Scallop Trawl OPEN LIM MA all 0 0 P
13 Otter Trawl, Twin OPEN all MA all 0 0 0 P
14 Otter Trawl, Twin OPEN all NE all 250 250 0 P
16 Otter Trawl, Ruhle OPEN all NE sm 0 0 0 P
17 Otter Trawl, Ruhle OPEN all NE lg 189 189 P
18 Otter Trawl, Haddock Separator OPEN all NE lg 169,418 165,406 4,012 0.805 3,231
19 Shrimp Trawl OPEN all MA all 0 0 0 P
20 Shrimp Trawl OPEN all NE all 0 0 P
22 Floating Trap OPEN all NE all 0 0 P
23 Sink, Anchor, Drift Gillnet OPEN all MA sm 35 0 35 0.819 29
24 Sink, Anchor, Drift Gillnet OPEN all MA lg 72 12 60 1.083 65
25 Sink, Anchor, Drift Gillnet OPEN all MA xlg 20 0 20 0.965 19
26 Sink, Anchor, Drift Gillnet OPEN all NE sm 500 500 P
27 Sink, Anchor, Drift Gillnet OPEN all NE lg 1,559,147 1,485,320 73,827 0.193 14,263
28 Sink, Anchor, Drift Gillnet OPEN all NE xlg 36,830 21,892 14,938 0.208 3,104
29 Purse Seine OPEN all MA all 0 0 P
30 Purse Seine OPEN all NE all 0 0 0

See text for fleet abbreviations. 69
Table 5B, continued. Total catch (live lb), Vessel Trip Report landings (kept; live lb), estimated discards (live lb), associated coefficient of variation (CV), and standard error of the estimated discards (SE; live lb) for 23 individual species that compose the 14 species groups, by fleet, based on July 2015 through June 2016 data. Dark shading indicates fleets not considered or with no Northeast Fisheries Observer Program trips in the annual analysis. These CVs were not used in the annual sample size analysis. Blank CV indicates either no discards estimated or discards equals 0. "P" indicates fleets with "pilot" designation.
Species: POLLOCK (Pollachius virens) Fleet Row Gear Type Access Trip Region Mesh Area Category Group Total Kept Discarded CV SE Pilot
31 Scallop Dredge AA GEN MA all 0 0 0
32 Scallop Dredge AA GEN NE all 0 0 0
33 Scallop Dredge AA LIM MA all 0 0 0
34 Scallop Dredge AA LIM NE all 0 0 0
35 Scallop Dredge OPEN GEN MA all 0 0 0
36 Scallop Dredge OPEN GEN NE all 73 0 73 0.944 69
37 Scallop Dredge OPEN LIM MA all 0 0 0
38 Scallop Dredge OPEN LIM NE all 37 0 37 0.922 34
39 Danish Seine OPEN all MA all 0 0 P
40 Mid-water Paired & Single Trawl AA all NE all 461 0 461 0.616 284
42 Mid-water Paired & Single Trawl OPEN all NE all 0 0 0
43 Pots and Traps, Fish OPEN all MA all 5 5 0
44 Pots and Traps, Fish OPEN all NE all 0 0 0
45 Pots and Traps, Conch OPEN all MA all 0 0 0
46 Pots and Traps, Conch OPEN all NE all 0 0 0
47 Pots and Traps, Hagfish OPEN all NE all 0 0 P
48 Pots and Traps, Lobster OPEN all MA all 2 2 0
49 Pots and Traps, Lobster OPEN all NE all 172 0 172 0.379 65
50 Pots and Traps, Crab OPEN all MA all 0 0 P
51 Pots and Traps, Crab OPEN all NE all 0 0 P
52 Beam Trawl OPEN all MA all 0 0 P
53 Beam Trawl OPEN all NE all 0 0 P
54 Dredge, Other OPEN all MA all 0 0 P
55 Ocean Quahog/Surfclam Dredge OPEN all MA all 0 0 0
56 Ocean Quahog/Surfclam Dredge OPEN all NE all 0 0 0
Confidential fleets 0 0
Other minor fleets 0 0
TOTAL 5,488,700 5,281,548 207,152 0.147 30,386

See text for fleet abbreviations. 70
Table 5B, continued. Total catch (live lb), Vessel Trip Report landings (kept; live lb), estimated discards (live lb), associated coefficient of variation (CV), and standard error of the estimated discards (SE; live lb) for 23 individual species that compose the 14 species groups, by fleet, based on July 2015 through June 2016 data. Dark shading indicates fleets not considered or with no Northeast Fisheries Observer Program trips in the annual analysis. These CVs were not used in the annual sample size analysis. Blank CV indicates either no discards estimated or discards equals 0. "P" indicates fleets with "pilot" designation.
Species: REDFISH (Sebastes fasciatus) Fleet Row Gear Type Access Trip Region Mesh Area Category Group Total Kept Discarded CV SE Pilot
1 Longline OPEN all MA all 2 2 0
2 Longline OPEN all NE all 48 48 0
3 Hand Line OPEN all MA all 0 0 0 P
4 Hand Line OPEN all NE all 563 512 51 0.645 33
5 Otter Trawl OPEN all MA sm 400 42 358 0.564 202
6 Otter Trawl OPEN all MA lg 762 0 762 0.892 679
7 Otter Trawl OPEN all NE sm 21,507 7 21,500 0.571 12,277
8 Otter Trawl OPEN all NE lg 9,714,741 9,631,193 83,548 0.134 11,203
9 Scallop Trawl AA GEN MA all 0 0 0
11 Scallop Trawl OPEN GEN MA all 0 0 0
12 Scallop Trawl OPEN LIM MA all 0 0 P
13 Otter Trawl, Twin OPEN all MA all 0 0 0 P
14 Otter Trawl, Twin OPEN all NE all 27,200 27,200 0 P
16 Otter Trawl, Ruhle OPEN all NE sm 0 0 0 P
17 Otter Trawl, Ruhle OPEN all NE lg 0 0 P
18 Otter Trawl, Haddock Separator OPEN all NE lg 131,848 124,630 7,218 0.666 4,807
19 Shrimp Trawl OPEN all MA all 0 0 0 P
20 Shrimp Trawl OPEN all NE all 0 0 P
22 Floating Trap OPEN all NE all 0 0 P
23 Sink, Anchor, Drift Gillnet OPEN all MA sm 0 0 0
24 Sink, Anchor, Drift Gillnet OPEN all MA lg 2 2 0
25 Sink, Anchor, Drift Gillnet OPEN all MA xlg 0 0 0
26 Sink, Anchor, Drift Gillnet OPEN all NE sm 0 0 P
27 Sink, Anchor, Drift Gillnet OPEN all NE lg 85,494 82,561 2,933 0.348 1,021
28 Sink, Anchor, Drift Gillnet OPEN all NE xlg 2,147 2,016 131 1.133 148
29 Purse Seine OPEN all MA all 0 0 P
30 Purse Seine OPEN all NE all 0 0 0

See text for fleet abbreviations. 71
Table 5B, continued. Total catch (live lb), Vessel Trip Report landings (kept; live lb), estimated discards (live lb), associated coefficient of variation (CV), and standard error of the estimated discards (SE; live lb) for 23 individual species that compose the 14 species groups, by fleet, based on July 2015 through June 2016 data. Dark shading indicates fleets not considered or with no Northeast Fisheries Observer Program trips in the annual analysis. These CVs were not used in the annual sample size analysis. Blank CV indicates either no discards estimated or discards equals 0. "P" indicates fleets with "pilot" designation.
Species: REDFISH (Sebastes fasciatus) Fleet Row Gear Type Access Trip Region Mesh Area Category Group Total Kept Discarded CV SE Pilot
31 Scallop Dredge AA GEN MA all 0 0 0
32 Scallop Dredge AA GEN NE all 0 0 0
33 Scallop Dredge AA LIM MA all 0 0 0
34 Scallop Dredge AA LIM NE all 48 0 48 0.838 40
35 Scallop Dredge OPEN GEN MA all 0 0 0
36 Scallop Dredge OPEN GEN NE all 0 0 0
37 Scallop Dredge OPEN LIM MA all 0 0 0
38 Scallop Dredge OPEN LIM NE all 10 0 10 0.922 10
39 Danish Seine OPEN all MA all 0 0 P
40 Mid-water Paired & Single Trawl AA all NE all 701 655 46 0.419 19
42 Mid-water Paired & Single Trawl OPEN all NE all 20 20 0
43 Pots and Traps, Fish OPEN all MA all 0 0 0
44 Pots and Traps, Fish OPEN all NE all 0 0 0
45 Pots and Traps, Conch OPEN all MA all 0 0 0
46 Pots and Traps, Conch OPEN all NE all 0 0 0
47 Pots and Traps, Hagfish OPEN all NE all 0 0 P
48 Pots and Traps, Lobster OPEN all MA all 0 0 0
49 Pots and Traps, Lobster OPEN all NE all 960 0 960 5.761 5,533
50 Pots and Traps, Crab OPEN all MA all 0 0 P
51 Pots and Traps, Crab OPEN all NE all 0 0 P
52 Beam Trawl OPEN all MA all 0 0 P
53 Beam Trawl OPEN all NE all 0 0 P
54 Dredge, Other OPEN all MA all 0 0 P
55 Ocean Quahog/Surfclam Dredge OPEN all MA all 0 0 0
56 Ocean Quahog/Surfclam Dredge OPEN all NE all 0 0 0
Confidential fleets 0 0
Other minor fleets 0 0
TOTAL 9,986,454 9,868,888 117,566 0.155 18,208

See text for fleet abbreviations. 72
Table 5B, continued. Total catch (live lb), Vessel Trip Report landings (kept; live lb), estimated discards (live lb), associated coefficient of variation (CV), and standard error of the estimated discards (SE; live lb) for 23 individual species that compose the 14 species groups, by fleet, based on July 2015 through June 2016 data. Dark shading indicates fleets not considered or with no Northeast Fisheries Observer Program trips in the annual analysis. These CVs were not used in the annual sample size analysis. Blank CV indicates either no discards estimated or discards equals 0. "P" indicates fleets with "pilot" designation.
Species: WHITE HAKE (Urophycis tenuis) Fleet Row Gear Type Access Trip Region Mesh Area Category Group Total Kept Discarded CV SE Pilot
1 Longline OPEN all MA all 27 27 0
2 Longline OPEN all NE all 4 4 0
3 Hand Line OPEN all MA all 103 103 0 P
4 Hand Line OPEN all NE all 562 562 0
5 Otter Trawl OPEN all MA sm 9,105 225 8,880 0.773 6,861
6 Otter Trawl OPEN all MA lg 5,417 97 5,320 0.550 2,928
7 Otter Trawl OPEN all NE sm 1,730 85 1,645 0.459 755
8 Otter Trawl OPEN all NE lg 2,106,956 2,097,510 9,446 0.299 2,824
9 Scallop Trawl AA GEN MA all 0 0 0
11 Scallop Trawl OPEN GEN MA all <1 0 <1 0.471 <1
12 Scallop Trawl OPEN LIM MA all 0 0 P
13 Otter Trawl, Twin OPEN all MA all 0 0 0 P
14 Otter Trawl, Twin OPEN all NE all 200 200 0 P
16 Otter Trawl, Ruhle OPEN all NE sm 0 0 0 P
17 Otter Trawl, Ruhle OPEN all NE lg 9 9 P
18 Otter Trawl, Haddock Separator OPEN all NE lg 22,155 22,078 77 0.528 41
19 Shrimp Trawl OPEN all MA all 0 0 0 P
20 Shrimp Trawl OPEN all NE all 0 0 P
22 Floating Trap OPEN all NE all 0 0 P
23 Sink, Anchor, Drift Gillnet OPEN all MA sm 0 0 0
24 Sink, Anchor, Drift Gillnet OPEN all MA lg 30 30 0
25 Sink, Anchor, Drift Gillnet OPEN all MA xlg 0 0 0
26 Sink, Anchor, Drift Gillnet OPEN all NE sm 40 40 P
27 Sink, Anchor, Drift Gillnet OPEN all NE lg 350,137 334,810 15,327 0.216 3,306
28 Sink, Anchor, Drift Gillnet OPEN all NE xlg 6,138 5,736 402 0.396 159
29 Purse Seine OPEN all MA all 0 0 P
30 Purse Seine OPEN all NE all 0 0 0

See text for fleet abbreviations. 73
Table 5B, continued. Total catch (live lb), Vessel Trip Report landings (kept; live lb), estimated discards (live lb), associated coefficient of variation (CV), and standard error of the estimated discards (SE; live lb) for 23 individual species that compose the 14 species groups, by fleet, based on July 2015 through June 2016 data. Dark shading indicates fleets not considered or with no Northeast Fisheries Observer Program trips in the annual analysis. These CVs were not used in the annual sample size analysis. Blank CV indicates either no discards estimated or discards equals 0. "P" indicates fleets with "pilot" designation.
Species: WHITE HAKE (Urophycis tenuis) Fleet Row Gear Type Access Trip Region Mesh Area Category Group Total Kept Discarded CV SE Pilot
31 Scallop Dredge AA GEN MA all 0 0 0
32 Scallop Dredge AA GEN NE all 0 0 0
33 Scallop Dredge AA LIM MA all 27 0 27 0.556 15
34 Scallop Dredge AA LIM NE all 77 0 77 0.907 69
35 Scallop Dredge OPEN GEN MA all 0 0 0
36 Scallop Dredge OPEN GEN NE all 203 0 203 0.895 182
37 Scallop Dredge OPEN LIM MA all 556 0 556 0.768 427
38 Scallop Dredge OPEN LIM NE all 1,365 0 1,365 0.287 392
39 Danish Seine OPEN all MA all 0 0 P
40 Mid-water Paired & Single Trawl AA all NE all 0 0 0
42 Mid-water Paired & Single Trawl OPEN all NE all 0 0 0
43 Pots and Traps, Fish OPEN all MA all 2 2 0
44 Pots and Traps, Fish OPEN all NE all 0 0 0
45 Pots and Traps, Conch OPEN all MA all 0 0 0
46 Pots and Traps, Conch OPEN all NE all 0 0 0
47 Pots and Traps, Hagfish OPEN all NE all 0 0 P
48 Pots and Traps, Lobster OPEN all MA all 0 0 0
49 Pots and Traps, Lobster OPEN all NE all 25,041 0 25,041 0.339 8,482
50 Pots and Traps, Crab OPEN all MA all 0 0 P
51 Pots and Traps, Crab OPEN all NE all 0 0 P
52 Beam Trawl OPEN all MA all 0 0 P
53 Beam Trawl OPEN all NE all 0 0 P
54 Dredge, Other OPEN all MA all 0 0 P
55 Ocean Quahog/Surfclam Dredge OPEN all MA all 0 0 0
56 Ocean Quahog/Surfclam Dredge OPEN all NE all 0 0 0
Confidential fleets 0 0
Other minor fleets 0 0
TOTAL 2,529,884 2,461,518 68,366 0.178 12,144
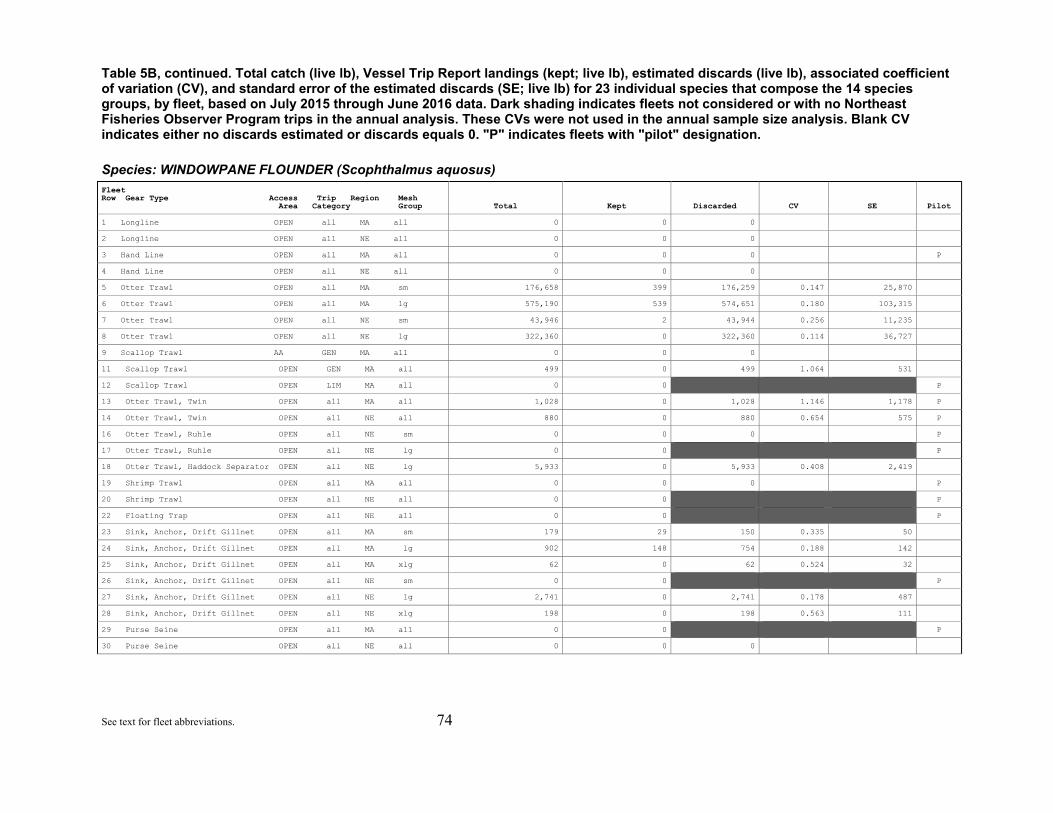
See text for fleet abbreviations. 74
Table 5B, continued. Total catch (live lb), Vessel Trip Report landings (kept; live lb), estimated discards (live lb), associated coefficient of variation (CV), and standard error of the estimated discards (SE; live lb) for 23 individual species that compose the 14 species groups, by fleet, based on July 2015 through June 2016 data. Dark shading indicates fleets not considered or with no Northeast Fisheries Observer Program trips in the annual analysis. These CVs were not used in the annual sample size analysis. Blank CV indicates either no discards estimated or discards equals 0. "P" indicates fleets with "pilot" designation.
Species: WINDOWPANE FLOUNDER (Scophthalmus aquosus) Fleet Row Gear Type Access Trip Region Mesh Area Category Group Total Kept Discarded CV SE Pilot
1 Longline OPEN all MA all 0 0 0
2 Longline OPEN all NE all 0 0 0
3 Hand Line OPEN all MA all 0 0 0 P
4 Hand Line OPEN all NE all 0 0 0
5 Otter Trawl OPEN all MA sm 176,658 399 176,259 0.147 25,870
6 Otter Trawl OPEN all MA lg 575,190 539 574,651 0.180 103,315
7 Otter Trawl OPEN all NE sm 43,946 2 43,944 0.256 11,235
8 Otter Trawl OPEN all NE lg 322,360 0 322,360 0.114 36,727
9 Scallop Trawl AA GEN MA all 0 0 0
11 Scallop Trawl OPEN GEN MA all 499 0 499 1.064 531
12 Scallop Trawl OPEN LIM MA all 0 0 P
13 Otter Trawl, Twin OPEN all MA all 1,028 0 1,028 1.146 1,178 P
14 Otter Trawl, Twin OPEN all NE all 880 0 880 0.654 575 P
16 Otter Trawl, Ruhle OPEN all NE sm 0 0 0 P
17 Otter Trawl, Ruhle OPEN all NE lg 0 0 P
18 Otter Trawl, Haddock Separator OPEN all NE lg 5,933 0 5,933 0.408 2,419
19 Shrimp Trawl OPEN all MA all 0 0 0 P
20 Shrimp Trawl OPEN all NE all 0 0 P
22 Floating Trap OPEN all NE all 0 0 P
23 Sink, Anchor, Drift Gillnet OPEN all MA sm 179 29 150 0.335 50
24 Sink, Anchor, Drift Gillnet OPEN all MA lg 902 148 754 0.188 142
25 Sink, Anchor, Drift Gillnet OPEN all MA xlg 62 0 62 0.524 32
26 Sink, Anchor, Drift Gillnet OPEN all NE sm 0 0 P
27 Sink, Anchor, Drift Gillnet OPEN all NE lg 2,741 0 2,741 0.178 487
28 Sink, Anchor, Drift Gillnet OPEN all NE xlg 198 0 198 0.563 111
29 Purse Seine OPEN all MA all 0 0 P
30 Purse Seine OPEN all NE all 0 0 0
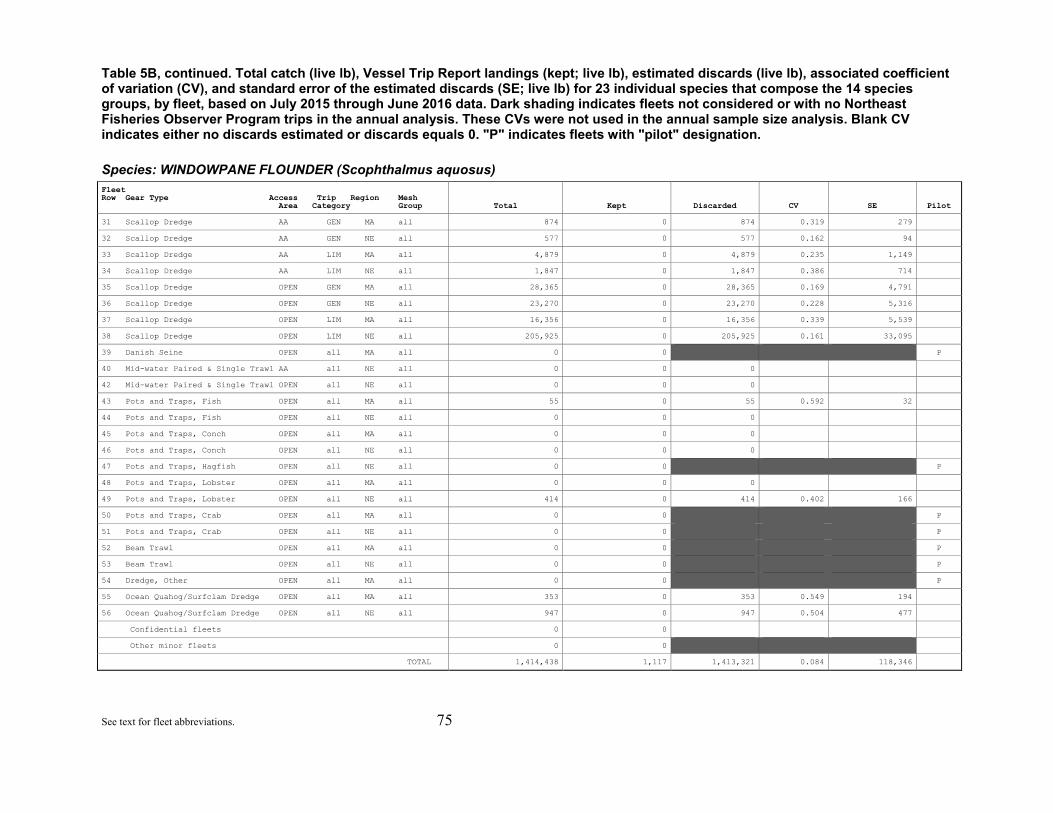
See text for fleet abbreviations. 75
Table 5B, continued. Total catch (live lb), Vessel Trip Report landings (kept; live lb), estimated discards (live lb), associated coefficient of variation (CV), and standard error of the estimated discards (SE; live lb) for 23 individual species that compose the 14 species groups, by fleet, based on July 2015 through June 2016 data. Dark shading indicates fleets not considered or with no Northeast Fisheries Observer Program trips in the annual analysis. These CVs were not used in the annual sample size analysis. Blank CV indicates either no discards estimated or discards equals 0. "P" indicates fleets with "pilot" designation.
Species: WINDOWPANE FLOUNDER (Scophthalmus aquosus) Fleet Row Gear Type Access Trip Region Mesh Area Category Group Total Kept Discarded CV SE Pilot
31 Scallop Dredge AA GEN MA all 874 0 874 0.319 279
32 Scallop Dredge AA GEN NE all 577 0 577 0.162 94
33 Scallop Dredge AA LIM MA all 4,879 0 4,879 0.235 1,149
34 Scallop Dredge AA LIM NE all 1,847 0 1,847 0.386 714
35 Scallop Dredge OPEN GEN MA all 28,365 0 28,365 0.169 4,791
36 Scallop Dredge OPEN GEN NE all 23,270 0 23,270 0.228 5,316
37 Scallop Dredge OPEN LIM MA all 16,356 0 16,356 0.339 5,539
38 Scallop Dredge OPEN LIM NE all 205,925 0 205,925 0.161 33,095
39 Danish Seine OPEN all MA all 0 0 P
40 Mid-water Paired & Single Trawl AA all NE all 0 0 0
42 Mid-water Paired & Single Trawl OPEN all NE all 0 0 0
43 Pots and Traps, Fish OPEN all MA all 55 0 55 0.592 32
44 Pots and Traps, Fish OPEN all NE all 0 0 0
45 Pots and Traps, Conch OPEN all MA all 0 0 0
46 Pots and Traps, Conch OPEN all NE all 0 0 0
47 Pots and Traps, Hagfish OPEN all NE all 0 0 P
48 Pots and Traps, Lobster OPEN all MA all 0 0 0
49 Pots and Traps, Lobster OPEN all NE all 414 0 414 0.402 166
50 Pots and Traps, Crab OPEN all MA all 0 0 P
51 Pots and Traps, Crab OPEN all NE all 0 0 P
52 Beam Trawl OPEN all MA all 0 0 P
53 Beam Trawl OPEN all NE all 0 0 P
54 Dredge, Other OPEN all MA all 0 0 P
55 Ocean Quahog/Surfclam Dredge OPEN all MA all 353 0 353 0.549 194
56 Ocean Quahog/Surfclam Dredge OPEN all NE all 947 0 947 0.504 477
Confidential fleets 0 0
Other minor fleets 0 0
TOTAL 1,414,438 1,117 1,413,321 0.084 118,346

See text for fleet abbreviations. 76
Table 5B, continued. Total catch (live lb), Vessel Trip Report landings (kept; live lb), estimated discards (live lb), associated coefficient of variation (CV), and standard error of the estimated discards (SE; live lb) for 23 individual species that compose the 14 species groups, by fleet, based on July 2015 through June 2016 data. Dark shading indicates fleets not considered or with no Northeast Fisheries Observer Program trips in the annual analysis. These CVs were not used in the annual sample size analysis. Blank CV indicates either no discards estimated or discards equals 0. "P" indicates fleets with "pilot" designation.
Species: WINTER FLOUNDER (Pseudopleuronectes americanus) Fleet Row Gear Type Access Trip Region Mesh Area Category Group Total Kept Discarded CV SE Pilot
1 Longline OPEN all MA all 0 0 0
2 Longline OPEN all NE all 105 105 0
3 Hand Line OPEN all MA all 6 6 0 P
4 Hand Line OPEN all NE all 125 125 0
5 Otter Trawl OPEN all MA sm 101,289 1,609 99,680 0.160 15,989
6 Otter Trawl OPEN all MA lg 284,447 233,783 50,664 0.212 10,732
7 Otter Trawl OPEN all NE sm 78,973 7,896 71,077 0.213 15,124
8 Otter Trawl OPEN all NE lg 2,440,374 2,393,219 47,155 0.153 7,223
9 Scallop Trawl AA GEN MA all 0 0 0
11 Scallop Trawl OPEN GEN MA all 169 0 169 1.010 171
12 Scallop Trawl OPEN LIM MA all 0 0 P
13 Otter Trawl, Twin OPEN all MA all 2,188 2,110 78 1.261 98 P
14 Otter Trawl, Twin OPEN all NE all 220 0 220 0.671 148 P
16 Otter Trawl, Ruhle OPEN all NE sm 0 0 0 P
17 Otter Trawl, Ruhle OPEN all NE lg 44 44 P
18 Otter Trawl, Haddock Separator OPEN all NE lg 143,737 143,652 85 0.553 47
19 Shrimp Trawl OPEN all MA all 0 0 0 P
20 Shrimp Trawl OPEN all NE all 0 0 P
22 Floating Trap OPEN all NE all 0 0 P
23 Sink, Anchor, Drift Gillnet OPEN all MA sm 0 0 0
24 Sink, Anchor, Drift Gillnet OPEN all MA lg 184 159 25 0.701 17
25 Sink, Anchor, Drift Gillnet OPEN all MA xlg 640 640 0
26 Sink, Anchor, Drift Gillnet OPEN all NE sm 0 0 P
27 Sink, Anchor, Drift Gillnet OPEN all NE lg 31,332 30,174 1,158 0.238 275
28 Sink, Anchor, Drift Gillnet OPEN all NE xlg 2,873 2,735 138 0.512 71
29 Purse Seine OPEN all MA all 0 0 P
30 Purse Seine OPEN all NE all 0 0 0

See text for fleet abbreviations. 77
Table 5B, continued. Total catch (live lb), Vessel Trip Report landings (kept; live lb), estimated discards (live lb), associated coefficient of variation (CV), and standard error of the estimated discards (SE; live lb) for 23 individual species that compose the 14 species groups, by fleet, based on July 2015 through June 2016 data. Dark shading indicates fleets not considered or with no Northeast Fisheries Observer Program trips in the annual analysis. These CVs were not used in the annual sample size analysis. Blank CV indicates either no discards estimated or discards equals 0. "P" indicates fleets with "pilot" designation.
Species: WINTER FLOUNDER (Pseudopleuronectes americanus) Fleet Row Gear Type Access Trip Region Mesh Area Category Group Total Kept Discarded CV SE Pilot
31 Scallop Dredge AA GEN MA all 0 0 0
32 Scallop Dredge AA GEN NE all 861 0 861 0.193 166
33 Scallop Dredge AA LIM MA all 71 0 71 0.681 49
34 Scallop Dredge AA LIM NE all 0 0 0
35 Scallop Dredge OPEN GEN MA all 4,339 0 4,339 0.478 2,074
36 Scallop Dredge OPEN GEN NE all 20,225 0 20,225 0.179 3,611
37 Scallop Dredge OPEN LIM MA all 4,180 94 4,086 0.189 773
38 Scallop Dredge OPEN LIM NE all 229,166 1,400 227,766 0.160 36,332
39 Danish Seine OPEN all MA all 0 0 P
40 Mid-water Paired & Single Trawl AA all NE all 0 0 0
42 Mid-water Paired & Single Trawl OPEN all NE all 0 0 0
43 Pots and Traps, Fish OPEN all MA all 0 0 0
44 Pots and Traps, Fish OPEN all NE all 218 218 0
45 Pots and Traps, Conch OPEN all MA all 0 0 0
46 Pots and Traps, Conch OPEN all NE all 0 0 0
47 Pots and Traps, Hagfish OPEN all NE all 0 0 P
48 Pots and Traps, Lobster OPEN all MA all 58 0 58 0.508 30
49 Pots and Traps, Lobster OPEN all NE all 601 14 587 0.361 212
50 Pots and Traps, Crab OPEN all MA all 0 0 P
51 Pots and Traps, Crab OPEN all NE all 0 0 P
52 Beam Trawl OPEN all MA all 0 0 P
53 Beam Trawl OPEN all NE all 0 0 P
54 Dredge, Other OPEN all MA all 0 0 P
55 Ocean Quahog/Surfclam Dredge OPEN all MA all 278 0 278 1.028 286
56 Ocean Quahog/Surfclam Dredge OPEN all NE all 3,274 0 3,274 0.463 1,516
Confidential fleets 0 0
Other minor fleets 0 0
TOTAL 3,349,975 2,817,983 531,992 0.084 44,635

See text for fleet abbreviations. 78
Table 5B, continued. Total catch (live lb), Vessel Trip Report landings (kept; live lb), estimated discards (live lb), associated coefficient of variation (CV), and standard error of the estimated discards (SE; live lb) for 23 individual species that compose the 14 species groups, by fleet, based on July 2015 through June 2016 data. Dark shading indicates fleets not considered or with no Northeast Fisheries Observer Program trips in the annual analysis. These CVs were not used in the annual sample size analysis. Blank CV indicates either no discards estimated or discards equals 0. "P" indicates fleets with "pilot" designation.
Species: WITCH FLOUNDER (Glyptocephalus cynoglossus) Fleet Row Gear Type Access Trip Region Mesh Area Category Group Total Kept Discarded CV SE Pilot
1 Longline OPEN all MA all 0 0 0
2 Longline OPEN all NE all 0 0 0
3 Hand Line OPEN all MA all 0 0 0 P
4 Hand Line OPEN all NE all 0 0 0
5 Otter Trawl OPEN all MA sm 24,489 0 24,489 0.253 6,185
6 Otter Trawl OPEN all MA lg 14,069 1,868 12,201 0.264 3,218
7 Otter Trawl OPEN all NE sm 25,506 65 25,441 0.284 7,229
8 Otter Trawl OPEN all NE lg 1,000,841 912,230 88,611 0.108 9,537
9 Scallop Trawl AA GEN MA all 211 0 211 0.928 196
11 Scallop Trawl OPEN GEN MA all 46 0 46 1.164 53
12 Scallop Trawl OPEN LIM MA all 0 0 P
13 Otter Trawl, Twin OPEN all MA all 503 0 503 0.112 56 P
14 Otter Trawl, Twin OPEN all NE all 56 20 36 0.861 31 P
16 Otter Trawl, Ruhle OPEN all NE sm 0 0 0 P
17 Otter Trawl, Ruhle OPEN all NE lg 227 227 P
18 Otter Trawl, Haddock Separator OPEN all NE lg 16,634 15,197 1,437 0.370 532
19 Shrimp Trawl OPEN all MA all 5,479 0 5,479 0.000 0 P
20 Shrimp Trawl OPEN all NE all 0 0 P
22 Floating Trap OPEN all NE all 0 0 P
23 Sink, Anchor, Drift Gillnet OPEN all MA sm 0 0 0
24 Sink, Anchor, Drift Gillnet OPEN all MA lg 119 0 119 0.650 77
25 Sink, Anchor, Drift Gillnet OPEN all MA xlg 9 0 9 0.965 8
26 Sink, Anchor, Drift Gillnet OPEN all NE sm 1 1 P
27 Sink, Anchor, Drift Gillnet OPEN all NE lg 2,072 1,927 145 0.275 40
28 Sink, Anchor, Drift Gillnet OPEN all NE xlg 210 210 0
29 Purse Seine OPEN all MA all 0 0 P
30 Purse Seine OPEN all NE all 0 0 0

See text for fleet abbreviations. 79
Table 5B, continued. Total catch (live lb), Vessel Trip Report landings (kept; live lb), estimated discards (live lb), associated coefficient of variation (CV), and standard error of the estimated discards (SE; live lb) for 23 individual species that compose the 14 species groups, by fleet, based on July 2015 through June 2016 data. Dark shading indicates fleets not considered or with no Northeast Fisheries Observer Program trips in the annual analysis. These CVs were not used in the annual sample size analysis. Blank CV indicates either no discards estimated or discards equals 0. "P" indicates fleets with "pilot" designation.
Species: WITCH FLOUNDER (Glyptocephalus cynoglossus) Fleet Row Gear Type Access Trip Region Mesh Area Category Group Total Kept Discarded CV SE Pilot
31 Scallop Dredge AA GEN MA all 512 0 512 0.417 213
32 Scallop Dredge AA GEN NE all 9 0 9 0.949 9
33 Scallop Dredge AA LIM MA all 733 0 733 0.327 240
34 Scallop Dredge AA LIM NE all 2,199 0 2,199 0.267 587
35 Scallop Dredge OPEN GEN MA all 703 0 703 0.607 427
36 Scallop Dredge OPEN GEN NE all 3,993 0 3,993 0.959 3,830
37 Scallop Dredge OPEN LIM MA all 3,784 0 3,784 0.229 868
38 Scallop Dredge OPEN LIM NE all 27,901 642 27,259 0.329 8,972
39 Danish Seine OPEN all MA all 0 0 P
40 Mid-water Paired & Single Trawl AA all NE all 0 0 0
42 Mid-water Paired & Single Trawl OPEN all NE all 0 0 0
43 Pots and Traps, Fish OPEN all MA all 0 0 0
44 Pots and Traps, Fish OPEN all NE all 0 0 0
45 Pots and Traps, Conch OPEN all MA all 0 0 0
46 Pots and Traps, Conch OPEN all NE all 0 0 0
47 Pots and Traps, Hagfish OPEN all NE all 0 0 P
48 Pots and Traps, Lobster OPEN all MA all 0 0 0
49 Pots and Traps, Lobster OPEN all NE all 64 0 64 0.774 50
50 Pots and Traps, Crab OPEN all MA all 0 0 P
51 Pots and Traps, Crab OPEN all NE all 0 0 P
52 Beam Trawl OPEN all MA all 0 0 P
53 Beam Trawl OPEN all NE all 0 0 P
54 Dredge, Other OPEN all MA all 0 0 P
55 Ocean Quahog/Surfclam Dredge OPEN all MA all 44 0 44 1.272 56
56 Ocean Quahog/Surfclam Dredge OPEN all NE all 0 0 0
Confidential fleets 0 0
Other minor fleets 0 0
TOTAL 1,130,415 932,387 198,028 0.086 16,992

See text for fleet abbreviations. 80
Table 5B, continued. Total catch (live lb), Vessel Trip Report landings (kept; live lb), estimated discards (live lb), associated coefficient of variation (CV), and standard error of the estimated discards (SE; live lb) for 23 individual species that compose the 14 species groups, by fleet, based on July 2015 through June 2016 data. Dark shading indicates fleets not considered or with no Northeast Fisheries Observer Program trips in the annual analysis. These CVs were not used in the annual sample size analysis. Blank CV indicates either no discards estimated or discards equals 0. "P" indicates fleets with "pilot" designation.
Species: YELLOWTAIL FLOUNDER (Limanda ferruginea) Fleet Row Gear Type Access Trip Region Mesh Area Category Group Total Kept Discarded CV SE Pilot
1 Longline OPEN all MA all 0 0 0
2 Longline OPEN all NE all 0 0 0
3 Hand Line OPEN all MA all 0 0 0 P
4 Hand Line OPEN all NE all 11 11 0
5 Otter Trawl OPEN all MA sm 3,681 0 3,681 0.322 1,187
6 Otter Trawl OPEN all MA lg 174,286 166,389 7,897 0.427 3,371
7 Otter Trawl OPEN all NE sm 18,576 90 18,486 0.293 5,413
8 Otter Trawl OPEN all NE lg 1,111,633 1,057,154 54,479 0.122 6,621
9 Scallop Trawl AA GEN MA all 0 0 0
11 Scallop Trawl OPEN GEN MA all 259 0 259 0.327 85
12 Scallop Trawl OPEN LIM MA all 0 0 P
13 Otter Trawl, Twin OPEN all MA all 438 438 0 P
14 Otter Trawl, Twin OPEN all NE all 0 0 0 P
16 Otter Trawl, Ruhle OPEN all NE sm 0 0 0 P
17 Otter Trawl, Ruhle OPEN all NE lg 373 373 P
18 Otter Trawl, Haddock Separator OPEN all NE lg 1,633 1,505 128 0.452 58
19 Shrimp Trawl OPEN all MA all 0 0 0 P
20 Shrimp Trawl OPEN all NE all 0 0 P
22 Floating Trap OPEN all NE all 0 0 P
23 Sink, Anchor, Drift Gillnet OPEN all MA sm 0 0 0
24 Sink, Anchor, Drift Gillnet OPEN all MA lg 0 0 0
25 Sink, Anchor, Drift Gillnet OPEN all MA xlg 9 9 0
26 Sink, Anchor, Drift Gillnet OPEN all NE sm 0 0 P
27 Sink, Anchor, Drift Gillnet OPEN all NE lg 45,777 42,326 3,451 0.240 829
28 Sink, Anchor, Drift Gillnet OPEN all NE xlg 1,178 1,178 0
29 Purse Seine OPEN all MA all 0 0 P
30 Purse Seine OPEN all NE all 0 0 0

See text for fleet abbreviations. 81
Table 5B, continued. Total catch (live lb), Vessel Trip Report landings (kept; live lb), estimated discards (live lb), associated coefficient of variation (CV), and standard error of the estimated discards (SE; live lb) for 23 individual species that compose the 14 species groups, by fleet, based on July 2015 through June 2016 data. Dark shading indicates fleets not considered or with no Northeast Fisheries Observer Program trips in the annual analysis. These CVs were not used in the annual sample size analysis. Blank CV indicates either no discards estimated or discards equals 0. "P" indicates fleets with "pilot" designation.
Species: YELLOWTAIL FLOUNDER (Limanda ferruginea) Fleet Row Gear Type Access Trip Region Mesh Area Category Group Total Kept Discarded CV SE Pilot
31 Scallop Dredge AA GEN MA all 18 0 18 1.991 35
32 Scallop Dredge AA GEN NE all 7 0 7 0.950 7
33 Scallop Dredge AA LIM MA all 5 5 0
34 Scallop Dredge AA LIM NE all 53 0 53 0.541 29
35 Scallop Dredge OPEN GEN MA all 1,797 0 1,797 0.477 858
36 Scallop Dredge OPEN GEN NE all 26,384 0 26,384 0.264 6,966
37 Scallop Dredge OPEN LIM MA all 1,023 0 1,023 0.314 321
38 Scallop Dredge OPEN LIM NE all 101,830 0 101,830 0.234 23,868
39 Danish Seine OPEN all MA all 0 0 P
40 Mid-water Paired & Single Trawl AA all NE all 0 0 0
42 Mid-water Paired & Single Trawl OPEN all NE all 0 0 0
43 Pots and Traps, Fish OPEN all MA all 0 0 0
44 Pots and Traps, Fish OPEN all NE all 0 0 0
45 Pots and Traps, Conch OPEN all MA all 0 0 0
46 Pots and Traps, Conch OPEN all NE all 0 0 0
47 Pots and Traps, Hagfish OPEN all NE all 0 0 P
48 Pots and Traps, Lobster OPEN all MA all 0 0 0
49 Pots and Traps, Lobster OPEN all NE all 0 0 0
50 Pots and Traps, Crab OPEN all MA all 0 0 P
51 Pots and Traps, Crab OPEN all NE all 0 0 P
52 Beam Trawl OPEN all MA all 0 0 P
53 Beam Trawl OPEN all NE all 0 0 P
54 Dredge, Other OPEN all MA all 0 0 P
55 Ocean Quahog/Surfclam Dredge OPEN all MA all 0 0 0
56 Ocean Quahog/Surfclam Dredge OPEN all NE all 82 0 82 0.959 79
Confidential fleets 0 0
Other minor fleets 0 0
TOTAL 1,489,054 1,269,478 219,576 0.121 26,564

See text for fleet abbreviations. 82
Table 5B, continued. Total catch (live lb), Vessel Trip Report landings (kept; live lb), estimated discards (live lb), associated coefficient of variation (CV), and standard error of the estimated discards (SE; live lb) for 23 individual species that compose the 14 species groups, by fleet, based on July 2015 through June 2016 data. Dark shading indicates fleets not considered or with no Northeast Fisheries Observer Program trips in the annual analysis. These CVs were not used in the annual sample size analysis. Blank CV indicates either no discards estimated or discards equals 0. "P" indicates fleets with "pilot" designation.
Species: OFFSHORE HAKE (Merluccius albidus) Fleet Row Gear Type Access Trip Region Mesh Area Category Group Total Kept Discarded CV SE Pilot
1 Longline OPEN all MA all 136 0 136 0.572 78
2 Longline OPEN all NE all 0 0 0
3 Hand Line OPEN all MA all 0 0 0 P
4 Hand Line OPEN all NE all 0 0 0
5 Otter Trawl OPEN all MA sm 10,758 661 10,097 0.569 5,742
6 Otter Trawl OPEN all MA lg 3,157 1,240 1,917 0.799 1,532
7 Otter Trawl OPEN all NE sm 1,571 615 956 0.510 487
8 Otter Trawl OPEN all NE lg 498 130 368 0.666 245
9 Scallop Trawl AA GEN MA all 0 0 0
11 Scallop Trawl OPEN GEN MA all 0 0 0
12 Scallop Trawl OPEN LIM MA all 0 0 P
13 Otter Trawl, Twin OPEN all MA all 609 0 609 0.112 68 P
14 Otter Trawl, Twin OPEN all NE all 38 0 38 0.861 32 P
16 Otter Trawl, Ruhle OPEN all NE sm 1,701 0 1,701 0.000 0 P
17 Otter Trawl, Ruhle OPEN all NE lg 0 0 P
18 Otter Trawl, Haddock Separator OPEN all NE lg 0 0 0
19 Shrimp Trawl OPEN all MA all 0 0 0 P
20 Shrimp Trawl OPEN all NE all 0 0 P
22 Floating Trap OPEN all NE all 0 0 P
23 Sink, Anchor, Drift Gillnet OPEN all MA sm 0 0 0
24 Sink, Anchor, Drift Gillnet OPEN all MA lg 0 0 0
25 Sink, Anchor, Drift Gillnet OPEN all MA xlg 0 0 0
26 Sink, Anchor, Drift Gillnet OPEN all NE sm 0 0 P
27 Sink, Anchor, Drift Gillnet OPEN all NE lg 0 0 0
28 Sink, Anchor, Drift Gillnet OPEN all NE xlg 126 0 126 1.159 146
29 Purse Seine OPEN all MA all 0 0 P
30 Purse Seine OPEN all NE all 0 0 0

See text for fleet abbreviations. 83
Table 5B, continued. Total catch (live lb), Vessel Trip Report landings (kept; live lb), estimated discards (live lb), associated coefficient of variation (CV), and standard error of the estimated discards (SE; live lb) for 23 individual species that compose the 14 species groups, by fleet, based on July 2015 through June 2016 data. Dark shading indicates fleets not considered or with no Northeast Fisheries Observer Program trips in the annual analysis. These CVs were not used in the annual sample size analysis. Blank CV indicates either no discards estimated or discards equals 0. "P" indicates fleets with "pilot" designation.
Species: OFFSHORE HAKE (Merluccius albidus) Fleet Row Gear Type Access Trip Region Mesh Area Category Group Total Kept Discarded CV SE Pilot
31 Scallop Dredge AA GEN MA all 0 0 0
32 Scallop Dredge AA GEN NE all 0 0 0
33 Scallop Dredge AA LIM MA all 5 0 5 0.892 4
34 Scallop Dredge AA LIM NE all 0 0 0
35 Scallop Dredge OPEN GEN MA all 0 0 0
36 Scallop Dredge OPEN GEN NE all 0 0 0
37 Scallop Dredge OPEN LIM MA all 22 0 22 0.906 20
38 Scallop Dredge OPEN LIM NE all 437 0 437 1.067 467
39 Danish Seine OPEN all MA all 0 0 P
40 Mid-water Paired & Single Trawl AA all NE all 0 0 0
42 Mid-water Paired & Single Trawl OPEN all NE all 0 0 0
43 Pots and Traps, Fish OPEN all MA all 4 4 0
44 Pots and Traps, Fish OPEN all NE all 0 0 0
45 Pots and Traps, Conch OPEN all MA all 0 0 0
46 Pots and Traps, Conch OPEN all NE all 0 0 0
47 Pots and Traps, Hagfish OPEN all NE all 0 0 P
48 Pots and Traps, Lobster OPEN all MA all 0 0 0
49 Pots and Traps, Lobster OPEN all NE all 0 0 0
50 Pots and Traps, Crab OPEN all MA all 0 0 P
51 Pots and Traps, Crab OPEN all NE all 0 0 P
52 Beam Trawl OPEN all MA all 0 0 P
53 Beam Trawl OPEN all NE all 0 0 P
54 Dredge, Other OPEN all MA all 0 0 P
55 Ocean Quahog/Surfclam Dredge OPEN all MA all 0 0 0
56 Ocean Quahog/Surfclam Dredge OPEN all NE all 0 0 0
Confidential fleets 0 0
Other minor fleets 0 0
TOTAL 19,061 2,650 16,411 0.365 5,989

See text for fleet abbreviations. 84
Table 5B, continued. Total catch (live lb), Vessel Trip Report landings (kept; live lb), estimated discards (live lb), associated coefficient of variation (CV), and standard error of the estimated discards (SE; live lb) for 23 individual species that compose the 14 species groups, by fleet, based on July 2015 through June 2016 data. Dark shading indicates fleets not considered or with no Northeast Fisheries Observer Program trips in the annual analysis. These CVs were not used in the annual sample size analysis. Blank CV indicates either no discards estimated or discards equals 0. "P" indicates fleets with "pilot" designation.
Species: RED HAKE (Urophycis chuss) Fleet Row Gear Type Access Trip Region Mesh Area Category Group Total Kept Discarded CV SE Pilot
1 Longline OPEN all MA all 496 0 496 0.826 410
2 Longline OPEN all NE all 280 0 280 0.897 252
3 Hand Line OPEN all MA all 803 803 0 P
4 Hand Line OPEN all NE all 134 21 113 6.030 684
5 Otter Trawl OPEN all MA sm 651,428 432,189 219,239 0.429 93,960
6 Otter Trawl OPEN all MA lg 43,461 30,807 12,654 0.445 5,633
7 Otter Trawl OPEN all NE sm 2,439,638 564,142 1,875,496 0.245 459,066
8 Otter Trawl OPEN all NE lg 301,366 55,710 245,656 0.183 44,848
9 Scallop Trawl AA GEN MA all 88 0 88 1.031 91
11 Scallop Trawl OPEN GEN MA all 10 0 10 0.487 5
12 Scallop Trawl OPEN LIM MA all 0 0 P
13 Otter Trawl, Twin OPEN all MA all 699 34 665 0.112 75 P
14 Otter Trawl, Twin OPEN all NE all 24,240 0 24,240 0.259 6,288 P
16 Otter Trawl, Ruhle OPEN all NE sm 10,151 0 10,151 0.000 0 P
17 Otter Trawl, Ruhle OPEN all NE lg 0 0 P
18 Otter Trawl, Haddock Separator OPEN all NE lg 6,053 0 6,053 0.365 2,211
19 Shrimp Trawl OPEN all MA all 20 20 0 P
20 Shrimp Trawl OPEN all NE all 1,995 1,995 P
22 Floating Trap OPEN all NE all 0 0 P
23 Sink, Anchor, Drift Gillnet OPEN all MA sm 87 87 0
24 Sink, Anchor, Drift Gillnet OPEN all MA lg 0 0 0
25 Sink, Anchor, Drift Gillnet OPEN all MA xlg 34 34 0
26 Sink, Anchor, Drift Gillnet OPEN all NE sm 0 0 P
27 Sink, Anchor, Drift Gillnet OPEN all NE lg 3,476 899 2,577 0.133 343
28 Sink, Anchor, Drift Gillnet OPEN all NE xlg 109 26 83 0.894 74
29 Purse Seine OPEN all MA all 0 0 P
30 Purse Seine OPEN all NE all 0 0 0

See text for fleet abbreviations. 85
Table 5B, continued. Total catch (live lb), Vessel Trip Report landings (kept; live lb), estimated discards (live lb), associated coefficient of variation (CV), and standard error of the estimated discards (SE; live lb) for 23 individual species that compose the 14 species groups, by fleet, based on July 2015 through June 2016 data. Dark shading indicates fleets not considered or with no Northeast Fisheries Observer Program trips in the annual analysis. These CVs were not used in the annual sample size analysis. Blank CV indicates either no discards estimated or discards equals 0. "P" indicates fleets with "pilot" designation.
Species: RED HAKE (Urophycis chuss) Fleet Row Gear Type Access Trip Region Mesh Area Category Group Total Kept Discarded CV SE Pilot
31 Scallop Dredge AA GEN MA all 1,875 0 1,875 0.357 669
32 Scallop Dredge AA GEN NE all 682 0 682 0.229 156
33 Scallop Dredge AA LIM MA all 4,398 0 4,398 0.244 1,072
34 Scallop Dredge AA LIM NE all 2,424 0 2,424 0.235 569
35 Scallop Dredge OPEN GEN MA all 6,141 0 6,141 0.845 5,189
36 Scallop Dredge OPEN GEN NE all 7,201 0 7,201 0.363 2,614
37 Scallop Dredge OPEN LIM MA all 18,506 0 18,506 0.354 6,552
38 Scallop Dredge OPEN LIM NE all 133,504 0 133,504 0.219 29,239
39 Danish Seine OPEN all MA all 0 0 P
40 Mid-water Paired & Single Trawl AA all NE all 0 0 0
42 Mid-water Paired & Single Trawl OPEN all NE all 0 0 0
43 Pots and Traps, Fish OPEN all MA all 1,048 1,048 0
44 Pots and Traps, Fish OPEN all NE all 41 41 0
45 Pots and Traps, Conch OPEN all MA all 0 0 0
46 Pots and Traps, Conch OPEN all NE all 0 0 0
47 Pots and Traps, Hagfish OPEN all NE all 0 0 P
48 Pots and Traps, Lobster OPEN all MA all 12,203 9,115 3,088 2.376 7,337
49 Pots and Traps, Lobster OPEN all NE all 115,851 12,264 103,587 0.910 94,291
50 Pots and Traps, Crab OPEN all MA all 0 0 P
51 Pots and Traps, Crab OPEN all NE all 0 0 P
52 Beam Trawl OPEN all MA all 0 0 P
53 Beam Trawl OPEN all NE all 145 145 P
54 Dredge, Other OPEN all MA all 0 0 P
55 Ocean Quahog/Surfclam Dredge OPEN all MA all 83 0 83 0.999 83
56 Ocean Quahog/Surfclam Dredge OPEN all NE all 445 0 445 0.702 312
Confidential fleets 0 0
Other minor fleets 3,100 3,100
TOTAL 3,792,217 1,112,480 2,679,737 0.180 481,182

See text for fleet abbreviations. 86
Table 5B, continued. Total catch (live lb), Vessel Trip Report landings (kept; live lb), estimated discards (live lb), associated coefficient of variation (CV), and standard error of the estimated discards (SE; live lb) for 23 individual species that compose the 14 species groups, by fleet, based on July 2015 through June 2016 data. Dark shading indicates fleets not considered or with no Northeast Fisheries Observer Program trips in the annual analysis. These CVs were not used in the annual sample size analysis. Blank CV indicates either no discards estimated or discards equals 0. "P" indicates fleets with "pilot" designation.
Species: SILVER HAKE (Merluccius bilinearis) Fleet Row Gear Type Access Trip Region Mesh Area Category Group Total Kept Discarded CV SE Pilot
1 Longline OPEN all MA all 308 283 25 2.319 58
2 Longline OPEN all NE all 4 4 0
3 Hand Line OPEN all MA all 6 6 0 P
4 Hand Line OPEN all NE all 1,523 1,523 0
5 Otter Trawl OPEN all MA sm 2,385,132 2,308,960 76,172 0.272 20,727
6 Otter Trawl OPEN all MA lg 94,419 44,409 50,010 0.347 17,348
7 Otter Trawl OPEN all NE sm 9,629,845 9,280,233 349,612 0.309 108,125
8 Otter Trawl OPEN all NE lg 1,027,044 512,115 514,929 0.162 83,242
9 Scallop Trawl AA GEN MA all 66 0 66 0.955 63
11 Scallop Trawl OPEN GEN MA all 272 0 272 0.863 235
12 Scallop Trawl OPEN LIM MA all 0 0 P
13 Otter Trawl, Twin OPEN all MA all 2,219 511 1,708 0.112 191 P
14 Otter Trawl, Twin OPEN all NE all 9,790 3,520 6,270 0.250 1,567 P
16 Otter Trawl, Ruhle OPEN all NE sm 768 0 768 0.000 0 P
17 Otter Trawl, Ruhle OPEN all NE lg 65 65 P
18 Otter Trawl, Haddock Separator OPEN all NE lg 20,768 3,208 17,560 0.411 7,215
19 Shrimp Trawl OPEN all MA all 39,425 800 38,625 0.000 0 P
20 Shrimp Trawl OPEN all NE all 18,490 18,490 P
22 Floating Trap OPEN all NE all 0 0 P
23 Sink, Anchor, Drift Gillnet OPEN all MA sm 39 39 0
24 Sink, Anchor, Drift Gillnet OPEN all MA lg 323 323 0
25 Sink, Anchor, Drift Gillnet OPEN all MA xlg 157 7 150 0.658 99
26 Sink, Anchor, Drift Gillnet OPEN all NE sm 400 400 P
27 Sink, Anchor, Drift Gillnet OPEN all NE lg 101,791 86,852 14,939 0.191 2,850
28 Sink, Anchor, Drift Gillnet OPEN all NE xlg 17,192 11,916 5,276 0.199 1,050
29 Purse Seine OPEN all MA all 0 0 P
30 Purse Seine OPEN all NE all 0 0 0
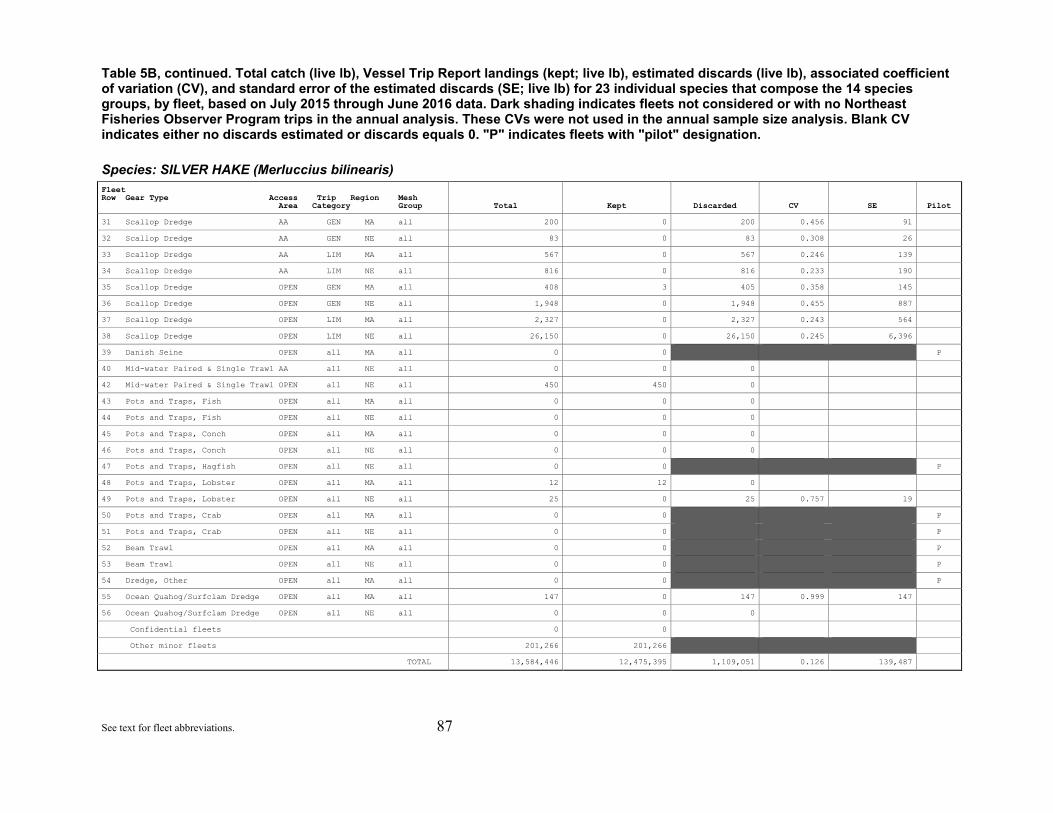
See text for fleet abbreviations. 87
Table 5B, continued. Total catch (live lb), Vessel Trip Report landings (kept; live lb), estimated discards (live lb), associated coefficient of variation (CV), and standard error of the estimated discards (SE; live lb) for 23 individual species that compose the 14 species groups, by fleet, based on July 2015 through June 2016 data. Dark shading indicates fleets not considered or with no Northeast Fisheries Observer Program trips in the annual analysis. These CVs were not used in the annual sample size analysis. Blank CV indicates either no discards estimated or discards equals 0. "P" indicates fleets with "pilot" designation.
Species: SILVER HAKE (Merluccius bilinearis) Fleet Row Gear Type Access Trip Region Mesh Area Category Group Total Kept Discarded CV SE Pilot
31 Scallop Dredge AA GEN MA all 200 0 200 0.456 91
32 Scallop Dredge AA GEN NE all 83 0 83 0.308 26
33 Scallop Dredge AA LIM MA all 567 0 567 0.246 139
34 Scallop Dredge AA LIM NE all 816 0 816 0.233 190
35 Scallop Dredge OPEN GEN MA all 408 3 405 0.358 145
36 Scallop Dredge OPEN GEN NE all 1,948 0 1,948 0.455 887
37 Scallop Dredge OPEN LIM MA all 2,327 0 2,327 0.243 564
38 Scallop Dredge OPEN LIM NE all 26,150 0 26,150 0.245 6,396
39 Danish Seine OPEN all MA all 0 0 P
40 Mid-water Paired & Single Trawl AA all NE all 0 0 0
42 Mid-water Paired & Single Trawl OPEN all NE all 450 450 0
43 Pots and Traps, Fish OPEN all MA all 0 0 0
44 Pots and Traps, Fish OPEN all NE all 0 0 0
45 Pots and Traps, Conch OPEN all MA all 0 0 0
46 Pots and Traps, Conch OPEN all NE all 0 0 0
47 Pots and Traps, Hagfish OPEN all NE all 0 0 P
48 Pots and Traps, Lobster OPEN all MA all 12 12 0
49 Pots and Traps, Lobster OPEN all NE all 25 0 25 0.757 19
50 Pots and Traps, Crab OPEN all MA all 0 0 P
51 Pots and Traps, Crab OPEN all NE all 0 0 P
52 Beam Trawl OPEN all MA all 0 0 P
53 Beam Trawl OPEN all NE all 0 0 P
54 Dredge, Other OPEN all MA all 0 0 P
55 Ocean Quahog/Surfclam Dredge OPEN all MA all 147 0 147 0.999 147
56 Ocean Quahog/Surfclam Dredge OPEN all NE all 0 0 0
Confidential fleets 0 0
Other minor fleets 201,266 201,266
TOTAL 13,584,446 12,475,395 1,109,051 0.126 139,487

See text for fleet abbreviations. 88
Table 5B, continued. Total catch (live lb), Vessel Trip Report landings (kept; live lb), estimated discards (live lb), associated coefficient of variation (CV), and standard error of the estimated discards (SE; live lb) for 23 individual species that compose the 14 species groups, by fleet, based on July 2015 through June 2016 data. Dark shading indicates fleets not considered or with no Northeast Fisheries Observer Program trips in the annual analysis. These CVs were not used in the annual sample size analysis. Blank CV indicates either no discards estimated or discards equals 0. "P" indicates fleets with "pilot" designation.
Species: ATLANTIC MACKEREL (Scomber scombrus) Fleet Row Gear Type Access Trip Region Mesh Area Category Group Total Kept Discarded CV SE Pilot
1 Longline OPEN all MA all 0 0 0
2 Longline OPEN all NE all 5,000 5,000 0
3 Hand Line OPEN all MA all 1,298 1,298 0 P
4 Hand Line OPEN all NE all 1,622,088 1,622,088 0
5 Otter Trawl OPEN all MA sm 46,878 39,300 7,578 0.303 2,294
6 Otter Trawl OPEN all MA lg 5,495 3,559 1,936 0.813 1,575
7 Otter Trawl OPEN all NE sm 429,232 412,402 16,830 0.369 6,218
8 Otter Trawl OPEN all NE lg 16,581 11,922 4,659 0.427 1,991
9 Scallop Trawl AA GEN MA all 0 0 0
11 Scallop Trawl OPEN GEN MA all 0 0 0
12 Scallop Trawl OPEN LIM MA all 0 0 P
13 Otter Trawl, Twin OPEN all MA all 794 0 794 0.112 89 P
14 Otter Trawl, Twin OPEN all NE all 1,392 5 1,387 0.406 563 P
16 Otter Trawl, Ruhle OPEN all NE sm 0 0 0 P
17 Otter Trawl, Ruhle OPEN all NE lg 0 0 P
18 Otter Trawl, Haddock Separator OPEN all NE lg 185 0 185 0.486 90
19 Shrimp Trawl OPEN all MA all 0 0 0 P
20 Shrimp Trawl OPEN all NE all 0 0 P
22 Floating Trap OPEN all NE all 2,144 2,144 P
23 Sink, Anchor, Drift Gillnet OPEN all MA sm 379 52 327 0.696 228
24 Sink, Anchor, Drift Gillnet OPEN all MA lg 532 477 55 0.457 25
25 Sink, Anchor, Drift Gillnet OPEN all MA xlg 250 153 97 0.339 33
26 Sink, Anchor, Drift Gillnet OPEN all NE sm 0 0 P
27 Sink, Anchor, Drift Gillnet OPEN all NE lg 6,629 5,756 873 0.454 396
28 Sink, Anchor, Drift Gillnet OPEN all NE xlg 1,777 1,658 119 0.476 56
29 Purse Seine OPEN all MA all 0 0 P
30 Purse Seine OPEN all NE all 36 0 36 0.668 24

See text for fleet abbreviations. 89
Table 5B, continued. Total catch (live lb), Vessel Trip Report landings (kept; live lb), estimated discards (live lb), associated coefficient of variation (CV), and standard error of the estimated discards (SE; live lb) for 23 individual species that compose the 14 species groups, by fleet, based on July 2015 through June 2016 data. Dark shading indicates fleets not considered or with no Northeast Fisheries Observer Program trips in the annual analysis. These CVs were not used in the annual sample size analysis. Blank CV indicates either no discards estimated or discards equals 0. "P" indicates fleets with "pilot" designation.
Species: ATLANTIC MACKEREL (Scomber scombrus) Fleet Row Gear Type Access Trip Region Mesh Area Category Group Total Kept Discarded CV SE Pilot
31 Scallop Dredge AA GEN MA all 0 0 0
32 Scallop Dredge AA GEN NE all 0 0 0
33 Scallop Dredge AA LIM MA all 0 0 0
34 Scallop Dredge AA LIM NE all 9 0 9 1.009 9
35 Scallop Dredge OPEN GEN MA all 16 0 16 0.622 10
36 Scallop Dredge OPEN GEN NE all 2 0 2 0.875 2
37 Scallop Dredge OPEN LIM MA all 15 0 15 0.906 13
38 Scallop Dredge OPEN LIM NE all 108 0 108 0.485 53
39 Danish Seine OPEN all MA all 0 0 P
40 Mid-water Paired & Single Trawl AA all NE all 1 0 1 0.244 <1
42 Mid-water Paired & Single Trawl OPEN all NE all 6,002,595 6,002,507 88 0.301 26
43 Pots and Traps, Fish OPEN all MA all 9 9 0
44 Pots and Traps, Fish OPEN all NE all 0 0 0
45 Pots and Traps, Conch OPEN all MA all 0 0 0
46 Pots and Traps, Conch OPEN all NE all 0 0 0
47 Pots and Traps, Hagfish OPEN all NE all 0 0 P
48 Pots and Traps, Lobster OPEN all MA all 0 0 0
49 Pots and Traps, Lobster OPEN all NE all 30 0 30 0.774 23
50 Pots and Traps, Crab OPEN all MA all 0 0 P
51 Pots and Traps, Crab OPEN all NE all 0 0 P
52 Beam Trawl OPEN all MA all 0 0 P
53 Beam Trawl OPEN all NE all 45 45 P
54 Dredge, Other OPEN all MA all 0 0 P
55 Ocean Quahog/Surfclam Dredge OPEN all MA all 0 0 0
56 Ocean Quahog/Surfclam Dredge OPEN all NE all 0 0 0
Confidential fleets 210,586 210,586
Other minor fleets 1,663 1,663
TOTAL 8,355,769 8,320,624 35,145 0.203 7,136

See text for fleet abbreviations. 90
Table 5B, continued. Total catch (live lb), Vessel Trip Report landings (kept; live lb), estimated discards (live lb), associated coefficient of variation (CV), and standard error of the estimated discards (SE; live lb) for 23 individual species that compose the 14 species groups, by fleet, based on July 2015 through June 2016 data. Dark shading indicates fleets not considered or with no Northeast Fisheries Observer Program trips in the annual analysis. These CVs were not used in the annual sample size analysis. Blank CV indicates either no discards estimated or discards equals 0. "P" indicates fleets with "pilot" designation.
Species: BUTTERFISH (Peprilus triacanthus) Fleet Row Gear Type Access Trip Region Mesh Area Category Group Total Kept Discarded CV SE Pilot
1 Longline OPEN all MA all 0 0 0
2 Longline OPEN all NE all 0 0 0
3 Hand Line OPEN all MA all 0 0 0 P
4 Hand Line OPEN all NE all 2 2 0
5 Otter Trawl OPEN all MA sm 2,483,014 530,940 1,952,074 0.255 496,972
6 Otter Trawl OPEN all MA lg 104,199 63,450 40,749 0.390 15,883
7 Otter Trawl OPEN all NE sm 3,784,786 2,019,149 1,765,637 0.221 390,477
8 Otter Trawl OPEN all NE lg 71,573 46,296 25,277 0.364 9,190
9 Scallop Trawl AA GEN MA all 82 0 82 0.869 71
11 Scallop Trawl OPEN GEN MA all 36 0 36 1.530 56
12 Scallop Trawl OPEN LIM MA all 0 0 P
13 Otter Trawl, Twin OPEN all MA all 1,118 550 568 0.143 81 P
14 Otter Trawl, Twin OPEN all NE all 26,764 410 26,354 0.462 12,168 P
16 Otter Trawl, Ruhle OPEN all NE sm 3,621 0 3,621 0.000 0 P
17 Otter Trawl, Ruhle OPEN all NE lg 0 0 P
18 Otter Trawl, Haddock Separator OPEN all NE lg 6 0 6 0.637 4
19 Shrimp Trawl OPEN all MA all 97 97 0 P
20 Shrimp Trawl OPEN all NE all 4,962 4,962 P
22 Floating Trap OPEN all NE all 0 0 P
23 Sink, Anchor, Drift Gillnet OPEN all MA sm 5,743 3,984 1,759 0.906 1,594
24 Sink, Anchor, Drift Gillnet OPEN all MA lg 1,342 1,294 48 0.575 28
25 Sink, Anchor, Drift Gillnet OPEN all MA xlg 0 0 0
26 Sink, Anchor, Drift Gillnet OPEN all NE sm 0 0 P
27 Sink, Anchor, Drift Gillnet OPEN all NE lg 103 55 48 0.272 13
28 Sink, Anchor, Drift Gillnet OPEN all NE xlg 0 0 0
29 Purse Seine OPEN all MA all 0 0 P
30 Purse Seine OPEN all NE all 0 0 0

See text for fleet abbreviations. 91
Table 5B, continued. Total catch (live lb), Vessel Trip Report landings (kept; live lb), estimated discards (live lb), associated coefficient of variation (CV), and standard error of the estimated discards (SE; live lb) for 23 individual species that compose the 14 species groups, by fleet, based on July 2015 through June 2016 data. Dark shading indicates fleets not considered or with no Northeast Fisheries Observer Program trips in the annual analysis. These CVs were not used in the annual sample size analysis. Blank CV indicates either no discards estimated or discards equals 0. "P" indicates fleets with "pilot" designation.
Species: BUTTERFISH (Peprilus triacanthus) Fleet Row Gear Type Access Trip Region Mesh Area Category Group Total Kept Discarded CV SE Pilot
31 Scallop Dredge AA GEN MA all 10 0 10 0.784 8
32 Scallop Dredge AA GEN NE all 0 0 0
33 Scallop Dredge AA LIM MA all 67 0 67 0.697 47
34 Scallop Dredge AA LIM NE all 13 0 13 0.413 5
35 Scallop Dredge OPEN GEN MA all 10 0 10 0.595 6
36 Scallop Dredge OPEN GEN NE all 0 0 0
37 Scallop Dredge OPEN LIM MA all 13 0 13 0.463 6
38 Scallop Dredge OPEN LIM NE all 129 0 129 0.356 46
39 Danish Seine OPEN all MA all 0 0 P
40 Mid-water Paired & Single Trawl AA all NE all 0 0 0
42 Mid-water Paired & Single Trawl OPEN all NE all 3,000 3,000 0
43 Pots and Traps, Fish OPEN all MA all 0 0 0
44 Pots and Traps, Fish OPEN all NE all 0 0 0
45 Pots and Traps, Conch OPEN all MA all 0 0 0
46 Pots and Traps, Conch OPEN all NE all 0 0 0
47 Pots and Traps, Hagfish OPEN all NE all 0 0 P
48 Pots and Traps, Lobster OPEN all MA all 0 0 0
49 Pots and Traps, Lobster OPEN all NE all 0 0 0
50 Pots and Traps, Crab OPEN all MA all 0 0 P
51 Pots and Traps, Crab OPEN all NE all 0 0 P
52 Beam Trawl OPEN all MA all 115 115 P
53 Beam Trawl OPEN all NE all 8 8 P
54 Dredge, Other OPEN all MA all 0 0 P
55 Ocean Quahog/Surfclam Dredge OPEN all MA all 0 0 0
56 Ocean Quahog/Surfclam Dredge OPEN all NE all 0 0 0
Confidential fleets 331 331
Other minor fleets 19,225 19,225
TOTAL 6,510,368 2,693,868 3,816,500 0.166 632,409

See text for fleet abbreviations. 92
Table 5B, continued. Total catch (live lb), Vessel Trip Report landings (kept; live lb), estimated discards (live lb), associated coefficient of variation (CV), and standard error of the estimated discards (SE; live lb) for 23 individual species that compose the 14 species groups, by fleet, based on July 2015 through June 2016 data. Dark shading indicates fleets not considered or with no Northeast Fisheries Observer Program trips in the annual analysis. These CVs were not used in the annual sample size analysis. Blank CV indicates either no discards estimated or discards equals 0. "P" indicates fleets with "pilot" designation.
Species: NORTHERN SHORTFIN SQUID (Illex illecebrosus) Fleet Row Gear Type Access Trip Region Mesh Area Category Group Total Kept Discarded CV SE Pilot
1 Longline OPEN all MA all 0 0 0
2 Longline OPEN all NE all 0 0 0
3 Hand Line OPEN all MA all 0 0 0 P
4 Hand Line OPEN all NE all 1 1 0
5 Otter Trawl OPEN all MA sm 1,729,758 1,298,385 431,373 0.264 114,093
6 Otter Trawl OPEN all MA lg 1,824 979 845 0.628 530
7 Otter Trawl OPEN all NE sm 4,444,193 3,961,631 482,562 0.247 119,232
8 Otter Trawl OPEN all NE lg 17,972 306 17,666 0.139 2,447
9 Scallop Trawl AA GEN MA all 0 0 0
11 Scallop Trawl OPEN GEN MA all 8 0 8 0.616 5
12 Scallop Trawl OPEN LIM MA all 0 0 P
13 Otter Trawl, Twin OPEN all MA all 95,973 0 95,973 0.112 10,759 P
14 Otter Trawl, Twin OPEN all NE all 115,208 0 115,208 0.129 14,879 P
16 Otter Trawl, Ruhle OPEN all NE sm 25,953 0 25,953 0.000 0 P
17 Otter Trawl, Ruhle OPEN all NE lg 0 0 P
18 Otter Trawl, Haddock Separator OPEN all NE lg 101 0 101 0.442 45
19 Shrimp Trawl OPEN all MA all 53,966 0 53,966 0.000 0 P
20 Shrimp Trawl OPEN all NE all 0 0 P
22 Floating Trap OPEN all NE all 0 0 P
23 Sink, Anchor, Drift Gillnet OPEN all MA sm 0 0 0
24 Sink, Anchor, Drift Gillnet OPEN all MA lg 0 0 0
25 Sink, Anchor, Drift Gillnet OPEN all MA xlg 0 0 0
26 Sink, Anchor, Drift Gillnet OPEN all NE sm 0 0 P
27 Sink, Anchor, Drift Gillnet OPEN all NE lg 0 0 0
28 Sink, Anchor, Drift Gillnet OPEN all NE xlg 0 0 0
29 Purse Seine OPEN all MA all 0 0 P
30 Purse Seine OPEN all NE all 0 0 0

See text for fleet abbreviations. 93
Table 5B, continued. Total catch (live lb), Vessel Trip Report landings (kept; live lb), estimated discards (live lb), associated coefficient of variation (CV), and standard error of the estimated discards (SE; live lb) for 23 individual species that compose the 14 species groups, by fleet, based on July 2015 through June 2016 data. Dark shading indicates fleets not considered or with no Northeast Fisheries Observer Program trips in the annual analysis. These CVs were not used in the annual sample size analysis. Blank CV indicates either no discards estimated or discards equals 0. "P" indicates fleets with "pilot" designation.
Species: NORTHERN SHORTFIN SQUID (Illex illecebrosus) Fleet Row Gear Type Access Trip Region Mesh Area Category Group Total Kept Discarded CV SE Pilot
31 Scallop Dredge AA GEN MA all 13 0 13 0.730 10
32 Scallop Dredge AA GEN NE all 10 0 10 0.953 10
33 Scallop Dredge AA LIM MA all 113 0 113 0.853 96
34 Scallop Dredge AA LIM NE all 298 0 298 0.559 167
35 Scallop Dredge OPEN GEN MA all 38 0 38 0.630 24
36 Scallop Dredge OPEN GEN NE all 18 0 18 1.252 23
37 Scallop Dredge OPEN LIM MA all 79 0 79 0.837 66
38 Scallop Dredge OPEN LIM NE all 558 0 558 0.600 335
39 Danish Seine OPEN all MA all 0 0 P
40 Mid-water Paired & Single Trawl AA all NE all 11 11 0
42 Mid-water Paired & Single Trawl OPEN all NE all 0 0 0
43 Pots and Traps, Fish OPEN all MA all 0 0 0
44 Pots and Traps, Fish OPEN all NE all 0 0 0
45 Pots and Traps, Conch OPEN all MA all 0 0 0
46 Pots and Traps, Conch OPEN all NE all 0 0 0
47 Pots and Traps, Hagfish OPEN all NE all 0 0 P
48 Pots and Traps, Lobster OPEN all MA all 0 0 0
49 Pots and Traps, Lobster OPEN all NE all 0 0 0
50 Pots and Traps, Crab OPEN all MA all 0 0 P
51 Pots and Traps, Crab OPEN all NE all 0 0 P
52 Beam Trawl OPEN all MA all 500 500 P
53 Beam Trawl OPEN all NE all 0 0 P
54 Dredge, Other OPEN all MA all 0 0 P
55 Ocean Quahog/Surfclam Dredge OPEN all MA all 0 0 0
56 Ocean Quahog/Surfclam Dredge OPEN all NE all 0 0 0
Confidential fleets 0 0
Other minor fleets 0 0
TOTAL 6,486,596 5,261,813 1,224,783 0.136 166,064

See text for fleet abbreviations. 94
Table 5B, continued. Total catch (live lb), Vessel Trip Report landings (kept; live lb), estimated discards (live lb), associated coefficient of variation (CV), and standard error of the estimated discards (SE; live lb) for 23 individual species that compose the 14 species groups, by fleet, based on July 2015 through June 2016 data. Dark shading indicates fleets not considered or with no Northeast Fisheries Observer Program trips in the annual analysis. These CVs were not used in the annual sample size analysis. Blank CV indicates either no discards estimated or discards equals 0. "P" indicates fleets with "pilot" designation.
Species: LONGFIN INSHORE SQUID (Doryteuthis [Amerigo] pealeii) Fleet Row Gear Type Access Trip Region Mesh Area Category Group Total Kept Discarded CV SE Pilot
1 Longline OPEN all MA all 0 0 0
2 Longline OPEN all NE all 0 0 0
3 Hand Line OPEN all MA all 5 5 0 P
4 Hand Line OPEN all NE all 21 21 0
5 Otter Trawl OPEN all MA sm 11,458,858 10,799,485 659,373 0.536 353,683
6 Otter Trawl OPEN all MA lg 681,336 651,333 30,003 0.445 13,346
7 Otter Trawl OPEN all NE sm 26,524,174 26,341,590 182,584 0.242 44,106
8 Otter Trawl OPEN all NE lg 491,636 480,378 11,258 0.354 3,982
9 Scallop Trawl AA GEN MA all 456 0 456 0.895 408
11 Scallop Trawl OPEN GEN MA all 12 8 4 0.855 3
12 Scallop Trawl OPEN LIM MA all 31,520 31,520 P
13 Otter Trawl, Twin OPEN all MA all 1,710,879 1,709,716 1,163 0.067 78 P
14 Otter Trawl, Twin OPEN all NE all 928,201 912,808 15,393 0.263 4,053 P
16 Otter Trawl, Ruhle OPEN all NE sm 24,534 5,000 19,534 0.000 0 P
17 Otter Trawl, Ruhle OPEN all NE lg 1 1 P
18 Otter Trawl, Haddock Separator OPEN all NE lg 112 5 107 0.449 48
19 Shrimp Trawl OPEN all MA all 22,941 22,941 0 P
20 Shrimp Trawl OPEN all NE all 147,285 147,285 P
22 Floating Trap OPEN all NE all 6 6 P
23 Sink, Anchor, Drift Gillnet OPEN all MA sm 0 0 0
24 Sink, Anchor, Drift Gillnet OPEN all MA lg 732 732 0
25 Sink, Anchor, Drift Gillnet OPEN all MA xlg 8 0 8 0.965 8
26 Sink, Anchor, Drift Gillnet OPEN all NE sm 0 0 P
27 Sink, Anchor, Drift Gillnet OPEN all NE lg 0 0 0
28 Sink, Anchor, Drift Gillnet OPEN all NE xlg 0 0 0
29 Purse Seine OPEN all MA all 0 0 P
30 Purse Seine OPEN all NE all 0 0 0
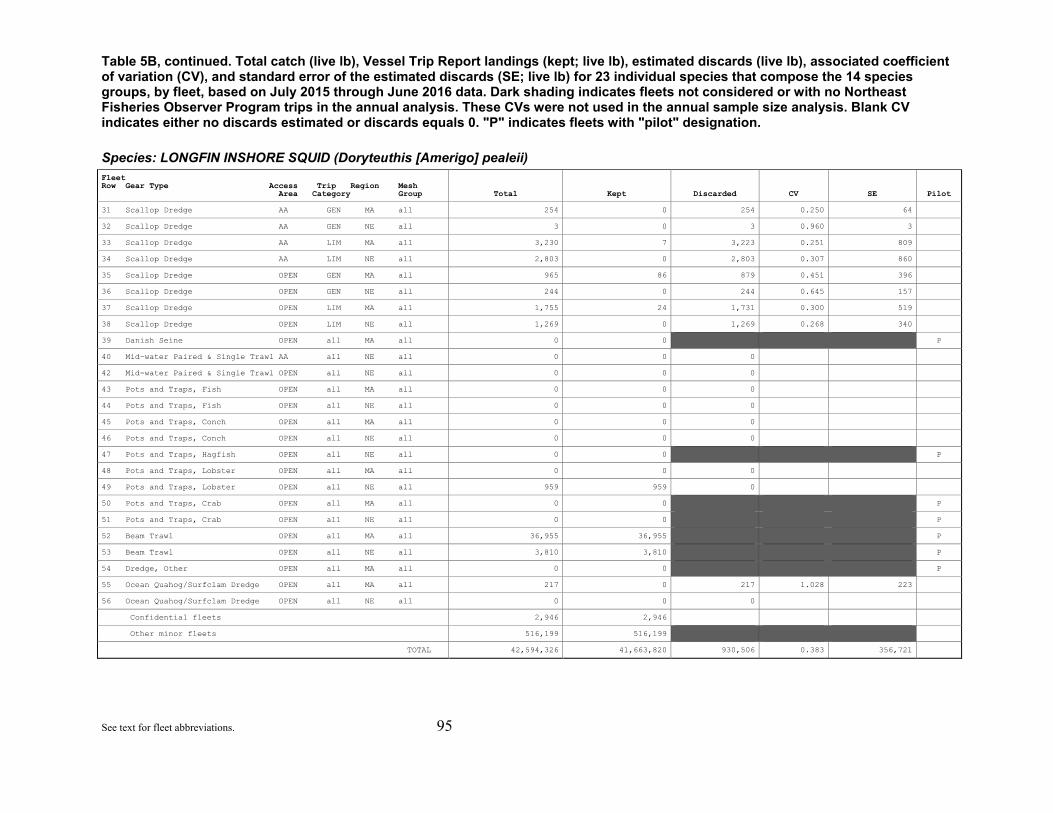
See text for fleet abbreviations. 95
Table 5B, continued. Total catch (live lb), Vessel Trip Report landings (kept; live lb), estimated discards (live lb), associated coefficient of variation (CV), and standard error of the estimated discards (SE; live lb) for 23 individual species that compose the 14 species groups, by fleet, based on July 2015 through June 2016 data. Dark shading indicates fleets not considered or with no Northeast Fisheries Observer Program trips in the annual analysis. These CVs were not used in the annual sample size analysis. Blank CV indicates either no discards estimated or discards equals 0. "P" indicates fleets with "pilot" designation.
Species: LONGFIN INSHORE SQUID (Doryteuthis [Amerigo] pealeii) Fleet Row Gear Type Access Trip Region Mesh Area Category Group Total Kept Discarded CV SE Pilot
31 Scallop Dredge AA GEN MA all 254 0 254 0.250 64
32 Scallop Dredge AA GEN NE all 3 0 3 0.960 3
33 Scallop Dredge AA LIM MA all 3,230 7 3,223 0.251 809
34 Scallop Dredge AA LIM NE all 2,803 0 2,803 0.307 860
35 Scallop Dredge OPEN GEN MA all 965 86 879 0.451 396
36 Scallop Dredge OPEN GEN NE all 244 0 244 0.645 157
37 Scallop Dredge OPEN LIM MA all 1,755 24 1,731 0.300 519
38 Scallop Dredge OPEN LIM NE all 1,269 0 1,269 0.268 340
39 Danish Seine OPEN all MA all 0 0 P
40 Mid-water Paired & Single Trawl AA all NE all 0 0 0
42 Mid-water Paired & Single Trawl OPEN all NE all 0 0 0
43 Pots and Traps, Fish OPEN all MA all 0 0 0
44 Pots and Traps, Fish OPEN all NE all 0 0 0
45 Pots and Traps, Conch OPEN all MA all 0 0 0
46 Pots and Traps, Conch OPEN all NE all 0 0 0
47 Pots and Traps, Hagfish OPEN all NE all 0 0 P
48 Pots and Traps, Lobster OPEN all MA all 0 0 0
49 Pots and Traps, Lobster OPEN all NE all 959 959 0
50 Pots and Traps, Crab OPEN all MA all 0 0 P
51 Pots and Traps, Crab OPEN all NE all 0 0 P
52 Beam Trawl OPEN all MA all 36,955 36,955 P
53 Beam Trawl OPEN all NE all 3,810 3,810 P
54 Dredge, Other OPEN all MA all 0 0 P
55 Ocean Quahog/Surfclam Dredge OPEN all MA all 217 0 217 1.028 223
56 Ocean Quahog/Surfclam Dredge OPEN all NE all 0 0 0
Confidential fleets 2,946 2,946
Other minor fleets 516,199 516,199
TOTAL 42,594,326 41,663,820 930,506 0.383 356,721

See text for fleet abbreviations 96
Table 5C. Total catch (live lb), Vessel Trip Report landings (kept; live lb), estimated discards (live lb), associated coefficient of variation (CV), and standard error of the estimated discards (SE; live lb) for 14 Standardized Bycatch Reporting Methodology (SBRM) species groups combined, by fleet, based on July 2015 through June 2016 data. Dark shading indicates fleets not considered or with no Northeast Fisheries Observer Program trips in the annual analysis. These CV were not used in the annual sample size analysis. Blank CV indicates either no discards or discards equals 0. "P" indicates fleets with "pilot" designation.
Species: 14 SBRM SPECIES GROUPS COMBINED
Fleet Row Gear Type Access Trip Region Mesh Area Category Group Total Kept Discarded CV SE Pilot
1 Longline OPEN all MA all 1,395,876 1,155,953 239,923 0.293 70,288
2 Longline OPEN all NE all 3,949,633 3,236,766 712,867 0.391 278,920
3 Hand Line OPEN all MA all 295,388 295,388 0 P
4 Hand Line OPEN all NE all 2,502,557 2,420,243 82,314 1.272 104,681
5 Otter Trawl OPEN all MA sm 40,617,554 22,783,110 17,834,444 0.091 1,625,413
6 Otter Trawl OPEN all MA lg 39,321,081 15,847,982 23,473,099 0.109 2,548,548
7 Otter Trawl OPEN all NE sm 63,571,021 52,410,056 11,160,966 0.085 947,546
8 Otter Trawl OPEN all NE lg 87,963,325 49,838,534 38,124,791 0.089 3,388,088
9 Scallop Trawl AA GEN MA all 1,942,298 770,913 1,171,385 0.279 326,485
11 Scallop Trawl OPEN GEN MA all 184,981 94,556 90,425 0.404 36,527
12 Scallop Trawl OPEN LIM MA all 65,861 65,861 P
13 Otter Trawl, Twin OPEN all MA all 2,315,245 2,041,787 273,458 0.644 176,096 P
14 Otter Trawl, Twin OPEN all NE all 1,189,172 956,977 232,195 0.106 24,583 P
16 Otter Trawl, Ruhle OPEN all NE sm 1,348,709 1,278,037 70,672 0.000 0 P
17 Otter Trawl, Ruhle OPEN all NE lg 84,471 84,471 P
18 Otter Trawl, Haddock Separator OPEN all NE lg 5,705,411 4,133,646 1,571,765 0.198 310,827
19 Shrimp Trawl OPEN all MA all 227,203 24,682 202,521 0.000 0 P
20 Shrimp Trawl OPEN all NE all 216,788 216,788 P
22 Floating Trap OPEN all NE all 4,406 4,406 P
23 Sink, Anchor, Drift Gillnet OPEN all MA sm 2,229,625 2,102,717 126,908 0.418 53,098
24 Sink, Anchor, Drift Gillnet OPEN all MA lg 6,400,571 6,049,093 351,477 0.158 55,623
25 Sink, Anchor, Drift Gillnet OPEN all MA xlg 6,877,249 5,636,861 1,240,389 0.108 134,572
26 Sink, Anchor, Drift Gillnet OPEN all NE sm 2,286 2,286 P
27 Sink, Anchor, Drift Gillnet OPEN all NE lg 9,795,676 7,288,013 2,507,663 0.144 359,867
28 Sink, Anchor, Drift Gillnet OPEN all NE xlg 21,662,437 18,829,387 2,833,050 0.132 373,882
29 Purse Seine OPEN all MA all 0 0 P
30 Purse Seine OPEN all NE all 55,868,638 55,865,565 3,073 1.113 3,422
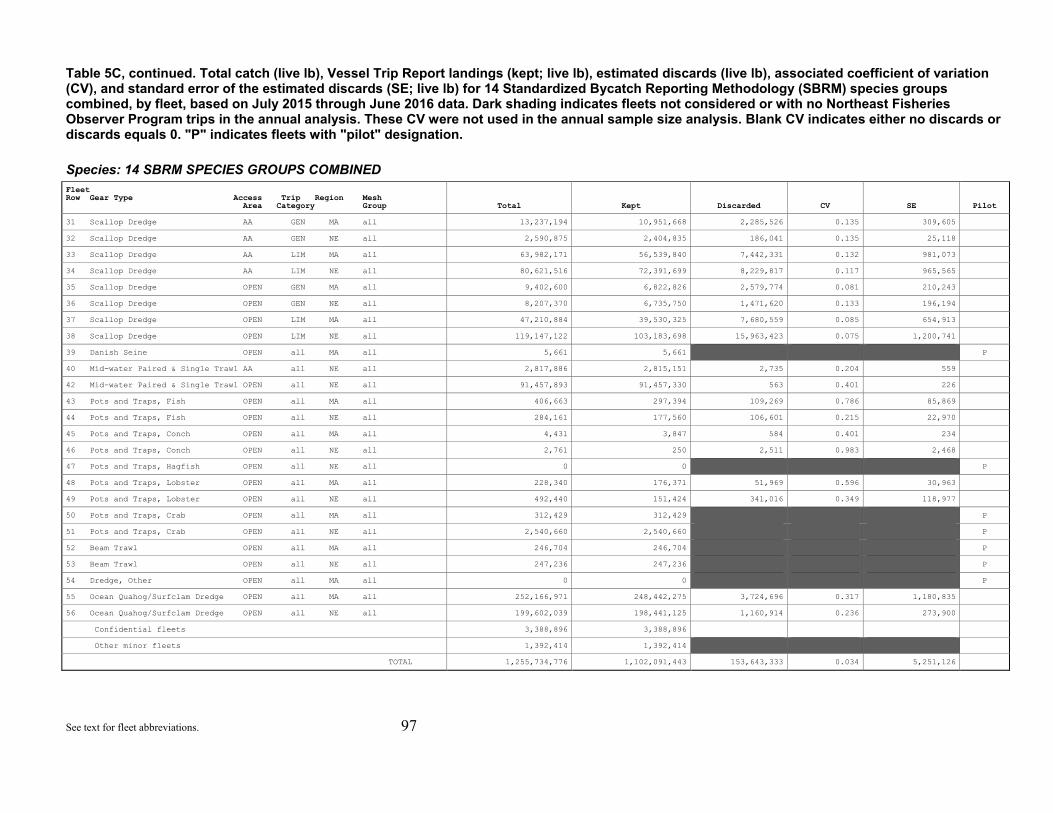
See text for fleet abbreviations. 97
Table 5C, continued. Total catch (live lb), Vessel Trip Report landings (kept; live lb), estimated discards (live lb), associated coefficient of variation (CV), and standard error of the estimated discards (SE; live lb) for 14 Standardized Bycatch Reporting Methodology (SBRM) species groups combined, by fleet, based on July 2015 through June 2016 data. Dark shading indicates fleets not considered or with no Northeast Fisheries Observer Program trips in the annual analysis. These CV were not used in the annual sample size analysis. Blank CV indicates either no discards or discards equals 0. "P" indicates fleets with "pilot" designation.
Species: 14 SBRM SPECIES GROUPS COMBINED
Fleet Row Gear Type Access Trip Region Mesh Area Category Group Total Kept Discarded CV SE Pilot
31 Scallop Dredge AA GEN MA all 13,237,194 10,951,668 2,285,526 0.135 309,605
32 Scallop Dredge AA GEN NE all 2,590,875 2,404,835 186,041 0.135 25,118
33 Scallop Dredge AA LIM MA all 63,982,171 56,539,840 7,442,331 0.132 981,073
34 Scallop Dredge AA LIM NE all 80,621,516 72,391,699 8,229,817 0.117 965,565
35 Scallop Dredge OPEN GEN MA all 9,402,600 6,822,826 2,579,774 0.081 210,243
36 Scallop Dredge OPEN GEN NE all 8,207,370 6,735,750 1,471,620 0.133 196,194
37 Scallop Dredge OPEN LIM MA all 47,210,884 39,530,325 7,680,559 0.085 654,913
38 Scallop Dredge OPEN LIM NE all 119,147,122 103,183,698 15,963,423 0.075 1,200,741
39 Danish Seine OPEN all MA all 5,661 5,661 P
40 Mid-water Paired & Single Trawl AA all NE all 2,817,886 2,815,151 2,735 0.204 559
42 Mid-water Paired & Single Trawl OPEN all NE all 91,457,893 91,457,330 563 0.401 226
43 Pots and Traps, Fish OPEN all MA all 406,663 297,394 109,269 0.786 85,869
44 Pots and Traps, Fish OPEN all NE all 284,161 177,560 106,601 0.215 22,970
45 Pots and Traps, Conch OPEN all MA all 4,431 3,847 584 0.401 234
46 Pots and Traps, Conch OPEN all NE all 2,761 250 2,511 0.983 2,468
47 Pots and Traps, Hagfish OPEN all NE all 0 0 P
48 Pots and Traps, Lobster OPEN all MA all 228,340 176,371 51,969 0.596 30,963
49 Pots and Traps, Lobster OPEN all NE all 492,440 151,424 341,016 0.349 118,977
50 Pots and Traps, Crab OPEN all MA all 312,429 312,429 P
51 Pots and Traps, Crab OPEN all NE all 2,540,660 2,540,660 P
52 Beam Trawl OPEN all MA all 246,704 246,704 P
53 Beam Trawl OPEN all NE all 247,236 247,236 P
54 Dredge, Other OPEN all MA all 0 0 P
55 Ocean Quahog/Surfclam Dredge OPEN all MA all 252,166,971 248,442,275 3,724,696 0.317 1,180,835
56 Ocean Quahog/Surfclam Dredge OPEN all NE all 199,602,039 198,441,125 1,160,914 0.236 273,900
Confidential fleets 3,388,896 3,388,896
Other minor fleets 1,392,414 1,392,414
TOTAL 1,255,734,776 1,102,091,443 153,643,333 0.034 5,251,126

See text for fleet abbreviations. 98
Table 6. The number of sea days needed to achieve a 30% coefficient of variation of the discard estimate for each of the 14 fish and invertebrate species groups, the number of pilot sea days, the number of minimum pilot sea days, and the maximum number of sea days needed for each fleet (2017 Sea Days Needed) for fish and invertebrate species groups based on July 2015 through June 2016 data. Bold red font indicates basis for fleet sea days. "P" indicates fleets with "pilot" designation. Species group abbreviations are given in Table 1.
Row
Fleet Gear Access Trip Region Mesh Type Area Category Group BLUE HERR SAL RCRAB SCAL SBM MONK GFL GFS SKATE DOG FSB SCOQ TILE
Pilot Days
Min Pilot Days
2017 Sea Days Needed Pilot
1 Longline OPEN all MA all 0 0 0 0 0 0 0 0 0 0 0 0 0 0 94 94 94
2 Longline OPEN all NE all 0 0 0 0 0 0 0 0 0 0 44 0 0 0 22 14 44 3 Hand Line OPEN all MA all 65 65 65 65 65 65 65 65 65 65 65 65 65 65 65 13 65 P
4 Hand Line OPEN all NE all 0 0 0 0 0 0 0 0 0 0 0 0 0 0 66 14 14
5 Otter Trawl OPEN all MA sm 0 0 0 0 0 719 450 0 1,010 189 323 130 0 0 141 28 1,010
6 Otter Trawl OPEN all MA lg 0 0 0 0 0 0 183 125 0 80 167 172 0 0 186 30 183
7 Otter Trawl OPEN all NE sm 0 0 0 0 0 331 1,946 490 520 448 468 392 0 0 209 35 1,946
8 Otter Trawl OPEN all NE lg 0 0 0 5,256 0 0 314 353 598 342 301 796 0 0 318 36 5,256
9 Scallop Trawl AA GEN MA all 0 0 0 0 0 0 0 0 0 0 50 0 0 0 13 13 50
10 Scallop Trawl AA LIM MA all 0 0 0 0 0 0 0 0 0 0 0 0 0 0 0 0 0 P
11 Scallop Trawl OPEN GEN MA all 0 0 0 0 0 0 0 0 0 0 0 0 0 0 17 17 17
12 Scallop Trawl OPEN LIM MA all 33 33 33 33 33 33 33 33 33 33 33 33 33 33 33 33 33 P
13 Otter Trawl, Twin OPEN all MA all 30 30 30 30 30 30 30 30 30 30 30 30 30 30 30 30 30 P
14 Otter Trawl, Twin OPEN all NE all 89 89 89 89 89 89 89 89 89 89 89 89 89 89 89 89 89 P
15 Otter Trawl, Ruhle OPEN all MA lg 4 4 4 4 4 4 4 4 4 4 4 4 4 4 4 4 4 P
16 Otter Trawl, Ruhle OPEN all NE sm 14 14 14 14 14 14 14 14 14 14 14 14 14 14 14 14 14 P
17 Otter Trawl, Ruhle OPEN all NE lg 24 24 24 24 24 24 24 24 24 24 24 24 24 24 24 24 24 P
18 Otter Trawl, Haddock Separator OPEN all NE lg 0 0 0 0 0 0 0 219 0 0 0 0 0 0 102 102 219
19 Shrimp Trawl OPEN all MA all 50 50 50 50 50 50 50 50 50 50 50 50 50 50 50 50 50 P
20 Shrimp Trawl OPEN all NE all 33 33 33 33 33 33 33 33 33 33 33 33 33 33 33 33 33 P
21 Floating Trap OPEN all MA all 6 6 6 6 6 6 6 6 6 6 6 6 6 6 6 6 6 P
22 Floating Trap OPEN all NE all 3 3 3 3 3 3 3 3 3 3 3 3 3 3 3 3 3 P
23 Sink, Anchor, Drift Gillnet OPEN all MA sm 0 0 0 0 0 0 0 0 0 0 0 0 0 0 33 12 12
24 Sink, Anchor, Drift Gillnet OPEN all MA lg 0 0 0 0 0 0 0 0 0 0 116 0 0 0 46 13 116
25 Sink, Anchor, Drift Gillnet OPEN all MA xlg 0 0 0 0 0 0 0 0 0 33 0 0 0 0 41 14 33
26 Sink, Anchor, Drift Gillnet OPEN all NE sm 0 0 0 0 0 0 0 0 0 0 0 0 0 0 0 0 0 P
27 Sink, Anchor, Drift Gillnet OPEN all NE lg 0 0 0 0 0 0 0 0 0 0 240 0 0 0 80 21 240
28 Sink, Anchor, Drift Gillnet OPEN all NE xlg 0 0 0 0 0 0 162 0 0 197 507 0 0 0 102 19 507
29 Purse Seine OPEN all MA all 7 7 7 7 7 7 7 7 7 7 7 7 7 7 7 6 7 P
30 Purse Seine OPEN all NE all 0 0 0 0 0 0 0 0 0 0 0 0 0 0 23 21 21
31 Scallop Dredge AA GEN MA all 0 0 0 0 0 0 0 0 0 0 0 0 0 0 90 26 26
32 Scallop Dredge AA GEN NE all 0 0 0 0 0 0 0 0 0 0 0 0 0 0 34 23 23
33 Scallop Dredge AA LIM MA all 0 0 0 0 154 0 82 0 0 125 0 0 0 0 100 85 154
34 Scallop Dredge AA LIM NE all 0 0 0 0 187 0 128 0 0 101 0 0 0 0 114 93 187
35 Scallop Dredge OPEN GEN MA all 0 0 0 0 0 0 55 0 0 16 0 0 0 0 79 26 55

See text for fleet abbreviations. 99
Table 6, continued. The number of sea days needed to achieve a 30% coefficient of variation of the discard estimate for each of the 14 fish and invertebrate species groups, the number of pilot sea days, the number of minimum pilot sea days, and the maximum number of sea days needed for each fleet (2017 Sea Days Needed) for fish and invertebrate species groups based on July 2015 through June 2016 data. Bold red font indicates basis for fleet sea days. "P" indicates fleets with "pilot" designation. Species group abbreviations are given in Table 1.
Row
Fleet Gear Access Trip Region Mesh Type Area Category Group BLUE HERR SAL RCRAB SCAL SBM MONK GFL GFS SKATE DOG FSB SCOQ TILE
Pilot Days
Min Pilot Days
2017 Sea Days Needed Pilot
36 Scallop Dredge OPEN GEN NE all 0 0 0 0 0 0 41 0 0 58 0 0 0 0 85 18 58
37 Scallop Dredge OPEN LIM MA all 0 0 0 0 0 0 46 0 0 34 0 0 0 0 103 97 46
38 Scallop Dredge OPEN LIM NE all 0 0 0 0 406 0 272 160 489 130 0 563 0 0 185 109 563
39 Danish Seine OPEN all MA all 7 7 7 7 7 7 7 7 7 7 7 7 7 7 7 7 7 P
40 Mid-water Paired & Single Trawl AA all NE all 0 0 0 0 0 0 0 0 0 0 0 0 0 0 25 25 25
41 Mid-water Paired & Single Trawl OPEN all MA all 13 13 13 13 13 13 13 13 13 13 13 13 13 13 13 13 13 P
42 Mid-water Paired & Single Trawl OPEN all NE all 0 0 0 0 0 0 0 0 0 0 0 0 0 0 40 40 40
43 Pots and Traps, Fish OPEN all MA all 0 0 0 0 0 0 0 0 0 0 0 0 0 0 16 13 13
44 Pots and Traps, Fish OPEN all NE all 0 0 0 0 0 0 0 0 0 0 0 0 0 0 15 10 10
45 Pots and Traps, Conch OPEN all MA all 0 0 0 0 0 0 0 0 0 0 0 0 0 0 25 12 12
46 Pots and Traps, Conch OPEN all NE all 0 0 0 0 0 0 0 0 0 0 0 0 0 0 26 9 9
47 Pots and Traps, Hagfish OPEN all NE all 97 97 97 97 97 97 97 97 97 97 97 97 97 97 97 97 97 P
48 Pots and Traps, Lobster OPEN all MA all 0 0 0 0 0 0 0 0 0 0 0 0 0 0 37 15 15
49 Pots and Traps, Lobster OPEN all NE all 0 0 0 602 0 0 0 0 0 0 0 0 0 0 459 17 602
50 Pots and Traps, Crab OPEN all MA all 28 28 28 28 28 28 28 28 28 28 28 28 28 28 28 28 28 P
51 Pots and Traps, Crab OPEN all NE all 83 83 83 83 83 83 83 83 83 83 83 83 83 83 83 83 83 P
52 Beam Trawl OPEN all MA all 31 31 31 31 31 31 31 31 31 31 31 31 31 31 31 31 31 P
53 Beam Trawl OPEN all NE all 13 13 13 13 13 13 13 13 13 13 13 13 13 13 13 13 13 P
54 Dredge, Other OPEN all MA all 11 11 11 11 11 11 11 11 11 11 11 11 11 11 11 10 11 P
55 Ocean Quahog/Surfclam Dredge OPEN all MA all 0 0 0 0 0 0 0 0 0 0 0 0 0 0 63 21 21
56 Ocean Quahog/Surfclam Dredge OPEN all NE all 0 0 0 0 0 0 0 0 0 0 0 0 0 0 56 16 16
Total 641 641 641 6,499 1,388 1,691 4,320 1,988 3,258 2,394 2,857 2,694 641 641 3,686 1,725 12,278
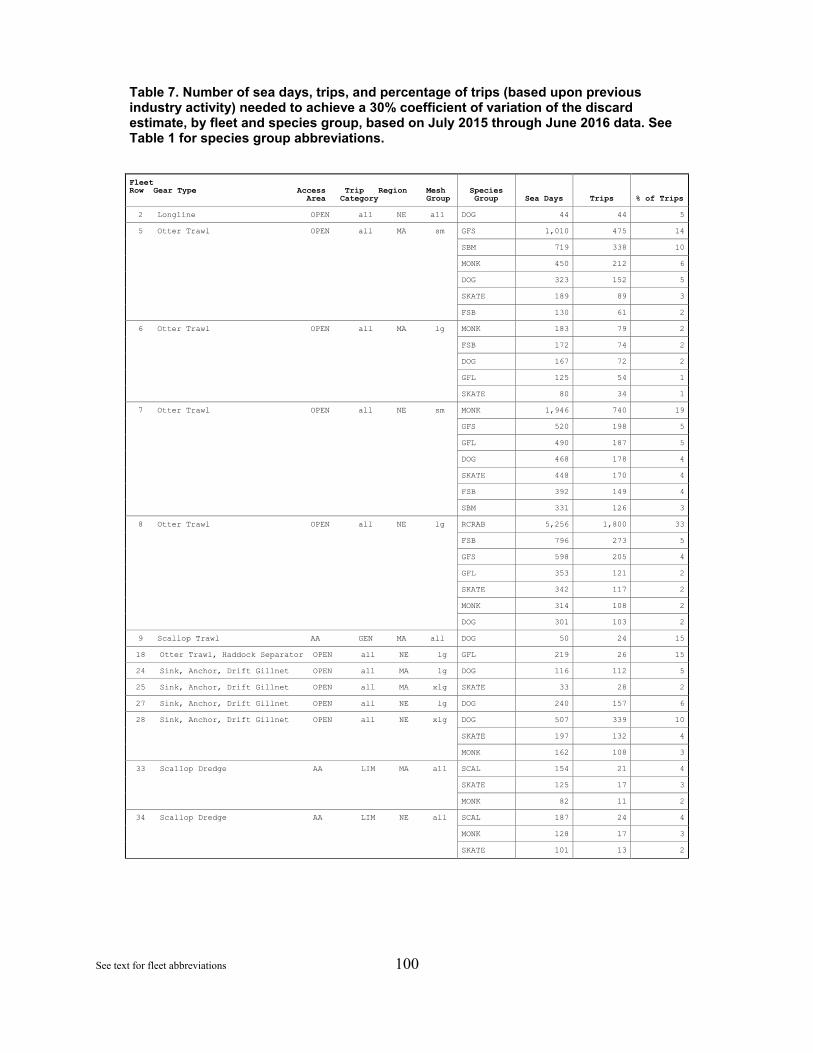
See text for fleet abbreviations 100
Table 7. Number of sea days, trips, and percentage of trips (based upon previous industry activity) needed to achieve a 30% coefficient of variation of the discard estimate, by fleet and species group, based on July 2015 through June 2016 data. See Table 1 for species group abbreviations.
Fleet Row Gear Type Access Trip Region Mesh Area Category Group
Species Group Sea Days Trips % of Trips
2 Longline OPEN all NE all DOG 44 44 5
5 Otter Trawl OPEN all MA sm GFS 1,010 475 14
SBM 719 338 10
MONK 450 212 6
DOG 323 152 5
SKATE 189 89 3
FSB 130 61 2
6 Otter Trawl OPEN all MA lg MONK 183 79 2
FSB 172 74 2
DOG 167 72 2
GFL 125 54 1
SKATE 80 34 1
7 Otter Trawl OPEN all NE sm MONK 1,946 740 19
GFS 520 198 5
GFL 490 187 5
DOG 468 178 4
SKATE 448 170 4
FSB 392 149 4
SBM 331 126 3
8 Otter Trawl OPEN all NE lg RCRAB 5,256 1,800 33
FSB 796 273 5
GFS 598 205 4
GFL 353 121 2
SKATE 342 117 2
MONK 314 108 2
DOG 301 103 2
9 Scallop Trawl AA GEN MA all DOG 50 24 15
18 Otter Trawl, Haddock Separator OPEN all NE lg GFL 219 26 15
24 Sink, Anchor, Drift Gillnet OPEN all MA lg DOG 116 112 5
25 Sink, Anchor, Drift Gillnet OPEN all MA xlg SKATE 33 28 2
27 Sink, Anchor, Drift Gillnet OPEN all NE lg DOG 240 157 6
28 Sink, Anchor, Drift Gillnet OPEN all NE xlg DOG 507 339 10
SKATE 197 132 4
MONK 162 108 3
33 Scallop Dredge AA LIM MA all SCAL 154 21 4
SKATE 125 17 3
MONK 82 11 2
34 Scallop Dredge AA LIM NE all SCAL 187 24 4
MONK 128 17 3
SKATE 101 13 2

See text for fleet abbreviations. 101
Table 7, continued. Number of sea days, trips, and percentage of trips (based upon previous industry activity) needed to achieve a 30% coefficient of variation of the discard estimate, by fleet and species group, based on July 2015 through June 2016 data. See Table 1 for species group abbreviations.
Fleet Row Gear Type Access Trip Region Mesh Area Category Group
Species Group Sea Days Trips % of Trips
35 Scallop Dredge OPEN GEN MA all MONK 55 26 1
SKATE 16 7 0
36 Scallop Dredge OPEN GEN NE all SKATE 58 40 1
MONK 41 28 1
37 Scallop Dredge OPEN LIM MA all MONK 46 5 1
SKATE 34 4 1
38 Scallop Dredge OPEN LIM NE all FSB 563 59 6
GFS 489 51 6
SCAL 406 43 5
MONK 272 29 3
GFL 160 17 2
SKATE 130 14 1
49 Pots and Traps, Lobster OPEN all NE all RCRAB 602 463 2