ta enterprise berhad (194867-m) condensed … · ta enterprise berhad (194867-m) condensed...
TRANSCRIPT

TA ENTERPRISE BERHAD (194867-M)
CONDENSED CONSOLIDATED STATEMENT OF FINANCIAL POSIT ION AS AT 31 JANUARY 2013
31/1/2013
RM'000
(Restated) (Restated)
ASSETSNon-current assets
Property, plant and equipment 2,182,645 1,929,715 1,726,442 Investment property 178,419 179,961 185,669 Land held for property development 414,614 411,485 410,033 Prepaid land lease payments 213 220 227 Intangible assets 366,957 297,810 270,360 Land use rights 7,415 7,510 - Associated companies 25,229 26,271 14,874 Jointly controlled operations 107,013 87,506 47,609 Jointly controlled entity 92,669 - - Investment securities 225,800 158,229 23,164 Financial receivables 303,180 266,648 207,978 Deferred lease registration fee 109 - - Deferred tax assets 7,059 7,413 10,308
3,911,322 3,372,768 2,896,664
Current assetsProperty development costs 22,362 35,078 36,064 Properties & land held for resale 40,716 39,627 23,567 Inventories 4,462 2,489 1,815 Financial receivables 150,509 99,480 137,960 Trade receivables 536,796 489,179 600,792 Other receivables 68,759 112,978 126,889 Investment securities 153,953 37,229 8,463 Short term funds 234,778 380,449 378,821
1,212,335 1,196,509 1,314,371
TOTAL ASSETS 5,123,657 4,569,277 4,211,035
EQUITY AND LIABILITIESEquity attributable to equity holders of the Company
Share capital 1,711,910 1,711,910 1,711,910 Reserves (17,176) (113,311) (215,533)
1,694,734 1,598,599 1,496,377
Non-controlling interests 1,232,759 1,206,998 1,176,974 TOTAL EQUITY 2,927,493 2,805,597 2,673,351
Non-current liabilitiesDeferred tax liabilities 266,553 236,025 212,482 Borrowings 911,275 800,124 711,813
1,177,828 1,036,149 924,295
Current liabilitiesProvision for liabilities 2,696 3,665 3,235 Borrowings 337,283 119,608 44,831 Trade payables 352,655 417,181 401,545 Other payables 310,619 175,328 152,458 Derivatives 1,688 1,736 - Income tax payable 13,395 10,013 11,320
1,018,336 727,531 613,389
TOTAL LIABILITIES 2,196,164 1,763,680 1,537,684
TOTAL EQUITY AND LIABILITIES 5,123,657 4,569,277 4,211,035
Net assets value per share (RM) 1.71 1.64 1.56
AS AT BEGINNING OF PRECEDING
FINANCIAL YEAR END
RM'000
31/1/2011
(The Condensed Consolidated Statement of Financial Position should be read in conjunction with the Annual Financial Report for the year ended 31 January 2012)
AS AT END OF CURRENT
QUARTER
AS AT PRECEDING FINANCIAL YEAR END
31/1/2012
RM'000
Page 1 of 25
TA ENTERPRISE BERHAD (194867-M)
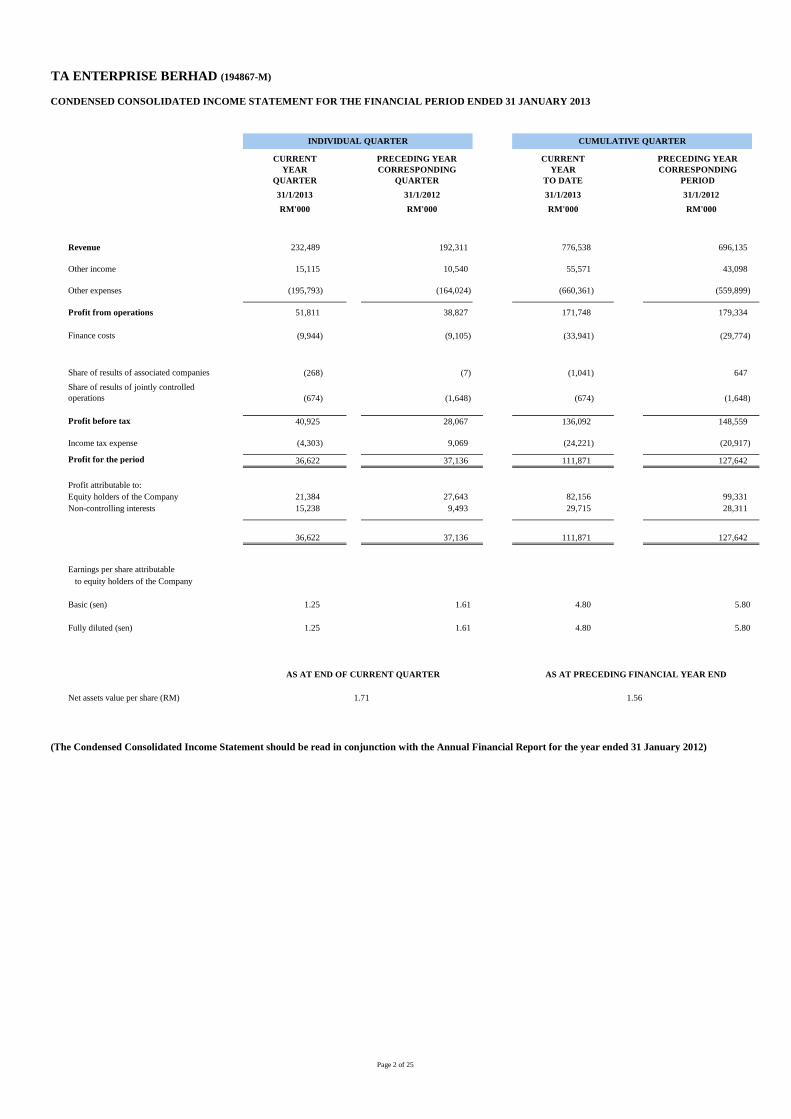
CONDENSED CONSOLIDATED INCOME STATEMENT FOR THE FIN ANCIAL PERIOD ENDED 31 JANUARY 2013
CURRENT YEAR
QUARTER
PRECEDING YEAR CORRESPONDING
QUARTER
CURRENTYEAR
TO DATE
PRECEDING YEAR CORRESPONDING
PERIOD
31/1/2013 31/1/2012 31/1/2013 31/1/2012
RM'000 RM'000 RM'000 RM'000
Revenue 232,489 192,311 776,538 696,135
Other income 15,115 10,540 55,571 43,098
Other expenses (195,793) (164,024) (660,361) (559,899)
Profit from operations 51,811 38,827 171,748 179,334
Finance costs (9,944) (9,105) (33,941) (29,774)
Share of results of associated companies (268) (7) (1,041) 647
Share of results of jointly controlled operations (674) (1,648) (674) (1,648)
Profit before tax 40,925 28,067 136,092 148,559
Income tax expense (4,303) 9,069 (24,221) (20,917)
Profit for the period 36,622 37,136 111,871 127,642
Profit attributable to:Equity holders of the Company 21,384 27,643 82,156 99,331 Non-controlling interests 15,238 9,493 29,715 28,311
36,622 37,136 111,871 127,642
Earnings per share attributable to equity holders of the Company
Basic (sen) 1.25 1.61 4.80 5.80
Fully diluted (sen) 1.25 1.61 4.80 5.80
AS AT END OF CURRENT QUARTER AS AT PRECEDING FINANCI AL YEAR END
Net assets value per share (RM) 1.71 1.56
(The Condensed Consolidated Income Statement should be read in conjunction with the Annual Financial Report for the year ended 31 January 2012)
INDIVIDUAL QUARTER CUMULATIVE QUARTER
Page 2 of 25

TA ENTERPRISE BERHAD (194867-M)
CONDENSED CONSOLIDATED STATEMENT OF COMPREHENSIVE I NCOME FOR THE FINANCIAL PERIOD ENDED 31 JANUARY 201 3
CURRENT YEAR
QUARTER
PRECEDING YEAR CORRESPONDING
QUARTER
CURRENTYEAR
TO DATE
PRECEDING YEAR CORRESPONDING
PERIOD
31/1/2013 31/1/2012 31/1/2013 31/1/2012
RM'000 RM'000 RM'000 RM'000
Profit for the period 36,622 37,136 111,871 127,642
Other comprehensive income/(loss):
Foreign currency translation differences for foreign operation 35,018 (5,993) 42,093 41,617
Net gain/(loss) on fair value changes on available-for-sale financial assets 220 1,888 3,284 (1,734)
Income tax relating to components of other comprehensive income 345 17 157 11
Other comprehensive income/(loss) for the period, net of tax 35,583 (4,088) 45,534 39,894
Total comprehensive income/(loss) for the period 72,205 33,048 157,405 167,536
Total comprehensive income/(loss) attributable to:
Equity holders of the Company 44,814 24,477 121,814 127,901 Non-controlling interests 27,391 8,571 35,591 39,635
72,205 33,048 157,405 167,536
(The Condensed Consolidated Statement of Comprehensive Income should be read in conjunction with the Annual Financial Report for the year ended 31 January 2012)
INDIVIDUAL QUARTER CUMULATIVE QUARTER
Page 3 of 25

TA
EN
TE
RP
RIS
E B
ER
HA
D (
1948
67-M
)
CO
ND
EN
SE
D C
ON
SO
LID
AT
ED
ST
AT
EM
EN
T O
F C
HA
NG
ES
IN E
QU
IT
Y
FO
R T
HE
FIN
AN
CIA
L P
ER
IOD
EN
DE
D 3
1 JA
NU
AR
Y 2
013
Dis
trib
utab
le
Sha
re c
apita
l S
hare
pre
miu
m
Cap
ital r
eser
ve
Gene
ral r
eser
ve
Ava
ilabl
e-fo
r-sa
lere
serv
e E
xcha
nge
tran
slat
ion
rese
rve
Exc
hang
e di
ffer
ence
re
cogn
ised
in e
quity
R
etai
ned
prof
its/
(acc
umul
ated
loss
es)
Tot
al
Non
-con
trol
ling
inte
rest
sT
otal
Equ
ityR
M'0
00R
M'0
00R
M'0
00R
M'0
00R
M'0
00R
M'0
00R
M'0
00R
M'0
00R
M'
000
RM
'000
RM
'000
At 1
Feb
ruar
y 20
111
,71
1,9
10
6
3,2
08
10
,26
7
-
2
,08
6
1
71
,81
8
27
,83
2
(4
90
,74
4)
1
,49
6,3
77
1,1
76
,97
4
2
,67
3,3
51
Tot
al c
ompr
ehen
sive
inco
me/
(loss
) fo
r th
e pe
riod
-
-
-
-
(1,7
66
)
3
4,6
39
(4,3
03
)
99
,33
1
12
7,9
01
3
9,6
35
16
7,5
36
Tra
nsac
tion
with
ow
ners
Div
iden
d-
-
-
-
-
-
-
(25
,67
9)
(25
,67
9)
-
(25
,67
9)
D
ivid
end
to n
on-
cont
rolli
ng in
tere
sts
-
-
-
-
-
-
-
-
-
(9,6
11
)
(9
,61
1)
Tot
al tr
ansa
ctio
n w
ith o
wne
rs-
-
-
-
-
-
-
(25
,67
9)
(25
,67
9)
(9,6
11
)
(3
5,2
90
)
At 3
1 Ja
nuar
y 20
121
,71
1,9
10
6
3,2
08
10
,26
7
-
3
20
20
6,4
57
2
3,5
29
(41
7,0
92
)
1,5
98
,59
9
1
,20
6,9
98
2,8
05
,59
7
At 1
Feb
ruar
y 20
121
,71
1,9
10
6
3,2
08
10
,26
7
-
3
20
20
6,4
57
2
3,5
29
(41
7,0
92
)
1,5
98
,59
9
1
,20
6,9
98
2,8
05
,59
7
Tot
al c
ompr
ehen
sive
inco
me/
(loss
) fo
r th
e pe
riod
-
-
-
-
3,1
26
24
,49
6
1
2,0
36
82
,15
6
12
1,8
14
3
5,5
91
15
7,4
05
Tra
nsac
tion
with
ow
ners
Div
iden
d-
-
-
-
-
-
-
(25
,67
9)
(25
,67
9)
-
(25
,67
9)
D
ivid
end
to n
on-
cont
rolli
ng in
tere
sts
-
-
-
-
-
-
-
-
-
(9,8
30
)
(9
,83
0)
Tot
al tr
ansa
ctio
n w
ith o
wne
rs-
-
-
-
-
-
-
(25
,67
9)
(25
,67
9)
(9,8
30
)
(3
5,5
09
)
At 3
1 Ja
nuar
y 20
131
,71
1,9
10
6
3,2
08
10
,26
7
-
3
,44
6
2
30
,95
3
35
,56
5
(3
60
,61
5)
1
,69
4,7
34
1,2
32
,75
9
2
,92
7,4
93
Attr
ibut
able
to e
quity
hol
ders
of t
he C
ompa
ny
(The
Con
dens
ed C
onso
lidat
ed S
tate
men
t of C
hang
es in E
quity
sho
uld
be r
ead
in c
onju
nctio
n w
ith th
e A
nnua
l Fin
anci
al R
epor
t for
the
year
end
ed 3
1 Ja
nuar
y 201
2)
Non
-dis
trib
utab
le
Pa
ge 4
of
25
TA ENTERPRISE BERHAD (194867-M)
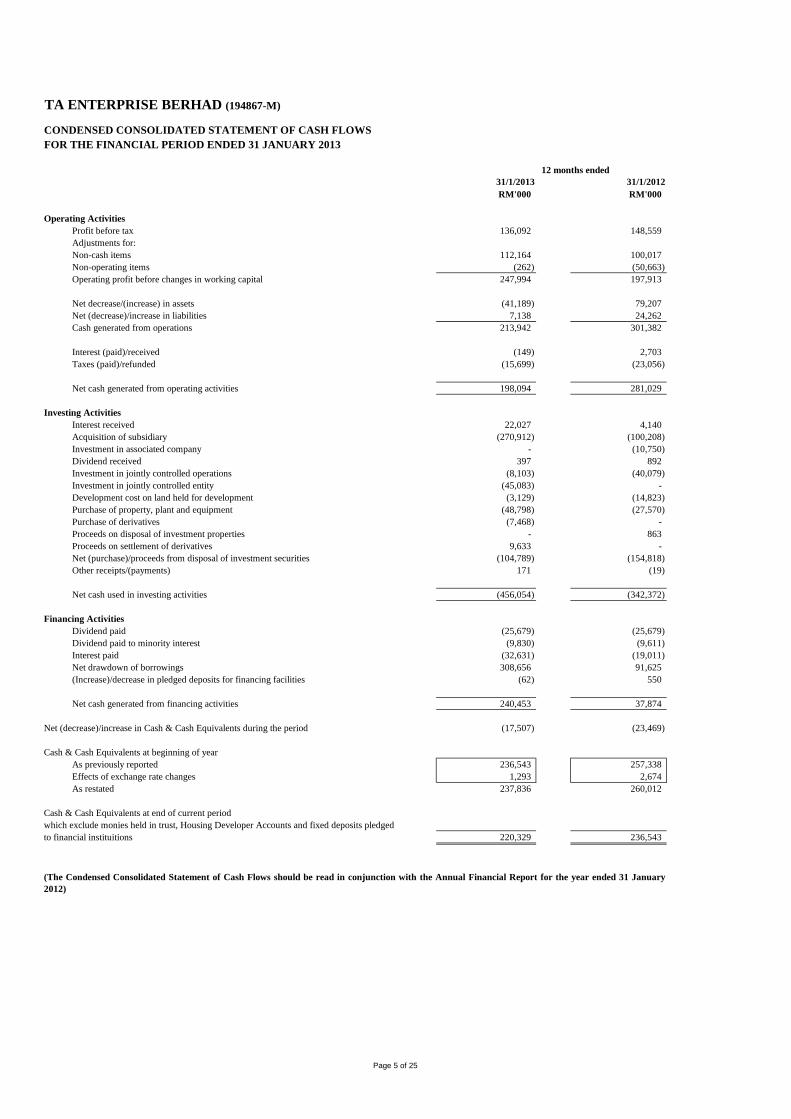
CONDENSED CONSOLIDATED STATEMENT OF CASH FLOWSFOR THE FINANCIAL PERIOD ENDED 31 JANUARY 2013
31/1/2013 31/1/2012RM'000 RM'000
Operating ActivitiesProfit before tax 136,092 148,559 Adjustments for:Non-cash items 112,164 100,017 Non-operating items (262) (50,663) Operating profit before changes in working capital 247,994 197,913
Net decrease/(increase) in assets (41,189) 79,207 Net (decrease)/increase in liabilities 7,138 24,262 Cash generated from operations 213,942 301,382
Interest (paid)/received (149) 2,703 Taxes (paid)/refunded (15,699) (23,056)
Net cash generated from operating activities 198,094 281,029
Investing ActivitiesInterest received 22,027 4,140 Acquisition of subsidiary (270,912) (100,208) Investment in associated company - (10,750) Dividend received 397 892 Investment in jointly controlled operations (8,103) (40,079) Investment in jointly controlled entity (45,083) - Development cost on land held for development (3,129) (14,823) Purchase of property, plant and equipment (48,798) (27,570) Purchase of derivatives (7,468) - Proceeds on disposal of investment properties - 863 Proceeds on settlement of derivatives 9,633 - Net (purchase)/proceeds from disposal of investment securities (104,789) (154,818) Other receipts/(payments) 171 (19)
Net cash used in investing activities (456,054) (342,372)
Financing ActivitiesDividend paid (25,679) (25,679) Dividend paid to minority interest (9,830) (9,611) Interest paid (32,631) (19,011) Net drawdown of borrowings 308,656 91,625 (Increase)/decrease in pledged deposits for financing facilities (62) 550
Net cash generated from financing activities 240,453 37,874
Net (decrease)/increase in Cash & Cash Equivalents during the period (17,507) (23,469)
Cash & Cash Equivalents at beginning of yearAs previously reported 236,543 257,338 Effects of exchange rate changes 1,293 2,674 As restated 237,836 260,012
Cash & Cash Equivalents at end of current periodwhich exclude monies held in trust, Housing Developer Accounts and fixed deposits pledgedto financial instituitions 220,329 236,543
12 months ended
(The Condensed Consolidated Statement of Cash Flows shouldbe read in conjunction with the Annual Financial Report for t he year ended 31 January2012)
Page 5 of 25
Page 6 of 25
TA ENTERPRISE BERHAD (194867-M)
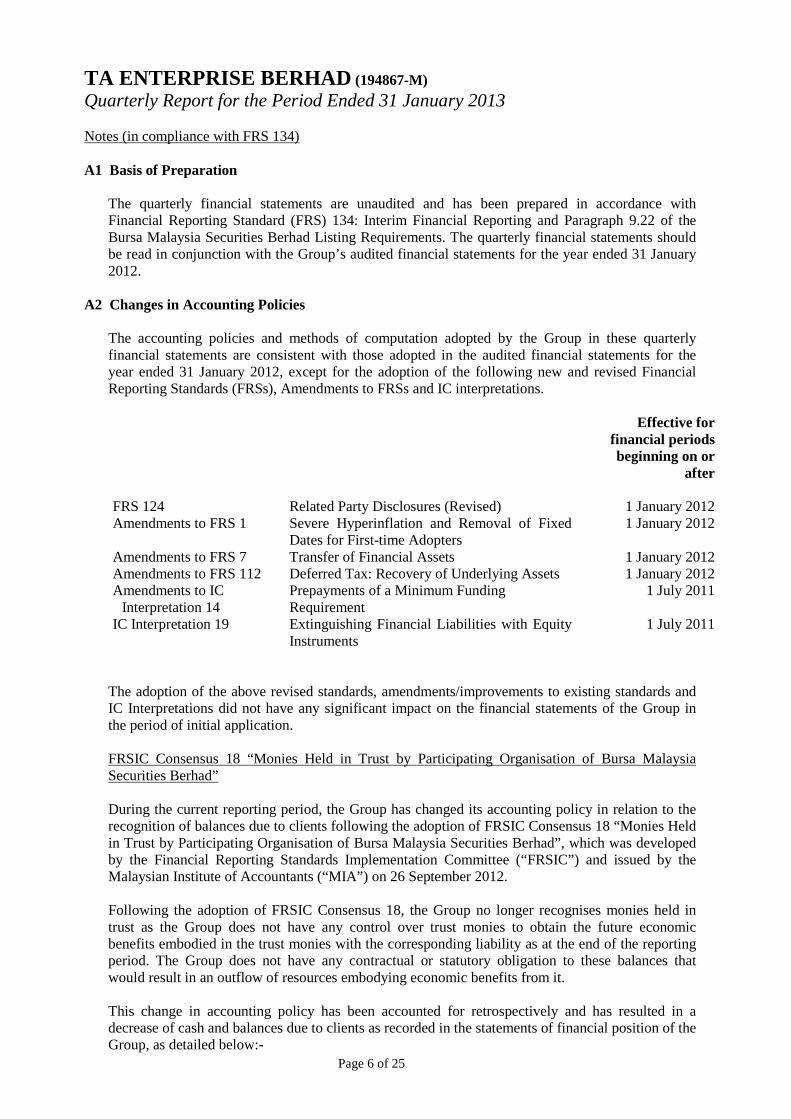
Quarterly Report for the Period Ended 31 January 2013 Notes (in compliance with FRS 134) A1 Basis of Preparation
The quarterly financial statements are unaudited and has been prepared in accordance with Financial Reporting Standard (FRS) 134: Interim Financial Reporting and Paragraph 9.22 of the Bursa Malaysia Securities Berhad Listing Requirements. The quarterly financial statements should be read in conjunction with the Group’s audited financial statements for the year ended 31 January 2012.
A2 Changes in Accounting Policies
The accounting policies and methods of computation adopted by the Group in these quarterly financial statements are consistent with those adopted in the audited financial statements for the year ended 31 January 2012, except for the adoption of the following new and revised Financial Reporting Standards (FRSs), Amendments to FRSs and IC interpretations.
Effective for
financial periods beginning on or
after
FRS 124 Amendments to FRS 1 Amendments to FRS 7
Related Party Disclosures (Revised) Severe Hyperinflation and Removal of Fixed Dates for First-time Adopters Transfer of Financial Assets
1 January 2012 1 January 2012
1 January 2012
Amendments to FRS 112 Deferred Tax: Recovery of Underlying Assets 1 January 2012 Amendments to IC
Interpretation 14 Prepayments of a Minimum Funding Requirement
1 July 2011
IC Interpretation 19 Extinguishing Financial Liabilities with Equity Instruments
1 July 2011
The adoption of the above revised standards, amendments/improvements to existing standards and IC Interpretations did not have any significant impact on the financial statements of the Group in the period of initial application. FRSIC Consensus 18 “Monies Held in Trust by Participating Organisation of Bursa Malaysia Securities Berhad” During the current reporting period, the Group has changed its accounting policy in relation to the recognition of balances due to clients following the adoption of FRSIC Consensus 18 “Monies Held in Trust by Participating Organisation of Bursa Malaysia Securities Berhad”, which was developed by the Financial Reporting Standards Implementation Committee (“FRSIC”) and issued by the Malaysian Institute of Accountants (“MIA”) on 26 September 2012. Following the adoption of FRSIC Consensus 18, the Group no longer recognises monies held in trust as the Group does not have any control over trust monies to obtain the future economic benefits embodied in the trust monies with the corresponding liability as at the end of the reporting period. The Group does not have any contractual or statutory obligation to these balances that would result in an outflow of resources embodying economic benefits from it. This change in accounting policy has been accounted for retrospectively and has resulted in a decrease of cash and balances due to clients as recorded in the statements of financial position of the Group, as detailed below:-
Page 7 of 25
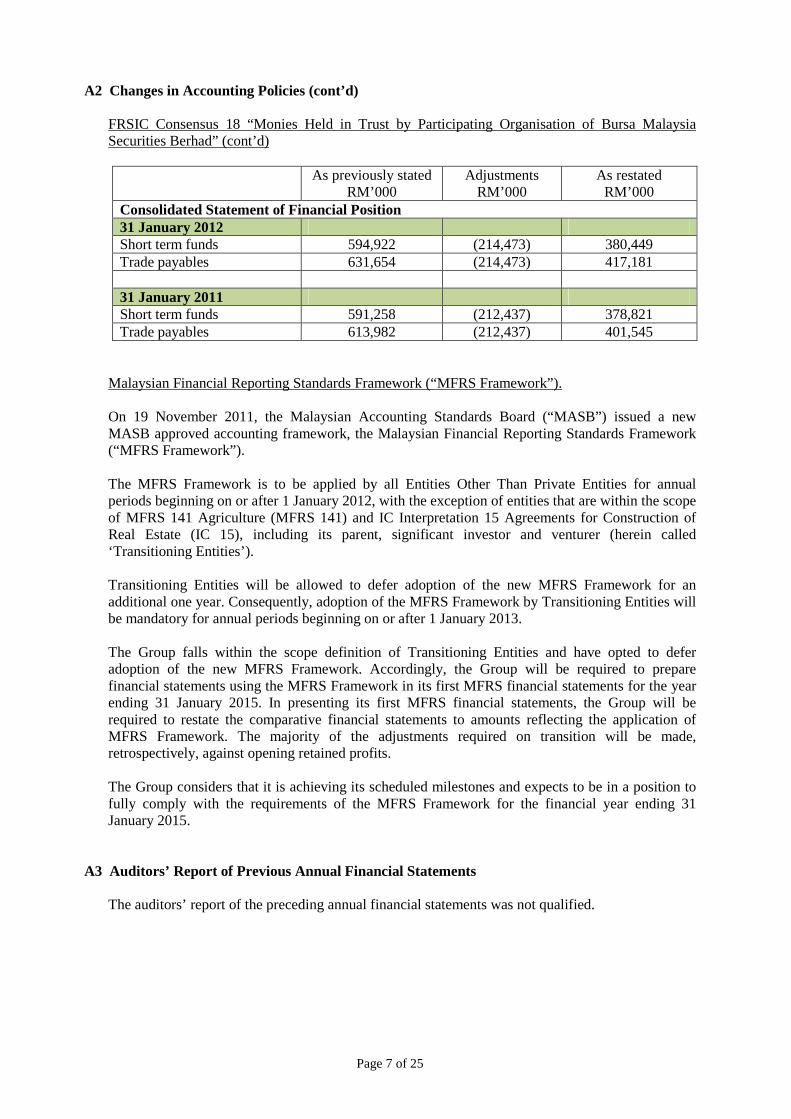
A2 Changes in Accounting Policies (cont’d)
FRSIC Consensus 18 “Monies Held in Trust by Participating Organisation of Bursa Malaysia Securities Berhad” (cont’d)
As previously stated
RM’000 Adjustments
RM’000 As restated RM’000
Consolidated Statement of Financial Position 31 January 2012 Short term funds 594,922 (214,473) 380,449 Trade payables 631,654 (214,473) 417,181 31 January 2011 Short term funds 591,258 (212,437) 378,821 Trade payables 613,982 (212,437) 401,545
Malaysian Financial Reporting Standards Framework (“MFRS Framework”). On 19 November 2011, the Malaysian Accounting Standards Board (“MASB”) issued a new MASB approved accounting framework, the Malaysian Financial Reporting Standards Framework (“MFRS Framework”). The MFRS Framework is to be applied by all Entities Other Than Private Entities for annual periods beginning on or after 1 January 2012, with the exception of entities that are within the scope of MFRS 141 Agriculture (MFRS 141) and IC Interpretation 15 Agreements for Construction of Real Estate (IC 15), including its parent, significant investor and venturer (herein called ‘Transitioning Entities’).
Transitioning Entities will be allowed to defer adoption of the new MFRS Framework for an additional one year. Consequently, adoption of the MFRS Framework by Transitioning Entities will be mandatory for annual periods beginning on or after 1 January 2013.
The Group falls within the scope definition of Transitioning Entities and have opted to defer adoption of the new MFRS Framework. Accordingly, the Group will be required to prepare financial statements using the MFRS Framework in its first MFRS financial statements for the year ending 31 January 2015. In presenting its first MFRS financial statements, the Group will be required to restate the comparative financial statements to amounts reflecting the application of MFRS Framework. The majority of the adjustments required on transition will be made, retrospectively, against opening retained profits.
The Group considers that it is achieving its scheduled milestones and expects to be in a position to fully comply with the requirements of the MFRS Framework for the financial year ending 31 January 2015.
A3 Auditors’ Report of Previous Annual Financial Statements
The auditors’ report of the preceding annual financial statements was not qualified.

Page 8 of 25
A4 Seasonal or Cyclical Factors The Group’s operations are not affected by any seasonal or cyclical factors other than the volatility in the trading volume and share prices on the Bursa Malaysia and the seasonal factors that affect the occupancy and room rates of the Group’s hotel operations.
A5 Unusual Items Affecting the Financial Statements There were no items affecting assets, liabilities, equity, net income or cash flows during the financial period under review that were unusual because of their nature, size or incidence.
A6 Changes in Accounting Estimates
There were no changes in estimates that have had a material effect in the current quarter results.
A7 Debt and Equity Securities
There were no issuances, cancellations, repurchases, resale and repayments of debt and equity securities since the last annual reporting date.
A8 Dividends Paid
A first and final dividend of 2.0% less 25% taxation on 1,711,909,630 ordinary shares for financial year ended 31 January 2012 (1.5 sen net per ordinary shares), amounted to RM25,678,650 was paid on 9 August 2012.

Page 9 of 25
A9 Segmental Information Segment revenue and segment results for the current financial year to date:
Broking and
financial services
Investment holding
and O thers
Credit and
lending Property
investment Property
development Hotel
operations
Elimination Consolidated
RM’000 RM’000 RM’000 RM’000 RM’000 RM’000 RM’000 RM’000
Revenue
External sales 122,543 7,319 37,786 51,188 98,851 458,851 - 776,538 Inter-segment sales - 163,454 5,613 29,256 - - (198,323) - Total revenue 122,543 170,773 43,399 80,444 98,851 458,851 (198,323) 776,538
Other income 22,547 9,242 14,912 1,055 1,661 6,154 - 55,571
Results
Net segment results 31,684 1,807 16,078 17,456 26,353 91,466 - 184,844
Foreign exchange (losses)/gains 852 (15,121) 5,806 (6) - 12,029 - 3,560
Unallocated costs (16,656)
Profit from operations 171,748
Finance costs (674) (14,729) (2,452) (9,493) - (6,593) - (33,941)
Share of results of associated companies - - - (719) (322) - - (1,041) Share of results of
joint ly controlled operations - - - (674) - - - (674)
Profit before tax 136,092
Income tax expense (24,221)
Profit for the year 111,871
Attributable to:
Equity holders of the Company 82,156 Non-controlling interests 29,715
111,871

Page 10 of 25
A10 Subsequent Events
There were no material events subsequent to the end of the current quarter
A11 Changes in the Composition of the Group
Acquisition of Crystal Caliber On 3 February 2012, the Company announced that TA Gemilang Trading Sdn Bhd has acquired 2 ordinary shares representing 100% equity interest in Crystal Caliber Sdn. Bhd., for a total cash consideration of RM2.00. On 20 April 2012, TA Gemilang Sdn Bhd disposed its 2 ordinary shares representing 100% equity interest in Crystal Caliber Sdn Bhd to TA Global Bhd, for a cash consideration of RM2.00.
Crystal Caliber was incorporated on 20 September 2011 as a private limited company in Malaysia pursuant to the Companies Act, 1965. The issued and paid-up capital of Crystal Caliber is RM2.00 divided into 2 shares of RM1.00 each. Crystal Caliber is an investment holding company.
Acquisition of Kingdom 5-KR-194, Ltd. and Kingdom 5-KR-195, Ltd..
On 31 May 2012, Crystal Caliber Sdn. Bhd. completed the acquisition of the hotel and business of Movenpick Karon Beach Resort in Phuket, Thailand via the purchase of the entire issued share capital of Kingdom 5-KR-194, Ltd. and Kingdom 5-KR-195, Ltd., for a total cash consideration of USD90,283,487. The acquired subsidiaries had contributed the following results to the Group:
3 Months ended 12 Months ended 31 January 2013 31 January 2013 RM’000 RM’000 Revenue 23,383 44,098 Profit for the period 12,830 19,056
Page 11 of 25
A11 Changes in the Composition of the Group (cont’d)
Acquisition of Kingdom 5-KR-194, Ltd. and Kingdom 5-KR-195, Ltd. (cont’d)
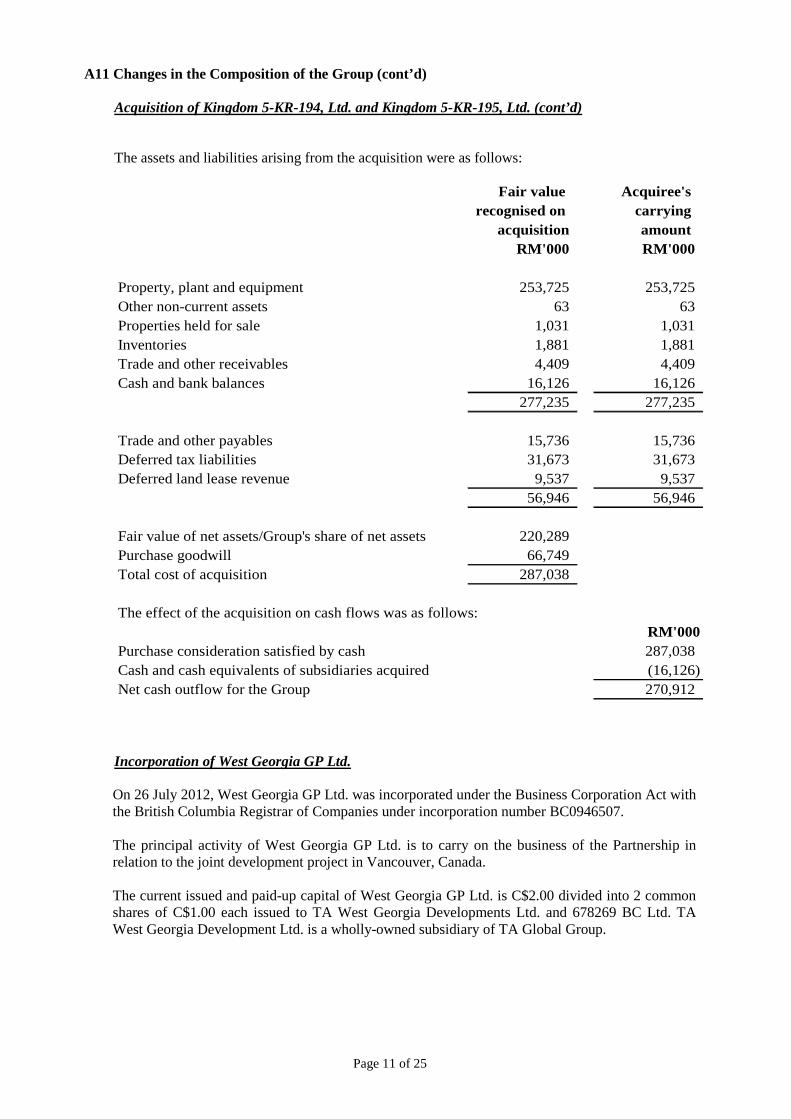
The assets and liabilities arising from the acquisition were as follows:
Fair value Acquiree's recognised on carrying
acquisition amount RM'000 RM'000
253,725 253,725 63 63
1,031 1,031 1,881 1,881 4,409 4,409
16,126 16,126 277,235 277,235
Trade and other payables 15,736 15,736 Deferred tax liabilities 31,673 31,673 Deferred land lease revenue 9,537 9,537
56,946 56,946
Fair value of net assets/Group's share of net assets 220,289 Purchase goodwill 66,749 Total cost of acquisition 287,038
RM'000287,038 (16,126) 270,912
Property, plant and equipment
Cash and bank balancesTrade and other receivablesInventories Properties held for saleOther non-current assets
The effect of the acquisition on cash flows was as follows:
Purchase consideration satisfied by cashCash and cash equivalents of subsidiaries acquiredNet cash outflow for the Group
Incorporation of West Georgia GP Ltd.
On 26 July 2012, West Georgia GP Ltd. was incorporated under the Business Corporation Act with the British Columbia Registrar of Companies under incorporation number BC0946507. The principal activity of West Georgia GP Ltd. is to carry on the business of the Partnership in relation to the joint development project in Vancouver, Canada.
The current issued and paid-up capital of West Georgia GP Ltd. is C$2.00 divided into 2 common shares of C$1.00 each issued to TA West Georgia Developments Ltd. and 678269 BC Ltd. TA West Georgia Development Ltd. is a wholly-owned subsidiary of TA Global Group.
Page 12 of 25
A11 Changes in the Composition of the Group (cont’d) Formation of a Limited Partnership On 2 August 2012, TA West Georgia Development Ltd (“TAWG”), Birkbeck Trust and West Georgia GP Ltd entered into a Limited Partnership Agreement to form a Limited Partnership under the name of West Georgia Development Limited Partnership (“WGLP” or “Partnership”). The following units in WGLP had been issued with the formation of the Partnership:- a) 100 Class “A” Units to TAWG at C$1.00 per unit; b) 100 Class “A” Units to Birkbeck Trust at C$1.00 per unit; and c) 1 Class “B” Unit to West Georgia GP Ltd at C$1.00 per unit. The Partnership was formed to undertake the joint development of hotel and residences on the piece of land located at 1151, West Georgia Street, City of Vancouver, British Columbia, Canada. Acquisition of Golden Artistic On 23 October 2012, the Group announced that TA Properties Sdn. Bhd. has acquired 2 ordinary shares representing 100% equity interest in Golden Artistic Sdn. Bhd. (“Golden Artistic”), for a total cash consideration of RM2.00. Golden Artistic was incorporated on 25 July 2012 as a private limited company in Malaysia pursuant to the Companies Act, 1965. The authorised share capital of Golden Artistic is RM100,000.00 divided into 100,000 shares of RM1.00 each. The current issued and paid-up capital of Golden Artistic is RM2.00. Golden Artistic is an investment holding company.
Conversion of TAG’s Irredeemable Convertible Preference Shares “ICPS” to Ordinary Shares
During the financial year ended 31 January 2013, TA Global Bhd. issued 670,115,451 ordinary shares pursuant to the conversion of ICPS by the ICPS holders. The conversion is satisfied by surrendering 1 ICPS of RM0.50 each in TA Global Bhd for each new TAG’s ordinary share of RM0.50 each. The conversion had resulted in the Company’s effective interest in TA Global Bhd. to decrease from 73.4% to 63.1%.
Investment in Nusa Lagenda
On 1 November 2012, the Group announced that TA Properties Sdn Bhd has acquired one ordinary share of RM1.00, representing 50% of the issued and paid-up share capital of Nusa Lagenda Development Sdn Bhd (“Nusa Lagenda”), for a total cash consideration of RM1.00. Nusa Lagenda was incorporated on 24 May 2012 as a private limited company in Malaysia pursuant to the Companies Act, 1965. The authorised share capital of Nusa Lagenda is RM100,000.00 divided into 100,000 shares of RM1.00 each. The current issued and paid-up capital of Nusa Lagenda is RM2.00. Nusa Lagenda is a property investment and development company, jointly controlled by TA Properties Sdn Bhd and Prominent Xtreme Sdn Bhd.

Page 13 of 25
A12 Changes in Contingent Liabilities or Contingent Assets
There were no changes in contingent liabilities since the last annual reporting date. The Group does not have any contingent assets.
A13 Commitments The amount of capital commitments not provided for in the interim financial statements as at 31 January 2013 is as follow:
RM'000Approved and contracted for:-- Renovation 19,739 - Jointly controlled entities 247,736
267,475
Page 14 of 25
Notes (in compliance with the Listing Requirements of Bursa Malaysia Securities Berhad)
B1 Performance Analysis of the Group’s Operating Segments
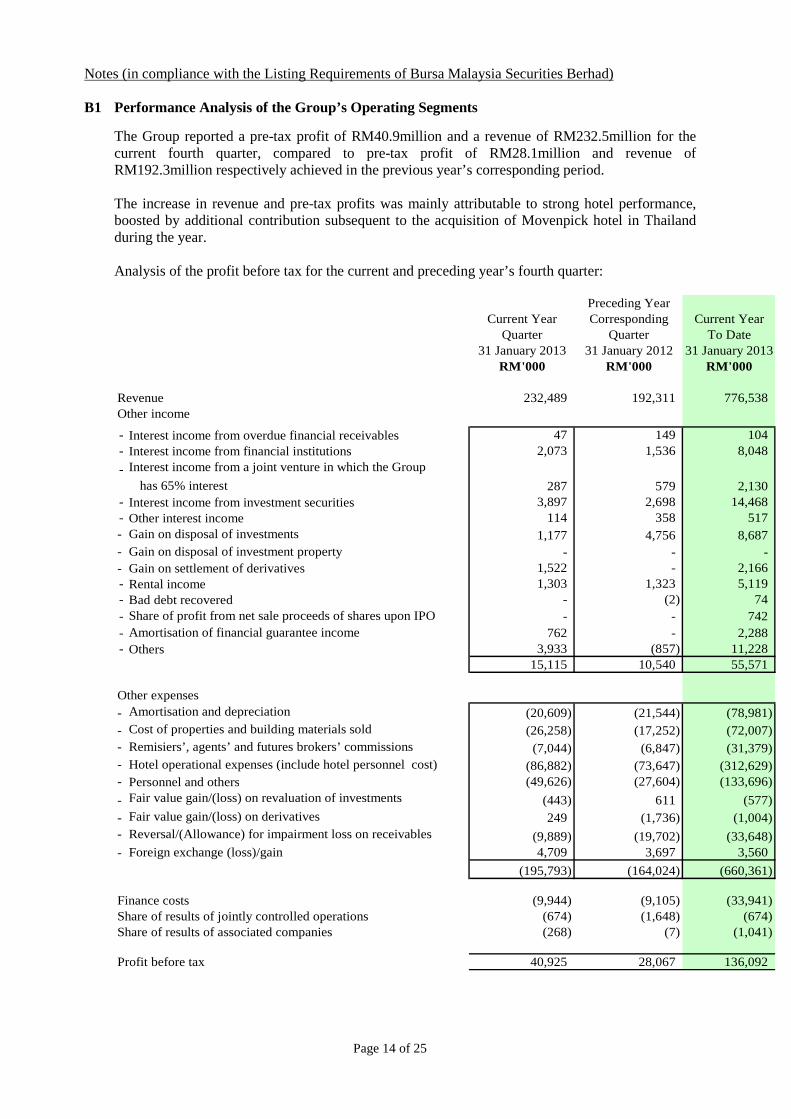
The Group reported a pre-tax profit of RM40.9million and a revenue of RM232.5million for the current fourth quarter, compared to pre-tax profit of RM28.1million and revenue of RM192.3million respectively achieved in the previous year’s corresponding period. The increase in revenue and pre-tax profits was mainly attributable to strong hotel performance, boosted by additional contribution subsequent to the acquisition of Movenpick hotel in Thailand during the year. Analysis of the profit before tax for the current and preceding year’s fourth quarter:
Preceding YearCurrent Year Corresponding Current Year
Quarter Quarter To Date31 January 2013 31 January 2012 31 January 2013
RM'000 RM'000 RM'000
Revenue 232,489 192,311 776,538 Other income
- Interest income from overdue financial receivables 47 149 104 - Interest income from financial institutions 2,073 1,536 8,048
- Interest income from a joint venture in which the Group
has 65% interest 287 579 2,130 - Interest income from investment securities 3,897 2,698 14,468 - Other interest income 114 358 517 - Gain on disposal of investments 1,177 4,756 8,687 - Gain on disposal of investment property - - - - Gain on settlement of derivatives 1,522 - 2,166 - Rental income 1,303 1,323 5,119 - Bad debt recovered - (2) 74 - Share of profit from net sale proceeds of shares upon IPO - - 742 - Amortisation of financial guarantee income 762 - 2,288 - Others 3,933 (857) 11,228
15,115 10,540 55,571
Other expenses- Amortisation and depreciation (20,609) (21,544) (78,981) - Cost of properties and building materials sold (26,258) (17,252) (72,007) - Remisiers’, agents’ and futures brokers’ commissions (7,044) (6,847) (31,379) - Hotel operational expenses (include hotel personnel cost) (86,882) (73,647) (312,629) - Personnel and others (49,626) (27,604) (133,696)
- Fair value gain/(loss) on revaluation of investments (443) 611 (577) - Fair value gain/(loss) on derivatives 249 (1,736) (1,004) - Reversal/(Allowance) for impairment loss on receivables (9,889) (19,702) (33,648) - Foreign exchange (loss)/gain 4,709 3,697 3,560
(195,793) (164,024) (660,361)
Finance costs (9,944) (9,105) (33,941) Share of results of jointly controlled operations (674) (1,648) (674) Share of results of associated companies (268) (7) (1,041)
Profit before tax 40,925 28,067 136,092
Page 15 of 25
B1 Performance Analysis of the Group’s Operating Segments (cont’d) Broking and financial services Pre-tax profit of the broking and financial services division decreased 44% to a profit of RM5.7mil in the current year’s fourth quarter as compared to the previous year’s corresponding quarter. For the current year-to-date, this segment achieved a pre-tax profit of RM31.9mil, which represented a 34% decrease as compared to the preceding year. Prolonged uncertainties in the equities market and soft market sentiment had led to lower trading turnover, which resulted in a decrease in brokerage and proprietary trade income. Despite the drop of pre-tax profit, the division remains as the second largest profit contributor to the Group. Investment holding Investment holding division reported a pre-tax loss of RM5.0million in the current fourth quarter, as compared to a loss of RM2.8million in the previous year’s corresponding quarter. Despite higher fair value gain on derivatives and higher interest income on investment securities, pre-tax results of the division was dragged down by higher finance cost, and net foreign exchange translation loss on US Dollar and Singapore Dollar denominated borrowings. For the current year-to-date, this division reported RM28.0million pre-tax loss as compared to a loss of RM14.3million in the previous year. This was mainly due to the high finance cost and foreign exchange translation loss resulting from borrowings denominated in Singapore Dollar. Credit and lending For the current fourth quarter, credit and lending segment contributed RM1.7mil pre-tax profit to the Group, as compared with RM5.1mil in the previous year’s corresponding quarter. This was mainly due to higher impairment loss. For the current year-to-date, this division reported a lower current year pre-tax profit of RM19.4million, as compared to RM40.9million in the previous year. Although the Group enjoyed higher revenue on active lending activities during the year, pre-tax profits was dragged down by lower revenue and higher impairment loss recognised on Australian Dollar denominated financial receivables. Property investment Property investment division reported a pre-tax loss of RM0.1million in the current fourth quarter, as compared to a loss of RM4.0mil in the previous year’s corresponding quarter. This was mainly due to lower amortisation of deferred incentive fee.
This segment contributed consistent year-to-date pre-tax profits of RM8.0million to the Group. Property development Property development division registered a pre-tax profit of RM11.6million in the current year fourth quarter, consistent with previous year’s corresponding quarter. Current year pre-tax profit was RM11.1mil higher as compared with last year, mainly contributed by the on-going development projects in Damansara Avenue.

Page 16 of 25
B1 Performance Analysis of the Group’s Operating Segments (cont’d) Hotel operations Hotel operations pre-tax profit had increased by RM19.2mil at RM32.7million in the current year’s fourth quarter, as compared to the previous year’s corresponding quarter. This was mainly due to strong hotel performance, boosted by contribution from the newly acquired Movenpick hotel in Thailand. Besides, this segment recorded high foreign exchange translation gain on Thai Baht denominated balances. This also explained the increase in current year’s pre-tax profit at RM96.9million as compared to RM68.5million last year. Hotel operations division had remained as the top profit contributor, representing 63% of the Group’s current year’s pre-tax profit.
B2 Material Changes in Pre-tax Profit for the Current Quarter Compared with the Preceding
Quarter The Group registered a pre-tax profit of RM40.9million in the current fourth quarter as compared to RM52.5million in the preceding quarter. Although contribution from hotel operations was higher, pre-tax profit of the Group was dragged down by higher impairment loss on financial receivables and lower foreign exchange translation gain.

Page 17 of 25
B3 Prospects for the next financial year
The global economy is gradually recovering. However, the overall global situation continues to be challenging as the pace of recovery in the Euro Zone remains constrained by unresolved fiscal and financial concerns. Emerging economies in Asia have continued to be resilient, sustained by domestic demand and robust domestic fundamentals. The Malaysian economy is expected to be on steady growth. Growth performance is currently driven by higher growth in domestic demand, which outweighed the negative impact from the weak external environment. Domestic growth sustained by strong private consumption and private investments are the key drivers in Malaysia’s domestic growth. The Prospects for Each Business Segments Broking and financial services Global financial markets have shown encouraging improvements. The resilient domestic demand supported by macro policies plays an important role to ensure that the Malaysian economy withstands the adverse impact arising from the economic weaknesses in the more advanced economies. Domestic demand will continue to become the main driver for growth. The stockbroking subsidiary is expanding its branch network nationwide and is actively looking for strategic locations to expand our branch network and to further improve on our infrastructure to enhance our revenue and earnings though the expected earnings from the stockbroking segment will continue to be affected by the capital market sentiment and challenges in Malaysia. The investment management unit will be launching new and diversify unit trust funds to fulfill market needs and to expand the distribution network through the Group’s stock broking subsidiary. With the increasing competition, the performance of the investment management arm of the Group is expected to be under pressure in the next financial year. The Group’s expansion plan on its derivative trading arm will continue in next financial year and will continue to grow in view of the setting up of more servicing branches and kiosk in various strategic locations locally. Credit and Lending The credit and lending segment will continue to provide financing to investors for new public issues (“IPO") and staff of corporations that has Employees Share Option Schemes (“ESOS"). The segment’s business strategy will be to focus more on IPO financing. In line with our stock broking business, we will continue to provide corporate lending for private placement and share investment financing. We expect the growth of the above IPO financing to contribute positively to the Group’s earnings in the next financial year. Property Investment The overseas property investment will continue to generate stable income to the Group’s earnings for the next financial year. The Group will continue to explore opportunity to increase its property investments locally to generate higher returns. Going forward, reasonable capital expenditure expected in the next financial year to upgrade our existing properties to retain its market competitiveness.

Page 18 of 25
B3 Prospects for the current financial year (cont’d) Property development The Group is expected to launch new products in the next financial year on its strategic development projects located in the Klang Valley, Vancouver and Sydney. Our joint venture development projects in Vancouver and development alliance project in Sydney will continue to be our main focus. With the “Build-Then-Sell” approach adopted in these countries, the contributions from these projects to the Group’s earnings will come in at the later stage of the development. Hotel Operations The hospitality segment is expected to improve its contributions significantly to the Group’s earnings in the next financial year. With a total of 6 hotel properties and with the anticipated increased in tourism activities in Singapore, Phuket and Australia, we expect to see a further boost to our hotels’ revenue. The Group is expected to perform satisfactorily in year 2013.

Page 19 of 25
B4 Variance between Actual Profit and Forecast Profit Not applicable.
B5 Taxation
a) Taxation for the current financial period is as follows:
Current quarter Year to dateRM'000 RM'000
Estimated tax charge for the period:- Malaysian income tax 7,155 20,405 - Foreign tax (1,490) 3,348 Deferred tax (1,364) (792) Underprovision in prior year 2 1,260
4,303 24,221
b) A reconciliation between the statutory and effective tax rate:
Current quarter Year to dateRM'000 RM'000
Profit before taxation 40,925 136,092
Taxation at the statutory income tax rate of 25% 10,231 34,023
Adjustments mainly due to the utilisation ofpreviously unabsorbed tax losses and capitalallowances, certain income not subject to tax net of certain expenses not deductible fortax purpose (5,928) (9,802) Tax expense for the financial period 4,303 24,221

Page 20 of 25
B6 Corporate Proposals
Status of Corporate Proposals
All corporate proposals announced have been completed at the date of this quarterly report except for the following:-
a) partially completed Special Bumiputra Issue first implemented in 1997;
b) On 21 March 2003, TA Securities Holdings Berhad (“TASH”) submitted an application for Universal Broker (“UB”) status to the Securities Commission (“SC”). On 11 August 2003, TASH received approval from the SC subject to the fulfillment of certain conditions imposed on TASH.
An appeal seeking exemption/waiver of the aforesaid conditions was made by TASH and on 18 March 2004, SC varied the earlier conditional approval by retaining all the conditions previously imposed, except the condition that TASH, instead of Datuk Tiah Thee Kian (“Datuk”), would now provide a written declaration to the SC on the effective beneficial shareholding of Datuk in the Company.
Following the 18 March 2004 letter from SC and pursuant to the various appeals made by TASH to the SC on the same subject matter, the SC on 18 October 2004, consented to the following: (i) That Datuk and persons connected with him shall assign the voting rights of the shares
in excess of 20% of their collective shareholding in the Company (“the excess shares”) to a firm of independent trustees before TASH is given the status of UB; and
(ii) That Datuk shall have full discretion to dispose the excess shares in the Company as
he deems fit to persons other than himself, his nominees and persons connected with him within two years from the date of TASH being given the UB status.
c) In the AGM held on 31 July 2009, the shareholders of the Company approved the
establishment of a new employees’ share option scheme (“ESOS”) for the granting of option(s) to the eligible employees including Directors of the Company and its subsidiaries who fulfil the eligibility criteria to subscribe for new ordinary share(s) of RM1.00 each in the Company of up to 5% of the issued and paid-up share capital of the Company. The ESOS is currently pending implementation and no options have been granted to any eligible employees.
Page 21 of 25
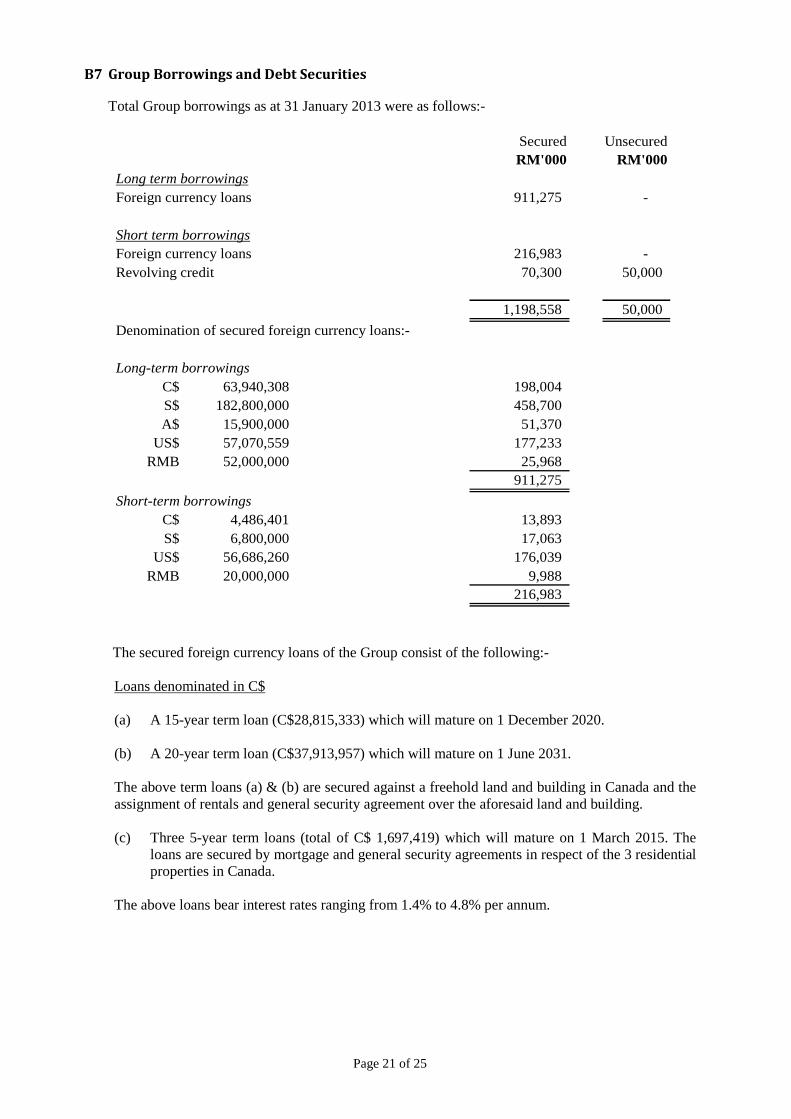
B7 Group Borrowings and Debt Securities Total Group borrowings as at 31 January 2013 were as follows:-
Secured UnsecuredRM'000 RM'000
Long term borrowingsForeign currency loans 911,275 -
Short term borrowingsForeign currency loans 216,983 - Revolving credit 70,300 50,000
1,198,558 50,000
Denomination of secured foreign currency loans:-
Long-term borrowingsC$ 63,940,308 198,004 S$ 182,800,000 458,700 A$ 15,900,000 51,370
US$ 57,070,559 177,233 RMB 52,000,000 25,968
911,275
Short-term borrowingsC$ 4,486,401 13,893 S$ 6,800,000 17,063
US$ 56,686,260 176,039 RMB 20,000,000 9,988
216,983
The secured foreign currency loans of the Group consist of the following:- Loans denominated in C$ (a) A 15-year term loan (C$28,815,333) which will mature on 1 December 2020. (b) A 20-year term loan (C$37,913,957) which will mature on 1 June 2031. The above term loans (a) & (b) are secured against a freehold land and building in Canada and the assignment of rentals and general security agreement over the aforesaid land and building. (c) Three 5-year term loans (total of C$ 1,697,419) which will mature on 1 March 2015. The
loans are secured by mortgage and general security agreements in respect of the 3 residential properties in Canada.
The above loans bear interest rates ranging from 1.4% to 4.8% per annum.
Page 22 of 25
B7 Group Borrowings and Debt Securities (cont’d) Loan denominated in S$ A 5-year term loan (S$189,600,000) with a scheduled principal repayment S$1,700,000 at the end of each of the 3 months from 30 November 2009. The term loan will mature on 30 November 2014, bear floating interest rate ranging from 1.7% to 1.9%, and is secured by new first all-monies charge over the ordinary shares of a subsidiary and mortgage over a hotel in Singapore. Loan denominated in A$
A 3-year floating rate Bill Facility amounting to A$15,900,000 which will mature on 28 February 2015. The loan is secured against a freehold hotel land and building in Australia.
The above loan bears interest rates ranging from 5.5% to 6.3% per annum. Loans denominated in US$
(a) 3-year loan (total of US$57,070,559) which will mature on April 2014. The loan is secured
against a freehold hotel land and building in Australia. (b) Short-term loan amounting to US$56,686,260 on rollover basis. The loan is secured against
certain quoted investment securities.
The above loans bear interest rates ranging from 0.6% to 2.1% per annum. Loans denominated in RMB
Four term loans (total of RMB72,000,000) with maturities from 20 December 2013 to 24 April 2016. The loans are subject to variable interest rate ranging from 5.6% to 6.7%, and are secured against a hotel building and land use rights in China.
B8 Material Litigation As at 20 March 2013, there were no changes in material litigation since the last annual reporting date of 31 January 2012.
B9 Dividend
No further dividend is declared as at the date of this announcement other than as stated in Note A8 on dividend paid.
Page 23 of 25
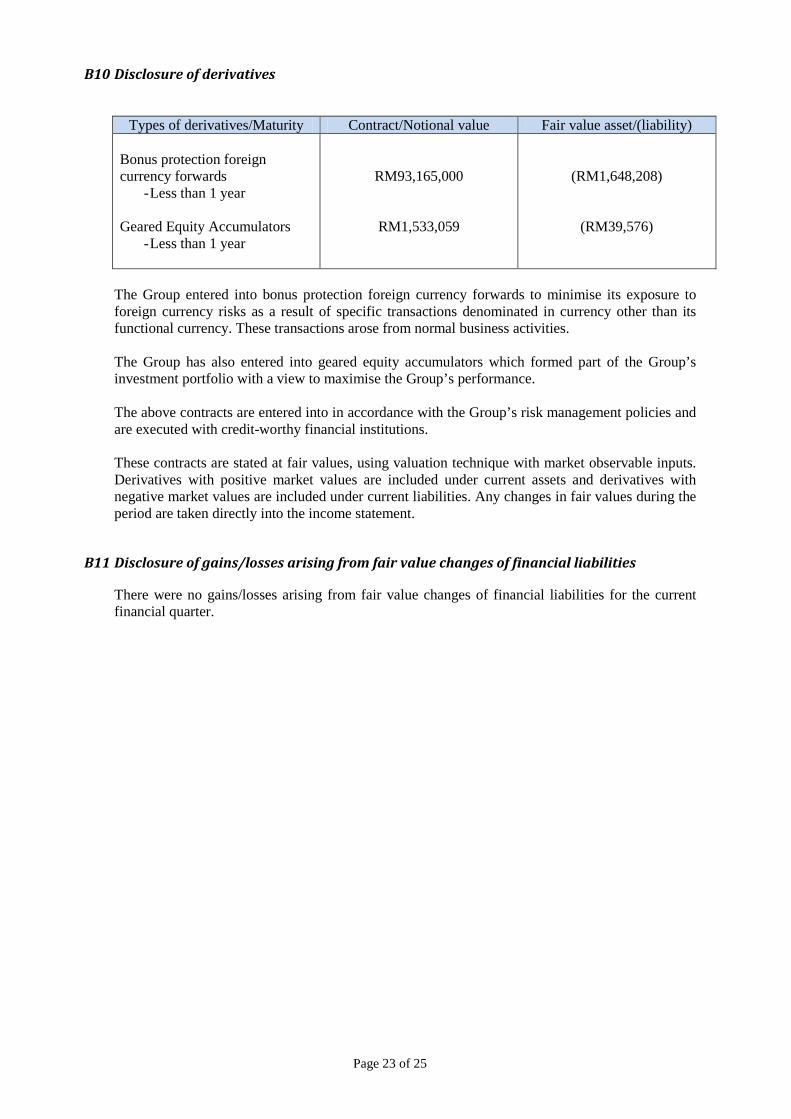
B10 Disclosure of derivatives
Types of derivatives/Maturity Contract/Notional value Fair value asset/(liability)
Bonus protection foreign currency forwards
- Less than 1 year Geared Equity Accumulators
- Less than 1 year
RM93,165,000
RM1,533,059
(RM1,648,208)
(RM39,576)
The Group entered into bonus protection foreign currency forwards to minimise its exposure to foreign currency risks as a result of specific transactions denominated in currency other than its functional currency. These transactions arose from normal business activities. The Group has also entered into geared equity accumulators which formed part of the Group’s investment portfolio with a view to maximise the Group’s performance. The above contracts are entered into in accordance with the Group’s risk management policies and are executed with credit-worthy financial institutions. These contracts are stated at fair values, using valuation technique with market observable inputs. Derivatives with positive market values are included under current assets and derivatives with negative market values are included under current liabilities. Any changes in fair values during the period are taken directly into the income statement.
B11 Disclosure of gains/losses arising from fair value changes of financial liabilities
There were no gains/losses arising from fair value changes of financial liabilities for the current financial quarter.
Page 24 of 25
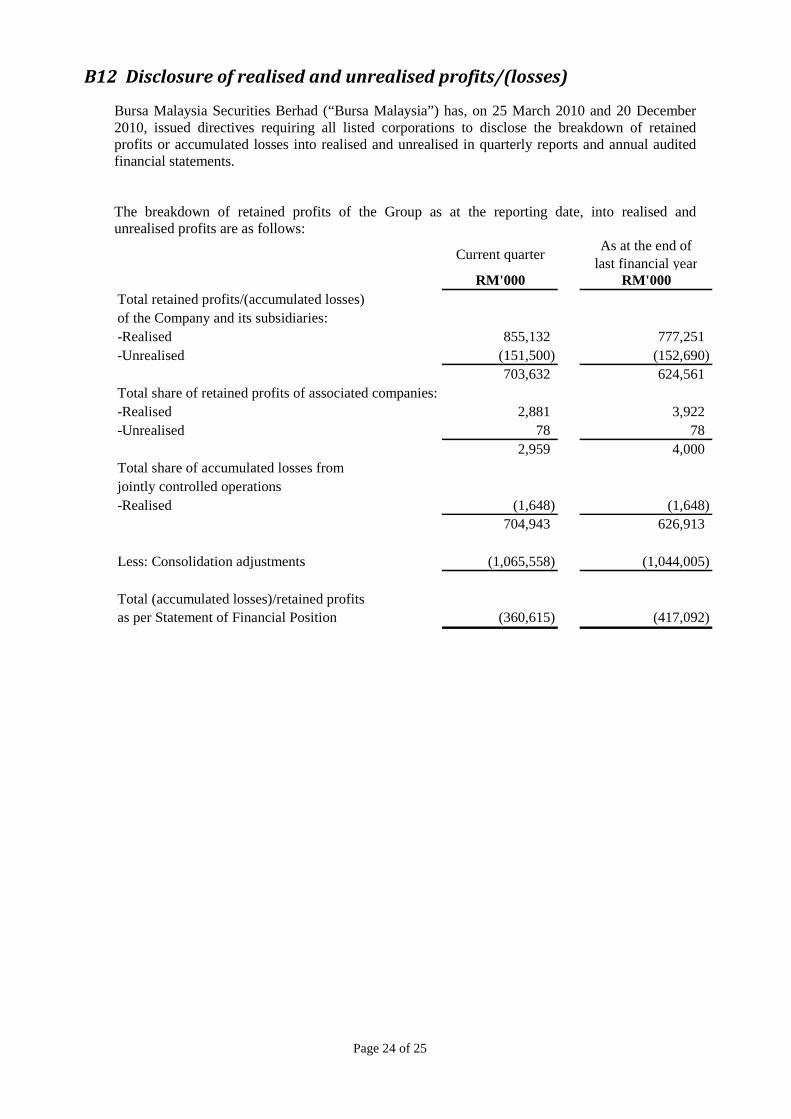
B12 Disclosure of realised and unrealised profits/(losses)
Bursa Malaysia Securities Berhad (“Bursa Malaysia”) has, on 25 March 2010 and 20 December 2010, issued directives requiring all listed corporations to disclose the breakdown of retained profits or accumulated losses into realised and unrealised in quarterly reports and annual audited financial statements. The breakdown of retained profits of the Group as at the reporting date, into realised and unrealised profits are as follows:
Current quarterAs at the end of
last financial yearRM'000 RM'000
Total retained profits/(accumulated losses)of the Company and its subsidiaries:-Realised 855,132 777,251 -Unrealised (151,500) (152,690)
703,632 624,561 Total share of retained profits of associated companies:-Realised 2,881 3,922 -Unrealised 78 78
2,959 4,000 Total share of accumulated losses from jointly controlled operations-Realised (1,648) (1,648)
704,943 626,913
Less: Consolidation adjustments (1,065,558) (1,044,005)
Total (accumulated losses)/retained profitsas per Statement of Financial Position (360,615) (417,092)
Page 25 of 25
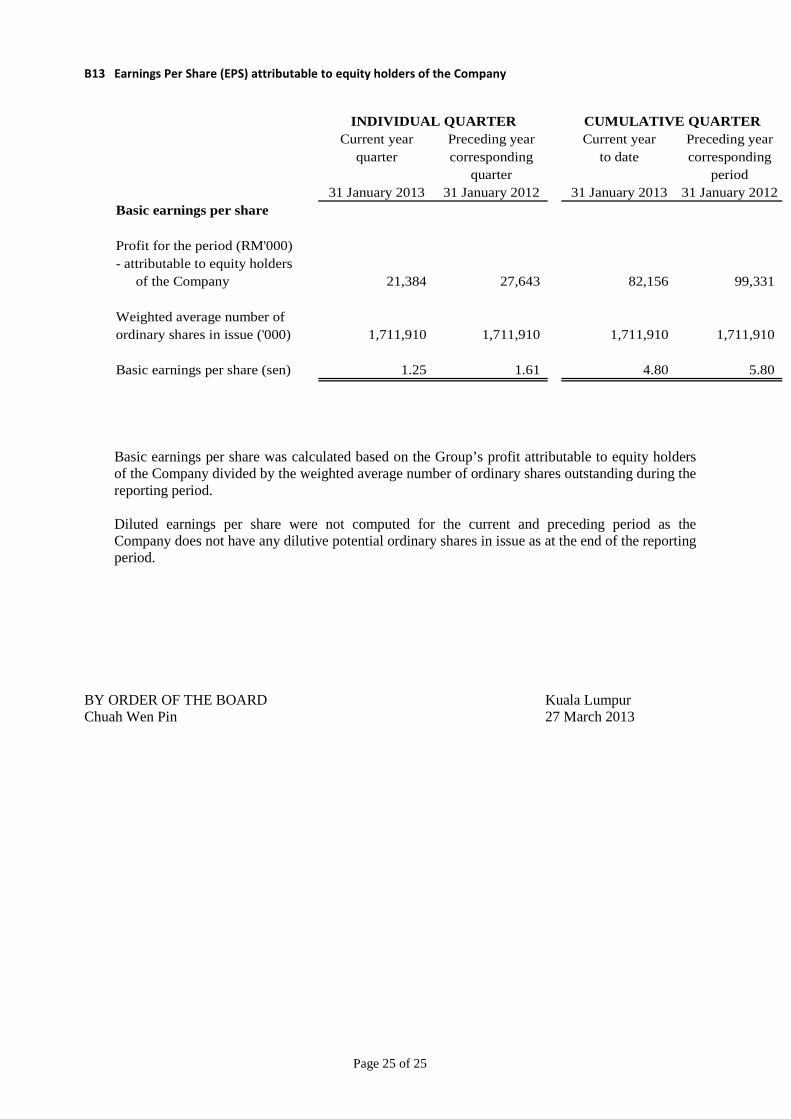
B13 Earnings Per Share (EPS) attributable to equity holders of the Company
Current year Preceding year Current year Preceding yearquarter corresponding to date corresponding
quarter period31 January 2013 31 January 2012 31 January 2013 31 January 2012
Basic earnings per share
Profit for the period (RM'000)- attributable to equity holders
of the Company 21,384 27,643 82,156 99,331
Weighted average number of ordinary shares in issue ('000) 1,711,910 1,711,910 1,711,910 1,711,910
Basic earnings per share (sen) 1.25 1.61 4.80 5.80
INDIVIDUAL QUARTER CUMULATIVE QUARTER
Basic earnings per share was calculated based on the Group’s profit attributable to equity holders of the Company divided by the weighted average number of ordinary shares outstanding during the reporting period. Diluted earnings per share were not computed for the current and preceding period as the Company does not have any dilutive potential ordinary shares in issue as at the end of the reporting period.
BY ORDER OF THE BOARD Kuala Lumpur Chuah Wen Pin 27 March 2013