t r y & a n a lytic b biochemistry b analytical biochemistry · biochemistry b analytical...
TRANSCRIPT

Research Article Open Access
Biochemistry & Analytical BiochemistryBi
oche
mist
ry & Analytical Biochem
istry
ISSN: 2161-1009
Sashidhar et al., Biochem Anal Biochem 2016, 5:3DOI: 10.4172/2161-1009.1000293
Volume 5 • Issue 3 • 1000293Biochem Anal Biochem, an open access journalISSN: 2161-1009
*Corresponding author: Department of Biochemistry, University College of Science, Osmania University, Hyderabad-500007, Telangana State, India, Tel: 091-040-27097044, 09848823268; Fax: 091-040-27016868; E-mail: [email protected]
Received: July 29, 2016; Accepted: September 20, 2016; Published September 23, 2016
Citation: Sashidhar RB, Kosuri T, Nayak S (2016) Rapid Detection of Proteins on One-Dimensional Polyacrylamide Gel Electrophoresis Using an Inexpensive Fluorescent Optical Brightener. Biochem Anal Biochem 5: 293. doi:10.4172/2161-1009.1000293
Copyright: © 2016 Sashidhar RB, et al. This is an open-access article distributed under the terms of the Creative Commons Attribution License, which permits unrestricted use, distribution, and reproduction in any medium, provided the original author and source are credited.
AbstractA commercial fabric fluorescent optical brightener Ranipal (F-OB), has been successfully employed to stain
proteins on native and SDS-1D-PAGE. The F-OB was purified by using a biphasic solvent system of dichloromethane and water. The Rf value (0.63) of purified and crude F-OB were comparable on TLC. The mass spectrometry of purified F-OB indicated base peak at 414 (m/z). Absorption and emission maxima of F-OB were found to be 350 nm and 430 nm, respectively. The F-OB could stain the proteins both pre- and post-electrophoretic run, on native gel. Post-electrophoretic staining was rapid and required 20 min to visualize the stained proteins. On the other hand, in SDS gels, an additional 20 min was required for the extraction of SDS before staining the proteins with F-OB. SDS was found to interfere with binding of F-OB to proteins. Varying concentrations of molecular weight markers were loaded and their fluorescent intensity was plotted against the concentration of the proteins. The r2 values ranged from 0.965 to 0.997 indicating excellent linearity. The detection for carbonic anhydrase was in the range of 8.0-800 ng. Unlike most of the dyes used for protein staining, staining with F-OB could be carried out in tank buffer (2 mg/100 mL) and was also reversible. The F-OB, perhaps would be the most cost-effective fluorescent dye to stain the proteins (US $ 0.04/25.0 g). The F-OB was found to be simple, safe, sensitive, less time consuming and economical fluorescent dye as an alternative, for staining proteins on polyacrylamide gels.
Rapid Detection of Proteins on One-Dimensional Polyacrylamide Gel Electrophoresis Using an Inexpensive Fluorescent Optical BrightenerSashidhar RB*, Tanuja Kosuri and Sujata NayakDepartment of Biochemistry, University College of Science, Osmania University, Hyderabad-500007, Telangana State, India
Keywords: Fluorescent optical brightener; CCD-based digital image based analysis system; 1D-Electrophoresis; Protein staining
IntroductionThe successful use of polyacrylamide gel electrophoresis as an
analytical tool for protein separation and characterization depends on, the availability of detection methods that are both quantitative and sensitive [1]. Classically, Coomassie Brilliant Blue (CBB) has been the most widely used dye, for the detection of proteins. However, it suffers from low sensitivity [2], capable of detecting µg to sub µg amounts of protein [1]. Although silver-staining method has been recognized as an alternative staining technique, competent of detecting proteins with high sensitivity, the procedure is tedious, the results not totally quantitative and it showed variable binding characteristics towards many proteins [3]. When compared with total protein stains such as CBB or silver, fluorescent labels and stains were shown to be more sensitive, and yielded quantitative data over a wider linear dynamic range. Conventional stains are not designed for state-of-the art detectors such as charged couple device (CCD) camera imagers and laser scanners and generally showed limited linearity in signal intensity vs. protein/band relation, which make them unsuitable for protein quantification on gel. For this reason, fluorescent dyes in combination with advanced imagers have increasingly become the method of choice [1,4]. Therefore, an alternative method for protein detection in gels that is sensitive and easy-to-use has been long desired.
In the recent past both pre- and post-electrophoretic staining techniques using fluorescent compounds have been reported for one dimensional sodium dodecyl sulfate-polyacrylamide gel electrophoresis (1-D SDS-PAGE) [5,6]. The major disadvantage of the pre-electrophoretic staining procedures [fluorescamine, p-pththaldehyde and 2-methoxy-2, 4-diphenyl-3(2H)-furanone (MDPF)] is that, they caused protein charge modification. The alternative approach that could overcome this limitation of protein charge modification was to use fluorescent staining reagents after the electrophoretic separation [7]. These include commercially available stains, such as the series of SYPROs and Ruthenium red based dyes, for which synthesis procedures were published [5,8]. The SYPRO-Orange
and Red dyes have been shown to be linear, with a sensitivity of 4-10 ng of protein and were found to stain the protein in 30 min [9]. A new fluorescent aminostyryl quinolinium dye was synthesized recently and was found to be more sensitive than SYPRO-Orange [10]. However staining with these reagents required the protein to be complexed to SDS, and when electrophoresis was carried out in the absence of this detergent, the gels were incubated in a solution of SDS prior to staining. SYPRO-Orange and Red needed dilute acetic acid as a staining diluent, whereas, SYPRO-Tangerine staining could be performed in a non-fixative solution. SYPRO-Ruby, a ruthenium based metal chelate stain had an advantage over other SYPRO dyes, as SDS was not required for binding, but the gel had to be soaked in the stain for at least 3 h [8]. However, their present use remains relatively limited, probably due to their cost and/or technical difficulties associated.
There is a need to identify a simple, sensitive, less time consuming and economical fluorescent dye as an alternative, for staining proteins on the gels. Ranipal earlier marketed by IDI (Indian dye stuff industries Ltd.) Baroda, India and currently marketed by Pidilite Industries Ltd, Mumbai, India is a popular fabric whitener. Ranipal is very economical (Rs. 7.50/- for 25 g i.e., equivalent to US $ 0.04 for 25.0 g approximately) and readily available in stores in India. It is light greenish white in color with traces of blue dye. Ranipal has been earlier

Citation: Sashidhar RB, Kosuri T, Nayak S (2016) Rapid Detection of Proteins on One-Dimensional Polyacrylamide Gel Electrophoresis Using an Inexpensive Fluorescent Optical Brightener. Biochem Anal Biochem 5: 293. doi:10.4172/2161-1009.1000293
Volume 5 • Issue 3 • 1000293Biochem Anal Biochem, an open access journalISSN: 2161-1009
Page 2 of 9
used for the detection of chitinase activity in plate assays in place of Calcofluor White [11]. For the first time the present communication reports fluorescent optical brightener (F-OB), purified from Ranipal, to stain the proteins separated on 1D-PAGE. Further this unique dye has been successfully used for both pre- and post-electrophoretic staining of proteins on native PAGE and post-electrophoretic staining on SDS-PAGE.
ExperimentMaterials
Ranipal, an extensively used fabric whitener was obtained from the local stores (Hyderabad, India). Coomassie brilliant blue (CBB) R-250 was obtained from Sisco Research Laboratories, Mumbai, India. Medium range molecular weight (MW) markers were from Genei (Bangalore, India). Bovine serum albumin (BSA), bromo phenol blue, acrylamide, SDS, TEMED (N, N, N’, N’ -tetramethylethylenediamine), 2-mercaptoethanol, Polyester silica Gel-G TLC plates (size 20 cm × 20 cm; thickness 250 m; particle size 2-25 m) were sourced from Sigma (St. Louis, MO, USA). Glycine, Tris base, methanol, acetic acid, dichloromethane (DCM), pyridine, ammonium hydroxide, chloroform, acetone were from Qualigens (Mumbai, India). N-N- Methylene-bis-acrylamide was obtained from Spectrochem Pvt. Ltd. Mumbai, India. Ammonium persulfate was from Hi media (Mumbai, India) and glycerol was procured from Merck [E-Merck (India), Ltd. Mumbai, India]. All other reagents and chemicals used were of analytical grade.
Purification of fluorescent optical brightener from Ranipal
To 10.0 g of the Ranipal powder, 5.0 mL of double glass-distilled water, just sufficient to form an emulsion was added. To this emulsion, 100 mL of dichloromethane (DCM) was added and vortexed vigorously for 10-15 min. The blue colored component which is extracted into the DCM phase was discarded and the washings were repeated until a colorless DCM layer was obtained. The purified fluorescent optical brightener (F-OB) present in the aqueous phase of the emulsion devoid of blue color was dried at 70°C overnight. The entire procedure was done in a subdued light. The percent recovery of purified F-OB powder was calculated based on five independent extractions (n=5).
Thin layer chromatography (TLC)
The crude and purified aliquots of F-OB (1.0 µg each), and evaporated DCM fraction was dissolved in double glass distilled water. Ten micro liters of each sample was spotted onto the activated Polyester Silica Gel-G TLC plate. The plate was developed using pyridine ammonium hydroxide: acetone: chloroform (8:1:1) as solvent system. Pyridine ammonium hydroxide was prepared by adding 95 parts of pyridine and 5 parts ammonium hydroxide. After the chromatographic run, the fluorescence of the resulting compound was visualized under long wavelength UV light (365 nm) in a UV cabinet in transmittance mode using digital image-based analysis system (DIAS) equipped with CCD camera (UVItec, Cambridge, UK). The Rf value of the fluorescent spot was calculated.
Spectral studies
Absorption spectra: The absorption spectrum of both crude and purified F-OB was taken from 200-420 nm using a spectrophotometer (Spekol 1200, Analytic Jena AG, Konard Zuse, Jena, Germany). Concentration of the sample used was 50 µg/mL of double glass distilled water. In addition, the absorption spectrum of the purified
F-OB was taken under different pH conditions (Neutral, alkaline and acidic). Fifty micro grams of the purified sample was dissolved in 1 mL of double glass distilled water (neutral)/1.0 M HCl (acidic)/0.1 M NaOH (basic) and their spectra was obtained against their respective blanks from 200-420 nm.
Emission spectra: Based on the absorption maxima, the excitation was fixed at 345 nm and an emission spectrum of both crude and purified F-OB was taken from 340-600 nm in a Fluorescence spectrophotometer (Perkin-Elmer LS-3B, Norwalk, NJ, USA). Concentration of the sample used was 50 µg/mL of double glass distilled water. Emission profile of purified F-OB under different pH conditions was obtained by dissolving 50 µg of F-OB/mL each of double glass distilled water (neutral)/1 M HCl (acidic)/0.1 M NaOH (basic). Measurements were made against their respective blanks. The absorption maxima obtained under different pH conditions was fixed as excitation wavelength and emission spectra was obtained from 340-600 nm.
Mass spectrometry (MS)
Mass spectral analysis was carried out to find out the probable molecular weight of the purified F-OB. The analysis was performed using Agilent 1100 series LC/MSD trap equipped with ESI (electron spray ionization) source in a positive mode. The flow rate of the solvent system [methanol: water (80: 20] was set at 0.5 mL/min. The sample was also solubilized in the solvent system (1.0 mg/mL). Five micro liters of sample was subjected to FIA (free injection analysis). The scan of the molecule was taken from 20-900 nm using a PDA detector. The operating conditions for MS are given in Table 1.
Polyacrylamide gel electrophoresis
Bovine serum albumin (BSA) was used for the initial standardization of staining procedure using purified F-OB on 1D native PAGE. Subsequently, protein MW markers (medium range) containing Phosphorylase b (Mr 97,400), BSA (Mr 66,000), Ovalbumin (Mr 43,000), Carbonic anhydrase (Mr 29,000), Soyabean trypsin inhibitor (Mr 20,100) and Lysozyme (Mr 14,300) were used for both native and SDS PAGE. Approximately, 0.05-5.0 µg of protein MW markers were loaded per gel lane and separated by both Native/SDS PAGE utilizing a 4% T, 0.1% C stacking gel, pH-6.8 and 12.5% T, 0.32% C separating gel, pH-8.8. % T is the percent amount of total monomer (including cross-linker) and % C is the percent amount of cross-linker in a polyacrylamide gel. Running/tank buffer used was 25 mm Tris, 192 mm glycine, pH 8.3. A 0.75 mm and 1.0 mm thickness gels were used for Native and SDS-PAGE respectively which were run according to the method Fuvite of Laemmli in 1970 [12]. Electrophoresis was carried out with 1.5 mA of current per loaded well using Sigma gel electrophoresis unit (Model: Z37240-4, Sigma Chemical Co., St. Louis,
Ionization mode Positive ESI (electron spray ionization)Nebulizer 45 psig
Drying gas flow 8 L/minDrying gas flow 350°CCapillary voltage 3500 V
Skimmer 1 40 VCapillary exit 114.8 V
Trap drive 43.1Scan 50–600 m/z
ICC on Target 10000; Maximum accumulation time: 200 ms
Averages 5
Table 1: Mass spectrometry (MS) operating conditions.

Citation: Sashidhar RB, Kosuri T, Nayak S (2016) Rapid Detection of Proteins on One-Dimensional Polyacrylamide Gel Electrophoresis Using an Inexpensive Fluorescent Optical Brightener. Biochem Anal Biochem 5: 293. doi:10.4172/2161-1009.1000293
Volume 5 • Issue 3 • 1000293Biochem Anal Biochem, an open access journalISSN: 2161-1009
Page 3 of 9
MO 63178, USA). For comparison and to maintain uniform running conditions, two gels were run simultaneously. One of the gels was stained with F-OB (dissolved in double glass distilled water) and the other stained directly with CBB.
Native (non-denaturing) PAGE: Varying concentrations of the protein sample (BSA; 0.05-10 µg) was loaded in the wells (15 µL/well) and the gel was allowed to run just until the bromo phenol blue ran completely off the gel. During the course of standardization of the staining procedure, initially, F-OB (0.002%) was added (a) while running the gel i.e., pre-electrophoretically in (i) separating gel, sample and the tank buffer (ii) sample and tank buffer (iii) only tank buffer. The proteins were fixed in 7% acetic acid and the gel was left overnight in the same solvent to remove the fluorescent background; (b) after running the gel i.e., post-electrophoretically in the tank buffer. After the electrophoretic run, the proteins were fixed in 7% acetic acid for 5-10 min and were stained with F-OB (2 mg/100 mL of tank buffer) for 10 min.
Varying concentrations of protein MW markers (medium range) were also loaded in the concentration range of 0.05-5.0 µg/lane or 8.33-833 ng/band. The stained protein bands were then visualized under UV at 365 nm using CCD-based DIAS in transmittance mode. Biological samples such as rabbit sera (1:50 diluted) and rat lens γ-crystallins (10 g) were also stained with F-OB on native gel, post-electrophoretically.
Sodium dodecyl sulfate (SDS)-PAGE (Denaturing): Protein MW markers (medium range) were used at different concentrations (0.05-5.0 µg/lane or 8.33-833 ng/band). The samples with the tracking dye were heated to 70-75°C for 3 min and were allowed to cool to room temperature before loading into the sample wells. After running the gel, SDS was extracted from the polyacrylamide gel using SDS extraction buffer containing 10 mm Tris-HCl (pH 7.5), 5 mm 2-mercaptoethanol and 25% of 2-propanol, twice for 10 min each at 25°C on a platform shaker. The volume of SDS extraction buffer used was 30-35 times the gel volume. The proteins were later fixed and stained with F-OB as described in the previous section.
Detection of proteins using digital image-based analysis system (DIAS)
Though, F-OB is readily visualized by eye under a UV light cabinet, a computerized CCD (charged coupled device) based camera (monochrome type) with digital image-based analysis system (DIAS) (UVItec, Cambridege, UK) was used for data acquisition, since fluorescence intensity can be integrated and quantitative information can be obtained using digital image processing and analysis software. This system consisted of a high-resolution CCD-based camera (monochrome type) with absorbance and fluorescence density recording facility. The camera was equipped with UV and infrared interference filters. The acquired image was displayed on a built-in liquid crystal display screen (resolution 8-bit, 256 gray level images). The image acquisition system was linked to an Intel Pentium 4 processor-based computer, loaded with UVItec image processing and storage software (64-bit data software). The digitalized image had a resolution of 752 (H) x 582 (V) pixels. The transilluminator consisted of dual wavelength (312 nm and 365 nm) UV lamps, along with a UV-to-white-light conversion screen. The digital image acquisition was achieved by placing the gels on flat surface of the trans-illuminator, housed in the light-tight cabinet. The fluorescence of the separated protein bands was visualized under long wavelength UV light (365 nm) in a UV cabinet in transmittance mode. Annotated images were saved in PC compatible file format (.tiff file). Later, the digital images of the
protein bands were analyzed by the software for determining the net fluorescence intensity (density), which was measured as peak volume.
Linearity analysisLinearity of protein staining in the gels was analyzed by correlating
the amount of protein loaded (each band) vs fluorescent intensity (peak volume). The fluorescent intensities of each of the individual protein bands for each concentration were taken. To ensure repeatability and reproducibility of the results, the values are Mean ± SD from three different gels run under similar experimental conditions. Varying concentrations of BSA/individual protein band of protein MW markers (medium range) were taken to establish calibration plots [by plotting different concentrations of BSA (0.05-10 µg)/individual protein band of molecular weight standards (8.33-833 ng/band) versus the fluorescent intensity measured as peak volume]. The calibration plot was based on linear regression analysis.
Results and DiscussionPurification of optical brightener
Treating crude optical brightener with the biphasic solvent system (i.e., DCM and water) was found to be ideal for purifying the fluorescent material (F-OB) free from associated contaminants. The percent recovery of the purified material was found to be 92 ± 0.66. Values in parenthesis indicate C.V (coefficient of variance). The associated impurities were found to be approximately 8.0%.
Thin layer chromatography The solvent system [pyridine ammonium hydroxide: chloroform:
acetone (8: 1: 1)] was found to be suitable for separation of fluorescent dye on TLC plates. The Rf value of both in crude and purified sample (F-OB) was found to be 0.63. The DCM fraction has not shown any fluorescence spot indicating that F-OB has not been extracted in to it during the biphasic purification procedure (Figure 1).
Spectral analysis
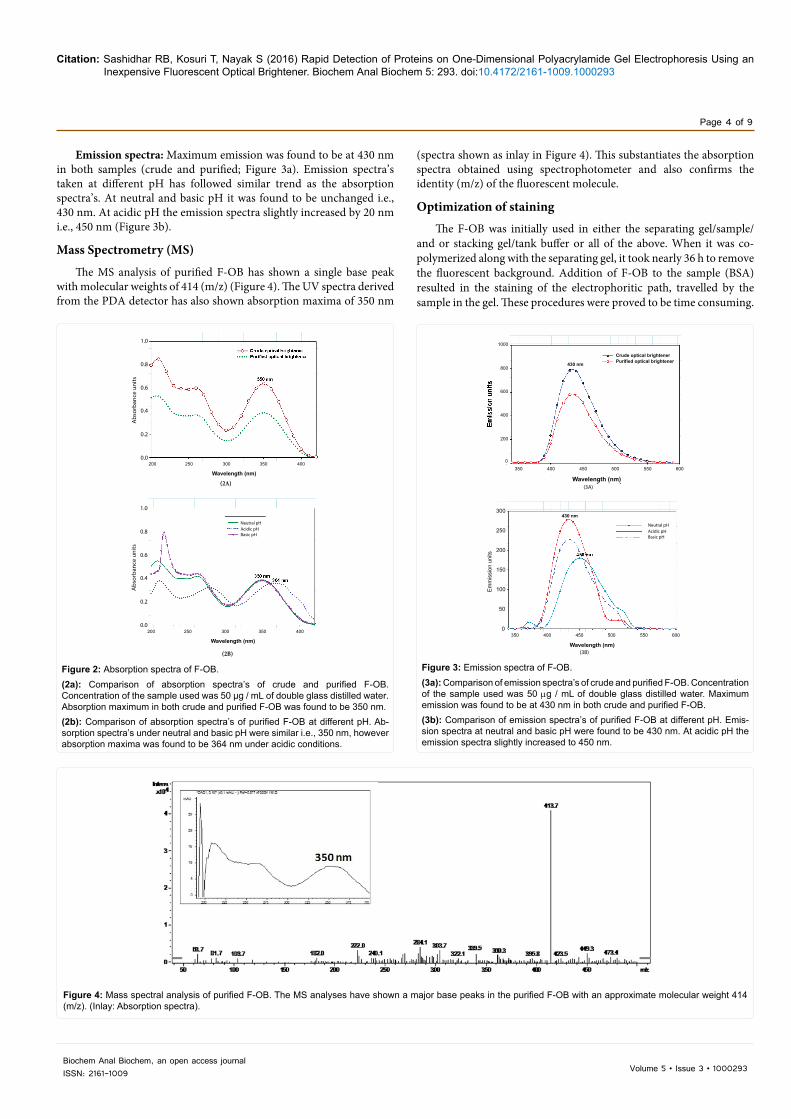
Absorption spectra: Absorption maxima of both crude and purified samples were found to be 350 nm (Figure 2a). Absorption spectra’s under neutral and basic pH were similar i.e., 350 nm, however under acidic conditions, a shift in absorption maxima to 364 nm was seen (Figure 2b).
Figure 1: Thin layer chromatography of crude and purified F-OB. (Lane 1: Crude F-OB; Lane 2: Purified F-OB; Lane 3: Pooled DCM fraction obtained during purification. One micro gram each of crude and purified F-OB was spotted on the TLC plate. Pyridine ammonium hydroxide: acetone: chloroform (8:1:1) was used as the solvent system. The Rf value of crude and purified F-OB was found to be 0.63).
Citation: Sashidhar RB, Kosuri T, Nayak S (2016) Rapid Detection of Proteins on One-Dimensional Polyacrylamide Gel Electrophoresis Using an Inexpensive Fluorescent Optical Brightener. Biochem Anal Biochem 5: 293. doi:10.4172/2161-1009.1000293
Volume 5 • Issue 3 • 1000293Biochem Anal Biochem, an open access journalISSN: 2161-1009
Page 4 of 9
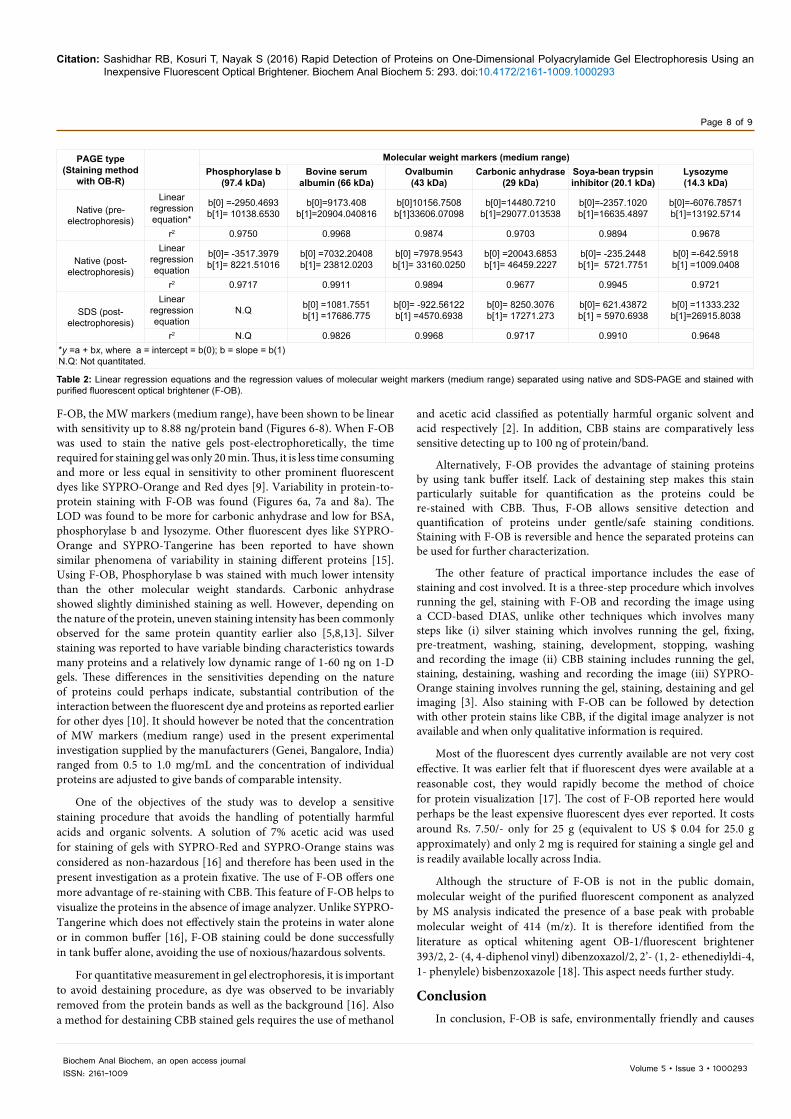
(spectra shown as inlay in Figure 4). This substantiates the absorption spectra obtained using spectrophotometer and also confirms the identity (m/z) of the fluorescent molecule.
Optimization of stainingThe F-OB was initially used in either the separating gel/sample/
and or stacking gel/tank buffer or all of the above. When it was co-polymerized along with the separating gel, it took nearly 36 h to remove the fluorescent background. Addition of F-OB to the sample (BSA) resulted in the staining of the electrophoritic path, travelled by the sample in the gel. These procedures were proved to be time consuming.
(2A)
(2B)
Neutral pHAcidic pHBasic pH
200 250 300 350 400
Wavelength (nm)
200 250 300 350 400
Wavelength (nm)
Ab
sorb
ance
uni
ts
0.0
0.2
0.4
0.6
0.8
1.0
Ab
sorb
ance
uni
ts
0.0
0.2
0.4
0.6
0.8
1.0
Figure 2: Absorption spectra of F-OB.(2a): Comparison of absorption spectra’s of crude and purified F-OB. Concentration of the sample used was 50 µg / mL of double glass distilled water. Absorption maximum in both crude and purified F-OB was found to be 350 nm.(2b): Comparison of absorption spectra’s of purified F-OB at different pH. Ab-sorption spectra’s under neutral and basic pH were similar i.e., 350 nm, however absorption maxima was found to be 364 nm under acidic conditions.
(3A)
(3B)
Crude optical brightenerPurified optical brightener430 nm
Wavelength (nm)
350 400 450 500 550 600
200
400
600
800
1000
0
350 400 450 500 550 600
Wavelength (nm)
300
250
200
150
100
50
0
430 nm
Em
mis
sion
uni
ts
Neutral pHAcidic pHBasic pH
Figure 3: Emission spectra of F-OB.(3a): Comparison of emission spectra’s of crude and purified F-OB. Concentration of the sample used was 50 µg / mL of double glass distilled water. Maximum emission was found to be at 430 nm in both crude and purified F-OB.(3b): Comparison of emission spectra’s of purified F-OB at different pH. Emis-sion spectra at neutral and basic pH were found to be 430 nm. At acidic pH the emission spectra slightly increased to 450 nm.
Emission spectra: Maximum emission was found to be at 430 nm in both samples (crude and purified; Figure 3a). Emission spectra’s taken at different pH has followed similar trend as the absorption spectra’s. At neutral and basic pH it was found to be unchanged i.e., 430 nm. At acidic pH the emission spectra slightly increased by 20 nm i.e., 450 nm (Figure 3b).
Mass Spectrometry (MS)
The MS analysis of purified F-OB has shown a single base peak with molecular weights of 414 (m/z) (Figure 4). The UV spectra derived from the PDA detector has also shown absorption maxima of 350 nm
Figure 4: Mass spectral analysis of purified F-OB. The MS analyses have shown a major base peaks in the purified F-OB with an approximate molecular weight 414 (m/z). (Inlay: Absorption spectra).

Citation: Sashidhar RB, Kosuri T, Nayak S (2016) Rapid Detection of Proteins on One-Dimensional Polyacrylamide Gel Electrophoresis Using an Inexpensive Fluorescent Optical Brightener. Biochem Anal Biochem 5: 293. doi:10.4172/2161-1009.1000293
Volume 5 • Issue 3 • 1000293Biochem Anal Biochem, an open access journalISSN: 2161-1009
Page 5 of 9
10 5.0 2.5 1.0 0.5 0.25 0.1 0.05 µg/lane
66 k Da
(5A) (5B)
10 5.0 2.5 1.0 0.5 0.25 0.1 0.05 µg/lane
66 k Da
(5C)
2.5e+5
2.0e+5
1.5e+5
1.0e+5
5.0e+4
0.0
-5.0e+40.1 1 10
Conc. of BSA (µg)
Fluo
resc
ent i
nten
sity
(den
sity
)
Figure 5: Native gel electrophoresis of BSA. (Electrophoresis was carried out in 12.5% native gel and the concentration of BSA loaded per lane ranged from 0.05-10 µg. Arrows refers to the bands quantified).(5a): F-OB stained native gel electrophoresis of BSA. Gel was incubated in 100 mL of tank buffer containing 2 mg of F-OB for 5-10 min, after fixing the protein briefly for 5 min in 7% acetic acid. The fluorescent intensity as peak volume was quantified using CCD camera based DIAS.(5b): Native gel electrophoresis of BSA stained with CBB. The gel was stained in 0.4% CBB for 25-30 min and destained with 7% acetic acid and 5% methanol overnight.(5c): Calibration plot for BSA stained with F-OB. The plot is based on linear regression equation. The points are Mean ± S.D of three independent analyses. The r2 value of 0.976 indicates good linearity at different concentrations of proteins.
(A) (B)
(C)
Figure 6: Native gel electrophoresis of MW markers (medium range) stained with F-OB pre-electrophoretically. Electrophoresis was carried out in 12.5% native gel and the concentration of MW markers (Medium range) standards loaded per lane ranged from 0.05-5.0 g / lane or 8.33-833 ng / protein band. Arrows refers to the bands quantified.(6a): Pre-electrophoretic staining of MW markers (medium range) with F-OB on native gel. [F-OB was added in the tank buffer (2 mg/100 mL). The proteins were fixed in 7% acetic acid and the gel was left overnight in the same to remove the fluorescent background. The stained proteins were quantified using CCD based DIAS. The limit of detection (LOD) was found to vary among the proteins stained with F-OB. Among the MW marker proteins, the LOD was found to be more for carbonic anhydrase (8.33-833 ng), followed by Ovalbumin and Soya bean trypsin inhibitor (16.67-833 ng)].(6b): Native gel electrophoresis of MW markers (medium range) stained with CBB. The gel was stained in 0.4% CBB for 25-30 min and destained with 7% acetic acid and 5% methanol overnight. The LOD of proteins using CBB was found to be 10 times less sensitive compared to F-OB.(6c): Calibration plot for MW markers (medium range) stained with F-OB pre-electrophoretically on native gel. The plot is based on linear regression equation. Each point is based on Mean ± S.D of three independent analyses. The r2 value of 0.968 to 0.997 indicates good linearity at different concentrations of proteins.

Citation: Sashidhar RB, Kosuri T, Nayak S (2016) Rapid Detection of Proteins on One-Dimensional Polyacrylamide Gel Electrophoresis Using an Inexpensive Fluorescent Optical Brightener. Biochem Anal Biochem 5: 293. doi:10.4172/2161-1009.1000293
Volume 5 • Issue 3 • 1000293Biochem Anal Biochem, an open access journalISSN: 2161-1009
Page 6 of 9
(7A) (7B)
(7C)
Figure 7: Native gel electrophoresis of MW markers (medium range) stained with F-OB post-electrophoretically. Electrophoresis was carried out in 12.5% native gel and the concentration of MW markers loaded per lane ranged from 0.05-5.0 µg or 8.33-833 ng/protein band. Arrows refers to the bands quantified.(7a) Post-electrophoretic staining of MW markers (medium range) with F-OB on native gel. Gel was incubated in 100 mL of tank buffer containing 2 mg of F-OB for 5-10 min, after fixing the protein briefly for 5 min in 7% acetic acid. The fluorescent intensity as peak volume was quantified using CCD based DIAS. The limit of detection (LOD) was found to vary among the proteins stained with F-OB. Among the MW markers, the LOD was found to be more for carbonic anhydrase (8.33-833 ng), followed by Ovalbumin and Soya bean trypsin inhibitor (16.67-833 ng).(7b): Native gel electrophoresis of MW markers (medium range) stained with CBB. The gel was stained in 0.4% CBB for 25-30 min and destained with 7% acetic acid and 5% methanol overnight. The LOD of proteins using CBB was found to be 10 times less sensitive compared to F-OB.(7c): Calibration plot for MW markers (medium range) stained with F-OB post-electrophoretically on native gel. The plot is based on linear regression equation. Each point is based on Mean ± S.D of three independent analyses. The r2 value of 0.968 to 0.995 indicates good linearity at different concentrations of proteins.
Alternatively, F-OB was added only in the tank buffer either pre- or post-electrophoretically. Among the various staining methods tried, the ease of staining the proteins with F-OB was found to be less cumbersome and consumed less time, by adding it directly to tank buffer post-electrophoretically (Figure 5a). Also, as staining of proteins with F-OB was accomplished in the tank buffer itself, it ensured safe and gentle staining conditions, thus avoiding the use of harmful acids and solvents. Though, both the methods (pre- and post-electrophoretic staining) were found to yield sensitive visualization of proteins, it is pertinent to note that the pre-electrophoretic staining of the gel with F-OB was time-consuming, as F-OB has to be removed from the gel background that took nearly 6-10 h. With post-electrophoretic staining of the gels with F-OB, the time required for recording the proteins after electrophoretic run was only 20 min for native PAGE. No variation in terms of sensitivity of detection of proteins was seen between the pre- and post-electrophoretic methods (Figures 6a and 7a).
However, for SDS-PAGE, additional 20-30 min was required for the extraction of SDS from the polyacrylamide gel, as SDS was found to interfere with binding of F-OB to proteins, when F-OB was added to the tank buffer pre-electrophoretically. Hence, ideally, SDS gels should be stained post-electrophoretically, after extraction of SDS from the gels (Figure 8a). The authenticity of staining biological material with F-OB was also confirmed, by staining native gel loaded with different concentrations of rabbit sera and rat lens γ-crystallins post-electrophoretically (Figure 9). Most of the dyes reported previously, bind to proteins in gels non-covalently through interaction with the SDS micelles [9,13,14]. In the present study, as presence of SDS was
found to deter F-OB from binding to the proteins, the nature of its interaction could be different from other fluorescent dyes. This aspect of F-OB needs further investigation.
Staining of gels with F-OB is reversible. When the F-OB stained gel was left in the tank buffer for more than 2 h, the F-OB was found to dissociate from the protein and dissolved into the tank buffer. But the F-OB remained intact, bound to protein when it was left in acidic conditions i.e., 7% acetic acid for any length of time. This reversible staining nature of F-OB helps in further characterization of proteins. Interestingly, it was observed that, the time required for re-staining the F-OB stained gels with 0.4% CBB is very less (3-5 min) compared to direct staining of gels with CBB (30 min).
Sensitivity of staining proteins with F-OBFigure 5a shows the sensitivity of staining of BSA with F-OB and it
could stain up to 0.05 µg of BSA compared to BSA stained with CBB, which could stain only up to 0.1 µg (Figure 5b). No difference, in terms of sensitivity of detecting the proteins (molecular weight standards) was observed between pre- and post-electrophoretic staining of gels with F-OB (Figures 6a and 7a). Also, F-OB was found to be tenfold more sensitive as compared to the gels stained with CBB directly (Figures 5b, 6b, 7b and 8b).
Linearity of staining
In order to see the linearity of staining proteins on gels using F-OB, the intensities of the protein bands for each concentration were taken. A calibration plot with various concentrations of proteins on x-axis vs their fluorescent intensity units (density) as peak volume on y-axis was constructed for (i) BSA on native PAGE (Figure 5c) (ii) MW markers
Citation: Sashidhar RB, Kosuri T, Nayak S (2016) Rapid Detection of Proteins on One-Dimensional Polyacrylamide Gel Electrophoresis Using an Inexpensive Fluorescent Optical Brightener. Biochem Anal Biochem 5: 293. doi:10.4172/2161-1009.1000293
Volume 5 • Issue 3 • 1000293Biochem Anal Biochem, an open access journalISSN: 2161-1009
Page 7 of 9
(8A) (8B)
(8C)
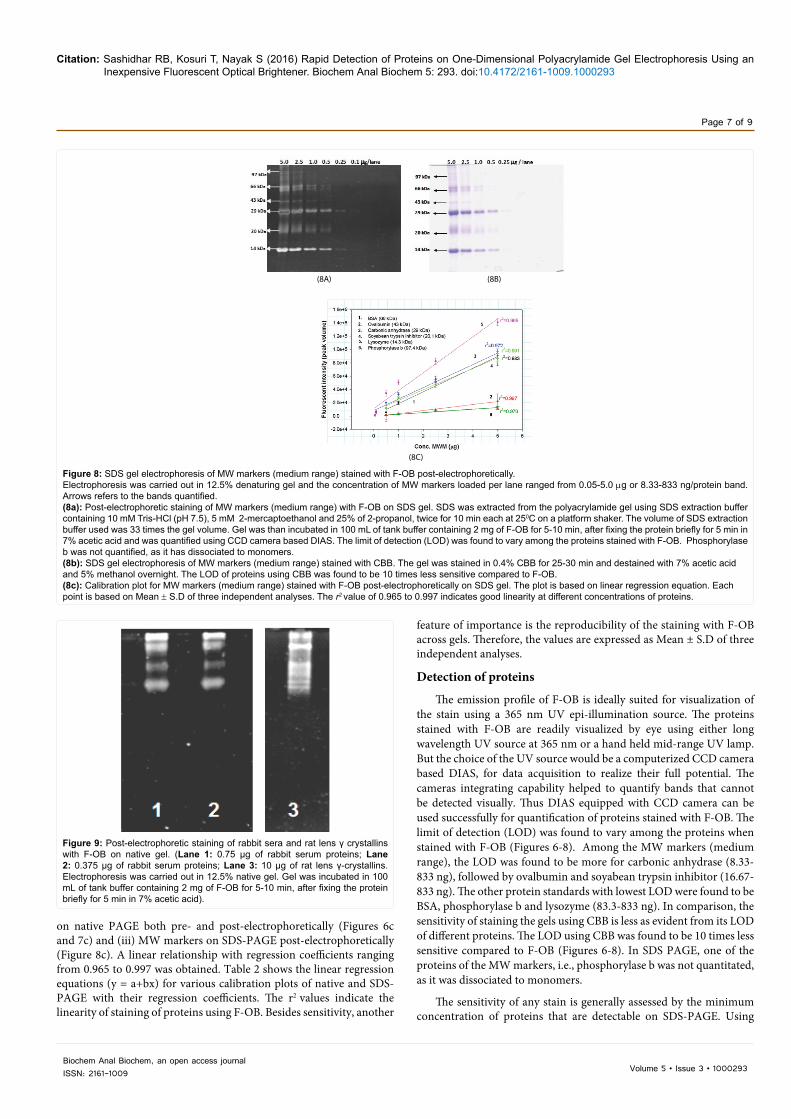
Figure 8: SDS gel electrophoresis of MW markers (medium range) stained with F-OB post-electrophoretically.Electrophoresis was carried out in 12.5% denaturing gel and the concentration of MW markers loaded per lane ranged from 0.05-5.0 µg or 8.33-833 ng/protein band. Arrows refers to the bands quantified.(8a): Post-electrophoretic staining of MW markers (medium range) with F-OB on SDS gel. SDS was extracted from the polyacrylamide gel using SDS extraction buffer containing 10 mM Tris-HCl (pH 7.5), 5 mM 2-mercaptoethanol and 25% of 2-propanol, twice for 10 min each at 250C on a platform shaker. The volume of SDS extraction buffer used was 33 times the gel volume. Gel was than incubated in 100 mL of tank buffer containing 2 mg of F-OB for 5-10 min, after fixing the protein briefly for 5 min in 7% acetic acid and was quantified using CCD camera based DIAS. The limit of detection (LOD) was found to vary among the proteins stained with F-OB. Phosphorylase b was not quantified, as it has dissociated to monomers.(8b): SDS gel electrophoresis of MW markers (medium range) stained with CBB. The gel was stained in 0.4% CBB for 25-30 min and destained with 7% acetic acid and 5% methanol overnight. The LOD of proteins using CBB was found to be 10 times less sensitive compared to F-OB.(8c): Calibration plot for MW markers (medium range) stained with F-OB post-electrophoretically on SDS gel. The plot is based on linear regression equation. Each point is based on Mean ± S.D of three independent analyses. The r2 value of 0.965 to 0.997 indicates good linearity at different concentrations of proteins.
Figure 9: Post-electrophoretic staining of rabbit sera and rat lens γ crystallins with F-OB on native gel. (Lane 1: 0.75 µg of rabbit serum proteins; Lane 2: 0.375 µg of rabbit serum proteins; Lane 3: 10 µg of rat lens γ-crystallins. Electrophoresis was carried out in 12.5% native gel. Gel was incubated in 100 mL of tank buffer containing 2 mg of F-OB for 5-10 min, after fixing the protein briefly for 5 min in 7% acetic acid).
on native PAGE both pre- and post-electrophoretically (Figures 6c and 7c) and (iii) MW markers on SDS-PAGE post-electrophoretically (Figure 8c). A linear relationship with regression coefficients ranging from 0.965 to 0.997 was obtained. Table 2 shows the linear regression equations (y = a+bx) for various calibration plots of native and SDS-PAGE with their regression coefficients. The r2 values indicate the linearity of staining of proteins using F-OB. Besides sensitivity, another
feature of importance is the reproducibility of the staining with F-OB across gels. Therefore, the values are expressed as Mean ± S.D of three independent analyses.
Detection of proteins
The emission profile of F-OB is ideally suited for visualization of the stain using a 365 nm UV epi-illumination source. The proteins stained with F-OB are readily visualized by eye using either long wavelength UV source at 365 nm or a hand held mid-range UV lamp. But the choice of the UV source would be a computerized CCD camera based DIAS, for data acquisition to realize their full potential. The cameras integrating capability helped to quantify bands that cannot be detected visually. Thus DIAS equipped with CCD camera can be used successfully for quantification of proteins stained with F-OB. The limit of detection (LOD) was found to vary among the proteins when stained with F-OB (Figures 6-8). Among the MW markers (medium range), the LOD was found to be more for carbonic anhydrase (8.33-833 ng), followed by ovalbumin and soyabean trypsin inhibitor (16.67-833 ng). The other protein standards with lowest LOD were found to be BSA, phosphorylase b and lysozyme (83.3-833 ng). In comparison, the sensitivity of staining the gels using CBB is less as evident from its LOD of different proteins. The LOD using CBB was found to be 10 times less sensitive compared to F-OB (Figures 6-8). In SDS PAGE, one of the proteins of the MW markers, i.e., phosphorylase b was not quantitated, as it was dissociated to monomers.
The sensitivity of any stain is generally assessed by the minimum concentration of proteins that are detectable on SDS-PAGE. Using
Citation: Sashidhar RB, Kosuri T, Nayak S (2016) Rapid Detection of Proteins on One-Dimensional Polyacrylamide Gel Electrophoresis Using an Inexpensive Fluorescent Optical Brightener. Biochem Anal Biochem 5: 293. doi:10.4172/2161-1009.1000293
Volume 5 • Issue 3 • 1000293Biochem Anal Biochem, an open access journalISSN: 2161-1009
Page 8 of 9
F-OB, the MW markers (medium range), have been shown to be linear with sensitivity up to 8.88 ng/protein band (Figures 6-8). When F-OB was used to stain the native gels post-electrophoretically, the time required for staining gel was only 20 min. Thus, it is less time consuming and more or less equal in sensitivity to other prominent fluorescent dyes like SYPRO-Orange and Red dyes [9]. Variability in protein-to-protein staining with F-OB was found (Figures 6a, 7a and 8a). The LOD was found to be more for carbonic anhydrase and low for BSA, phosphorylase b and lysozyme. Other fluorescent dyes like SYPRO-Orange and SYPRO-Tangerine has been reported to have shown similar phenomena of variability in staining different proteins [15]. Using F-OB, Phosphorylase b was stained with much lower intensity than the other molecular weight standards. Carbonic anhydrase showed slightly diminished staining as well. However, depending on the nature of the protein, uneven staining intensity has been commonly observed for the same protein quantity earlier also [5,8,13]. Silver staining was reported to have variable binding characteristics towards many proteins and a relatively low dynamic range of 1-60 ng on 1-D gels. These differences in the sensitivities depending on the nature of proteins could perhaps indicate, substantial contribution of the interaction between the fluorescent dye and proteins as reported earlier for other dyes [10]. It should however be noted that the concentration of MW markers (medium range) used in the present experimental investigation supplied by the manufacturers (Genei, Bangalore, India) ranged from 0.5 to 1.0 mg/mL and the concentration of individual proteins are adjusted to give bands of comparable intensity.
One of the objectives of the study was to develop a sensitive staining procedure that avoids the handling of potentially harmful acids and organic solvents. A solution of 7% acetic acid was used for staining of gels with SYPRO-Red and SYPRO-Orange stains was considered as non-hazardous [16] and therefore has been used in the present investigation as a protein fixative. The use of F-OB offers one more advantage of re-staining with CBB. This feature of F-OB helps to visualize the proteins in the absence of image analyzer. Unlike SYPRO-Tangerine which does not effectively stain the proteins in water alone or in common buffer [16], F-OB staining could be done successfully in tank buffer alone, avoiding the use of noxious/hazardous solvents.
For quantitative measurement in gel electrophoresis, it is important to avoid destaining procedure, as dye was observed to be invariably removed from the protein bands as well as the background [16]. Also a method for destaining CBB stained gels requires the use of methanol
and acetic acid classified as potentially harmful organic solvent and acid respectively [2]. In addition, CBB stains are comparatively less sensitive detecting up to 100 ng of protein/band.
Alternatively, F-OB provides the advantage of staining proteins by using tank buffer itself. Lack of destaining step makes this stain particularly suitable for quantification as the proteins could be re-stained with CBB. Thus, F-OB allows sensitive detection and quantification of proteins under gentle/safe staining conditions. Staining with F-OB is reversible and hence the separated proteins can be used for further characterization.
The other feature of practical importance includes the ease of staining and cost involved. It is a three-step procedure which involves running the gel, staining with F-OB and recording the image using a CCD-based DIAS, unlike other techniques which involves many steps like (i) silver staining which involves running the gel, fixing, pre-treatment, washing, staining, development, stopping, washing and recording the image (ii) CBB staining includes running the gel, staining, destaining, washing and recording the image (iii) SYPRO-Orange staining involves running the gel, staining, destaining and gel imaging [3]. Also staining with F-OB can be followed by detection with other protein stains like CBB, if the digital image analyzer is not available and when only qualitative information is required.
Most of the fluorescent dyes currently available are not very cost effective. It was earlier felt that if fluorescent dyes were available at a reasonable cost, they would rapidly become the method of choice for protein visualization [17]. The cost of F-OB reported here would perhaps be the least expensive fluorescent dyes ever reported. It costs around Rs. 7.50/- only for 25 g (equivalent to US $ 0.04 for 25.0 g approximately) and only 2 mg is required for staining a single gel and is readily available locally across India.
Although the structure of F-OB is not in the public domain, molecular weight of the purified fluorescent component as analyzed by MS analysis indicated the presence of a base peak with probable molecular weight of 414 (m/z). It is therefore identified from the literature as optical whitening agent OB-1/fluorescent brightener 393/2, 2- (4, 4-diphenol vinyl) dibenzoxazol/2, 2’- (1, 2- ethenediyldi-4, 1- phenylele) bisbenzoxazole [18]. This aspect needs further study.
ConclusionIn conclusion, F-OB is safe, environmentally friendly and causes
PAGE type (Staining method
with OB-R)
Molecular weight markers (medium range)Phosphorylase b
(97.4 kDa)Bovine serum
albumin (66 kDa)Ovalbumin
(43 kDa)Carbonic anhydrase
(29 kDa)Soya-bean trypsin inhibitor (20.1 kDa)
Lysozyme(14.3 kDa)
Native (pre-electrophoresis)
Linear regression equation*
b[0] =-2950.4693b[1]= 10138.6530
b[0]=9173.408b[1]=20904.040816
b[0]10156.7508b[1]33606.07098
b[0]=14480.7210b[1]=29077.013538
b[0]=-2357.1020b[1]=16635.4897
b[0]=-6076.78571b[1]=13192.5714
r2 0.9750 0.9968 0.9874 0.9703 0.9894 0.9678
Native (post-electrophoresis)
Linear regression equation
b[0]= -3517.3979b[1]= 8221.51016
b[0] =7032.20408b[1]= 23812.0203
b[0] =7978.9543b[1]= 33160.0250
b[0] =20043.6853b[1]= 46459.2227
b[0]= -235.2448b[1]= 5721.7751
b[0] =-642.5918b[1] =1009.0408
r2 0.9717 0.9911 0.9894 0.9677 0.9945 0.9721
SDS (post-electrophoresis)
Linear regression equation
N.Q b[0] =1081.7551b[1] =17686.775
b[0]= -922.56122b[1] =4570.6938
b[0]= 8250.3076b[1]= 17271.273
b[0]= 621.43872b[1] = 5970.6938
b[0] =11333.232b[1]=26915.8038
r2 N.Q 0.9826 0.9968 0.9717 0.9910 0.9648*y =a + bx, where a = intercept = b(0); b = slope = b(1)N.Q: Not quantitated.
Table 2: Linear regression equations and the regression values of molecular weight markers (medium range) separated using native and SDS-PAGE and stained with purified fluorescent optical brightener (F-OB).

Citation: Sashidhar RB, Kosuri T, Nayak S (2016) Rapid Detection of Proteins on One-Dimensional Polyacrylamide Gel Electrophoresis Using an Inexpensive Fluorescent Optical Brightener. Biochem Anal Biochem 5: 293. doi:10.4172/2161-1009.1000293
Volume 5 • Issue 3 • 1000293Biochem Anal Biochem, an open access journalISSN: 2161-1009
Page 9 of 9
fewer nuisances due to the absence of usage of noxious solvents. It allows sensitive detection of protein with sensitivity higher than CBB under gentle staining conditions and does not allow protein modification, in addition to being cost effective.
References
1. Dunn MJ (2002) Detection of proteins in polyacrylamide gels by fluorescent staining, in: J.M. Walker (Ed.), The Protein Protocols Handbook, Human Press Inc., Totowa, NJ, p: 287-293.
2. Neuhoff V, Stamm R, Pardowitz I, Arold N, Ehrhardt W, et al. (1990) Essential problems in quantification of proteins following colloidal staining with coomassie brilliant blue dyes in polyacrylamide gels, and their solution. Electrophoresis 11: 101-117.
3. Tohru T, Eng M, Makiko N (1998) Application Note No. 4, Fuji Film Co, Tokyo, Japan.
4. Patton WF (2000) A thousand points of light: the application of fluorescence detection technologies to two-dimensional gel electrophoresis and proteomics. Biotechniques 28: 944-957.
5. Berggren K, Chernokalskaya E, Steinberg TH, Kemper C, Lopez MF, et al.(2000) Background-free, high sensitivity staining of proteins in one- and two-dimensional sodium dodecyl sulfate-polyacrylamide gels using a luminescentruthenium complex. Electrophoresis 21: 2509-2521.
6. Patton WF (2000b) Making blind robots ‘see’ synergy between fluorescent dyes and imaging devices in automated proteomics. Electrophoresis 21: 1123-1144.
7. Hartman BK, Udenfriend S (1969) A method for immediate visualization ofproteins in acrylamide gels and its use for preparation of antibodies to enzymes. Anal Biochem 30: 391-394.
8. Rabilloud T, Strub JM, Luche S, Van Dorsselaer A, Lunardi J (2001) A
comparison between Sypro Ruby and Ruthenium II tris (bathophenanthroline disulfonate) as fluorescent stains for protein detection in gels. Proteomics 1: 699-704.
9. Steinberg TH, Jones LJ, Haugland RP, Singer V (1996) SYPRO-Orange andSYPRO-Red protein gel stains: One-step fluorescent staining of denaturing gels for detection of nanogram levels of protein. Anal Biochem 239: 223-237.
10. Hong SS, Yoon S, Kang C, Suh M (2004) Hydrophobic aminostyryl quinolinium dyes as new fluorescent stains for proteins in sodium dodecyl sulfate-polyacrylamide gel. Bull Korean Chem Soc 25: 345-346.
11. Anil K, Seshagirirao K, Apparao P (2007) A simple, rapid and yet less expensive method to detectchitinase in agarose plates. J Biochem Biophys Methods 70:683-684.
12. Laemmli UK (1970) Cleavage of structural proteins during the assembly of thehead of bacteriophage T4. Nature 227: 680-685.
13. Steinberg TH, White HM, Singer VL (1997) Optimal filter combinations for photographing SYPRO-Orange or SYPRO-Red dye-stained gels. AnalBiochem 248: 168-172.
14. Patton WF (2002) Detection technologies in proteome analysis. J ChromatogrB Analyt Technol. Biomed Life Sci 771: 3-31.
15. Steinberg TH, Haugland R, Singer V (1996) Applications of SYPRO-Orangeand SYPRO-Red protein gel stains. Anal Biochem 239: 238-245.
16. Steinberg TH, Lauber WM, Berggren K, Kemper C, Yue S, et al. (2000)Fluorescence detection of proteins in sodium dodecyl sulfate-polyacrylamidegels using environmentally benign, non-fixative, saline solution. Electrophoresis 21: 497-508.
17. Sreeramulu G, Singh NK (1995) Destaining of Coomassie brilliant blue R-250-stained polyacrylamide gels with sodium chloride solutions. Electrophoresis 16: 362-365
18. http: //www.chemicalland21.com/fc/fluorescent%20brighteners.htm