t he n ortheastern ice stormice storm1998
TRANSCRIPT

ICE STORM1998ICE STORM1998
A Forest Damage Assessment
for New York, Vermont,
New Hampshire, and Maine
T H E N O R T H E A S T E R N

THE NORTHEASTERN ICE STORM 1998:
A FOREST DAMAGE ASSESSMENT
Prepared by Margaret Miller-Weeks
USDA Forest Service, Northeastern Area State and Private Forestryand
Chris EagarUSDA Forest Service, Northeastern Research Station
in cooperation with Christina M. Petersen
North East State Foresters Association (NEFA)
Contributors:Robert Smith, USDA Forest Service, Northeastern Research Station
Chuck Barnett, USDA Forest Service Northeastern Research Station, Forest Health Monitoring ProgramPierre DesRochers, Natural Resources Canada, Canadian Forest Service
Lewis Staats, Sugar Maple Field Station, Cornell UniversityRon Kelley, Vermont Department of Forests, Parks, and Recreation
David Alerich and Jason Morrison USDA Forest Service, Northeastern Research Station, Forest Inventory and Analysis
William Frament, Tom Luther, and Robert Cooke USDA Forest Service, Northeastern Area State and Private Forestry
Special thanks to state members of the Ice Storm Assessment Team for cooperating in the planning, implementing, and reporting of the damage assessment:
Henry Trial and Dave Struble Maine Forest Service
Jennifer Bofinger and Kyle LombardNew Hampshire Division of Forests and Lands
Brent Teillon, Ron Kelley, Barbara Burns, Sandy Wilmot, and Jay LackeyVermont Department of Forests, Parks and Recreation
Mike Birmingham and Jenna Spear O’MaraNew York Department of Environmental Conservation
Editor: Helen Thompson, USDA Forest ServiceDesign: Baker Salmon Design, Peterborough, NH
Data Entry: Karen Davies and Sherry Legare, USDA Forest Service
Produced by NEFA –– the State Foresters of New York, Vermont, New Hampshire, and Maine, cooperating with the USDA Forest Service, State and Private Forestry. December 1999. Printed on recycled paper.

3
Highlights 2
Introduction 4
Meterological Details of the Ice Storm 4
Damage Assessment Surveys 5Regional Damage Survey and Forest Inventory and Analysis Sites 5
Characteristics of Damage 8Crown Damage 8Damage to Frequently Occurring Species 10Damage in Relation to Tree Size 13Bent or Leaning Trees 14Damage to Saplings 14Aspect and Elevation 14
Fire Hazard 15
Forest Health Monitoring Sites 16Results 17
North American Maple Project Sites 18Results 18
Additional Surgarbush Surveys 19New York 19New Hampshire 20
Vermont Hardwood Health Survey Sites 20Results 21
Remote Sensing Activities Related to the Ice Storm 22Aerial Photography 22Satellite Imagery 22Color Infrared Digital Camera 22
Monitoring Effects of the Ice Storm 23New York 23Vermont 24New Hampshire 25Maine 25USDA Forest Service 25
Appendix: Management Recommendations for Landowners 27
Contacts & Websites 32
TABLE OF CONTENTS
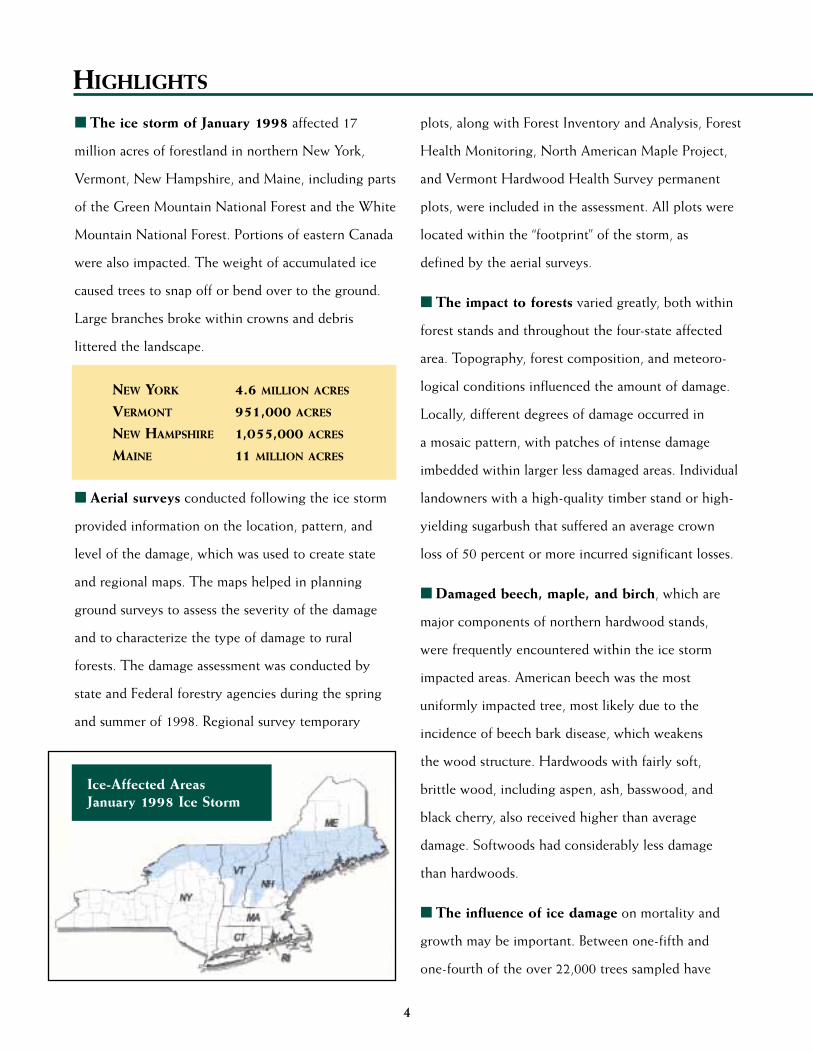
■ The ice storm of January 1998 affected 17
million acres of forestland in northern New York,
Vermont, New Hampshire, and Maine, including parts
of the Green Mountain National Forest and the White
Mountain National Forest. Portions of eastern Canada
were also impacted. The weight of accumulated ice
caused trees to snap off or bend over to the ground.
Large branches broke within crowns and debris
littered the landscape.
■ Aerial surveys conducted following the ice storm
provided information on the location, pattern, and
level of the damage, which was used to create state
and regional maps. The maps helped in planning
ground surveys to assess the severity of the damage
and to characterize the type of damage to rural
forests. The damage assessment was conducted by
state and Federal forestry agencies during the spring
and summer of 1998. Regional survey temporary
plots, along with Forest Inventory and Analysis, Forest
Health Monitoring, North American Maple Project,
and Vermont Hardwood Health Survey permanent
plots, were included in the assessment. All plots were
located within the “footprint” of the storm, as
defined by the aerial surveys.
■ The impact to forests varied greatly, both within
forest stands and throughout the four-state affected
area. Topography, forest composition, and meteoro-
logical conditions influenced the amount of damage.
Locally, different degrees of damage occurred in
a mosaic pattern, with patches of intense damage
imbedded within larger less damaged areas. Individual
landowners with a high-quality timber stand or high-
yielding sugarbush that suffered an average crown
loss of 50 percent or more incurred significant losses.
■ Damaged beech, maple, and birch, which are
major components of northern hardwood stands,
were frequently encountered within the ice storm
impacted areas. American beech was the most
uniformly impacted tree, most likely due to the
incidence of beech bark disease, which weakens
the wood structure. Hardwoods with fairly soft,
brittle wood, including aspen, ash, basswood, and
black cherry, also received higher than average
damage. Softwoods had considerably less damage
than hardwoods.
■ The influence of ice damage on mortality and
growth may be important. Between one-fifth and
one-fourth of the over 22,000 trees sampled have
4
NEW YORK 4.6 MILLION ACRES
VERMONT 951,000 ACRES
NEW HAMPSHIRE 1,055,000 ACRES
MAINE 11 MILLION ACRES
Ice-Affected Areas
January 1998 Ice Storm
HIGHLIGHTS
5
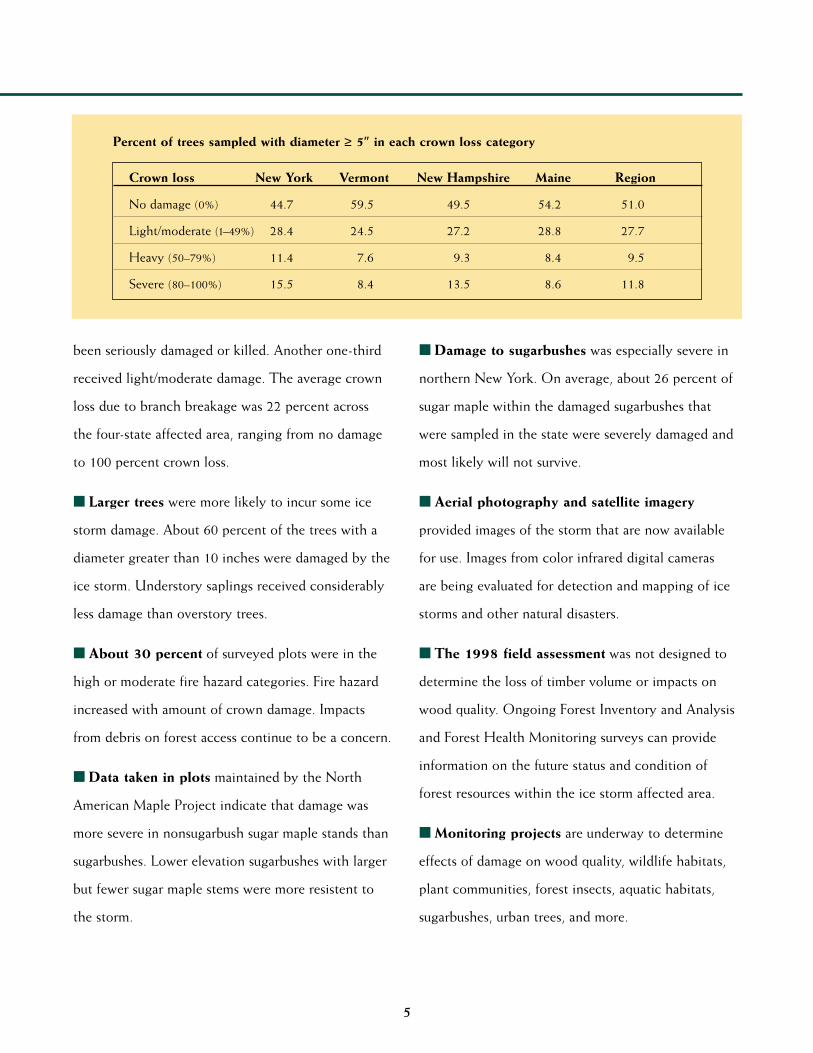
Percent of trees sampled with diameter ≥ 5” in each crown loss category
Crown loss New York Vermont New Hampshire Maine Region
No damage (0%) 44.7 59.5 49.5 54.2 51.0
Light/moderate (1–49%) 28.4 24.5 27.2 28.8 27.7
Heavy (50–79%) 11.4 7.6 9.3 8.4 9.5
Severe (80–100%) 15.5 8.4 13.5 8.6 11.8
been seriously damaged or killed. Another one-third
received light/moderate damage. The average crown
loss due to branch breakage was 22 percent across
the four-state affected area, ranging from no damage
to 100 percent crown loss.
■ Larger trees were more likely to incur some ice
storm damage. About 60 percent of the trees with a
diameter greater than 10 inches were damaged by the
ice storm. Understory saplings received considerably
less damage than overstory trees.
■ About 30 percent of surveyed plots were in the
high or moderate fire hazard categories. Fire hazard
increased with amount of crown damage. Impacts
from debris on forest access continue to be a concern.
■ Data taken in plots maintained by the North
American Maple Project indicate that damage was
more severe in nonsugarbush sugar maple stands than
sugarbushes. Lower elevation sugarbushes with larger
but fewer sugar maple stems were more resistent to
the storm.
■ Damage to sugarbushes was especially severe in
northern New York. On average, about 26 percent of
sugar maple within the damaged sugarbushes that
were sampled in the state were severely damaged and
most likely will not survive.
■ Aerial photography and satellite imagery
provided images of the storm that are now available
for use. Images from color infrared digital cameras
are being evaluated for detection and mapping of ice
storms and other natural disasters.
■ The 1998 field assessment was not designed to
determine the loss of timber volume or impacts on
wood quality. Ongoing Forest Inventory and Analysis
and Forest Health Monitoring surveys can provide
information on the future status and condition of
forest resources within the ice storm affected area.
■ Monitoring projects are underway to determine
effects of damage on wood quality, wildlife habitats,
plant communities, forest insects, aquatic habitats,
sugarbushes, urban trees, and more.

INTRODUCTION
The ice storm of January 1998 affected 17 million
acres of forestland in northern New York, Vermont,
New Hampshire, and Maine, including parts of the
Green Mountain National Forest and the White Mountain
National Forest. Portions of eastern Canada were also
impacted, especially Quebec. The weight of accumulated
ice caused trees to snap off or bend over to the ground.
Large branches broke within crowns and debris littered
the landscape. Meteorologists have called the ice storm
a 100-year event, and many compare it to the hurricane
of 1938 with respect to damage to the region’s forests.
The meteorological characteristics of the storm,
topography of the landscape, and localized forest
composition and structure caused damage that was highly
variable within forests. An Ice Storm Assessment Team
was formed in early February 1998 to assess the severity
of damage. State forestry agencies in New York, Vermont,
New Hampshire, and Maine; the USDA Forest Service’s
Northeastern Area for State and Private Forestry and
Northeastern Research Station; and the Canadian Forest
Service cooperated to collect information. A Federal
Emergency Appropriation was signed in May 1998 to
fund damage assessment and recovery from the ice storm.
The studies presented in this report characterize the
type of damage observed in rural forests within the storm
footprint, defined by the aerial surveys. Several data sets
are examined, including a regional damage survey and
information from Forest Inventory and Analysis permanent
plots in New York, Vermont,
New Hampshire, and Maine.
Results are also presented from
visits to permanent plots that
are part of forest monitoring
projects established over the
last 15 years, including Forest
Health Monitoring, the North
American Maple Project, and
the Vermont Hardwood
Health Survey. Compared to
the regional and FIA surveys
the number of trees that were
observed in these monitoring
networks was small, due to the
limited number of plots within
the ice storm impacted area.
This assessment was not designed to provide an estimate of
the loss of timber volume or reduction of wood quality.
An update on remote sensing activities related to the
ice storm is included in the report. Numerous research
projects that have been initiated or proposed in each of
the affected states are summarized. Information offered in
the appendices includes USDA Forest Service Ice Storm
Fact Sheets covering recommendations for managing ice
damaged forests and a list of contacts and web sites for
additional information.
METEROLOGICAL DETAILSOF THE ICE STORM
The National Weather Service in Gray, Maine, reported
that intermittent freezing rain developed over northern
New York and New England on January 5, 1998. The
freezing rain and drizzle became steadier on January 7 and
continued through January 9. The overall weather pattern
of the ice storm was caused by a low pressure system that
developed in the Gulf of Mexico. The low pressure had
moved northward to the Great Lakes area and then into
Quebec by the morning of January 10. During this period,
several weak areas of low pressure moved along the
quasi-stationary front as southerly winds at mid-levels
in the atmosphere brought warm moist air from the
southeastern United States into the Northeast and
Canada. The combination of these weak low pressure
areas, abundant moisture in the atmosphere, and cold
temperatures near the ground caused significant rainfall and
severe icing in parts of northern New York, New England,
and Quebec. Ice accretions between 1⁄8 and 1⁄4 inch were
reported, with as much as 1⁄2 inch to 3 inches in several
isolated areas. Heavy sleet also fell in many areas, with up
to 10 inches of sleet reported in central Maine. More than
2 feet of snow accumulated in northern Maine.
Intermittent freezing rain, freezing drizzle, rain, drizzle,
and snow persisted during the 5-day period before skies
cleared. On January 11 a drier cold front moved in.
Another low moved through the area on January 12
followed by strong and gusty west to northwest winds.
Maximum wind gusts were generally between 30 and 40
mph, but higher gusts were reported. These winds caused
additional damage to the trees that were still laden with ice.
Warmer temperatures and low pressure followed the cold
front, bringing more precipitation in the form of snow to
coastal and interior areas. Weather remained generally
6
Severe crown damage inhardwood trees in New Hampshire
USD
A Fo
rest
Ser
vice

unsettled until January 23 when sleet developed, then
changed to freezing rain. The mixture of precipitation
continued into January 24, causing significant icing along
coastal areas in New Hampshire and Maine.
DAMAGE ASSESSMENT SURVEYS
Aerial surveys were conducted over forests in New York,
Vermont, New Hampshire, and Maine immediately after
the ice storm. Maps produced from the aerial surveys (pages
6 and 7) provided general information on the location,
pattern, and estimated level of the damage. The damage maps
were used to select areas to use for ground damage assessment
surveys. Information was collected from forest plots, using
standard measurements. Damage assessment began in the
spring of 1998 and continued throughout the summer.
Several components were incorporated, including:
■ A regional damage survey
■ Forest Inventory and Analysis sites
■ Forest Health Monitoring sites
■ North American Maple Project sites and additional sugarbush surveys
■ Vermont Hardwood Health Survey sites.
Regional Damage Survey and Forest Inventory and Analysis Sites
The objective of the regional survey was to characterize
the degree of damage to the forest resource by species and
size class within the four-state affected area. The damage
areas were classified as light/moderate, heavy, and severe,
estimated by the amount of tree breakage observed
from the air. Seventeen damage areas were sampled on
the ground in New York, 23 in Vermont, 25 in New
Hampshire, and 46 in Maine. Areas were selected to
represent a range of topographic and forest type
conditions. In Maine, study sites were specifically
selected in proportion to damage class severity.
Depending on the size of the area, between 10 and
15 fixed radius plots, 1⁄24 acre each, were sampled in a
transect across each selected damage area. Due to the
amount of debris on the ground, areas with reasonable
road or trail access were used to facilitate the work of state
and USDA Forest Service ground crews. The plots were
located randomly at least 100 to 200 feet off the access
road or trail, but were not established as permanent sample
sites. The plot size was the same as used in Forest Health
Monitoring (FHM) and recently adopted by Forest
Inventory and Analysis (FIA).
FIA has an extensive network of permanent plots
throughout the United States. The data from these sites
provide periodic information about the forest resource
in individual states. The most recent FIA surveys were
completed in New York in 1993, in Maine in 1995, and in
New Hampshire and Vermont in 1997. Future inventories
will be conducted on an annual basis. To obtain additional
information on the impact from the ice storm, FIA plots
that were within the ice storm damage areas were revisited.
Throughout the area affected by the ice storm, 787 FIA
plots were revisited, including 461 in New York, 118 in
Vermont, 78 in New Hampshire, and 130 in Maine. This
resurvey was carried out by the USDA Forest Service
Northeastern Research Station FIA group and the Maine
Forest Service. The plots in New Hampshire and Vermont
were clusters of four 1⁄24-acre fixed radius plots. In New
York, and Maine the 1⁄5-acre FIA plots were visited. The full
plots were measured in New York, and the inner 1⁄10-acre
portion of the 1⁄5-acre plots were measured in Maine.
All trees greater than 5 inches in diameter within the
plots were tallied. To assess damage to the smaller sapling
size trees, a 6.8-foot radius microplot was nested within the
larger plot. The center of the microplot was offset 12 feet
east of plot center.
Information related to site, tree damage, and fire hazard
was collected within each of the plots, including:
■ sample site –– location, elevation, aspect, and forest type
■ fire hazard –– estimated within a 60-foot radius of plot center, including fuel load (high, medium, low, or none) and fuel type (based on percent of hardwood and softwood slash)
■ tree species
■ diameter breast height (d.b.h.)
■ crown position –– open grown, dominant, codominant, intermediate, or overtopped
■ bent or leaning (greater than 45 degrees, greater than45 degrees with crown touching ground, or uprooted)
■ percent crown damage –– amount of crown broken or removed due to ice damage, in 10 percent classes,from zero with no ice breakage to 100 percent wherethe entire crown was gone (branches that were brokenbut still attached were included; older, previously broken branches or dieback were not)
■ bole condition –– bole broken below the crown or severely split below the crown
■ general tree condition –– previous damage agent (for example, beech bark disease)
■ tree height –– estimate of total height.
7

8
Ice-Damaged Areas in MaineMapped area: 11 million acres
LEGEND
Ice Damage
Heavy Light
Moderate/heavy Trace/light
Moderate None/trace
Light/moderate
Ice-Damaged Areas in New YorkMapped area: 4.6 million acres
LEGEND
Ice Damage
Heavy
Moderate
Light
USD
A Fo
rest
Ser
vice
USD
A Fo
rest
Ser
vice

9
Ice-Damaged Areas in New HampshireMapped area: 1,055,000 acres
LEGEND
Ice Damage
Heavy
Light/moderate
Scattered
Ice-Damaged Areas in VermontMapped area: 951,000 acres
LEGEND
Ice Damage
Heavy
Light/Moderate
USD
A Fo
rest
Ser
vice
USD
A Fo
rest
Ser
vice

Standard FIA and FHM data codes were used to record
the information. All regional survey and FIA data were
analyzed at the USDA Forest Service in Durham, NH.
Initially, the regional survey and FIA remeasurement data
sets for each state were analyzed individually for crown
loss by species and tree size class. This preliminary analysis
revealed only minor differences between the regional
survey and FIA data sets with respect to the amount of
damage and crown damage by species or tree size class.
For the final analysis the two data sets were merged and
treated as one set of samples for each state and for the
entire four-state region. In some cases only the regional
survey data were used because the sampling design allowed
determination of average conditions within a particular stand.
CHARACTERISTICS OF DAMAGE
The interactions of precipitation, temperature, wind,
topography, forest stand structure, and individual tree
architecture combined to produce a complex mosaic of
crown damage and tree injury caused by ice accumulation
during storm. There was an extremely high level of
variability in the impact to forests, both within forest stands
and throughout the region. At the landscape scale, there
were differences in the distribution of ice storm damage to
forests that were influenced by the interplay of meteorolog-
ical conditions and topography across the four states.
The ice storm impacted forests in the northern six
counties of New York in an area that stretches from the
northern Adirondack Mountains to the St. Lawrence River.
Ice accumulation on trees in New York occurred below an
elevation of 1,800 feet. In Vermont the ice storm impacted
forests in the Champlain Valley at elevations below 1,000
feet and throughout the Green Mountains in an elevation
band between 1,800 and 3,200 feet. Ice accumulation in
New Hampshire was restricted to an elevation band
between 1,000 and 2,600 feet, with the damage occurring
in the White Mountains and to the southwest toward the
Mt. Sunapee area. There was a zonal pattern to the ice
storm in Maine, with a band of ice accumulation extending
across the southern third of the state. The elevation
distribution of ice storm damage to trees in Maine was
between 100 and 1,200 feet, with the upper elevation
extending to 2,400 feet in the western part of the state.
Crown DamageA general measure of the damage caused by the ice
storm was determined by calculating the average crown loss
across the four-state affected region and within each of the
states. This average was based on the 10 percent crown loss
classes that were assigned in the field for each tree. The
average crown loss for all trees from all four states was 22
percent. New York had the highest average crown loss at
27 percent, followed by New Hampshire with 24 percent,
Maine with 19 percent, and Vermont with 17 percent.
Overall averages are useful for broad comparisons, but
they do not provide an adequate depiction of the damage
because of the high variability of impacts caused by the ice
storm. The sampling of damage areas identified by aerial
surveys provided information on the range of crown loss
within specific forest stands. The average crown loss for the
damage areas sampled ranged from near zero to 64 percent.
New Hampshire had the damage area with the highest
average crown loss (64 percent), followed by New York (56
percent), Vermont (53 percent), and Maine (46 percent).
In New York and New Hampshire, 60 percent of sampled
areas had greater than 25 percent average crown loss,
1 0
Table 1. Damage categories based on percent crown loss and expected tree impact
Damage category Crown loss (%) Impact on tree survival
No damage 0 None
Light/moderate 1–49 Survival good
Heavy 50–79 Survival likely, growth affected
Severe 80–100 Survival unlikely
Damage on hillside in northern New York
NY
Dep
artm
ent o
f Env
ironm
enta
l Con
serv
atio
n

whereas in Vermont and Maine only 30 percent of the sam-
pled areas had greater than 25 percent average crown loss.
The 10 percent increments of crown loss used in the
field have been grouped into four biologically meaningful
categories (Table 1). Trees in the first category did not
have any ice storm damage. The light/moderate damage
category contains trees that had very little visible ice storm
damage through those that lost 49 percent of their crowns.
Trees in this category are expected to live and resume
normal growth. For trees with crown loss between 30 and
49 percent, there may be a period of reduced growth for a
few years, but the prospect of survival and recovery is high.
The occurrence of other major stressors such as drought or
insect infestation may affect growth and survivability. The
heavy damage category includes trees that lost between 50
and 79 percent of their crowns. Individuals in this category
are susceptible to long-term adverse impacts. Most will
survive, but recovery to normal growth may be significantly
delayed. The high incidence of branch breakage associated
with this category can provide increased opportunity
for infection by organisms that cause discoloration or
decay. The impact of this secondary injury will be more
detrimental to wood quality if large branches were broken
from the main stem. Individual trees in this category may
also become poor competitors for growing space and,
over time, could be overtopped by neighboring trees that
incurred less damage. The severe damage category consists
of trees that lost 80 percent or more of their crowns,
including trees that lost their entire crown. It is highly
unlikely that trees in this category will survive.
Of the 22,268 trees in this study with d.b.h. of 5 inches
or larger, 51 percent did not have branches broken by
the ice storm (Table 2). The portion of the undamaged
trees was 45 percent in New York, 50 percent in New
Hampshire, 54 percent in Maine, and 60 percent in
Vermont. Across the region, 28 percent of the trees in the
areas sampled for the assessment were in the light/moderate
damage category and
should fully recover from
the ice storm. Almost
10 percent of the trees
sampled were in the
heavy damage category.
About 12 percent were
in the severe damage
category and will most
likely die due to ice storm
damage.
In New York about 27
percent of the trees sam-
pled were in the heavy or
severe categories and are in jeopardy of significantly
reduced growth, increased incidence of infection, loss of
wood quality, or death. New Hampshire had about 23 per-
cent of the sampled trees in the heavy or severe categories.
In New York and New Hampshire, more trees were in the
severe damage category, about 16 percent and 14 percent,
respectively, than in the heavy damage category, 11 percent
and 9 percent, respectively. Maine and Vermont had about
17 percent of the trees in the heavy or severe categories.
Although it might be expected that the larger surface
area provided by the foliage of softwoods would allow
higher ice loading than the leafless hardwoods, softwoods
as a group had considerably less damage than hardwoods.
Only 9 percent of the softwoods were in the heavy or
severe damage categories, compared with 26 percent of
the hardwoods (Figure 1). The low level of damage to
1 1
Table 2. Percent of trees sampled with d.b.h. ≥ 5”
in each crown loss category
Crown loss NY VT NH ME Region
No damage 44.7 59.5 49.5 54.2 51.0
Light/moderate 28.4 24.5 27.2 28.8 27.7
Heavy 11.4 7.6 9.3 8.4 9.5
Severe 15.5 8.4 13.5 8.6 11.8Figure 1. Percent of hardwoods and softwoods sampled in each of the four crown loss categories across the icestorm affected area
Sparse foliage within ice
damaged crowns
USD
A Fo
rest
Ser
vice
Regional Crown Loss
Hardwoods Softwoods
None Light/moderate Heavy Severe
80
70
60
50
40
30
20
10
0
Perc
ent

softwoods was consistent for all species that were sampled,
including cedar, white and red pine, hemlock, spruce, fir,
and larch.
Damage to Frequently Occurring SpeciesFigures 2a-d show the number of trees (sample size) and
percent within species in the four crown loss categories for
the most frequently sampled species in New York, Vermont,
New Hampshire, and Maine. Beech, maple, and birch,
which are major components of northern hardwood stands,
were frequently encountered within the ice damaged areas.
Red spruce, white spruce, and balsam fir were combined
into a single group, since results were similar for each of
these species. Species such as big tooth aspen, basswood,
hophornbeam, and silver maple that were not encountered
frequently enough to receive separate listing are included in
the “other” species group.The species in this group varied
among the states.
1 2
Figure 2a. Number and percent of trees within species in each of the four crown loss categories in New York
New York Crown Loss
None Light/moderate Heavy Severe
800
700
600
500
400
300
200
100
0
Num
ber
90
80
70
60
50
40
30
20
10
0
Perc
ent
W. A
sh
A. B
eech
Q. A
spen
R. M
aple
S. M
aple
Y. B
irch
B. C
herry
Oth
er
Spru
ce-F
ir
White P
ine
Ced
ar
Hem
lock
W. A
sh
A. B
eech
Q. A
spen
R. M
aple
S. M
aple
Y. B
irch
B. C
herry
Oth
er
Spru
ce-F
ir
White P
ine
Ced
ar
Hem
lock

NEW YORK –– Black cherry and quaking aspen were
heavily damaged in New York, with about 45 percent of
each species having either heavy or severe damage. Thirty
percent of the black cherry and 23 percent of the quaking
aspen had severe crown damage. About 36 percent of the
red maple and American beech sampled received heavy
or severe damage, with 21 percent of each species in the
severe category. White ash had about 30 percent of the
sampled trees in either the heavy or severe damage
category. Several species in the “other” group had high
levels of damage. American basswood had 58 percent of
the trees sampled in either the heavy or severe damage
categories, with 40 percent in the severe category. Big
tooth aspen had damage similar to quaking aspen, with
43 percent of the trees with either heavy or severe damage.
Northern red oak had 38 percent of the trees sampled
in either the heavy or severe damage categories. Yellow
birch in New York received less damage than in the other
three states.
VERMONT –– Crown damage was fairly uniform for the
major hardwood species in Vermont, with between 16 and
25 percent of sampled trees sustaining heavy or severe
damage. American beech and yellow birch had slightly
more damage than sugar maple and paper birch. American
beech had more individuals in the severe category (13
percent) than in the heavy category (11 percent). Sugar
maple was the most frequently encountered species in
Vermont, making up 28 percent of the trees tallied.
Damage to sugar maple was lighter in Vermont compared
to the level of crown loss recorded for this species in the
1 3
Figure 2b. Number and percent of trees within species in each of the four crown loss categories in Vermont
Vermont Crown Loss
A. Beech P. Birch S. Maple Y. Birch Other Spruce-Fir
None Light/moderate Heavy SevereNone Light/moderate Heavy Severe
A. Beech P. Birch S. Maple Y. Birch Other Spruce-Fir
90
80
70
60
50
40
30
20
10
0
Perc
ent
700
600
500
400
300
200
100
0
Num
ber

other three states. Eighty-four percent of the sugar maple
sampled had no damage or were in the light/moderate
category, and only 7 percent were in the severe category.
NEW HAMPSHIRE –– American beech and sugar maple
incurred the most crown damage in New Hampshire.
American beech had 40 percent of the sampled trees in
the heavy or severe damage categories, with 23 percent in
the severe category. Thirty-four percent of the sugar maple
sustained heavy or severe damage, with 18 percent in
the severe category. Yellow birch sustained slightly more
damage than the statewide average for all species, with 26
percent of the individuals sampled in the heavy or severe
damage categories. There was an even split between the
heavy and severe damage categories for yellow birch.
Among the other species affected, quaking aspen and white
ash experienced higher than average levels of damage, with
38 percent and 28 percent respectively in the heavy and severe
damage categories.
MAINE –– Crown loss in the heavy or severe categories
for the major hardwood species in Maine ranged from 14
1 4
Figure 2c. Number and percent of trees within species in each of the four crown loss categories in New Hampshire
90
80
70
60
50
40
30
20
10
0
Perc
ent
800
700
600
500
400
300
200
100
0
Num
ber
New Hampshire Crown Loss
A. Beech P. Birch R. Maple S. Maple Y. Birch Other Spruce-Fir Hemlock
A. Beech P. Birch R. Maple S. Maple Y. Birch Other Spruce-Fir Hemlock
None Light/moderate Heavy Severe

to 31 percent of the species sampled. American beech and
yellow birch were the species most impacted in Maine,
with about 30 percent of each species in the heavy or
severe categories. Paper birch was the next most damaged
species, with 25 percent of the sampled trees in the heavy
and severe categories. Fifteen percent of the sampled trees
were in the severe category. Paper birch had higher levels
of damage in Maine than in New Hampshire and Vermont.
Red maple and sugar maple had the same level of crown
damage, with 23 percent of the trees sampled in the heavy
or severe categories. Twelve percent of the red maple
were in the severe category, as were 9 percent of the sugar
maple. Two species, white ash and northern red oak,
were less damaged in Maine (19 percent and 14 percent
respectively in the heavy or severe categories) than in
New York (30 percent and 38 percent, respectively).
Damage in Relation to Tree Size The diameter distribution of the trees sampled for this
assessment conformed to the distribution described for
forests in the Northeast –– mostly small diameter trees with
a steep but even decline in the number of trees with larger
1 5
Figure 2d. Number and percent of trees within species in each of the four crown loss categories in Maine
100
90
80
70
60
50
40
30
20
10
0
Perc
ent
900
800
700
600
500
400
300
200
100
0
Num
ber
Maine Crown Loss
W. A
sh
A. B
eech
P. B
irch
R. M
aple
S. M
aple
Y. B
irch
N. R
ed O
ak
Oth
er
Spru
ce-F
ir
White P
ine
Hem
lock
W. A
sh
A. B
eech
P. B
irch
R. M
aple
S. M
aple
Y. B
irch
N. R
ed O
ak
Oth
er
Spru
ce-F
ir
White P
ine
Hem
lock
None Light/moderate Heavy Severe

diameters. Across the four-state affected region, larger trees
were more likely to incur some ice storm damage than
smaller trees, indicated by the decreasing percentage with
no damage as d.b.h increased (Figure 3). There was an
increase in the percentage of trees in the light/moderate
category with increasing d.b.h., and there was a slight
increase in the percentage of trees in the heavy and severe
categories combined with increasing d.b.h., up to 14 inches
d.b.h. For trees larger than 14 inches d.b.h., there was
no relationship between increasing d.b.h. and damage;
however, the number of trees sampled in the larger size
classes is very small. Two factors could explain these trends:
trees in the canopy accumulated more ice and had higher
levels of crown damage than understory trees, or branches
in larger trees were more easily broken by the buildup of
ice. Since there was no relationship between crown posi-
tion and crown damage, the latter factor seems most likely.
For the entire four-state affected region, 79 percent of
the trees sampled had a d.b.h. less than 11 inches and 63
percent had a d.b.h. less than 9 inches. The smallest trees
sampled, with a d.b.h. between 5 and 6.9 inches (6-inch
d.b.h. class), had less crown damage than larger trees. As
previously noted, 51 percent of all the trees sampled in this
study did not have crown damage; however, this number
drops to 39 percent for trees with d.b.h. larger than 10
inches (Table 3). If other types of damage such as severe
bending or uprooting are factored in, then small trees had
similar damage levels to larger trees. In Vermont and New
Hampshire, trees with d.b.h. between 11 and 12.9 inches
(12-inch d.b.h. class) had slightly more crown damage than
either larger or smaller diameter trees. This relationship
was not apparent in the data from Maine and New York.
Bent or Leaning Trees There were several other types of visible tree damage
associated with the ice storm. Some trees were bent over
in a sweeping arch with their crowns touching the ground.
Trees that were still leaning more than 45o several months
after the ice storm are not likely to recover to a typical tree
growth form, although they may survive for many years.
The tension created from bending could result in serious
cracks in the bole, which will disrupt translocation of water
and nutrients, provide infection sites for a wide range of
organisms, and degrade the quality of the wood.
Overall, about 5 percent of the trees sampled were
leaning more than 45o or were uprooted by the weight of
the ice that accumulated in the crown. Smaller diameter
trees were much more likely to be leaning or uprooted than
larger trees. There were
over four times more
leaning trees than uprooted
trees. Of the trees that were
leaning or uprooted, 61
percent were in the 6-inch
d.b.h. class and 24 percent
were in the 8-inch d.b.h.
class. Vermont had the
lowest percentage of
leaning or uprooted trees
(2.6 percent); the other
three states had similar
percentages ranging from 5 to 5.8 percent. Paper birch
and red maple were the species most likely to be leaning,
followed by yellow birch. Paper birch made up 33 percent
of the leaning trees in Maine and 31 percent in Vermont.
Less than 1 percent of the sampled trees showed severe
cracking of the bole due to tension from being bent over.
Damage to Saplings Understory saplings received considerably less crown
damage than overstory trees. Table 4 provides a summary
of damage to saplings. The average crown loss ranged from
5.1 percent in Vermont to 10.7 percent in New Hampshire.
Between 70 and 84 percent of the saplings sampled had no
crown damage. Although damage to saplings was low, when
there was crown damage it tended to be severe instead
of heavy. There were two to three times more trees with
severe crown damage than heavy damage in three of the
four states. Saplings were much more likely to be bent at
greater than 45o than overstory trees, as was evident in
10 to 24 percent of the trees sampled.
Aspect and ElevationThere was a slight tendency for more damage on slopes
that faced south or east. New Hampshire had a stronger
aspect signal than the other states, but the tendencies for
more damage on one aspect were not pronounced. Damage
1 6
Table 3. Comparison of damaged and undamaged
trees by d.b.h. measurement
Damage Trees ≥ 5” d.b.h. Trees ≥ 10” d.b.h.
Number Percent Number Percent
No damage 11,364 51 2,548 39
Damage 10,904 49 3,966 61
Total 22,268 100 6,514 100
Injury caused by branch breakage
USD
A Fo
rest
Ser
vice
type

was slightly greater in certain portions of the elevation
range of ice storm damage in New York, Vermont, and
New Hampshire. Much of the area affected by the ice
storm in Maine and New York had gently rolling terrain
and lower elevations. In New Hampshire and Vermont the
ice storm was widely distributed throughout the mountains.
No elevation trend was detected in Maine. In New York
there was a slightly higher percentage of trees affected
between 300 and 900 feet than at other elevations. In the
Green Mountains of Vermont there was more damage
between 2,100 and 2,700 feet than at other elevations,
and in New Hampshire the zone of higher damage was
between 1,800 and 2,100 feet.
FIRE HAZARD
Fire concerns were raised over the amount of fuel and
the blockage of fire access roads from fallen debris,
including broken branches and whole trees. To address
1 7
Figure 3. Number and percent of trees within each diameter class in each of the four crown loss categories
70
60
50
40
30
20
10
0
Perc
ent
6000
5000
4000
3000
2000
1000
0
Num
ber
None Light/moderate Heavy Severe
Regional Crown Loss by Diameter (d.b.h.) Class
6” 8” 10” 12” 14” 16” 18” 20” 22” ≥24”
6” 8” 10” 12” 14”
d.b.h. class
16” 18” 20” 22” ≥24”

this concern, plots within the regional and FIA surveys
were assessed for potential fire hazard. Fire hazard ratings
were based on a system developed by the New Hampshire
Division of Forests and Lands, but did not take into account
access or proximity to human development. Fuel load and
fuel type were estimated within 60 feet of plot center. Fuel
load is determined by the size, amount, and distribution of
slash. Fuel types are based on the amount of hardwood and
softwood that make up the slash.
About 30 percent of the plots were in the high or
moderate fire hazard category, with mostly hardwood slash
present (Table 5). About 4 percent of the plots were rated
with a high fire hazard. One-quarter of the plots had a
moderate fire hazard, ranging from about 23 percent
of the plots in Vermont to 27 percent in New York.
Approximately half of the plots were rated in the low
fire hazard category, ranging from 40 percent of the plots
in New York to 59 percent in Maine. In Vermont and
New Hampshire about half of the plots had a low fire
hazard. No fire hazard was observed on about one-fifth
of the plots regionwide. About 28 percent of the plots
in New York and 10 percent in Maine had no fire hazard
present. In Vermont and New Hampshire, 26 and 19
percent of the plots, respectively, had no fire hazard.
Fire hazard increased with the amount of crown damage
recorded on the plots (Figure 4). Plots rated as high fire
hazard with more than 50 percent hardwood slash had
an average crown damage ranging from 45 percent in
New Hampshire and Maine to 50 percent in Vermont
and 54 percent in New York. Plots rated as low fire hazard
with more than 50 percent hardwood slash ranged from
about 19 percent average crown damage in Vermont and
Maine to 23 percent in New Hampshire and 32 percent
in New York.
Forest Health Monitoring SitesThe Forest Health Monitoring (FHM) plot network has
been in place in New England since 1990. Information on
tree growth, damage, and crown condition is collected on
all trees at each location. One-quarter of the plots are
visited each year, thus all plots are measured once every
4 years. FHM plots were used in the ice storm damage
assessment to provide a comparison to pre-storm
information. The number of trees that were observed was
small, compared to the regional and FIA surveys, due to
1 8
Table 4. Summary of damage to saplings (<5” d.b.h.) based on temporary plots established for
the regional survey (percent)
Average No Heavy Severe LeaningState crown loss damage damage1 damage2 >45
o
NY 10.4 72.2 2.6 6.5 24.0VT 5.1 82.6 3.3 1.1 10.0NH 10.7 69.5 1.9 5.9 14.0ME 6.7 83.5 2.6 4.2 20.0
1Heavy damage: 50–75% crown loss 2Severe damage: 80–100% crown loss
Table 5. Percent of plots within each fire hazard category based on fuel load1 and fuel type2
State H1 H2 H3 M1 M2 M3 L1 L2 L3 None
NY 3.5 0.6 0.8 21.1 3.5 3.1 29.7 3.7 6.6 27.7
VT 3.1 0.0 0.0 17.9 4.4 0.8 33.1 6.4 7.9 26.4
NH 3.5 1.2 0.5 20.7 2.5 2.2 32.3 8.2 9.7 19.2
ME 3.0 0.6 0.6 15.5 7.5 3.8 37.2 12.7 9.1 10.1
1H (heavy): slash 3–6 inches in diameter, piled over 4 feet uniformly across the groundM (moderate): less than 3-inch diameter slash, with about half of the slash within 2 feet of the groundL (low): lesser amount of smaller size slash that is scattered
21: more than 50 percent hardwood slash2: equal mix of hardwood and softwood slash3: more than 50 percent softwood slash

the limited number of FHM plots throughout the ice storm
impacted area. All measurements were made according
to FHM protocols. Chuck Barnett of the USDA Forest
Service, Northeastern Research Station, provided the FHM
data analysis.
In Vermont, the FHM plots scheduled for measurement
in 1998 were visited. In New Hampshire, all existing FHM
plot locations were visited. In Maine, plots in the footprint
of the ice storm were measured in addition to the plots
scheduled for measurement in 1998. New York was not
scheduled to begin establishing FHM plots until 1999.
However, the FHM plot locations are co-located with the
Forest Inventory and Analysis (FIA) plots that were visited,
and measurements were taken during the FIA visit to deter-
mine the impact of the ice storm on the future sample sites.
RESULTS
Ice damage was noted on 31 percent of all the forested
FHM plots measured in Vermont, New Hampshire, and
Maine, mainly due to the scattered pattern of the ice
damage. This includes 3 of 9 forested plots in Vermont,
8 of 34 forested plots in New Hampshire, and 17 of 48
forested plots in Maine.
The 1998 FHM measurements of about 1,000 trees on
53 of the plots were compared to the 1994 measurements.
One measurement of crown condition –– foliage
transparency –– is defined as the amount of light visible
through the live crown. Ratings are made for each tree as
a percentage of the live crown. Individual trees with higher
transparency ratings have thinner crowns. For some species,
the percentage of trees with high foliage transparency
rose slightly between 1994 and 1998. The percentage of
hardwood trees with more than 30 percent foliage trans-
parency rose from 1.0 percent in 1994 to 2.3 percent in
1998. The percentage of birch trees with more than 30
percent foliage transparency rose from 2.3 percent in 1994
to 5.3 percent in 1998. Given that these trees were in areas
impacted by the ice storm, they may have experienced a
loss of buds or branches, which resulted in thinner crowns.
Figure 4. Average crown loss for each fire hazard category (see Table 5 for definitions)
1 9
Debris from broken tree tops in the White MountainNational Forest
USD
A Fo
rest
Ser
vice
Average Crown Loss by Fire Hazard Category
Fire hazard category
60
50
40
30
20
10
0
Perc
ent
H1 H2 H3 M1 M2 M3 L1 L2 L3 None
New York
Vermont
New Hampshire
Maine
Comparisons were also made using the annual
measurements made on plots from 1995 to 1998. Because
of the rotating, systematic sample, plots measured in these
samples are largely different from one year to the next.
Between 1,700 and 4,000 trees were measured each year
on forested plots from 1995 to 1998. The percentage of
beech trees with more than 30 percent foliage transparency
increased slightly from less than 1 percent in 1995-1997
to 3.5 percent in 1998. Crown condition will continue to
be monitored through the FHM Program.
North American Maple Project SitesNorth American Maple Project (NAMP) sample sites
were visited after the storm to determine damage to
sugarbushes (trees managed for maple syrup production).
NAMP is a United States and Canadian program
implemented in 1988 to assess and monitor the health
of sugar maple. Sample sites were measured in both
sugarbushes and nonsugarbush maple stands. Data was
collected by state and Federal forestry agencies and
analyzed by Pierre DesRochers, Natural Resources
Canada, Canadian Forest Service.
Forty-seven NAMP plot clusters are located in areas
affected by the January 1998 ice storm. The plots are in
Maine, New Hampshire, Vermont, New York, Nova Scotia,
New Brunswick, Ontario, and Quebec. Among these, 38
clusters had visible tree damage. Two sugarbushes and two
nonsugarbush maple stands located in an area that did
not receive any freezing rain were used as controls. In
the impacted stands and the control stands, damage was
assessed for each tree in all five plots per cluster in April
and early May 1998. About 1,800 trees were observed.
Each plot cluster was characterized by management
category (sugarbush or nonsugarbush maple stand),
elevation, basal area, stocking, species diversity, and
amount of freezing rain received. Damage was recorded
for each tree, including fallen, bole broken below the
crown, crown damage, top broken, major branches broken
at the bole, and wounds within or below the crown.
Crown damage was calculated as a percentage of crown
loss by assessing the volume of broken branches hanging
on the tree or fallen beneath the tree canopy. The damage
classes were combined into light and moderate/severe
categories for analysis (Table 6). Crown damage, presence
of broken tops, and presence of major branches broken at
the bole were the most sensitive indicators of damage
caused by the ice storm.
RESULTS
Tree damage was observed on NAMP plots in Vermont,
Maine, and Quebec (Table 7). No visible signs of damage
were recorded in NAMP clusters in New Brunswick, New
Hampshire, New York, or Nova Scotia, since these plots
were not located in ice storm impacted areas. Data from
Ontario was not available.
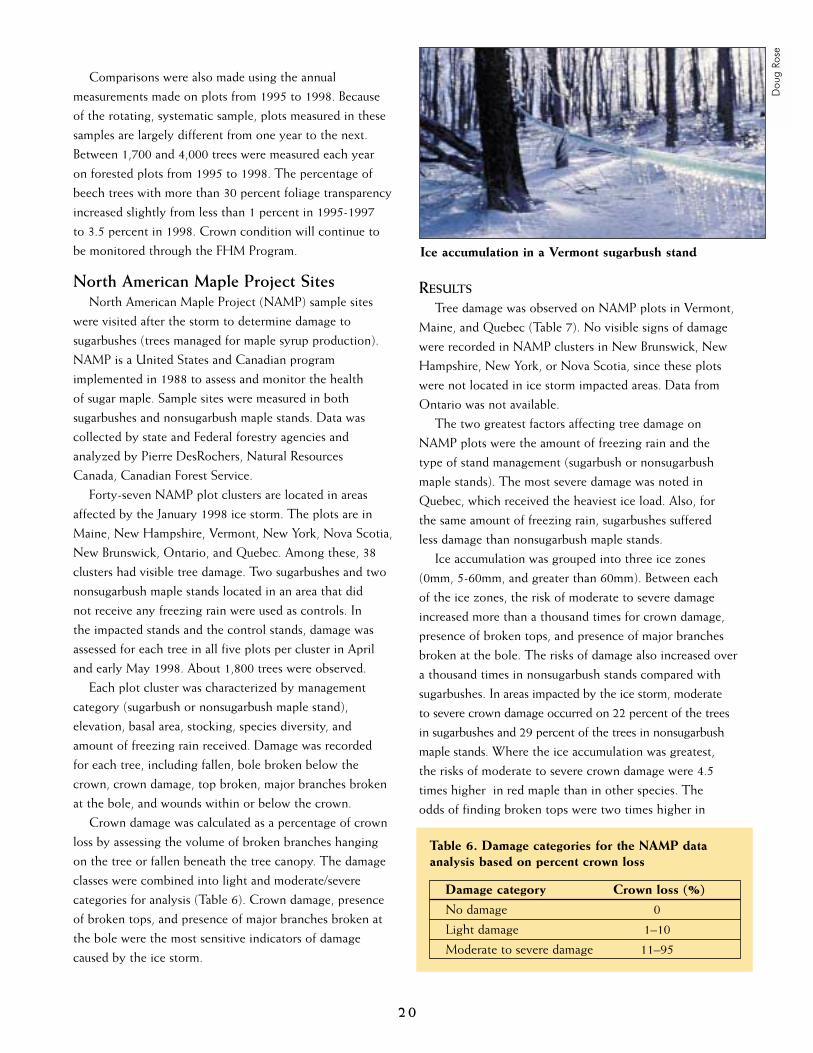
The two greatest factors affecting tree damage on
NAMP plots were the amount of freezing rain and the
type of stand management (sugarbush or nonsugarbush
maple stands). The most severe damage was noted in
Quebec, which received the heaviest ice load. Also, for
the same amount of freezing rain, sugarbushes suffered
less damage than nonsugarbush maple stands.
Ice accumulation was grouped into three ice zones
(0mm, 5-60mm, and greater than 60mm). Between each
of the ice zones, the risk of moderate to severe damage
increased more than a thousand times for crown damage,
presence of broken tops, and presence of major branches
broken at the bole. The risks of damage also increased over
a thousand times in nonsugarbush stands compared with
sugarbushes. In areas impacted by the ice storm, moderate
to severe crown damage occurred on 22 percent of the trees
in sugarbushes and 29 percent of the trees in nonsugarbush
maple stands. Where the ice accumulation was greatest,
the risks of moderate to severe crown damage were 4.5
times higher in red maple than in other species. The
odds of finding broken tops were two times higher in
2 0
Table 6. Damage categories for the NAMP data
analysis based on percent crown loss
Damage category Crown loss (%)
No damage 0
Light damage 1–10
Moderate to severe damage 11–95
Ice accumulation in a Vermont sugarbush stand
Dou
g Ro
se

beech and three times higher in red maple, relative to
other species.
The risk of crown damage, broken tops, and major
broken branches increased with stand elevation, but this
increase was always larger in nonsugarbush maple stands
than in sugarbushes. In sugarbushes, damage decreased
with increasing basal area of sugar maple. Low elevation
sugarbush stands, with larger but fewer sugar maple stems,
were more resilient to the ice storm. In nonsugarbush maple
stands there was increased damage due to the presence
of more smaller diameter trees. These trees, with smaller
crowns, could not withstand ice loads as well and were
more prone to breakage.
Additional Sugarbush Surveys Since many commercial sugarbushes did not fall within
the NAMP plot system, additional sugarbush sites were
measured to better determine the effect of the ice storm on
the maple industry. The additional sugarbush sites were
surveyed in New York, coordinated by Lewis Staats of
Cornell University, and in New Hampshire, by the State
Division of Forests and Lands. Within the additional
sugarbush stands, the plot size, core data elements, and
damage categories were the same as the regional and
FIA surveys to provide consistency with the regional
assessments. Also, NAMP dieback and transparency
measurements were recorded for all trees greater than 5
inches d.b.h. to relate to the NAMP database. Three to
five 24-foot fixed radius plots were established within each
sugarbush, depending on the relative size of the sugarbush.
NEW YORK
Damage to sugarbushes was especially severe in northernNew York, with damage to trees and tubing lines. In two of the six counties, estimates suggested a near total loss of production in 1998. Between 2 and 4 inches of ice accumulated on the maple branches, causing them to collapse. In many sugarbush stands almost all of the trees
lost significant portions of their crowns. The six northerncounties of New York account for 25 percent of the state’smaple syrup producers and 35 percent of the syrup. It isestimated that 380,000 fewer taps were placed in 1998, a direct result of the damage by the ice storm.
In Clinton, Franklin, and St. Lawrence Counties, damagewas observed in over 90 percent of the sugarbushes, withover half of the producers reporting heavy damage, includ-ing significant crown loss, broken main trunks, and uproot-ing. Fallen trees and branches blocked accessibility to thesugarbush and took down tubing lines. Hanging branchescreated a hazardous situation for any landowner attemptingaccess to a sugarbush. Tapping guidelines were formulatedin response to concerns related to tapping damaged trees.
Cornell University researchers surveyed sugarbushes in
northern New York, then conducted an assessment on 12
selected ice storm damaged sugarbushes. Sugarbushes were
selected based on damage level, access, cooperation of
landowners, age, management history, and topography.
Selected sugarbushes needed to have a minimum of 300
taps and to have been in active production prior to the
ice storm. The assessment included five sugarbushes in
Clinton County, five in St. Lawrence County, one in
Essex County, and one in Franklin County. The sample
sites in New York were established as permanent plots for
long-term monitoring.
The average crown damage for sugar maple within
the sampled sugarbushes ranged from 23 to 82 percent
(Figure 5). The overall average crown damage on the
sampled sugar maple in New York was about 49 percent.
On average, about 26 percent of the sugar maple within
the sampled damaged sugarbushes were severely damaged
and most likely will not survive (Table 8). Another 25
percent were heavily damaged. About 44 percent were in
the light/moderate damage category. The survey results
indicated that sugar maples greater than 10 inches d.b.h.
were more heavily damaged than smaller diameter trees.
2 1
Table 7. Number of trees within sugarbush and nonsugarbush maple stands in each crown damage
category in NAMP plot clusters damaged by the ice storm and in control clusters
Management Damage category Maine Quebec Vermont Control Total
Sugarbushes No damage 457 350 52 170 1,039Light 90 60 20 0 160Moderate to severe 66 184 43 0 293Total 603 594 115 170 1,482
Nonsugarbush No damage 560 392 71 157 1,080maple stands Light 77 67 143 0 287
Moderate to severe 106 246 174 1 427Total 743 505 388 158 1,794

Other species, comprising 27 percent of the sampled trees
within the sugarbushes, were also significantly affected.
A higher proportion of these other species were in the
severe damage category than the sugar maple (37 percent
compared to 27 percent).
NEW HAMPSHIRE
Seven damaged sugarbushes which were not part of the
NAMP network of plots were visited in New Hampshire.
Within the selected sugarbushes, the average crown
damage for sugar maple ranged from 11 to 64 percent
(Figure 6). The overall average crown damage was 34
percent for sugar maple and about the same for all species
within the sugarbushes. On average, about 14 percent of
the sugar maple and 16 percent of all other species within
the sugarbushes had severe crown damage and will most
likely die (Table 9). Approximately 18 percent of the sugar
maple had heavy damage and their vigor was greatly
reduced. About 50 percent of the sugar maple sampled
had light/moderate damage.
Vermont Hardwood Health Survey SitesThe Vermont Department of Forests, Parks and
Recreation began the Vermont Hardwood Health Survey
in 1985 to assess the condition of Vermont’s hardwood
forests. This plot system consists of 84 ground plots
distributed throughout the state, which were randomly
selected based on mortality classes from interpretation
of 1985 photography. Each plot consists of five 10-factor
prism points. Ron Kelly, Forest Health Specialist,
coordinated a resurvey of the plots to determine the
impact from the ice storm and provided the data analysis.
All plots that fell within areas aerially mapped as having
been impacted by the ice storm were visited in the spring
of 1998 before the trees leafed out. The number of trees
2 2
Table 8. Crown damage in selected New York sugarbush stands
Crown Sugar maple Other species Total
damage Number Percent Number Percent Number Percent
No damage 8 4.0 4 5.3 12 4.3
Light/moderate 89 44.3 34 44.7 123 44.4
Heavy 51 25.4 10 13.2 61 22.0
Severe 53 26.4 28 36.8 81 29.2
Figure 5. Average crown loss in selected New York sugarbush stands
90
80
70
60
50
40
30
20
10
0
Perc
ent
1 2 3 4 5 6 7 8 9 10 11 12
Average Crown Loss: New York Sugarbush Stands
Sugarbush stand number
All species
Sugar maple

2 3
Table 9. Crown damage in selected New Hampshire sugarbush stands
Crown Sugar maple Other species Total
damage Number Percent Number Percent Number Percent
No damage 42 17.4 34 45.9 76 24.1
Light/moderate 122 50.6 18 24.3 140 44.4
Heavy 43 17.8 10 13.5 53 16.8
Severe 34 14.1 12 16.2 46 14.6
Figure 6. Average crown loss in selected New Hampshire sugarbush stands
that were observed was small, compared to the regional
and FIA surveys, due to the limited number of plots located
in the ice storm impacted area. The ice storm damaged
17 of the plots but some of these had only light damage.
It was decided that those plots that had two or more
dominant/codominant trees with more than 25 percent
crown loss due to the ice storm would be revisited for
summer crown evaluations. Data analysis was done for the
9 plots (containing 437 trees) that exceeded that threshold.
Five of these plots were located in Shelburne and South
Burlington in the Champlain Valley at elevations of 300 to
400 feet. Three were in Jay at elevations above 2,100 feet,
and one was in Roxbury at an elevation of 2,000 feet.
North American Maple Project guidelines were followed
for the early spring ice damage evaluations. Bole breakage
was recorded as none, single bole broken, multiple bole
with at least one unbroken, or multiple bole, all broken.
Crown loss due to breakage was recorded as none, 1-10
percent, 11-25 percent, 26-50 percent, 51-75 percent, or
76-100 percent. Crown dieback and transparency were
recorded to the nearest 5 percent during a follow-up
summer visit, to be consistent with FHM protocols.
RESULTS
The majority of trees in these plots received either light
or no damage –– less than 25 percent crown loss (Figure 7).
Dominant/codominant trees received more crown damage
than trees in other canopy positions, except for trees down
on the ground or with boles broken below the crown (100
percent crown loss). The smaller pole-size trees were the
ones most likely to break due to heavy ice loading. About
15 percent of the dominant/codominant trees had heavy
or severe crown damage with more than 50 percent
crown damage.
About 40 percent of the dominant/codominant black
cherries and hickories had greater than 50 percent crown
loss. One-quarter of the red maple lost more than 75
70
60
50
40
30
20
10
0
Perc
ent
1 2 3 4 5 6 7
Average Crown Loss: New Hampshire Sugarbush Stands
Sugarbush stand number
All species
Sugar maple

percent of their crowns and almost 20 percent of the sugar
maple lost more than half their crowns. About 5 percent
of the sugar maple and aspen were killed by the ice storm.
Beech trees suffered the greatest damage in the survey, with
all trees having lost more than 50 percent of their crowns,
but all of these trees were located in one very heavily
damaged plot. Most of the yellow birch, paper birch, and
oak had less than 25 percent crown damage. Less than
3 percent of the pine had any significant ice damage.
Average dieback and transparency increased dramatically
in these ice damaged plots compared to when evaluations
were last conducted in 1996 (Figure 8). Many of the
heavily damaged trees were observed to have poor foliage
production along many of the remaining branches, as well
as smaller than normal leaf size. These trees will continue
to be monitored to determine whether they survive.
REMOTE SENSING ACTIVITES
RELATED TO THE ICE STORM
The ice storm provided some unique opportunities for
incorporating remote sensing technology to evaluate the
damage caused by this event. Aerial photography, satellite
imagery, and digital camera imagery were used by the
USDA Forest Service and state forestry agencies to collect
information about the location, severity, and pattern of
the damage.
Aerial PhotographyThe State of Maine acquired photography covering
more than 2.8 million acres affected by the ice storm.
The photography is being used to define the extent,
pattern, and severity of the damage caused by the ice
storm. This aerial photography is also being made available
to county extension groups who, in turn, make prints
available to individual landowners in order to help them
make land management decisions.
Aerial photography was collected over the Long Trail
on the Green Mountain National Forest by the USDA
Forest Service to evaluate the damage caused to the trail
and huts by the ice storm. Aerial photography was also
acquired also over selected sites covering 88,000 acres
in Maine, New Hampshire, Vermont, and New York.
This photography was used to evaluate the accuracy of the
aerial sketch mapping that was conducted soon after the
ice storm to determine the extent of the damage.
New Hampshire is planning to acquire aerial
photography over the entire state. This photography
will be made available for making better management
decisions related to ice storm damage and other activities.
Satellite ImagerySatellite imagery from the Landsat and Spot satellite
programs, both before and after the ice storm occurred, has
been acquired by the states and the USDA Forest Service.
The imagery will be used in a change detection analysis
project to evaluate the use of this scale and resolution of
imagery for detecting and mapping ice storm damage.
Color Infrared Digital CameraImages from this camera system are being evaluated by
the USDA Forest Service for its ability to detect and map
ice storm damage as well as damage caused by other
natural disasters.
Figure 7. Average crown loss in dominant/codominanttrees in Vermont Hardwood Health Survey plots
Figure 8. Average crown dieback and transparency fordominant/codominant trees before (1996) and after(1998) the ice storm
2 4
Crown loss
160
140
120
100
80
60
40
20
0
Tre
es
per
acre
40
35
30
25
20
15
10
5
0
Perc
ent
None 1-25% 26-50% 51-75% 75-99% 100%
1996
Year
1998
8
17
38
32
All other canopy positions
Dominant/codominant
Dieback
Transparency

MONITORING EFFECTS
OF THE ICE STORM
What will be the long-term impact from the ice storm
on the trees, forest stands, wildlife, and landowners of
northern New England? Will the ice storm change the way
we manage forests? The Federal Emergency Appropriation
for ice storm recovery includes funds for studying the
storm’s long-term effects. The following section describes
research projects that have been initiated or proposed in
each of the affected states and the project contact.
New YorkForest Plant Communities –– Quantifying the
nature of losses in various stands to assist managers in
planning responses for future events. Relating post-damage
condition and future growth of surviving trees to their
pre-ice storm canopy position and extent of crown break-
age. Documenting size, species, and conditions of trees lost
to ice loading and describing structural changes in forest
plant community and effect on plant and animal habitat.
(D. Leopold, SUNY Environmental Science and Forestry, Syracuse, NY)
Forest Health –– Continuing random sampling of ice
damage to assess impact to forested areas. Establishing plots
to determine the relative damage within tree species and
across forest types. Also assessing the proportion of man-
aged forest and how management affected impacts and
recovery from the ice storm. Determining the relationship
of previous disease-induced defects to ice storm damage
and the long-term impact of ice damage on future forest
health. (Paul Manion, SUNY Environmental Science and Forestry,
Syracuse, NY)
Wildlife Communities –– Focusing on faunal diversity
response to disturbance and potential forest management
alternatives, and the interaction of deer and regenerating
plant communities. Examining species abundance, richness,
and diversity of breeding birds, amphibians, land snails,
ground beetles, and burying beetles; how forest floor
complexity affects amphibian communities; and how
management practices affect songbird and beetle
communities. Assessing how deer browsing affects overall
stand composition and relative abundance of various tree
species in ice damaged stands. Also examining if deer affect
regeneration differently in highly disturbed areas compared
to undisturbed areas and if deer browsing intensity can be
predicted by local landscape characteristics, such as the
scalfe of the disturbance and distance to agricultural areas.
(J. Gibbs, SUNY Environmental Science and Forestry, Syracuse, NY)
Forest Insects –– Evaluating the economic impact of
various bark beetles and wood borers on commercially
valuable northern hardwood and white pine in heavily
damaged stands. Assessing damage by sugar maple borer,
peach bark beetle, and ambrosia in hardwood stands
and the impact on white pine by ambrosia beetles, red
turpentine beetle, and sawyer beetles. Assessing impact
from these secondary insects on sawtimber-quality wood
2 to 4 years after ice storm injury. Investigating secondary
insect diversity, abundance, and temporal patterns in
damaged and undamaged stands. (Doug Allen and Stephen Teale,
SUNY Environmental Science and Forestry, Syracuse, NY)
Economic Impact Analysis –– Determining the
financial impacts of the ice storm on forest resources, with
emphasis on short- and long-term impacts on timber and
forest-related recreation. Incorporating data on the quantity
and extent of timber loss volume and the extent and future
development over the next 10 to 20 years of accelerated
volume and grade loss due to ice storm damage. A schedule
of expected product and grade recovery will be developed,
along with an estimate of losses due to inability to recover
material. Regional estimates will be determined regarding
number of recreationists affected and financial losses.
(J. Wagner, SUNY Environmental Science and Forestry, Syracuse, NY)
Social and Policy Issues –– Assessing various public
policy questions associated with natural catastrophic events,
including threat of increased fuel load to landowners,
fire dangers, funding mechanisms for rural fire districts,
and regulations related to sanitation and salvage. Also
evaluating public assistance to private landowners to assess
damage, private-public partnerships for better management,
and response of communities to loss of street trees.
(D. Floyd, SUNY Environmental Science and Forestry, Syracuse, NY)
Evaluation of Stewardship Incentive Program(SIP) –– Evaluating the delivery of technical assistance
to landowners affected by the ice storm. Assessing the
awareness and understanding of landowners, state forestry
agency staff, and consulting foresters regarding how to
apply for SIP funds. Evaluating the ease of the application
process and the communication between the various
agencies and landowners. (Tommy Brown, Cornell University,
Ithaca, NY)
2 5

Educational Efforts –– Assessing educational efforts
and needs of private woodland owners, maple producers,
and tree care professionals. This project will characterize
the degree to which educational materials and programs
have assisted landowners, and if any additional educational
assistance is needed. (Tommy Brown, Cornell University, Ithaca, NY)
Aquatic Habitats –– Assessing the immediate and
long-term impacts on streamsides and aquatic habitats.
Investigating the immediate impacts of the ice storm on
riparian zone trees and assessing the resulting effects on
the fish and invertebrate communities and on physical
processes in associated streams. The second component
will consist of a long-term monitoring program of the
recovery of the streamside and stream habitats. (Rebecca
Schneider and Cliff Kraft, Cornell University, Ithaca, NY)
Sugarbushes –– Evaluating the recovery of sugarbushes
in northern New York. Examining growth rates, stocking
levels, tree vigor and quality, changes in successional pat-
terns and invasion of species, rate of compartmentalization
of taphole wounds, and increased susceptibility to insects
and disease. Establishing permanent plots in impacted
stands that were active in sap production prior to the ice
storm, to be remeasured over a 4-year period. (Lewis Staats,
Marianne Krasny, and Peter Smallidge, Cornell University, Ithaca, NY)
Urban Trees –– Initially re-examining trees damaged
in the Rochester, NY, 1991 ice storm to supply background
for a sound urban canopy monitoring project in the
northern portion of the state. Eventually, a parallel study
of the rural forest recovery project that has already been
initiated will be implemented. Determining the long-term
effects of urban ice storm damage, evaluating the
consequences of leaving trees with 50 to 70 percent
crown damage, and planning to provide better guidelines
for tree managers. (Jerry Bond, Cornell University, Ithaca, NY)
Remote Sensing –– Utilizing satellite imagery to
precisely locate and describe the degree of forest cover
damage resulting from the ice storm. Current forest damage
data was collected via aerial sketch-mapping with addition-
al processing. This information is of a small scale and tends
to generalize damage intensity, as it ignores small intensely
impacted or protected components of forest stands. It is
hypothesized that greater detail of damage intensity and
smaller, more specific locations of isolated forest cover
impact may be determined through use of modern satellite
technology. (Kurt Swartz, NY Department of Environmental Conservation,
and William Elberty, St. Lawrence University, Plattsburg, NY)
VermontImpact on Butternut –– Evaluating butternut trees
in the Champlain Basin of northwestern Vermont to
determine the overall extent and impact of ice damage.
Evaluating the extent and impact of ice damage on other
tree species growing in association with butternut. (Dale R.
Bergdahl, Department of Forestry, University of Vermont, Burlington, VT)
Bird Populations –– Assessing changes in breeding
bird populations in ice damaged forests. Investigating the
effect of the ice storm on the relative abundance, diversity,
and composition of forest breeding bird populations in
Vermont. (Steve Faccio, Staff Biologist, Vermont Institute of Natural
Science, Woodstock, VT)
Growth and Survival of Sugar Maple –– Examining
the relationships among crown damage, root and stem
carbohydrate storage, and subsequent growth and survival
in sugar maple trees in stands in Vermont. (Timothy Perkins and
Betty Wong, Proctor Maple Research Center, University of Vermont, and
USDA Forest Service, Northeastern Research Station, Burlington, VT)
Crown Canopy Changes –– Following the recovery
or decline of tree crowns in ice damaged stands compared
to nearby nondamaged stands using image analysis as a
means to monitor changes over time in canopy cover,
leaf area, and standard crown health ratings. (Ronald Kelley,
Department of Forests, Parks and Recreation, Stowe, VT)
Remote Sensing –– Assessing ice-affected foliage
using remotely sensed infrared imagery to detect ongoing
stressed vegetation. Attempting to provide additional
information on the location and extent of forest damage
based on visible imagery analysis. (Lesley-Ann Dupigny-Giroux,
University of Vermont, Geography Department, Burlington, VT)
Changes in Forest Stands –– Monitoring changes
in growth, composition, and health throughout the forest
vegetation structure in a severely ice damaged stand and
a comparable undamaged site on state-owned land in
Vermont. (Jay Lackey, Vermont Department of Forests, Parks and
Recreation, Barre, VT, and Florence Peterson, USDA Forest Service,
Northeastern Area, Durham, NH)
Ecological Effects –– Monitoring long-term ecological
effects on vegetation using monitoring plots at Shaw
Mountain preserve. (Ana Ruesink, Vermont Nature Conservancy,
Montpelier, VT)
2 6

2 7
New Hampshire Land Cover Type Mapping –– Developing a digital
mapped data layer to support identification and assessment
of areas damaged during the ice storm. Cooperative effort
will rely on remotely sensed data (Landsat Thematic
Mapper imagery) and imaging radar data (Radarsat, ERS-1,
ERS-2) to characterize landscape patches. The project will
incorporate a pre-event vegetation type map of susceptible
areas above a specific elevation and post-event imagery to
provide data on specific locations of damage. The overlay
will provide an assessment of damage areas by location and
vegetation type, and provide baseline information to man-
agers to assist in monitoring long-term impacts. (Barry Rock,
Complex Systems Research Center, University of New Hampshire, Durham, NH)
Natural Heritage Assessment and Management ––
Assessing the condition of rare plant populations and
natural communities influenced by the ice storm. Planning
to identify appropriate management actions to ensure their
survival. Currently 281 occurrences on non-Federal lands
in New Hampshire. Planning reconnaissance on the ground
in ice storm damaged areas to assess condition, habitat,
and management options. Will coordinate with the White
Mountain National Forest on USDA Forest Service lands.
(NH Division of Forests and Lands, Concord, NH)
Wildlife Habitat –– Working within ice storm
damaged areas to develop long-term plans for ice damage
recovery, forest stewardship, and wildlife habitat
conservation. Collaborating with NH Fish and Game
Department, Regional Planning Commissions, and
Conservation Commissions. (Extension Wildlife Specialist,
Cooperative Extension, University of New Hampshire, Durham, NH)
Amphibian Populations –– Researching amphibian
responses to changes in forest structure associated with ice
storm damage. Studying changes in amphibian populations,
which can potentially have a significant impact on the
forest food web. Provides a model for examining the effects
of natural disaster events. (Kimberly Babbitt, University of
New Hampshire, Durham, NH)
MaineTree Damage –– Investigating long-term damage from
ice storm injury, related to stocking and stand condition,
and post-ice storm harvest impacts. Looking at various
stand conditions: precondition (undamaged) stands,
damaged stands, and post-harvest stands. Planning training
sessions to share management recommendations based
on research. (Bill Ostrofsky, University of Maine, Orono, ME)
Secondary Insect Impacts –– Conducting general
surveys for various insect pests such as callous borers, sugar
maple borers, bronze birch borer, and ambrosia beetles.
Planning to compare previous years’ insect populations
with future population development. Have already
observed significant increases in beetle populations in
affected red pine plantations. Will also be looking at
potential buildup of larch beetle populations. (Dick Dearborn,
Maine Forest Service, Entomology Lab, Augusta, ME)
Aerial Photography –– Planning to compare current
true color (1:9,000 scale) photography to aerial photos
obtained 5 and 10 years after the ice storm to determine
change in stand condition. The information on the photos
will be augmented by information from permanent plots
within the photographed area, including Forest Health
Monitoring, Forest Inventory and Analysis, Beech Survey,
and Birch Survey plots. (Dave Struble, State Entomologist, Maine
Forest Service, Augusta, ME)
USDA Forest ServiceResponse of Forests –– Monitoring the response of
the entire plant community, including herbaceous and
understory woody species dynamics, to openings created
by the ice storm. Assessing the fate of injured trees. Using
detailed, permanent vegetation study sites to be located
throughout Vermont, New Hampshire, and Maine.
(Christopher Eagar, USDA Forest Service, Northeastern Research Station,
Durham, NH)
Tree Damage –– Examining the damage to northern
hardwoods caused by ice storm injury. Determining the
effect of crown loss due to ice injury on stemwood forma-
tion 5 years after injury and the effect of wood exposure on
wood quality. Assessing the types of wood stains and rots
that develop after injury. Creating a library of digital
images to produce photo guides and educational materials.
Study trees located in Maine, New Hampshire, and
Vermont. (Water Shortle and Kevin Smith, USDA Forest Service,
Northeastern Research Station, Durham, NH)
Stress Detection –– Assessing short- and long-term ice
damage through detection of stress in foliage using bio-
chemical markers. Selecting trees in various damage cate-
gories to collect samples of visually healthy leaves and
establish the relationship between the stress marker,
putrescine, and tree recovery. (Rakesh Minocha, USDA Forest
Service, Northeastern Research Station, Durham, NH)

2 8
2 9
APPENDIX
Management Recommendations for Landowners
Fact sheets were produced shortly after the ice storm to provide information
on tree damage and response, including crown loss, effects on hardwood
quality, approaches to stand management and inventory, harvesting damaged
timber, and impacts on wildlife. The fact sheets are available on the
USDA Forest Service ice storm web site (see contact page).
Two have been included in this publication:
Will Winter Storm Injury Affect Hardwood Quality and Maple Sap Production?
and
Silvicultural Approaches for Managing Ice-Damaged Stands.

3 0

3 1
For more information, contact:USDA Forest ServicePO Box 640Durham, NH 03833Or visit our website:www.fs.fed.us/na/durham

3 2

3 3
For more information, contact:Neil Lamson or William LeakUSDA Forest ServicePO Box 640Durham, NH 03833Or visit our website:www.fs.fed.us/na/durham

3 4
CONTACTS & WEB SITES
■ NEW YORK
James BeilIce Storm Recovery CoordinatorNY Dept. of Environmental Conservation50 Wolf RoadAlbany, NY 12233-4250Phone: 518-457-2475Fax: 518-457-5438E-mail: [email protected]: www.dec.state.ny.us/website/dlf/
privland/forprot/icestorm/index.html
■ VERMONT
Neil LamsonIce Storm Recovery CoordinatorVermont Dept. of Forests, Parks and Recreation103 South Main Street – 10 SouthWaterbury, VT 05671Phone: 802-241-3678Fax: 802-244-1481E-mail: [email protected]: www.state.vt.us/anr/fpr/index.htm
■ USDA FOREST SERVICE
Margaret Miller-WeeksIce Storm Damage Assessment CoordinatorNortheastern Area, State and Private ForestryUSDA Forest ServicePO Box 640Durham, NH 03824Phone: 603-868-7712Fax: 603-868-1066E-mail: mweeks/[email protected]: www.fs.fed.us/na/durham/ice/index.htm
Chris EagarResearch EcologistNortheastern Research StationUSDA Forest ServicePO Box 640Durham, NH 03824Phone: 603-868-7636Fax: 603-868-7604E-mail: ceagar/[email protected]
■ NEW HAMPSHIRE
J.B. CullenIce Storm Recovery CoordinatorNew Hampshire Division of Forests and LandsPO Box 1856Concord, NH 03302-1856Phone: 603-271-3457Fax: 603-271-2629E-mail: [email protected]: ceinfo.unh.edu/ice98.htm
■ MAINE
Dave StrubleIce Storm Technical ContactMaine Forest ServiceState House Station #22Augusta, ME 04333Phone: 207-287-2791Fax: 207-287-8422E-mail: [email protected]: www.state.me.us/doc/mfs/icefrnt.htm


STATE FORESTERS
■ Philip Bryce
DirectorDivision of Forests and LandsNH Dept. of Resources and
Economic DevelopmentPO Box 1856Concord, NH 03302-1856Phone: 603-271-2214Fax: 603-271-2629E-mail: [email protected]
■ Tom Doak
State ForesterMaine Forest ServiceMaine Dept. of ConservationState House Station #22Augusta, ME 04333Phone: 207-287-2791 Fax: 207-287-8422 E-mail: [email protected]
■ Frank Dunstan
Director, Division of Lands & ForestsNY Dept. of Environmental Conservation 50 Wolf Road, Room 410CAlbany, NY 12233-4250Phone: 518-457-2475 Fax: 518-457-5438 E-mail: [email protected]
■ David Stevens
State ForesterVT Dept. of Forests, Parks and Recreation103 South Main Street – 10 SouthWaterbury, VT 05671-0601Phone: 802-241-3678 Fax: 802-244-1481 E-mail: [email protected]
USDA FOREST SERVICE,
STATE & PRIVATE FORESTRY
■ Gail Michaels
Planning & Information CoordinatorUSDA Forest Service, State & Private Forestry271 Mast RoadPO Box 640Durham, NH 03824Phone: 603-868-7694 Fax: 603-868-1066 E-mail: gmichael/[email protected]
NEFA EXECUTIVE DIRECTOR
■ Charles A. Levesque
Executive DirectorNEFAPO Box 2911Concord, NH 03302-2911Phone: 603-229-4965 Fax: 603-226-0499 E-mail: [email protected]
NEFA’S MISSION. To encourage sound decisions about the management and use
of forest resources in the NEFA region by identifying significant regional trends, broadening
awareness of forest health and sustainability issues, providing a regional context for state and
local decisions about forest resources, and analyzing the environmental, social, and economic
impacts of forest land use. NEFA seeks to accomplish this mission through the development
of high quality information about the region’s forests and acting as a forum for presentation
and discussion of these issues.
This document is also available online at nefa.conknet.com and www.fs.fed.us/na/durham/ice/index.htm.
Front, back & inside cover photos: Tom Thomson