t h e a l l s tat e c o r po r at i o n f o r m 1 0 -q s e
TRANSCRIPT

UNITED STATESSECURITIES AND EXCHANGE COMMISSION
Washington, D.C. 20549FORM 10-Q
☒ QUARTERLY REPORT PURSUANT TO SECTION 13 OR 15(d) OF THE SECURITIES EXCHANGE ACT OF 1934
For the quarterly period ended September 30, 2019OR
☐ TRANSITION REPORT PURSUANT TO SECTION 13 OR 15(d) OF THE SECURITIES EXCHANGE ACT OF 1934For the transition period from ______ to ______
Commission file number 1-11840
THE ALLSTATE CORPORATION(Exact name of registrant as specified in its charter)
Delaware
36-3871531
(State or other jurisdiction of incorporation or organization)
(I.R.S. Employer Identification No.)
2775 Sanders Road, Northbrook, Illinois 60062
(Address of principal executive offices) (Zip Code)Registrant’s telephone number, including area code: (847) 402-5000
Securities registered pursuant to Section 12(b) of the Act:
Title of each classTrading
SymbolsName of each exchange
on which registered
Common Stock, par value $.01 per share ALL New York Stock ExchangeChicago Stock Exchange
5.100% Fixed-to-Floating Rate Subordinated Debentures due 2053 ALL.PR.B New York Stock ExchangeDepositary Shares represent 1/1,000th of a share of 5.625% Noncumulative Preferred Stock, Series A ALL PR A New York Stock ExchangeDepositary Shares represent 1/1,000th of a share of 5.625% Noncumulative Preferred Stock, Series G ALL PR G New York Stock ExchangeDepositary Shares represent 1/1,000th of a share of 5.100% Noncumulative Preferred Stock, Series H ALL PR H New York Stock Exchange
Indicate by check mark whether the registrant (1) has filed all reports required to be filed by Section 13 or 15(d) of the Securities Exchange Act of 1934 during the preceding12 months (or for such shorter period that the registrant was required to file such reports), and (2) has been subject to such filing requirements for the past 90 days. Yes ☒No ☐
Indicate by check mark whether the registrant has submitted electronically every Interactive Data File required to be submitted pursuant to Rule 405 of Regulation S-T(§232.405 of this chapter) during the preceding 12 months (or for such shorter period that the registrant was required to submit such files). Yes ☒No ☐
Indicate by check mark whether the registrant is a large accelerated filer, an accelerated filer, a non-accelerated filer, a smaller reporting company, or an emerging growthcompany. See the definitions of “large accelerated filer,” “accelerated filer,” “smaller reporting company” and “emerging growth company” in Rule 12b-2 of the Exchange Act.
Large accelerated filer ☒ Accelerated filer ☐
Non-accelerated filer ☐ Smaller reporting company ☐
Emerging growth company ☐
If an emerging growth company, indicate by check mark if the registrant has elected not to use the extended transition period for complying with any new or revised financialaccounting standards provided pursuant to Section 13(a) of the Exchange Act. ☐
Indicate by check mark whether the registrant is a shell company (as defined in Rule 12b-2 of the Exchange Act). Yes ☐ No ☒As of October 14, 2019, the registrant had 323,956,116 common shares, $.01 par value, outstanding.

The Allstate CorporationIndex to Quarterly Report on Form 10-Q
September 30, 2019
Part I Financial Information Page Item 1. Financial Statements
Condensed Consolidated Statements of Operations for the Three Month and Nine Month Periods Ended September 30, 2019 and 2018(unaudited) 1
Condensed Consolidated Statements of Comprehensive Income for the Three Month and Nine Month Periods Ended September 30, 2019and 2018 (unaudited) 2
Condensed Consolidated Statements of Financial Position as of September 30, 2019 and December 31, 2018 (unaudited) 3
Condensed Consolidated Statements of Shareholders’ Equity for the Three Month and Nine Month Periods Ended September 30, 2019and 2018 (unaudited) 4
Condensed Consolidated Statements of Cash Flows for the Nine Month Periods Ended September 30, 2019 and 2018 (unaudited) 5 Notes to Condensed Consolidated Financial Statements (unaudited) 6 Report of Independent Registered Public Accounting Firm 52 Item 2. Management’s Discussion and Analysis of Financial Condition and Results of Operations Highlights 53 Property-Liability Operations 58
Allstate Protection 61– Allstate brand 68– Esurance brand 73– Encompass brand 77
Discontinued Lines and Coverages 81Service Businesses 83Allstate Life 85Allstate Benefits 89Allstate Annuities 91
Investments 95 Capital Resources and Liquidity 102 Recent Developments 105 Forward-Looking Statements 106Item 4. Controls and Procedures 106 Part II Other InformationItem 1. Legal Proceedings 107Item 1A. Risk Factors 107Item 2. Unregistered Sales of Equity Securities and Use of Proceeds 107Item 6. Exhibits 108

Condensed Consolidated Financial Statements
Part I. Financial InformationItem 1. Financial Statements
The Allstate Corporation and SubsidiariesCondensed Consolidated Statements of Operations (unaudited)
($ in millions, except per share data)
Three months ended
September 30, Nine months ended
September 30,
2019 2018 2019 2018
Revenues
Property and casualty insurance premiums $ 9,094 $ 8,595 $ 26,882 $ 25,341
Life premiums and contract charges 625 612 1,874 1,840
Other revenue 273 238 794 682
Net investment income 880 844 2,470 2,454
Realized capital gains and losses:
Total other-than-temporary impairment (“OTTI”) losses (16) (4) (44) (8)
OTTI losses reclassified to (from) other comprehensive income ("OCI") 2 (1) 1 (2)
Net OTTI losses recognized in earnings (14) (5) (43) (10)
Sales and valuation changes on equity investments and derivatives 211 181 1,226 27
Total realized capital gains and losses 197 176 1,183 17
Total revenues 11,069 10,465 33,203 30,334
Costs and expenses
Property and casualty insurance claims and claims expense 6,051 5,805 18,227 16,711
Life contract benefits 513 498 1,521 1,485
Interest credited to contractholder funds 169 163 487 489
Amortization of deferred policy acquisition costs 1,425 1,317 4,151 3,886
Operating costs and expenses 1,414 1,425 4,174 4,086
Pension and other postretirement remeasurement gains and losses 225 (39) 365 (32)
Restructuring and related charges — 13 27 55
Amortization of purchased intangibles 32 24 96 69
Impairment of purchased intangibles — — 55 —
Interest expense 80 82 245 251
Total costs and expenses 9,909 9,288 29,348 27,000
Gain on disposition of operations — 1 3 4
Income from operations before income tax expense 1,160 1,178 3,858 3,338
Income tax expense 229 199 784 636
Net income 931 979 3,074 2,702
Preferred stock dividends 42 37 103 105
Net income applicable to common shareholders $ 889 $ 942 $ 2,971 $ 2,597
Earnings per common share
Net income applicable to common shareholders per common share - Basic $ 2.71 $ 2.72 $ 8.98 $ 7.43
Weighted average common shares - Basic 327.7 346.0 330.8 349.7
Net income applicable to common shareholders per common share - Diluted $ 2.67 $ 2.68 $ 8.85 $ 7.31
Weighted average common shares - Diluted 333.0 351.7 335.7 355.4
See notes to condensed consolidated financial statements.
Third Quarter 2019 Form 10-Q 1

Condensed Consolidated Financial Statements
The Allstate Corporation and SubsidiariesCondensed Consolidated Statements of Comprehensive Income (unaudited)
($ in millions)
Three months ended September
30, Nine months ended September
30,
2019 2018 2019 2018
Net income $ 931 $ 979 $ 3,074 $ 2,702
Other comprehensive income (loss), after-tax
Changes in:
Unrealized net capital gains and losses 369 (70) 2,025 (768)
Unrealized foreign currency translation adjustments (10) (14) (1) (22)
Unamortized pension and other postretirement prior service credit (12) (15) (35) (45)
Other comprehensive income (loss), after-tax 347 (99) 1,989 (835)
Comprehensive income $ 1,278 $ 880 $ 5,063 $ 1,867
See notes to condensed consolidated financial statements.
2 www.allstate.com

Condensed Consolidated Financial Statements
The Allstate Corporation and SubsidiariesCondensed Consolidated Statements of Financial Position (unaudited)
($ in millions, except par value data) September 30, 2019 December 31, 2018
Assets Investments
Fixed income securities, at fair value (amortized cost $56,263 and $57,134) $ 59,259 $ 57,170
Equity securities, at fair value (cost $6,930 and $4,489) 8,206 5,036
Mortgage loans 4,694 4,670
Limited partnership interests 7,990 7,505
Short-term, at fair value (amortized cost $5,254 and $3,027) 5,254 3,027
Other 3,904 3,852
Total investments 89,307 81,260
Cash 587 499
Premium installment receivables, net 6,558 6,154
Deferred policy acquisition costs 4,683 4,784
Reinsurance and indemnification recoverables, net 9,363 9,565
Accrued investment income 613 600
Property and equipment, net 1,092 1,045
Goodwill 2,545 2,530
Other assets 3,383 3,007
Separate Accounts 2,942 2,805
Total assets $ 121,073 $ 112,249
Liabilities
Reserve for property and casualty insurance claims and claims expense $ 28,076 $ 27,423
Reserve for life-contingent contract benefits 12,378 12,208
Contractholder funds 17,804 18,371
Unearned premiums 15,343 14,510
Claim payments outstanding 952 1,007
Deferred income taxes 1,079 425
Other liabilities and accrued expenses 9,729 7,737
Long-term debt 6,630 6,451
Separate Accounts 2,942 2,805
Total liabilities 94,933 90,937
Commitments and Contingent Liabilities (Note 12) Shareholders’ equity
Preferred stock and additional capital paid-in, $1 par value, 25 million shares authorized, 125.8 thousand and 79.8 thousandshares issued and outstanding, $3,145 and $1,995 aggregate liquidation preference 3,052 1,930
Common stock, $.01 par value, 2.0 billion shares authorized and 900 million issued, 325 million and 332 million sharesoutstanding 9 9
Additional capital paid-in 3,511 3,310
Retained income 46,527 44,033
Deferred Employee Stock Ownership Plan (“ESOP”) expense (3) (3)
Treasury stock, at cost (575 million and 568 million shares) (29,063) (28,085)
Accumulated other comprehensive income:
Unrealized net capital gains and losses:
Unrealized net capital gains and losses on fixed income securities with OTTI 82 75
Other unrealized net capital gains and losses 2,276 (51)
Unrealized adjustment to DAC, DSI and insurance reserves (335) (26)
Total unrealized net capital gains and losses 2,023 (2)
Unrealized foreign currency translation adjustments (50) (49)
Unamortized pension and other postretirement prior service credit 134 169
Total accumulated other comprehensive income (“AOCI”) 2,107 118
Total shareholders’ equity 26,140 21,312
Total liabilities and shareholders’ equity $ 121,073 $ 112,249
See notes to condensed consolidated financial statements.
Third Quarter 2019 Form 10-Q 3

Condensed Consolidated Financial Statements
The Allstate Corporate and SubsidiariesCondensed Consolidated Statements of Shareholders’ Equity (unaudited)
($ in millions, except per share data)
Three months ended
September 30, Nine months ended
September 30,
2019 2018 2019 2018
Preferred stock par value $ — $ — $ — $ —
Preferred stock additional capital paid-in
Balance, beginning of period 1,930 2,303 1,930 1,746
Preferred stock issuance, net of issuance costs 1,122 — 1,122 557
Balance, end of period 3,052 2,303 3,052 2,303
Common stock par value 9 9 9 9
Common stock additional capital paid-in
Balance, beginning of period 3,477 3,391 3,310 3,313
Forward contract on accelerated share repurchase agreement — — 150 45
Activity under equity incentive plans 34 50 51 83
Balance, end of period 3,511 3,441 3,511 3,441
Retained income
Balance, beginning of period 45,803 43,997 44,033 41,579
Cumulative effect of change in accounting principle — — 21 1,088
Net income 931 979 3,074 2,702
Dividends on common stock (declared per share of $0.50, $0.46, $1.50 and $1.38) (165) (163) (498) (488)
Dividends on preferred stock (42) (37) (103) (105)
Balance, end of period 46,527 44,776 46,527 44,776
Deferred ESOP expense (3) (3) (3) (3)
Treasury stock
Balance, beginning of period (28,500) (26,818) (28,085) (25,982)
Shares acquired (609) (225) (1,107) (1,117)
Shares reissued under equity incentive plans, net 46 32 129 88
Balance, end of period (29,063) (27,011) (29,063) (27,011)
Accumulated other comprehensive income
Balance, beginning of period 1,760 243 118 1,889
Cumulative effect of change in accounting principle — — — (910)
Change in unrealized net capital gains and losses 369 (70) 2,025 (768)
Change in unrealized foreign currency translation adjustments (10) (14) (1) (22)
Change in unamortized pension and other postretirement prior service credit (12) (15) (35) (45)
Balance, end of period 2,107 144 2,107 144
Total shareholders’ equity $ 26,140 $ 23,659 $ 26,140 $ 23,659
See notes to condensed consolidated financial statements.
4 www.allstate.com

Condensed Consolidated Financial Statements
The Allstate Corporation and SubsidiariesCondensed Consolidated Statements of Cash Flows (unaudited)
($ in millions)
Nine months ended September
30,
2019 2018
Cash flows from operating activities Net income $ 3,074 $ 2,702
Adjustments to reconcile net income to net cash provided by operating activities:
Depreciation, amortization and other non-cash items 476 376
Realized capital gains and losses (1,183) (17)
Pension and other postretirement remeasurement gains and losses 365 (32)
Gain on disposition of operations (3) (4)
Interest credited to contractholder funds 487 489
Impairment of purchased intangibles 55 —
Changes in:
Policy benefits and other insurance reserves 29 90
Unearned premiums 813 785
Deferred policy acquisition costs (66) (203)
Premium installment receivables, net (392) (422)
Reinsurance recoverables, net 167 (103)
Income taxes 254 (178)
Other operating assets and liabilities (181) 335
Net cash provided by operating activities 3,895 3,818
Cash flows from investing activities
Proceeds from sales
Fixed income securities 23,075 26,223
Equity securities 3,735 4,637
Limited partnership interests 557 490
Other investments 279 234
Investment collections
Fixed income securities 1,847 2,388
Mortgage loans 451 378
Other investments 203 370
Investment purchases
Fixed income securities (23,536) (29,049)
Equity securities (6,080) (4,791)
Limited partnership interests (989) (1,317)
Mortgage loans (475) (435)
Other investments (548) (686)
Change in short-term investments, net (1,509) (665)
Change in other investments, net 66 (28)
Purchases of property and equipment, net (293) (195)
Acquisition of operations (18) (10)
Net cash used in investing activities (3,235) (2,456)
Cash flows from financing activities
Proceeds from issuance of long-term debt 491 498
Redemption and repayment of long-term debt (317) (401)
Proceeds from issuance of preferred stock 1,122 557
Contractholder fund deposits 751 756
Contractholder fund withdrawals (1,278) (1,474)
Dividends paid on common stock (490) (455)
Dividends paid on preferred stock (92) (97)
Treasury stock purchases (936) (1,062)
Shares reissued under equity incentive plans, net 98 66
Other 79 93
Net cash used in financing activities (572) (1,519)
Net increase (decrease) in cash 88 (157)
Cash at beginning of period 499 617
Cash at end of period $ 587 $ 460

See notes to condensed consolidated financial statements.
Third Quarter 2019 Form 10-Q 5

Notes to Condensed Consolidated Financial Statements
The Allstate Corporation and SubsidiariesNotes to Condensed Consolidated Financial Statements
(Unaudited)
Note 1 GeneralBasis of presentation
The accompanying condensed consolidated financial statementsinclude the accounts of The Allstate Corporation (the “Corporation”) and itswholly owned subsidiaries, primarily Allstate Insurance Company (“AIC”), aproperty and casualty insurance company with various property andcasualty and life and investment subsidiaries, including Allstate LifeInsurance Company (“ALIC”) (collectively referred to as the “Company” or“Allstate”). These condensed consolidated financial statements have beenprepared in conformity with accounting principles generally accepted in theUnited States of America (“GAAP”).
The condensed consolidated financial statements and notes as ofSeptember 30, 2019 and for the three and nine month periods endedSeptember 30, 2019 and 2018 are unaudited. The condensed consolidatedfinancial statements reflect all adjustments (consisting only of normalrecurring accruals) which are, in the opinion of management, necessary forthe fair presentation of the financial position, results of operations and cashflows for the interim periods.
These condensed consolidated financial statements and notes shouldbe read in conjunction with the consolidated financial statements and notesthereto included in the Company’s annual report on Form 10-K for the yearended December 31, 2018, filed February 15, 2019, and the Company’sCurrent Report on Form 8-K filed on May 16, 2019, Exhibit 99.1, reflectingthe Company’s 2018 Form 10-K with adjustments to Part II. Item 6., Item 7.and Item 8. for the Company’s change in accounting principle for pensionand other postretirement benefit plans. The results of operations for theinterim periods should not be considered indicative of results to be expectedfor the full year. All significant intercompany accounts and transactions havebeen eliminated.
Impairment of purchased intangibles
During the second quarter of 2019, the Company made the decision tophase-out the use of the SquareTrade trade name in the United States andsell consumer protection plans under the Allstate Protection Plans’ name.The SquareTrade trade name will continue to be used outside of the UnitedStates. The change in the second quarter of 2019 required an impairmentevaluation of the indefinite-lived intangible asset recognized in the ServiceBusinesses segment for SquareTrade’s trade name that was recorded whenSquareTrade was acquired in 2017.
As a result, the Company recognized an impairment of $55 million pre-tax during the second quarter of 2019.
Adopted accounting standards
Accounting for Leases Effective January 1, 2019 the Company adoptednew Financial Accounting Standards Board (“FASB”) guidance related toaccounting for leases. Upon adoption of the guidance under the optionaltransition method that allows application of the transition provisions at theadoption date instead of the earliest period presented, the Companyrecorded a $585 million lease liability equal to the present value of leasepayments and a $488 million right-of-use (“ROU”) asset, which is thecorresponding lease liability adjusted for qualifying accrued lease payments.The lease liability and ROU asset were reported as part of other liabilitiesand other assets on the Condensed Consolidated Statements of FinancialPosition. The impact of these changes at adoption had no impact on netincome or shareholders’ equity. Prior periods were not restated under thenew standard. The Company utilized practical expedients which do notrequire reassessment of existing contracts for the existence of a lease orreassessment of existing lease classifications.
Upon adoption, the new guidance required sellers in a sale-leasebacktransaction to recognize the entire gain from the sale of an underlying assetat the time the sale is recognized rather than over the leaseback term. Thecarrying value of unrecognized gains on sale-leaseback transactionsexecuted prior to January 1, 2019 was $21 million, after-tax, and wasrecorded as an increase to retained income at the date of adoption.
Accounting for Hedging Activities Effective January 1, 2019 theCompany adopted new FASB guidance intended to better align hedgeaccounting with an organization’s risk management activities. The newguidance expands hedge accounting to nonfinancial and financial riskcomponents and revises the measurement methodologies. Separatepresentation of hedge ineffectiveness is eliminated with the intention toprovide greater transparency to the full impact of hedging by requiringpresentation of the results of the hedged item and hedging instrument in asingle financial statement line item. In addition, the amendments weredesigned to reduce complexity by simplifying hedge effectiveness testing.The adoption had no impact on the Company’s results of operations orfinancial position.
6 www.allstate.com

Notes to Condensed Consolidated Financial Statements
Changes to significant accounting policies
Leases The Company has certain operating leases for office facilities,computer and office equipment, and vehicles. The Company’s leases haveremaining lease terms of 1 year to 10 years, some of which include optionsto extend the leases for up to 20 years, and some of which include optionsto terminate the leases within 60 days.
The Company determines if an arrangement is a lease at inception.Leases with an initial term less than one year are not recorded on thebalance sheet and the lease costs for these leases are recorded as anexpense on a straight-line basis over the lease term. Operating leases withterms greater than one year result in a lease liability recorded in otherliabilities with a corresponding ROU asset recorded in other assets. As ofSeptember 30, 2019, the Company had $542 million in lease liabilities and$443 million in ROU assets.
Operating lease liabilities are recognized at the commencement datebased on the present value of future minimum lease payments over thelease term. ROU assets are recognized based on the corresponding leaseliabilities adjusted for qualifying initial direct costs, prepaid or accrued leasepayments and unamortized lease incentives. As most of the Company’sleases do not disclose the implicit interest rate, the Company usescollateralized incremental borrowing rates based on information available atlease commencement when determining the present value of future leasepayments. The Company has lease agreements with lease and non-leasecomponents, which are generally accounted for as a single lease. Leaseterms may include options to extend or terminate the lease which areincorporated into the Company’s measurements when it is reasonablycertain that the Company will exercise the option.
Operating lease costs are recognized on a straight-line basis over thelease term and include interest expense on the lease liability andamortization of the ROU asset. Variable lease costs are expensed asincurred and include maintenance costs and real estate taxes. Lease costsare reported in operating costs and expenses and totaled $45 million and$128 million, including $7 million and $22 million of variable lease costs forthe three and nine months ended September 30, 2019, respectively.
Other information related to operating leases
As of September 30, 2019
Weighted average remaining leaseterm (years) 6
Weighted average discount rate 3.32%
Maturity of lease liabilities
($ in millions) Operating leases
2019 (1) $ 12
2020 141
2021 111
2022 91
2023 76
2024 59
Thereafter 108
Total lease payments $ 598
Less: interest (56)
Present value of lease liabilities $ 542
(1) Excludes maturity of lease liabilities for the nine months ended September 30,2019.
Pending accounting standards
Measurement of Credit Losses on Financial Instruments
In June 2016, the FASB issued guidance which revises the credit lossrecognition criteria for certain financial assets measured at amortized cost,including reinsurance recoverables. The new guidance replaces the existingincurred loss recognition model with an expected loss recognition model.The objective of the expected credit loss model is for a reporting entity torecognize its estimate of expected credit losses for affected financial assetsin a valuation allowance that when deducted from the amortized cost basisof the related financial assets results in a net carrying value at the amountexpected to be collected. The reporting entity must consider all relevantinformation available when estimating expected credit losses, includingdetails about past events, current conditions, and reasonable andsupportable forecasts over the life of an asset. Financial assets may beevaluated individually or on a pooled basis when they share similar riskcharacteristics. The measurement of credit losses for available-for-sale debtsecurities measured at fair value is not affected except that credit lossesrecognized are limited to the amount by which fair value is below amortizedcost and the carrying value adjustment is recognized through a valuationallowance which may change over time but once recorded cannotsubsequently be reduced to an amount below zero. The guidance iseffective for reporting periods beginning after December 15, 2019, and formost affected instruments must be adopted using a modified retrospectiveapproach, with a cumulative effect adjustment recorded to beginningretained income.
The Company’s implementation activities, which remain in process,include review and validation of models, methodologies, data inputs andassumptions to be used to estimate expected credit losses. Theimplementation impacts relate primarily to the Company’s commercialmortgage loans, bank loans and reinsurance recoverables and will dependon economic conditions and judgments at the date of adoption as well asthe size and composition of the loan portfolios and reinsurance balances.Based on
Third Quarter 2019 Form 10-Q 7

Notes to Condensed Consolidated Financial Statements
current economic conditions and the balances at the reporting date, theCompany anticipates application of the current expected credit lossrequirements will result in total valuation allowances for credit losses ofbetween $260 million and $330 million, pre-tax, as of the date of adoption.After consideration of existing valuation allowances maintained prior toadopting the new guidance, the Company would anticipate recognizing acumulative effect decrease in retained income of between $75 million and$125 million, after-tax, to adjust existing valuation allowances to the basis inthe new requirements.
Changes to the Disclosure Requirements for Defined Benefit Plans
In August 2018, the FASB issued amendments to modify certaindisclosure requirements for defined benefit plans. Disclosure additionsrelate to the weighted-average interest crediting rates for cash balanceplans and other plans with interest crediting rates and explanations forsignificant gains and losses related to changes in the benefit obligationduring the reporting period. Disclosures to be removed include those thatidentify amounts that are expected to be reclassified out of AOCI and intothe income statement in the coming year and the anticipated impact of aone-percentage point change in assumed health care cost trend rate onservice and interest cost and on the accumulated benefit obligation. Theamendments are effective for annual reporting periods beginning afterDecember 15, 2020. The impacts of adoption are to the Company’sdisclosures only.
Accounting for Long-Duration Insurance Contracts
In August 2018, the FASB issued guidance revising the accounting forcertain long-duration insurance contracts. The new guidance introducesmaterial changes to the measurement of the Company’s reserves fortraditional life, life-contingent immediate annuities and certain voluntaryaccident and health insurance products.
Under the new guidance, measurement assumptions, including thosefor mortality, morbidity and policy terminations, will be required to bereviewed and updated at least annually. The effect of updatingmeasurement assumptions other than the discount rate are required to bemeasured on a retrospective basis and reported in net income. In addition,reserves under the new guidance are required to be discounted using anupper-medium grade fixed income instrument yield required to be updatedthrough OCI at each reporting date. Current GAAP requires reserves toutilize assumptions set at policy issuance unless updated currentassumptions indicate that recorded reserves are deficient.
The new guidance also requires deferred policy acquisition costs(“DAC”) and other capitalized balances currently amortized in proportion topremiums or gross profits to be amortized on a constant level basis over theexpected term for all long-duration insurance contracts. DAC will not besubject to loss recognition testing but will be reduced when actual lapseexperience exceeds expected experience. The new guidance will no longerrequire
adjustments to DAC and deferred sales inducement costs (“DSI”) related tounrealized gains and losses on investment securities supporting the relatedbusiness.
All market risk benefit product features will be measured at fair valuewith changes in fair value recorded in net income with the exception ofchanges in the fair value attributable to changes in the reporting entity’s owncredit risk, which are required to be recognized in OCI. Substantially all ofthe Company’s market risk benefits are reinsured and therefore theseimpacts are not expected to be material to the Company.
The new guidance is expected to be included in the comparablefinancial statements issued in reporting periods beginning after December15, 2021, thereby requiring restatement of prior periods presented. Earlyadoption is permitted. The new guidance will be applied to affectedcontracts and DAC on the basis of existing carrying amounts at the earliestperiod presented or retrospectively using actual historical experience as ofcontract inception. The new guidance for market risk benefits is required tobe adopted retrospectively. In October 2019, the FASB affirmed its decisionto delay the effective date of the new guidance by one year to reportingperiods beginning after December 15, 2021.
The Company is evaluating the anticipated impacts of applying the newguidance to both retained income and AOCI. The requirements of the newguidance represent a material change from existing GAAP, however, theunderlying economics of the business and related cash flows areunchanged. The Company is evaluating the specific impacts of adopting thenew guidance and anticipates the financial statement impact of adopting thenew guidance to be material, largely attributed to the impact of transitioningto a discount rate based on an upper-medium grade fixed incomeinvestment yield and updates to mortality assumptions. The Companyexpects the most significant impacts will occur in the run-off annuitysegment. The revised accounting for DAC will be applied prospectivelyusing the new model and any DAC effects existing in AOCI as a result ofapplying existing GAAP at the date of adoption will be reversed.
Change in accounting principle
The Company changed its accounting principle for recognizing actuarialgains and losses and expected return on plan assets for its pension andother postretirement plans to a more preferable policy under U.S. GAAP.Under the new principle, remeasurement of projected benefit obligation andplan assets are immediately recognized in earnings and are referred to aspension and other postretirement remeasurement gains and losses on theCondensed Consolidated Statements of Operations. Previously, actuarialgains and losses and differences between the expected and actual returnson plan assets were recognized as a component of AOCI and were subjectto amortization into earnings in future periods. This change has beenapplied on a retrospective basis. The Company’s policy
8 www.allstate.com

Notes to Condensed Consolidated Financial Statements
is to remeasure its pension and postretirement plans on a quarterly basis.
Differences between expected and actual returns and changes inassumptions affect our pension and other postretirement obligations, planassets and expenses. The primary factors contributing to pension and otherpostretirement remeasurement gains and losses are 1) changes in thediscount rate used to value pension and postretirement obligations as of themeasurement date, 2) differences between the expected and the actualreturn on plan assets, 3) changes in demographic assumptions, includingmortality, and 4) participant experience different from demographicassumptions.
The Company also changed its policy for recognizing expected returnson plan assets by eliminating the permitted accounting practice allowing thefive-year smoothing of equity returns and moving to an unadjusted fair valuemethod.
The Company believes that immediately recognizing remeasurement ofprojected benefit
obligation and plan assets in earnings is preferable as it provides greatertransparency of the Company’s economic obligations in accounting resultsand better aligns with fair value accounting principles by recognizing theeffects of economic and interest rate changes on pension and otherpostretirement plan assets and liabilities in the year in which the gains andlosses are incurred. These changes have been applied on a retrospectivebasis and as of January 1, 2018 resulted in a cumulative effect decrease toretained income of $1.58 billion, with a corresponding offset to AOCI andhad no impact on total shareholders’ equity.
Pension and other postretirement service cost, interest cost, expectedreturn on plan assets and amortization of prior service credits are allocatedto the Company’s reportable segments. The pension and otherpostretirement remeasurement gains and losses are now reported in theCorporate and Other segment.
The impacts of the adjustments on the financial statements aresummarized in the following tables.
Condensed Consolidated Statements of Operations (unaudited)
Previousaccountingprinciple
Impact of change(1) As reported
($ in millions, except per share data) Three months ended September 30, 2019
Property and casualty insurance claims and claims expense $ 6,080 $ (29) $ 6,051
Operating costs and expenses 1,433 (19) 1,414
Pension and other postretirement remeasurement gains and losses — 225 225
Restructuring and related charges — — —
Total costs and expenses 9,732 177 9,909
Income from operations before income tax expense 1,337 (177) 1,160
Income tax expense 266 (37) 229
Net income 1,071 (140) 931
Net income applicable to common shareholders $ 1,029 $ (140) $ 889
Earnings per common share: Net income applicable to common shareholders per common share - Basic $ 3.14 $ (0.43) $ 2.71
Net income applicable to common shareholders per common share - Diluted $ 3.09 $ (0.42) $ 2.67
Nine months ended September 30, 2019
Property and casualty insurance claims and claims expense $ 18,285 $ (58) $ 18,227
Operating costs and expenses 4,222 (48) 4,174
Pension and other postretirement remeasurement gains and losses — 365 365
Restructuring and related charges 27 — 27
Total costs and expenses 29,089 259 29,348
Income from operations before income tax expense 4,117 (259) 3,858
Income tax expense 839 (55) 784
Net income 3,278 (204) 3,074
Net income applicable to common shareholders $ 3,175 $ (204) $ 2,971
Earnings per common share: Net income applicable to common shareholders per common share - Basic $ 9.60 $ (0.62) $ 8.98
Net income applicable to common shareholders per common share - Diluted $ 9.46 $ (0.61) $ 8.85
(1) The Company merged two of its pension plans, which had no impact on our financial statements as we remeasure pension plan assets and projected benefit obligationsimmediately in earnings on a quarterly basis. However, the plan merger increased the impact of change by $12 million and $18 million for the third quarter and first ninemonths of 2019, respectively, reflecting the shorter amortization period for losses deferred in AOCI from one of the merged plans that was required as part of the merger.
Third Quarter 2019 Form 10-Q 9

Notes to Condensed Consolidated Financial Statements
Condensed Consolidated Statements of Operations (unaudited)
Previouslyreported Impact of change As adjusted
($ in millions, except per share data) Three months ended September 30, 2018
Property and casualty insurance claims and claims expense $ 5,817 $ (12) $ 5,805
Operating costs and expenses 1,510 (85) 1,425
Pension and other postretirement remeasurement gains and losses — (39) (39)
Restructuring and related charges 16 (3) 13
Total costs and expenses 9,427 (139) 9,288
Income from operations before income tax expense 1,039 139 1,178
Income tax expense 169 30 199
Net income 870 109 979
Net income applicable to common shareholders $ 833 $ 109 $ 942
Earnings per common share: Net income applicable to common shareholders per common share - Basic $ 2.41 $ 0.31 $ 2.72
Net income applicable to common shareholders per common share - Diluted $ 2.37 $ 0.31 $ 2.68
Nine months ended September 30, 2018
Property and casualty insurance claims and claims expense $ 16,758 $ (47) $ 16,711
Operating costs and expenses 4,227 (141) 4,086
Pension and other postretirement remeasurement gains and losses — (32) (32)
Restructuring and related charges 65 (10) 55
Total costs and expenses 27,230 (230) 27,000
Income from operations before income tax expense 3,108 230 3,338
Income tax expense 587 49 636
Net income 2,521 181 2,702
Net income applicable to common shareholders $ 2,416 $ 181 $ 2,597
Earnings per common share: Net income applicable to common shareholders per common share - Basic $ 6.91 $ 0.52 $ 7.43
Net income applicable to common shareholders per common share - Diluted $ 6.80 $ 0.51 $ 7.31
Condensed Consolidated Statements of Comprehensive Income (unaudited)
Previousaccountingprinciple Impact of change As reported
($ in millions) Three months ended September 30, 2019
Net income $ 1,071 $ (140) $ 931
Other comprehensive income (loss), after-tax Changes in:
Unrealized net capital gains and losses 369 — 369
Unrealized foreign currency translation adjustments (12) 2 (10)
Unrecognized pension and other postretirement benefit cost (1) 20 (32) (12)
Other comprehensive income, after-tax 377 (30) 347
Comprehensive income $ 1,448 $ (170) $ 1,278
Nine months ended September 30, 2019
Net income $ 3,278 $ (204) $ 3,074
Other comprehensive income (loss), after-tax Changes in:
Unrealized net capital gains and losses 2,025 — 2,025
Unrealized foreign currency translation adjustments 2 (3) (1)
Unrecognized pension and other postretirement benefit cost (1) 155 (190) (35)
Other comprehensive income, after-tax 2,182 (193) 1,989
Comprehensive income $ 5,460 $ (397) $ 5,063
(1) Financial statement line item has been updated to “Unamortized pension and other postretirement prior service credit”.
10 www.allstate.com

Notes to Condensed Consolidated Financial Statements
Condensed Consolidated Statements of Comprehensive Income (unaudited)
Previouslyreported Impact of change As adjusted
($ in millions) Three months ended September 30, 2018
Net income $ 870 $ 109 $ 979
Other comprehensive income (loss), after-tax Changes in:
Unrealized net capital gains and losses (70) — (70)
Unrealized foreign currency translation adjustments (14) — (14)
Unrecognized pension and other postretirement benefit cost 68 (83) (15)
Other comprehensive loss, after-tax (16) (83) (99)
Comprehensive income $ 854 $ 26 $ 880
Nine months ended September 30, 2018
Net income $ 2,521 $ 181 $ 2,702
Other comprehensive income (loss), after-tax Changes in:
Unrealized net capital gains and losses (768) — (768)
Unrealized foreign currency translation adjustments (25) 3 (22)
Unrecognized pension and other postretirement benefit cost 113 (158) (45)
Other comprehensive loss, after-tax (680) (155) (835)
Comprehensive income $ 1,841 $ 26 $ 1,867
Condensed Consolidated Statements of Financial Position (unaudited)
Previousaccountingprinciple Impact of change As reported
($ in millions) September 30, 2019
Deferred income taxes $ 1,185 $ (106) $ 1,079
Other liabilities and accrued expenses 9,226 503 9,729
Total liabilities 94,536 397 94,933
Retained income 48,406 (1,879) 46,527
Unrealized foreign currency translation adjustments (62) 12 (50)
Unrecognized pension and other postretirement benefit cost (1,336) 1,470 134
Total AOCI 625 1,482 2,107
Total shareholders’ equity $ 26,537 $ (397) $ 26,140
Previouslyreported Impact of change As adjusted
($ in millions) December 31, 2018
Retained income $ 45,708 $ (1,675) $ 44,033
Unrealized foreign currency translation adjustments (64) 15 (49)
Unrecognized pension and other postretirement benefit cost (1,491) 1,660 169
Total AOCI $ (1,557) $ 1,675 $ 118
Third Quarter 2019 Form 10-Q 11

Notes to Condensed Consolidated Financial Statements
Condensed Consolidated Statements of Shareholders’ Equity (unaudited)
Previousaccountingprinciple Impact of change As reported
($ in millions) Three months ended September 30, 2019
Retained income Balance, beginning of period $ 47,542 $ (1,739) $ 45,803
Cumulative effect of change in accounting principle — — —
Net income 1,071 (140) 931
Dividends on common stock (165) — (165)
Dividends on preferred stock (42) — (42)
Balance, end of period 48,406 (1,879) 46,527
Accumulated other comprehensive income (loss) Balance, beginning of period 248 1,512 1,760
Cumulative effect of change in accounting principle — — —
Change in unrealized net capital gains and losses 369 — 369
Change in unrealized foreign currency translation adjustments (12) 2 (10)
Change in unrecognized pension and other postretirement benefit cost (1) 20 (32) (12)
Balance, end of period 625 1,482 2,107
Total shareholders’ equity $ 26,537 $ (397) $ 26,140
Nine months ended September 30, 2019
Retained income Balance, beginning of period $ 45,708 $ (1,675) $ 44,033
Cumulative effect of change in accounting principle 21 — 21
Net income 3,278 (204) 3,074
Dividends on common stock (498) — (498)
Dividends on preferred stock (103) — (103)
Balance, end of period 48,406 (1,879) 46,527
Accumulated other comprehensive income (loss) Balance, beginning of period (1,557) 1,675 118
Cumulative effect of change in accounting principle — — —
Change in unrealized net capital gains and losses 2,025 — 2,025
Change in unrealized foreign currency translation adjustments 2 (3) (1)
Change in unrecognized pension and other postretirement benefit cost (1) 155 (190) (35)
Balance, end of period 625 1,482 2,107
Total shareholders’ equity $ 26,537 $ (397) $ 26,140
(1) Financial statement line item has been updated to “Change in unamortized pension and other postretirement prior service credit”.
12 www.allstate.com

Notes to Condensed Consolidated Financial Statements
Condensed Consolidated Statements of Shareholders’ Equity (unaudited)
Previouslyreported Impact of change As adjusted
($ in millions) Three months ended September 30, 2018
Retained income Balance, beginning of period $ 45,508 $ (1,511) $ 43,997
Cumulative effect of change in accounting principle — — —
Net income 870 109 979
Dividends on common stock (163) — (163)
Dividends on preferred stock (37) — (37)
Balance, end of period 46,178 (1,402) 44,776
Accumulated other comprehensive income (loss) Balance, beginning of period (1,268) 1,511 243
Cumulative effect of change in accounting principle — — —
Change in unrealized net capital gains and losses (70) — (70)
Change in unrealized foreign currency translation adjustments (14) — (14)
Change in unrecognized pension and other postretirement benefit cost 68 (83) (15)
Balance, end of period (1,284) 1,428 144
Total shareholders’ equity $ 23,633 $ 26 $ 23,659
Nine months ended September 30, 2018
Retained income Balance, beginning of period $ 43,162 $ (1,583) $ 41,579
Cumulative effect of change in accounting principle 1,088 — 1,088
Net income 2,521 181 2,702
Dividends on common stock (488) — (488)
Dividends on preferred stock (105) — (105)
Balance, end of period 46,178 (1,402) 44,776
Accumulated other comprehensive income (loss) Balance, beginning of period 306 1,583 1,889
Cumulative effect of change in accounting principle (910) — (910)
Change in unrealized net capital gains and losses (768) — (768)
Change in unrealized foreign currency translation adjustments (25) 3 (22)
Change in unrecognized pension and other postretirement benefit cost 113 (158) (45)
Balance, end of period (1,284) 1,428 144
Total shareholders’ equity $ 23,633 $ 26 $ 23,659
Third Quarter 2019 Form 10-Q 13

Notes to Condensed Consolidated Financial Statements
Condensed Consolidated Statements of Cash Flows (unaudited)
Previousaccountingprinciple Impact of change As reported
($ in millions) Nine months ended September 30, 2019
Cash flows from operating activities Net income $ 3,278 $ (204) $ 3,074
Adjustments to reconcile net income to net cash provided by operating activities: Pension and other postretirement remeasurement gains and losses — 365 365
Income taxes 309 (55) 254
Other operating assets and liabilities (75) (106) (181)
Net cash provided by operating activities $ 3,895 $ — $ 3,895
Previouslyreported Impact of change As adjusted
($ in millions) Nine months ended September 30, 2018
Cash flows from operating activities Net income $ 2,521 $ 181 $ 2,702
Adjustments to reconcile net income to net cash provided by operating activities: Pension and other postretirement remeasurement gains and losses — (32) (32)
Income taxes (227) 49 (178)
Other operating assets and liabilities 533 (198) 335
Net cash provided by operating activities $ 3,818 $ — $ 3,818
14 www.allstate.com

Notes to Condensed Consolidated Financial Statements
Note 2 Earnings per Common ShareBasic earnings per common share is computed using the weighted
average number of common shares outstanding, including vested unissuedparticipating restricted stock units. Diluted earnings per common share iscomputed using the weighted average number of common and dilutivepotential common shares outstanding.
For the Company, dilutive potential common shares consist ofoutstanding stock options and
unvested non-participating restricted stock units and contingently issuableperformance stock awards. The effect of dilutive potential common sharesdoes not include the effect of options with an anti-dilutive effect on earningsper common share because their exercise prices exceed the averagemarket price of Allstate common shares during the period or for which theunrecognized compensation cost would have an anti-dilutive effect.
Computation of basic and diluted earnings per common share
(In millions, except per share data)
Three months ended
September 30, Nine months ended
September 30,
2019 2018 2019 2018
Numerator:
Net income $ 931 $ 979 $ 3,074 $ 2,702
Less: Preferred stock dividends 42 37 103 105
Net income applicable to common shareholders $ 889 $ 942 $ 2,971 $ 2,597
Denominator:
Weighted average common shares outstanding 327.7 346.0 330.8 349.7
Effect of dilutive potential common shares:
Stock options 3.4 3.8 3.2 3.8
Restricted stock units (non-participating) and performance stock awards 1.9 1.9 1.7 1.9
Weighted average common and dilutive potential common shares outstanding 333.0 351.7 335.7 355.4
Earnings per common share - Basic $ 2.71 $ 2.72 $ 8.98 $ 7.43
Earnings per common share - Diluted $ 2.67 $ 2.68 $ 8.85 $ 7.31
Anti-dilutive options excluded from diluted earnings per common share 1.8 2.3 3.7 1.9
Note 3 AcquisitionsiCracked On February 12, 2019, the Company acquired iCracked Inc.
(“iCracked”) which offers on-site, on-demand repair services forsmartphones and tablets in North America, supporting Allstate ProtectionPlans' (formerly known as SquareTrade) operations. In conjunction with theiCracked acquisition, the Company recorded goodwill of $17 million.
PlumChoice On November 30, 2018, the Company acquiredPlumChoice, Inc. (“PlumChoice”) for $30 million in cash to provide technicalsupport services to Allstate Protection Plans' customers and smallbusinesses. In conjunction with the PlumChoice acquisition, the Companyrecorded goodwill of $23 million.
Allstate Identity Protection On October 5, 2018, the Company acquiredInfoArmor, Inc. (“InfoArmor”), a leading provider of identity protection in theemployee benefits market, for $525 million in cash. InfoArmor primarilyoffers identity protection to employees and their family members throughvoluntary benefit programs at over 1,400 firms, including more than 100 ofthe Fortune 500 companies. Starting in the third quarter of 2019, theCompany is reporting InfoArmor using the name Allstate Identity Protection.
In connection with the InfoArmor acquisition, the Company recordedgoodwill of $318 million and intangible assets of $257 million. The intangibleassets include $225 million and $32 million related to acquired customerrelationships and technology, respectively.
Third Quarter 2019 Form 10-Q 15

Notes to Condensed Consolidated Financial Statements
Note 4 Reportable SegmentsChange in accounting principle
As discussed in Note 1, the Company changed its accounting principlefor recognizing actuarial gains and losses and expected return on planassets for its pension and other postretirement plans to a more preferablepolicy under U.S. GAAP. Under the new principle, remeasurement ofprojected benefit obligation and plan assets are immediately recognizedthrough earnings and are referred to as pension and other postretirementremeasurement gains and losses on the Condensed ConsolidatedStatements of Operations. This change has been applied on a retrospectivebasis. See Note 1 for further information regarding the impact of the changein accounting principle on the condensed consolidated financial statements.
Measuring segment profit or loss
The measure of segment profit or loss used in evaluating performanceis underwriting income for the Allstate Protection and Discontinued Linesand Coverages segments and adjusted net income for the ServiceBusinesses, Allstate Life, Allstate Benefits, Allstate Annuities, and Corporateand Other segments. A reconciliation of these measures to net incomeapplicable to common shareholders is provided below.
Underwriting income is calculated as premiums earned and otherrevenue, less claims and claims expenses (“losses”), amortization of DAC,operating costs and expenses, amortization of purchased intangibles andrestructuring and related charges as determined using GAAP.
Adjusted net income is net income applicable to common shareholders,excluding:
• Realized capital gains and losses, after-tax, except for periodic settlements andaccruals on non-hedge derivative instruments, which are reported with realizedcapital gains and losses but included in adjusted net income
• Pension and other postretirement remeasurement gains and losses, after-tax
• Valuation changes on embedded derivatives not hedged, after-tax
• Amortization of DAC and DSI, to the extent they resulted from the recognition ofcertain realized capital gains and losses or valuation changes on embeddedderivatives not hedged, after-tax
• Business combination expenses and the amortization or impairment of purchasedintangibles, after-tax
• Gain (loss) on disposition of operations, after-tax
• Adjustments for other significant non-recurring, infrequent or unusual items,when (a) the nature of the charge or gain is such that it is reasonably unlikely torecur within two years, or (b) there has been no similar charge or gain within theprior two years
16 www.allstate.com

Notes to Condensed Consolidated Financial Statements
Reportable segments revenue information
($ in millions)
Three months ended September
30, Nine months ended September
30,
2019 2018 2019 2018
Property-Liability
Insurance premiums
Auto $ 6,080 $ 5,798 $ 18,045 $ 17,094
Homeowners 1,997 1,891 5,890 5,603
Other personal lines 469 455 1,390 1,354
Commercial lines 236 176 645 477
Allstate Protection 8,782 8,320 25,970 24,528
Discontinued Lines and Coverages — — — —
Total Property-Liability insurance premiums 8,782 8,320 25,970 24,528
Other revenue 195 192 561 550
Net investment income 448 410 1,210 1,100
Realized capital gains and losses 163 126 916 16
Total Property-Liability 9,588 9,048 28,657 26,194
Service Businesses
Consumer product protection plans 163 125 461 369
Roadside assistance 57 66 183 198
Finance and insurance products 92 84 268 246
Intersegment premiums and service fees (1) 44 31 110 89
Other revenue 47 16 142 48
Net investment income 11 7 30 18
Realized capital gains and losses 4 — 21 (6)
Total Service Businesses 418 329 1,215 962
Allstate Life Traditional life insurance premiums 155 149 465 443
Accident and health insurance premiums — — 1 1
Interest-sensitive life insurance contract charges 176 173 535 531
Other revenue 31 30 91 84
Net investment income 128 128 380 380
Realized capital gains and losses 5 (3) 1 (9)
Total Allstate Life 495 477 1,473 1,430
Allstate Benefits Traditional life insurance premiums 12 13 31 32
Accident and health insurance premiums 250 246 746 739
Interest-sensitive life insurance contract charges 29 26 86 83
Net investment income 21 19 61 57
Realized capital gains and losses 2 2 8 —
Total Allstate Benefits 314 306 932 911
Allstate Annuities Fixed annuities contract charges 3 5 10 11
Net investment income 251 260 737 843
Realized capital gains and losses 20 51 224 28
Total Allstate Annuities 274 316 971 882
Corporate and Other
Net investment income 21 20 52 56
Realized capital gains and losses 3 — 13 (12)
Total Corporate and Other 24 20 65 44
Intersegment eliminations (1) (44) (31) (110) (89)
Consolidated revenues $ 11,069 $ 10,465 $ 33,203 $ 30,334
(1) Intersegment insurance premiums and service fees are primarily related to Arity and Allstate Roadside Services and are eliminated in the condensed consolidated financialstatements.

Third Quarter 2019 Form 10-Q 17

Notes to Condensed Consolidated Financial Statements
Reportable segments financial performance
Three months ended
September 30, Nine months ended
September 30,
($ in millions) 2019 2018 2019 2018
Property-Liability
Allstate Protection $ 836 $ 587 $ 1,909 $ 2,053
Discontinued Lines and Coverages (99) (80) (105) (86)
Total underwriting income 737 507 1,804 1,967
Net investment income 448 410 1,210 1,100
Income tax expense on operations (236) (185) (617) (628)
Realized capital gains and losses, after-tax 127 103 724 16
Tax Legislation expense — (3) — (3)
Property-Liability net income applicable to common shareholders 1,076 832 3,121 2,452
Service Businesses
Adjusted net income 8 1 35 —
Realized capital gains and losses, after-tax 4 (1) 17 (5)
Amortization of purchased intangibles, after-tax (25) (16) (74) (48)
Impairment of purchased intangibles, after-tax — — (43) —
Tax Legislation expense — (4) — (4)
Service Businesses net loss applicable to common shareholders (13) (20) (65) (57)
Allstate Life Adjusted net income 44 75 185 226
Realized capital gains and losses, after-tax 4 (3) — (7)
Valuation changes on embedded derivatives not hedged, after-tax (9) — (9) —
DAC and DSI amortization related to realized capital gains and losses, after-tax 1 (1) (2) (6)
Tax Legislation expense — (16) — (16)
Allstate Life net income applicable to common shareholders 40 55 174 197
Allstate Benefits Adjusted net income 31 33 99 98
Realized capital gains and losses, after-tax 2 2 7 —
Allstate Benefits net income applicable to common shareholders 33 35 106 98
Allstate Annuities Adjusted net income 16 20 43 99
Realized capital gains and losses, after-tax 16 40 177 22
Valuation changes on embedded derivatives not hedged, after-tax (1) 1 (6) 5
Gain on disposition of operations, after-tax — 1 2 3
Tax Legislation benefit — 69 — 69
Allstate Annuities net income applicable to common shareholders 31 131 216 198
Corporate and Other Adjusted net loss (101) (106) (302) (291)
Realized capital gains and losses, after-tax 2 — 10 (10)
Pension and other postretirement remeasurement gains and losses, after-tax (179) 30 (289) 25
Tax Legislation expense — (15) — (15)
Consolidated and Other net loss applicable to common shareholders (278) (91) (581) (291)
Consolidated net income applicable to common shareholders $ 889 $ 942 $ 2,971 $ 2,597
18 www.allstate.com

Notes to Condensed Consolidated Financial Statements
Note 5 Investments
Amortized cost, gross unrealized gains (losses) and fair value for fixed income securities
($ in millions)
Amortized cost
Gross unrealized Fairvalue Gains Losses
September 30, 2019
U.S. government and agencies $ 3,855 $ 257 $ (1) $ 4,111
Municipal 8,227 615 (4) 8,838
Corporate 42,013 2,075 (70) 44,018
Foreign government 972 24 (3) 993
Asset-backed securities (“ABS”) 818 10 (6) 822
Residential mortgage-backed securities (“RMBS”) 301 92 (1) 392
Commercial mortgage-backed securities (“CMBS”) 57 8 (1) 64
Redeemable preferred stock 20 1 — 21
Total fixed income securities $ 56,263 $ 3,082 $ (86) $ 59,259
December 31, 2018
U.S. government and agencies $ 5,386 $ 137 $ (6) $ 5,517
Municipal 8,963 249 (43) 9,169
Corporate 40,536 490 (890) 40,136
Foreign government 739 13 (5) 747
ABS 1,049 6 (10) 1,045
RMBS 377 89 (2) 464
CMBS 63 8 (1) 70
Redeemable preferred stock 21 1 — 22
Total fixed income securities $ 57,134 $ 993 $ (957) $ 57,170
Scheduled maturities for fixed income securities
($ in millions)
As of September 30, 2019
Amortized cost Fair value
Due in one year or less $ 3,026 $ 3,050
Due after one year through five years 25,251 25,913
Due after five years through ten years 17,315 18,290
Due after ten years 9,495 10,728
55,087 57,981
ABS, RMBS and CMBS 1,176 1,278
Total $ 56,263 $ 59,259
Actual maturities may differ from those scheduled as a result of calls and make-whole payments by the issuers. ABS, RMBS and CMBS are shownseparately because of the potential for prepayment of principal prior to contractual maturity dates.
Third Quarter 2019 Form 10-Q 19

Notes to Condensed Consolidated Financial Statements
Net investment income
($ in millions)
Three months ended September
30, Nine months ended September
30,
2019 2018 2019 2018
Fixed income securities $ 546 $ 527 $ 1,627 $ 1,544
Equity securities 57 35 155 130
Mortgage loans 54 52 161 163
Limited partnership interests 197 210 460 563
Short-term investments 28 19 80 50
Other 66 71 196 205
Investment income, before expense 948 914 2,679 2,655
Investment expense (68) (70) (209) (201)
Net investment income $ 880 $ 844 $ 2,470 $ 2,454
Realized capital gains (losses) by asset type
($ in millions)
Three months ended September
30, Nine months ended September
30,
2019 2018 2019 2018
Fixed income securities $ 147 $ (30) $ 290 $ (153)
Equity securities 40 223 771 204
Mortgage loans — — — 2
Limited partnership interests (18) (23) 75 (56)
Derivatives 40 5 16 20
Other (12) 1 31 —
Realized capital gains and losses $ 197 $ 176 $ 1,183 $ 17
Realized capital gains (losses) by transaction type
($ in millions)
Three months ended September
30, Nine months ended September
30,
2019 2018 2019 2018
Impairment write-downs $ (14) $ (5) $ (43) $ (10)
Sales 147 (22) 359 (139)
Valuation of equity investments (1) 24 198 851 149
Valuation and settlements of derivative instruments 40 5 16 17
Realized capital gains and losses $ 197 $ 176 $ 1,183 $ 17
(1) Includes valuation of equity securities and certain limited partnership interests where the underlying assets are predominately public equity securities.
Sales of fixed income securities resulted in gross gains of $168 millionand $21 million and gross losses of $20 million and $48 million during thethree months ended September 30, 2019 and 2018, respectively.
Sales of fixed income securities resulted in gross gains of $409 millionand $95 million and gross losses of $107 million and $242 million during thenine months ended September 30, 2019 and 2018, respectively.
The following table presents the net pre-tax appreciation (decline) during 2019 and 2018 of equity securities and limited partnership interests carried at fairvalue still held as of September 30, 2019 and September 30, 2018 recognized in net income.
Net appreciation (decline) recognized in net income
($ in millions)
Three months ended September
30, Nine months ended September
30,
2019 2018 2019 2018
Equity securities $ 107 $ 234 $ 736 $ 321
Limited partnership interests carried at fair value 49 75 109 181
Total $ 156 $ 309 $ 845 $ 502
20 www.allstate.com

Notes to Condensed Consolidated Financial Statements
OTTI losses by asset type
($ in millions)
Three months ended Three months ended
September 30, 2019 September 30, 2018
Gross Included in OCI Net Gross
Includedin OCI Net
Fixed income securities:
Municipal $ (2) $ 2 $ — $ — $ — $ —
Corporate $ — $ — $ — $ — $ — $ —
ABS — — — — (1) (1)
RMBS — — — — — —
CMBS (1) — (1) (2) — (2)
Total fixed income securities (3) 2 (1) (2) (1) (3)
Limited partnership interests (1) — (1) (2) — (2)
Other (12) — (12) — — —
OTTI losses $ (16) $ 2 $ (14) $ (4) $ (1) $ (5)
Nine months ended Nine months ended
September 30, 2019 September 30, 2018
Gross Included in OCI Net Gross
Includedin OCI Net
Fixed income securities:
Municipal $ (2) $ 2 $ — $ — $ — $ —
Corporate $ (5) $ (2) $ (7) $ — $ — $ —
ABS (3) — (3) (1) (1) (2)
RMBS — (1) (1) (1) — (1)
CMBS (3) 2 (1) (2) (1) (3)
Total fixed income securities (13) 1 (12) (4) (2) (6)
Limited partnership interests (4) — (4) (3) — (3)
Other (27) — (27) (1) — (1)
OTTI losses $ (44) $ 1 $ (43) $ (8) $ (2) $ (10)
OTTI losses included in AOCI at the time of impairment for fixed income securities which were not included in earnings
($ in millions) September 30, 2019 December 31, 2018
Municipal $ (7) $ (5)
Corporate — (2)
ABS (10) (10)
RMBS (56) (67)
CMBS (3) (2)
Total $ (76) $ (86)
The amounts exclude $179 million and $180 million as of September 30, 2019 and December 31, 2018, respectively, of net unrealized gains related tochanges in valuation of the fixed income securities subsequent to the impairment measurement date.
Rollforward of cumulative credit losses recognized in earnings for fixed income securities held as of September 30,
($ in millions)
Three months ended September
30, Nine months ended September
30,
2019 2018 2019 2018
Beginning balance $ (208) $ (206) $ (204) $ (226)
Additional credit loss for securities previously other-than-temporarily impaired (1) (3) (8) (5)
Additional credit loss for securities not previously other-than-temporarily impaired — — (4) (1)
Reduction in credit loss for securities disposed or collected 14 4 21 26
Change in credit loss due to accretion of increase in cash flows — — — 1
Ending balance $ (195) $ (205) $ (195) $ (205)
The Company uses its best estimate of future cash flows expected tobe collected from the fixed income security, discounted at the security’soriginal or current
effective rate, as appropriate, to calculate a recovery value and determinewhether a credit loss exists. The determination of cash flow estimates isinherently
Third Quarter 2019 Form 10-Q 21

Notes to Condensed Consolidated Financial Statements
subjective and methodologies may vary depending on facts andcircumstances specific to the security. All reasonably available informationrelevant to the collectability of the security, including past events, currentconditions, and reasonable and supportable assumptions and forecasts, areconsidered when developing the estimate of cash flows expected to becollected. That information generally includes, but is not limited to, theremaining payment terms of the security, prepayment speeds, foreignexchange rates, the financial condition and future earnings potential of theissue or issuer, expected defaults, expected recoveries, the value ofunderlying collateral, vintage, geographic concentration of underlyingcollateral, available reserves or escrows, current subordination levels, third-party guarantees and other credit enhancements. Other information, suchas industry analyst reports and forecasts, sector credit ratings, financialcondition of the bond insurer for insured fixed
income securities, and other market data relevant to the realizability ofcontractual cash flows, may also be considered. The estimated fair value ofcollateral will be used to estimate recovery value if the Company determinesthat the security is dependent on the liquidation of collateral for ultimatesettlement. If the estimated recovery value is less than the amortized cost ofthe security, a credit loss exists and an OTTI for the difference between theestimated recovery value and amortized cost is recorded in earnings. Theportion of the unrealized loss related to factors other than credit remainsclassified in AOCI. If the Company determines that the fixed income securitydoes not have sufficient cash flow or other information to estimate arecovery value for the security, the Company may conclude that the entiredecline in fair value is deemed to be credit related and the loss is recordedin earnings.
Unrealized net capital gains and losses included in AOCI($ in millions) Fair
value
Gross unrealized Unrealized netgains (losses)September 30, 2019 Gains Losses
Fixed income securities $ 59,259 $ 3,082 $ (86) $ 2,996
Short-term investments 5,254 — — —
Derivative instruments — — (3) (3)
Equity method of accounting (“EMA”) limited partnerships (1)
(3)
Unrealized net capital gains and losses, pre-tax
2,990
Amounts recognized for:
Insurance reserves (2)
(202)
DAC and DSI (3)
(221)
Amounts recognized
(423)
Deferred income taxes
(544)
Unrealized net capital gains and losses, after-tax
$ 2,023
(1) Unrealized net capital gains and losses for limited partnership interests represent the Company’s share of EMA limited partnerships’ OCI. Fair value and gross unrealizedgains and losses are not applicable.
(2) The insurance reserves adjustment represents the amount by which the reserve balance would increase if the net unrealized gains in the applicable product portfolios wererealized and reinvested at lower interest rates, resulting in a premium deficiency. This adjustment primarily relates to structured settlement annuities with life contingencies (atype of immediate fixed annuities).
(3) The DAC and DSI adjustment balance represents the amount by which the amortization of DAC and DSI would increase or decrease if the unrealized gains or losses in therespective product portfolios were realized.
22 www.allstate.com

Notes to Condensed Consolidated Financial Statements
Unrealized net capital gains and losses included in AOCI($ in millions) Fair
value
Gross unrealized Unrealized netgains (losses)December 31, 2018 Gains Losses
Fixed income securities $ 57,170 $ 993 $ (957) $ 36
Short-term investments 3,027 — — —
Derivative instruments — — (3) (3)
EMA limited partnerships
—
Unrealized net capital gains and losses, pre-tax
33
Amounts recognized for:
Insurance reserves
—
DAC and DSI
(33)
Amounts recognized
(33)
Deferred income taxes
(2)
Unrealized net capital gains and losses, after-tax
$ (2)
Change in unrealized net capital gains (losses)
($ in millions) Nine months endedSeptember 30, 2019
Fixed income securities $ 2,960
Derivative instruments —
EMA limited partnerships (3)
Total 2,957
Amounts recognized for:
Insurance reserves (202)
DAC and DSI (188)
Amounts recognized (390)
Deferred income taxes (542)
Increase in unrealized net capital gains and losses, after-tax $ 2,025
Portfolio monitoring
The Company has a comprehensive portfolio monitoring process toidentify and evaluate each fixed income security whose carrying value maybe other-than-temporarily impaired.
For each fixed income security in an unrealized loss position, theCompany assesses whether management with the appropriate authority hasmade the decision to sell or whether it is more likely than not the Companywill be required to sell the security before recovery of the amortized costbasis for reasons such as liquidity, contractual or regulatory purposes. If asecurity meets either of these criteria, the security’s decline in fair value isconsidered other than temporary and is recorded in earnings.
If the Company has not made the decision to sell the fixed incomesecurity and it is not more likely than not the Company will be required tosell the fixed income security before recovery of its amortized cost basis, theCompany evaluates whether it expects to receive cash flows sufficient torecover the entire amortized cost basis of the security. The Companycalculates the estimated recovery value by discounting the best estimate offuture cash flows at the security’s original or current effective rate, asappropriate, and compares this to the amortized cost of the security. If theCompany does not expect to receive cash flows sufficient to recover theentire amortized cost basis of the fixed income security, the credit losscomponent of the impairment is recorded in earnings, with the
remaining amount of the unrealized loss related to other factors recognizedin OCI.
The Company’s portfolio monitoring process includes a quarterly reviewof all securities to identify instances where the fair value of a securitycompared to its amortized cost is below established thresholds. The processalso includes the monitoring of other impairment indicators such as ratings,ratings downgrades and payment defaults. The securities identified, inaddition to other securities for which the Company may have a concern, areevaluated for potential OTTI using all reasonably available informationrelevant to the collectability or recovery of the security. Inherent in theCompany’s evaluation of OTTI for these securities are assumptions andestimates about the financial condition and future earnings potential of theissue or issuer. Some of the factors that may be considered in evaluatingwhether a decline in fair value is other than temporary are: 1) the financialcondition, near-term and long-term prospects of the issue or issuer,including relevant industry specific market conditions and trends, geographiclocation and implications of rating agency actions and offering prices; 2) thespecific reasons that a security is in an unrealized loss position, includingoverall market conditions which could affect liquidity; and 3) the length oftime and extent to which the fair value has been less than amortized cost.
Third Quarter 2019 Form 10-Q 23

Notes to Condensed Consolidated Financial Statements
Gross unrealized losses and fair value by type and length of time held in a continuous unrealized loss position
($ in millions)
Less than 12 months 12 months or more Total
unrealizedlosses
Numberof
issues Fairvalue
Unrealizedlosses
Numberof
issues Fairvalue
Unrealizedlosses
September 30, 2019
Fixed income securities
U.S. government and agencies 8 $ 165 $ (1) 17 $ 48 $ — $ (1)
Municipal 204 373 (2) 1 14 (2) (4)
Corporate 206 1,671 (31) 96 973 (39) (70)
Foreign government 32 205 (2) 6 103 (1) (3)
ABS 33 150 (2) 20 122 (4) (6)
RMBS 26 15 — 145 20 (1) (1)
CMBS 1 5 — 1 2 (1) (1)
Redeemable preferred stock — — — — — — —
Total fixed income securities 510 $ 2,584 $ (38) 286 $ 1,282 $ (48) $ (86)
Investment grade fixed income securities 426 $ 2,088 $ (13) 237 $ 991 $ (23) $ (36)
Below investment grade fixed income securities 84 496 (25) 49 291 (25) (50)
Total fixed income securities 510 $ 2,584 $ (38) 286 $ 1,282 $ (48) $ (86)
December 31, 2018
Fixed income securities
U.S. government and agencies 11 $ 55 $ — 38 $ 364 $ (6) $ (6)
Municipal 943 1,633 (10) 1,147 1,554 (33) (43)
Corporate 1,735 19,243 (543) 645 8,374 (347) (890)
Foreign government 7 20 (1) 27 412 (4) (5)
ABS 64 454 (5) 28 161 (5) (10)
RMBS 166 30 — 195 52 (2) (2)
CMBS 3 7 — 2 — (1) (1)
Redeemable preferred stock 1 — — — — — —
Total fixed income securities 2,930 $ 21,442 $ (559) 2,082 $ 10,917 $ (398) $ (957)
Investment grade fixed income securities 2,348 $ 17,485 $ (331) 2,021 $ 10,626 $ (360) $ (691)
Below investment grade fixed income securities 582 3,957 (228) 61 291 (38) (266)
Total fixed income securities 2,930 $ 21,442 $ (559) 2,082 $ 10,917 $ (398) $ (957)
Gross unrealized losses by unrealized loss position and credit quality as of September 30, 2019
($ in millions) Investment
grade Below investment grade Total
Fixed income securities with unrealized loss position less than 20% of amortized cost (1)(2) $ (23) $ (46) $ (69)
Fixed income securities with unrealized loss position greater than or equal to 20% ofamortized cost (3) (4) (13) (4) (17)
Total unrealized losses $ (36) $ (50) $ (86)
(1) Below investment grade fixed income securities include $25 million that have been in an unrealized loss position for less than twelve months.
(2) Related to securities with an unrealized loss position less than 20% of amortized cost, the degree of which suggests that these securities do not pose a high risk of beingother-than-temporarily impaired.
(3) Below investment grade fixed income securities include zero that have been in an unrealized loss position for a period of twelve or more consecutive months.
(4) Evaluated based on factors such as discounted cash flows and the financial condition and near-term and long-term prospects of the issue or issuer and were determined tohave adequate resources to fulfill contractual obligations.Investment grade is defined as a security having a rating of Aaa, Aa, A
or Baa from Moody’s, a rating of AAA, AA, A or BBB from S&P GlobalRatings (“S&P”), a comparable rating from another nationally recognizedrating agency, or a comparable internal rating if an externally provided ratingis not available. Market prices for certain securities may have credit spreads
which imply higher or lower credit quality than the current third-party rating.Unrealized losses on investment grade securities are principally related toan increase in market yields which may include increased risk-free interestrates and/or wider credit spreads since the time of initial purchase. The
24 www.allstate.com

Notes to Condensed Consolidated Financial Statements
unrealized losses are expected to reverse as the securities approachmaturity.
ABS, RMBS and CMBS in an unrealized loss position were evaluatedbased on actual and projected collateral losses relative to the securities’positions in the respective securitization trusts, security specificexpectations of cash flows, and credit ratings. This evaluation also takesinto consideration credit enhancement, measured in terms of (i)subordination from other classes of securities in the trust that arecontractually obligated to absorb losses before the class of security theCompany owns, and (ii) the expected impact of other structural featuresembedded in the securitization trust beneficial to the class of securities theCompany owns, such as overcollateralization and excess spread. Municipalbonds in an unrealized loss position were evaluated based on theunderlying credit quality of the primary obligor, obligation type and quality ofthe underlying assets.
As of September 30, 2019, the Company has not made the decision tosell and it is not more likely than not the Company will be required to sellfixed income securities with unrealized losses before recovery of theamortized cost basis.
Limited partnerships
Investments in limited partnership interests include interests in privateequity funds, real estate funds and other funds. As of September 30, 2019and December 31, 2018, the carrying value of EMA limited partnershipstotaled $6.23 billion and $5.73 billion, respectively, and limited partnershipscarried at fair value totaled $1.76 billion and $1.78 billion, respectively.
Mortgage loans
Mortgage loans are evaluated for impairment on a specific loan basisthrough a quarterly credit
monitoring process and review of key credit quality indicators. Mortgageloans are considered impaired when it is probable that the Company will notcollect the contractual principal and interest. Valuation allowances areestablished for impaired loans to reduce the carrying value to the fair valueof the collateral less costs to sell or the present value of the loan’s expectedfuture repayment cash flows discounted at the loan’s original effectiveinterest rate. Impaired mortgage loans may not have a valuation allowancewhen the fair value of the collateral less costs to sell is higher than thecarrying value. Valuation allowances are adjusted for subsequent changesin the fair value of the collateral less costs to sell or present value of theloan’s expected future repayment cash flows. Mortgage loans are chargedoff against their corresponding valuation allowances when there is noreasonable expectation of recovery. The impairment evaluation is non-statistical in respect to the aggregate portfolio but considers facts andcircumstances attributable to each loan. It is not considered probable thatadditional impairment losses, beyond those identified on a specific loanbasis, have been incurred as of September 30, 2019.
Accrual of income is suspended for mortgage loans that are in defaultor when full and timely collection of principal and interest payments is notprobable. Cash receipts on mortgage loans on non-accrual status aregenerally recorded as a reduction of carrying value.
Debt service coverage ratio is considered a key credit quality indicatorwhen mortgage loans are evaluated for impairment. Debt service coverageratio represents the amount of estimated cash flows from the propertyavailable to the borrower to meet principal and interest payment obligations.Debt service coverage ratio estimates are updated annually or morefrequently if conditions are warranted based on the Company’s creditmonitoring process.
Carrying value of non-impaired mortgage loans summarized by debt service coverage ratio distribution($ in millions) September 30, 2019 December 31, 2018
Debt service coverage ratio distribution
Fixed ratemortgage
loans
Variable ratemortgage
loans Total
Fixed ratemortgage
loans
Variable ratemortgage
loans Total
Below 1.0 $ 20 $ 32 $ 52 $ 6 $ 31 $ 37
1.0 - 1.25 247 — 247 273 — 273
1.26 - 1.50 1,347 18 1,365 1,192 — 1,192
Above 1.50 2,941 83 3,024 3,063 101 3,164
Total non-impaired mortgage loans $ 4,555 $ 133 $ 4,688 $ 4,534 $ 132 $ 4,666
Mortgage loans with a debt service coverage ratio below 1.0 that arenot considered impaired primarily relate to instances where the borrowerhas the financial capacity to fund the revenue shortfalls from the propertiesfor the foreseeable term, the decrease
in cash flows from the properties is considered temporary, or there are otherrisk mitigating circumstances such as additional collateral, escrow balancesor borrower guarantees.
Net carrying value of impaired mortgage loans
($ in millions) September 30, 2019 December 31, 2018
Impaired mortgage loans with a valuation allowance $ 6 $ 4
Impaired mortgage loans without a valuation allowance — —
Total impaired mortgage loans $ 6 $ 4
Valuation allowance on impaired mortgage loans $ 3 $ 3
Third Quarter 2019 Form 10-Q 25

Notes to Condensed Consolidated Financial Statements
The valuation allowance on impaired loans had no activity for the threemonths and nine months ended September 30, 2019 and 2018. Theaverage balance of impaired loans was $4 million for both the nine monthsended September 30, 2019 and 2018.
Payments on all mortgage loans were current as of September 30,2019 and December 31, 2018.
Short-term investments
Short-term investments, including commercial paper, money marketfunds, U.S. Treasury bills and other short-term investments, are carried atfair value. As of September 30, 2019 and December 31, 2018, the fair valueof short-term investments totaled $5.25 billion and $3.03 billion, respectively.
Other investments
Other investments primarily consist of bank loans, policy loans, realestate, agent loans and derivatives. Bank loans are primarily senior securedcorporate loans and are carried at amortized cost. Policy loans are carriedat unpaid principal balances. Real estate is carried at cost less accumulateddepreciation. Agent loans are loans issued to exclusive Allstate agents andare carried at unpaid principal balances, net of valuation allowances andunamortized deferred fees or costs. Derivatives are carried at fair value.
Other investments by asset type
($ in millions) September 30, 2019 December 31, 2018
Bank loans $ 1,223 $ 1,350
Policy loans 892 891
Real estate 917 791
Agent loans 663 620
Derivatives and other 209 200
Total $ 3,904 $ 3,852
26 www.allstate.com

Notes to Condensed Consolidated Financial Statements
Note 6 Fair Value of Assets and LiabilitiesFair value is defined as the price that would be received to sell an asset
or paid to transfer a liability in an orderly transaction between marketparticipants at the measurement date. The hierarchy for inputs used indetermining fair value maximizes the use of observable inputs andminimizes the use of unobservable inputs by requiring that observableinputs be used when available. Assets and liabilities recorded on theCondensed Consolidated Statements of Financial Position at fair value arecategorized in the fair value hierarchy based on the observability of inputs tothe valuation techniques as follows:
Level 1: Assets and liabilities whose values are based on unadjusted quotedprices for identical assets or liabilities in an active market that the Companycan access.
Level 2: Assets and liabilities whose values are based on the following:
(a) Quoted prices for similar assets or liabilities in active markets;
(b) Quoted prices for identical or similar assets or liabilities in markets thatare not active; or
(c) Valuation models whose inputs are observable, directly or indirectly, forsubstantially the full term of the asset or liability.
Level 3: Assets and liabilities whose values are based on prices or valuationtechniques that require inputs that are both unobservable and significant tothe overall fair value measurement. Unobservable inputs reflect theCompany’s estimates of the assumptions that market participants would usein valuing the assets and liabilities.
The availability of observable inputs varies by instrument. In situationswhere fair value is based on internally developed pricing models or inputsthat are unobservable in the market, the determination of fair value requiresmore judgment. The degree of judgment exercised by the Company indetermining fair value is typically greatest for instruments categorized inLevel 3. In many instances, valuation inputs used to measure fair value fallinto different levels of the fair value hierarchy. The category level in the fairvalue hierarchy is determined based on the lowest level input that issignificant to the fair value measurement in its entirety. The Company usesprices and inputs that are current as of the measurement date, includingduring periods of market disruption. In periods of market disruption, theability to observe prices and inputs may be reduced for many instruments.
The Company is responsible for the determination of fair value and thesupporting assumptions and methodologies. The Company gains assurancethat assets and liabilities are appropriately valued through the execution ofvarious processes and controls designed to ensure the overallreasonableness and consistent application of valuation methodologies,including inputs and assumptions, and compliance
with accounting standards. For fair values received from third parties orinternally estimated, the Company’s processes and controls are designed toensure that the valuation methodologies are appropriate and consistentlyapplied, the inputs and assumptions are reasonable and consistent with theobjective of determining fair value, and the fair values are accuratelyrecorded. For example, on a continuing basis, the Company assesses thereasonableness of individual fair values that have stale security prices orthat exceed certain thresholds as compared to previous fair values receivedfrom valuation service providers or brokers or derived from internal models.The Company performs procedures to understand and assess themethodologies, processes and controls of valuation service providers. Inaddition, the Company may validate the reasonableness of fair values bycomparing information obtained from valuation service providers or brokersto other third-party valuation sources for selected securities. The Companyperforms ongoing price validation procedures such as back-testing of actualsales, which corroborate the various inputs used in internal models tomarket observable data. When fair value determinations are expected to bemore variable, the Company validates them through reviews by members ofmanagement who have relevant expertise and who are independent ofthose charged with executing investment transactions.
The Company has two types of situations where investments areclassified as Level 3 in the fair value hierarchy. The first is where specificinputs significant to the fair value estimation models are not marketobservable. This primarily occurs in the Company’s use of broker quotes tovalue certain securities where the inputs have not been corroborated to bemarket observable, and the use of valuation models that use significant non-market observable inputs. The second situation where the Companyclassifies securities in Level 3 is where quotes continue to be received fromindependent third-party valuation service providers and all significant inputsare market observable; however, there has been a significant decrease inthe volume and level of activity for the asset when compared to normalmarket activity such that the degree of market observability has declined toa point where categorization as a Level 3 measurement is consideredappropriate. The indicators considered in determining whether a significantdecrease in the volume and level of activity for a specific asset has occurredinclude the level of new issuances in the primary market, trading volume inthe secondary market, the level of credit spreads over historical levels,applicable bid-ask spreads, and price consensus among market participantsand other pricing sources.
Certain assets are not carried at fair value on a recurring basis,including investments such as mortgage loans, bank loans, agent loans andpolicy loans. Accordingly, such investments are only included in the fairvalue hierarchy disclosure when the investment is subject toremeasurement at fair value after initial recognition and the resulting
Third Quarter 2019 Form 10-Q 27

Notes to Condensed Consolidated Financial Statements
remeasurement is reflected in the condensed consolidated financialstatements.
In determining fair value, the Company principally uses the marketapproach which generally utilizes market transaction data for the same orsimilar instruments. To a lesser extent, the Company uses the incomeapproach which involves determining fair values from discounted cash flowmethodologies. For the majority of Level 2 and Level 3 valuations, acombination of the market and income approaches is used.
Summary of significant valuation techniques for assets and liabilitiesmeasured at fair value on a recurring basis
Level 1 measurements
• Fixed income securities: Comprise certain U.S. Treasury fixed incomesecurities. Valuation is based on unadjusted quoted prices for identicalassets in active markets that the Company can access.
• Equity securities: Comprise actively traded, exchange-listed equitysecurities. Valuation is based on unadjusted quoted prices for identicalassets in active markets that the Company can access.
• Short-term: Comprise U.S. Treasury bills valued based on unadjustedquoted prices for identical assets in active markets that the Companycan access and actively traded money market funds that have dailyquoted net asset values for identical assets that the Company canaccess.
• Separate account assets: Comprise actively traded mutual funds thathave daily quoted net asset values that are readily determinable foridentical assets that the Company can access. Net asset values for theactively traded mutual funds in which the separate account assets areinvested are obtained daily from the fund managers.
• Other assets: Comprise free-standing exchange-listed derivatives thatare valued based on unadjusted quoted prices for identical assets inactive markets.
Level 2 measurements
• Fixed income securities:
U.S. government and agencies: The primary inputs to the valuationinclude quoted prices for identical or similar assets in markets that arenot active, contractual cash flows, benchmark yields and credit spreads.
Municipal: The primary inputs to the valuation include quoted prices foridentical or similar assets in markets that are not active, contractualcash flows, benchmark yields and credit spreads.
Corporate - public: The primary inputs to the valuation include quotedprices for identical or similar assets in markets that are not active,contractual cash flows, benchmark yields and credit spreads.
Corporate - privately placed: Valued using a discounted cash flowmodel that is widely accepted in the financial services industry and usesmarket observable inputs and inputs derived principally from, orcorroborated by, observable market data. The primary inputs to thediscounted cash flow model include an interest rate yield curve, as wellas published credit spreads for similar assets in markets that are notactive that incorporate the credit quality and industry sector of theissuer.
Foreign government: The primary inputs to the valuation include quotedprices for identical or similar assets in markets that are not active,contractual cash flows, benchmark yields and credit spreads.
ABS - collateralized debt obligations (“CDO”) and ABS - consumer andother: The primary inputs to the valuation include quoted prices foridentical or similar assets in markets that are not active, contractualcash flows, benchmark yields, prepayment speeds, collateralperformance and credit spreads. Certain ABS - CDO and ABS -consumer and other are valued based on non-binding broker quoteswhose inputs have been corroborated to be market observable.
RMBS: The primary inputs to the valuation include quoted prices foridentical or similar assets in markets that are not active, contractualcash flows, benchmark yields, prepayment speeds, collateralperformance and credit spreads.
CMBS: The primary inputs to the valuation include quoted prices foridentical or similar assets in markets that are not active, contractualcash flows, benchmark yields, collateral performance and creditspreads.
Redeemable preferred stock: The primary inputs to the valuationinclude quoted prices for identical or similar assets in markets that arenot active, contractual cash flows, benchmark yields, underlying stockprices and credit spreads.
• Equity securities: The primary inputs to the valuation include quotedprices or quoted net asset values for identical or similar assets inmarkets that are not active.
• Short-term: The primary inputs to the valuation include quoted pricesfor identical or similar assets in markets that are not active, contractualcash flows, benchmark yields and credit spreads.
• Other investments: Free-standing exchange listed derivatives that arenot actively traded are valued based on quoted prices for identicalinstruments in markets that are not active.
Over-the-counter (“OTC”) derivatives, including interest rate swaps,foreign currency swaps, total return swaps, foreign exchange forwardcontracts, certain options and certain credit default swaps, are valuedusing models that rely on inputs such as interest rate yield curves,implied volatilities, index price levels, currency rates, and credit
28 www.allstate.com

Notes to Condensed Consolidated Financial Statements
spreads that are observable for substantially the full term of thecontract. The valuation techniques underlying the models are widelyaccepted in the financial services industry and do not involve significantjudgment.
Level 3 measurements
• Fixed income securities:
Municipal: Comprise municipal bonds that are not rated by third-partycredit rating agencies. The primary inputs to the valuation of thesemunicipal bonds include quoted prices for identical or similar assets inmarkets that exhibit less liquidity relative to those markets supportingLevel 2 fair value measurements, contractual cash flows, benchmarkyields and credit spreads. Also included are municipal bonds valuedbased on non-binding broker quotes where the inputs have not beencorroborated to be market observable and municipal bonds in defaultvalued based on the present value of expected cash flows.
Corporate - public and Corporate - privately placed: Primarily valuedbased on non-binding broker quotes where the inputs have not beencorroborated to be market observable. Other inputs include an interestrate yield curve, as well as published credit spreads for similar assetsthat incorporate the credit quality and industry sector of the issuer.
ABS - CDO, ABS - consumer and other, RMBS and CMBS: Valuedbased on non-binding broker quotes received from brokers who arefamiliar with the investments and where the inputs have not beencorroborated to be market observable.
• Equity securities: The primary inputs to the valuation include quotedprices or quoted net asset values for identical or similar assets inmarkets that exhibit less liquidity relative to those markets supportingLevel 2 fair value measurements.
• Short-term: For certain short-term investments, amortized cost is usedas the best estimate of fair value.
• Other investments: Certain OTC derivatives, such as interest rate caps,certain credit default swaps
and certain options (including swaptions), are valued using models thatare widely accepted in the financial services industry. These arecategorized as Level 3 as a result of the significance of non-marketobservable inputs such as volatility. Other primary inputs includeinterest rate yield curves and credit spreads.
• Contractholder funds: Derivatives embedded in certain life and annuitycontracts are valued internally using models widely accepted in thefinancial services industry that determine a single best estimate of fairvalue for the embedded derivatives within a block of contractholderliabilities. The models primarily use stochastically determined cashflows based on the contractual elements of embedded derivatives,projected option cost and applicable market data, such as interest rateyield curves and equity index volatility assumptions. These arecategorized as Level 3 as a result of the significance of non-marketobservable inputs.
Assets and liabilities measured at fair value on a non-recurring basis
Mortgage loans written-down to fair value in connection withrecognizing impairments are valued based on the fair value of theunderlying collateral less costs to sell. Bank loans written-down to fair valueare valued based on broker quotes from brokers familiar with the loans andcurrent market conditions or based on internal valuation models.
Investments excluded from the fair value hierarchy
Limited partnerships carried at fair value, which do not have readilydeterminable fair values, use NAV provided by the investees and areexcluded from the fair value hierarchy. These investments are generally notredeemable by the investees and generally cannot be sold without approvalof the general partner. The Company receives distributions of income andproceeds from the liquidation of the underlying assets of the investees,which usually takes place in years 4-9 of the typical contractual life of 10-12years. As of September 30, 2019, the Company has commitments to invest$545 million in these limited partnership interests.
Third Quarter 2019 Form 10-Q 29

Notes to Condensed Consolidated Financial Statements
Assets and liabilities measured at fair value As of September 30, 2019
($ in millions)
Quoted prices in activemarkets for
identical assets(Level 1)
Significant otherobservable inputs
(Level 2) Significant
unobservable inputs(Level 3)
Counterpartyand cash collateral
netting Total
Assets
Fixed income securities:
U.S. government and agencies $ 3,707 $ 404 $ — $ 4,111
Municipal — 8,774 64 8,838
Corporate - public — 31,538 104 31,642
Corporate - privately placed — 12,289 87 12,376
Foreign government — 993 — 993
ABS - CDO — 297 63 360
ABS - consumer and other — 447 15 462
RMBS — 392 — 392
CMBS — 30 34 64
Redeemable preferred stock — 21 — 21
Total fixed income securities 3,707 55,185 367 59,259
Equity securities 7,453 368 385 8,206
Short-term investments 2,530 2,709 15 5,254
Other investments: Free-standing derivatives — 186 — $ (52) 134
Separate account assets 2,942 — — 2,942
Other assets 1 — — 1
Total recurring basis assets 16,633 58,448 767 (52) 75,796
Total assets at fair value $ 16,633 $ 58,448 $ 767 $ (52) $ 75,796
% of total assets at fair value 22.0% 77.1% 1.0% (0.1)% 100.0%
Investments reported at NAV 1,761
Total $ 77,557
Liabilities Contractholder funds: Derivatives embedded in life and annuitycontracts $ — $ — $ (454) $ (454)
Other liabilities: Free-standing derivatives (1) (59) — $ 5 (55)
Total recurring basis liabilities $ (1) $ (59) $ (454) $ 5 $ (509)
% of total liabilities at fair value 0.2% 11.6% 89.2% (1.0)% 100.0%
30 www.allstate.com

Notes to Condensed Consolidated Financial Statements
Assets and liabilities measured at fair value As of December 31, 2018
($ in millions)
Quoted prices in activemarkets for
identical assets(Level 1)
Significant otherobservable inputs
(Level 2) Significant
unobservable inputs(Level 3)
Counterpartyand cash collateral
netting Total
Assets
Fixed income securities:
U.S. government and agencies $ 5,085 $ 432 $ — $ 5,517
Municipal — 9,099 70 9,169
Corporate - public — 29,200 70 29,270
Corporate - privately placed — 10,776 90 10,866
Foreign government — 747 — 747
ABS - CDO — 263 6 269
ABS - consumer and other — 713 63 776
RMBS — 464 — 464
CMBS — 44 26 70
Redeemable preferred stock — 22 — 22
Total fixed income securities 5,085 51,760 325 57,170
Equity securities 4,364 331 341 5,036
Short-term investments 1,338 1,659 30 3,027
Other investments: Free-standing derivatives — 139 1 $ (23) 117
Separate account assets 2,805 — — 2,805
Other assets 2 — — 2
Total recurring basis assets $ 13,594 $ 53,889 $ 697 $ (23) $ 68,157
% of total assets at fair value 19.9% 79.1% 1.0% — % 100.0%
Investments reported at NAV 1,779
Total $ 69,936
Liabilities Contractholder funds: Derivatives embedded in life and annuitycontracts $ — $ — $ (224) $ (224)
Other liabilities: Free-standing derivatives (1) (62) — $ 6 (57)
Total recurring basis liabilities $ (1) $ (62) $ (224) $ 6 $ (281)
% of total liabilities at fair value 0.3% 22.1% 79.7% (2.1)% 100.0%
Quantitative information about the significant unobservable inputs used in Level 3 fair value measurements
($ in millions) Fair value Valuationtechnique
Unobservableinput Range
Weightedaverage
September 30, 2019
Derivatives embedded in life and annuity contracts –Equity-indexed and forward starting options
$ (417)
Stochastic cashflow model
Projected option cost
1.0 - 4.2%
2.64%
December 31, 2018
Derivatives embedded in life and annuity contracts –Equity-indexed and forward starting options
$ (185)
Stochastic cashflow model
Projected option cost
1.0 - 2.2%
1.74%
The embedded derivatives are equity-indexed and forward startingoptions in certain life and annuity products that provide customers withinterest crediting rates based on the performance of the S&P 500. If theprojected option cost increased (decreased), it would result in a higher(lower) liability fair value.
As of September 30, 2019 and December 31, 2018, Level 3 fair valuemeasurements of fixed income securities total $367 million and $325 million,respectively, and include $87 million and $105 million, respectively, ofsecurities valued based on non-binding broker quotes where the inputs havenot been
corroborated to be market observable and $37 million and $44 million,respectively, of municipal fixed income securities that are not rated by third-party credit rating agencies. The Company does not develop theunobservable inputs used in measuring fair value; therefore, these are notincluded in the table above. However, an increase (decrease) in creditspreads for fixed income securities valued based on non-binding brokerquotes would result in a lower (higher) fair value, and an increase(decrease) in the credit rating of municipal bonds that are not rated by third-party credit rating agencies would result in a higher (lower) fair value.
Third Quarter 2019 Form 10-Q 31

Notes to Condensed Consolidated Financial Statements
Rollforward of Level 3 assets and liabilities held at fair value during the three months period ended September 30, 2019
Balance as of June
30, 2019
Total gains (losses) included in: Transfersinto
Level 3
Transfersout of
Level 3
($ in millions) Net income OCI
Assets
Fixed income securities:
Municipal $ 63 $ — $ 2 $ — $ —
Corporate - public 46 — 1 — (7)
Corporate - privately placed 89 — (1) — — ABS - CDO 10 1 — 50 (5)
ABS - consumer and other 43 — — — (30) RMBS 1 — (1) — —
CMBS 34 — — — —
Total fixed income securities 286 1 1 50 (42)
Equity securities 319 11 — — —
Short-term investments 5 — — — —
Free-standing derivatives, net — — — — — Total recurring Level 3 assets $ 610 $ 12 $ 1 $ 50 $ (42)
Liabilities Contractholder funds: Derivatives embeddedin life and annuity contracts $ (437) $ (14) $ — $ — $ —
Total recurring Level 3 liabilities $ (437) $ (14) $ — $ — $ —
Purchases Sales Issues Settlements Balance as of
September 30, 2019 Assets
Fixed income securities: Municipal $ — $ (1) $ — $ — $ 64 Corporate - public 66 (2) — — 104 Corporate - privately placed 1 — — (2) 87 ABS - CDO 8 — — (1) 63 ABS - consumer and other 3 — — (1) 15 RMBS — — — — — CMBS — — — — 34
Total fixed income securities 78 (3) — (4) 367 Equity securities 55 — — — 385 Short-term investments 10 — — — 15 Free-standing derivatives, net — — — — —
Total recurring Level 3 assets $ 143 $ (3) $ — $ (4) $ 767 Liabilities
Contractholder funds: Derivatives embeddedin life and annuity contracts $ — $ — $ (9) $ 6 $ (454)
Total recurring Level 3 liabilities $ — $ — $ (9) $ 6 $ (454)
Total Level 3 gains (losses) included in net income for the three months ended September 30, 2019
Net investment
income Realized capitalgains and losses
Life contractbenefits
Interest credited tocontractholder funds Total
Components of net income $ 5 $ 7 $ (1) $ (13) $ (2)
32 www.allstate.com

Notes to Condensed Consolidated Financial Statements
Rollforward of Level 3 assets and liabilities held at fair value during the nine months period ended September 30, 2019
Balance as of
December 31, 2018
Total gains (losses) included in: Transfersinto
Level 3
Transfersout of
Level 3
($ in millions) Net income OCI
Assets
Fixed income securities:
Municipal $ 70 $ — $ 4 $ — $ (5)
Corporate - public 70 — 3 — (47)
Corporate - privately placed 90 (1) 1 15 (2) ABS - CDO 6 1 — 51 (5)
ABS - consumer and other 63 — — — (145) RMBS — — (1) 1 —
CMBS 26 — — 3 —
Total fixed income securities 325 — 7 70 (204)
Equity securities 341 49 — — —
Short-term investments 30 — — — —
Free-standing derivatives, net 1 (1) — — — Total recurring Level 3 assets $ 697 $ 48 $ 7 $ 70 $ (204)
Liabilities Contractholder funds: Derivatives embeddedin life and annuity contracts $ (224) $ (54) $ — $ (175) $ —
Total recurring Level 3 liabilities $ (224) $ (54) $ — $ (175) $ —
Purchases Sales Issues Settlements Balance as of
September 30, 2019 Assets
Fixed income securities: Municipal $ — $ (4) $ — $ (1) $ 64 Corporate - public 86 (7) — (1) 104 Corporate - privately placed 2 (13) — (5) 87 ABS - CDO 11 — — (1) 63 ABS - consumer and other 124 (22) — (5) 15 RMBS — — — — — CMBS 6 — — (1) 34
Total fixed income securities 229 (46) — (14) 367 Equity securities 77 (82) — — 385 Short-term investments 25 (40) — — 15 Free-standing derivatives, net — — — — —
Total recurring Level 3 assets $ 331 $ (168) $ — $ (14) $ 767 Liabilities
Contractholder funds: Derivatives embeddedin life and annuity contracts $ — $ — $ (9) $ 8 $ (454)
Total recurring Level 3 liabilities $ — $ — $ (9) $ 8 $ (454)
Total Level 3 gains (losses) included in net income for the nine months ended September 30, 2019
Net investment
income Realized capitalgains and losses
Life contractbenefits
Interest credited tocontractholder funds Total
Components of net income $ 10 $ 38 $ 2 $ (56) $ (6)
Third Quarter 2019 Form 10-Q 33

Notes to Condensed Consolidated Financial Statements
Rollforward of Level 3 assets and liabilities held at fair value during the three months period ended September 30, 2018
Balance as of June
30, 2018
Total gains (losses) included in: Transfersinto
Level 3
Transfersout of
Level 3
($ in millions) Net income OCI
Assets
Fixed income securities:
Municipal $ 106 $ — $ (1) $ — $ (9)
Corporate - public 76 — (1) 12 (4)
Corporate - privately placed 195 1 (1) — (20) ABS - CDO 9 — 1 20 —
ABS - consumer and other 73 — — 12 (29) CMBS 26 — — — —
Total fixed income securities 485 1 (2) 44 (62)
Equity securities 291 8 — — —
Short-term investments — — — — — Free-standing derivatives, net 1 — — — —
Total recurring Level 3 assets $ 777 $ 9 $ (2) $ 44 $ (62)
Liabilities Contractholder funds: Derivatives embeddedin life and annuity contracts $ (260) $ (7) $ — $ — $ —
Total recurring Level 3 liabilities $ (260) $ (7) $ — $ — $ —
Purchases Sales Issues Settlements Balance as of
September 30, 2018
Assets
Fixed income securities:
Municipal $ — $ (6) $ — $ (1) $ 89
Corporate - public 10 (1) — — 92
Corporate - privately placed 6 (2) — (12) 167 ABS - CDO — — — (1) 29
ABS - consumer and other 33 (20) — (17) 52 CMBS — — — — 26
Total fixed income securities 49 (29) — (31) 455
Equity securities 21 — — — 320
Short-term investments 20 — — — 20 Free-standing derivatives, net — — — — 1 (1)
Total recurring Level 3 assets $ 90 $ (29) $ — $ (31) $ 796
Liabilities Contractholder funds: Derivatives embeddedin life and annuity contracts $ — $ — $ — $ 1 $ (266)
Total recurring Level 3 liabilities $ — $ — $ — $ 1 $ (266) (1) Comprises $1 million of assets.
Total Level 3 gains (losses) included in net income for the three months ended September 30, 2018
Net investment
income Realized capitalgains and losses
Life contractbenefits
Interest credited tocontractholder funds Total
Components of net income $ — $ 9 $ 2 $ (9) $ 2
34 www.allstate.com

Notes to Condensed Consolidated Financial Statements
Rollforward of Level 3 assets and liabilities held at fair value during the nine months period ended September 30, 2018
Balance as of
December 31, 2017
Total gains (losses) included in: Transfersinto
Level 3
Transfersout of
Level 3
($ in millions) Net income OCI
Assets
Fixed income securities:
Municipal $ 101 $ 1 $ (2) $ — $ (11)
Corporate - public 108 — (3) 16 (9)
Corporate - privately placed 224 (1) (2) 20 (49) ABS - CDO 99 — 1 20 (89)
ABS - consumer and other 48 — 1 22 (45) CMBS 26 — — — —
Total fixed income securities 606 — (5) 78 (203)
Equity securities 210 24 — — —
Short-term investments 20 — — — — Free-standing derivatives, net 1 — — — —
Total recurring Level 3 assets $ 837 $ 24 $ (5) $ 78 $ (203)
Liabilities Contractholder funds: Derivatives embedded inlife and annuity contracts $ (286) $ 17 $ — $ — $ —
Total recurring Level 3 liabilities $ (286) $ 17 $ — $ — $ —
Purchases Sales Issues Settlements Balance as of
September 30, 2018
Assets
Fixed income securities:
Municipal $ 10 $ (8) $ — $ (2) $ 89
Corporate - public 10 (27) — (3) 92
Corporate - privately placed 21 (5) — (41) 167 ABS - CDO — — — (2) 29
ABS - consumer and other 108 (62) — (20) 52 CMBS 1 — — (1) 26
Total fixed income securities 150 (102) — (69) 455
Equity securities 100 (14) — — 320
Short-term investments 45 (45) — — 20 Free-standing derivatives, net — — — — 1 (1)
Total recurring Level 3 assets $ 295 $ (161) $ — $ (69) $ 796
Liabilities Contractholder funds: Derivatives embedded inlife and annuity contracts $ — $ — $ (1) $ 4 $ (266)
Total recurring Level 3 liabilities $ — $ — $ (1) $ 4 $ (266) (1) Comprises $1 million of assets.
Total Level 3 gains (losses) included in net income for the nine months ended September 30, 2018
Net investment
income Realized capitalgains and losses
Life contractbenefits
Interest credited tocontractholder funds Total
Components of net income $ — $ 24 $ 7 $ 10 $ 41
Third Quarter 2019 Form 10-Q 35
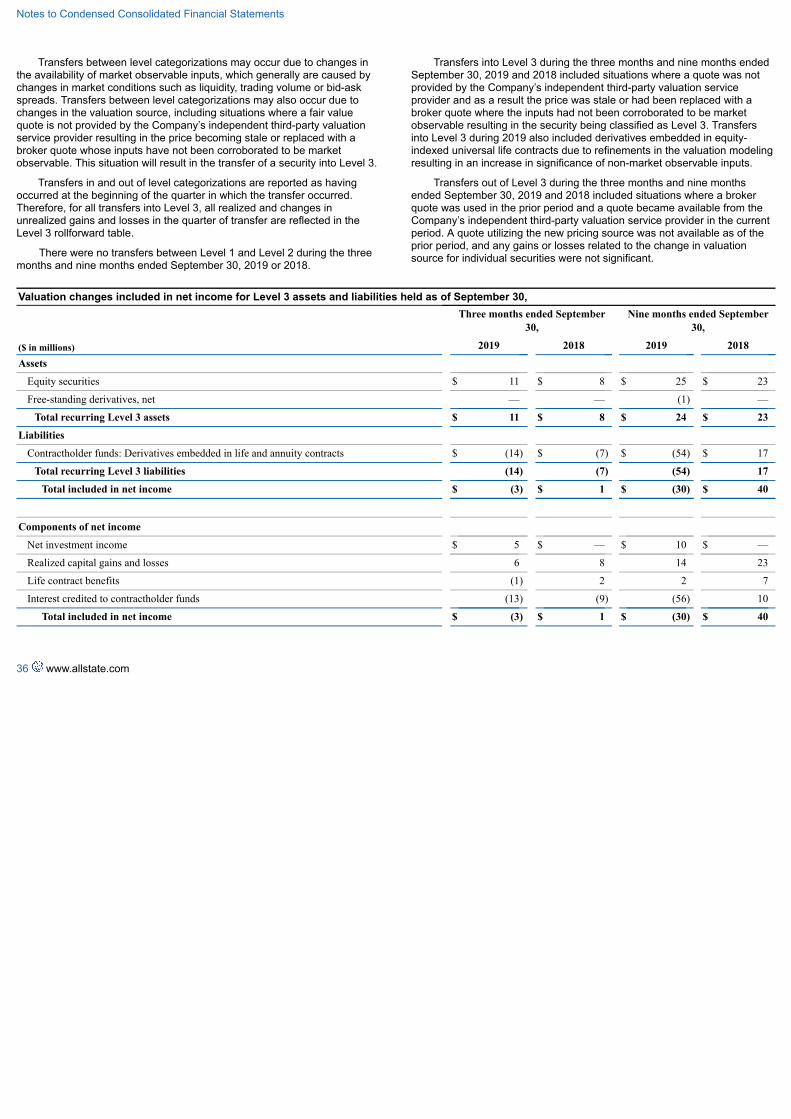
Notes to Condensed Consolidated Financial Statements
Transfers between level categorizations may occur due to changes inthe availability of market observable inputs, which generally are caused bychanges in market conditions such as liquidity, trading volume or bid-askspreads. Transfers between level categorizations may also occur due tochanges in the valuation source, including situations where a fair valuequote is not provided by the Company’s independent third-party valuationservice provider resulting in the price becoming stale or replaced with abroker quote whose inputs have not been corroborated to be marketobservable. This situation will result in the transfer of a security into Level 3.
Transfers in and out of level categorizations are reported as havingoccurred at the beginning of the quarter in which the transfer occurred.Therefore, for all transfers into Level 3, all realized and changes inunrealized gains and losses in the quarter of transfer are reflected in theLevel 3 rollforward table.
There were no transfers between Level 1 and Level 2 during the threemonths and nine months ended September 30, 2019 or 2018.
Transfers into Level 3 during the three months and nine months endedSeptember 30, 2019 and 2018 included situations where a quote was notprovided by the Company’s independent third-party valuation serviceprovider and as a result the price was stale or had been replaced with abroker quote where the inputs had not been corroborated to be marketobservable resulting in the security being classified as Level 3. Transfersinto Level 3 during 2019 also included derivatives embedded in equity-indexed universal life contracts due to refinements in the valuation modelingresulting in an increase in significance of non-market observable inputs.
Transfers out of Level 3 during the three months and nine monthsended September 30, 2019 and 2018 included situations where a brokerquote was used in the prior period and a quote became available from theCompany’s independent third-party valuation service provider in the currentperiod. A quote utilizing the new pricing source was not available as of theprior period, and any gains or losses related to the change in valuationsource for individual securities were not significant.
Valuation changes included in net income for Level 3 assets and liabilities held as of September 30,
($ in millions)
Three months ended September
30, Nine months ended September
30,
2019 2018 2019 2018
Assets
Equity securities $ 11 $ 8 $ 25 $ 23
Free-standing derivatives, net — — (1) —
Total recurring Level 3 assets $ 11 $ 8 $ 24 $ 23
Liabilities
Contractholder funds: Derivatives embedded in life and annuity contracts $ (14) $ (7) $ (54) $ 17
Total recurring Level 3 liabilities (14) (7) (54) 17
Total included in net income $ (3) $ 1 $ (30) $ 40
Components of net income
Net investment income $ 5 $ — $ 10 $ —
Realized capital gains and losses 6 8 14 23
Life contract benefits (1) 2 2 7
Interest credited to contractholder funds (13) (9) (56) 10
Total included in net income $ (3) $ 1 $ (30) $ 40
36 www.allstate.com

Notes to Condensed Consolidated Financial Statements
Financial assets
Carrying values and fair value estimates of financial instruments not carried at fair value
($ in millions)
September 30, 2019 December 31, 2018
Fair value level Carrying
value Fairvalue
Carryingvalue
Fairvalue
Mortgage loans Level 3 $ 4,694 $ 4,876 $ 4,670 $ 4,703
Bank loans Level 3 1,223 1,199 1,350 1,298
Agent loans Level 3 663 666 620 617
Financial liabilities
Carrying values and fair value estimates of financial instruments not carried at fair value
($ in millions)
September 30, 2019 December 31, 2018
Fair value level Carrying
value Fairvalue
Carryingvalue
Fairvalue
Contractholder funds on investment contracts Level 3 $ 8,619 $ 9,435 $ 9,250 $ 9,665
Long-term debt Level 2 6,630 7,710 6,451 6,708
Liability for collateral Level 2 2,087 2,087 1,458 1,458
Note 7 Derivative Financial InstrumentsThe Company uses derivatives for risk reduction and to increase
investment portfolio returns through asset replication. Risk reduction activityis focused on managing the risks with certain assets and liabilities arisingfrom the potential adverse impacts from changes in risk-free interest rates,changes in equity market valuations, increases in credit spreads and foreigncurrency fluctuations.
Asset replication refers to the “synthetic” creation of assets through theuse of derivatives. The Company replicates fixed income securities using acombination of a credit default swap, index total return swap, or a foreigncurrency forward contract and one or more highly rated fixed incomesecurities, primarily investment grade host bonds, to synthetically replicatethe economic characteristics of one or more cash market securities. TheCompany replicates equity securities using futures, index total return swaps,and options to increase equity exposure.
Property-Liability may use interest rate swaps, swaptions, futures andoptions to manage the interest rate risks of existing investments. Theseinstruments are utilized to change the duration of the portfolio in order tooffset the economic effect that interest rates would otherwise have on thefair value of its fixed income securities. Fixed income index total returnswaps are used to offset valuation losses in the fixed income portfolio duringperiods of declining market values. Credit default swaps are typically usedto mitigate the credit risk within the Property-Liability fixed income portfolio.Equity index total return swaps, futures and options are used by Property-Liability to offset valuation losses in the equity portfolio during periods ofdeclining equity market values. In addition, equity futures are used to hedgethe market risk related to deferred compensation liability contracts. Forwardcontracts are primarily used by Property-Liability to hedge foreign currencyrisk associated with holding foreign currency denominated investments andforeign operations.
Asset-liability management is a risk management strategy that isprincipally employed by Allstate Life and Allstate Annuities to balance therespective interest-rate sensitivities of its assets and liabilities. Dependingupon the attributes of the assets acquired and liabilities issued, derivativeinstruments such as interest rate swaps, caps, swaptions and futures areutilized to change the interest rate characteristics of existing assets andliabilities to ensure the relationship is maintained within specified ranges andto reduce exposure to rising or falling interest rates. Fixed income index totalreturn swaps are used to offset valuation losses in the portfolio duringperiods of declining market values. Credit default swaps are typically usedto mitigate the credit risk within the Allstate Life and Allstate Annuities fixedincome portfolios. Futures and options are used for hedging the equityexposure contained in equity indexed life and annuity product contracts thatoffer equity returns to contractholders. In addition, the Company uses equityindex total return swaps, options and futures to offset valuation losses in theequity portfolio during periods of declining equity market values. Foreigncurrency swaps and forwards are primarily used to reduce the foreigncurrency risk associated with holding foreign currency denominatedinvestments.
The Company also has derivatives embedded in non-derivative hostcontracts that are required to be separated from the host contracts andaccounted for at fair value with changes in fair value of embeddedderivatives reported in net income. The Company’s primary embeddedderivatives are equity options in life and annuity product contracts, whichprovide returns linked to equity indices to contractholders.
When derivatives meet specific criteria, they may be designated asaccounting hedges and accounted for as fair value, cash flow, foreigncurrency fair value or foreign currency cash flow hedges. The Companydesignates certain investment risk transfer reinsurance agreements as fairvalue hedges when the hedging instrument is highly effective in offsettingthe risk of
Third Quarter 2019 Form 10-Q 37

Notes to Condensed Consolidated Financial Statements
changes in the fair value of the hedged item. The fair value of hedgedliability is reported in contractholder funds in the Condensed ConsolidatedStatements of Financial Position. The impact from results of the fair valuehedge is reported in interest credited to contractholder funds in theCondensed Consolidated Statements of Operations.
The notional amounts specified in the contracts are used to calculatethe exchange of contractual payments under the agreements and aregenerally not representative of the potential for gain or loss on theseagreements. However, the notional amounts specified in credit defaultswaps where the Company has sold credit protection represent themaximum amount of potential loss, assuming no recoveries.
Fair value, which is equal to the carrying value, is the estimated amountthat the Company would receive or pay to terminate the derivative contractsat the reporting date. The carrying value amounts for OTC derivatives arefurther adjusted for the effects, if any, of enforceable master nettingagreements and are presented on a net basis, by counterparty agreement,in the Condensed Consolidated Statements of Financial Position.
For those derivatives which qualify and have been designated as fairvalue accounting hedges, net income includes the changes in the fair valueof both the derivative instrument and the hedged risk, and therefore reflectsany hedging ineffectiveness. Non-hedge accounting is generally used for“portfolio” level hedging strategies where the terms of the individual hedgeditems do not meet the strict homogeneity requirements to permit theapplication of hedge accounting. For non-hedge derivatives, net incomeincludes changes in fair value and accrued periodic settlements, whenapplicable. With the exception of non-hedge derivatives used for assetreplication and non-hedge embedded derivatives, all of the Company’sderivatives are evaluated for their ongoing effectiveness as eitheraccounting hedge or non-hedge derivative financial instruments on at least aquarterly basis.
Fair value hedges The Company had one derivative used in fair valuehedging relationships and had no foreign currency contracts designated asfair value hedges for the three and nine months ended September 30, 2019and 2018.
Cash flow hedges The Company had no derivatives used in cash flowhedging relationships for the three months ended September 30, 2019 andSeptember 30, 2018. The Company had no foreign currency contractsdesignated as cash flow hedges during the nine months endedSeptember 30, 2019 and one foreign currency contract designated as acash flow hedge during the nine months ended September 30, 2018.
38 www.allstate.com

Notes to Condensed Consolidated Financial Statements
Summary of the volume and fair value positions of derivative instruments as of September 30, 2019
($ in millions, except number of contracts)
Volume (1)
Balance sheet location Notionalamount
Number ofcontracts
Fairvalue, net
Grossasset
Grossliability
Asset derivatives
Derivatives designated as fair value accounting hedging instruments
Other Other assets $ 2 n/a $ — $ — $ —
Derivatives not designated as accounting hedging instruments
Interest rate contracts
Interest rate cap agreements Other investments 21 n/a — — —
Futures Other assets — 2,674 — — —
Equity and index contracts
Options Other investments — 9,290 131 131 —
Futures Other assets — 1,607 1 1 —
Total return index contracts
Total return swap agreements – fixed income Other investments 7 n/a — — —
Total return swap agreements – equity index Other investments 170 n/a 3 3 —
Foreign currency contracts
Foreign currency forwards Other investments 291 n/a 19 20 (1)
Credit default contracts
Credit default swaps – buying protection Other investments 149 n/a (4) — (4)
Credit default swaps – selling protection Other investments 5 n/a — — —
Subtotal 643 13,571 150 155 (5)
Total asset derivatives $ 645 13,571 $ 150 $ 155 $ (5)
Liability derivatives
Derivatives not designated as accounting hedging instruments
Interest rate contracts
Interest rate cap agreements Other liabilities & accrued expenses $ 14 n/a $ — $ — $ —
Futures Other liabilities & accrued expenses — 2,915 — — —
Equity and index contracts
Options Other liabilities & accrued expenses — 9,016 (52) — (52)
Futures Other liabilities & accrued expenses — 1,383 (1) — (1)
Total return index contracts
Total return swap agreements – fixed income Other liabilities & accrued expenses 228 n/a 8 8 —
Foreign currency contracts
Foreign currency forwards Other liabilities & accrued expenses 396 n/a 23 24 (1)
Embedded derivative financial instruments
Guaranteed accumulation benefits Contractholder funds 161 n/a (21) — (21)
Guaranteed withdrawal benefits Contractholder funds 205 n/a (16) — (16)Equity-indexed and forward starting options in life andannuity product contracts Contractholder funds 1,782 n/a (417) — (417)
Credit default contracts
Credit default swaps – buying protection Other liabilities & accrued expenses 46 n/a (1) — (1)
Credit default swaps – selling protection Other liabilities & accrued expenses 4 n/a — — —
Total liability derivatives 2,836 13,314 (477) $ 32 $ (509)
Total derivatives $ 3,481 26,885 $ (327) (1) Volume for OTC and cleared derivative contracts is represented by their notional amounts. Volume for exchange traded derivatives is represented by the number of contracts,
which is the basis on which they are traded. (n/a = not applicable)
Third Quarter 2019 Form 10-Q 39
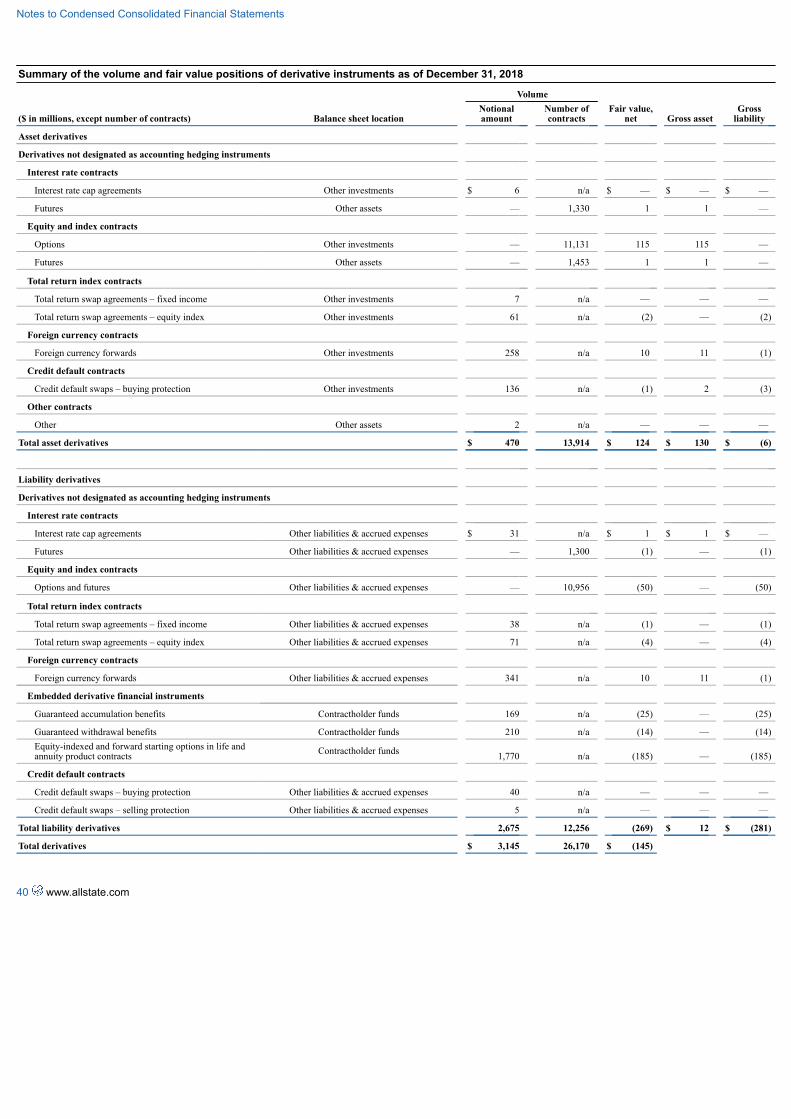
Notes to Condensed Consolidated Financial Statements
Summary of the volume and fair value positions of derivative instruments as of December 31, 2018
($ in millions, except number of contracts)
Volume
Balance sheet location Notionalamount
Number ofcontracts
Fair value,net Gross asset
Grossliability
Asset derivatives
Derivatives not designated as accounting hedging instruments
Interest rate contracts
Interest rate cap agreements Other investments $ 6 n/a $ — $ — $ —
Futures Other assets — 1,330 1 1 —
Equity and index contracts
Options Other investments — 11,131 115 115 —
Futures Other assets — 1,453 1 1 —
Total return index contracts
Total return swap agreements – fixed income Other investments 7 n/a — — —
Total return swap agreements – equity index Other investments 61 n/a (2) — (2)
Foreign currency contracts
Foreign currency forwards Other investments 258 n/a 10 11 (1)
Credit default contracts
Credit default swaps – buying protection Other investments 136 n/a (1) 2 (3)
Other contracts
Other Other assets 2 n/a — — —
Total asset derivatives $ 470 13,914 $ 124 $ 130 $ (6)
Liability derivatives
Derivatives not designated as accounting hedging instruments
Interest rate contracts
Interest rate cap agreements Other liabilities & accrued expenses $ 31 n/a $ 1 $ 1 $ —
Futures Other liabilities & accrued expenses — 1,300 (1) — (1)
Equity and index contracts
Options and futures Other liabilities & accrued expenses — 10,956 (50) — (50)
Total return index contracts
Total return swap agreements – fixed income Other liabilities & accrued expenses 38 n/a (1) — (1)
Total return swap agreements – equity index Other liabilities & accrued expenses 71 n/a (4) — (4)
Foreign currency contracts
Foreign currency forwards Other liabilities & accrued expenses 341 n/a 10 11 (1)
Embedded derivative financial instruments
Guaranteed accumulation benefits Contractholder funds 169 n/a (25) — (25)
Guaranteed withdrawal benefits Contractholder funds 210 n/a (14) — (14)Equity-indexed and forward starting options in life andannuity product contracts Contractholder funds 1,770 n/a (185) — (185)
Credit default contracts
Credit default swaps – buying protection Other liabilities & accrued expenses 40 n/a — — —
Credit default swaps – selling protection Other liabilities & accrued expenses 5 n/a — — —
Total liability derivatives 2,675 12,256 (269) $ 12 $ (281)
Total derivatives $ 3,145 26,170 $ (145)
40 www.allstate.com

Notes to Condensed Consolidated Financial Statements
Gross and net amounts for OTC derivatives (1)
($ in millions)
Offsets
Gross amount Counter-party
netting Cash collateral
(received) pledged Net amount onbalance sheet
Securitiescollateral
(received) pledged Net amount
September 30, 2019
Asset derivatives $ 55 $ (37) $ (15) $ 3 $ — $ 3
Liability derivatives (7) 37 (32) (2) — (2)
December 31, 2018
Asset derivatives $ 25 $ (18) $ (5) $ 2 $ — $ 2
Liability derivatives (12) 18 (12) (6) — (6)
(1) All OTC derivatives are subject to enforceable master netting agreements.
Gains (losses) from valuation and settlements reported on derivatives not designated as accounting hedges
($ in millions) Realized capital
gains (losses) Life contract
benefits Interest credited to
contractholder funds Operating costs
and expenses Total gain (loss)
recognized in netincome on derivatives
Three months ended September 30, 2019
Interest rate contracts $ 32 $ — $ — $ — $ 32
Equity and index contracts (10) — 4 (1) (7)
Embedded derivative financial instruments — (1) (16) — (17)
Foreign currency contracts 21 — — — 21
Credit default contracts (1) — — — (1)
Total return swaps - fixed income 1 — — — 1
Total return swaps - equity index (3) — — — (3)
Total $ 40 $ (1) $ (12) $ (1) $ 26
Nine months ended September 30, 2019
Interest rate contracts $ 58 $ — $ — $ — $ 58
Equity and index contracts (98) — 46 25 (27)
Embedded derivative financial instruments — 2 (57) — (55)
Foreign currency contracts 31 — — — 31
Credit default contracts (6) — — — (6)
Total return swaps - fixed income 11 — — — 11
Total return swaps - equity index 20 — — — 20
Total $ 16 $ 2 $ (11) $ 25 $ 32
Three months ended September 30, 2018
Interest rate contracts $ (1) $ — $ — $ — $ (1)
Equity and index contracts (12) — 19 9 16
Embedded derivative financial instruments — 2 (8) — (6)
Foreign currency contracts 7 — — — 7
Total return swaps 11 — — — 11
Total $ 5 $ 2 $ 11 $ 9 $ 27
Nine months ended September 30, 2018
Equity and index contracts $ (15) $ — $ 25 $ 12 $ 22
Embedded derivative financial instruments — 7 13 — 20
Foreign currency contracts 19 — — (1) 18
Total return swaps 12 — — — 12
Credit default contracts 1 — — — 1
Total $ 17 $ 7 $ 38 $ 11 $ 73
Third Quarter 2019 Form 10-Q 41

Notes to Condensed Consolidated Financial Statements
The Company manages its exposure to credit risk by utilizing highlyrated counterparties, establishing risk control limits, executing legallyenforceable master netting agreements (“MNAs”) and obtaining collateralwhere appropriate. The Company uses MNAs for OTC derivativetransactions that permit either party to net payments due for transactionsand collateral is either pledged or obtained when certain predeterminedexposure limits are exceeded. As of September 30, 2019, counterpartiespledged $48 million in collateral to the Company, and the Company pledged$1 million in collateral to counterparties under MNAs for contracts withoutcredit-risk-contingent features.
The Company has not incurred any losses on derivative financialinstruments due to counterparty nonperformance. Other derivatives,including futures and certain option contracts, are traded on organizedexchanges which require margin deposits and guarantee the execution oftrades, thereby mitigating any potential credit risk.
Counterparty credit exposure represents the Company’s potential loss ifall of the counterparties concurrently fail to perform under the contractualterms of the contracts and all collateral, if any, becomes worthless. Thisexposure is measured by the fair value of OTC derivative contracts with apositive fair value at the reporting date reduced by the effect, if any, oflegally enforceable master netting agreements.
OTC derivatives counterparty credit exposure by counterparty credit rating
($ in millions) September 30, 2019 December 31, 2018
Rating (1) Number of
counter-parties
Notionalamount (2)
Creditexposure (2)
Exposure, net ofcollateral (2)
Number ofcounter-parties
Notionalamount (2)
Creditexposure (2)
Exposure, net ofcollateral (2)
A+ 6 $ 1,152 $ 46 $ 3 3 $ 643 $ 19 $ 1
A 1 112 3 — 2 121 1 —
Total 7 $ 1,264 $ 49 $ 3 5 $ 764 $ 20 $ 1(1) Allstate uses the lower of S&P’s or Moody’s long-term debt issuer ratings.(2) Only OTC derivatives with a net positive fair value are included for each counterparty.
For certain exchange traded and cleared derivatives, margin depositsare required as well as daily cash settlements of margin accounts. As ofSeptember 30, 2019, the Company pledged $50 million in the form ofmargin deposits.
Market risk is the risk that the Company will incur losses due to adversechanges in market rates and prices. Market risk exists for all of thederivative financial instruments the Company currently holds, as theseinstruments may become less valuable due to adverse changes in marketconditions. To limit this risk, the Company’s senior management hasestablished risk control limits. In addition, changes in fair value of thederivative financial instruments that the Company uses for risk managementpurposes are generally offset by the change in the fair value or cash flows ofthe hedged risk component of the related assets, liabilities or forecastedtransactions.
Certain of the Company’s derivative instruments contain credit-risk-contingent termination events, cross-default provisions and credit supportannex agreements. Credit-risk-contingent termination
events allow the counterparties to terminate the derivative agreement or aspecific trade on certain dates if AIC’s, ALIC’s or Allstate Life InsuranceCompany of New York’s (“ALNY”) financial strength credit ratings byMoody’s or S&P fall below a certain level. Credit-risk-contingent cross-default provisions allow the counterparties to terminate the derivativeagreement if the Company defaults by pre-determined threshold amountson certain debt instruments. Credit-risk-contingent credit support annexagreements specify the amount of collateral the Company must post tocounterparties based on AIC’s, ALIC’s or ALNY’s financial strength creditratings by Moody’s or S&P, or in the event AIC, ALIC or ALNY are no longerrated by either Moody’s or S&P.
The following summarizes the fair value of derivative instruments withtermination, cross-default or collateral credit-risk-contingent features that arein a liability position, as well as the fair value of assets and collateral that arenetted against the liability in accordance with provisions within legallyenforceable MNAs.
($ in millions) As of September 30, 2019 As of December 31, 2018
Gross liability fair value of contracts containing credit-risk-contingent features $ 7 $ 11
Gross asset fair value of contracts containing credit-risk-contingent features and subject toMNAs (7) (5)
Collateral posted under MNAs for contracts containing credit-risk-contingent features — (2)
Maximum amount of additional exposure for contracts with credit-risk-contingentfeatures if all features were triggered concurrently $ — $ 4
42 www.allstate.com

Notes to Condensed Consolidated Financial Statements
Note 8 Reserve for Property and Casualty Insurance Claims and Claims ExpenseThe Company establishes reserves for claims and claims expense on
reported and unreported claims of insured losses. The Company’s reservingprocess takes into account known facts and interpretations of circumstancesand factors including the Company’s experience with similar cases, actualclaims paid, historical trends involving claim payment patterns and pendinglevels of unpaid claims, loss management programs, product mix andcontractual terms, changes in law and regulation, judicial decisions, andeconomic conditions. In the normal course of business, the Company mayalso supplement its claims processes by utilizing third-party adjusters,appraisers, engineers, inspectors, and other professionals and informationsources to assess and settle catastrophe and non-catastrophe relatedclaims. The effects of inflation are implicitly considered in the reservingprocess.
Because reserves are estimates of unpaid portions of losses that haveoccurred, including incurred but not reported (“IBNR”) losses, theestablishment of appropriate reserves, including reserves for catastrophes,Discontinued Lines and Coverages and reinsurance and indemnificationrecoverables, is an inherently uncertain and complex process. The ultimatecost of losses may vary materially from recorded amounts, which are basedon management’s best estimates. The highest degree of uncertainty isassociated with reserves for losses incurred in the
current reporting period as it contains the greatest proportion of losses thathave not been reported or settled. The Company regularly updates itsreserve estimates as new information becomes available and as eventsunfold that may affect the resolution of unsettled claims. Changes in prioryear reserve estimates, which may be material, are reported in property andcasualty insurance claims and claims expense in the CondensedConsolidated Statements of Operations in the period such changes aredetermined.
Management believes that the reserve for property and casualtyinsurance claims and claims expense, net of recoverables, is appropriatelyestablished in the aggregate and adequate to cover the ultimate net cost ofreported and unreported claims arising from losses which had occurred bythe date of the Condensed Consolidated Statements of Financial Positionbased on available facts, technology, laws and regulations.
Allstate’s reserves for asbestos claims were $840 million and $866million, net of recoverables of $387 million and $400 million, as ofSeptember 30, 2019 and December 31, 2018, respectively. Reserves forenvironmental claims were $188 million and $170 million, net ofrecoverables of $42 million and $39 million, as of September 30, 2019 andDecember 31, 2018, respectively.
Rollforward of the reserve for property and casualty insurance claims and claims expense Nine months ended September 30,($ in millions)
2019 2018
Balance as of January 1 $ 27,423 $ 26,325
Less recoverables (1) (7,155) (6,471)
Net balance as of January 1 20,268 19,854
Incurred claims and claims expense related to: Current year 18,345 16,846
Prior years (118) (135)
Total incurred 18,227 16,711
Claims and claims expense paid related to: Current year (10,640) (10,077)
Prior years (6,872) (6,174)
Total paid (17,512) (16,251)
Net balance as of September 30 20,983 20,314
Plus recoverables 7,093 6,625
Balance as of September 30 $ 28,076 $ 26,939
(1) Recoverables comprises reinsurance and indemnification recoverables.Incurred claims and claims expense represents the sum of paid losses
and reserve changes in the period. This expense included losses fromcatastrophes of $2.26 billion and $1.89 billion in the nine months endedSeptember 30, 2019 and 2018, respectively, net of recoverables.
Catastrophes are an inherent risk of the property and casualtyinsurance business that have contributed to, and will continue to contributeto, material year-to-year fluctuations in the Company’s results of operationsand financial position.
Third Quarter 2019 Form 10-Q 43

Notes to Condensed Consolidated Financial Statements
Prior year reserve reestimates included in claims and claims expense (1) Nine months ended September 30,
($ in millions) Non-catastrophes Catastrophes Total
2019 2018 2019 (2) 2018 2019 2018
Auto (3) $ (302) $ (319) $ (9) $ (37) $ (311) $ (356)
Homeowners — (38) 59 84 59 46
Other personal lines 13 (13) 4 (2) 17 (15)
Commercial lines 18 107 (1) — 17 107
Discontinued Lines and Coverages (4) 103 85 — — 103 85
Service Businesses (3) (2) — — (3) (2)
Total prior year reserve reestimates $ (171) $ (180) $ 53 $ 45 $ (118) $ (135)(1) Favorable reserve reestimates are shown in parentheses.(2) Includes $13 million of reinstatement reinsurance premiums incurred during the period related to the 2018 Camp Fire, which primarily impacted homeowners reestimates.(3) Non-catastrophe results related to continued favorable personal lines auto injury coverage development.(4) The Company’s 2019 annual reserve review, using established industry and actuarial best practices, resulted in unfavorable reestimates of $95 million.
Note 9 Reinsurance
Effects of reinsurance ceded on property and casualty premiums earned and life premiums and contract charges
($ in millions)
Three months ended September
30, Nine months ended September
30,
2019 2018 2019 2018
Property and casualty insurance premiums earned $ (289) $ (260) $ (836) $ (756)
Life premiums and contract charges (68) (76) (200) (221)
Effects of reinsurance ceded on property and casualty insurance claims and claims expense, life contract benefits and interest credited to contractholder funds
($ in millions)
Three months ended September
30, Nine months ended September
30,
2019 2018 2019 2018
Property and casualty insurance claims and claims expense $ (216) $ (247) $ (465) $ (572)
Life contract benefits (74) (35) (92) (150)
Interest credited to contractholder funds (6) (5) (14) (16)
Reinsurance Recoverables As of September 30, 2019, the Companyhad $9.36 billion of reinsurance and indemnification recoverables, including$781 million of reinsurance recoverables for its life insurance business. Ofthe $781 million, the Company had $64 million of reinsurance recoverables,net of an allowance for estimated uncollectible amounts, related to ScottishRe (U.S.), Inc. On December 14, 2018, the Delaware InsuranceCommissioner placed Scottish Re (U.S.), Inc. under regulatory supervision. On March 6, 2019, the Chancery Court of the State of Delaware entered aRehabilitation and Injunction Order (the “Rehabilitation Order”) in responseto a petition filed by the Insurance Commissioner (the “Petition”). Pursuantto the Petition, it is expected that Scottish Re (U.S.), Inc. will submit a Planof Rehabilitation. The Company joined in
a joint motion filed on behalf of several affected parties asking the court toallow a specified amount of offsetting claim payments and losses againstpremiums remitted to Scottish Re (U.S.), Inc. The Company also filed aseparate motion related to the reimbursement of claim payments whereScottish Re (U.S.), Inc. is also acting as administrator. The Court has not yetruled on either of these motions. In the interim, the Company and severalother affected parties have been permitted to exercise certain setoff rightswhile the parties address any potential disputes.
The Company continues to monitor Scottish Re (U.S.), Inc. for futuredevelopments and will reevaluate its allowance for uncollectible amounts asnew information becomes available.
Note 10 Capital StructureIssuance of preferred stock On August 8, 2019, the Company issued
46,000 shares of 5.100% Fixed Rate Noncumulative Perpetual PreferredStock, Series H, par value $1.00 per share and liquidation preference$25,000 per share, for gross proceeds of $1.15 billion. The preferred stockis perpetual and has no maturity date. The preferred stock is redeemable atthe
Company’s option in whole or in part, on or after October 15, 2024, at aredemption price of $25,000 per share, plus declared and unpaid dividends.Prior to October 15, 2024, the preferred stock is redeemable at theCompany’s option, in whole but not in part, within 90 days of the occurrenceof a certain regulatory capital event at a redemption price equal to $25,000
44 www.allstate.com

Notes to Condensed Consolidated Financial Statements
per share or a certain rating agency event at a redemption price equal to$25,500 per share, plus declared and unpaid dividends.
Issuance of debt On June 10, 2019, the Company issued $500 millionof 3.850% Senior Notes due 2049. Interest on the Senior Notes is payablesemi-annually in arrears on February 10 and August 10 of each year,beginning on February 10, 2020. The Senior Notes are redeemable at anytime at the applicable redemption price prior to the maturity date. Theproceeds of this issuance will be used for general corporate purposes.
Repayment of debt On May 16, 2019, the Company repaid $317million of 7.450% Senior Notes, Series B, at maturity.
Subsequent event On October 15, 2019, the Company redeemed all5,400 shares of its Fixed Rate Noncumulative Perpetual Preferred Stock,Series D, par
value $1.00 per share and liquidation preference $25,000 per share, all29,900 shares of its Fixed Rate Noncumulative Perpetual Preferred Stock,Series E, par value $1.00 per share and liquidation preference $25,000 pershare, all 10,000 shares of its Fixed Rate Noncumulative PerpetualPreferred Stock, Series F, par value $1.00 per share and liquidationpreference $25,000 per share, and the corresponding depositary shares.The total redemption payment was $1.13 billion, using the proceeds fromthe issuance of the Fixed Rate Noncumulative Perpetual Preferred Stock,Series H. In the fourth quarter of 2019, the Company will recognize $37million of original issuance costs in preferred stock dividends on theConsolidated Statements of Operations and Consolidated Statements ofShareholders’ Equity as a result of the preferred stock redemptions.
Note 11 Company RestructuringThe Company undertakes various programs to reduce expenses.
These programs generally involve a reduction in staffing levels, and incertain cases, office closures. Restructuring and related charges primarilyinclude the following costs related to these programs:
• Employee - severance and relocation benefits
• Exit - contract termination penalties
The expenses related to these activities are included in the CondensedConsolidated Statements of Operations as restructuring and related chargesand totaled zero and $13 million during the three months endedSeptember 30, 2019 and 2018, respectively, and $27 million and $55 millionduring the nine months ended September 30, 2019 and 2018, respectively.Restructuring expenses in 2019 primarily related to realignment of certainemployees to centralized talent centers.
Restructuring activity during the period
($ in millions) Employee
costs Exitcosts
Totalliability
Restructuring liability as of December 31, 2018 $ 29 $ 15 $ 44
Expense incurred 31 3 34
Adjustments to liability (7) — (7)
Payments (37) (7) (44)
Restructuring liability as of September 30, 2019 $ 16 $ 11 $ 27
As of September 30, 2019, the cumulative amount incurred to date for active programs related to employee severance, relocation benefits and exitexpenses totaled $102 million for employee costs and $10 million for exit costs.
Note 12 Guarantees and Contingent LiabilitiesShared markets and state facility assessments
The Company is required to participate in assigned risk plans,reinsurance facilities and joint underwriting associations in various statesthat provide insurance coverage to individuals or entities that otherwise areunable to purchase such coverage from private insurers.
The Company routinely reviews its exposure to assessments fromthese plans, facilities and government programs. Underwriting resultsrelated to these arrangements, which tend to be adverse, have beenimmaterial to the Company’s results of operations. Because of theCompany’s participation, it may be exposed to losses that surpass thecapitalization of these facilities and/or assessments from these facilities.
Guarantees
Related to the sale of Lincoln Benefit Life Company on April 1, 2014,ALIC agreed to indemnify Resolution Life Holdings, Inc. in connection withcertain representations, warranties and covenants of ALIC, and certainliabilities specifically excluded from the transaction, subject to specificcontractual limitations regarding ALIC’s maximum obligation. Managementdoes not believe these indemnifications will have a material effect on resultsof operations, cash flows or financial position of the Company.
Related to the disposal through reinsurance of substantially all of itsvariable annuity business to Prudential in 2006, the Company and itsconsolidated subsidiaries, ALIC and ALNY, have agreed to indemnifyPrudential for certain pre-closing contingent liabilities (including extra-contractual liabilities of ALIC and ALNY
Third Quarter 2019 Form 10-Q 45

Notes to Condensed Consolidated Financial Statements
and liabilities specifically excluded from the transaction) that ALIC andALNY have agreed to retain. In addition, the Company, ALIC and ALNY willeach indemnify Prudential for certain post-closing liabilities that may arisefrom the acts of ALIC, ALNY and their agents, including certain liabilitiesarising from ALIC’s and ALNY’s provision of transition services. Thereinsurance agreements contain no limitations or indemnifications withregard to insurance risk transfer and transferred all of the future risks andresponsibilities for performance on the underlying variable annuity contractsto Prudential, including those related to benefit guarantees. Managementdoes not believe this agreement will have a material effect on results ofoperations, cash flows or financial position of the Company.
In the normal course of business, the Company provides standardindemnifications to contractual counterparties in connection with numeroustransactions, including acquisitions and divestitures. The types ofindemnifications typically provided include indemnifications for breaches ofrepresentations and warranties, taxes and certain other liabilities, such asthird-party lawsuits. The indemnification clauses are often standardcontractual terms and are entered into in the normal course of businessbased on an assessment that the risk of loss would be remote. The terms ofthe indemnifications vary in duration and nature. In many cases, themaximum obligation is not explicitly stated and the contingencies triggeringthe obligation to indemnify have not occurred and are not expected to occur.Consequently, the maximum amount of the obligation under suchindemnifications is not determinable. Historically, the Company has notmade any material payments pursuant to these obligations.
The aggregate liability balance related to all guarantees was notmaterial as of September 30, 2019.
Regulation and compliance
The Company is subject to extensive laws, regulations, administrativedirectives, and regulatory actions. From time to time, regulatory authoritiesor legislative bodies seek to influence and restrict premium rates, requirepremium refunds to policyholders, require reinstatement of terminatedpolicies, prescribe rules or guidelines on how affiliates compete in themarketplace, restrict the ability of insurers to cancel or non-renew policies,require insurers to continue to write new policies or limit their ability to writenew policies, limit insurers’ ability to change coverage terms or to imposeunderwriting standards, impose additional regulations regarding agency andbroker compensation, regulate the nature of and amount of investments,impose fines and penalties for unintended errors or mistakes, imposeadditional regulations regarding cybersecurity and privacy, and otherwiseexpand overall regulation of insurance products and the insurance industry.In addition, the Company is subject to laws and regulations administeredand enforced by federal agencies, international agencies, and otherorganizations, including but not limited to the Securities and ExchangeCommission (“SEC”), the
Financial Industry Regulatory Authority, the U.S. Equal EmploymentOpportunity Commission, and the U.S. Department of Justice. TheCompany has established procedures and policies to facilitate compliancewith laws and regulations, to foster prudent business operations, and tosupport financial reporting. The Company routinely reviews its practices tovalidate compliance with laws and regulations and with internal proceduresand policies. As a result of these reviews, from time to time the Companymay decide to modify some of its procedures and policies. Suchmodifications, and the reviews that led to them, may be accompanied bypayments being made and costs being incurred. The ultimate changes andeventual effects of these actions on the Company’s business, if any, areuncertain.
Legal and regulatory proceedings and inquiries
The Company and certain subsidiaries are involved in a number oflawsuits, regulatory inquiries, and other legal proceedings arising out ofvarious aspects of its business.
Background These matters raise difficult and complicated factual andlegal issues and are subject to many uncertainties and complexities,including the underlying facts of each matter; novel legal issues; variationsbetween jurisdictions in which matters are being litigated, heard, orinvestigated; changes in assigned judges; differences or developments inapplicable laws and judicial interpretations; judges reconsidering priorrulings; the length of time before many of these matters might be resolvedby settlement, through litigation, or otherwise; adjustments with respect toanticipated trial schedules and other proceedings; developments in similaractions against other companies; the fact that some of the lawsuits areputative class actions in which a class has not been certified and in whichthe purported class may not be clearly defined; the fact that some of thelawsuits involve multi-state class actions in which the applicable law(s) forthe claims at issue is in dispute and therefore unclear; and the challenginglegal environment faced by corporations and insurance companies.
The outcome of these matters may be affected by decisions, verdicts,and settlements, and the timing of such decisions, verdicts, and settlements,in other individual and class action lawsuits that involve the Company, otherinsurers, or other entities and by other legal, governmental, and regulatoryactions that involve the Company, other insurers, or other entities. Theoutcome may also be affected by future state or federal legislation, thetiming or substance of which cannot be predicted.
In the lawsuits, plaintiffs seek a variety of remedies which may includeequitable relief in the form of injunctive and other remedies and monetaryrelief in the form of contractual and extra-contractual damages. In somecases, the monetary damages sought may include punitive or trebledamages. Often specific information about the relief sought, such as theamount of damages, is not available because plaintiffs have not requestedspecific relief in their
46 www.allstate.com

Notes to Condensed Consolidated Financial Statements
pleadings. When specific monetary demands are made, they are often setjust below a state court jurisdictional limit in order to seek the maximumamount available in state court, regardless of the specifics of the case, whilestill avoiding the risk of removal to federal court. In Allstate’s experience,monetary demands in pleadings bear little relation to the ultimate loss, ifany, to the Company.
In connection with regulatory examinations and proceedings,government authorities may seek various forms of relief, including penalties,restitution, and changes in business practices. The Company may not beadvised of the nature and extent of relief sought until the final stages of theexamination or proceeding.
Accrual and disclosure policy The Company reviews its lawsuits,regulatory inquiries, and other legal proceedings on an ongoing basis andfollows appropriate accounting guidance when making accrual anddisclosure decisions. The Company establishes accruals for such matters atmanagement’s best estimate when the Company assesses that it isprobable that a loss has been incurred and the amount of the loss can bereasonably estimated. The Company does not establish accruals for suchmatters when the Company does not believe both that it is probable that aloss has been incurred and the amount of the loss can be reasonablyestimated. The Company’s assessment of whether a loss is reasonablypossible, or probable, is based on its assessment of the ultimate outcome ofthe matter following all appeals. The Company does not include potentialrecoveries in its estimates of reasonably possible or probable losses. Legalfees are expensed as incurred.
The Company continues to monitor its lawsuits, regulatory inquiries,and other legal proceedings for further developments that would make theloss contingency both probable and estimable, and accordingly accruable,or that could affect the amount of accruals that have been previouslyestablished. There may continue to be exposure to loss in excess of anyamount accrued. Disclosure of the nature and amount of an accrual is madewhen there have been sufficient legal and factual developments such thatthe Company’s ability to resolve the matter would not be impaired by thedisclosure of the amount of accrual.
When the Company assesses it is reasonably possible or probable thata loss has been incurred, it discloses the matter. When it is possible toestimate the reasonably possible loss or range of loss above the amountaccrued, if any, for the matters disclosed, that estimate is aggregated anddisclosed. Disclosure is not required when an estimate of the reasonablypossible loss or range of loss cannot be made.
For certain of the matters described below in the “Claims relatedproceedings” and “Other proceedings” subsections, the Company is able toestimate the reasonably possible loss or range of loss above the amountaccrued, if any. In determining whether it is possible to estimate thereasonably possible loss or range of loss, the Company reviews andevaluates the disclosed matters, in conjunction with counsel, in light ofpotentially relevant factual and legal developments.
These developments may include information learned through thediscovery process, rulings on dispositive motions, settlement discussions,information obtained from other sources, experience from managing theseand other matters, and other rulings by courts, arbitrators or others. Whenthe Company possesses sufficient appropriate information to develop anestimate of the reasonably possible loss or range of loss above the amountaccrued, if any, that estimate is aggregated and disclosed below. There maybe other disclosed matters for which a loss is probable or reasonablypossible, but such an estimate is not possible. Disclosure of the estimate ofthe reasonably possible loss or range of loss above the amount accrued, ifany, for any individual matter would only be considered when there havebeen sufficient legal and factual developments such that the Company’sability to resolve the matter would not be impaired by the disclosure of theindividual estimate.
The Company currently estimates that the aggregate range ofreasonably possible loss in excess of the amount accrued, if any, for thedisclosed matters where such an estimate is possible is zero to $75 million,pre-tax. This disclosure is not an indication of expected loss, if any. Underaccounting guidance, an event is “reasonably possible” if “the chance of thefuture event or events occurring is more than remote but less than likely”and an event is “remote” if “the chance of the future event or eventsoccurring is slight.” This estimate is based upon currently availableinformation and is subject to significant judgment and a variety ofassumptions, and known and unknown uncertainties. The mattersunderlying the estimate will change from time to time, and actual resultsmay vary significantly from the current estimate. The estimate does notinclude matters or losses for which an estimate is not possible. Therefore,this estimate represents an estimate of possible loss only for certain mattersmeeting these criteria. It does not represent the Company’s maximumpossible loss exposure. Information is provided below regarding the natureof all of the disclosed matters and, where specified, the amount, if any, ofplaintiff claims associated with these loss contingencies.
Due to the complexity and scope of the matters disclosed in the “Claimsrelated proceedings” and “Other proceedings” subsections below and themany uncertainties that exist, the ultimate outcome of these matters cannotbe predicted and in the Company’s judgment, a loss, in excess of amountsaccrued, if any, is not probable. In the event of an unfavorable outcome inone or more of these matters, the ultimate liability may be in excess ofamounts currently accrued, if any, and may be material to the Company’soperating results or cash flows for a particular quarterly or annual period.However, based on information currently known to it, management believesthat the ultimate outcome of all matters described below, as they areresolved over time, is not likely to have a material effect on the financialposition of the Company.
Claims related proceedings The Company is managing variousdisputes in Florida that raise challenges to the Company’s practices,processes, and
Third Quarter 2019 Form 10-Q 47

Notes to Condensed Consolidated Financial Statements
procedures relating to claims for personal injury protection benefits underFlorida auto policies. Medical providers continue to pursue litigation undervarious theories that challenge the amounts that the Company pays underthe personal injury protection benefits. There are pending putative classactions and litigation involving individual plaintiffs. The Company isvigorously asserting both procedural and substantive defenses to theselawsuits.
Other proceedings The case of Jack Jimenez, et al. v. AllstateInsurance Company was filed in the United States District Court for theCentral District of California on September 30, 2010. Plaintiffs allege off-the-clock wage and hour claims and other California Labor Code violationsresulting from purported unpaid overtime. Plaintiffs seek recovery of unpaidcompensation, liquidated damages, penalties, and attorneys’ fees andcosts. The court certified a class that includes all adjusters in the state ofCalifornia, except auto field adjusters, from September 29, 2006 to finaljudgment. Allstate’s appeals to the Ninth Circuit Court of Appeals and thento the U.S. Supreme Court did not result in decertification. As of October2019, the parties have reached an agreement to settle the case. Thesettlement agreement is subject to the court’s final approval.
The stockholder derivative actions described below are disclosedpursuant to SEC disclosure requirements for these types of matters. Theputative class action alleging violations of the federal securities laws isdisclosed because it involves similar allegations to those made in thestockholder derivative actions.
Biefeldt / IBEW Consolidated Action. Two separately filed stockholderderivative actions have been consolidated into a single proceeding that ispending in the Circuit Court for Cook County, Illinois, Chancery Division. Theoriginal complaint in the first-filed of those actions, Biefeldt v. Wilson, et al.,was filed on August 3, 2017, in that court by a plaintiff alleging that she is astockholder of the Company. On June 29, 2018, the court granteddefendants’ motion to dismiss that complaint for failure to make a pre-suitdemand on the Allstate board before instituting the suit, but granted theplaintiff permission to file an amended complaint. The original complaint inIBEW Local No. 98 Pension Fund v. Wilson, et al., was filed on April 12,2018, in the same court by another plaintiff alleging to be a stockholder ofthe Company. After the court issued its dismissal decision in the Biefeldtaction, the plaintiffs agreed to consolidate the two actions and filed aconsolidated amended complaint naming the Company’s chairman,president and chief executive officer, its former president, and certainpresent or former members of the board of directors. In that complaint, theplaintiffs allege that the directors and officer defendants breached theirfiduciary duties to the Company in connection with allegedly materialmisstatements or omissions concerning the Company’s automobileinsurance claim frequency statistics and the reasons for a claim frequencyincrease for Allstate brand auto insurance between October 2014 andAugust 3, 2015. The factual allegations are substantially similar to those atissue in In re The
Allstate Corp. Securities Litigation. The plaintiffs further allege that a seniorofficer and several outside directors engaged in stock option exercisesallegedly while in possession of material nonpublic information. The plaintiffsseek, on behalf of the Company, an unspecified amount of damages andvarious forms of equitable relief. Defendants moved to dismiss theconsolidated complaint on September 24, 2018 for failure to make ademand on the Allstate board. On May 14, 2019, the court granted thedefendants’ motion to dismiss the complaint, but allowed the plaintiffs leaveto file a second consolidated amended complaint by June 11, 2019. OnJune 3, 2019, the plaintiffs filed a motion to stay the action, or in thealternative defer the filing of the second consolidated amended complaint, toallow the plaintiffs to conduct an inspection of the Company’s books andrecords. The parties reached a compromise by which the Companyproduced certain board materials and the deadline for the plaintiffs to file thesecond consolidated amended complaint was extended.
In Sundquist v. Wilson, et al., another plaintiff alleging to be astockholder of the Company filed a stockholder derivative complaint in theUnited States District Court for the Northern District of Illinois on May 21,2018. The plaintiff seeks, on behalf of the Company, an unspecified amountof damages and various forms of equitable relief. The complaint names asdefendants the Company’s chairman, president and chief executive officer,its former president, its former chief financial officer, who is now theCompany’s vice chairman, and certain present or former members of theboard of directors.
The complaint alleges breaches of fiduciary duty based on allegationssimilar to those asserted in In re The Allstate Corp. Securities Litigation aswell as state law “misappropriation” claims based on stock optiontransactions by the Company’s chairman, president and chief executiveofficer, its former chief financial officer, who is now the Company’s vicechairman, and certain members of the board of directors. Defendantsmoved to dismiss and/or stay the complaint on August 7, 2018. OnDecember 4, 2018, the court granted the defendants’ motion and stayed thecase pending the resolution of the consolidated Biefeldt/IBEW matter.
In re The Allstate Corp. Securities Litigation is a certified class actionfiled on November 11, 2016 in the United States District Court for theNorthern District of Illinois against the Company and two of its officersasserting claims under the federal securities laws. Plaintiffs allege that theypurchased Allstate common stock during the class period and suffereddamages as the result of the conduct alleged. Plaintiffs seek an unspecifiedamount of damages, costs, attorney’s fees, and other relief as the courtdeems appropriate. Plaintiffs allege that the Company and certain seniorofficers made allegedly material misstatements or omissions concerningclaim frequency statistics and the reasons for a claim frequency increase forAllstate brand auto insurance between October 2014 and August 3, 2015.
Plaintiffs’ further allege that a senior officer engaged in stock optionexercises during that time
48 www.allstate.com

Notes to Condensed Consolidated Financial Statements
allegedly while in possession of material nonpublic information aboutAllstate brand auto insurance claim frequency. The Company, its chairman,president and chief executive officer, and its former president are the nameddefendants. After the court denied their motion to dismiss on February 27,2018, defendants answered the complaint, denying plaintiffs’ allegations thatthere was any misstatement or omission or other misconduct. On June 22,2018, plaintiffs filed their motion for class certification, which was fullybriefed as of January 11, 2019. On September 12, 2018, the court allowedthe lead plaintiffs to amend their complaint to add the City of ProvidenceEmployee Retirement System as a proposed class representative.
The amended complaint was filed the same day. On March 26, 2019,the court granted plaintiffs’ motion for class certification and certified a classconsisting of all persons who purchased Allstate common stock betweenOctober 29, 2014 and August 3, 2015. On April 9, 2019, defendants filedwith the Seventh Circuit Court of Appeals a petition for permission to appealthis ruling pursuant to Federal Rule of Civil Procedure 23 (f) and the Court ofAppeals granted that petition on April 25, 2019. The appeal was fully briefedas of July 31, 2019, and the Seven Circuit Court of Appeals heard oralargument on September 18, 2019.
Note 13 Benefit PlansChange in accounting principle
As discussed in Note 1, the Company changed its accounting principlefor recognizing actuarial gains and losses and expected return on planassets for its pension and other postretirement plans to a more preferablepolicy under U.S. GAAP. Under the new principle, remeasurement ofprojected benefit obligation and plan assets are immediately recognizedthrough earnings and are referred to as pension and
other postretirement remeasurement gains and losses on the CondensedConsolidated Statements of Operations. This change has been applied on aretrospective basis. See Note 1 for further information regarding the impactof the change in accounting principle on the condensed consolidatedfinancial statements.
Components of net cost (benefit) for pension and other postretirement plans
Three months ended September
30, Nine months ended September
30,($ in millions)
2019 2018 2019 2018
Pension benefits Service cost $ 30 $ 27 $ 86 $ 83
Interest cost 58 65 185 189
Expected return on plan assets (103) (103) (297) (323)
Amortization of prior service credit (14) (14) (42) (42)
Costs and expenses (29) (25) (68) (93)
Remeasurement of projected benefit obligation 323 (38) 1,054 (314)
Remeasurement of plan assets (136) 4 (752) 301
Remeasurement gains and losses 187 (34) 302 (13)
Pension net cost (benefit) $ 158 $ (59) $ 234 $ (106)
Postretirement benefits Service cost $ 2 $ 1 $ 6 $ 5
Interest cost 4 4 11 11
Amortization of prior service credit — (5) (2) (16)
Costs and expenses 6 — 15 —
Remeasurement of projected benefit obligation 38 (5) 63 (19)
Remeasurement of plan assets — — — —
Remeasurement gains and losses 38 (5) 63 (19)
Postretirement net cost (benefit) $ 44 $ (5) $ 78 $ (19)
Pension and postretirement benefits Costs and expenses $ (23) $ (25) $ (53) $ (93)
Remeasurement gains and losses 225 (39) 365 (32)
Total net cost (benefit) $ 202 $ (64) $ 312 $ (125)
Differences between expected and actual returns and changes inassumptions affect our pension and other postretirement obligations, planassets and expenses.
Pension and other postretirement remeasurement losses were $225million and $365 million for the third quarter and first nine months of 2019,respectively, compared to remeasurement gains of $39 million and $32million for the same periods of 2018.
Third Quarter 2019 Form 10-Q 49

Notes to Condensed Consolidated Financial Statements
The losses for the third quarter and first nine months of 2019 primarilyrelated to a decrease in the discount rate used to value the liabilities,partially offset by favorable asset performance compared to the expectedreturn on plan assets.
The weighted average discount rate used to measure the benefitobligation decreased to 3.17% at September 30, 2019 compared to 3.53%at June 30, 2019, 3.87% at March 31, 2019 and 4.30% at December 31,2018. Pension and other postretirement remeasurement of projected benefitobligation losses due to declines in the weighted average discount rate were$324 million and $1.04 billion for the third quarter and first nine months of2019, respectively.
During the third quarter of 2019, the Company completed its triennialstudy of demographic assumptions. The Company reviewed historicalexperience for various long-term actuarial assumptions and methodologiesthat affect our pension and other postretirement obligations andincorporated updates into its best estimates of these assumptions. Theupdate to these assumptions resulted in an increase of pension and otherpostretirement obligations primarily
related to the timing of participant retirements and higher levels and durationof medical coverage elected for retirees, partially offset by lower ages ofemployees electing medical coverage. During the second quarter of 2019,we recognized participant experience different from our demographicassumptions for mortality, terminations and retirements and the percentageof employees taking lump sum distributions. Actuarial assumption updatesthat affect our pension and other postretirement obligations resulted inremeasurement losses of $37 million and $81 million in the third quarter andfirst nine months of 2019, respectively, compared to gains of $3 million andlosses of $72 million in the third quarter of 2018 and first nine months of2018, respectively.
For the third quarter and first nine months of 2019, the actual return onplan assets was higher than our expected return by $136 million and $752million, respectively, due to declines in interest rates which increased the fairvalue of our fixed income investments. The increase in the first nine monthsof 2019 was also due to strong equity market performance.
Note 14 Supplemental Cash Flow InformationNon-cash investing activities include $187 million and $78 million
related to mergers and exchanges involving third party equity securities,fixed income securities and limited partnerships, and modifications of certainmortgage loans and other investments for the nine months endedSeptember 30, 2019 and 2018, respectively.
Non-cash financing activities include $48 million and $30 million relatedto the issuance of Allstate common shares for vested equity awards for thenine months ended September 30, 2019 and 2018, respectively.
Cash flows used in operating activities in the Condensed ConsolidatedStatements of Cash Flows include cash paid for operating leases related toamounts included in the measurement of lease
liabilities of $115 million for the nine months ended September 30, 2019.Non-cash operating activities include $534 million related to ROU assetsobtained in exchange for lease obligations, including $488 million related tothe adoption of new guidance related to accounting for leases, for the ninemonths ended September 30, 2019.
Liabilities for collateral received in conjunction with the Company’ssecurities lending program and over-the-counter and cleared derivatives arereported in other liabilities and accrued expenses or other investments. Theaccompanying cash flows are included in cash flows from operatingactivities in the Condensed Consolidated Statements of Cash Flows alongwith the activities resulting from management of the proceeds, as follows:
($ in millions)
Nine months ended September 30,
2019 2018
Net change in proceeds managed
Net change in fixed income securities $ 80 $ 175
Net change in short-term investments (709) (454)
Operating cash flow used $ (629) $ (279)
Net change in liabilities
Liabilities for collateral, beginning of period $ (1,458) $ (1,124)
Liabilities for collateral, end of period (2,087) (1,403)
Operating cash flow provided $ 629 $ 279
50 www.allstate.com

Notes to Condensed Consolidated Financial Statements
Note 15 Other Comprehensive Income
Components of other comprehensive income (loss) on a pre-tax and after-tax basis
($ in millions)
Three months ended September 30,
2019 2018
Pre-tax Tax After-tax Pre-tax Tax After-tax
Unrealized net holding gains and losses arising during the period, netof related offsets $ 603 $ (127) $ 476 $ (116) $ 25 $ (91)
Less: reclassification adjustment of realized capital gains and losses 136 (29) 107 (26) 5 (21)
Unrealized net capital gains and losses 467 (98) 369 (90) 20 (70)
Unrealized foreign currency translation adjustments (12) 2 (10) (18) 4 (14)
Unamortized pension and other postretirement prior servicecredit (1) (15) 3 (12) (19) 4 (15)
Other comprehensive income (loss) $ 440 $ (93) $ 347 $ (127) $ 28 $ (99)
Nine months ended September 30,
2019 2018
Pre-tax Tax After-tax Pre-tax Tax After-tax
Unrealized net holding gains and losses arising during the period, netof related offsets $ 2,811 $ (593) $ 2,218 $ (1,103) $ 233 $ (870)
Less: reclassification adjustment of realized capital gains and losses 244 (51) 193 (129) 27 (102)
Unrealized net capital gains and losses 2,567 (542) 2,025 (974) 206 (768)
Unrealized foreign currency translation adjustments (1) — (1) (28) 6 (22)
Unamortized pension and other postretirement prior servicecredit (1) (44) 9 (35) (58) 13 (45)
Other comprehensive income (loss) $ 2,522 $ (533) $ 1,989 $ (1,060) $ 225 $ (835)
(1) Represents prior service credits reclassified out of other comprehensive income and amortized into operating costs and expenses.
Third Quarter 2019 Form 10-Q 51

Report of Independent Registered Public Accounting FirmTo the Board of Directors and Shareholders ofThe Allstate CorporationNorthbrook, Illinois 60062
Results of Review of Interim Financial Information
We have reviewed the accompanying condensed consolidated statement of financial position of The Allstate Corporation and subsidiaries (the “Company”)as of September 30, 2019, the related condensed consolidated statements of operations, comprehensive income and shareholders’ equity for the three andnine month periods ended September 30, 2019 and 2018, and cash flows for the nine month periods ended September 30, 2019 and 2018, and the relatednotes (collectively referred to as the “condensed consolidated financial statements”). Based on our reviews, we are not aware of any material modifications thatshould be made to the accompanying condensed consolidated financial statements for them to be in conformity with accounting principles generally acceptedin the United States of America.
We have previously audited, in accordance with the standards of the Public Company Accounting Oversight Board (United States) (“PCAOB”), theconsolidated statement of financial position of The Allstate Corporation and subsidiaries as of December 31, 2018, and the related consolidated statements ofoperations, comprehensive income, shareholders’ equity, and cash flows for the year then ended (not presented herein); and in our report dated February 15,2019 (May 16, 2019, as to the effects of the retrospective adoption of the change in principles of accounting for recognizing pension and other postretirementbenefit plan costs), we expressed an unqualified opinion on those consolidated financial statements (which report expresses an unmodified opinion andincludes an emphasis of a matter paragraph relating to a change in accounting principle for the recognition and measurement of financial assets and financialliabilities). In our opinion, the information set forth in the accompanying condensed consolidated statement of financial position as of December 31, 2018 isfairly stated, in all material respects, in relation to the consolidated statement of financial position from which it has been derived.
Basis for Review Results
These condensed consolidated financial statements are the responsibility of the Company's management. We are a public accounting firm registered withthe PCAOB and are required to be independent with respect to the Company in accordance with the U.S. federal securities laws and the applicable rules andregulations of the Securities and Exchange Commission and the PCAOB.
We conducted our reviews in accordance with standards of the PCAOB. A review of the condensed consolidated financial statements consists principallyof applying analytical procedures and making inquiries of persons responsible for financial and accounting matters. It is substantially less in scope than anaudit conducted in accordance with the standards of the PCAOB, the objective of which is the expression of an opinion regarding the financial statementstaken as a whole. Accordingly, we do not express such an opinion.
Emphasis of a Matter
As discussed in Note 1 to the condensed consolidated financial statements, the Company elected to change its principles of accounting for recognizingpension and other postretirement benefit plan costs.
/s/ DELOITTE & TOUCHE LLP
Chicago, IllinoisOctober 29, 2019
52 www.allstate.com

Item 2. Management’s Discussion and Analysis of Financial Condition and Results of Operations for the Three and NineMonth Periods Ended September 30, 2019 and 2018
OverviewTo achieve its goals in 2019, Allstate is focused on the following
priorities:
• Better serve customers
• Achieve target economic returns on capital
• Grow customer base
• Proactively manage investments
• Build long-term growth platforms
The following discussion highlights significant factors influencing theconsolidated financial position and results of operations of The AllstateCorporation (referred to in this document as “we,” “our,” “us,” the “Company”or “Allstate”). It should be read in conjunction with the condensedconsolidated financial statements and notes thereto found under Part I. Item1. contained herein, and with the discussion, analysis, consolidated financialstatements and notes thereto in Part I. Item 1. and Part II. Item 7. and Item8. of The Allstate Corporation annual report on Form 10-K for 2018, filedFebruary 15, 2019, and the Company’s Current Report on Form 8-K filed onMay 16, 2019, Exhibit 99.1, reflecting the Company’s 2018 Form 10-K withadjustments to Part II. Item 6., Item 7. and Item 8. for the Company’schange in accounting principle for pension and other postretirement benefitplans.
Further analysis of our insurance segments is provided in the Property-Liability Operations and Segment Results sections, including AllstateProtection, Discontinued Lines and Coverages, Service Businesses, AllstateLife, Allstate Benefits, and Allstate Annuities, of Management’s Discussionand Analysis (“MD&A”). The segments are consistent with the way in whichthe chief operating decision maker reviews financial performance andmakes decisions about the allocation of resources.
Measuring segment profit or loss
The measure of segment profit or loss used in evaluating performanceis underwriting income for the Allstate Protection and Discontinued Linesand Coverages segments and adjusted net income for the ServiceBusinesses, Allstate Life, Allstate Benefits, Allstate Annuities, and Corporateand Other segments.
Underwriting income is calculated as premiums earned and otherrevenue, less claims and claims expense (“losses”), amortization of deferredpolicy acquisition costs (“DAC”), operating costs and expenses, amortizationof purchased intangibles and restructuring and related charges, asdetermined using accounting principles generally accepted in the UnitedStates of America (“GAAP”). We use this measure in our evaluation ofresults of operations to analyze the profitability of the Property-Liabilityinsurance operations separately from investment results. Underwritingincome is reconciled to net income applicable to common shareholders inthe Property-Liability Operations section of Management’s Discussion andAnalysis.
Adjusted net income is net income applicable to common shareholders,excluding:
• Realized capital gains and losses, after-tax, except for periodic settlements andaccruals on non-hedge derivative instruments, which are reported with realizedcapital gains and losses but included in adjusted net income
• Pension and other postretirement remeasurement gains and losses, after-tax
• Valuation changes on embedded derivatives not hedged, after-tax
• Amortization of DAC and deferred sales inducement costs (“DSI”), to the extentthey resulted from the recognition of certain realized capital gains and losses orvaluation changes on embedded derivatives not hedged, after-tax
• Business combination expenses and the amortization or impairment of purchasedintangibles, after-tax
• Gain (loss) on disposition of operations, after-tax
• Adjustments for other significant non-recurring, infrequent or unusual items,when (a) the nature of the charge or gain is such that it is reasonably unlikely torecur within two years, or (b) there has been no similar charge or gain within theprior two years
Adjusted net income is reconciled to net income applicable to commonshareholders in the Service Businesses, Allstate Life, Allstate Benefits andAllstate Annuities Segment sections of MD&A.
Third Quarter 2019 Form 10-Q 53

Highlights
Consolidated net income($ in millions)
Consolidated net income applicable to common shareholders decreased 5.6% in the third quarter of 2019 compared to the same period of 2018, primarily due topension and other postretirement remeasurement losses in 2019 compared to gains in 2018, higher Allstate Protection non-catastrophes claim and claims expense and higheramortization of DAC, partially offset by higher premiums earned. Consolidated net income applicable to common shareholders increased 14.4% in the first nine months of2019 compared to the same period of 2018 primarily due to higher premiums earned and net realized capital gains, partially offset by higher Allstate Protection claim andclaim expense and pension and other postretirement remeasurement losses.
The Property-Liability combined ratios were 91.6 and 93.1 in the third quarter and first nine months of 2019, respectively, compared to 93.9 and 92.0 in the third quarter andfirst nine months of 2018, respectively.
Total revenue($ in millions)
Total revenue increased 5.8% and 9.5% in the third quarter and first nine months of 2019, respectively, compared to the prior year periods, driven by higher net realizedcapital gains and a 5.6% and 5.8% increase in insurance premiums and contract charges in the third quarter and first nine months of 2019, respectively. Insurance premiumsearned increased in the following segments: Allstate Protection (Allstate and Esurance brands), Service Businesses (Allstate Protection Plans and Allstate Dealer Services),Allstate Life and Allstate Benefits.
Net investment income($ in millions)
Net investment income increased 4.3% and 0.7% in the third quarter and first nine months of 2019 compared to the prior year periods, primarily due to higher income frommarket-based portfolios, partially offset by lower performance-based investment results, mainly from limited partnerships.
Q1 Q2 Q3

54 www.allstate.com

Summarized financial results
Three months ended September
30, Nine months ended September
30,
($ in millions) 2019 2018 2019 2018
Revenues
Property and casualty insurance premiums $ 9,094 $ 8,595 $ 26,882 $ 25,341
Life premiums and contract charges 625 612 1,874 1,840
Other revenue 273 238 794 682
Net investment income 880 844 2,470 2,454
Realized capital gains and losses 197 176 1,183 17
Total revenues 11,069 10,465 33,203 30,334
Costs and expenses
Property and casualty insurance claims and claims expense (6,051) (5,805) (18,227) (16,711)
Life contract benefits and interest credited to contractholder funds (682) (661) (2,008) (1,974)
Amortization of deferred policy acquisition costs (1,425) (1,317) (4,151) (3,886)
Other expenses (1,494) (1,520) (4,446) (4,392)
Pension and other postretirement remeasurement gains and losses (225) 39 (365) 32
Amortization of purchased intangibles (32) (24) (96) (69)
Impairment of purchased intangibles — — (55) —
Total costs and expenses (9,909) (9,288) (29,348) (27,000)
Gain on disposition of operations — 1 3 4
Income tax expense (229) (199) (784) (636)
Net income 931 979 3,074 2,702
Preferred stock dividends (42) (37) (103) (105)
Net income applicable to common shareholders $ 889 $ 942 $ 2,971 $ 2,597
Segment highlights
Allstate Protection underwriting income totaled $836 million in the thirdquarter of 2019, a 42.4% increase from $587 million in the third quarter of2018. The increase was primarily due to increased premiums earned, lowercatastrophe losses and higher favorable non-catastrophe prior year reservereestimates, partially offset by higher non-catastrophe losses. Underwritingincome totaled $1.91 billion in the first nine months of 2019, a 7.0%decrease from $2.05 billion in the first nine months of 2018. The decreasewas primarily due to higher claim severity, catastrophe losses and policyacquisition and renewal costs, partially offset by increased premiumsearned.
Catastrophe losses were $510 million and $2.26 billion in the thirdquarter and first nine months of 2019, respectively, compared to $625million and $1.89 billion in the third quarter and first nine months of 2018,respectively.
Premiums written increased 5.8% to $9.31 billion in the third quarter of2019 and 5.9% to $26.68 billion in the first nine months of 2019, comparedto the same periods of 2018.
Service Businesses adjusted net income was $8 million in the thirdquarter of 2019 compared to $1 million in the third quarter of 2018. Adjustednet income was $35 million in the first nine months of 2019 compared toadjusted net income of zero in the first nine months of 2018. Starting in thethird quarter of 2019, we are reporting SquareTrade and InfoArmor usingthe names Allstate Protection Plans and Allstate
Identity Protection, respectively, due to the re-branding of these businesses.The improvements in both periods were primarily due to growth of AllstateProtection Plans and favorable loss experience of both Allstate ProtectionPlans and Allstate Dealer Services, partially offset by higher operatingexpenses related to investing in growth of Allstate Protection Plans andAllstate Identity Protection and integrating the Allstate Identity Protectionbusiness.
Total revenues increased 27.1% to $418 million in the third quarter of2019 and 26.3% to $1.22 billion in the first nine months of 2019, comparedto the same periods of 2018, primarily due to Allstate Protection Plans’growth through its U.S. retail and international distribution partners and theacquisitions of Allstate Identity Protection, PlumChoice and iCracked,partially offset by declines in Allstate Roadside Services wholesale and retailbusiness.
Allstate Life adjusted net income was $44 million in the third quarter of2019 compared to $75 million in the third quarter of 2018, primarily due tohigher amortization of DAC related to our annual review of assumptions,partially offset by lower operating costs and expenses and higher premiums.Adjusted net income was $185 million in the first nine months of 2019compared to $226 million in the first nine months of 2018, primarily due tohigher contract benefits and amortization of DAC, partially offset by higherpremiums and other revenue.
Third Quarter 2019 Form 10-Q 55

Our annual comprehensive review of actuarial assumptions in the thirdquarter of 2019 resulted in a decrease to after-tax income of $42 millioncompared to $5 million in the prior year period.
Premiums and contract charges increased 2.8% to $331 million in thethird quarter of 2019 and 2.7% to $1.00 billion in the first nine months of2019, compared to the same periods of 2018.
Allstate Benefits adjusted net income was $31 million in the thirdquarter of 2019 compared to $33 million in the third quarter of 2018,primarily due to higher DAC amortization related to our annual review ofassumptions, partially offset by higher premiums. Adjusted net income was$99 million in the first nine months of 2019 compared to $98 million in thefirst nine months of 2018, primarily due to higher premiums, partially offsetby higher DAC amortization.
Our annual comprehensive review of actuarial assumptions in the thirdquarter of 2019 resulted in a decrease to after-tax income of $1 millioncompared to an increase of $2 million in the prior year period.
Premiums and contract charges increased 2.1% to $291 million in thethird quarter of 2019 and 1.1% to $863 million in the first nine months of2019, compared to the same periods of 2018.
Allstate Annuities adjusted net income was $16 million in the thirdquarter of 2019 compared to $20 million in the third quarter of 2018,primarily due to higher contract benefits and lower net investment income,partially offset by lower interest credited to contractholder funds. AllstateAnnuities adjusted net income was $43 million in the first nine months of2019 compared to $99 million in the first nine months of 2018, primarily dueto lower net investment income, partially offset by lower interest credited tocontractholder funds.
Net investment income decreased 3.5% to $251 million in the thirdquarter of 2019 compared to the same period of 2018 and 12.6% to $737million in the first nine months of 2019 compared to the same period of2018, primarily due to lower performance-based investment results andlower average investment balances.
Financial highlights
Investments totaled $89.31 billion as of September 30, 2019, increasingfrom $81.26 billion as of December 31, 2018. Unrealized net capital gainstotaled $2.99 billion as of September 30, 2019 compared to net unrealizedcapital gains of $33 million as of December 31, 2018.
Shareholders’ equity As of September 30, 2019, shareholders’ equitywas $26.14 billion. This total included $3.55 billion in deployable assets atthe parent holding company level comprising cash and investments that aregenerally saleable within one quarter.
Book value per diluted common share (ratio of common shareholders’equity to total common shares outstanding and dilutive potential commonshares outstanding) was $69.84, an increase of 14.8% from $60.86 as ofSeptember 30, 2018, and an increase of 21.3% from $57.56 as ofDecember 31, 2018.
Return on average common shareholders’ equity For the twelve monthsended September 30, 2019, net income applicable to commonshareholders’ return on the average of beginning and ending periodcommon shareholders’ equity of 10.7% decreased by 7.9 points from 18.6%for the twelve months ended September 30, 2018, primarily due to lower netincome applicable to common shareholders for the trailing twelve-monthperiod ended September 30, 2019, and an increase in average commonshareholders’ equity. The September 30, 2018 trailing twelve-monthcalculation includes a one-time $540 million Tax Cuts and Jobs Act of 2017benefit, which contributed 2.6 points to the September 30, 2018 return onaverage common shareholders’ equity.
Change in accounting principle
We changed our accounting principle for recognizing actuarial gainsand losses and expected return on plan assets for our pension and otherpostretirement plans to a more preferable policy under U.S. GAAP. Underthe new principle, remeasurement of projected benefit obligation and planassets are immediately recognized through earnings and are referred to aspension and other postretirement remeasurement gains and losses on theCondensed Consolidated Statements of Operations. This change has beenapplied on a retrospective basis. The following table provides a summary ofthe impacts of this change. See Note 1 of the condensed consolidatedfinancial statements for further information regarding the impact of thechange in accounting principle on our condensed consolidated financialstatements.
Pension and other postretirement measurement gains and losses In thethird quarter of 2019, we recorded pension and other postretirementmeasurement losses of $225 million compared to gains of $39 million in thesame period of 2018. Pension and other postretirement measurementlosses were $365 million in the first nine months of 2019 compared to gainsof $32 million in the same period of 2018.
The losses for the third quarter and first nine months of 2019 primarilyrelated to a decrease in the discount rate used to value the liabilities,partially offset by favorable asset performance compared to the expectedreturn on plan assets. See Note 13 of the condensed consolidated financialstatements for further information.
56 www.allstate.com

Impact of pension and postretirement accounting change on selected financial data
($ in millions, except per share data and ratios) Three months ended September
30, 2018 Nine months ended September 30,
2018
As adjusted Previouslyreported As adjusted
Previouslyreported
Net income $ 979 $ 870 $ 2,702 $ 2,521
Net income applicable to common shareholders 942 833 2,597 2,416
Net income applicable to common shareholders per common share - Basic 2.72 2.41 7.43 6.91
Net income applicable to common shareholders per common share - Diluted 2.68 2.37 7.31 6.80
Return on common shareholders’ equity (1) 18.6% 17.4%
Property-Liability combined ratio 93.9 94.3 92.0 92.5(1) Trailing twelve months
Third Quarter 2019 Form 10-Q 57

Property-Liability Operations
Property-Liability OperationsOverview Our Property-Liability operations consist of two reportable
segments: Allstate Protection and Discontinued Lines and Coverages.These segments are consistent with the groupings of financial informationthat management uses to evaluate performance and to determine theallocation of resources.
We do not allocate Property-Liability investment income, realizedcapital gains and losses, or assets to the Allstate Protection andDiscontinued Lines and Coverages segments. Management reviews assetsat the Property-Liability level for decision-making purposes.
The table below includes GAAP operating ratios we use to measure ourprofitability. We believe that they enhance an investor’s understanding of ourprofitability. They are calculated as follows:
• Loss ratio: the ratio of claims and claims expense to premiums earned.Loss ratios include the impact of catastrophe losses.
• Expense ratio: the ratio of amortization of DAC, operating costs andexpenses, amortization of purchased intangibles and restructuring andrelated charges, less other revenue to premiums earned.
• Combined ratio: the ratio of claims and claims expense, amortization ofDAC, operating costs and expenses, amortization of purchasedintangibles and restructuring and related charges, less other revenue topremiums earned. The combined ratio is the sum of the loss ratio andthe expense ratio. The difference between 100% and the combinedratio represents underwriting income as a percentage of premiumsearned, or underwriting margin.
We have also calculated the following impacts of specific items on theGAAP operating ratios because of the volatility of these items between fiscalperiods.
• Effect of catastrophe losses on combined ratio: the ratio of catastrophelosses included in claims and claims expense to premiums earned. Thisratio includes prior year reserve reestimates of catastrophe losses.
• Effect of prior year reserve reestimates on combined ratio: the ratio ofprior year reserve reestimates included in claims and claims expense topremiums earned. This ratio includes prior year reserve reestimates ofcatastrophe losses.
• Effect of amortization of purchased intangibles on combined ratio: theratio of amortization of purchased intangibles to premiums earned.
• Effect of restructuring and related charges on combined ratio: the ratioof restructuring and related charges to premiums earned.
• Effect of Discontinued Lines and Coverages on combined ratio: theratio of claims and claims expense and operating costs and expensesin the Discontinued Lines and Coverages segment to Property-Liabilitypremiums earned. The sum of the effect of Discontinued Lines andCoverages on the combined ratio and the Allstate Protection combinedratio is equal to the Property-Liability combined ratio.
58 www.allstate.com

Property-Liability Operations
Summarized financial data
Three months ended September
30, Nine months ended September
30,
($ in millions, except ratios) 2019 2018 2019 2018
Premiums written $ 9,312 $ 8,800 $ 26,682 $ 25,185
Revenues
Premiums earned $ 8,782 $ 8,320 $ 25,970 $ 24,528
Other revenue 195 192 561 550
Net investment income 448 410 1,210 1,100
Realized capital gains and losses 163 126 916 16
Total revenues 9,588 9,048 28,657 26,194
Costs and expenses
Claims and claims expense (5,960) (5,717) (17,962) (16,444)
Amortization of DAC (1,167) (1,133) (3,494) (3,331)
Operating costs and expenses (1,114) (1,143) (3,245) (3,285)
Restructuring and related charges 1 (12) (26) (51)
Total costs and expenses (8,240) (8,005) (24,727) (23,111)
Income tax expense (272) (211) (809) (631)
Net income applicable to common shareholders $ 1,076 $ 832 $ 3,121 $ 2,452
Underwriting income $ 737 $ 507 $ 1,804 $ 1,967
Net investment income 448 410 1,210 1,100
Income tax expense on operations (236) (185) (617) (628)
Realized capital gains and losses, after-tax 127 103 724 16
Tax Legislation expense — (3) — (3)
Net income applicable to common shareholders $ 1,076 $ 832 $ 3,121 $ 2,452
Catastrophe losses Catastrophe losses, excluding reserve reestimates $ 513 $ 624 $ 2,209 $ 1,847
Catastrophe reserve reestimates (1) (3) 1 53 45
Total catastrophe losses $ 510 $ 625 $ 2,262 $ 1,892
GAAP operating ratios
Loss ratio 67.9 68.7 69.2 67.1
Expense ratio (2) 23.7 25.2 23.9 24.9
Combined ratio 91.6 93.9 93.1 92.0
Effect of catastrophe losses on combined ratio 5.8 7.5 8.7 7.7
Effect of prior year reserve reestimates on combined ratio (3) (0.5) 0.2 (0.4) (0.5)
Effect of catastrophe losses included in prior year reserve reestimates on combined ratio — — 0.2 0.2
Effect of restructuring and related charges on combined ratio — 0.1 0.1 0.2
Effect of Discontinued Lines and Coverages on combined ratio 1.1 1.0 0.5 0.4(1) Favorable reserve reestimates are shown in parentheses. Prior year reserve reestimates included a $7 million reduction of reinstatement reinsurance premiums for the three
months ended September 30, 2019 and an increase of $13 million for the nine months ended September 30, 2019 related to the 2018 Camp Fire.(2) Other revenue is deducted from operating costs and expenses in the expense ratio calculation.(3) Prior year reserve reestimates totaled $44 million and $115 million favorable in the three and nine months ended September 30, 2019, respectively, compared to $13 million
unfavorable and $133 million favorable in the same periods of 2018, respectively.
Third Quarter 2019 Form 10-Q 59

Property-Liability Operations
Net investment income increased 9.3% or $38 million in the third quarter of 2019 and 10.0% or $110 million in the first nine months of 2019 compared tothe same periods of 2018, due to higher income from market-based portfolios, partially offset by lower performance-based investment results, mainly fromlimited partnerships.
We increased the maturity profile of fixed income securities in our Property-Liability portfolio to a duration of 5.1 years as of September 30, 2019 comparedto 3.7 years as of September 30, 2018.
Net investment income
Three months ended September
30, Nine months ended September
30,
($ in millions) 2019 2018 2019 2018
Fixed income securities $ 272 $ 240 $ 796 $ 690
Equity securities 44 24 116 93
Mortgage loans 4 5 12 13
Limited partnership interests 128 136 286 301
Short-term investments 13 11 44 26
Other 27 33 80 93
Investment income, before expense 488 449 1,334 1,216
Investment expense (1) (2) (40) (39) (124) (116)
Net investment income $ 448 $ 410 $ 1,210 $ 1,100(1) Investment expense includes $11 million and $10 million of investee level expenses in the third quarter of 2019 and 2018, respectively, and $38 million and $34 million in the first
nine months of 2019 and 2018, respectively. Investee level expenses include depreciation and asset level operating expenses on directly held real estate and otherconsolidated investments.
(2) Investment expense includes $7 million and $6 million related to the portion of reinvestment income on securities lending collateral paid to the counterparties in the third quarterof 2019 and 2018, respectively, and $22 million and $12 million in the first nine months of 2019 and 2018, respectively.
Realized capital gains and losses Net realized capital gains in the third quarter related primarily to gains on sales of fixed income securities. Net realizedcapital gains in the first nine months of 2019 related primarily to increased valuation of equity investments and gains on sales of fixed income securities.Valuation of equity investments for the nine months ended September 30, 2019 includes $538 million of appreciation in the valuation of equity securities and$69 million of appreciation primarily related to certain limited partnerships where the underlying assets are predominately public equity securities.
Realized capital gains and losses
($ in millions)
Three months ended
September 30, Nine months ended
September 30,
2019 2018 2019 2018
Impairment write-downs $ (6) $ (1) $ (23) $ (3)
Sales 124 (16) 332 (104)
Valuation of equity investments 13 142 607 114
Valuation and settlements of derivative instruments 32 1 — 9
Realized capital gains and losses, pre-tax 163 126 916 16
Income tax expense (36) (23) (192) —
Realized capital gains and losses, after-tax $ 127 $ 103 $ 724 $ 16
60 www.allstate.com

Allstate Protection Segment Results
Allstate Protection Segment
Underwriting results
Three months ended September
30, Nine months ended September
30,($ in millions) 2019 2018 2019 2018
Premiums written $ 9,312 $ 8,800 $ 26,682 $ 25,185
Premiums earned $ 8,782 $ 8,320 $ 25,970 $ 24,528
Other revenue 195 192 561 550
Claims and claims expense (5,862) (5,637) (17,859) (16,359)
Amortization of DAC (1,167) (1,133) (3,494) (3,331)
Other costs and expenses (1,113) (1,143) (3,243) (3,284)
Restructuring and related charges 1 (12) (26) (51)
Underwriting income $ 836 $ 587 $ 1,909 $ 2,053
Catastrophe losses $ 510 $ 625 $ 2,262 $ 1,892
Underwriting income (loss) by line of business
Auto $ 421 $ 394 $ 1,332 $ 1,410
Homeowners 349 208 403 564
Other personal lines (1) 50 13 130 128
Commercial lines 1 (42) 1 (84)
Other business lines (2) 16 15 45 39
Answer Financial (1) (1) (2) (4)
Underwriting income $ 836 $ 587 $ 1,909 $ 2,053
(1) Other personal lines include renters, condominium, landlord and other personal lines products.(2) Other business lines represent Ivantage, a general agency for Allstate exclusive agencies. Ivantage provides agencies a solution for their customers when coverage through
Allstate brand underwritten products is not available.
Third Quarter 2019 Form 10-Q 61

Segment Results Allstate Protection
Changes in underwriting results from prior year by component and by line of business (1) Three months ended September 30,
Auto Homeowners Other personal lines Commercial lines Allstate Protection (2)
($ in millions) 2019 2018 2019 2018 2019 2018 2019 2018 2019 2018
Underwriting income (loss) - prior period $ 394 $ 187 $ 208 $ 320 $ 13 $ (24) $ (42) $ (17) $ 587 $ 480
Changes in underwriting income (loss) from: Increase (decrease) premiums earned 282 297 106 59 14 16 60 52 462 424
Increase (decrease) other revenue 5 5 — 2 1 (2) (1) — 3 7
(Increase) decrease incurred claims and claimsexpense (“losses”):
Incurred losses, excluding catastrophe lossesand reserve reestimates (300) (194) (54) (86) 1 3 (58) (51) (411) (328)
Catastrophe losses, excluding reservereestimates (17) 259 100 (40) 25 14 3 6 111 239
Catastrophe reserve reestimates (3) — 4 (8) 2 (1) 1 1 4 (8)
Non-catastrophe reserve reestimates 57 (90) (19) (21) (8) (2) 41 (36) 71 (149)
Losses subtotal (263) (25) 31 (155) 20 14 (13) (80) (225) (246)
(Increase) decrease expenses 3 (70) 4 (18) 2 9 (3) 3 9 (78)
Underwriting income (loss) $ 421 $ 394 $ 349 $ 208 $ 50 $ 13 $ 1 $ (42) $ 836 $ 587
Nine months ended September 30,
Auto Homeowners Other personal lines Commercial lines Allstate Protection (2)
2019 2018 2019 2018 2019 2018 2019 2018 2019 2018
Underwriting income (loss) - prior period $ 1,410 $ 892 $ 564 $ 431 $ 128 $ 54 $ (84) $ (21) $ 2,053 $ 1,392
Changes in underwriting income (loss) from: Increase (decrease) premiums earned 951 767 287 141 36 48 168 110 1,442 1,066
Increase (decrease) other revenue 8 15 — 4 2 1 (1) (3) 11 17
(Increase) decrease losses: Incurred losses, excluding catastrophe lossesand reserve reestimates (833) (358) (144) (193) 9 (41) (170) (80) (1,138) (672)
Catastrophe losses, excluding reservereestimates (77) 358 (276) 377 (14) 50 5 8 (362) 793
Catastrophe reserve reestimates (28) 23 25 (86) (6) 7 1 1 (8) (55)
Non-catastrophe reserve reestimates (17) (3) (38) (46) (26) 8 89 (101) 8 (142)
Losses subtotal (955) 20 (433) 52 (37) 24 (75) (172) (1,500) (76)
(Increase) decrease expenses (82) (284) (15) (64) 1 1 (7) 2 (97) (346)
Underwriting income (loss) $ 1,332 $ 1,410 $ 403 $ 564 $ 130 $ 128 $ 1 $ (84) $ 1,909 $ 2,053
(1) The 2019 column presents changes in 2019 compared to 2018. The 2018 column presents changes in 2018 compared to 2017.(2) Includes other business lines underwriting income of $16 million and $15 million in the third quarter of 2019 and 2018, respectively, and $45 million and $39 million in the first nine
months of 2019 and 2018, respectively. Includes Answer Financial underwriting loss of $1 million in both the third quarter of 2019 and 2018, and $2 million and $4 million in thefirst nine months of 2019 and 2018, respectively.
Underwriting income increased to $836 million in the third quarter of 2019 from $587 million in the third quarter of 2018 primarily due to increasedpremiums earned, lower catastrophe losses and higher favorable non-catastrophe prior year reserve reestimates, partially offset by higher non-catastrophelosses. Underwriting income decreased to $1.91 billion in the first nine months of 2019 from $2.05 billion in the first nine months of 2018 primarily due to higherclaim severity, catastrophe losses and policy acquisition and renewal costs, partially offset by increased premiums earned.
62 www.allstate.com

Allstate Protection Segment Results
Premiums written is the amount of premiums charged for policies issued during a fiscal period. Premiums are considered earned and are included in thefinancial results on a pro-rata basis over the policy period. The portion of premiums written applicable to the unexpired term of the policies is recorded asunearned premiums on our Condensed Consolidated Statements of Financial Position.
Premiums written and earned by line of business
($ in millions) Three months ended September
30, Nine months ended September
30,
Premiums written 2019 2018 2019 2018
Auto $ 6,271 $ 5,987 $ 18,405 $ 17,513
Homeowners 2,288 2,144 6,183 5,800
Other personal lines 515 496 1,435 1,390
Subtotal – Personal lines 9,074 8,627 26,023 24,703
Commercial lines 238 173 659 482
Total premiums written $ 9,312 $ 8,800 $ 26,682 $ 25,185
Reconciliation of premiums written to premiums earned: Increase in unearned premiums (538) (505) (743) (643)
Other 8 25 31 (14)
Total premiums earned $ 8,782 $ 8,320 $ 25,970 $ 24,528
Auto $ 6,080 $ 5,798 $ 18,045 $ 17,094
Homeowners 1,997 1,891 5,890 5,603
Other personal lines 469 455 1,390 1,354
Subtotal – Personal lines 8,546 8,144 25,325 24,051
Commercial lines 236 176 645 477
Total premiums earned $ 8,782 $ 8,320 $ 25,970 $ 24,528
Combined ratios by line of business Loss ratio Expense ratio (1) Combined ratio
2019 2018 2019 2018 2019 2018
Three months ended September 30, Auto 68.9 67.7 24.2 25.5 93.1 93.2
Homeowners 59.3 64.2 23.2 24.8 82.5 89.0
Other personal lines 62.7 69.0 26.6 28.1 89.3 97.1
Commercial lines 83.5 104.6 16.1 19.3 99.6 123.9
Total 66.8 67.7 23.7 25.2 90.5 92.9
Nine months ended September 30, Auto 68.2 66.4 24.4 25.4 92.6 91.8
Homeowners 70.1 66.0 23.1 23.9 93.2 89.9
Other personal lines 64.4 63.3 26.2 27.2 90.6 90.5
Commercial lines 82.5 95.8 17.3 21.8 99.8 117.6
Total 68.7 66.7 23.9 24.9 92.6 91.6
(1) Other revenue is deducted from operating costs and expenses in the expense ratio calculation.
Third Quarter 2019 Form 10-Q 63

Segment Results Allstate Protection
Loss ratios by line of business
Loss ratio Effect of catastrophe losses Effect of prior year reserve
reestimates
Effect of catastrophe lossesincluded in prior year
reserve reestimates
2019 2018 2019 2018 2019 2018 2019 2018
Three months ended September 30, Auto 68.9 67.7 2.4 2.1 (2.5) (1.7) — (0.1)
Homeowners 59.3 64.2 17.0 23.5 0.1 (0.7) 0.1 0.3
Other personal lines 62.7 69.0 5.3 11.4 1.9 0.6 (0.4) —
Commercial lines 83.5 104.6 0.9 3.4 — 23.9 (0.4) —
Total 66.8 67.7 5.8 7.5 (1.6) (0.8) — —
Nine months ended September 30, Auto 68.2 66.4 2.3 1.8 (1.7) (2.0) — (0.2)
Homeowners 70.1 66.0 28.9 25.8 1.0 0.8 1.0 1.5
Other personal lines 64.4 63.3 10.7 9.5 1.2 (1.1) 0.3 (0.1)
Commercial lines 82.5 95.8 1.0 2.7 2.6 22.4 (0.2) —
Total 68.7 66.7 8.7 7.7 (0.9) (0.9) 0.2 0.2
Catastrophe losses were $510 million and $2.26 billion in the thirdquarter and first nine months of 2019, respectively, compared to $625million and $1.89 billion in the third quarter and first nine months of 2018,respectively.
We define a “catastrophe” as an event that produces pre-tax lossesbefore reinsurance in excess of $1 million and involves multiple first partypolicyholders, or a winter weather event that produces a number of claims inexcess of a preset, per-event threshold of average claims in a specific area,occurring within a certain amount of time following the event. Catastrophesare caused by various natural events including high winds, winter stormsand freezes, tornadoes, hailstorms, wildfires, tropical storms, tsunamis,hurricanes, earthquakes and volcanoes. We are also exposed to man-madecatastrophic events, such as certain types of terrorism or industrial
accidents. The nature and level of catastrophes in any period cannot bereliably predicted.
Loss estimates are generally based on claim adjuster inspections andthe application of historical loss development factors. Our loss estimates arecalculated in accordance with the coverage provided by our policies. Autopolicyholders generally have coverage for physical damage due to flood ifthey have purchased optional auto comprehensive coverage. Ourhomeowners policies specifically exclude coverage for losses caused byflood.
Over time, we have limited our aggregate insurance exposure tocatastrophe losses in certain regions of the country that are subject to highlevels of natural catastrophes, limited by our participation in various statefacilities.
64 www.allstate.com

Allstate Protection Segment Results
Catastrophe losses by the size of event Three months ended September 30, 2019
($ in millions) Number of events Claims and
claims expense
Combinedratio
impact
Averagecatastrophe
loss per event
Size of catastrophe loss
Greater than $250 million — —% $ — — % — $ —
$101 million to $250 million — — — — — —
$50 million to $100 million 2 7.1 178 34.9 2.0 89
Less than $50 million 26 92.9 314 61.6 3.6 12
Total 28 100.0% 492 96.5 5.6 18
Prior year reserve reestimates (3) (0.6) —
Prior quarter reserve reestimates 21 4.1 0.2 Total catastrophe losses $ 510 100.0 % 5.8
Nine months ended September 30, 2019
Number of events Claims and
claims expense
Combinedratio
impact
Averagecatastrophe
loss per event
Size of catastrophe loss
Greater than $250 million 1 1.1% $ 360 15.9 % 1.4 $ 360
$101 million to $250 million 1 1.1 194 8.6 0.7 194
$50 million to $100 million 9 10.4 666 29.5 2.6 74
Less than $50 million 76 87.4 989 43.7 3.8 13
Total 87 100.0% 2,209 97.7 8.5 25
Prior year reserve reestimates 53 2.3 0.2 Total catastrophe losses $ 2,262 100.0 % 8.7
Catastrophe losses by the type of event Three months ended September 30, Nine months ended September 30,
($ in millions) Numberof events 2019
Number ofevents 2018
Number ofevents 2019
Number ofevents 2018
Hurricanes/Tropical storms 3 $ 113 2 $ 75 3 $ 113 3 $ 79
Tornadoes — — 1 9 4 390 1 9
Wind/Hail 25 379 34 376 74 1,583 77 1,567
Wildfires — — 7 62 — — 9 78
Other events — — — — 6 123 2 114
Prior year reserve reestimates (3) 1 53 45
Prior quarter reserve reestimates 21 102 — —
Total catastrophe losses 28 $ 510 44 $ 625 87 $ 2,262 92 $ 1,892
Third Quarter 2019 Form 10-Q 65

Segment Results Allstate Protection
Expense ratio decreased 1.5 points and 1.0 points in the third quarter and first nine months of 2019, respectively, compared to the same periods of 2018.
Impact of specific costs and expenses on the expense ratio
Three months ended September
30, Nine months ended September
30,
2019 2018 2019 2018
Amortization of DAC 13.3 13.6 13.5 13.6
Advertising expense 2.3 2.9 2.2 2.3
Other costs and expenses (1) 8.1 8.6 8.1 8.8
Restructuring and related charges — 0.1 0.1 0.2
Total expense ratio 23.7 25.2 23.9 24.9
(1) Other revenue is deducted from other costs and expenses in the expense ratio calculation. Reserve reestimates were favorable in the third quarter and first nine months of 2019 and primarily related to favorable personal lines auto injury
coverage development, partially offset by strengthening in our homeowners business related to catastrophe reestimates.
Total reserves, net of reinsurance (estimated cost of outstanding claims) as of January 1, by line of business
($ in millions) 2019 2018
Auto $ 14,378 $ 14,051
Homeowners 2,157 2,205
Other personal lines 1,489 1,489
Commercial lines 801 616
Total Allstate Protection $ 18,825 $ 18,361
Reserve reestimates Three months ended September 30, Nine months ended September 30,
Reserve
reestimate (1) Effect on
combined ratio (2) Reserve
reestimate (1) Effect on
combined ratio (2)
($ in millions, except ratios) 2019 2018 2019 2018 2019 2018 2019 2018
Auto $ (153) $ (99) (1.7) (1.2) $ (311) $ (356) (1.2) (1.4)
Homeowners 2 (13) — (0.1) 59 46 0.2 0.2
Other personal lines 9 3 0.1 — 17 (15) 0.1 (0.1)
Commercial lines — 42 — 0.5 17 107 — 0.4
Total Allstate Protection (3) $ (142) $ (67) (1.6) (0.8) $ (218) $ (218) (0.9) (0.9)
Allstate brand $ (143) $ (64) (1.6) (0.8) $ (224) $ (216) (0.9) (0.9)
Esurance brand — — — — 3 — — —
Encompass brand 1 (3) — — 3 (2) — —
Total Allstate Protection $ (142) $ (67) (1.6) (0.8) $ (218) $ (218) (0.9) (0.9)
(1) Favorable reserve reestimates are shown in parentheses.(2) Ratios are calculated using Allstate Protection premiums earned.(3) Prior year reserve reestimates included in catastrophe losses totaled $3 million favorable and $53 million unfavorable in the three and nine months ended September 30, 2019,
respectively, and $1 million and $45 million unfavorable in the three and nine months ended September 30, 2018, respectively.
66 www.allstate.com

Allstate Protection Segment Results
The following table presents premiums written, policies in force (“PIF”) and underwriting income (loss) by line of business for Allstate brand, Esurancebrand, Encompass brand and Allstate Protection as of or for the nine months ended September 30, 2019. Detailed analysis of underwriting results, premiumswritten and earned, and the combined ratios, including loss and expense ratios, are discussed in the brand sections.
Premiums written, policies in force and underwriting income (loss)
($ in millions) Allstate brand Esurance brand Encompass brand Allstate Protection
Premiums written Amount Percent to total
brand Amount Percent to total
brand Amount Percent to total
brand Amount Percent to total
Auto $ 16,466 67.8% $ 1,526 94.0 % $ 413 52.9 % $ 18,405 69.0 %
Homeowners 5,784 23.8 92 5.6 307 39.4 6,183 23.2
Other personal lines 1,369 5.7 6 0.4 60 7.7 1,435 5.4
Commercial lines 659 2.7 — — — — 659 2.4
Total $ 24,278 100.0% $ 1,624 100.0 % $ 780 100.0 % $ 26,682 100.0 %
Percent to total Allstate Protection 91.0% 6.1 % 2.9 % 100.0 %
PIF (thousands)
Auto 20,339 65.3% 1,543 91.0 % 496 61.4 % 22,378 66.5 %
Homeowners 6,237 20.0 104 6.2 235 29.1 6,576 19.5
Other personal lines 4,341 14.0 48 2.8 77 9.5 4,466 13.3
Commercial lines 228 0.7 — — — — 228 0.7
Total 31,145 100.0% 1,695 100.0 % 808 100.0 % 33,648 100.0 %
Percent to total Allstate Protection 92.6% 5.0 % 2.4 % 100.0 %
Underwriting income (loss)
Auto $ 1,328 68.9% $ (2) 33.3 % $ 6 (60.0)% $ 1,332 69.8 %
Homeowners 424 22.0 (6) 100.0 (15) 150.0 403 21.1
Other personal lines 129 6.7 2 (33.3) (1) 10.0 130 6.8
Commercial lines 1 0.1 — — — — 1 0.1
Other business lines 45 2.3 — — — — 45 2.3
Answer Financial — — — — — — (2) (0.1)
Total $ 1,927 100.0% $ (6) 100.0 % $ (10) 100.0 % $ 1,909 100.0 %
When analyzing premium measures and statistics for all three brands the following calculations are used as described below.
• PIF: Policy counts are based on items rather than customers. A multi-car customer would generate multiple item (policy) counts, even if allcars were insured under one policy. Commercial lines PIF for sharedeconomy agreements typically reflect contracts that cover multipledrivers as opposed to individual drivers.
• New issued applications: Item counts of automobile or homeownerinsurance applications for insurance policies that were issued duringthe period, regardless of whether the customer was previously insuredby another Allstate Protection brand. Allstate brand includesautomobiles added by existing customers when they exceed thenumber allowed (currently 10) on a policy.
• Average premium-gross written (“average premium”): Gross premiumswritten divided by issued item count. Gross premiums written includethe impacts from discounts, surcharges and ceded reinsurancepremiums and exclude the impacts from mid-term premiumadjustments and premium refund accruals. Average premiumsrepresent the appropriate policy term for each line. Allstate andEsurance brand policy terms are 6 months for auto and 12 months forhomeowners. Encompass brand policy terms are generally 12 monthsfor auto and homeowners.
• Renewal ratio: Renewal policy item counts issued during the period,based on contract effective dates, divided by the total policy itemcounts issued 6 months prior for auto (generally 12 months prior forEncompass brand) or 12 months prior for homeowners.
Third Quarter 2019 Form 10-Q 67

Segment Results Allstate Protection: Allstate brand
Underwriting results
($ in millions)
Three months ended September
30, Nine months ended September
30,
2019 2018 2019 2018
Premiums written $ 8,472 $ 8,010 $ 24,278 $ 22,945
Premiums earned $ 7,997 $ 7,587 $ 23,651 $ 22,386
Other revenue 153 152 439 431
Claims and claims expense (5,245) (5,109) (16,098) (14,815)
Amortization of DAC (1,108) (1,076) (3,316) (3,157)
Other costs and expenses (941) (956) (2,726) (2,751)
Restructuring and related charges 2 (11) (23) (43)
Underwriting income $ 858 $ 587 $ 1,927 $ 2,051
Catastrophe losses $ 447 $ 588 $ 2,112 $ 1,754
Underwriting income (loss) by line of business
Auto $ 429 $ 391 $ 1,328 $ 1,387
Homeowners 361 217 424 591
Other personal lines (1) 51 6 129 118
Commercial lines 1 (42) 1 (84)
Other business lines (2) 16 15 45 39
Underwriting income $ 858 $ 587 $ 1,927 $ 2,051
(1) Other personal lines include renters, condominium, landlord and other personal lines products.(2) Other business lines represent Ivantage.
Changes in underwriting results from prior year by component (1)
($ in millions)
Three months ended
September 30, Nine months ended
September 30,
2019 2018 2019 2018
Underwriting income (loss) - prior period $ 587 $ 473 $ 2,051 $ 1,464
Changes in underwriting income (loss) from: Increase (decrease) premiums earned 410 392 1,265 1,030
Increase (decrease) other revenue 1 3 8 6
(Increase) decrease losses: Incurred losses, excluding catastrophe losses and reserve reestimates (354) (301) (944) (662)
Catastrophe losses, excluding reserve reestimates 139 244 (347) 736
Catastrophe reserve reestimates 2 (5) (11) (40)
Non-catastrophe reserve reestimates 77 (152) 19 (153)
Losses subtotal (136) (214) (1,283) (119)
(Increase) decrease expenses (4) (67) (114) (330)
Underwriting income $ 858 $ 587 $ 1,927 $ 2,051
(1) The 2019 column presents changes in 2019 compared to 2018. The 2018 column presents changes in 2018 compared to 2017.
Underwriting income increased to $858 million from $587 million in the third quarter 2018 primarily due to increased premiums earned, lower catastrophelosses and higher favorable non-catastrophe prior year reserve reestimates, partially offset by higher non-catastrophe losses. Underwriting income decreasedto $1.93 billion in the first nine months of 2019 from $2.05 billion in the first nine months of 2018 primarily due to higher claim severity, catastrophe losses andpolicy acquisition and renewal costs, partially offset by increased premiums earned.
68 www.allstate.com

Allstate Protection: Allstate brand Segment Results
Premiums written and earned by line of business
($ in millions) Three months ended September
30, Nine months ended September
30,
Premiums written 2019 2018 2019 2018
Auto $ 5,599 $ 5,357 $ 16,466 $ 15,719
Homeowners 2,143 2,008 5,784 5,422
Other personal lines 492 472 1,369 1,322
Subtotal – Personal lines 8,234 7,837 23,619 22,463
Commercial lines 238 173 659 482
Total $ 8,472 $ 8,010 $ 24,278 $ 22,945
Premiums earned Auto $ 5,446 $ 5,210 $ 16,171 $ 15,387
Homeowners 1,868 1,769 5,511 5,238
Other personal lines 447 432 1,324 1,284
Subtotal – Personal lines 7,761 7,411 23,006 21,909
Commercial lines 236 176 645 477
Total $ 7,997 $ 7,587 $ 23,651 $ 22,386
Auto premium measures and statistics
Three months ended September
30, Nine months ended September
30,
2019 2018 2019 2018
PIF (thousands) 20,339 19,912 20,339 19,912
New issued applications (thousands) 753 755 2,248 2,223
Average premium (6-month policy) $ 589 $ 572 $ 583 $ 567
Renewal ratio (%) 88.6 88.7 88.7 88.5
Approved rate changes (1): Number of locations (2) 24 20 43 42
Total brand (%) (3) (5) 0.5 — 1.9 0.8
Location specific (%) (4) (5) 3.1 1.0 3.8 2.7
(1) Rate changes do not include rating plan enhancements, including the introduction of discounts and surcharges that result in no change in the overall rate level in a location.These rate changes do not reflect initial rates filed for insurance subsidiaries initially writing business in a location.
(2) Allstate brand operates in 50 states, the District of Columbia and 5 Canadian provinces.(3) Represents the impact in the states, the District of Columbia and Canadian provinces where rate changes were approved during the period as a percentage of total brand
2018 and 2017 premiums written, respectively.(4) Represents the impact in the states, the District of Columbia and Canadian provinces where rate changes were approved during the period as a percentage of their respective
total 2018 and 2017 premiums written in those same locations.(5) Based on historical premiums written in the locations noted above, the annual impact of rate changes approved for auto totaled $110 million and $407 million in the three and
nine months ended September 30, 2019, respectively, compared to $12 million and $165 million in the three and nine months ended September 30, 2018, respectively.
Auto insurance premiums written totaled $5.60 billion in the thirdquarter of 2019, a 4.5% increase from $5.36 billion in the third quarter of2018 and $16.47 billion in the first nine months of 2019, a 4.8% increasefrom $15.72 billion in the first nine months of 2018. Factors impactingpremiums written were:
• 2.1% or 427 thousand increase in PIF as of September 30, 2019 comparedto September 30, 2018. Auto PIF increased in 37 states, including 6 ofour largest 10 states, as of September 30, 2019 compared toSeptember 30, 2018.
• 0.1 point decrease and 0.2 point increase in the renewal ratio in the thirdquarter and first nine months of 2019, respectively, compared to thesame periods of 2018.
• 0.3% decrease and 1.1% increase in new issued applications in the thirdquarter and first nine months of 2019, respectively, compared to thesame periods of 2018.
• 3.0% and 2.8% increase in average premium in the third quarter and firstnine months of 2019, respectively, compared to the same periods of2018, primarily due to rate increases.
Third Quarter 2019 Form 10-Q 69

Segment Results Allstate Protection: Allstate brand
Homeowners premium measures and statistics
Three months ended September
30, Nine months ended September
30,
2019 2018 2019 2018
PIF (thousands) 6,237 6,145 6,237 6,145
New issued applications (thousands) 226 219 652 629
Average premium (12-month policy) $ 1,308 $ 1,238 $ 1,292 $ 1,227
Renewal ratio (%) 88.4 88.3 88.3 87.9
Approved rate changes (1): Number of locations (2) 12 10 32 28
Total brand (%) (3) 0.3 0.4 2.5 1.6
Location specific (%) (3) 3.5 3.6 5.1 4.1
(1) Includes rate changes approved based on our net cost of reinsurance.(2) Allstate brand operates in 50 states, the District of Columbia and 5 Canadian provinces.(3) Based on historical premiums written in the locations noted above, the annual impact of rate changes approved for homeowners totaled $21 million and $184 million in the
three and nine months ended September 30, 2019, respectively, compared to $30 million and $115 million in the three and nine months ended September 30, 2018,respectively.
Homeowners insurance premiums written totaled $2.14 billion in thethird quarter of 2019, a 6.7% increase from $2.01 billion in the third quarterof 2018 and $5.78 billion in the first nine months of 2019, a 6.7% increasefrom $5.42 billion in the first nine months of 2018. Factors impactingpremiums written were:
• 1.5% or 92 thousand increase in PIF as of September 30, 2019 compared toSeptember 30, 2018. Homeowners PIF increased in 33 states, including 6of our largest 10 states, as of September 30, 2019 compared toSeptember 30, 2018.
• 0.1 point and 0.4 point increase in the renewal ratio in the third quarterand first nine months of 2019, respectively, compared to the sameperiods of 2018.
• 3.2% and 3.7% increase in new issued applications in the third quarterand first nine months of 2019, respectively, compared to the sameperiods of 2018.
• 5.7% and 5.3% increase in average premium in the third quarter and firstnine months of 2019, respectively, compared to the same periods of2018, primarily due to rate increases and inflationary increases ininsured home valuations.
• $10 million increase in the cost of our catastrophe reinsurance programto $75 million in the third quarter of 2019 from $65 million in the thirdquarter of 2018, and $12 million increase to $211 million in the first ninemonths of 2019 from $199 million in the first nine months of 2018.Catastrophe placement premiums are recorded primarily in the Allstatebrand and are a reduction of premium.
Other personal lines premiums written totaled $492 million in the thirdquarter of 2019, a 4.2% increase from $472 million in the third quarter of2018 and $1.37 billion in the first nine months of 2019, a 3.6% increase from$1.32 billion in the first nine months of 2018. The increase in both periodswas primarily due to increases in personal umbrella and condominiuminsurance premiums.
Commercial lines premiums written totaled $238 million in the thirdquarter of 2019, a 37.6% increase from $173 million in the third quarter of2018 and $659 million in the nine months of 2019, a 36.7% increase from$482 million in the first nine months of 2018. The increase in both periodswas primarily due to growth in our shared economy agreements, includingone with a large a transportation network company to provide commercialauto insurance coverage in 15 states. Growth in premiums written is notreflected in growth in policies in force as the shared economy agreementstypically reflect contracts that cover multiple drivers as opposed to individualdrivers.
70 www.allstate.com

Allstate Protection: Allstate brand Segment Results
Combined ratios by line of business Loss ratio Expense ratio (1) Combined ratio
2019 2018 2019 2018 2019 2018
Three months ended September 30, Auto 67.7 67.1 24.4 25.4 92.1 92.5
Homeowners 57.9 63.6 22.8 24.1 80.7 87.7
Other personal lines 62.0 70.6 26.6 28.0 88.6 98.6
Commercial lines 83.5 104.6 16.1 19.3 99.6 123.9
Total 65.6 67.4 23.7 24.9 89.3 92.3
Nine months ended September 30, Auto 67.2 65.7 24.6 25.3 91.8 91.0
Homeowners 69.8 65.4 22.5 23.3 92.3 88.7
Other personal lines 64.2 64.0 26.1 26.8 90.3 90.8
Commercial lines 82.5 95.8 17.3 21.8 99.8 117.6
Total 68.1 66.2 23.8 24.6 91.9 90.8
(1) Other revenue is deducted from operating costs and expenses in the expense ratio calculation.
Loss ratios by line of business
Loss ratio Effect of catastrophe losses Effect of prior year reserve
reestimates
Effect of catastrophe lossesincluded in prior year
reserve reestimates
2019 2018 2019 2018 2019 2018 2019 2018
Three months ended September 30, Auto 67.7 67.1 2.4 2.2 (2.8) (1.9) — (0.1)
Homeowners 57.9 63.6 15.7 23.6 (0.1) (1.0) (0.1) 0.1
Other personal lines 62.0 70.6 5.1 11.8 2.2 1.8 (0.3) —
Commercial lines 83.5 104.6 0.9 3.4 — 23.9 (0.4) —
Total 65.6 67.4 5.6 7.8 (1.8) (0.8) (0.1) —
Nine months ended September 30, Auto 67.2 65.7 2.3 1.8 (1.9) (2.3) (0.1) (0.2)
Homeowners 69.8 65.4 28.7 25.7 0.8 0.6 0.8 1.3
Other personal lines 64.2 64.0 10.9 9.7 1.4 (0.3) 0.3 (0.2)
Commercial lines 82.5 95.8 1.0 2.7 2.6 22.4 (0.2) —
Total 68.1 66.2 9.0 7.8 (0.9) (1.0) 0.2 0.1
Frequency and severity statistics, which are influenced by drivingpatterns, inflation and other factors, are provided to describe the trends inloss costs of the business. Our reserving process incorporates changes inloss patterns, operational statistics and changes in claims reportingprocesses to determine our best estimate of recorded reserves. We use thefollowing statistics to evaluate losses:
• Paid claim frequency (1) is calculated as annualized notice counts closed withpayment in the period divided by the average of PIF with the applicablecoverage during the period.
• Gross claim frequency (1) is calculated as annualized notice counts received inthe period divided by the average of PIF with the applicable coverage during theperiod. Gross claim frequency includes all actual notice counts, regardless oftheir current status (open or closed) or their ultimate disposition (closed with apayment or closed without payment).
• Paid claim severity is calculated by dividing the sum of paid losses and lossexpenses by claims closed with a payment during the period.
• Percent change in frequency or severity statistic is calculated as the amount of
increase or decrease in the paid or gross claim frequency or severity in thecurrent period compared to the same period in the prior year divided by the prioryear paid or gross claim frequency or severity.
(1) Frequency statistics exclude counts associated with catastrophe events.
Paid claim frequency trends will often differ from gross claim frequencytrends due to differences in the timing of when notices are received andwhen claims are settled. For property damage claims, paid frequency trendsreflect smaller differences as timing between opening and settlement isgenerally less. For bodily injury, gross frequency trends reflect emergingtrends since the difference in timing between opening and settlement ismuch greater and gross frequency does not typically experience the samevolatility in quarterly fluctuations seen in paid frequency. In evaluatingfrequency, we typically rely upon paid frequency trends for physical damagecoverages such as property damage and gross frequency for casualtycoverages such as bodily injury to provide an indicator
Third Quarter 2019 Form 10-Q 71

Segment Results Allstate Protection: Allstate brand
of emerging trends in overall claim frequency while also providing insightsfor our analysis of severity.
We are continuing to implement new technology and processimprovements that provide continued loss cost accuracy, efficientprocessing and enhanced customer experiences that are simple, fast andproduce high degrees of satisfaction. We use Digital Operating Centers tohandle auto physical damage claims countrywide utilizing our virtualestimation capabilities, which includes estimating damage with photos andvideo through the use of QuickFoto Claim® and Virtual Assist®. We are alsoleveraging virtual capabilities to handle property claims by estimatingdamage through video with Virtual Assist and aerial imagery using satellites,airplanes and drones. These organizational and process changes impactfrequency and severity statistics as changes in claim opening and closingpractices and shifts in timing, if any, can impact comparisons to priorperiods.
Auto loss ratio increased 0.6 points and 1.5 points in the third quarterand first nine months of 2019, respectively, compared to the same periodsof 2018, primarily due to higher non-catastrophe and catastrophe losses,partially offset by increased premiums earned and higher favorable non-catastrophe prior year reserve reestimates.
Property damage paid claim frequency increased 0.2% in the thirdquarter of 2019 and decreased 1.6% in the first nine months of 2019,respectively, compared to the same periods of 2018. Property damage paidclaim severities increased 5.1% and 6.6% in the third quarter and first ninemonths of 2019, respectively, compared to the same periods of 2018 due tothe impact of higher costs to repair more sophisticated newer modelvehicles, higher third-party subrogation demands and increased number oftotal losses.
Bodily injury gross claim frequency decreased 0.5% and 1.2% in thethird quarter and first nine months of 2019, respectively, compared to thesame periods of 2018. Bodily injury incurred losses reflect costs generallyconsistent with medical care inflation indices.
Homeowners loss ratio decreased 5.7 points in the third quarter of 2019compared to the same period of 2018 primarily due to lower catastrophes,increased premiums earned and improved claim frequency, partially offsetby increased claim severity. Homeowners loss ratio increased 4.4 points inthe first nine months of 2019 compared to the same period of 2018 primarilydue to higher catastrophe losses and increased claim severity, partiallyoffset by increased premiums earned and improved claim frequency. Paidclaim frequency excluding catastrophe losses decreased 6.4% and 4.3% inthe third quarter and first nine months of 2019, respectively, compared to thesame periods of 2018. Paid claim severity excluding catastrophe lossesincreased 13.2% and 8.6% in the third quarter and first nine months of2019, respectively, compared to the same periods of 2018, as weexperienced increased claim severity in fire and water perils. Homeownerpaid claim severity can be impacted by both the mix of perils and themagnitude of specific losses paid during the quarter.
Other personal lines loss ratio decreased 8.6 points in the third quarterof 2019 compared to the same period of 2018 primarily due to lowercatastrophe losses and increased premiums earned. Other personal linesloss ratio increased 0.2 points in the first nine months of 2019 compared tothe same period of 2018 primarily due to higher catastrophe losses, partiallyoffset by increased premiums earned.
Commercial lines loss ratio decreased 21.1 points and 13.3 points inthe third quarter and first nine months of 2019, respectively, compared to thesame periods of 2018, primarily due to increased premiums earned andlower unfavorable non-catastrophe prior year reserve reestimates, partiallyoffset by higher severity. Commercial lines recorded losses related to theshared economy agreements are primarily based on original pricingexpectations given limited loss experience.
Impact of specific costs and expenses on the expense ratio
Three months ended September
30, Nine months ended September
30,
2019 2018 2019 2018
Amortization of DAC 13.8 14.2 14.0 14.1
Advertising expense 2.1 2.5 2.0 2.1
Other costs and expenses (1) 7.8 8.1 7.7 8.2
Restructuring and related charges — 0.1 0.1 0.2
Total expense ratio 23.7 24.9 23.8 24.6
(1) Other revenue is deducted from other costs and expenses in the expense ratio calculation.
Expense ratio decreased 1.2 points in the third quarter of 2019compared to the third quarter of 2018 primarily due to lower agent incentivecompensation and advertising costs. Expense ratio decreased 0.8 points inthe first nine months of 2019 compared to the first nine months of 2018primarily related to lower agent incentive compensation and operatingexpenses.
Amortization of DAC primarily includes agent remuneration andpremium taxes. Allstate agency total incurred base commissions, variablecompensation and bonuses in total in the third quarter and first nine monthsof 2019 were lower than the same periods of 2018.
72 www.allstate.com

Allstate Protection: Esurance brand Segment Results
Underwriting results
($ in millions)
Three months ended September
30, Nine months ended September
30,
2019 2018 2019 2018
Premiums written $ 562 $ 519 $ 1,624 $ 1,471
Premiums earned $ 528 $ 479 $ 1,555 $ 1,375
Other revenue 23 21 63 61
Claims and claims expense (424) (366) (1,227) (1,051)
Amortization of DAC (11) (10) (34) (31)
Other costs and expenses (122) (134) (363) (368)
Restructuring and related charges — — — (2)
Underwriting loss $ (6) $ (10) $ (6) $ (16)
Catastrophe losses $ 16 $ 14 $ 47 $ 46
Underwriting income (loss) by line of business
Auto $ (9) $ (5) $ (2) $ 1
Homeowners 1 (6) (6) (18)
Other personal lines 2 1 2 1
Underwriting loss $ (6) $ (10) $ (6) $ (16)
Changes in underwriting results from prior year by component (1)
($ in millions)
Three months ended
September 30, Nine months ended
September 30,
2019 2018 2019 2018
Underwriting income (loss) - prior period $ (10) $ (19) $ (16) $ (55)
Changes in underwriting income (loss) from: Increase (decrease) premiums earned 49 47 180 95
Increase (decrease) other revenue 2 4 2 11
(Increase) decrease incurred claims and claims expense (“losses”): Incurred losses, excluding catastrophe losses and reserve reestimates (54) (32) (171) (58)
Catastrophe losses, excluding reserve reestimates (4) 4 (2) 6
Catastrophe reserve reestimates 2 (1) 1 (3)
Non-catastrophe reserve reestimates (2) — (4) 1
Losses subtotal (58) (29) (176) (54)
(Increase) decrease expenses 11 (13) 4 (13)
Underwriting loss $ (6) $ (10) $ (6) $ (16)(1) The 2019 column presents changes in 2019 compared to 2018. The 2018 column presents changes in 2018 compared to 2017.
Underwriting loss totaled $6 million in the third quarter of 2019 compared to $10 million in the third quarter of 2018 and was $6 million in the first ninemonths of 2019 compared to $16 million in the first nine months of 2018 as higher premiums earned and decreased operating expenses were offset byincreased loss costs.
Premiums written and earned by line of business
($ in millions) Three months ended September
30, Nine months ended September
30,
Premiums written 2019 2018 2019 2018
Auto $ 525 $ 487 $ 1,526 $ 1,387
Homeowners 35 30 92 78
Other personal lines 2 2 6 6
Total $ 562 $ 519 $ 1,624 $ 1,471
Premiums earned Auto $ 498 $ 455 $ 1,469 $ 1,305
Homeowners 28 22 80 64
Other personal lines 2 2 6 6
Total $ 528 $ 479 $ 1,555 $ 1,375
Third Quarter 2019 Form 10-Q 73
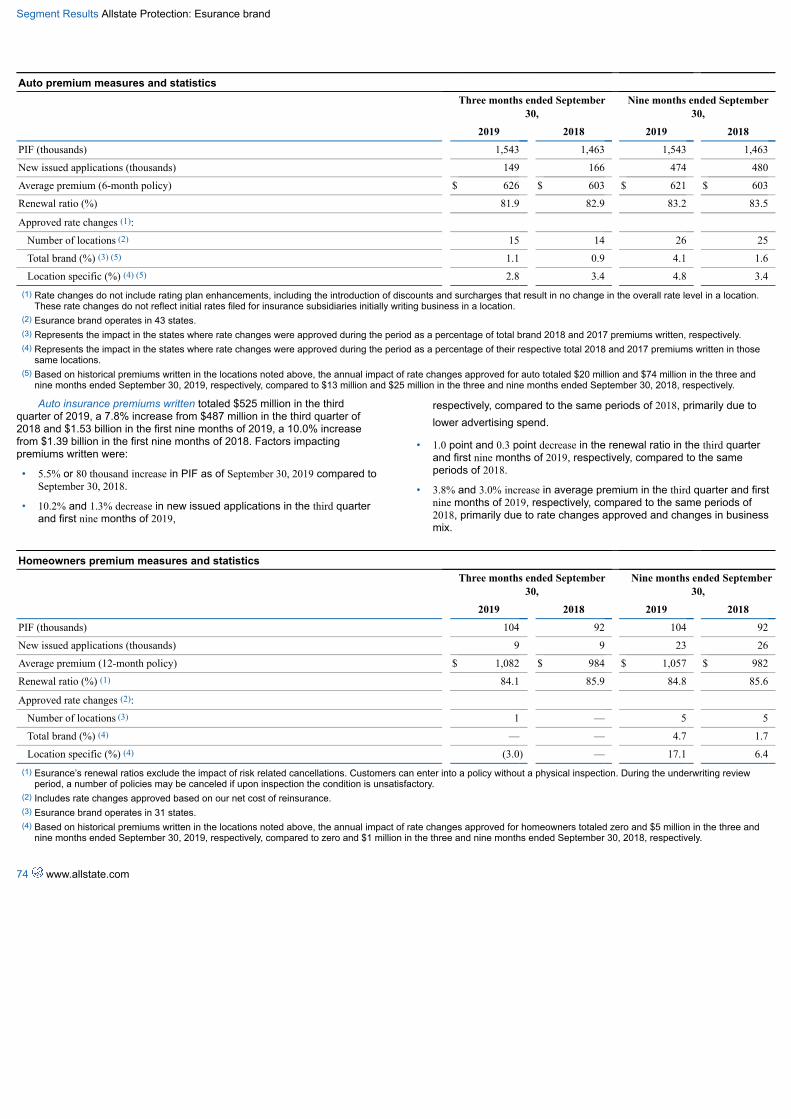
Segment Results Allstate Protection: Esurance brand
Auto premium measures and statistics
Three months ended September
30, Nine months ended September
30,
2019 2018 2019 2018
PIF (thousands) 1,543 1,463 1,543 1,463
New issued applications (thousands) 149 166 474 480
Average premium (6-month policy) $ 626 $ 603 $ 621 $ 603
Renewal ratio (%) 81.9 82.9 83.2 83.5
Approved rate changes (1): Number of locations (2) 15 14 26 25
Total brand (%) (3) (5) 1.1 0.9 4.1 1.6
Location specific (%) (4) (5) 2.8 3.4 4.8 3.4(1) Rate changes do not include rating plan enhancements, including the introduction of discounts and surcharges that result in no change in the overall rate level in a location.
These rate changes do not reflect initial rates filed for insurance subsidiaries initially writing business in a location.(2) Esurance brand operates in 43 states.(3) Represents the impact in the states where rate changes were approved during the period as a percentage of total brand 2018 and 2017 premiums written, respectively.(4) Represents the impact in the states where rate changes were approved during the period as a percentage of their respective total 2018 and 2017 premiums written in those
same locations.(5) Based on historical premiums written in the locations noted above, the annual impact of rate changes approved for auto totaled $20 million and $74 million in the three and
nine months ended September 30, 2019, respectively, compared to $13 million and $25 million in the three and nine months ended September 30, 2018, respectively.
Auto insurance premiums written totaled $525 million in the thirdquarter of 2019, a 7.8% increase from $487 million in the third quarter of2018 and $1.53 billion in the first nine months of 2019, a 10.0% increasefrom $1.39 billion in the first nine months of 2018. Factors impactingpremiums written were:
• 5.5% or 80 thousand increase in PIF as of September 30, 2019 compared toSeptember 30, 2018.
• 10.2% and 1.3% decrease in new issued applications in the third quarterand first nine months of 2019,
respectively, compared to the same periods of 2018, primarily due tolower advertising spend.
• 1.0 point and 0.3 point decrease in the renewal ratio in the third quarterand first nine months of 2019, respectively, compared to the sameperiods of 2018.
• 3.8% and 3.0% increase in average premium in the third quarter and firstnine months of 2019, respectively, compared to the same periods of2018, primarily due to rate changes approved and changes in businessmix.
Homeowners premium measures and statistics
Three months ended September
30, Nine months ended September
30,
2019 2018 2019 2018
PIF (thousands) 104 92 104 92
New issued applications (thousands) 9 9 23 26
Average premium (12-month policy) $ 1,082 $ 984 $ 1,057 $ 982
Renewal ratio (%) (1) 84.1 85.9 84.8 85.6
Approved rate changes (2): Number of locations (3) 1 — 5 5
Total brand (%) (4) — — 4.7 1.7
Location specific (%) (4) (3.0) — 17.1 6.4(1) Esurance’s renewal ratios exclude the impact of risk related cancellations. Customers can enter into a policy without a physical inspection. During the underwriting review
period, a number of policies may be canceled if upon inspection the condition is unsatisfactory.(2) Includes rate changes approved based on our net cost of reinsurance.(3) Esurance brand operates in 31 states.(4) Based on historical premiums written in the locations noted above, the annual impact of rate changes approved for homeowners totaled zero and $5 million in the three and
nine months ended September 30, 2019, respectively, compared to zero and $1 million in the three and nine months ended September 30, 2018, respectively.
74 www.allstate.com

Allstate Protection: Esurance brand Segment Results
Homeowners insurance premiums written totaled $35 million in the thirdquarter of 2019, a 16.7% increase from $30 million in the third quarter of2018, and $92 million in the first nine months of 2019, a 17.9% increasefrom $78 million in the first nine months of 2018. Factors impactingpremiums written were:
• 13.0% or 12 thousand increase in PIF as of September 30, 2019 comparedto September 30, 2018.
• 10.0% and 7.6% increase in average premium in the third quarter and firstnine months of 2019, respectively, compared to the same periods of2018, primarily due to approved rate changes. As of September 30, 2019,Esurance continues to
write homeowners insurance in 31 states with lower hurricane risk,contributing to lower average premium compared to the industry.
• 1.8 point and 0.8 point decrease in the renewal ratio in the third quarterand first nine months of 2019, respectively, compared to the sameperiods of 2018.
• No change in new issued applications in the third quarter of 2019compared to the same period in 2018. 11.5% decrease in new issuedapplications in the first nine months of 2019 compared to the sameperiod of 2018.
Combined ratios by line of business Loss ratio Expense ratio (1) Combined ratio
2019 2018 2019 2018 2019 2018
Three months ended September 30, Auto 81.1 76.0 20.7 25.1 101.8 101.1
Homeowners 71.4 90.9 25.0 36.4 96.4 127.3
Total 80.3 76.4 20.8 25.7 101.1 102.1
Nine months ended September 30, Auto 78.8 75.8 21.3 24.1 100.1 99.9
Homeowners 82.5 92.2 25.0 35.9 107.5 128.1
Total 78.9 76.5 21.5 24.7 100.4 101.2
(1) Other revenue is deducted from operating costs and expenses in the expense ratio calculation.
Loss ratios by line of business
Loss ratio Effect of catastrophe losses Effect of prior year reserve
reestimates
Effect of catastrophe lossesincluded in prior year
reserve reestimates
2019 2018 2019 2018 2019 2018 2019 2018
Three months ended September 30, Auto 81.1 76.0 1.8 1.8 — — (0.2) —
Homeowners 71.4 90.9 25.0 27.3 — 4.5 — 4.5
Total 80.3 76.4 3.0 2.9 — — (0.2) 0.2
Nine months ended September 30, Auto 78.8 75.8 1.5 1.9 0.2 — — —
Homeowners 82.5 92.2 31.3 32.8 — 1.6 1.3 3.2
Total 78.9 76.5 3.0 3.4 0.2 — — 0.1
Auto loss ratio increased 5.1 points and 3.0 points in the third quarter and first nine months of 2019, respectively, compared to the same periods of 2018,primarily due to higher claim severity and to a lesser extent higher frequency, partially offset by higher premiums earned.
Homeowners loss ratio decreased 19.5 points and 9.7 points in the third quarter and first nine months of 2019, respectively, compared to the same periodsof 2018, primarily due to lower frequency and higher premiums earned, partially offset by higher claim severity.
Third Quarter 2019 Form 10-Q 75

Segment Results Allstate Protection: Esurance brand
Impact of specific costs and expenses on the expense ratio
Three months ended September
30, Nine months ended September
30,
2019 2018 2019 2018
Amortization of DAC 2.1 2.1 2.2 2.2
Advertising expense 8.0 10.6 7.8 9.2
Amortization of purchased intangibles — 0.2 0.1 0.1
Other costs and expenses (1) 10.7 12.8 11.4 13.0
Restructuring and related charges — — — 0.2
Total expense ratio 20.8 25.7 21.5 24.7(1) Other revenue is deducted from other costs and expenses in the expense ratio calculation.
Expense ratio decreased 4.9 points and 3.2 points in the third quarterand first nine months of 2019, respectively, compared to the same periodsof 2018. Other costs and expenses, including sales personnel and otherunderwriting costs related to customer acquisition, were 2.1 points and 1.6points lower in the third quarter and first nine months of 2019, respectively,compared to the same periods of 2018 reflecting continued implementationof digital self-service capabilities and premium growth.
Esurance uses a direct distribution model, therefore its primaryacquisition-related costs are advertising as opposed to commissions. TheEsurance advertising expense ratio decreased 2.6 points and 1.4 points inthe third quarter and first nine months of 2019, respectively, compared to thesame periods of 2018, primarily due to initial costs associated with a newmarketing campaign launched during the third quarter of 2018.
76 www.allstate.com

Allstate Protection: Encompass brand Segment Results
Underwriting results
($ in millions)
Three months ended September
30, Nine months ended September
30,
2019 2018 2019 2018
Premiums written $ 278 $ 271 $ 780 $ 769
Premiums earned $ 257 $ 254 $ 764 $ 767
Other revenue 2 1 4 4
Claims and claims expense (193) (162) (534) (493)
Amortization of DAC (48) (47) (144) (143)
Other costs and expenses (32) (34) (97) (107)
Restructuring and related charges (1) (1) (3) (6)
Underwriting (loss) income $ (15) $ 11 $ (10) $ 22
Catastrophe losses $ 47 $ 23 $ 103 $ 92
Underwriting income (loss) by line of business
Auto $ 1 $ 8 $ 6 $ 22
Homeowners (13) (3) (15) (9)
Other personal lines (3) 6 (1) 9
Underwriting (loss) income $ (15) $ 11 $ (10) $ 22
Changes in underwriting results from prior year by component (1)
($ in millions)
Three months ended
September 30, Nine months ended
September 30,
2019 2018 2019 2018
Underwriting income (loss) - prior period $ 11 $ 26 $ 22 $ (16)
Changes in underwriting loss from: Increase (decrease) premiums earned 3 (15) (3) (59)
Increase (decrease) other revenue 1 — — —
(Increase) decrease incurred claims and claims expense (“losses”): Incurred losses, excluding catastrophe losses and reserve reestimates (3) 5 (23) 48
Catastrophe losses, excluding reserve reestimates (24) (9) (13) 51
Catastrophe reserve reestimates — (2) 2 (12)
Non-catastrophe reserve reestimates (4) 3 (7) 10
Losses subtotal (31) (3) (41) 97
(Increase) decrease expenses 1 3 12 —
Underwriting (loss) income $ (15) $ 11 $ (10) $ 22(1) The 2019 column presents changes in 2019 compared to 2018. The 2018 column presents changes in 2018 compared to 2017.
Underwriting loss was $15 million in the third quarter of 2019 compared to underwriting income of $11 million in the third quarter of 2018, primarily due tohigher catastrophe losses. Underwriting loss was $10 million in the first nine months of 2019, compared to underwriting income of $22 million in the first ninemonths of 2018, primarily due to higher auto claim severity and higher catastrophe losses, partially offset by lower operating expenses.
Third Quarter 2019 Form 10-Q 77

Segment Results Allstate Protection: Encompass brand
Premiums written and earned by line of business
($ in millions) Three months ended September
30, Nine months ended September
30,
2019 2018 2019 2018
Premiums written Auto $ 147 $ 143 $ 413 $ 407
Homeowners 110 106 307 300
Other personal lines 21 22 60 62
Total $ 278 $ 271 $ 780 $ 769
Premiums earned Auto $ 136 $ 133 $ 405 $ 402
Homeowners 101 100 299 301
Other personal lines 20 21 60 64
Total $ 257 $ 254 $ 764 $ 767
Auto premium measures and statistics
Three months ended September
30, Nine months ended September
30,
2019 2018 2019 2018
PIF (thousands) 496 504 496 504
New issued applications (thousands) 21 21 63 57
Average premium (12-month policy) $ 1,137 $ 1,115 $ 1,134 $ 1,112
Renewal ratio (%) 78.9 76.4 78.3 74.1
Approved rate changes (1): Number of locations (2) 6 7 9 14
Total brand (%) (3) (5) 0.3 0.6 0.8 1.9
Location specific (%) (4) (5) 2.4 4.6 3.7 5.9(1) Rate changes that are indicated based on loss trend analysis to achieve a targeted return will continue to be pursued. Rate changes do not include rating plan enhancements,
including the introduction of discounts and surcharges that result in no change in the overall rate level in a location. These rate changes do not reflect initial rates filed forinsurance subsidiaries initially writing business in a location.
(2) Encompass brand operates in 40 states and the District of Columbia.(3) Represents the impact in the states and the District of Columbia where rate changes were approved during the period as a percentage of total brand 2018 and 2017 premiums
written, respectively.(4) Represents the impact in the states and the District of Columbia where rate changes were approved during the period as a percentage of their respective total 2018 and 2017
premiums written in those same locations.(5) Based on historical premiums written in the locations noted above, the annual impact of rate changes approved for auto totaled $2 million and $4 million in the three and nine
months ended September 30, 2019, respectively, compared to $3 million and $10 million in the three and nine months ended September 30, 2018, respectively.
Auto insurance premiums written totaled $147 million in the thirdquarter of 2019, a 2.8% increase from $143 million in the third quarter of2018, and $413 million in the first nine months of 2019, a 1.5% increasefrom $407 million in the first nine months of 2018, with the top 10 statesrepresenting approximately 70% of premiums written. Growth continues tobe driven by increases in average premiums, offset by lower PIF. Factorsimpacting premiums written were:
• 1.6% or 8 thousand decrease in PIF as of September 30, 2019 compared toSeptember 30, 2018.
• 2.5 point and 4.2 point increase in the renewal ratio in the third quarterand first nine months of 2019, respectively, compared to the sameperiods of 2018.
• 10.5% increase in new issued applications in the first nine months of 2019compared to the same period of 2018.
• 2.0% increase in average premium in both the third quarter and first ninemonths of 2019, respectively, compared to the same periods of 2018,primarily due to rate changes over the past 12 months.
78 www.allstate.com

Allstate Protection: Encompass brand Segment Results
Homeowners premium measure and statistics
Three months ended September
30, Nine months ended September
30,
2019 2018 2019 2018
PIF (thousands) 235 240 235 240
New issued applications (thousands) 12 10 33 28
Average premium (12-month policy) $ 1,807 $ 1,730 $ 1,787 $ 1,710
Renewal ratio (%) 83.0 80.9 82.6 79.5
Approved rate changes (1): Number of locations (2) 11 11 21 19
Total brand (%) (3) 3.5 2.7 6.3 3.5
Location specific (%) (3) 9.4 7.8 9.2 7.5(1) Includes rate changes approved based on our net cost of reinsurance.(2) Encompass brand operates in 40 states and the District of Columbia.(3) Based on historical premiums written in the locations noted above, the annual impact of rate changes approved for homeowners totaled $14 million and $26 million in the three
and nine months ended September 30, 2019, respectively, compared to $12 million and $15 million in the three and nine months ended September 30, 2018, respectively.
Homeowners insurance premiums written totaled $110 million in thethird quarter of 2019, a 3.8% increase from $106 million in the third quarterof 2018, and $307 million in the first nine months of 2019, a 2.3% increasefrom $300 million in the first nine months of 2018, with the top 10 statesrepresenting approximately 70% of premiums written. Factors impactingpremiums written were:
• 2.1% or 5 thousand decrease in PIF as of September 30, 2019 compared toSeptember 30, 2018.
• 2.1 point and 3.1 point increase in the renewal ratio in the third quarterand first nine months of 2019,
respectively, compared to the same periods of 2018.
• 20.0% and 17.9% increase in new issued applications in the third quarterand first nine months of 2019, respectively, compared to the sameperiods of 2018.
• 4.5% increase in average premium in both the third quarter and first ninemonths of 2019, respectively, compared to the same periods of 2018,primarily due to rate changes over the past 12 months.
Combined ratios by line of business
Loss ratio Expense ratio (1) Combined ratio
2019 2018 2019 2018 2019 2018
Three months ended September 30, Auto 69.1 62.4 30.2 31.6 99.3 94.0
Homeowners 81.2 70.0 31.7 31.9 112.9 101.9
Other personal lines 85.0 42.8 30.0 28.6 115.0 71.4
Total 75.1 63.8 30.7 31.9 105.8 95.7
Nine months ended September 30, Auto 67.2 62.2 31.3 32.3 98.5 94.5
Homeowners 73.6 69.8 31.4 32.8 105.0 102.6
Other personal lines 70.0 51.5 31.7 34.4 101.7 85.9
Total 69.9 64.3 31.4 32.8 101.3 97.1(1) Other revenue is deducted from operating costs and expenses in the expense ratio calculation.
Third Quarter 2019 Form 10-Q 79

Segment Results Allstate Protection: Encompass brand
Loss ratios by line of business
Loss ratio Effect of catastrophe losses Effect of prior year reserve
reestimates
Effect of catastrophe lossesincluded in prior year
reserve reestimates
2019 2018 2019 2018 2019 2018 2019 2018
Three months ended September 30, Auto 69.1 62.4 2.9 1.5 (0.7) (1.5) — (0.8)
Homeowners 81.2 70.0 40.6 20.0 3.0 3.0 3.0 3.0
Other personal lines 85.0 42.8 10.0 4.8 (5.0) (19.1) (5.0) —
Total 75.1 63.8 18.3 9.1 0.4 (1.2) 0.8 0.8
Nine months ended September 30, Auto 67.2 62.2 2.5 1.7 (2.5) (0.7) — (0.2)
Homeowners 73.6 69.8 29.4 26.6 5.1 3.7 3.7 4.0
Other personal lines 70.0 51.5 8.3 7.8 (3.3) (15.6) (1.7) 1.6
Total 69.9 64.3 13.5 12.0 0.4 (0.3) 1.3 1.6
Auto loss ratio increased 6.7 points and 5.0 points in the third quarter and first nine months of 2019, respectively, compared to the same periods of 2018,primarily due to increased claim severity and higher catastrophe losses, partially offset by favorable prior year reserve reestimates.
Homeowners loss ratio increased 11.2 points and 3.8 points in the third quarter and first nine months of 2019, respectively, compared to the same periodsof 2018, primarily due to higher catastrophe losses and unfavorable prior year reserve reestimates, partially offset by lower non-catastrophe losses driven byfavorable claim frequency.
Impact of specific costs and expenses on the expense ratio
Three months ended September
30, Nine months ended September
30,
2019 2018 2019 2018
Amortization of DAC 18.7 18.5 18.8 18.7
Advertising expense — — 0.1 0.1
Other costs and expenses (1) 11.6 13.0 12.1 13.2
Restructuring and related charges 0.4 0.4 0.4 0.8
Total expense ratio 30.7 31.9 31.4 32.8
(1) Other revenue is deducted from other costs and expenses in the expense ratio calculation.
Expense ratio decreased 1.2 points and 1.4 points in the third quarter and first nine months of 2019, respectively, compared to the same periods of 2018,primarily due to lower technology and operating expenses.
80 www.allstate.com

Discontinued Lines and Coverages Segment Results
Discontinued Lines and Coverages Segment
Underwriting results
($ in millions)
Three months ended September
30, Nine months ended September
30,
2019 2018 2019 2018
Claims and claims expense $ (98) $ (80) $ (103) $ (85)
Operating costs and expenses (1) — (2) (1)
Underwriting loss $ (99) $ (80) $ (105) $ (86)
Underwriting loss totaled $99 million and $105 million in the third quarter and first nine months of 2019, respectively, compared to $80 million and $86million in the third quarter and first nine months of 2018, respectively.
Claims and claims expense
($ in millions) Three months ended September
30, Nine months ended September
30,
2019 2018 2019 2018
Asbestos claims $ 28 $ 44 $ 28 $ 44
Environmental claims 36 20 36 20
Other discontinued lines 34 16 39 21
Total $ 98 $ 80 $ 103 $ 85
Our 2019 annual reserve review, using established industry andactuarial best practices, resulted in unfavorable reestimates of $95 million,including $28 million for asbestos exposures, primarily related to newreported information and settlement agreements, including bankruptcyproceedings; $36 million for environmental exposures primarily related tothe reporting of additional clean-up sites; $37 million for other exposuresbased on new reported information, partially offset by a $6 million decreasein the allowance for future uncollectible reinsurance. Our 2018 annualreserve review, resulted in unfavorable reestimates of $76 million, including$44 million for asbestos exposures, $20 million for environmental exposuresand $13 million for other exposures, partially offset by a $1 million decreasein the allowance for future uncollectible reinsurance.
The allowance for uncollectible reinsurance recoverables was $59million and $65 million as of September 30, 2019 and December 31, 2018,respectively. The allowance represents 10.9% and 11.8% of the relatedreinsurance recoverable balances as of September 30, 2019 and December31, 2018, respectively.
We believe that our reserves are appropriately established based onavailable facts, technology, laws, regulations, and assessments of otherpertinent factors and characteristics of exposure (e.g., claim activity,potential liability, jurisdiction, products versus non-products exposure)presented by individual policyholders, assuming no change in the legal,legislative or economic environment. However, as we progress with theresolution of disputed claims in the courts and arbitrations and withnegotiations and settlements, our reported losses may be more variable.
Reserves for asbestos, environmental and other discontinued lines claims before and after the effects of reinsurance
($ in millions) September 30, 2019 December 31, 2018
Asbestos claims Gross reserves $ 1,227 $ 1,266
Reinsurance (387) (400)
Net reserves 840 866
Environmental claims Gross reserves 230 209
Reinsurance (42) (39)
Net reserves 188 170
Other discontinued lines Gross reserves 425 389
Reinsurance (47) (34)
Net reserves 378 355
Total Gross reserves 1,882 1,864
Reinsurance (476) (473)
Net reserves $ 1,406 $ 1,391
Third Quarter 2019 Form 10-Q 81

Segment Results Discontinued Lines and Coverages
Reserves by type of exposure before and after the effects of reinsurance($ in millions) September 30, 2019 December 31, 2018
Direct excess commercial insurance Gross reserves (1) $ 998 $ 973
Reinsurance (2) (358) (355)
Net reserves 640 618
Assumed reinsurance coverage Gross reserves (3) 623 625
Reinsurance (4) (55) (53)
Net reserves 568 572
Direct primary commercial insurance Gross reserves (5) 167 171
Reinsurance (6) (49) (48)
Net reserves 118 123
Other run-off business Gross reserves 16 19
Reinsurance (13) (16)
Net reserves 3 3
Unallocated loss adjustment expenses Gross reserves 78 76
Reinsurance (1) (1)
Net reserves 77 75
Total Gross reserves 1,882 1,864
Reinsurance (476) (473)
Net reserves $ 1,406 $ 1,391
(1) Gross reserves as of September 30, 2019, comprised 66% case reserves and 34% incurred but not reported (“IBNR”) reserves. Approximately 72% of the total gross casereserves are subject to settlement agreements. In the first nine months of 2019, total gross payments from case reserves were $71 million with approximately 79% attributableto settlement agreements. Reserves as of December 31, 2018, comprised 67% case reserves and 33% IBNR reserves.
(2) Ceded reserves as of September 30, 2019, comprised 75% case reserves and 25% IBNR reserves. Approximately 79% of the total ceded case reserves are subject tosettlement agreements. In the first nine months of 2019, reinsurance billings of ceded case reserves were $28 million with approximately 83% attributable to settlementagreements. Reserves as of December 31, 2018, comprised 78% case reserves and 22% IBNR reserves.
(3) Gross reserves as of September 30, 2019, comprised 34% case reserves and 66% IBNR reserves. In the first nine months of 2019, total gross payments from case reserveswere $25 million. Reserves as of December 31, 2018, comprised 34% case reserves and 66% IBNR reserves.
(4) Ceded reserves as of September 30, 2019, comprised 36% case reserves and 64% IBNR reserves. In the first nine months of 2019, reinsurance billings of ceded casereserves were $1 million. Reserves as of December 31, 2018, comprised 37% case reserves and 63% IBNR reserves.
(5) Gross reserves as of September 30, 2019, comprised 55% case reserves and 45% IBNR reserves. In the first nine months of 2019, total gross payments from case reserveswere $12 million. Reserves as of December 31, 2018, comprised 58% case reserves and 42% IBNR reserves.
(6) Ceded reserves as of September 30, 2019, comprised 77% case reserves and 23% IBNR reserves. In the first nine months of 2019, reinsurance billings of ceded casereserves were $1 million. Reserves as of December 31, 2018, comprised 78% case reserves and 22% IBNR reserves.
Total net reserves were $1.41 billion, including $689 million or 49% ofestimated IBNR reserves as of September 30, 2019 compared to total netreserves of $1.39 billion, including $693 million or 50% of estimated IBNRreserves as of December 31, 2018.
Total gross payments were $27 million and $112 million for the thirdquarter and first nine months of 2019, respectively, primarily related topayments on settlement agreements reached with several insureds
on large claims, mainly asbestos related losses, where the scope ofcoverages has been agreed upon. The claims associated with thesesettlement agreements are expected to be substantially paid out over thenext several years as qualified claims are submitted by these insureds.Reinsurance collections were $12 million and $38 million for the thirdquarter and first nine months of 2019, respectively.
82 www.allstate.com

Service Businesses Segment Results
Service Businesses Segment
Summarized financial information
($ in millions)
Three months ended September
30, Nine months ended September
30,
2019 2018 2019 2018
Premiums written $ 364 $ 358 $ 1,082 $ 942
Revenues Premiums $ 312 $ 275 $ 912 $ 813
Other revenue 47 16 142 48
Intersegment insurance premiums and service fees (1) 44 31 110 89
Net investment income 11 7 30 18
Realized capital gains and losses 4 — 21 (6)
Total revenues 418 329 1,215 962
Costs and expenses Claims and claims expense (93) (90) (271) (272)
Amortization of DAC (139) (118) (400) (341)
Operating costs and expenses (171) (124) (480) (357)
Restructuring and related charges (1) — — (1)
Amortization of purchased intangibles (31) (20) (93) (61)
Impairment of purchased intangibles — — (55) —
Total costs and expenses (435) (352) (1,299) (1,032)
Income tax benefit 4 3 19 13
Net loss applicable to common shareholders $ (13) $ (20) $ (65) $ (57)
Adjusted net income $ 8 $ 1 $ 35 $ —
Realized capital gains and losses, after-tax 4 (1) 17 (5)
Amortization of purchased intangibles, after-tax (25) (16) (74) (48)
Impairment of purchased intangibles, after-tax — — (43) —
Tax Legislation expense — (4) — (4)
Net loss applicable to common shareholders $ (13) $ (20) $ (65) $ (57)
Allstate Protection Plans (2) $ 15 $ 7 $ 48 $ 14
Allstate Dealer Services 6 3 19 10
Arity (1) (4) (4) (10)
Allstate Identity Protection (3) (7) — (14) —
Allstate Roadside Services (5) (5) (14) (14)
Adjusted net income $ 8 $ 1 $ 35 $ —
Allstate Protection Plans 89,783 52,151
Allstate Dealer Services 4,224 4,402
Allstate Identity Protection 1,318 —
Allstate Roadside Services 617 671
Policies in force as of September 30 (in thousands) 95,942 57,224(1) Primarily related to Arity and Allstate Roadside Services and are eliminated in our condensed consolidated financial statements.(2) SquareTrade, which sells consumer protection plans using the Allstate Protection Plans name in the U.S., acquired PlumChoice on November 30, 2018 and iCracked on
February 12, 2019.(3) InfoArmor, which sells identity protection plans using the Allstate Identity Protection name, was acquired on October 5, 2018.
Net loss applicable to common shareholders was $13 million in the thirdquarter of 2019 compared to $20 million in the third quarter of 2018 and $65million in the first nine months of 2019 compared to $57 million in the firstnine months of 2018. The nine months ended September 30, 2019 includeda $55 million intangible asset impairment in the second
quarter related to the change in trade name from SquareTrade to AllstateProtection Plans.
Adjusted net income was $8 million in the third quarter of 2019compared to $1 million in the third quarter of 2018. Adjusted net income was$35 million in the first nine months of 2019 compared to zero in
Third Quarter 2019 Form 10-Q 83

Segment Results Service Businesses
the first nine months of 2018. The improvement in both periods wasprimarily due to growth of Allstate Protection Plans and favorable lossexperience of both Allstate Protection Plans and Allstate Dealer Services,partially offset by higher operating expenses related to investing in growth ofAllstate Protection Plans and Allstate Identity Protection and integrating theAllstate Identity Protection business.
Total revenues increased 27.1% to $418 million in the third quarter of2019 from $329 million in the third quarter of 2018 and 26.3% to $1.22billion in the first nine months of 2019 from $962 million in the first ninemonths of 2018. The increase in both periods was primarily due to AllstateProtection Plans’ growth through its U.S. retail and international distributionpartners and the acquisitions of Allstate Identity Protection, PlumChoice andiCracked, partially offset by declines in Allstate Roadside Serviceswholesale and retail business.
Premiums written increased 1.7% or $6 million to $364 million in thethird quarter of 2019 from $358 million in the third quarter of 2018 due toincreased premiums written by Allstate Dealer Services, partially offset bydecreases in Allstate Protection Plans as new business did not offset retailerlosses earlier in the year. Premiums written increased 14.9% or $140 millionto $1.08 billion in the first nine months of 2019 from $942 million in the firstnine months of 2018 due to growth at Allstate Protection Plans andincreased premiums written by Allstate Dealer Services, partially offset bydeclines in Allstate Roadside Services wholesale and retail business.
PIF of 95.9 million as of September 30, 2019, increased by 67.7%compared to 57.2 million as of September 30, 2018, due to continuedgrowth at Allstate Protection Plans.
Intersegment premiums and service fees increased by 41.9% or $13million to $44 million in third quarter 2019 from $31 million in third quarter2018 and 23.6% or $21 million to $110 million in the first nine months of2019 from $89 million in the first nine months of 2018. The increase in bothperiods was primarily due to increased auto connections and device salesthrough Arity’s device and mobile data collection services.
Other revenue increased by $31 million to $47 million in third quarter2019 from $16 million in third quarter 2018 and $94 million to $142 million inthe first nine months of 2019 from $48 million in the first nine months of2018, due to the acquisition of Allstate Identity Protection and AllstateProtection Plans’ acquisitions of PlumChoice and iCracked. All of therevenue from these acquired businesses is reported as other revenue. SeeNote 3 of the condensed consolidated financial statements for furtherdetails.
Claims and claims expense increased 3.3% to $93 million in thirdquarter 2019 compared to $90 million in third quarter 2018, primarily due tobusiness growth at Allstate Protection Plans. Claims and claims expensedecreased 0.4% to $271 million in the first nine months of 2019 compared to$272 million in the first nine months of 2018, primarily due to improved lossexperience at Allstate Protection Plans and Allstate
Dealer Services, partially offset by business growth at both of thesebusinesses.
Amortization of DAC increased 17.8% or $21 million to $139 million inthe third quarter of 2019 from $118 million in the third quarter of 2018 and17.3% or $59 million to $400 million in the first nine months of 2019compared to $341 million in the first nine months of 2018. The increase inboth periods is in line with the growth experienced at Allstate ProtectionPlans and Allstate Dealer Services.
Operating costs and expenses increased 37.9% or $47 million to $171million in the third quarter of 2019 from $124 million in the third quarter of2018 and 34.5% or $123 million to $480 million in the first nine months of2019 compared to $357 million in the first nine months of 2018. Theincrease in both periods was primarily due to the acquisitions of AllstateIdentity Protection, PlumChoice and iCracked, product development costs,investments in growing the business at Allstate Protection Plans and AllstateIdentity Protection and integrating the Allstate Identity Protection business.Allstate Protection Plans is investing in specific growth initiatives, which willincrease operating costs and expenses during fourth quarter 2019.
Amortization and impairment of purchased intangibles relates to theacquisitions of Allstate Protection Plans in 2017 and Allstate IdentityProtection in 2018. We recognized $486 million and $257 million ofintangible assets subject to amortization for Allstate Protection Plans andAllstate Identity Protection, respectively. We recorded amortization expenseof $31 million and $93 million in the third quarter and first nine months of2019, respectively, compared to $20 million and $61 million in the thirdquarter and first nine months of 2018, respectively.
During the second quarter of 2019, we made the decision to phase-outthe use of the SquareTrade trade name in the United States and sellconsumer protection plans under the Allstate Protection Plans name. TheSquareTrade trade name will continue to be used outside of the UnitedStates. This change required an impairment evaluation of the intangibleasset recognized for SquareTrade’s trade name that was recorded whenSquareTrade was acquired in 2017. As a result, the Company recognizedimpairment of $55 million during the second quarter of 2019.
84 www.allstate.com

Allstate Life Segment Results
Allstate Life Segment
Summarized financial information
($ in millions)
Three months ended September
30, Nine months ended September
30,
2019 2018 2019 2018
Revenues
Premiums and contract charges $ 331 $ 322 $ 1,001 $ 975
Other revenue 31 30 91 84
Net investment income 128 128 380 380
Realized capital gains and losses 5 (3) 1 (9)
Total revenues 495 477 1,473 1,430
Costs and expenses
Contract benefits (202) (193) (632) (593)
Interest credited to contractholder funds (85) (72) (227) (213)
Amortization of DAC (84) (38) (141) (106)
Operating costs and expenses (77) (88) (259) (257)
Restructuring and related charges — (1) (1) (3)
Total costs and expenses (448) (392) (1,260) (1,172)
Income tax expense (7) (30) (39) (61)
Net income applicable to common shareholders $ 40 $ 55 $ 174 $ 197
Adjusted net income $ 44 $ 75 $ 185 $ 226
Realized capital gains and losses, after-tax 4 (3) — (7)
Valuation changes on embedded derivatives not hedged, after-tax (9) — (9) —
DAC and DSI amortization related to realized capital gains and losses, after-tax 1 (1) (2) (6)
Tax Legislation (expense) benefit — (16) — (16)
Net income applicable to common shareholders $ 40 $ 55 $ 174 $ 197
Reserve for life-contingent contract benefits as of September 30 $ 2,718 $ 2,672
Contractholder funds as of September 30 $ 7,733 $ 7,650
Policies in force as of September 30 by distribution channel (in thousands) Allstate agencies 1,818 1,820
Closed channels 185 198
Total 2,003 2,018
Net income applicable to common shareholders was $40 million in thethird quarter of 2019 compared to $55 million in the third quarter of 2018and was $174 million in the first nine months of 2019 compared to $197million in the first nine months of 2018.
Adjusted net income was $44 million in the third quarter of 2019compared to $75 million in the third quarter of 2018, primarily due to higheramortization of DAC related to our annual review of assumptions, partiallyoffset by lower operating costs and expenses and higher premiums.Adjusted net income was $185
million in the first nine months of 2019 compared to $226 million in the firstnine months of 2018, primarily due to higher contract benefits andamortization of DAC, partially offset by higher premiums and other revenue.
Premiums and contract charges increased 2.8% or $9 million in thethird quarter of 2019 and 2.7% or $26 million in the first nine months of 2019compared to the same periods of 2018. The increase in both periodsprimarily relates to growth in traditional life insurance as well as lowerreinsurance premiums ceded.
Third Quarter 2019 Form 10-Q 85

Segment Results Allstate Life
Premiums and contract charges by product
Three months ended September
30, Nine months ended September
30,
($ in millions) 2019 2018 2019 2018
Traditional life insurance premiums $ 155 $ 149 $ 465 $ 443
Accident and health insurance premiums — — 1 1
Interest-sensitive life insurance contract charges 176 173 535 531
Premiums and contract charges (1) $ 331 $ 322 $ 1,001 $ 975(1) Contract charges related to the cost of insurance totaled $123 million and $119 million for the third quarter of 2019 and 2018, respectively, and $375 million and $366 million for
the first nine months of 2019 and 2018, respectively.
Other revenue increased 3.3% or $1 million in the third quarter of 2019and 8.3% or $7 million in the first nine months of 2019 compared to thesame periods of 2018, primarily due to higher gross dealer concessionsearned on Allstate agencies’ sales of non-proprietary fixed annuities, mutualfunds and variable annuities.
Contract benefits increased 4.7% or $9 million in the third quarter of2019 and 6.6% or $39 million in the first nine months of 2019 compared tothe same periods of 2018, primarily due to higher claim experience oninterest-sensitive life insurance, partially offset by a favorable changeassociated with the annual review of assumptions.
Our annual review of assumptions in third quarter 2019 resulted in a $5million decrease in reserves primarily for secondary guarantees on interest-sensitive life insurance due to utilizing more refined policy level informationand assumptions. In third quarter 2018, the review resulted in a $1 millionincrease in reserves due to higher than anticipated policyholder persistency.
Benefit spread reflects our mortality and morbidity results using thedifference between premiums and contract charges earned for the cost ofinsurance and contract benefits (“benefit spread”). Benefit spread increased1.3% to $76 million in the third quarter of
2019 compared to $75 million in the third quarter of 2018, primarily due togrowth in traditional life premiums and a favorable change in reservesassociated with the annual review of assumptions, partially offset by higherclaim experience on interest-sensitive life insurance. Benefit spreaddecreased 3.7% to $209 million in the first nine months of 2019 compared to$217 million in the first nine months of 2018, primarily due to higher claimexperience on interest-sensitive life insurance, partially offset by growth intraditional life premiums.
Interest credited to contractholder funds increased 18.1% or $13 millionin the third quarter of 2019 and 6.6% or $14 million in the first nine monthsof 2019 compared to the same periods of 2018. Valuation changes onderivatives embedded in equity-indexed universal life contracts that are nothedged increased interest credited to contractholder funds by $12 million inboth the third quarter and first nine months of 2019 compared to zero in thesame periods of 2018.
Investment spread reflects the difference between net investmentincome and interest credited to contractholder funds (“investment spread”)and is used to analyze the impact of net investment income and interestcredited to contractholder funds on net income.
Investment spread
Three months ended September
30, Nine months ended September
30,($ in millions) 2019 2018 2019 2018
Investment spread before valuation changes on embedded derivatives not hedged $ 55 $ 56 $ 165 $ 167
Valuation changes on derivatives embedded in equity-indexed universal life contracts that are nothedged (12) — (12) —
Total investment spread $ 43 $ 56 $ 153 $ 167
Investment spread before valuation changes on embedded derivativesnot hedged decreased 1.8% to $55 million in the third quarter of 2019compared to $56 million in the third quarter of 2018 and 1.2% to $165million in the first nine months of 2019 compared to $167 million in the firstnine months of 2018.
Amortization of DAC increased $46 million and $35 million in the thirdquarter and first nine months of 2019, respectively, compared to the sameperiods of 2018, primarily due to higher amortization acceleration forchanges in assumptions, partially offset by lower gross profits on interest-sensitive life insurance.
86 www.allstate.com

Allstate Life Segment Results
Components of amortization of DAC
Three months ended September
30, Nine months ended September
30,
($ in millions) 2019 2018 2019 2018
Amortization of DAC before amortization relating to realized capital gains and losses, valuationchanges on embedded derivatives that are not hedged, and changes in assumptions $ 27 $ 31 $ 80 $ 93
Amortization relating to realized capital gains and losses (1) and valuation changes on embeddedderivatives that are not hedged (1) 2 3 8
Amortization acceleration for changes in assumptions (‘‘DAC unlocking’’) 58 5 58 5
Total amortization of DAC $ 84 $ 38 $ 141 $ 106
(1) The impact of realized capital gains and losses on amortization of DAC is dependent upon the relationship between the assets that give rise to the gain or loss and the productliability supported by the assets. Fluctuations result from changes in the impact of realized capital gains and losses on actual and expected gross profits.
Our annual comprehensive review of assumptions underlying estimatedfuture gross profits for our interest-sensitive life contracts coversassumptions for mortality, persistency, expenses, investment returns,including capital gains and losses, interest crediting rates to policyholders,and the effect of any hedges. An assessment is made of future projectionsto ensure
the reported DAC balances reflect current expectations.
In third quarter 2019, the review resulted in an acceleration of DACamortization (decrease to income) of $58 million compared to anacceleration of DAC amortization of $5 million in the prior year period.
Effect on DAC amortization of changes in assumptions relating to gross profit components Nine months ended September 30,
($ in millions) 2019 2018
Investment margin $ 20 $ 11
Benefit margin 38 (7)
Expense margin — 1
Net acceleration $ 58 $ 5
In 2019, DAC amortization acceleration for changes in the investmentmargin component of estimated gross profits was due to lower projectedfuture interest rates and investment returns compared to our previousexpectations. The acceleration related to benefit margin was due todecreased projected interest rates that result in lower projected policyholderaccount values which increases benefits on guaranteed products and morerefined policy level information and assumptions. Less than 10% of theinterest-sensitive life DAC balance relates to policies with secondaryguarantees similar to those that contributed to the DAC amortizationacceleration.
In 2018, DAC amortization acceleration for changes in the investmentmargin component of estimated
gross profits was due to lower projected investment returns. Thedeceleration related to benefit margin was due to a decrease in projectedmortality.
Operating costs and expenses decreased 12.5% or $11 million in thethird quarter of 2019 compared to the third quarter of 2018, primarily due toa reduction in loss contingency expense related to reinsurance as well aslower technology, employee-related and marketing expenses. Operatingcosts and expenses increased 0.8% or $2 million in the first nine months of2019 compared to the first nine months of 2018, primarily due to highercommissions on non-proprietary product sales, partially offset by loweremployee-related expenses.
Analysis of reserves and contractholder funds
Reserve for life-contingent contract benefits
($ in millions) September 30, 2019 December 31, 2018
Traditional life insurance $ 2,592 $ 2,539
Accident and health insurance 126 138
Reserve for life-contingent contract benefits $ 2,718 $ 2,677
Contractholder funds represent interest-bearing liabilities arising from the sale of products such as interest-sensitive life insurance. The balance ofcontractholder funds is equal to the cumulative deposits received and interest credited to the contractholder less cumulative contract benefits, surrenders,withdrawals and contract charges for mortality or administrative expenses.
Third Quarter 2019 Form 10-Q 87

Segment Results Allstate Life
Change in contractholder funds
Three months ended September
30, Nine months ended September
30,($ in millions) 2019 2018 2019 2018
Contractholder funds, beginning balance $ 7,711 $ 7,630 $ 7,656 $ 7,608
Deposits 236 237 712 715
Interest credited 83 71 225 212
Benefits, withdrawals and other adjustments
Benefits (60) (59) (184) (174)
Surrenders and partial withdrawals (65) (64) (198) (196)
Contract charges (176) (176) (526) (527)
Net transfers from separate accounts 2 1 8 5
Other adjustments (1) 2 10 40 7
Total benefits, withdrawals and other adjustments (297) (288) (860) (885)
Contractholder funds, ending balance $ 7,733 $ 7,650 $ 7,733 $ 7,650(1) The table above illustrates the changes in contractholder funds, which are presented gross of reinsurance recoverables on the Condensed Consolidated Statements of
Financial Position. The table above is intended to supplement our discussion and analysis of revenues, which are presented net of reinsurance on the CondensedConsolidated Statements of Operations. As a result, the net change in contractholder funds associated with products reinsured is reflected as a component of the otheradjustments line.
88 www.allstate.com

Allstate Benefits Segment Results
Allstate Benefits Segment
Summarized financial information
Three months ended September
30, Nine months ended September
30,
($ in millions) 2019 2018 2019 2018
Revenues
Premiums and contract charges $ 291 $ 285 $ 863 $ 854
Net investment income 21 19 61 57
Realized capital gains and losses 2 2 8 —
Total revenues 314 306 932 911
Costs and expenses
Contract benefits (161) (159) (449) (451)
Interest credited to contractholder funds (9) (8) (26) (25)
Amortization of DAC (33) (26) (111) (103)
Operating costs and expenses (69) (68) (211) (207)
Total costs and expenses (272) (261) (797) (786)
Income tax expense (9) (10) (29) (27)
Net income applicable to common shareholders $ 33 $ 35 $ 106 $ 98
Adjusted net income $ 31 $ 33 $ 99 $ 98
Realized capital gains and losses, after-tax 2 2 7 —
Net income applicable to common shareholders $ 33 $ 35 $ 106 $ 98
Benefit ratio (1) 55.3 55.8 52.0 52.8
Operating expense ratio (2) 23.7 23.9 24.4 24.2
Reserve for life-contingent contract benefits as of September 30 $ 1,033 $ 1,007
Contractholder funds as of September 30 $ 912 $ 902
Policies in force as of September 30 (in thousands) 4,287 4,241
(1) Benefit ratio is calculated as contract benefits divided by premiums and contract charges.(2) Operating expense ratio is calculated as operating costs and expenses divided by premiums and contract charges.
Net income applicable to common shareholders was $33 million in thethird quarter of 2019 compared to $35 million in the third quarter of 2018and was $106 million in the first nine months of 2019 compared to $98million in the first nine months of 2018.
Adjusted net income was $31 million in the third quarter of 2019compared to $33 million in the third quarter of 2018, primarily due to higherDAC amortization related to our annual review of assumptions, partiallyoffset by higher premiums. Adjusted net income was $99 million in the firstnine
months of 2019 compared to $98 million in the first nine months of 2018,primarily due to higher premiums, partially offset by higher DACamortization.
Premiums and contract charges increased 2.1% or $6 million in thethird quarter of 2019 and 1.1% or $9 million in the first nine months of 2019compared to the same periods of 2018. The increase in both periodsprimarily related to growth in critical illness, life and hospital indemnity(included in other health) products.
Third Quarter 2019 Form 10-Q 89

Segment Results Allstate Benefits
Premiums and contract charges by product
Three months ended September
30, Nine months ended September
30,($ in millions) 2019 2018 2019 2018
Life $ 41 $ 39 $ 117 $ 115
Accident 76 75 226 224
Critical illness 121 119 363 359
Short-term disability 27 27 80 81
Other health 26 25 77 75
Premiums and contract charges $ 291 $ 285 $ 863 $ 854
Contract benefits increased 1.3% or $2 million in the third quarter of2019 compared to the third quarter of 2018, primarily due to higher claimexperience on critical illness and disability products, partially offset byfavorable mortality experience on life products. Contract benefits decreased0.4% or $2 million in the first nine months of 2019 compared to the first ninemonths of 2018, primarily due to favorable mortality experience on lifeproducts, partially offset by higher claim experience on critical illness anddisability products.
Benefit ratio decreased to 55.3 and 52.0 in the third quarter and the firstnine months of 2019, respectively, compared to 55.8 and 52.8 in the sameperiods of 2018, primarily due to favorable mortality experience on lifeproducts, partially offset by higher claim experience on disability products.
Amortization of DAC increased 26.9% or $7 million in the third quarterof 2019 and 7.8% or $8 million in the first nine months of 2019 compared tothe same periods of 2018, primarily due to an unfavorable adjustmentassociated with our annual review of assumptions. Our annualcomprehensive review of assumptions underlying estimated future grossprofits for our interest-sensitive life contracts resulted in an acceleration ofDAC amortization (decrease to income) of $2 million in third quarter 2019compared to a $4 million deceleration (increase to income) in third quarter2018. The acceleration in third quarter 2019 primarily relates to lowerprojected investment returns, partially offset by favorable projectedpersistency. The deceleration in third quarter 2018 primarily relates tofavorable projected mortality.
Operating costs and expenses
Three months ended September
30, Nine months ended September
30,($ in millions) 2019 2018 2019 2018
Non-deferrable commissions $ 26 $ 27 $ 78 $ 81
General and administrative expenses 43 41 133 126
Total operating costs and expenses $ 69 $ 68 $ 211 $ 207
Operating costs and expenses increased 1.5% or $1 million in the third quarter of 2019 and 1.9% or $4 million in the first nine months of 2019 compared tothe same periods of 2018, primarily due to higher technology and employee-related costs.
Analysis of reserves
Reserve for life-contingent contract benefits
($ in millions) September 30, 2019 December 31, 2018
Traditional life insurance $ 279 $ 269
Accident and health insurance 754 738
Reserve for life-contingent contract benefits $ 1,033 $ 1,007
90 www.allstate.com

Allstate Annuities Segment Results
Allstate Annuities Segment
Summarized financial information
Three months ended September
30, Nine months ended September
30,($ in millions) 2019 2018 2019 2018
Revenues
Contract charges $ 3 $ 5 $ 10 $ 11
Net investment income 251 260 737 843
Realized capital gains and losses 20 51 224 28
Total revenues 274 316 971 882
Costs and expenses
Contract benefits (150) (146) (440) (441)
Interest credited to contractholder funds (75) (83) (234) (251)
Amortization of DAC (2) (2) (5) (5)
Operating costs and expenses (7) (7) (22) (25)
Total costs and expenses (234) (238) (701) (722)
Gain on disposition of operations — 1 3 4
Income tax (expense) benefit (9) 52 (57) 34
Net income applicable to common shareholders $ 31 $ 131 $ 216 $ 198
Adjusted net income $ 16 $ 20 $ 43 $ 99
Realized capital gains and losses, after-tax 16 40 177 22
Valuation changes on embedded derivatives not hedged, after-tax (1) 1 (6) 5
Gain on disposition of operations, after-tax — 1 2 3
Tax legislation benefit — 69 — 69
Net income applicable to common shareholders $ 31 $ 131 $ 216 $ 198
Reserve for life-contingent contract benefits as of September 30 $ 8,627 $ 8,535
Contractholder funds as of September 30 $ 9,159 $ 10,098
Policies in force as of September 30 (in thousands) Deferred annuities 117 130
Immediate annuities 80 85
Total 197 215
Net income applicable to common shareholders was $31 million in thethird quarter of 2019 compared to $131 million in the third quarter of 2018and was $216 million in the first nine months of 2019 compared to $198million in the first nine months of 2018.
Adjusted net income was $16 million in the third quarter of 2019compared to $20 million in the third quarter of 2018, primarily due to highercontract benefits and lower net investment income, partially offset by lowerinterest credited to contractholder funds. Adjusted net income was $43million in the first nine months of 2019 compared to $99 million in the firstnine months of 2018, primarily due to lower net investment income, partiallyoffset by lower interest credited to contractholder funds.
Net investment income decreased 3.5% or $9 million in the third quarterof 2019 compared to the third quarter of 2018 and 12.6% or $106 million inthe first nine months of 2019 compared to the first nine months of 2018,primarily due to lower performance-based investment results, mainly fromlimited partnership interests, and lower average investment balances.
Net realized capital gains in both the third quarter of 2019 and the firstnine months of 2019 primarily related to increased valuation of equityinvestments and gains on sales of fixed income securities.
Contract benefits increased 2.7% or $4 million in the third quarter of2019 compared to the third quarter of 2018, primarily due to worseimmediate annuity mortality experience. Contract benefits decreased 0.2%or $1 million in the first nine months of 2019 compared to the first ninemonths of 2018, primarily due to lower implied interest on immediateannuities with life contingencies, partially offset by worse immediate annuitymortality experience.
Our annual review of assumptions resulted in no adjustment to reservesfor guaranteed benefits in third quarter 2019. In third quarter 2018, thereview resulted in a $2 million increase in reserves primarily for guaranteedwithdrawal benefits on equity-indexed annuities due to higher projectedguaranteed benefits.
We periodically review the adequacy of reserves for immediateannuities with life contingencies using actual experience and currentassumptions. In the event actual experience and current assumptions are
Third Quarter 2019 Form 10-Q 91

Segment Results Allstate Annuities
adverse compared to the original assumptions and a premium deficiency isdetermined to exist, the establishment of a premium deficiency reserve isrequired.
Long-term investment yield assumptions are sensitive to changes ininterest rates. During the third quarter of 2019 our reviews concluded that nopremium deficiency adjustments were necessary although immediateannuities with life contingencies had marginal sufficiency due to the declinein interest rates during 2019.
Benefit spread reflects our mortality results using the differencebetween contract charges earned and contract benefits excluding theportion related to the implied interest on immediate annuities with lifecontingencies. This implied interest totaled $120 million and $360 million inthe third quarter and first nine months of 2019, respectively, compared to$123 million and $370 million in the third quarter and first nine months of2018, respectively. Total benefit spread was $(28) million in third quarter2019 compared to $(20) million in third quarter 2018 and $(74) million in thefirst nine months of 2019 compared to $(65) million in the first nine monthsof 2018.
Interest credited to contractholder funds decreased 9.6% or $8 millionin the third quarter of 2019 and 6.8% or $17 million in the first nine monthsof 2019 compared to the same periods of 2018, primarily due to loweraverage contractholder funds. Valuation changes on derivatives embeddedin equity-indexed annuity contracts that are not hedged increased interestcredited to contractholder funds by $2 million and $8 million in the thirdquarter and first nine months of 2019, respectively, compared to decreasesof zero and $6 million in the third quarter and first nine months of 2018,respectively.
Investment spread reflects the difference between net investmentincome and the sum of interest credited to contractholder funds and theimplied interest on immediate annuities with life contingencies, which isincluded as a component of contract benefits and is used to analyze theimpact of net investment income and interest credited to contractholders onnet income.
Investment spread
Three months ended September
30, Nine months ended September
30,($ in millions) 2019 2018 2019 2018
Investment spread before valuation changes on embedded derivatives not hedged $ 58 $ 54 $ 151 $ 216
Valuation changes on derivatives embedded in equity-indexed annuity contracts that are nothedged (2) — (8) 6
Total investment spread $ 56 $ 54 $ 143 $ 222
Investment spread before valuation changes on embedded derivativesnot hedged increased by $4 million to $58 million in the third quarter of 2019compared to $54 million in the third quarter of 2018 primarily due to lowerinterest credited to contractholder funds, partially offset by lower investmentincome. Investment spread before valuation changes on embeddedderivatives not hedged decreased by $65 million to $151 million in the firstnine months of 2019 compared to $216 million in the first nine months of2018 primarily due to lower investment income, mainly from limitedpartnership
interests, partially offset by lower interest credited to contractholder funds.
To further analyze investment spreads, the following table summarizesthe weighted average investment yield on assets supporting productliabilities, interest crediting rates and investment spreads. Investmentspreads may vary significantly between periods due to the variability ininvestment income, particularly for immediate fixed annuities where theinvestment portfolio includes performance-based investments.
92 www.allstate.com

Allstate Annuities Segment Results
Analysis of investment spread
Three months ended September 30,
Weighted averageinvestment yield
Weighted averageinterest crediting rate
Weighted averageinvestment spreads
2019 2018 2019 2018 2019 2018
Deferred fixed annuities 4.3% 4.1% 2.8% 2.8% 1.5 % 1.3%
Immediate fixed annuities with and withoutlife contingencies 5.9 6.0 5.9 6.0 — —
Nine months ended September 30,
Weighted averageinvestment yield
Weighted averageinterest crediting rate
Weighted averageinvestment spreads
2019 2018 2019 2018 2019 2018
Deferred fixed annuities 4.3% 4.1% 2.7% 2.8% 1.6 % 1.3%
Immediate fixed annuities with and withoutlife contingencies 5.6 6.6 5.9 6.0 (0.3) 0.6
Operating costs and expenses in the third quarter of 2019 were comparable to the third quarter of 2018. Operating costs and expenses decreased by $3million in the first nine months of 2019 compared to the first nine months of 2018, primarily due to lower technology and employee-related costs.
Analysis of reserves and contractholder funds
Product Liabilities($ in millions) September 30, 2019 December 31, 2018
Immediate fixed annuities with life contingencies Sub-standard structured settlements and group pension terminations (1) $ 5,151 $ 4,990
Standard structured settlements and SPIA (2) 3,399 3,425
Other 77 109
Reserve for life-contingent contract benefits $ 8,627 $ 8,524
Deferred fixed annuities $ 6,648 $ 7,156
Immediate fixed annuities without life contingencies 2,382 2,525
Other 129 136
Contractholder funds $ 9,159 $ 9,817(1) Comprises structured settlement annuities for annuitants with severe injuries or other health impairments which increased their expected mortality rate at the time the annuity
was issued (“sub-standard structured settlements”) and group annuity contracts issued to sponsors of terminated pension plans.(2) Comprises structured settlement annuities for annuitants with standard life expectancy (“standard structured settlements”) and single premium immediate annuities (“SPIA”)
with life contingencies.
Contractholder funds represent interest-bearing liabilities arising from the sale of products such as fixed annuities. The balance of contractholder funds isequal to the cumulative deposits received and interest credited to the contractholder less cumulative contract benefits, surrenders, withdrawals and contractcharges for mortality or administrative expenses. The following table shows the changes in contractholder funds.
Changes in contractholder funds
Three months ended September
30, Nine months ended September
30,($ in millions) 2019 2018 2019 2018
Contractholder funds, beginning balance $ 9,347 $ 10,359 $ 9,817 $ 10,936
Deposits 3 3 12 12
Interest credited 75 82 233 248
Benefits, withdrawals and other adjustments
Benefits (143) (148) (419) (452)
Surrenders and partial withdrawals (133) (197) (464) (625)
Contract charges (2) (3) (6) (6)
Net transfers from separate accounts — — (1) —
Other adjustments (1) 12 2 (13) (15)
Total benefits, withdrawals and other adjustments (266) (346) (903) (1,098)
Contractholder funds, ending balance $ 9,159 $ 10,098 $ 9,159 $ 10,098
Third Quarter 2019 Form 10-Q 93

Segment Results Allstate Annuities
(1) The table above illustrates the changes in contractholder funds, which are presented gross of reinsurance recoverables on the Condensed Consolidated Statements ofFinancial Position. The table above is intended to supplement our discussion and analysis of revenues, which are presented net of reinsurance on the CondensedConsolidated Statements of Operations. As a result, the net change in contractholder funds associated with products reinsured is reflected as a component of the otheradjustments line.
Contractholder funds decreased 2.0% and 6.7% in the third quarter andfirst nine months of 2019, respectively, primarily due to the continued runoffof our deferred fixed annuity business. We discontinued the sale of annuitiesbut still accept additional deposits on existing contracts.
Surrenders and partial withdrawals decreased 32.5% to $133 million inthe third quarter of 2019 from $197 million in the third quarter of 2018.Surrenders and partial withdrawals decreased 25.8% to $464 million in thefirst nine months of 2019 from $625 million in the first nine months of 2018.
The annualized surrender and partial withdrawal rate on deferred fixedannuities, based on the beginning of year contractholder funds, was 9.5% inthe first nine months of 2019 compared to 11.1% in the first nine months of2018.
94 www.allstate.com

Investments
Investments
Portfolio composition and strategy by reporting segment (1)
As of September 30, 2019
($ in millions) Property-Liability
ServiceBusinesses Allstate Life
AllstateBenefits
AllstateAnnuities
Corporate andOther Total
Fixed income securities (2) $ 32,471 $ 1,161 $ 7,773 $ 1,323 $ 14,514 $ 2,017 $ 59,259
Equity securities (3) 6,203 272 104 130 1,162 335 8,206
Mortgage loans 393 — 1,953 212 2,136 — 4,694
Limited partnership interests 4,703 — — — 3,287 — 7,990
Short-term investments (4) 2,387 116 520 35 981 1,215 5,254
Other 1,604 — 1,351 311 638 — 3,904
Total $ 47,761 $ 1,549 $ 11,701 $ 2,011 $ 22,718 $ 3,567 $ 89,307
Percent to total 53.5% 1.7% 13.1% 2.3% 25.4% 4.0% 100.0%
Market-based core $ 33,369 $ 1,549 $ 11,701 $ 2,011 $ 17,766 $ 3,567 $ 69,963
Market-based active 9,366 — — — 1,384 — 10,750
Performance-based 5,026 — — — 3,568 — 8,594
Total $ 47,761 $ 1,549 $ 11,701 $ 2,011 $ 22,718 $ 3,567 $ 89,307(1) Balances reflect the elimination of related party investments between segments.(2) Fixed income securities are carried at fair value. Amortized cost basis for these securities was $31.24 billion, $1.12 billion, $7.12 billion, $1.25 billion, $13.56 billion, $1.97
billion and $56.26 billion for Property-Liability, Service Businesses, Allstate Life, Allstate Benefits, Allstate Annuities, Corporate and Other, and in Total, respectively.(3) Equity securities are carried at fair value. The fair value of equity securities held as of September 30, 2019, was $1.28 billion in excess of cost. These net gains were primarily
concentrated in the consumer goods and technology sectors and in domestic equity index funds.(4) Short-term investments are carried at fair value.
Investments totaled $89.31 billion as of September 30, 2019, increasingfrom $81.26 billion as of December 31, 2018, primarily due to higher fixedincome and equity valuations, positive investment and operating cash flowsand issuance of preferred stock and senior debt, partially offset by commonshare repurchases, dividends paid to shareholders, net reductions incontractholder funds and repayment of senior debt.
Portfolio composition by investment strategy We utilize two primarystrategies to manage risks and returns and to position our portfolio to takeadvantage of market opportunities while attempting to mitigate adverseeffects. As strategies and market conditions evolve, the asset allocation maychange or assets may be moved between strategies.
Market-based strategies include investments primarily in public fixedincome and equity securities. Market-based core seeks to deliverpredictable earnings aligned to business needs and returns consistent withthe markets in which we invest. Private fixed income assets, such ascommercial mortgages, bank loans and privately placed debt that provideliquidity premiums are also included in this category. Market-based activeseeks to outperform within the public markets through tactical positioningand by taking advantage of short-term opportunities. This category maygenerate results that meaningfully deviate from those achieved by marketindices, both favorably and unfavorably.
Performance-based strategy seeks to deliver attractive risk-adjustedreturns and supplement market risk with idiosyncratic risk primarily throughinvestments in private equity and real estate.
Third Quarter 2019 Form 10-Q 95

Investments
Portfolio composition by investment strategy As of September 30, 2019
($ in millions) Market-based core Market-based active Performance-based Total
Fixed income securities $ 50,508 $ 8,662 $ 89 $ 59,259
Equity securities 7,064 823 319 8,206
Mortgage loans 4,694 — — 4,694
Limited partnership interests 587 233 7,170 7,990
Short-term investments 4,351 903 — 5,254
Other 2,759 129 1,016 3,904
Total $ 69,963 $ 10,750 $ 8,594 $ 89,307
Percent to total 78.4% 12.0% 9.6% 100.0%
Unrealized net capital gains and losses Fixed income securities $ 2,692 $ 305 $ (1) $ 2,996
Limited partnership interests — — (3) (3)
Other (3) — — (3)
Total $ 2,689 $ 305 $ (4) $ 2,990
Fixed income securities by type Fair value as of
($ in millions) September 30, 2019 December 31, 2018
U.S. government and agencies $ 4,111 $ 5,517
Municipal 8,838 9,169
Corporate 44,018 40,136
Foreign government 993 747
Asset-backed securities (“ABS”) 822 1,045
Residential mortgage-backed securities (“RMBS”) 392 464
Commercial mortgage-backed securities (“CMBS”) 64 70
Redeemable preferred stock 21 22
Total fixed income securities $ 59,259 $ 57,170
Fixed income securities are rated by third-party credit rating agenciesand/or are internally rated. As of September 30, 2019, 87.7% of theconsolidated fixed income securities portfolio was rated investment grade,which is defined as a security having a rating of Aaa, Aa, A or Baa fromMoody’s, a rating of AAA, AA, A or BBB from S&P, a comparable rating fromanother nationally recognized rating agency, or a comparable internal ratingif an externally provided rating is not available. Credit ratings below thesedesignations are
considered low credit quality or below investment grade, which includes highyield bonds. Market prices for certain securities may have credit spreadswhich imply higher or lower credit quality than the current third-party rating.Our initial investment decisions and ongoing monitoring procedures for fixedincome securities are based on a thorough due diligence process whichincludes, but is not limited to, an assessment of the credit quality, sector,structure, and liquidity risks of each issue.
96 www.allstate.com

Investments
Fair value and unrealized net capital gains and losses for fixed income securities by credit quality As of September 30, 2019
Investment grade Below investment grade Total
($ in millions) Fairvalue
Unrealizedgain (loss)
Fairvalue
Unrealizedgain (loss)
Fairvalue
Unrealizedgain (loss)
Percent ratedinvestment grade
U.S. government and agencies $ 4,111 $ 256 $ — $ — $ 4,111 $ 256 100.0%
Municipal Tax exempt 6,937 286 17 1 6,954 287 99.8
Taxable 1,841 320 43 4 1,884 324 97.7
Total Municipal 8,778 606 60 5 8,838 611 99.3
Corporate Public 28,371 1,421 3,271 84 31,642 1,505 89.7
Privately placed 8,804 409 3,572 91 12,376 500 71.1
Total Corporate 37,175 1,830 6,843 175 44,018 2,005 84.5
Foreign government 986 21 7 — 993 21 99.3
ABS Collateralized debt obligations(“CDO”) 313 (3) 47 1 360 (2) 86.9
Consumer and other asset-backedsecurities (“Consumer and otherABS”) (1) 447 7 15 (1) 462 6 96.8
Total ABS 760 4 62 — 822 4 92.5
RMBS U.S. government sponsored entities(“U.S. Agency”) 61 1 — — 61 1 100.0
Non-agency 37 2 294 88 331 90 11.2
Total RMBS 98 3 294 88 392 91 25.0
CMBS 34 1 30 6 64 7 53.1
Redeemable preferred stock 21 1 — — 21 1 100.0
Total fixed income securities $ 51,963 $ 2,722 $ 7,296 $ 274 $ 59,259 $ 2,996 87.7%
(1) Total Consumer and other ABS consists of $117 million of consumer auto, $102 million of credit card and $243 million of other ABS with unrealized net capital gains of $1million, $1 million and $4 million, respectively.
Municipal bonds include general obligations of state and local issuersand revenue bonds (including pre-refunded bonds, which are bonds forwhich an irrevocable trust has been established to fund the remainingpayments of principal and interest).
Corporate bonds include publicly traded and privately placed securities.Privately placed securities primarily consist of corporate issued senior debtsecurities that are directly negotiated with the borrower or are inunregistered form.
ABS includes CDO and Consumer and other ABS. Credit risk ismanaged by monitoring the performance of the underlying collateral. Manyof the securities in the ABS portfolio have credit enhancement with featuressuch as overcollateralization, subordinated structures, reserve funds,guarantees and/or insurance.
CDO consist of obligations collateralized by cash flow CDO, which arestructures collateralized primarily by below investment grade senior securedcorporate loans.
RMBS is subject to interest rate risk, but unlike other fixed incomesecurities, is additionally subject to prepayment risk from the underlyingresidential
mortgage loans. RMBS consists of a U.S. Agency portfolio having collateralissued or guaranteed by U.S. government agencies and a non-agencyportfolio consisting of securities collateralized by Prime, Alt-A and Subprimeloans.
CMBS investments are primarily traditional conduit transactionscollateralized by commercial mortgage loans, broadly diversified acrossproperty types and geographical area.
Equity securities totaled $8.21 billion as of September 30, 2019 andprimarily include common stocks, exchange traded and mutual funds, non-redeemable preferred stocks and real estate investment trust equityinvestments. Exchange traded and mutual funds that have fixed incomesecurities as their underlying investments totaled $2.21 billion as ofSeptember 30, 2019, an increase of $1.81 billion compared toDecember 31, 2018.
Third Quarter 2019 Form 10-Q 97

Investments
Mortgage loans, which are primarily held in the life and annuity portfolios, totaled $4.69 billion as of September 30, 2019, and primarily comprise loanssecured by first mortgages on developed commercial real estate.
Limited partnership interests include interests in private equity funds, real estate funds and other funds.
Carrying value and other information for limited partnership interests As of September 30, 2019
($ in millions) Limited partnership
interests (1) Number of managers Number of individual
investments
Largest exposure tosingle investment
Private equity $ 6,162 153 302 $ 189
Real estate 1,008 37 73 69
Other 820 11 12 416
Total $ 7,990 201 387
(1) We have commitments to invest in additional limited partnership interests totaling $2.87 billion.Unrealized net capital gains totaled $2.99 billion as of September 30, 2019 compared to $33 million as of December 31, 2018.
Unrealized net capital gains (losses)
($ in millions) September 30, 2019 December 31, 2018
U.S. government and agencies $ 256 $ 131
Municipal 611 206
Corporate 2,005 (400)
Foreign government 21 8
ABS 4 (4)
RMBS 91 87
CMBS 7 7
Redeemable preferred stock 1 1
Fixed income securities 2,996 36
Derivatives (3) (3)
EMA limited partnerships (3) —
Unrealized net capital gains and losses, pre-tax $ 2,990 $ 33
The unrealized net capital gain for the fixed income portfolio totaled $3.00 billion, comprised of $3.08 billion of gross unrealized gains and $86 million ofgross unrealized losses as of September 30, 2019. This compares to an unrealized net capital gain for the fixed income portfolio totaling $36 million, comprisedof $993 million of gross unrealized gains and $957 million of gross unrealized losses as of December 31, 2018. Fixed income valuations increased primarilydue to a decrease in risk-free interest rates and tighter credit spreads.
98 www.allstate.com

Investments
Gross unrealized gains (losses) on fixed income securities by type and sector
As of September 30, 2019
($ in millions) Amortized
cost
Gross unrealized Fairvalue Gains Losses
Corporate:
Energy $ 2,701 $ 140 $ (23) $ 2,818
Banking 4,360 141 (15) 4,486
Consumer goods (cyclical and non-cyclical) 11,898 516 (13) 12,401
Utilities 5,333 422 (6) 5,749
Technology 2,845 106 (4) 2,947
Financial services 2,602 103 (3) 2,702
Communications 2,815 159 (2) 2,972
Basic industry 2,072 111 (2) 2,181
Capital goods 5,104 237 (1) 5,340
Transportation 2,031 131 (1) 2,161
Other 252 9 — 261
Total corporate fixed income portfolio 42,013 2,075 (70) 44,018
U.S. government and agencies 3,855 257 (1) 4,111
Municipal 8,227 615 (4) 8,838
Foreign government 972 24 (3) 993
ABS 818 10 (6) 822
RMBS 301 92 (1) 392
CMBS 57 8 (1) 64
Redeemable preferred stock 20 1 — 21
Total fixed income securities $ 56,263 $ 3,082 $ (86) $ 59,259
The consumer goods, utilities and capital goods sectors comprise 28%,13% and 12%, respectively, of the carrying value of our corporate fixedincome securities portfolio as of September 30, 2019. Energy, banking andconsumer goods had the highest concentration of gross unrealized losses inour corporate fixed income securities portfolio as of September 30, 2019.
In general, the gross unrealized losses are related to an increase inmarket yields which may include increased risk-free interest rates and/orwider credit spreads since the time of initial purchase. Similarly, grossunrealized gains reflect a decrease in market yields since the time of initialpurchase.
Third Quarter 2019 Form 10-Q 99

Investments
Net investment income
Three months ended September
30, Nine months ended September
30,($ in millions) 2019 2018 2019 2018
Fixed income securities $ 546 $ 527 $ 1,627 $ 1,544
Equity securities 57 35 155 130
Mortgage loans 54 52 161 163
Limited partnership interests 197 210 460 563
Short-term investments 28 19 80 50
Other 66 71 196 205
Investment income, before expense 948 914 2,679 2,655
Investment expense (1) (2) (68) (70) (209) (201)
Net investment income $ 880 $ 844 $ 2,470 $ 2,454
Market-based core $ 637 $ 609 $ 1,897 $ 1,814
Market-based active 91 76 259 222
Performance-based 220 229 523 619
Investment income, before expense $ 948 $ 914 $ 2,679 $ 2,655
(1) Investment expense includes $19 million and $17 million of investee level expenses in the third quarter of 2019 and 2018, respectively, and $59 million and $53 million in the firstnine months of 2019 and 2018, respectively. Investee level expenses include depreciation and asset level operating expenses on directly held real estate and other consolidatedinvestments.
(2) Investment expense includes $10 million and $8 million related to the portion of reinvestment income on securities lending collateral paid to the counterparties in the thirdquarter of 2019 and 2018, respectively, and $32 million and $19 million in the first nine months of 2019 and 2018, respectively.
Net investment income increased 4.3% and 0.7% or $36 million and $16 million in the third quarter and first nine months of 2019, respectively, comparedto the same periods of 2018, primarily due to higher income from market-based portfolios, partially offset by lower performance-based investment results,mainly from limited partnership interests.
Performance-based investment income
Three months ended September
30, Nine months ended September
30,($ in millions) 2019 2018 2019 2018
Limited partnerships Private equity $ 125 $ 123 $ 336 $ 452
Real estate 71 87 121 111
Performance-based - limited partnerships 196 210 457 563
Non-limited partnerships Private equity 5 1 18 7
Real estate 19 18 48 49
Performance-based - non-limited partnerships 24 19 66 56
Total Private equity 130 124 354 459
Real estate 90 105 169 160
Total performance-based $ 220 $ 229 $ 523 $ 619
Investee level expenses (1) $ (18) $ (15) $ (54) $ (48)(1) Investee level expenses include depreciation and asset level operating expenses reported in investment expense.
Performance-based investment income decreased 3.9% or $9 million inthe third quarter of 2019 compared to the third quarter of 2018, primarily dueto lower gains on sales of underlying investments. Performance-basedinvestment income decreased 15.5% or $96 million in the first nine monthsof 2019 compared to the first nine months of 2018, primarily due to lowerasset appreciation related to private equity investments.
Performance-based investment results and income can varysignificantly between periods and are influenced by economic conditions,equity market
performance, comparable public company earnings multiples, capitalizationrates, operating performance of the underlying investments and the timing ofasset sales.
100 www.allstate.com

Investments
Components of realized capital gains (losses) and the related tax effect
Three months ended September
30, Nine months ended September
30,($ in millions) 2019 2018 2019 2018
Impairment write-downs Fixed income securities $ (1) $ (3) $ (12) $ (6)
Limited partnership interests (1) (2) (4) (3)
Other investments (12) — (27) (1)
Total impairment write-downs (14) (5) (43) (10)
Sales 147 (22) 359 (139)
Valuation of equity investments 24 198 851 149
Valuation and settlements of derivative instruments 40 5 16 17
Realized capital gains and losses, pre-tax 197 176 1,183 17
Income tax expense (42) (35) (248) (1)
Realized capital gains and losses, after-tax $ 155 $ 141 $ 935 $ 16
Market-based core $ 107 $ 121 $ 838 $ (6)
Market-based active 64 42 225 (18)
Performance-based 26 13 120 41
Realized capital gains and losses, pre-tax $ 197 $ 176 $ 1,183 $ 17
Realized capital gains in the third quarter of 2019 related primarily togains on sales of fixed income securities and valuation and settlements ofderivative instruments. Realized capital gains in the first nine months of2019 related primarily to increased valuation of equity investments andgains on sales of fixed income securities.
Sales resulted in $147 million and $359 million of net realized capitalgains in the three and nine months ended September 30, 2019, respectively.Sales related primarily to fixed income securities in connection with ongoingportfolio management.
Valuation of equity investments resulted in gains of $24 million for thethree months ended September 30, 2019, which included $40 million ofappreciation in the valuation of equity securities and $16 million of declinesin value primarily for certain limited partnerships where the underlyingassets are predominately public equity securities. Valuation of equityinvestments resulted in gains of $851 million for the nine months endedSeptember 30, 2019, which
included $771 million of appreciation in the valuation of equity securities and$80 million of appreciation primarily for certain limited partnerships wherethe underlying assets are predominately public equity securities.
Valuation and settlements of derivative instruments generated gains of$40 million for the three months ended September 30, 2019, primarilycomprised of gains on interest rate futures used for asset replication andforeign currency contracts due to the strengthening of the U.S. dollar,partially offset by losses on equity options and futures used for riskmanagement. Valuation and settlements of derivative instruments generatedgains of $16 million for the nine months ended September 30, 2019,primarily comprised of gains on interest rate futures and total return swapsused for asset replication and foreign currency contracts due to thestrengthening of the U.S. dollar, partially offset by losses on equity optionsand futures used for risk management.
Realized capital gains (losses) for performance-based investments
Three months ended September
30, Nine months ended September
30,($ in millions) 2019 2018 2019 2018
Impairment write-downs $ (1) $ (2) $ (4) $ (3)
Sales (1) 3 59 2
Valuation of equity investments 7 4 34 23
Valuation and settlements of derivative instruments 21 8 31 19
Total performance-based $ 26 $ 13 $ 120 $ 41
Realized capital gains on performance-based investments were $26million in the third quarter of 2019, primarily related to valuation andsettlements of derivative instruments.
Realized capital gains on performance-based investments were $120million in the first nine months of 2019, primarily related to gains on sales ofinvestments in directly held real estate, increased valuation of equityinvestments and valuation and settlements of derivative instruments.
Third Quarter 2019 Form 10-Q 101

Capital Resources and Liquidity
Capital Resources and Liquidity
Capital resources consist of shareholders’ equity and debt, representing funds deployed or available to be deployed to support business operations or forgeneral corporate purposes.
Capital resources($ in millions) September 30, 2019 December 31, 2018
Preferred stock, common stock, treasury stock, retained income and other shareholders’ equity items $ 24,033 $ 21,194
Accumulated other comprehensive income 2,107 118
Total shareholders’ equity 26,140 21,312
Debt 6,630 6,451
Total capital resources $ 32,770 $ 27,763
Ratio of debt to shareholders’ equity 25.4% 30.3%
Ratio of debt to capital resources 20.2% 23.2%
Shareholders’ equity increased in the first nine months of 2019,primarily due to increased unrealized capital gains on investments and netincome. In the nine months ended September 30, 2019, we paid dividendsof $490 million and $92 million related to our common and preferred shares,respectively.
Common share repurchases As of September 30, 2019, there was$962 million remaining on the $3.00 billion common share repurchaseprogram that is expected to be completed by April 2020.
During the first nine months of 2019, we repurchased 9.8 millioncommon shares for $1.11 billion, which includes 417 thousand shares for$150 million related to the settlement of the December 2018 acceleratedshare repurchase agreement.
Common shareholder dividends On January 2, 2019, April 1, 2019, July1, 2019 and October 1, 2019, we paid common shareholder dividends of$0.46, $0.50, $0.50 and $0.50, respectively.
Issuance and redemption of preferred stock On August 8, 2019, weissued 46,000 shares of 5.100% Fixed Rate Noncumulative PerpetualPreferred Stock, Series H for gross proceeds of $1.15 billion.
On October 15, 2019, we redeemed all 5,400 shares of our Fixed RateNoncumulative Perpetual Preferred Stock, Series D, all 29,900 shares of ourFixed Rate Noncumulative Perpetual Preferred Stock, Series E, and all10,000 shares of our Fixed Rate Noncumulative Perpetual Preferred Stock,Series F and the corresponding depository shares for $1.13 billion.
For additional details on these transactions, see Note 10 of thecondensed consolidated financial statements.
Issuance and repayment of debt On June 10, 2019, we issued $500million of 3.850% Senior Notes due 2049. Interest on the Senior Notes ispayable semi-annually in arrears on February 10 and August 10 of eachyear, beginning on February 10, 2020. The Senior Notes are redeemable atany time at the applicable redemption price prior to the maturity date. Theproceeds of this issuance are used for general corporate purposes.
On May 16, 2019 we repaid $317 million of 7.450% Senior Notes,Series B, at maturity.
Financial ratings and strength Our ratings are influenced by manyfactors including our operating and financial performance, asset quality,liquidity, asset/liability management, overall portfolio mix, financial leverage(i.e. debt), exposure to risks such as catastrophes and the current level ofoperating leverage. The preferred stock and subordinated debentures areviewed as having a common equity component by certain rating agenciesand are given equity credit up to a pre-determined limit in our capitalstructure as determined by their respective methodologies. Theserespective methodologies consider the existence of certain terms andfeatures in the instruments such as the noncumulative dividend feature inthe preferred stock.
In May 2019, A.M. Best affirmed The Allstate Corporation’s debt andshort-term issuer ratings of a and AMB-1+, respectively, and the insurerfinancial strength ratings of A+ for Allstate Insurance Company (“AIC”),Allstate Life Insurance Company (“ALIC”), and Allstate Assurance Company(“AAC”). The outlook for the ratings is stable.
In July 2019, S&P Global affirmed The Allstate Corporation’s debt andshort-term issuer ratings of A- and A-2, respectively, and the insurancefinancial strength ratings of AA- for AIC and A+ for ALIC. The outlook for theratings is stable.
In July 2019, Moody’s affirmed The Allstate Corporation’s debt andshort-term issuer ratings of A3 and P-2, respectively, and the insurancefinancial strength rating of Aa3 for AIC. Moody’s downgraded ALIC and AACinsurance financial strength ratings to A2 from A1 reflecting Moody’s shift toa more standard single rating level positive adjustment for subsidiarycompany ratings. The outlook for the ratings is stable.
Liquidity sources and uses We actively manage our financial positionand liquidity levels in light of changing market, economic and businessconditions. Liquidity is managed at both the entity and enterprise levelacross the Company and is assessed on both base and stressed levelliquidity needs. We believe we have sufficient liquidity to meet these needs.Additionally, we have existing intercompany
102 www.allstate.com

Capital Resources and Liquidity
agreements in place that facilitate liquidity management across theCompany to enhance flexibility.
The Allstate Corporation is party to an Amended and RestatedIntercompany Liquidity Agreement (“Liquidity Agreement”) with certainsubsidiaries, which include, but are not limited to ALIC and AIC. TheLiquidity Agreement allows for short-term advances of funds to be madebetween parties for liquidity and other general corporate purposes. TheLiquidity Agreement does not establish a commitment to advance funds onthe part of any party. ALIC and AIC each serve as a lender and borrower,certain other subsidiaries serve only as borrowers, and the Corporationserves only as a lender. AIC also has a capital support agreement withALIC. Under the capital support agreement, AIC is committed to providingcapital to ALIC to maintain an adequate capital level. The maximum amountof potential funding under each of these agreements is $1.00 billion.
In addition to the Liquidity Agreement, the Corporation also has anintercompany loan agreement with certain of its subsidiaries, which include,but are not limited to, AIC and ALIC. The amount of intercompany loansavailable to the Corporation’s subsidiaries is at the discretion of theCorporation. The maximum amount of loans the Corporation will haveoutstanding to all its eligible subsidiaries at any given point in time is limitedto $1.00 billion. The Corporation may use commercial paper borrowings,bank lines of credit and securities lending to fund intercompany borrowings.
Parent company capital capacity Parent holding company deployableassets totaled $3.55 billion as of September 30, 2019, primarily comprisedof cash and investments that are generally saleable within one quarter.Deployable assets increased by the proceeds from the Preferred Stock,Series H issuance, which were then used for the preferred share redemptionthat occurred on October 15, 2019. The substantial earnings capacity of theoperating subsidiaries is the primary source of capital generation for theCorporation.
Intercompany dividends were paid in the first nine months of 2019between the following companies: AIC, Allstate Insurance Holdings, LLC(“AIH”), the Corporation and ALIC.
Intercompany dividends
($ in millions) September 30, 2019
AIC to AIH $ 2,132
AIH to the Corporation 2,134
ALIC to AIC 75
Dividends may not be paid or declared on our common stock andshares of common stock may not be repurchased unless the full dividendsfor the latest completed dividend period on our preferred stock have beendeclared and paid or provided for. We are prohibited from declaring orpaying dividends on certain preferred stock if we fail to meet specified
capital adequacy, net income or shareholders’ equity levels, except out ofthe net proceeds of common stock issued during the 90 days prior to thedate of declaration. As of September 30, 2019, we satisfied all of the testswith no current restrictions on the payment of preferred stock dividends.
The terms of our outstanding subordinated debentures also prohibit usfrom declaring or paying any dividends or distributions on our common orpreferred stock or redeeming, purchasing, acquiring, or making liquidationpayments on our common stock or preferred stock if we have elected todefer interest payments on the subordinated debentures, subject to certainlimited exceptions. In the first nine months of 2019, we did not defer interestpayments on the subordinated debentures.
Additional resources to support liquidity are as follows:
• The Corporation has access to a commercial paper facility with aborrowing limit of $1.00 billion to cover short-term cash needs. As ofSeptember 30, 2019, there were no balances outstanding and thereforethe remaining borrowing capacity was $1.00 billion.
• The Corporation, AIC and ALIC have access to a $1.00 billionunsecured revolving credit facility that is available for short-termliquidity requirements. The maturity date of this facility is April 2021.The facility is fully subscribed among 11 lenders with the largestcommitment being $115 million. The commitments of the lenders areseveral and no lender is responsible for any other lender’s commitmentif such lender fails to make a loan under the facility. This facilitycontains an increase provision that would allow up to an additional$500 million of borrowing. This facility has a financial covenantrequiring that we not exceed a 37.5% debt to capitalization ratio asdefined in the agreement. This ratio was 15.9% as of September 30,2019. Although the right to borrow under the facility is not subject to aminimum rating requirement, the costs of maintaining the facility andborrowing under it are based on the ratings of our senior unsecured,unguaranteed long-term debt. There were no borrowings under thecredit facility during 2019.
• The Corporation has access to a universal shelf registration statementwith the Securities and Exchange Commission that expires in 2021. Wecan use this shelf registration to issue an unspecified amount of debtsecurities, common stock (including 575 million shares of treasury stockas of September 30, 2019), preferred stock, depositary shares, warrants,stock purchase contracts, stock purchase units and securities of trustsubsidiaries. The specific terms of any securities we issue under thisregistration statement will be provided in the applicable prospectussupplements.
Third Quarter 2019 Form 10-Q 103

Capital Resources and Liquidity
Liquidity exposure Contractholder funds were $17.80 billion as of September 30, 2019.
Contractholder funds by contractual withdrawal provisions
($ in millions)
Percentto total
Not subject to discretionary withdrawal $ 2,726 15.3%
Subject to discretionary withdrawal with adjustments: Specified surrender charges (1) 4,723 26.5
Market value adjustments (2) 850 4.8
Subject to discretionary withdrawal without adjustments (3) 9,505 53.4
Total contractholder funds (4) $ 17,804 100.0%
(1) Includes $1.36 billion of liabilities with a contractual surrender charge of less than 5% of the account balance.(2) $399 million of the contracts with market value adjusted surrenders have a 30-45 day period at the end of their initial and subsequent interest rate guarantee periods (which
are typically 1, 5, 7 or 10 years) during which there is no surrender charge or market value adjustment.(3) 89% of these contracts have a minimum interest crediting rate guarantee of 3% or higher.(4) Includes $699 million of contractholder funds on variable annuities reinsured to The Prudential Insurance Company of America, a subsidiary of Prudential Financial Inc., in
2006.
Retail life and annuity products may be surrendered by customers for avariety of reasons. Reasons unique to individual customers include a currentor unexpected need for cash or a change in life insurance coverage needs.Other key factors that may impact the likelihood of customer surrenderinclude the level of the contract surrender charge, the length of time thecontract has been in force, distribution channel, market interest rates, equitymarket conditions and potential tax implications.
In addition, the propensity for retail life insurance policies to lapse islower than it is for fixed annuities because of the need for the insured to bere-underwritten upon policy replacement.
The annualized surrender and partial withdrawal rate on deferred fixedannuities and interest-sensitive life insurance products, based on thebeginning of year contractholder funds, was 6.1% and 7.1% in the first ninemonths of 2019 and 2018, respectively. We strive to promptly paycustomers who request cash surrenders; however, statutory regulationsgenerally provide up to six months in most states to fulfill surrenderrequests.
Our asset-liability management practices enable us to manage thedifferences between the cash flows generated by our investment portfolioand the expected cash flow requirements of our life insurance and annuityproduct obligations.
104 www.allstate.com

Recent Developments
Recent DevelopmentsCalifornia wildfire subrogation
On September 23, 2019, PG&E Corporation and Pacific Gas andElectric Company (together, "PG&E") announced that it executed a definitiveagreement to resolve insurance subrogation claims, arising from the 2017Northern California wildfires and the 2018 Camp Fire for $11 billion. Allstateis one of the insurance companies that are party to this agreement.
The settlement is subject to approval by the Bankruptcy Courtoverseeing PG&E's Chapter 11 case, will be implemented pursuant toPG&E's Joint Chapter 11 Plan of Reorganization (the "Plan"), and is subjectto confirmation of the Plan by the Bankruptcy Court. Due to the significantnumber of lawsuits and claims against PG&E and uncertainty around theallocation of benefits among claimants, the amount of recovery that wereceive, if any, cannot be determined at this time. Accordingly, we have notrecorded any benefit related to the potential proceeds from the agreement inthe condensed consolidated financial statements. We will continue tomonitor this matter.
Third Quarter 2019 Form 10-Q 105

Forward-Looking StatementsThis report contains “forward-looking statements” that anticipate results based on our estimates, assumptions and plans that are subject to uncertainty.
These statements are made subject to the safe-harbor provisions of the Private Securities Litigation Reform Act of 1995. These forward-looking statements donot relate strictly to historical or current facts and may be identified by their use of words like “plans,” “seeks,” “expects,” “will,” “should,” “anticipates,”“estimates,” “intends,” “believes,” “likely,” “targets” and other words with similar meanings. We believe these statements are based on reasonable estimates,assumptions and plans. If the estimates, assumptions or plans underlying the forward-looking statements prove inaccurate or if other risks or uncertaintiesarise, actual results could differ materially from those communicated in these forward-looking statements. Factors that could cause actual results to differmaterially from those expressed in, or implied by, the forward-looking statements include risks related to:
Insurance Industry Risks (1) adverse changes in the nature and level of catastrophes and severe weather events; (2) our catastrophe management strategyon premium growth; (3) unexpected increases in the frequency or severity of claims; (4) the cyclical nature of the property and casualty businesses; (5) theavailability of reinsurance at current levels and prices; (6) risk of our reinsurers; (7) changing climate and weather conditions; (8) changes in underwriting andactual experience; (9) changes in reserve estimates; (10) changes in estimates of profitability on interest-sensitive life products
Financial Risks (11) conditions in the global economy and capital markets; (12) a downgrade in financial strength ratings; (13) the effect of adverse capital andcredit market conditions; (14) possible impairments in the value of goodwill; (15) the realization of deferred tax assets; (16) restrictions on our subsidiaries’ability to pay dividends; (17) restrictions under the terms of certain of our securities on our ability to pay dividends or repurchase our stock
Investment Risks (18) market risk and declines in credit quality relating to our investment portfolio; (19) our subjective determination of the amount of realizedcapital losses recorded for impairments of our investments and the fair value of our fixed income and equity securities; (20) the influence of changes in marketinterest rates or performance-based investment returns on our annuity business
Operational Risks (21) impacts of new or changing technologies on our business; (22) failure in cyber or other information security controls, as well as theoccurrence of events unanticipated in our disaster recovery systems and business continuity planning; (23) misconduct or fraudulent acts by employees,agents and third parties; (24) the impact of a large scale pandemic, the threat or occurrence of terrorism or military action; (25) loss of key vendor relationshipsor failure of a vendor to protect confidential, proprietary and personal information; (26) intellectual property infringement, misappropriation and third-partyclaims
Regulatory and Legal Risks (27) regulatory changes, including limitations on rate increases and requirements to underwrite business and participate in losssharing arrangements; (28) regulatory reforms and restrictive regulations; (29) changes in tax laws; (30) our ability to mitigate the capital impact associatedwith statutory reserving and capital requirements; (31) changes in accounting standards; (32) losses from legal and regulatory actions; (33) our participation inindemnification programs, including state industry pools and facilities; (34) impacts from the Covered Agreement, including changes in state insurance laws
Strategic Risks (35) competition in the insurance industry and impact of new or changing technologies; (36) market convergence and regulatory changes onour risk segmentation and pricing; (37) acquisitions and divestitures of businesses; and (38) reducing our concentration in spread-based business and exitingcertain distribution channels
Additional information concerning these and other factors may be found in our filings with the Securities and Exchange Commission, including the “RiskFactors” section in our most recent annual report on Form 10-K. Forward- looking statements speak only as of the date on which they are made, and weassume no obligation to update or revise any forward-looking statement.
Item 4. Controls and ProceduresEvaluation of Disclosure Controls and Procedures. We maintain disclosure controls and procedures as defined in Rules 13a-15(e) under the Securities
Exchange Act of 1934. Under the supervision and with the participation of our management, including our principal executive officer and principal financialofficer, we conducted an evaluation of the effectiveness of our disclosure controls and procedures as of the end of the period covered by this report. Basedupon this evaluation, the principal executive officer and the principal financial officer concluded that our disclosure controls and procedures are effective inproviding reasonable assurance that material information required to be disclosed in our reports filed with or submitted to the Securities and ExchangeCommission under the Securities Exchange Act is made known to management, including the principal executive officer and the principal financial officer, asappropriate to allow timely decisions regarding required disclosure.
Changes in Internal Control over Financial Reporting. During the fiscal quarter ended September 30, 2019, there have been no changes in our internalcontrol over financial reporting that have materially affected, or are reasonably likely to materially affect, our internal control over financial reporting.
106 www.allstate.com

Other Information Part II.
Part II. Other InformationItem 1. Legal Proceedings
Information required for Part II, Item 1 is incorporated by reference tothe discussion under the heading “Regulation and compliance” and underthe heading “Legal and regulatory proceedings and inquiries” in Note 12 ofthe condensed consolidated financial statements in Part I, Item 1 of thisForm 10-Q.
Item 1A. Risk FactorsThere have been no material changes in our risk factors from those
disclosed in Part I, Item 1A in our annual report on Form 10-K for the yearended December 31, 2018.
Item 2. Unregistered Sales of Equity Securities and Use of ProceedsIssuer Purchases of Equity Securities
Period
Total number ofshares
(or units)purchased (1)
Average pricepaid per share
(or unit)
Total number of shares (orunits) purchased as part of
publicly announced plans orprograms (2)
Maximum number (or approximatedollar value) of shares (or units) that
may yet be purchased under the plansor programs (3)
July 1, 2019 -July 31, 2019
Open Market Purchases 1,800,424 $ 103.22 1,800,329 August 1, 2019 -
August 31, 2019 Open Market Purchases 2,161,418 $ 103.37 2,161,154
September 1, 2019 -September 30, 2019
Open Market Purchases 1,876,001 $ 106.59 1,875,686 Total 5,837,843 $ 104.35 5,837,169 $ 962 million(1) In accordance with the terms of its equity compensation plans, Allstate acquired the following shares in connection with the vesting of restricted stock units and performance
stock awards and the exercise of stock options held by employees and/or directors. The shares were acquired in satisfaction of withholding taxes due upon exercise or vestingand in payment of the exercise price of the options.July: 95August: 264September: 315
(2) From time to time, repurchases under our programs are executed under the terms of a pre-set trading plan meeting the requirements of Rule 10b5-1(c) of the SecuritiesExchange Act of 1934.
(3) On October 31, 2018, we announced the approval of a common share repurchase program for $3 billion, which is expected to be completed by April 2020.
Third Quarter 2019 Form 10-Q 107

Other Information Part II.
Item 6. Exhibits(a) Exhibits
The following is a list of exhibits filed as part of this Form 10-Q.
Incorporated by Reference
Exhibit Number Exhibit Description Form
File Number Exhibit
FilingDate
Filed orFurnishedHerewith
3.1 Certificate of Designations with respect to the Preferred Stock, Series H of theRegistrant, dated August 5, 2019
8-K 1-11840 3.1 August 5,2019
4.1 The Allstate Corporation hereby agrees to furnish to the Commission, upon request,the instruments defining the rights of holders of each issue of long-term debt of it andits consolidated subsidiaries
4.2 Deposit Agreement, dated August 8, 2019, among the Registrant, Equiniti TrustCompany, as depositary, and the holders from time to time of the depositary receiptsdescribed therein (Series H)
8-K 1-11840 4.1 August 8,2019
4.3 Form of Preferred Stock Certificate, Series H (included as Exhibit A to Exhibit 3.1
above)8-K 1-11840 4.2 August 8,
2019 4.4 Form of Depositary Receipt, Series H (included as Exhibit A to Exhibit 4.2 above) 8-K 1-11840 4.3 August 8,
2019 15 Acknowledgment of awareness from Deloitte & Touche LLP, dated October 29,
2019, concerning unaudited interim financial information X
31(i) Rule 13a-14(a) Certification of Principal Executive Officer X
31(i) Rule 13a-14(a) Certification of Principal Financial Officer X
32 Section 1350 Certifications X
101.INS Inline XBRL Instance Document (the instance document does not appear in theInteractive Data File because its XBRL tags are embedded within the Inline XBRLdocument
X
101.SCH Inline XBRL Taxonomy Extension Schema Document X
101.CAL Inline XBRL Taxonomy Extension Calculation Linkbase Document X
101.DEF Inline XBRL Taxonomy Extension Definition Linkbase Document X
101.LAB Inline XBRL Taxonomy Extension Label Linkbase Document X101.PRE Inline XBRL Taxonomy Extension Presentation Linkbase Document X104 Cover Page Interactive Data File (formatted as inline XBRL and contained in Exhibit
101) X
108 www.allstate.com

SignaturePursuant to the requirements of the Securities Exchange Act of 1934, the Registrant has duly caused this report to be signed on its behalf by the
undersigned thereunto duly authorized.
The Allstate Corporation (Registrant) October 29, 2019 By /s/ John C. Pintozzi John C. Pintozzi Senior Vice President, Controller, and Chief Accounting Officer (Authorized Signatory and Principal Accounting Officer)
Third Quarter 2019 Form 10-Q 109

Exhibit 15The Allstate Corporation2775 Sanders RoadNorthbrook, IL 60062
We have reviewed, in accordance with the standards of the Public Company Accounting Oversight Board (United States), the unaudited interim financialinformation of The Allstate Corporation and subsidiaries for the periods ended September 30, 2019 and 2018, as indicated in our report dated October 29,2019; because we did not perform an audit, we expressed no opinion on that information.
We are aware that our report referred to above, which is included in your Quarterly Report on Form 10-Q for the quarter ended September 30, 2019, isincorporated by reference in the following Registration Statements:
Form S-3 Registration Statement Nos. Form S-8 Registration Statement Nos.333-34583 333-04919333-224541 333-16129
333-40283
333-134243
333-144691
333-175526
333-188821
333-200390
333-218343
333-228490
333-228491
333-228492
333-231753
We also are aware that the aforementioned report, pursuant to Rule 436(c) under the Securities Act of 1933, is not considered a part of the RegistrationStatement prepared or certified by an accountant or a report prepared or certified by an accountant within the meaning of Sections 7 and 11 of that Act.
/s/ DELOITTE & TOUCHE LLP
Chicago, IllinoisOctober 29, 2019

Certifications Exhibit 31 (i)
I, Thomas J. Wilson, certify that:
1. I have reviewed this quarterly report on Form 10-Q of The Allstate Corporation;
2. Based on my knowledge, this report does not contain any untrue statement of a material fact or omit to state a material fact necessary to make thestatements made, in light of the circumstances under which such statements were made, not misleading with respect to the period covered by this report;
3. Based on my knowledge, the financial statements, and other financial information included in this report, fairly present in all material respects the financialcondition, results of operations and cash flows of the registrant as of, and for, the periods presented in this report;
4. The registrant’s other certifying officer(s) and I are responsible for establishing and maintaining disclosure controls and procedures (as defined in ExchangeAct Rules 13a-15(e) and 15d-15(e)) and internal control over financial reporting (as defined in Exchange Act Rules 13a-15(f) and 15d-15(f)) for the registrantand have:
a) Designed such disclosure controls and procedures, or caused such disclosure controls and procedures to be designed under our supervision, to ensurethat material information relating to the registrant, including its consolidated subsidiaries, is made known to us by others within those entities, particularly duringthe period in which this report is being prepared;
b) Designed such internal control over financial reporting, or caused such internal control over financial reporting to be designed under our supervision, toprovide reasonable assurance regarding the reliability of financial reporting and the preparation of financial statements for external purposes in accordancewith generally accepted accounting principles;
c) Evaluated the effectiveness of the registrant’s disclosure controls and procedures and presented in this report our conclusions about the effectiveness ofthe disclosure controls and procedures, as of the end of the period covered by this report based on such evaluation; and
d) Disclosed in this report any change in the registrant’s internal control over financial reporting that occurred during the registrant’s most recent fiscal quarter(the registrant’s fourth fiscal quarter in the case of an annual report) that has materially affected, or is reasonably likely to materially affect, the registrant’sinternal control over financial reporting; and
5. The registrant’s other certifying officer(s) and I have disclosed, based on our most recent evaluation of internal control over financial reporting, to theregistrant’s auditors and the audit committee of the registrant’s board of directors (or persons performing the equivalent functions):
a) All significant deficiencies and material weaknesses in the design or operation of internal control over financial reporting which are reasonably likely toadversely affect the registrant’s ability to record, process, summarize and report financial information; and
b) Any fraud, whether or not material, that involves management or other employees who have a significant role in the registrant’s internal control overfinancial reporting.
Date: October 29, 2019
/s/ Thomas J. WilsonThomas J. WilsonChairman of the Board, President, and Chief ExecutiveOfficer

Certifications Exhibit 31 (i)
I, Mario Rizzo, certify that:
1. I have reviewed this quarterly report on Form 10-Q of The Allstate Corporation;
2. Based on my knowledge, this report does not contain any untrue statement of a material fact or omit to state a material fact necessary to make thestatements made, in light of the circumstances under which such statements were made, not misleading with respect to the period covered by this report;
3. Based on my knowledge, the financial statements, and other financial information included in this report, fairly present in all material respects the financialcondition, results of operations and cash flows of the registrant as of, and for, the periods presented in this report;
4. The registrant’s other certifying officer(s) and I are responsible for establishing and maintaining disclosure controls and procedures (as defined in ExchangeAct Rules 13a-15(e) and 15d-15(e)) and internal control over financial reporting (as defined in Exchange Act Rules 13a-15(f) and 15d-15(f)) for the registrantand have:
a) Designed such disclosure controls and procedures, or caused such disclosure controls and procedures to be designed under our supervision, to ensurethat material information relating to the registrant, including its consolidated subsidiaries, is made known to us by others within those entities, particularly duringthe period in which this report is being prepared;
b) Designed such internal control over financial reporting, or caused such internal control over financial reporting to be designed under our supervision, toprovide reasonable assurance regarding the reliability of financial reporting and the preparation of financial statements for external purposes in accordancewith generally accepted accounting principles;
c) Evaluated the effectiveness of the registrant’s disclosure controls and procedures and presented in this report our conclusions about the effectiveness ofthe disclosure controls and procedures, as of the end of the period covered by this report based on such evaluation; and
d) Disclosed in this report any change in the registrant’s internal control over financial reporting that occurred during the registrant’s most recent fiscal quarter(the registrant’s fourth fiscal quarter in the case of an annual report) that has materially affected, or is reasonably likely to materially affect, the registrant’sinternal control over financial reporting; and
5. The registrant’s other certifying officer(s) and I have disclosed, based on our most recent evaluation of internal control over financial reporting, to theregistrant’s auditors and the audit committee of the registrant’s board of directors (or persons performing the equivalent functions):
a) All significant deficiencies and material weaknesses in the design or operation of internal control over financial reporting which are reasonably likely toadversely affect the registrant’s ability to record, process, summarize and report financial information; and
b) Any fraud, whether or not material, that involves management or other employees who have a significant role in the registrant’s internal control overfinancial reporting.
Date: October 29, 2019
/s/ Mario RizzoMario RizzoExecutive Vice President and Chief Financial Officer

Exhibit 32
Section 1350 CertificationsEach of the undersigned hereby certifies that to his knowledge the quarterly report on Form 10-Q for the fiscal period ended September 30, 2019 of The
Allstate Corporation filed with the Securities and Exchange Commission fully complies with the requirements of Section 13(a) or 15(d) of the SecuritiesExchange Act of 1934 and that the information contained in such report fairly presents, in all material respects, the financial condition and result of operationsof The Allstate Corporation.
Date: October 29, 2019
/s/ Thomas J. WilsonThomas J. WilsonChairman of the Board, President, and Chief ExecutiveOfficer
/s/ Mario RizzoMario RizzoExecutive Vice President and Chief Financial Officer