t-block coast protection units: random wave studies · t-block coast protection units: random wave...
TRANSCRIPT
T-Block Coast Protection Units: Random Wave Studies
Report EX 2484 December 1991
Address: Hydraulics Research Ltd, Wallingford, Oxfordshire OX10 8BA, United Kingdom. Telephone: 0491 35381 International +44 491 35381 Telex: 848552 HRSWAL G. Facsimile: 0491 32233 International +44 491 32233 Registered in England No. 1622 174

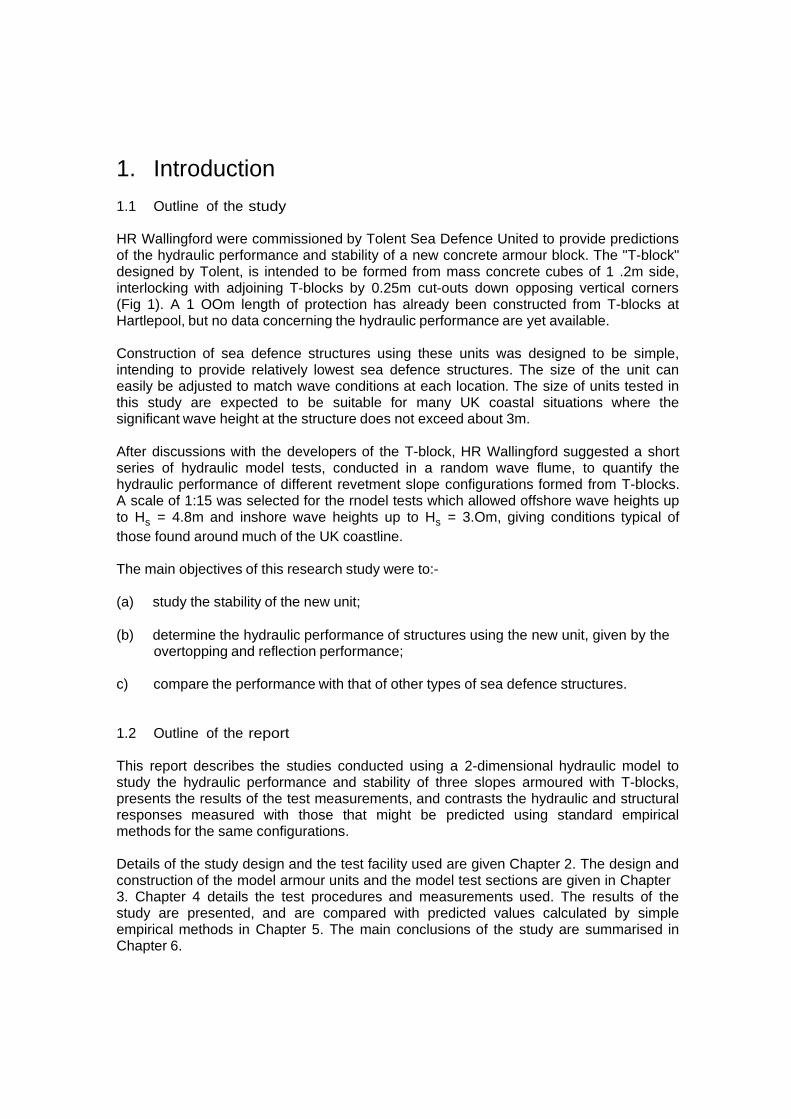
Abstract This report describes a 1:15 scale model study carried out to determine the hydraulic performance of a new coast protection unit. The study was commissioned by Tolent Sea Defence Limited, and considers hydraulic performance and stability parameters that may be used in design calculations for T-block coast protection units. These are cubical concrete blocks featuring vertical interlock slots and may be placed to form stepped sea wall slopes or vertical walls. The study used a two dimensional physical model in a random wave flume to measure the stability, overtopping and reflection performance of structures at slopes of 1:1, 1:2, and 1:4. The test results have been presented as graphs, formulae or coefficients that can be used with established design methods to estimate limiting unit size for stability; wave overtopping performance; and wave reflections. For further details of this study, please contact Mr N W H AlIsop of the Coastal Structures Section, at HR Wallingford.

H.g
Tl·
Notation
a B, b C, D D, F
fm
-..... Hmo
.
HINO h
h, lr lrm, lr
0 k l M Q a· R. A'
S, s, SWL
sm
?m
T. w ex y p
Pw P,. P,.P. 1!. h.
Empirical coefficient Flume width Empirical coefficient Coefficient of reflection Particle size or block thickness Nominal block diameter, defined (M/p,)'n Empirical coefficient Frequency of peak of wave energy spectrum Gravitationalacceleration Maximum wave height In a record of 1000 waves Significant wave height calculated from spectral analysis Offshore wave height,unaffected by shallow water processes Significant wave height, average of highest onet·hird of wave heights Mean height of highest 1110 of waves In a record Water depth Water depth at toe of the structure Iribarren number or surf similarity parameter, = tan o/s'" Iribarren number calculated in terms of sm or s. Permeability of porous material, has units rnls Wave length, In the direction ot propagation Armour unit mass Overtopping discharge. per unit length of structure Dimensionless overtopping discharge.= 0/(TmgHJ Crest freeboard,levelof crest above static water level Dimensionless freeboard,defined in terms of the steepness of the mean wave period, R'm a (RjH,)(s,/2rt)"' Total reflected wave energy Total Incident wave energy Still water level Steepness of mean wave period = 2r.H,tg T Steepness of peak wave period = 2nH,tg Mean wave period, given approximately by o.err. for a JONSWAP spectrum Spectral peak period, inverse of frequency at which wave energy density is maximum Test duration,or storm duration Armour unit weight Structure slope angle to horizontal Weight density, = p g Mass density,usually of fresh water Mass density of sea water Mass density of armour units, rock,concrete Relative density,• (P/P.)1 Modelscale ralio,mode!lprotolype
1. Introduction 1.1 Outline of the study
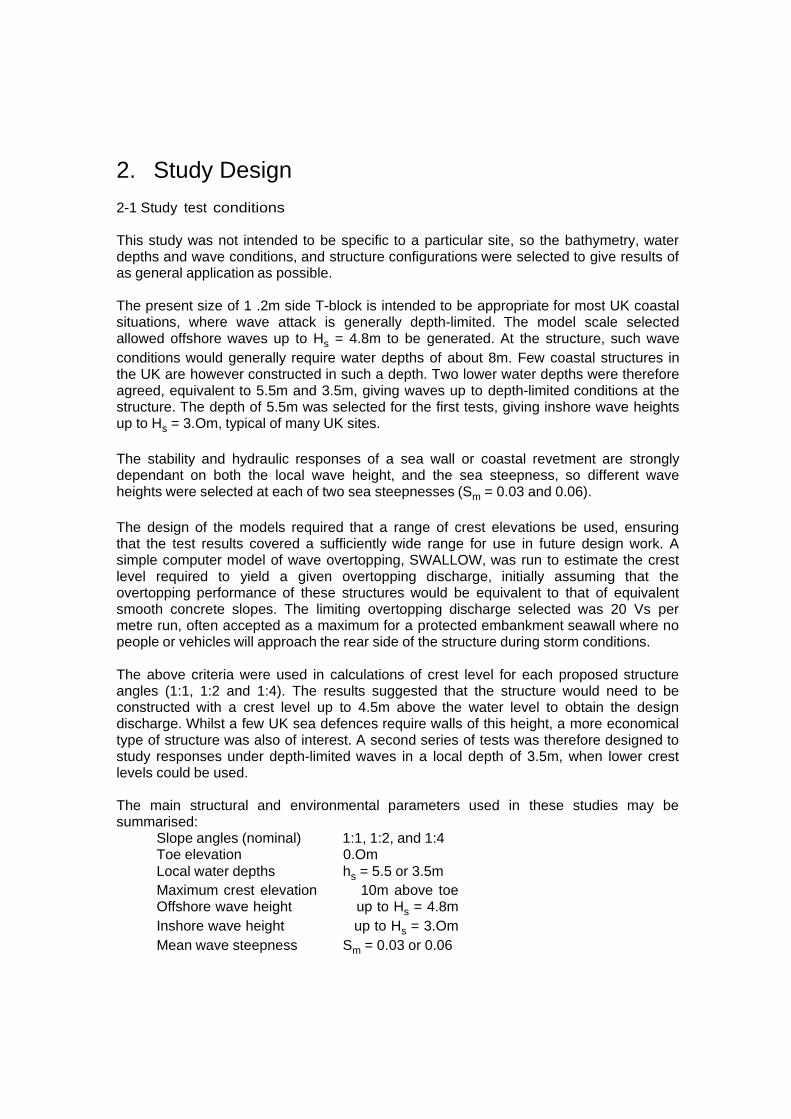
HR Wallingford were commissioned by Tolent Sea Defence United to provide predictions of the hydraulic performance and stability of a new concrete armour block. The "T-block" designed by Tolent, is intended to be formed from mass concrete cubes of 1 .2m side, interlocking with adjoining T-blocks by 0.25m cut-outs down opposing vertical corners (Fig 1). A 1 OOm length of protection has already been constructed from T-blocks at Hartlepool, but no data concerning the hydraulic performance are yet available.
Construction of sea defence structures using these units was designed to be simple, intending to provide relatively lowest sea defence structures. The size of the unit can easily be adjusted to match wave conditions at each location. The size of units tested in this study are expected to be suitable for many UK coastal situations where the significant wave height at the structure does not exceed about 3m.
After discussions with the developers of the T-block, HR Wallingford suggested a short series of hydraulic model tests, conducted in a random wave flume, to quantify the hydraulic performance of different revetment slope configurations formed from T-blocks. A scale of 1:15 was selected for the rnodel tests which allowed offshore wave heights up to Hs = 4.8m and inshore wave heights up to Hs = 3.Om, giving conditions typical of those found around much of the UK coastline.
The main objectives of this research study were to:-
(a) study the stability of the new unit;
(b) determine the hydraulic performance of structures using the new unit, given by the overtopping and reflection performance;
c) compare the performance with that of other types of sea defence structures.
1.2 Outline of the report
This report describes the studies conducted using a 2-dimensional hydraulic model to study the hydraulic performance and stability of three slopes armoured with T-blocks, presents the results of the test measurements, and contrasts the hydraulic and structural responses measured with those that might be predicted using standard empirical methods for the same configurations.
Details of the study design and the test facility used are given Chapter 2. The design and construction of the model armour units and the model test sections are given in Chapter 3. Chapter 4 details the test procedures and measurements used. The results of the study are presented, and are compared with predicted values calculated by simple empirical methods in Chapter 5. The main conclusions of the study are summarised in Chapter 6.
2. Study Design 2-1 Study test conditions
This study was not intended to be specific to a particular site, so the bathymetry, water depths and wave conditions, and structure configurations were selected to give results of as general application as possible.
The present size of 1 .2m side T-block is intended to be appropriate for most UK coastal situations, where wave attack is generally depth-limited. The model scale selected allowed offshore waves up to Hs = 4.8m to be generated. At the structure, such wave conditions would generally require water depths of about 8m. Few coastal structures in the UK are however constructed in such a depth. Two lower water depths were therefore agreed, equivalent to 5.5m and 3.5m, giving waves up to depth-limited conditions at the structure. The depth of 5.5m was selected for the first tests, giving inshore wave heights up to Hs = 3.Om, typical of many UK sites.
The stability and hydraulic responses of a sea wall or coastal revetment are strongly dependant on both the local wave height, and the sea steepness, so different wave heights were selected at each of two sea steepnesses (Sm = 0.03 and 0.06).
The design of the models required that a range of crest elevations be used, ensuring that the test results covered a sufficiently wide range for use in future design work. A simple computer model of wave overtopping, SWALLOW, was run to estimate the crest level required to yield a given overtopping discharge, initially assuming that the overtopping performance of these structures would be equivalent to that of equivalent smooth concrete slopes. The limiting overtopping discharge selected was 20 Vs per metre run, often accepted as a maximum for a protected embankment seawall where no people or vehicles will approach the rear side of the structure during storm conditions.
The above criteria were used in calculations of crest level for each proposed structure angles (1:1, 1:2 and 1:4). The results suggested that the structure would need to be constructed with a crest level up to 4.5m above the water level to obtain the design discharge. Whilst a few UK sea defences require walls of this height, a more economical type of structure was also of interest. A second series of tests was therefore designed to study responses under depth-limited waves in a local depth of 3.5m, when lower crest levels could be used.
The main structural and environmental parameters used in these studies may be summarised:
Slope angles (nominal) 1:1, 1:2, and 1:4 Toe elevation 0.Om Local water depths hs = 5.5 or 3.5m Maximum crest elevation 10m above toe Offshore wave height up to Hs = 4.8m Inshore wave height up to Hs = 3.Om Mean wave steepness Sm = 0.03 or 0.06
2.2 Wave Flume
The model tests outlined in this report were conducted in the deep random wave flume at HR Wallingford. The flume is 52m long and operates over a range of water depths at the paddle of 1.3 to 1 .7m. For most of its length the flume is split into a 1 .2m wide central test channel, terminating in a finger flume, and flanked by 2 side absorption channels. The test section is placed close to the end of the finger flume, bounded on both sides by glass walls allowing the structure to be observed. Splitter walls of graduated porosity between the central and side channels are designed to minimise the level of re-reflected waves. Each of the test sections were constructed in turn on the horizontal bed formed between the observation windows in the finger flume at 0.Om level. Approach bathymetry was moulded in cement mortar at 1:100, extending seawards some 225m to a level equivalent to -7.5m. This slope was then steepened down to deeper water, equivalent to -22m.
The wave paddle is a buoyant sliding wedge driven by a double acting hydraulic ram. A BBC computer, using software written at HR Wallingford, controls the paddle enabling either regular or random waves to be produced.
2.3 Wave calibrations
Detailed measurements of the test wave conditions were made in the absence of reflections before construction of the test sections. These wave calibration tests defined each of the test conditions at the position of the toe of the model sections. Spectral analysis of short sequences (250 - 300 waves) of random waves was used to derive spectral estimates of wave height and period. Statistical analysis of longer sequences of waves (1000 waves) was used to derive extreme wave heights in the distribution, such as H0/1%, Hs = H1/13, and H1/10, The measurement and analysis of wave conditions are discussed more fully in Appendix 2, and the results of the statistical analysis are summarised in Table 1.
3. Test Section Construction 3.1 Model design
The principal concern in the design of a physical model of this type is to ensure that the main aspects of wave I structure interaction are reproduced faithfully at a scale that avoids significant scale effects. The test section must also be of a practical size to be handled in the facility selected and with the resources available. Studies of this type have been discussed more fully by Owen & AlIsop (Ref 1) and Owen & Briggs (Ref 2). After the consideration of these constraints a scale of 1:15 was selected.
3.2 Model T-block fabrication
The test fluid in the model was fresh water with a specific weight of 1000 kg/rn3. In the

prototype however the sea water will have a specific weight of approximately 1025 kg/m3. This variation in water density means that the units in the model would be more stable than in the prototype if simply scaled geometrically, thereby under-predicting armour stability. The density of the model armour units was therefore adjusted for correct stability using a relationship based upon Hudson's formula (Ref 3). The specific weight of the model armour units scaled for correct stability can be derived by allowing the ratio of W2/W1 to equal unity:
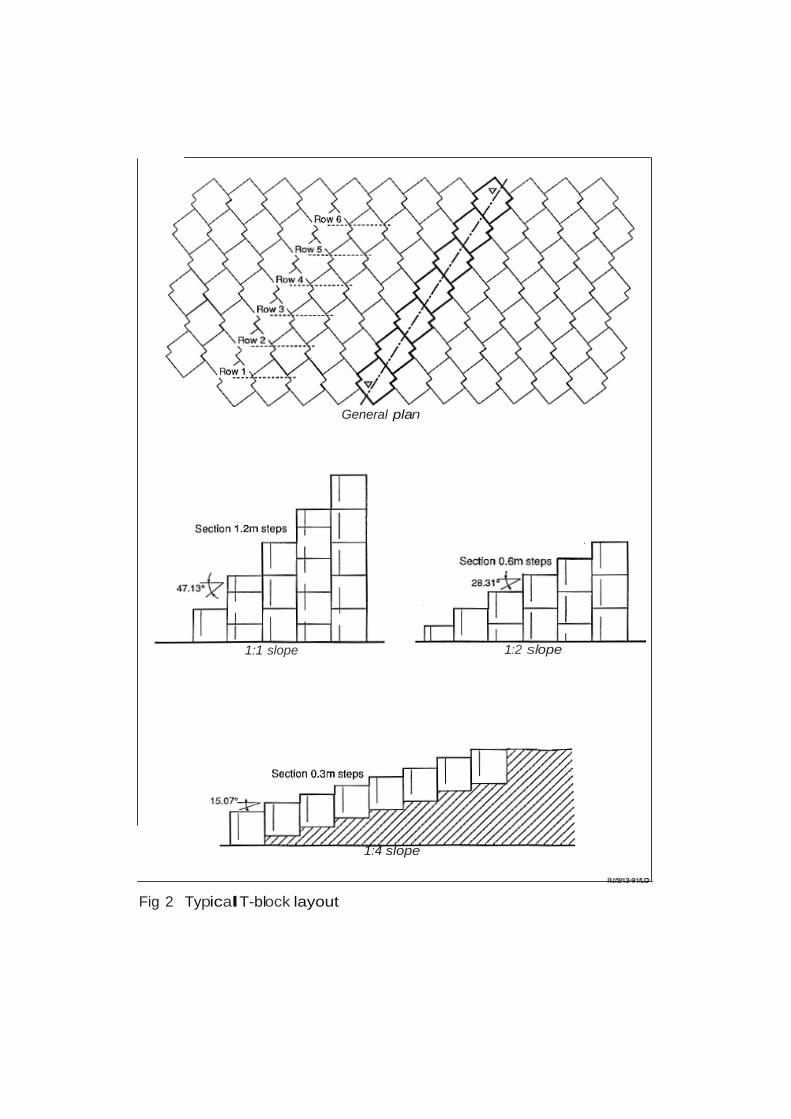
A total of 160 full size concrete units and 80 half size units at a scale of 1:15 were fabricated for this study. The T-block is cast as a concrete cube of 1 .2m side (with a block thickness, D = 1 .2m), interlocking with surrounding T-blocks by means of 0.25m side cut-outs down opposing vertical corners, see Figure 1. Two moulds for the model unit fabrication were constructed from interlocking sections of PVC plastic. Up to 8 full size and 4 half size units were cast in each operation.
3.3 Construction of model sections
The stability of any revetment armour is significantly influenced by the permeability of the cover layer, and of the under- or bedding layer(s) beneath. This effect was illustrated by damage to the test section in the first tests, see Chapter 5. It is therefore important to describe the form of construction anticipated in practice, and to identify the effects of any differences between practical structures and those tested here.
The simplest method of protecting a wall or embankment with T-blocks is to form a horizontal foundation level in lean-mix or no-fines concrete, or perhaps well-compacted fill, then place the T-blocks in columns as shown in Figure 2. On sloping structures, particularly those where the slope is long, a saving may be effected by placing the T- blocks in a single layer only. For these structures, the exclusion of significant wave pressures from the embankment fill material will require the bedding layer to be of relatively low permeability, and of sufficient strength itself to resist erosion by flows through the blockwork joints. This will be well satisfied by the use of a lean-mix or no- fines concrete as the bedding layer beneath each block.
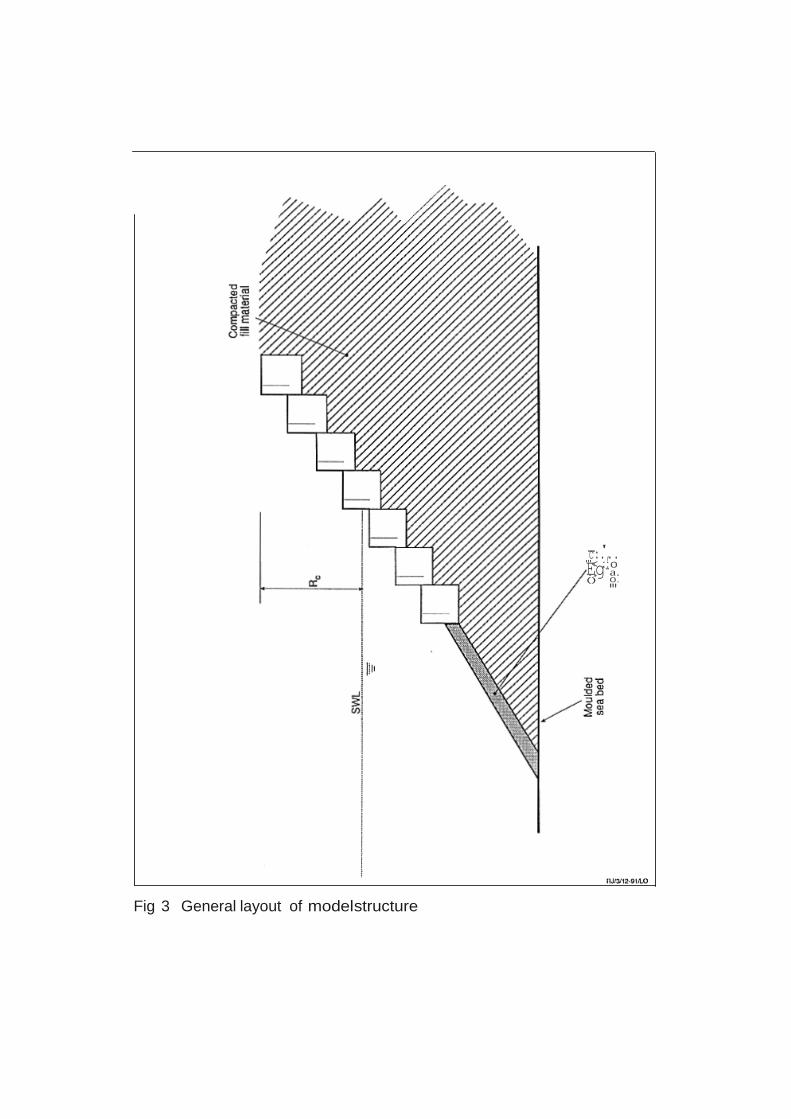
In the model it was not possible to construct the sections solely of T-blocks due to the limited number of model units available. For most test sections the blocks were therefore placed in a single layer upon fill material. At the toe of some of the test sections, a short approach was formed in cement mortar. For the first test, the bedding material beneath the T-blocks was loosely placed and of relatively high permeability, equivalent to k = 0.5m/s. This might correspond to narrow-graded bedding stone of typical diameter 0.25- 0.5m. After damage to this section in test la, see Chapter 5, the construction was
modified for the rest of the study. The permeable bedding layer and embankment core were replaced by compacted wide-graded fill with a permeability equivalent to 0.005 rn/s, equivalent to coarse sand, placed to approximately the depth of a unit below the intended armour unit. within the fill, a geotextile filter layer was placed in a stepped pattern, reflecting the levels of the bedding material. A further thickness of the same fill was then compacted, onto which the T-blocks were placed. Care was taken to seal the construction against water ingress at the edges of the structure. The main geometric parameters for the sections tested may be summarised:
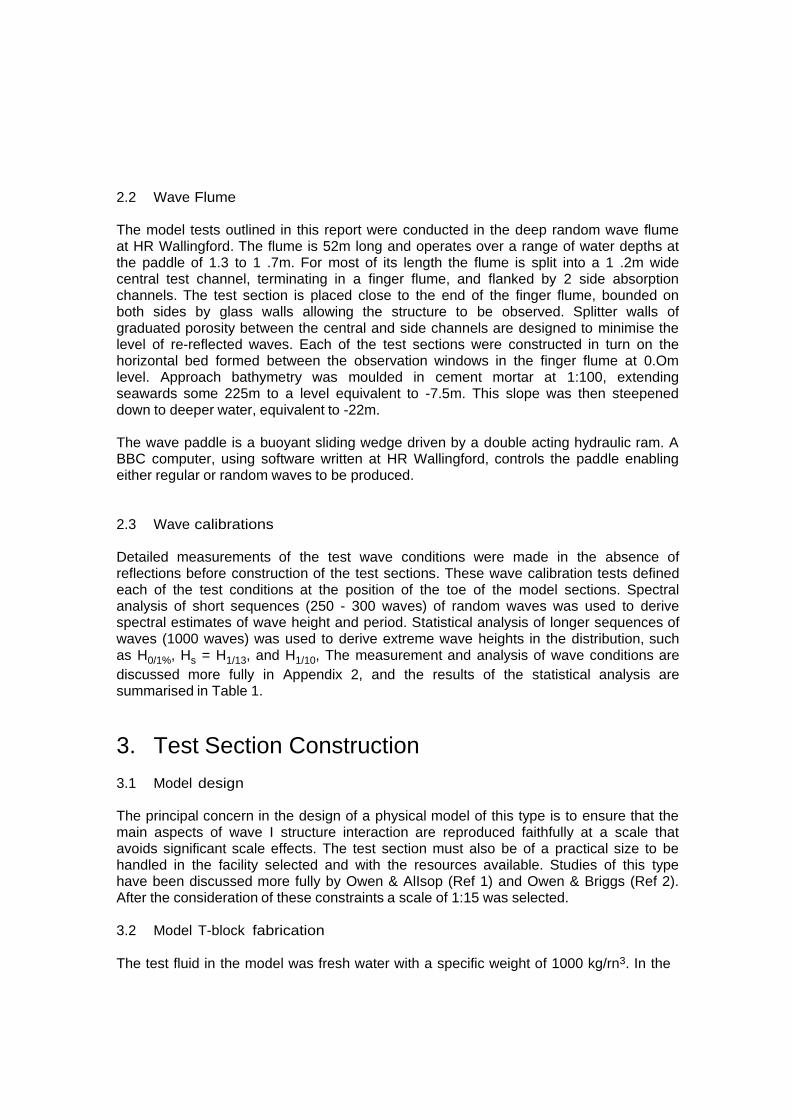
Test Slope Crest SWL Freeboardseries angle level Rc
(m) (m) (m) 1 1:2 10.85 5.5 5.35 2 1:2 10.05 5.5 4.55 3 1:2 9.42 5.5 3.92 4 1:1 8.50 3.5 5.00 5 1:2 7.88 3.5 4.38 6 1:4 7.40 3.5 3.90
An approach slope, shown schematically in Figure 3, was incorporated in all the test series except 4 and 510 achieve the required structure height with the number of units available. This approach slope was constructed at a level that minimised its effect upon the response functions of the model.
4. Test Procedures Each model test was run with random waves for a duration of 1000 waves.
4.1 Armour block stability
During testing1 observations of armour block movement were made through the flume
windows. An overlay photographic technique was employed to monitor displacement during test series 1, 2 and 3. Photographs were taken before and after an individual part of each test. These were then analysed to detect movement of individual T-blocks.
4.2 Overtopping
Overtopping discharges were measured in each test. All overtopping water was collected in a calibrated tank from which the difference in water level was converted to a discharge. All the water passing over the structure was measured over the whole test where possible, but the collection period was shortened if the rate was very high. Model discharge rates were converted to prototype using:
4.3 Reflections Incident and reflected wave energy spectra were measured using three wave probes placed at different spacings. The wave probes did not allow the. direct measurement of incident and reflected wave energy, but these were calculated using an analysis programme developed by Gilbert & Thompson (Ref 4) based on a method outlined by Kajirna (Ref 5). This method of analysis calculates the reflection coefficient for a range of frequencies, valid over a frequency band related to probe spacing.
The three probe spacings used in the model were selected so that data were derived for 0.5fm – 2.0fm where fm is the peak wave frequency. If two or more spacings produced valid energies at the same frequency band then the energies were averaged. The reflection coefficient, Cr~ was calculated:
Cr = (Sr /Si)O.5
where Sr is the total reflected wave energy and Si is the total incident wave energy.
5. Test Results A summary of the tests run in this study is given in Table 2.
5.1 Armour block stability
In test 1a, the 1:2 slope protected by T-blocks placed on coarse bedding stone failed. The collapse was relatively sudden, and almost all the test section suffered damage. The failure was that of a revetment facing, see Reference 6, where the pressures within a permeable bedding layer may be sufficient to push out a block, or blocks, at about the point of maximum wave draw-down. It was quickly clear that the highly permeable underlayer used in the first test section allowed water to flow into the structure on an incoming wave through the blockwork joints. During down-rush, water could not leave the structure so readily, leaving an elevated phreatic surface in the underlayer beneath the blocks. This imbalance in pressure was then sufficient to cause the failure.
The test section construction was revised for subsequent tests, resulting in a significantly less permeable structure, see Chapter 3. No blocks were removed in any of the subsequent tests, even when wave conditions reached Hs = 3.Om, although the cause of small movements of blocks is discussed at the end of this section. These tests did not
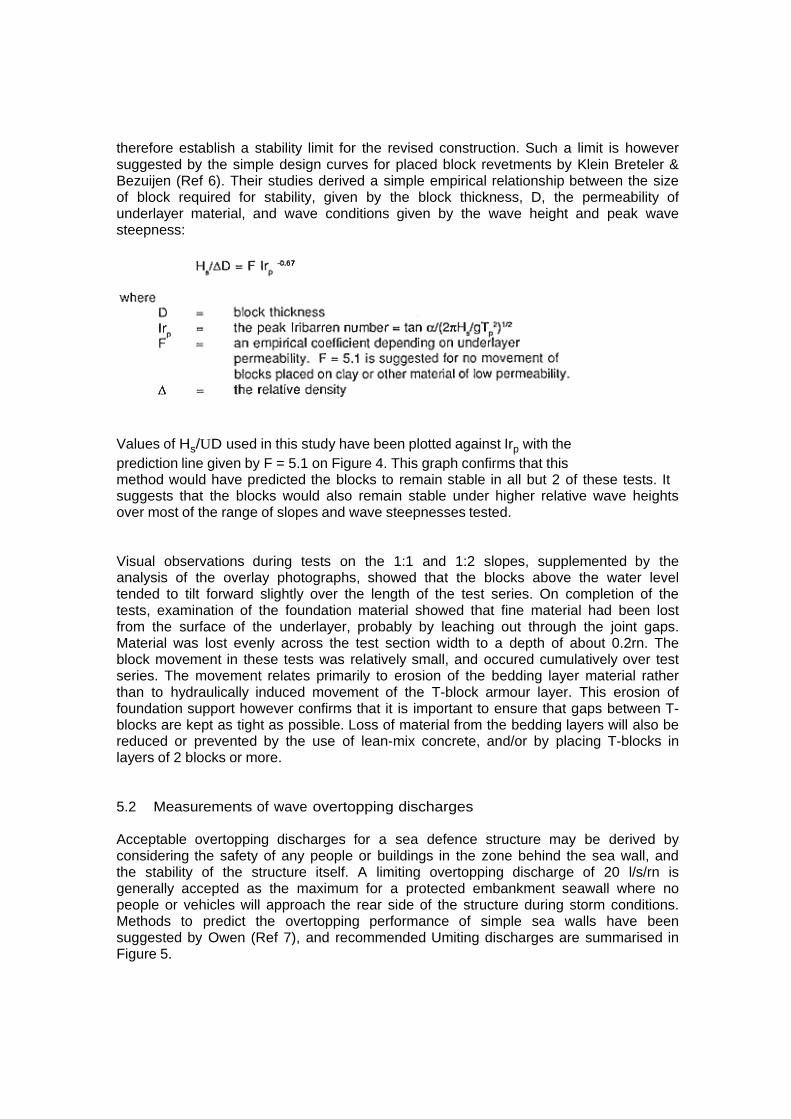
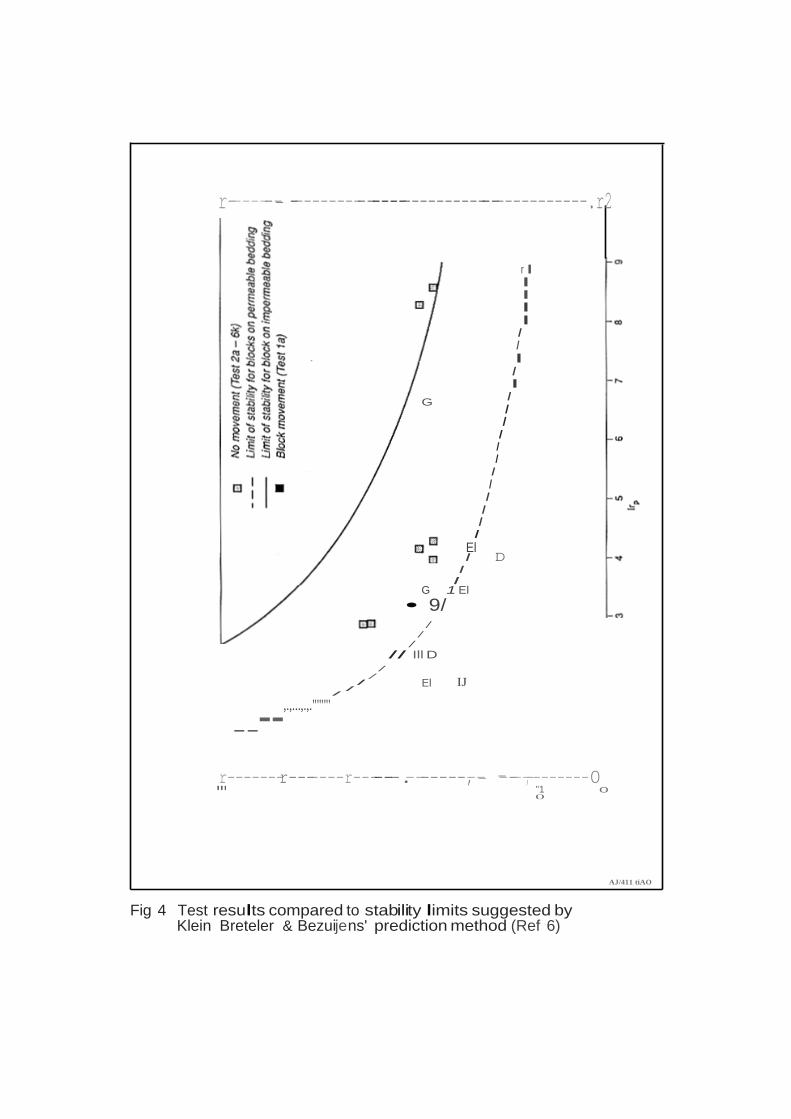
therefore establish a stability limit for the revised construction. Such a limit is however suggested by the simple design curves for placed block revetments by Klein Breteler & Bezuijen (Ref 6). Their studies derived a simple empirical relationship between the size of block required for stability, given by the block thickness, D, the permeability of underlayer material, and wave conditions given by the wave height and peak wave steepness:
Values of Hs/UD used in this study have been plotted against Irp with the prediction line given by F = 5.1 on Figure 4. This graph confirms that this method would have predicted the blocks to remain stable in all but 2 of these tests. It suggests that the blocks would also remain stable under higher relative wave heights over most of the range of slopes and wave steepnesses tested.
Visual observations during tests on the 1:1 and 1:2 slopes, supplemented by the analysis of the overlay photographs, showed that the blocks above the water level tended to tilt forward slightly over the length of the test series. On completion of the tests, examination of the foundation material showed that fine material had been lost from the surface of the underlayer, probably by leaching out through the joint gaps. Material was lost evenly across the test section width to a depth of about 0.2rn. The block movement in these tests was relatively small, and occured cumulatively over test series. The movement relates primarily to erosion of the bedding layer material rather than to hydraulically induced movement of the T-block armour layer. This erosion of foundation support however confirms that it is important to ensure that gaps between T- blocks are kept as tight as possible. Loss of material from the bedding layers will also be reduced or prevented by the use of lean-mix concrete, and/or by placing T-blocks in layers of 2 blocks or more.
5.2 Measurements of wave overtopping discharges
Acceptable overtopping discharges for a sea defence structure may be derived by considering the safety of any people or buildings in the zone behind the sea wall, and the stability of the structure itself. A limiting overtopping discharge of 20 l/s/rn is generally accepted as the maximum for a protected embankment seawall where no people or vehicles will approach the rear side of the structure during storm conditions. Methods to predict the overtopping performance of simple sea walls have been suggested by Owen (Ref 7), and recommended Umiting discharges are summarised in Figure 5.

Initial designs for the model test sections assumed that the performance of a T-block slope might be close to that of the equivalent smooth slope. Crest levels were calculated for an overtopping limit of 20 l/s/rn for 2 example wave conditions: Hs = 3.Om, Tm = 5.7s; and Hs = 2.5m, Tm = 7.3s. The crest levels to obtain overtopping discharges less than 20 I/s/rn, required that the test structures be constructed to crest levels up to 10m above toe level, having a crest freeboard of 4.5m. In test 2c, the measurements showed that overtopping was approximately 2 I/s/rn for a crest freeboard of 4.5m, ie 10 times smaller than guessed initially. In test 3c, the crest was therefore lowered by a half unit, and this increased the mean overtopping to approximately 7 I/s/rn at the design wave conditions.
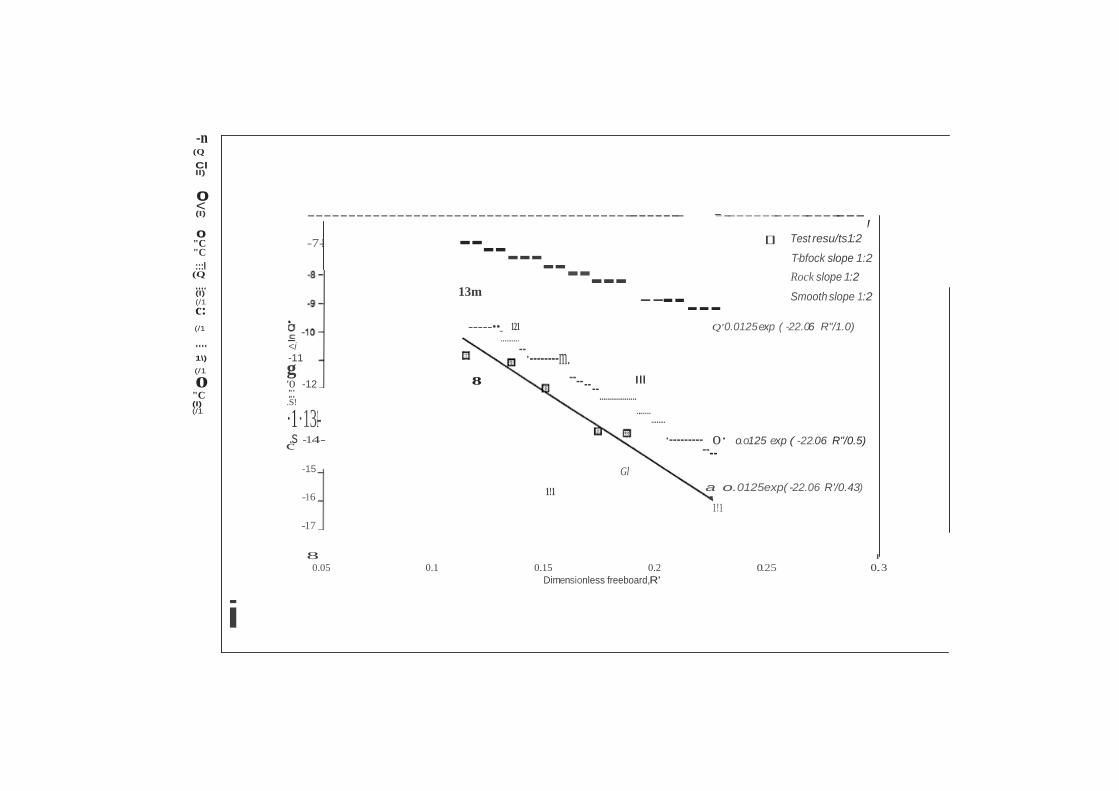
The results of the overtopping measurements are summarised in Table 2, and are presented within the empirical framework derived by Owen in Figures 6a and b. These figures illustrate the variation in the dimensionless discharge Q~ with the dimensionless freeboard R* for the 1:2 slope, and for all of the slopes. In Figure 6a the test results for the 1:2 slope are compared with predictions made by Owen's method for a smooth 1:2 slope and a rock 1:2 slope. Q* and R* are defined:
Q* = Q/(Tm g Hs) and R* = Rc/(Tm(g Hs)0.5)
where Q is the mean overtopping discharge per unit length of structure and Rc is the freeboard (the height of the crest above the design water level). Owen's analysis of data for simple slopes suggested that Q* may be related to R*
Q* = A exp (-BR*/r)
The empirical coefficients A and B depend on slope angle (A = 0.0125 and B = 22.06 for a 1:2 slope) and r is a relative roughness coefficient. Values of r less than 1.0 imply run- up levels below those for an equivalent smooth slope. Owen suggests values for r for different revetment facings based on earlier
work in the Netherlands on wave run-up levels. Suggested values for r may be
summarised:
Revetment Construction Roughness value, r Smooth, impermeable 1.0 Rough concrete 0.85 Pitched stone in mortar 0.75-0.8 Two layers of rubble 0.5 - 0.6
All measurements for the 1:2 T-block slope are presented in Figure 6a, together with predicted responses for smooth or rock armour red 1:2 slopes. The overtopping performance of the 1:2 T-block slope is well described by a value of r = 0.43, comparing most favourably with those suggested for smooth or rough impermeable slopes, and for rock armoured slopes.

The improvement in overtopping discharge achieved by constructing a T-block structure rather than a conventional concrete slab or blockwork slope are significant. The overtopping performance of T-block slopes are also better than predicted for the equivalent rock slope. For any design overtopping discharge, a slope formed with T- blocks may therefore be taken to a lower crest level than either of the comparison slopes. These improvements can be illustrated simply by considering three different structure types with crest freeboards of Rc = 4.4m, and wave conditions given by Hs = 2.2m and Tm = 6.ls. These give a value of R* = 0.155. At this value, the overtopping discharges predicted for a smooth slope (r = 1.0), a rock armoured slope (r = 0.5), and a T-block slope (r = 0.43), are 54.0, 1.8 and 0.6 l/s/m respectively.
5.3 Measurements of wave reflections
The results of wave reflection measurements are summarised in Table 2, and are shown on a single graph, Figure 7, using the simple empirical relationship suggested by AlIsop (Ref 8). AlIsop's measurements of reflections from smooth and rock armoured slopes fitted a simple relationship between the reflection coefficient Crm, and the mean Iribarren number lrm of the form:
Generally the reflection performance of the T-block slopes fell between these two prediction lines. Reflections from T-block protected slopes will therefore be less than for the equivalent smooth slope, but slightly more than that for a rock armoured structure.
6. Conclusions Hydraulic model tests in random waves have quantified the hydraulic performance and stability of T-blocks placed at slopes of 1:1, 1:2, and 1:4 slopes under a range of wave conditions and water levels. The test results suggest the following conclusions:
1. Stability of sloping face structures using the T-block depends upon the overall
permeability of the construction, as well as upon the incident wave conditions. Initial tests on a 1:2 slope protected by a single layer of T-blocks placed on coarse permeable material gave low levels of stability. Water entering the underlayer during wave up-rush forced units out of position on the down-rush, simply due to the differential pressure head. The revised structures on material of low permeability were stable under all test conditions used. A simple empirical relationship derived previously for placed block revetments may be used to give an initial estimate of the block thickness D required for limiting stability of T-blocks at these slopes, if placed on bedding material of permeability k < 0.OO5m/s:

Hs/UD = 5.1 Irp
-0.67
Careful design of joint spacings, underlayer material, and the number of layers of T-blocks will still be required to ensure overall stability. Attention to restricting possible flow paths into the structure will be needed to reduce any tendency for erosion of bedding material.
2. The overtopping discharges for these T-block structures have been compared to
those expected on equivalent smooth and rock armoured slopes. The T-block structures tested here gave significantly less overtopping than predicted for smooth slopes, and slightly better performance than predicted for rock armou red slopes. This implies that a slope formed with T-blocks may be taken to a lower crest level than either smooth or rock armoured slopes. The overtopping performance of a 1:2 slope protected with T-blocks may be given by Owen's empirical relationship using a relative roughness coefficient r = 0.43. This may be written:
Q* = 0.0125 exp (-22.06 R* / 0.43)
where Q* and R* are the dimensionless discharge and freeboard parameters defined earlier.
3. Wave reflections for slopes protected by T-blocks have been compared to those predicted for equivalent smooth and rock armoured slopes. The results show that the reflection performance of this armour unit lies between these two comparisons. The reflections for this type of armour unit will be less than for a smooth slope, but greater than for a rock armoured structure.
7. Acknowledgements This study was conducted and reported for Tolent Sea Defence Limited by Mr R J Jones and Mr N W H AIlsop of the Coastal Structures Section, HR Wallingford. HR Wallingford acknowledge the help given during the test programme by Mr S Atkinson of Tolent Sea Defence Umited.
8. References 1 Owen M W & AlIsop N W H "Hydraulic modelling of rubble mound breakwaters"
Proc Conf Breakwaters - Design and Construction, ICE, London, 1983. 2. Owen M W & Briggs M G "Limitations of modelling" Proc Conf Breakwaters 85,
ICE, London, October 1985. 3. Coastal Engineering Research Centre "Shore Protection Manual" Vols 1-2, US
Govt. Printing Office, Washington, 1984. 4. Gilbert G & Thompson D M "Reflections in random waves, the frequency response
lunction method" Report ITi 73, Hydraulics Research, Wallingford, March 1978. 5. Kajirna R "Estimation of an incident wave spectrum under the influence of
reflection" Coastal Eng. in Japan, Vol 12, 1969. 6. Klein Breteler M & Bezuijen A. "Simplified design method for block revetments"
Proc Coastal Structures and Breakwaters Conference, Institution ot Civil Engineers, London, 6-8 November 1991.
7. Owen M W "Design of seawalls allowing for wave overtopping" Report EX 924,
Hydraulics Research, Wallingford, June 1980. 8. AlIsop N W H "Reflection performance of rock armoured slopes in random waves"
Proc 22nd International Conference on Coastal Engineering, DeIft (also published paper No.37, HR Wallingford).

TABLES


FIGURES

t
"!
T
1--- - - - 0.9sm,-- - - --l-0.2sm-j
.. - .. -
E "!' 0
l - E i(l 0
..L "=
-
I
Plan
; I I I I I I I
E ---- ----------,I ---- 1 I
E I
m I 0 I
I I I I
Elevation
RJI\11? 91A.O
Fig 1 T-block
General plan
1:1 slope 1:2 slope
1:4 slope
Fig 2 TypicalT-block layout
Eg-
-c:.',.. "'< ::o ., a. () 0.
"'
Fig 3 General layout of modelstructure
/
"'
r--------- --------------------------------------.r2
r I I I I I I I I I I
G I I I I I I I I I I I I
El I D
I I
G 1 El
• 9/ /
/ /
/
/ /
----,.,...,.,."'""'
// Ill D /
El IJ
r-------r-------r------.-------,---- ------,-, -------0 "1 0 0
AJ/411 tiAO
Fig 4 Test results compared to stability limits suggested by Klein Breteler & Bezuijens' prediction method (Ref 6)

.,
1000
100
I.. 10
€.. !:
,."li"! . g8..
:
c.l;. :::i 0.1
O.ol
0.001
0.0001 Vehicles
Fig 5 Safe overtopping discharges
<
-::: --
-n (Q
Cl ll)
0 (I)
----------------------------------------------- ---------------------, 0
"C "C :::l
(Q
....
-7-1 ----
-----
----- [] Test resu/ts1:2
T-bfock slope 1:2
Rock slope 1:2
(I) (/1
c: 13m -------
Smooth slope 1:2
(/1
.... 1\)
(/1
0 "C (I) (/1
<i -11
g '0 -12
.S!
·1·13-1 c.s -14-
-----••_ 121 ..........
--·--------m. 8 ------
Q'0.0125 exp ( -22.06 R"/1.0)
Ill
................... ........
........
·--------- o· o.o125 exp ( -22.06 R"/0.5) ---- -15
-16
-17
Gl
1!1
a.·o.0125exp( -22.06 R'/0.43)
1!1
8 I
0.05 0.1 0.15 0.2 0.25 0.3 Dimensionless freeboard,R'
i

'TI (Q
(J)
C"
0 (.<I.). 0
-6,------------------------------------------------------------. + 1:1 T·block slope
"'C "'C :I
(Q
; Icll
;::;: Ill
Ill
a. I..l..l. Ill
. ]
·8
.g Bm
b ·10 E 0 -1' ;!< X u :6 -12
X
j
·1·13-1 .§·14- Cl
-15
·16
-17 X
13 1:2 T-block slope x 1:4 T-block slope
Empirical prediction tor 1:2 slope
13
·18+-------------,-------------,-------------.--------------r------------ 0.05
i ;< 0
0.1 0.15 0.2 Dlmensionlesslreoboard,R•
0.25 0.3

..
•
\
r---- --------------------------------------------
;;--
Q)
;:;;
I "e' I I
-;..:
1!1 )(
_,e <1 <o <1· 0> <S
(.)
I i:f I e I ...,. I
"! I"i' I (.) I I I I
\ \ \ \ \ \ \ \
'\ \ \ \ \ \
ms \ \ \ \ "'
\ \ \ \ \ \ \ \
0... 0 0
Fig 7 Reflection results

APPENDICES

Appendix 1 Physical model test facility
The model tests for this study were carried out in a wave flume or channel measuring 52m long by 3m wide by 2m deep and having a nominal working depth of 1.3 to 1 .7m. The wave generator is a wedge type random wave paddle powered by a double acting electro-hydraulic ram controlled by a BBG microcomputer. This system was developed at HR from an older "hard wired" wave spectrum synthesizer. This combination of synthesizer and wave generator is capable of producing any required deep water ocean wave spectrum that can be described by 16 spectral ordinates. The BBC micro computer wave spectrum synthesizer produces a random wave spectrum by digitally filtering a white noise signal via a shift register. Varying lengths of wave sequence can be produced on this shift register which is used in conjunction with a clock pulse generator (Ref 1.1). This allows a repeatable pseudo-random sequence of outputs to be generated creating sequences of waves with repeat times varying from a few minutes to several tens of years depending on the test requirements.
This wave flume is divided along its length into three channels by vertical splitter walls which increase in porosity as it approaches the generator end of the flume. These porous divide walls help prevent the generation of cross waves as well as dissipating any energy reflected back from the structure being tested. Two smaller channels (O.9m wide) are of constant depth and end in a spending beaches of about 1:5 gradient. These channels are used to measure the "deep water wave conditions produced by the generator. The wider channel (1 .2m wide) contained the model and sea bed profile under test.
References
1.1 Wave spectrum synthesizers. E&ME Tech Memo 1/1972, Hydraulics Research
Station, June 1972.

Appendix 2 Spectral analysis program
The BBG micro-computer wave spectrum synthesizer produces a random wave spectrum by digitally filtering a white noise signal via a shift register. Varying lengths of wave sequence can be produced on this shift register which is used in conjunction with a clock pulse generator (Ref 2.1). This allows a repeatable pseudo-random sequence of outputs to be generated creating sequences of waves with repeat times varying from a few minutes to several tens of years depending on the scaling parameters. During wave calibrations a short repeating sequence of about 10 minutes duration was programmed on the BBC computer using spectral analysis to define the waves parameters. This involves recording data over one complete wave generation sequence in order to eliminate any statistical uncertainty in the results. The water level at the twin wire wave probe (Ref 2.2) is recorded by a Compaq microcomputer at every clock pulse of the synthesizer, typically ever 0.1-0.2 seconds. A maximum of 16384 data points can be collected from up to 24 probes at one time using this program. The analogue output of the wave probe, representing a displacement relative to the still water level, is first converted to a digital form by an A-D convertor and then to an elevation in prototype metres via the model scale. Hence, at the end of sampling, a series of water level elevations are known for every clock pulse, ie up to 16384 points. This program then uses a Fast Fourier Transform technique (Ref 2.3) to convert the time base data into the frequency domain and then splits the data into individual sine waves to extract the energy content of each frequency component. From this data the energy/frequency spectrum can be set up from which values of the significant wave height, H9, and zero
down-crossing period, Tm ,can be defined using the moments of the spectrum.
References
2.1 Wave spectrum synthesizers. Technical Memo 1/1972, Hydraulics Research
Station, June 1972. 2.2 Twin wire wave probe modules. Technical Memo 3/1974, Hydraulics Research
Station, October 1974. 2.3 The fast Fourier transform with applications to spectral and cross spectral
analysis. Internal Report 100, Hydraulics Research Station, December 1972.

.
T-Block Coast Protection Units: Random wave studies
Summary of HR Wallingford Report EX 2484, December 1991
I.Introduction HR Wallingford have Xnnpleted hydraulic model tests at a IC&lc of 1:15 to mcuare the h)-dnullc perfonnmoc md 5tability inrandom waves of a new ooocrcle armour block. the '1'-bloclc". The T-bloclc is a mass c:onae1e cube of 1.2m sides, interlocking with adjoiniJI3 T- blocks by 0.25m cut uts down opposing vcmc.t comen (Pig 1).
A stability limit for this construction is suggested by design curves foe block revettnenS by Klein BreWer & Bemijen (Ref 2). who derive a
simple relationship between the size of block given by the block thickness D, the permeabilliy oC Ullderlayer material used for construction. the incident wave conditions given by the significant
wave height H. md peak wave stecpnCJJ a,. and slope angle a:
where h,
F
HJM> • Ph, "'n (1) peak In'barren number"' tan a /(21tHJgT,2)0$ empirical coeff'acic:nt depending on underlayer permeabilily relative buoymt density
- ·
f :1 •lot» 1:2'
IU
The tests were intended to be of general application. The model allowed offshore waves up to H, = 4.8m to be generaled, providing conditions considered typical of those foiDid around much of the UK coastline. Wafll:r depths up to S.Sm at the structure allowed tests on
3 different slopes formed from T-blocks in waves up to H,=3.0m.
2.Armour stability The test programme concentrated on 1:1, 1:2, and 1:4 slopes formed
from low permeability fill (k<O.OOSm/s) protected by T-blocks. No blocks were removed in these tests, even when wave conditions
reached H,= 3.0m. An alternative strucrure using permeable granular fill. equivalent to 0.25-0.Sm bedding stone, was found to be W\Stablc. demonstrating the requirement to select the appropriate low
permeability materials for r.Jl and bedding layers.
Klein Breteler &. Bezuijen suggest F=.S.l for no movement of blocks plac:ed on clay or olber mllerial of low permeability, and P-2.6 for
blocb on more peaneable bedding mala'ial. Values of HJM> ploacd against h, are compared wilh this prediction IIUlthod in FJ,gUre 2.
... .. ItA f• .
...
This graph &bows the suggested toneJ within which bloclcs may be stable, both for blocks placed on clay or olher material of low permeability, or for blocks on more permeable bedding malerial Tile limits shown suggest that some movement might have been expecud
in up to two of the tests, but that the blocks would also remain stable IDidcr higher relative wave heights than were tested here over most of the range of slopes and wave stecpnesses.

)
•
1·
.---------
3. Wave overtopping The overtopping discharge measurements obtained from this study are summarised in Figure 3, which illustrates the variation in
dimensionless discharge Q•, with the dimensionless freeboard R•.for the three slopes investigated and compares the results with predicted
values for smooth and rock armoured 1:2 slopes. The prediction equation derived at HR Wollingford relates Q• to R• in the form:
Q• = Aexp(-BR•/r) (2)
wh Q8 dimensionless discharge = Q/(f•g H.) R• dimensionless freeboard= RJ(T(.g H.)o.s) Q mean overtopping discharge pet unit length of
SlnlCIUCC
R. freebolfd (the height of the crest above tho design wat.er level)
r roughness coefficient, generally between 0.4 lllld 0.8 for rough slopes
A end B are empirical coefficients dependent on slope
angle (0.0125 and 22.06 respectively for a 1:2 slope)
Thc&e rc&ults show that a stepped T-bloclc structure may yield significant improvcmcnt.c in wave overtopping over the equivalent smoothconcrete slab or bloclcworlc armoured slope. The results also
auggc&t that aT-block structure may give as low overtopping as a roelc armoured slope. or even slightly better. The consequent reductions in freeboard needed for a given overtopping discharge rnay
be calculated by solving Equation 2 for R.using a roughness coefficient r-0.43.
4r----------------------------------,
coefficient C, may be related to the mean Iribarren number Ir.by a simple equation of tlle form :
(4)
where a and b arc empirical coefficients, and Irm
=tan a I (27tHjgT.,1 0_,.
Values of a=0.64 and b=8.8S have been derived for 2 layer rock armoured slopes, and a=0.96 and b=4.8 for smooth slopes. Most
reflection measurements inthiS swdy fell mid-way between these two predictions. Tho tendency for local scour to oocur with. the T-bloclc
will therefore be less than expected for a smooth sloped IU1JdU:re. but great.er than that CJ pocted for a roclc lmlOured structure.
·• b;:4: :: .1.5. ·17
•...•................_ .... ,_,.f) -,.;.:,.....,1
.. -"."a.s
r-ou a
5.Discussion The report on model studies (Ref 1) describes the test conditions and
results inmore depllL The results of the study are inten<lcd to give guidance on the likely performance of example sb'Ucture configurations, appropriate to initial dc&ign work.The test results
should not be used without careful considCI'&Iion of the applicability of the test conditions used in the study to the particular circmns coruidered. Detailed designs should be supported by site specific studies to check the likely hydraulic and structural responses.
-Ito.os ----- .------ ---- -----------l
0 1
4. Wave reflections
0.1$ 0.05
6.References 1) Jones RJ & Allsop NWH '1'-block ooast protection units:
random wave studies" Report EX 2484, HR Wallingford,
December 1991
Large wave refle.ctions from any coastal structure may lead to 2) CJ cessive local wave disturbance and/or to increased beach erosion or
bed scour. The reflection performance of the structures tested here
may be described on a single graph. Figure 4. 'The reflection
Klein Bretelcr M & Bezuijen A. "Simplified design method for block revetments" Proc Conference Coastal St:rucrures and
Breakwaters, Institution of Civil Engineen, London. 6-8 November 1991.
Coastal Structures Section, HR Wallingford February 1992
Resistcn=d Office:HR Wallingford Ltd, Howbcry Padt,Wallingford, Oxfordshire OXIO 8BA, UK. 'lelephonc: 0491835381 lntemadonal+4449183S3811Clex:848S52HRSWALG. Facsimile· 0491 832233 lnremational + 44 491 832233 Registered in England No.2562099 HR WIIJiDparclLidIs a wholly ownednbsldiary of HR Wallinaford GroupLtd.