t a j ,498:716 727,1998may10 1998 ... general, the co proÐles for ysos show evidence for both...
TRANSCRIPT

THE ASTROPHYSICAL JOURNAL, 498 :716È727, 1998 May 101998. The American Astronomical Society. All rights reserved. Printed in U.S.A.(
PROCESSING OF ICY MANTLES IN PROTOSTELLAR ENVELOPES
J. E. P. A. AND D. C. B.CHIAR,1 GERAKINES, WHITTET
Rensselaer Polytechnic Institute, Department of Physics, Applied Physics, and Astronomy, Troy, NY 12180
Y. J. AND A. G. G. M.PENDLETON TIELENS2NASA-Ames Research Center, Mail Stop 245-3, Mo†ett Field, CA, 94035
A. J. ADAMSON
Centre for Astrophysics, University of Central Lancashire, Corporation Street, Preston PR1 2HE, England, UK
AND
A. C. A. BOOGERT
Kapteyn Astronomical Institute, P.O. Box 800, 9700 AV, Groningen, NetherlandsReceived 1997 June 11 ; accepted 1997 December 16
ABSTRACTWe have obtained CO absorption proÐles of several young stellar objects (YSOs), spanning a range of
mass and luminosity, in order to investigate their ice mantle composition. We present the Ðrst detectionof CO toward the class I YSO L1489 IRS in the Taurus dark cloud. In general, the CO proÐles forYSOs show evidence for both processed and pristine ices in the same line of sight ; strong indirect evi-dence for is suggested in R CrA IRS 7, L1489 IRS, Elias 18, and GL 961E. Toward other sourcesCO2(R CrA IRS 1, IRS 2, W33A, NGC 7538 IRS 9, Mon R2 IRS 2) CO is present in (nearly) pure form. Wepropose an evolutionary scenario to explain the chemical diversity of the icy mantles toward theseobjects.Subject headings : dust, extinction È infrared : ISM: lines and bands È ISM: molecules È
stars : evolution È stars : preÈmain-sequence
1. INTRODUCTION
Molecules frozen on interstellar grain mantles can drive arich gas-phase chemistry when outgassed in the heatedregions around protostars Tielens, & Millar(Charnley,
Thus, sight lines toward young stellar objects (YSOs)1992).may contain thermally or energetically processed dust inaddition to a cold undisturbed intracloud component. The4.5È4.8 km spectral region provides two potential diagnos-tics of radiative or thermal processing of interstellar ices inthe environs of embedded stars in molecular clouds. Abroad absorption feature centered at 4.62 km is seen in thespectra of several YSOs and attributed to CyN bonds in anitrile or isonitrile (““ XCN ÏÏ ; et al. Tegler et al.Lacy 1984 ;
et al. Laboratory studies have1993, 1995 ; Pendleton 1998).produced a similar feature by ultraviolet photolysis of COand et al. et al. &NH3 (Lacy 1984 ; Bernstein 1995 ; SchutteGreenberg Some proposed carriers are1997). CH3CN
et al. and OCN~ & Greenberg(Larson 1985) (Grim 1987 ;& Greenberg The XCN feature has not yetSchutte 1997).
been detected in the quiescent dark cloud medium. As CN-bearing solids in the laboratory are produced by energeticradiative processing of ices containing nitrogen, detection ofthis feature in YSOs is taken as evidence for (1) the presenceof nitrogen in the unprocessed cloud ices, and (2) evolutionof the ice in the vicinity of the embedded source. The adja-cent feature at 4.67 km, identiÐed with solid CO, providesnot only quantitative information on CO itself but alsoindirect evidence for the presence of other species such as
and Laboratory studies have shown that theO2, N2, CO2.position, width, and shape of the CO proÐle changes appre-ciably depending on temperature and the matrix in which
1 Present address : NASA-Ames Research Center, Mail Stop 245-3,Mo†ett Field, CA, 94035.
2 Present address : Kapteyn Astronomical Institute, P.O. Box 800, 9700AV, Groningen, Netherlands.
the CO is frozen (e.g., et al. et al.Sandford 1988 ; GerakinesDetailed modeling of the CO feature has been accom-1995).
plished by Ðtting laboratory ice analogs to the astronomicalspectra et al. Adamson, & Whittet(Tielens 1991 ; Kerr,
et al. 1995 ; Allamandola, & Sand-1993 ; Chiar 1994, Elsila,ford In general, the CO proÐle contains (1) a broad1997).(polar) component (at D4.682 km) attributable to CO in amatrix dominated by and (2) a narrow (nonpolar)H2Ocomponent (at D4.673 km) produced by either pure CO,CO in a nonpolar matrix (such as CO mixed with CO2, N2,or or CO in a weakly polar matrix (i.e., CO mixed withO2),a small amount of H2O).
Field stars, located by chance alignment behind darkclouds, probe the quiescent cloud medium; their spectraprovide a benchmark for comparison to YSO spectra.Toward Ðeld stars, the CO proÐle reÑects the presence ofcold (10 K) unprocessed ices dominated by CO itself or byCO in a nonpolar mixture (Chiar et al. The1994, 1995).polar component makes only a small contribution to theoverall proÐle. In contrast, CO features toward someembedded YSOs are relatively broad and show evidence forirradiated and/or warm (T º 30 K) ices (e.g., &PalumboStrazzulla Detailed comparison to laboratory spectra1993).shows that the CO proÐles observed in a subset of theseYSOs are consistent with the presence of mix-CO:CO2tures. The existence of in processed ices near embed-CO2ded objects has long been suspected (as it is produced easilyin the laboratory by UV irradiation of CO-rich or CH3OH-
ices ; see et al. Sand-rich dÏHendecourt 1986 ; Allamandola,ford, & Valero Schutte, & Ehrenfreund1988 ; Gerakines,
and this was recently conÐrmed by data from the1996)Infrared Space Observatory (ISO ; Graauw et al.de 1996).Pure begins to sublime at D45 K and can survive atCO2even higher temperatures when mixed with other molecules
& Allamandola so it can exist under condi-(Sandford 1990),
716

PROCESSING OF ICY MANTLES IN PROTOSTELLAR ENVELOPES 717
TABLE 1
YOUNG STELLAR OBJECTS : LOG OF OBSERVATIONS WITH UKIRT
Right Ascension DeclinationSource Other Designation (1950) (1950) Date Standard
W33A . . . . . . . . . . . . . . . . . 18 11 44.6 [17 52 57 1995 Sep 15 BS 7120 (K1 II)L1489 IRS . . . . . . . . IRAS 04016]2610 04 01 40.6 ]26 10 49 1995 Oct 31 SAO 76461 (F1 V)R CrA IRS 1 . . . . . . TS 2.6, HH100 IR 18 58 28.3 [37 02 27 1996 Apr 28 BS 7254 (A2 V)R CrA IRS 2 . . . . . . TS 13.1 18 58 19.1 [37 02 48 1995 May 18 SAO 210781 (F2 V)R CrA IRS 7 . . . . . . R1 18 58 33.3 [37 01 45 1996 Apr 28 BS 7254 (A2 V)
NOTE.ÈUnits of right ascension are hours, minutes, and seconds, and units of declination are degrees, arcminutes, andarcseconds.
tions where the more volatile CO, which sublimes at D17 Kin pure form, would be evaporated (or processed into otherspecies). Recent ISO results show that is also present inCO2quiescent environments sampled by Ðeld stars et al.(Whittet
but this is not evident from their CO proÐles1998), (Chiaret al. indicating that CO and are not intimately1995), CO2mixed in the same ice layers in quiescent regions.
Extensive previous studies of ices in the nearby low tointermediate mass star-forming regions of Taurus, o Oph,Serpens, and R CrA clouds are reviewed by Chiar (1997a).In the present paper we present new observations of YSOsin the Taurus and R CrA clouds. Taurus-Auriga andCorona Australis reside at distances of 140 pc (Elias 1978)and 130 pc & Rydgren respectively.(Marraco 1981),Taurus, Ðrst surveyed in the near infrared by Elias (1978),extends over many degrees (several tens of parsecs). It isfragmentary in appearance with no well-deÐned center, andstar formation has occurred in widespread regions through-
out the cloud The Corona Australis complex is(Elias 1978).similar in extent and morphology to Taurus. Like Taurus,this cloud appears quiescent in nature ; star formationwithin the cloud has not been triggered by external shockwaves The core associated with R CrA, Ðrst(Burton 1992).surveyed by & Storey contains a cluster ofTaylor (1984),young preÈmain-sequence stars. Water ice and solid COhave been previously detected in Taurus by et al.Whittet
and Longmore, & McFadzean and in(1983) Whittet, (1985)R CrA by & Blades & ChenWhittet (1980), Graham (1991),
& Graham and et al. TheChen (1993), Tanaka (1994).threshold visual extinctions for detection of the these fea-tures are mag ice ; et al. &A
VD 3 (H2O Whittet 1988 ; Chen
Graham et al. and D6 mag (solid CO;1993 ; Whittet 1996)et al. et al. et al. forWhittet 1989 ; Chiar 1995 ; Tanaka 1994)
the dark clouds discussed in this work. These are compara-ble to the thresholds estimated for the Serpens dark cloud
& Hodapp et al.(Eiroa 1989 ; Chiar 1994 ; Chiar 1997b) ;
FIG. 1.ÈFlux-calibrated spectra shown with Ðtted second-degree polynomial continua. Upper left, Taurus L1489 ; upper right, R CrA IRS 1 ; lower left,R CrA IRS 2 ; and lower right, R CrA IRS 7. The CO feature of R CrA IRS 2 is saturated. The Pfb emission feature at 4.654 km is present in the spectra ofL1489 IRS, R CrA IRS 1, and IRS 2.

718 CHIAR ET AL. Vol. 498
FIG. 2.ÈCO proÐles for low-mass young stellar objects. Polar and nonpolar components are represented by dotted and dashed lines, respectively. Thesolid line represents the combination of the two components. Upper left, Taurus-Elias 18 et al. upper right, Taurus L1489 ; middle left, R CrA IRS(Chiar 1995) ;1 ; middle right, R CrA IRS 2 ; lower left, R CrA IRS 7. The Pfb emission feature at 4.654 km is present in the spectra of Elias 18, L1489 IRS, R CrA IRS 1, andIRS 2.
much higher extinctions are required to detect (CO andice features in the o Oph dark cloud et al.H2O) (Tanaka
et al.1990 ; Kerr 1993).Water ice and CO have also been detected in high-mass
star-forming regions such as W33, GL961, NGC7538, andMonoceros R2 Sellgren, & Tokunaga(Smith, 1989 ; Geballe
et al. In general, YSOs in these cloud1986 ; Tielens 1991).cores are surrounded by reÑection nebulosity and areheavily embedded, su†ering anywhere from 17È150 mag ofextinction (see Because of uncertainties in visualTable 6).extinction estimates toward these objects, calculation ofthreshold values has not been attempted ; however, they arelikely to be several times higher than the low-mass star-forming regions discussed above. Observations in the 4.5È4.8 km spectral region of YSOs in low- and high-massstar-forming regions are presented in The routine used° 2.
to Ðt the CO proÐles is described in results for individ-° 3 ;ual objects are discussed in the following sections (°° and4
Finally, we propose an evolutionary scenario, which may5).explain the diverse composition of ices around embeddedobjects, in and we summarize our results in° 6, ° 7.
2. OBSERVATIONS
New observations of Taurus L1489 IRS, R CrA IRS 1,R CrA IRS 2, and R CrA IRS 7 were carried out with the256 ] 256 InSb array of the cooled grating spectrometerCGS4 on the United Kingdom Infrared Telescope(UKIRT) on Mauna Kea. The spectrum of L1489 IRS wasobtained on 1995 October. The spectrum of R CrA IRS 2was obtained during service time in 1995 May. The spectraof R CrA IRS 1 and R CrA IRS 7 were obtained duringservice time in 1996 April. Details of the individual obser-
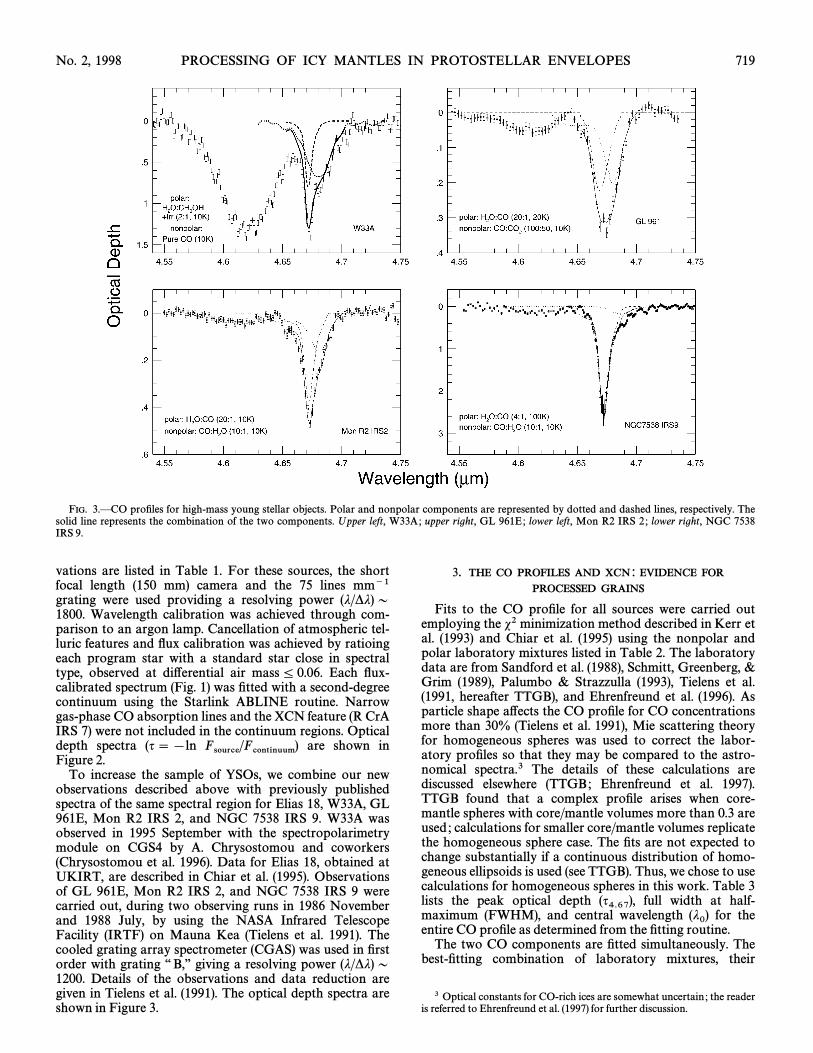
No. 2, 1998 PROCESSING OF ICY MANTLES IN PROTOSTELLAR ENVELOPES 719
FIG. 3.ÈCO proÐles for high-mass young stellar objects. Polar and nonpolar components are represented by dotted and dashed lines, respectively. Thesolid line represents the combination of the two components. Upper left, W33A; upper right, GL 961E; lower left, Mon R2 IRS 2 ; lower right, NGC 7538IRS 9.
vations are listed in For these sources, the shortTable 1.focal length (150 mm) camera and the 75 lines mm~1grating were used providing a resolving power (j/*j) D1800. Wavelength calibration was achieved through com-parison to an argon lamp. Cancellation of atmospheric tel-luric features and Ñux calibration was achieved by ratioingeach program star with a standard star close in spectraltype, observed at di†erential air mass¹ 0.06. Each Ñux-calibrated spectrum was Ðtted with a second-degree(Fig. 1)continuum using the Starlink ABLINE routine. Narrowgas-phase CO absorption lines and the XCN feature (R CrAIRS 7) were not included in the continuum regions. Opticaldepth spectra (q\ [ln are shown inFsource/Fcontinuum)Figure 2.
To increase the sample of YSOs, we combine our newobservations described above with previously publishedspectra of the same spectral region for Elias 18, W33A, GL961E, Mon R2 IRS 2, and NGC 7538 IRS 9. W33A wasobserved in 1995 September with the spectropolarimetrymodule on CGS4 by A. Chrysostomou and coworkers
et al. Data for Elias 18, obtained at(Chrysostomou 1996).UKIRT, are described in et al. ObservationsChiar (1995).of GL 961E, Mon R2 IRS 2, and NGC 7538 IRS 9 werecarried out, during two observing runs in 1986 Novemberand 1988 July, by using the NASA Infrared TelescopeFacility (IRTF) on Mauna Kea et al. The(Tielens 1991).cooled grating array spectrometer (CGAS) was used in Ðrstorder with grating ““ B,ÏÏ giving a resolving power (j/*j) D1200. Details of the observations and data reduction aregiven in et al. The optical depth spectra areTielens (1991).shown in Figure 3.
3. THE CO PROFILES AND XCN : EVIDENCE FOR
PROCESSED GRAINS
Fits to the CO proÐle for all sources were carried outemploying the s2 minimization method described in etKerral. and et al. using the nonpolar and(1993) Chiar (1995)polar laboratory mixtures listed in The laboratoryTable 2.data are from et al. Greenberg, &Sandford (1988), Schmitt,Grim & Strazzulla et al.(1989), Palumbo (1993), Tielens
hereafter TTGB), and et al. As(1991, Ehrenfreund (1996).particle shape a†ects the CO proÐle for CO concentrationsmore than 30% et al. Mie scattering theory(Tielens 1991),for homogeneous spheres was used to correct the labor-atory proÐles so that they may be compared to the astro-nomical The details of these calculations arespectra.3discussed elsewhere et al.(TTGB; Ehrenfreund 1997).
found that a complex proÐle arises when core-TTGBmantle spheres with core/mantle volumes more than 0.3 areused ; calculations for smaller core/mantle volumes replicatethe homogeneous sphere case. The Ðts are not expected tochange substantially if a continuous distribution of homo-geneous ellipsoids is used (see Thus, we chose to useTTGB).calculations for homogeneous spheres in this work. Table 3lists the peak optical depth full width at half-(q4.67),maximum (FWHM), and central wavelength for the(j0)entire CO proÐle as determined from the Ðtting routine.
The two CO components are Ðtted simultaneously. Thebest-Ðtting combination of laboratory mixtures, their
3 Optical constants for CO-rich ices are somewhat uncertain ; the readeris referred to et al. for further discussion.Ehrenfreund (1997)

720 CHIAR ET AL. Vol. 498
optical depths, and the corresponding for each Ðt aresl2listed in Although ideally a good Ðt should haveTable 4.in practice uncertainties in error-bar estimates (forsl2D 1,
the astronomical spectra) result in values somewhatsl2larger than 1. Reduced s2 can also be made artiÐcially smallif the error bars of the observed data are large due to a poorsignal-to-noise ratio or overestimation of the uncertainties.For each spectrum analyzed in this work, a list of all com-binations of polar and nonpolar mixtures and the corre-sponding value was generated by the Ðtting routine.sl2Starting from the lowest and progressing toward Ðts withsl2higher each Ðt was visually inspected for quality. Wesl2,found that several combinations of (polar and nonpolar)laboratory mixtures provided comparable matches to eachastronomical spectrum (see When the best valueTable 5). sl2was less than 2, apparently satisfactory Ðts resulted for sl2values within 20% of the lowest value. When for the bestsl2Ðt was greater than 2, acceptable Ðts resulted for withinsl230% and 40% of the best Ðt. We illus-(2 \sl2\ 4) (sl2[ 5)trate these criteria in which shows the best Ðt toFigure 4,R CrA IRS 1 top) compared to a Ðt that is just(sl2D 3.9 ;outside the 30% cuto† bottom). The Ðt shown in(sl2D 5.6 ;the lower panel is obviously poor ; the long-wavelength sideof the feature is scarcely matched by the laboratory data.
TABLE 2
LABORATORY MIXTURES USED IN THIS WORK
TMixture Ratio (K) Reference
Polar Laboratory Mixtures
CO2 :CO . . . . . . . . . . . . . . . . . . . . . . . . . . . (20 :1) 10 1H2O:CO . . . . . . . . . . . . . . . . . . . . . . . . . . . (20 :1) 10 1H2O:CO . . . . . . . . . . . . . . . . . . . . . . . . . . . (20 :1) 20 1H2O:CO . . . . . . . . . . . . . . . . . . . . . . . . . . . (20 :1) 30 1H2O:CO . . . . . . . . . . . . . . . . . . . . . . . . . . . (20 :1) 40 1H2O:CO . . . . . . . . . . . . . . . . . . . . . . . . . . . (20 :1) 50 1H2O:CO . . . . . . . . . . . . . . . . . . . . . . . . . . . (20 :1) 65 1H2O:CO . . . . . . . . . . . . . . . . . . . . . . . . . . . (20 :1) 80 1H2O:CO . . . . . . . . . . . . . . . . . . . . . . . . . . . (4 :1) 10 2H2O:CO . . . . . . . . . . . . . . . . . . . . . . . . . . . (4 :1) 25 2H2O:CO . . . . . . . . . . . . . . . . . . . . . . . . . . . (4 :1) 35 2H2O:CO . . . . . . . . . . . . . . . . . . . . . . . . . . . (4 :1) 50 2H2O:CO . . . . . . . . . . . . . . . . . . . . . . . . . . . (4 :1) 100 2H2O:CH3OH] irradiation . . . . . . (2 :1) 10 3H2O:CH3OH] irradiation . . . . . . (2 :1) 67 3
Nonpolar Laboratory Mixtures
Pure CO . . . . . . . . . . . . . . . . . . . . . . . . . . . . . . . 10 4CO:H2O . . . . . . . . . . . . . . . . . . . . . . . . . . . (10 :1) 10 4CO:O2 . . . . . . . . . . . . . . . . . . . . . . . . . . . . . (2 :3) 10 4CO:O2 . . . . . . . . . . . . . . . . . . . . . . . . . . . . . (19 :5) 10 4CO2 :CO . . . . . . . . . . . . . . . . . . . . . . . . . . . (20 :1) 10 4Pure CO] irradiation . . . . . . . . . . . . . . . 10 3CO:CO2] UV . . . . . . . . . . . . . . . . . . . . 100 :50 10 5CO:CO2] UV . . . . . . . . . . . . . . . . . . . . 50 :100 10 5Pure CO . . . . . . . . . . . . . . . . . . . . . . . . . . . . . . . 10 5CO:H2O . . . . . . . . . . . . . . . . . . . . . . . . . . . 100 :1 10 5CO:O2 :H2O. . . . . . . . . . . . . . . . . . . . . . . 80 :20 :1 10 5CO:O2 . . . . . . . . . . . . . . . . . . . . . . . . . . . . . 100 :50 10 5CO:O2 . . . . . . . . . . . . . . . . . . . . . . . . . . . . . 100 :70 10 5CO:O2 :H2O. . . . . . . . . . . . . . . . . . . . . . . 50 :50 :1 10 5CO:O2 :H2O. . . . . . . . . . . . . . . . . . . . . . . 20 :60 :1 10 5CO:CO2 . . . . . . . . . . . . . . . . . . . . . . . . . . . 100 :4 10 5CO:CO2 . . . . . . . . . . . . . . . . . . . . . . . . . . . 100 :8 10 5CO:CO2 . . . . . . . . . . . . . . . . . . . . . . . . . . . 100 :16 10 5CO:CO2 . . . . . . . . . . . . . . . . . . . . . . . . . . . 100 :21 10 5CO:CO2 . . . . . . . . . . . . . . . . . . . . . . . . . . . 100 :23 10 5
TABLE 2ÈContinued
TMixture Ratio (K) Reference
CO:CO2 . . . . . . . . . . . . . . . . . . . . . . 100 :26 10 5CO:CO2 :H2O . . . . . . . . . . . . . . . 50 :56 :1 10 5CO:O2 :CO2 . . . . . . . . . . . . . . . . . 100 :50 :4 10 5CO:O2 :CO2 . . . . . . . . . . . . . . . . . 100 :50 :8 10 5CO:O2 :CO2 . . . . . . . . . . . . . . . . . 100 :50 :16 10 5CO:O2 :CO2 . . . . . . . . . . . . . . . . . 100 :50 :21 10 5CO:O2 :CO2 . . . . . . . . . . . . . . . . . 100 :50 :32 10 5CO:O2 :CO2 . . . . . . . . . . . . . . . . . 100 :54 :10 10 5CO:O2 :CO2 . . . . . . . . . . . . . . . . . 100 :20 :11 10 5CO:O2 :CO2 . . . . . . . . . . . . . . . . . 100 :11 :20 10 5CO:O2 :CO2 . . . . . . . . . . . . . . . . . 100 :10 :23 10 5CO:N2 :H2O . . . . . . . . . . . . . . . . . 50 :50 :1 10 5CO:O2 :N2 . . . . . . . . . . . . . . . . . . . 100 :50 :25 10 5CO:O2 :N2 :H2O . . . . . . . . . . . . 40 :40 :20 :1 10 5CO:N2 :CO2 . . . . . . . . . . . . . . . . . 100 :50 :20 10 5CO:O2 :N2 :CO2 . . . . . . . . . . . . 100 :50 :25 :32 10 5CO:O2 :N2 :CO2 :H2O . . . . . . 50 :35 :15 :3 :1 10 5CO:O2 :N2 :CO2 :H2O . . . . . . 50 :35 :15 :3 :1 10 5CO:O2 :N2 :CO2 :H2O . . . . . . 25 :25 :10 :13 :1 10 5Pure CO . . . . . . . . . . . . . . . . . . . . . . . . . 30 5CO:H2O . . . . . . . . . . . . . . . . . . . . . 100 :1 30 5CO:O2 :H2O . . . . . . . . . . . . . . . . . 80 :20 :1 30 5CO:O2 . . . . . . . . . . . . . . . . . . . . . . . . 100 :50 30 5CO:O2 :H2O . . . . . . . . . . . . . . . . . 50 :50 :1 30 5CO:O2 :H2O . . . . . . . . . . . . . . . . . 20 :60 :1 30 5CO:CO2 . . . . . . . . . . . . . . . . . . . . . . 100 :4 30 5CO:CO2 . . . . . . . . . . . . . . . . . . . . . . 100 :8 30 5CO:CO2 . . . . . . . . . . . . . . . . . . . . . . 100 :16 30 5CO:CO2 . . . . . . . . . . . . . . . . . . . . . . 100 :21 30 5CO:CO2 . . . . . . . . . . . . . . . . . . . . . . 100 :23 30 5CO:CO2 . . . . . . . . . . . . . . . . . . . . . . 100 :26 30 5CO:CO2 :H2O . . . . . . . . . . . . . . . 50 :56 :1 30 5CO:O2 :CO2 . . . . . . . . . . . . . . . . . 100 :50 :16 30 5CO:O2 :CO2 . . . . . . . . . . . . . . . . . 100 :50 :21 30 5CO:O2 :CO2 . . . . . . . . . . . . . . . . . 100 :54 :10 30 5CO:O2 :CO2 . . . . . . . . . . . . . . . . . 100 :10 :23 30 5CO:N2 :H2O . . . . . . . . . . . . . . . . . 50 :50 :1 30 5CO:O2 :N2 :H2O . . . . . . . . . . . . 40 :40 :15 :1 30 5
Sandford et al. (2) et al. (3)REFERENCES.È(1) 1988 ; Schmitt 1989 ;& Strazzulla (4) et al. (5) et al.Palumbo 1993 ; Tielens 1991 ; Ehrenfreund
1996.
Gas-phase CO lines are present in the 4È5 km spectra ofmany embedded objects. shows the well-studiedFigure 5clearly separated R and P branches of the strong gas-phaseCO lines in the high-mass protostar GL 2591 et al.(Tielens
compared to the spectrum of R CrA IRS 7. It is1991)apparent that the narrow absorption lines in the spectrumof R CrA IRS 7 (and R CrA IRS 1 ; middle left) areFig. 2,due to gas-phase CO. Gas-phase lines are also partially
TABLE 3
CO PROFILE PARAMETERS
FWHM j0Source q4.67 (cm~1) (km)
Low-Mass Objects
Elias 18 . . . . . . . . . . . . . . . . . 0.33^ 0.03 9.48 4.672L1489 IRS . . . . . . . . . . . . . 0.7 ^ 0.1 7.94 4.670R CrA IRS 1 . . . . . . . . . . 1.55^ 0.05 3.67 4.671R CrA IRS 2 . . . . . . . . . . 4 ^ 1 3.22 4.671R CrA IRS 7 . . . . . . . . . . 1.38^ 0.05 6.12 4.671
High-Mass Objects
W33A . . . . . . . . . . . . . . . . . . . 1.30^ 0.05 7.64 4.672GL 961E . . . . . . . . . . . . . . . 0.31^ 0.03 10.76 4.675Mon R2 IRS 2 . . . . . . . . 0.47^ 0.02 6.73 4.674NGC 7538 IRS 9 . . . . . . 2.6 ^ 0.2 4.75 4.673

4.65 4.66 4.67 4.68 4.69
1.5
1
.5
0
1.5
1
.5
0
Opt
ical
Dep
th
4.55 4.6 4.65 4.7 4.75 4.80
1000
2000
Wavelength (µm)
Flu
x (A
rbitr
ary
Uni
ts)
GL 2591
RCrA-IRS7
No. 2, 1998 PROCESSING OF ICY MANTLES IN PROTOSTELLAR ENVELOPES 721
TABLE 4
BEST-FITTING LABORATORY MIXTURES FOR POLAR AND NONPOLAR COMPONENTS
NONPOLAR COMPONENT POLAR COMPONENT
SOURCE Mixture q Mixture q sl2
Low-Mass Objects
Elias 18 . . . . . . . . . . . . . . . . . CO:O2 :N2 :CO2 (100 :50 :25 :32, 10 K) 0.26^ 0.03 H2O:CH3OH] irr. (2 :1, 67 K) 0.14 ^ 0.03 5.6L1489 IRS . . . . . . . . . . . . . CO:O2 :N2 :CO2 (100 :50 :25 :32, 10 K) 0.6^ 0.1 H2O:CO (4 :1, 100 K) 0.2^ 0.1 1.7R CrA IRS 1 . . . . . . . . . . Pure CO (10 K) 1.40 ^ 0.05 H2O:CO (4 :1, 10 K) 0.21^ 0.05 3.9R CrA IRS 2 . . . . . . . . . . Pure CO (10 K) 4 ^ 1 H2O:CO (4 :1, 100 K) 0.01^ .01 0.7R CrA IRS 7 . . . . . . . . . . CO:O2 :CO2 (100 :50 :21, 30 K) 1.12^ 0.05 H2O:CO (4 :1, 10 K) 0.39^ 0.05 5.3
High-Mass Objects
W33A . . . . . . . . . . . . . . . . . . . Pure CO 0.79^ 0.05 H2O:CH3OH] irr. (2 :1, 10 K) 0.68 ^ 0.05 6.1GL 961E . . . . . . . . . . . . . . . CO:CO2] UV (100 :50, 10 K) 0.22^ 0.03 H2O:CO (20 :1, 20 K) 0.20^ 0.03 1.7Mon R2 IRS 2 . . . . . . . . CO:H2O (10 :1, 10 K) 0.37^ 0.02 H2O:CO (20 :1, 10 K) 0.16^ 0.02 3.0NGC 7538 IRS 9 . . . . . . CO:H2O (10 :1, 10 K) 2.5^ 0.2 H2O:CO (4 :1, 100 K) 0.2^ 0.1 3.0
resolved in the spectrum of Elias 18 upper left) and(Fig. 2,W33A upper left). In cases where the gas-phase lines(Fig. 3,are not separated, blending may cause a shallow absorptionfeature that mimics an XCN feature. For the spectra pre-sented here, this e†ect can be ruled out since ample wave-length coverage is available on both sides of the solid-stateCO feature. Gas-phase absorption (where present) couldalso have a minor a†ect on the Ðt to the CO proÐle. Ifgas-phase lines are not taken into account during the Ðttingprocedure, the precise peak position of the polar com-
FIG. 4.ÈBest Ðt (top) compared to a poor Ðt(sl2\ 3.9) (sl2\ 5.6)(bottom) to spectrum of R CrA IRS 1. The ““ bad ÏÏ Ðt is given by
(1 :50 :50, 30 K) (nonpolar component) and (4 :1,H2O:CO:O2 H2O:CO10 K) (polar component). In both panels, the combination of polar andnonpolar components is represented by a solid line.
ponent cannot be constrained and its depth may be slightlyoverestimated. In this work, great care was taken to excludetroublesome gas-phase lines centered at D4.6810, 4.6892,4.6989, 4.7067 km, so as not to a†ect the Ðt to the solid-state
FIG. 5.ÈSpectrum of GL 2591 (top) showing gas-phase CO absorptionlines compared to the spectrum of R CrA IRS 7 (bottom). This comparisonshows that the narrow absorption lines in the spectrum of R CrA IRS 7 aredue to gas-phase CO. The prominent emission feature at 4.654 km in GL2591 is the Pfb hydrogen emission line. (Spectrum of GL 2591 from Tielenset al. 1991.)
FIG. 6.ÈSpectrum of W33A in the wavelength region 4.5È4.8 km. The““ XCN ÏÏ (4.62 km) and CO (4.67 km) features are labeled. The solid line is aGaussian curve Ðtted to the ““ XCN ÏÏ feature. This curve has been sub-tracted before attempting to Ðt the CO proÐle.

TABLE 5
ALTERNATIVE FITS FROM s2 ROUTINEa
Source Nonpolar Mixture Polar Mixture sl2Low-Mass Objects
Elias 18 . . . . . . . . . . . . . . . . . CO:O2 :N2 :CO2 (100 :50 :25 :32, 10 K) H2O:CH3OH ] irr. (2 :1, 10, 67 K) 5.6È7.0CO:O2 :CO2 (100 :50 :21, 10 K) H2O:CH3OH ] irr. (2 :1, 10 K) 6.1
H2O:CO (4 :1, 10È35 K) 6.6È7.7CO:O2 :CO2 (100 :50 :16, 10 K) H2O:CO (4 :1, 10, 25 K) 7.7
L1489 IRS . . . . . . . . . . . . . CO:O2 :N2 :CO2 (100 :50 :25 :32, 10 K) H2O:CO (4 :1, 10È100 K) 1.7È1.8CO2 :CO (20 :1, 10 K) H2O:CO (4 :1, 10È100 K) 1.8È1.9
H2O:CH3OH ] irr. (2 :1, 10 K) 1.8CO:CO2] UV (100 :50, 10 K) H2O:CO (4 :1, 35È100 K) 1.8È1.9
H2O:CH3OH ] irr. (2 :1, 10, 67 K) 1.8È2.0CO:CO2 (100 :21, 10 K) H2O:CO (4 :1, 10, 25 K) 2.0CO:CO2 (100 :23, 10 K) H2O:CO (4 :1, 10È100 K) 1.8È1.9
H2O:CH3OH ] irr. (2 :1, 10 K) 1.8CO:CO2 (100 :26, 10 K) H2O:CO (4 :1, 10È100 K) 1.8È2.0
H2O:CH3OH ] irr. (2 :1, 10 K) 1.8CO:O2 :CO2 (100 :50 :16, 10 K) H2O:CO (4 :1, 10, 25 K) 2.0CO:O2 :CO2 (100 :50 :21, 10 K) H2O:CO (4 :1, 10, 25, 100 K) 1.9CO:O2 :CO2 (100 :50 :32, 10 K) H2O:CO (4 :1, 10È100 K) 1.7È1.9
H2O:CH3OH ] irr. (2 :1, 10 K) 1.8CO:O2 :CO2 (100 :20 :11, 10 K) H2O:CO (4 :1, 10, 25 K) 2.0CO:O2 :CO2 (100 :11 :20, 10 K) H2O:CO (4 :1, 10È100 K) 1.8È2.0
H2O:CH3OH ] irr. (2 :1, 10 K) 1.9CO:O2 :CO2 (100 :10 :23, 10 K) H2O:CO (4 :1, 10È100 K) 1.7È2.0
H2O:CH3OH ] irr. (2 :1, 10 K) 1.8CO:N2 :CO2 (100 :50 :20, 10 K) H2O:CO (4 :1, 10, 25 K) 2.0
H2O:CH3OH ] irr. (2 :1, 10, 67 K) 1.8È2.0CO:O2 :N2 :CO2 :H2O (25 :25 :10 :13 :1, 10 K) H2O:CO (4 :1, 10È100 K) 1.7È2.0
H2O:CH3OH ] irr. (2 :1, 10, 67 K) 1.7È1.9CO:CO2 (100 :23, 30 K) H2O:CO (4 :1, 10, 25 K) 1.9CO:CO2 (100 :26, 30 K) H2O:CO (4 :1, 10, 25 K) 1.9CO:O2 :CO2 (100 :50 :16, 30 K) H2O:CO (4 :1, 10, 25 K) 1.9CO:O2 :CO2 (100 :50 :21, 30 K) H2O:CO (4 :1, 10È35 K) 1.8È1.9
H2O:CH3OH ] irr. (2 :1, 10, 67 K) 1.9CO:O2 :CO2 (100 :10 :23, 30 K) H2O:CO (4 :1, 10, 25 K) 1.9Pure CO (10 K) ] irradiation H2O:CO (4 :1, 10, 25 K) 1.9
R CrA IRS 1 . . . . . . . . . . Pure CO H2O:CO (4 :1, 10È35 K) 3.9È5.1H2O:CH3OH ] irr. (10 K) 4.7
R CrA IRS 2 . . . . . . . . . . Pure CO (10 K) H2O:CO (4 :1, 10È100 K) 0.7È0.8H2O:CH3OH ] irr. (10, 67 K) 0.8
CO:O2 :CO2 (100 :54 :10, 10 K) H2O:CO (4 :1, 10, 25 K) 0.8R CrA IRS 7 . . . . . . . . . . CO:O2 :CO2 (100 :50 :21, 30 K) H2O:CO (4 :1, 10È35 K) 5.3È6.6
CO:O2 :CO2 (100 :50 :16, 30 K) H2O:CO (4 :1, 10, 25 K) 6.4
High-Mass Objects
W33A . . . . . . . . . . . . . . . . . . . Pure CO H2O:CH3OH ] irr. (2 :1, 10 K) 6.1H2O:CO (4 :1, 35, 50 K) 7.2È8.4
CO:H2O (10 :1, 10 K) H2O:CO (4 :1, 100 K) 6.3CO:O2 :N2 :H2O (40 :40 :15 :1, 30 K) H2O:CH3OH ] irr (2 :1, 10 K) 6.9
H2O:CO (4 :1, 35 K) 7.7CO:N2 :H2O (50 :50 :1, 30 K) H2O:CH3OH ] irr (2 :1, 10 K) 7.3
GL 961E . . . . . . . . . . . . . . . CO:CO2] UV (100 :50, 10 K) H2O:CO (20 :1, 20, 30 K) 1.7È1.9CO:CO2 (100 :23, 10 K) H2O:CO (20 :1, 30 K) 1.9CO:CO2 (100 :26, 10 K) H2O:CO (20 :1, 20, 30 K) 2.0CO:O2 :CO2 (100 :50 :32, 10 K) H2O:CO (20 :1, 10È30 K) 1.7È1.8CO:O2 :CO2 (100 :50 :23, 10 K) H2O:CO (20 :1, 10È30 K) 1.9È2.0CO:O2 :N2 :CO2 (100 :50 :25 :32, 10 K) H2O:CO (20 :1, 10È30 K) 1.7È1.9CO:O2 :N2 :CO2 :H2O (25 :25 :10 :13 :1, 10 K) H2O:CO (20 :1, 20, 30 K) 1.7
Mon R2 IRS 2 . . . . . . . . CO:H2O (10 :1, 10 K) H2O:CO (20 :1, 10È30 K) 3.0È3.4H2O:CO (4 :1, 10È35 K) 3.0È3.4
CO2 :CO (20 :1, 10 K) H2O:CH3OH ] irr. (67 K) 3.1H2O:CO (20 :1, 20È50 K) 3.3È3.8
CO:O2 :CO2 (100 :54 :10, 10 K) H2O:CO (4 :1, 10, 25 K) 3.4CO:O2 :N2 :CO2 :H2O (50 :35 :15 :3 :1, 10 K) H2O:CO (4 :1, 10, 25 K) 3.7CO:O2 :CO2 (100 :54 :8, 10 K) H2O:CO (4 :1, 10, 25 K) 3.7
NGC 7538 IRS 9 . . . . . . CO:H2O (10 :1, 10 K) H2O:CO (4 :1, 10È100 K) 3.0È3.9H2O:CO (20 :1, 10È80 K) 3.0È3.5H2O:CH3OH ] irr. (10, 67 K) 3.0È3.4
Pure CO (10 K) H2O:CH3OH ] irr. (10 K) 3.4H2O:CO (4 :1, 10, 25 K) 3.6
CO:O2 :CO2 (100 :50 :4, 10 K) H2O:CO (4 :1, 10, 25 K) 3.5CO:O2 :H2O (50 :50 :1, 30 K) H2O:CO (4 :1, 10, 25 K) 3.5
a This table lists all mixtures that provide Ðts comparable to the lowest Ðt. See text for further explanation. The ““ best ÏÏ Ðt forsl2each source is listed Ðrst.

PROCESSING OF ICY MANTLES IN PROTOSTELLAR ENVELOPES 723
TABLE 6
DUST COLUMN DENSITIES (cm~2)
N(CO) (]1017)N(H2O) A
VN(H) GAS
SOURCE Nonpolar Polar Total (]1017) N(CO)/N(H2O) (mag) (]1023)
Low-Mass Objects
Elias 18 . . . . . . . . . . . . . . . . . 1.9 ^ 0.2 1.3^ 0.3 3.1 ^ 0.3 14a 0.2 18.5 3.52L1489 IRS . . . . . . . . . . . . . 4.5 ^ 0.7 1.7^ 0.7 6.2 ^ 1.0 47b 0.1 29 5.51R CrA IRS 1 . . . . . . . . . . 4.1 ^ 0.2 2.5^ 0.6 6.5 ^ 0.6 24c 0.3 25 4.75R CrA IRS 2 . . . . . . . . . . 11 ^ 3 0.6 ^ 0.7 12 ^ 3 21d 0.6 35 6.66R CrA IRS 7 . . . . . . . . . . 5.4 ^ 0.2 4.6^ 0.6 10 ^ 1 60d 0.2 35 6.66
High-Mass Objects
W33A . . . . . . . . . . . . . . . . . . . 2.3 ^ 0.2 6.6^ 0.5 8.9 ^ 0.5 90È420e 0.02È0.1 50È100 9.50È28.5GL 961E . . . . . . . . . . . . . . . 1.4 ^ 0.2 1.5^ 0.2 2.9 ^ 0.3 40f 0.1 17 3.23Mon R2 IRS 2 . . . . . . . . 1.6 ^ 0.1 1.2^ 0.2 2.7 ^ 0.2 45f 0.1 21 3.99NGC 7538 IRS 9 . . . . . . 11^ 1 1.4 ^ 0.8 12 ^ 1 64e 0.2 84 16.0
NOTE.ÈColumn densities are for the solid phase unless otherwise noted. Lower bound on ice column density for W33AH2Ois from saturated 3.0 km feature ; upper bound was estimated from 6.0 km feature.a Estimated from spectra in et al.Whittet 1988.
Nagata, & Yamamotob Sato, 1990.et al.c Whittet 1996.et al.d Tanaka 1994.
et al.e Allamandola 1992.et al.f Smith 1989.
feature. When present, the Pfb hydrogen emission line at4.654 km was excluded from the wavelength region used forÐtting. In the case of W33A, the XCN feature was““ removed ÏÏ before Ðtting the CO proÐle by Ðtting a Gauss-ian to the feature and subtracting it from the spectrum(Fig. 6).
Column densities for solid CO are calculated for thepolar and nonpolar components of the CO feature using theequation N \ (q*l/A) cm~2 The full width at(Table 6).half-maximum (*l ; cm~1) and optical depth (q) for eachcomponent are determined by the resulting Ðt to the astro-nomical spectrum; the band strength (A), determined fromlaboratory experiments, is only weakly dependent on thecomposition of the matrix et al. and is(Gerakines 1995)equal to 1.1] 10~17 cm molecule~1 for polar and non-polar CO.
4. LOW-MASS EMBEDDED OBJECTS
4.1. Taurus : Elias 18, L 1489 IRSElias 18 appears to lie near the eastern edge of a dense
condensation within the Taurus cloud, and it illuminates avisible reÑection nebula (IC2087) to the west (see Fig. 9 of
and discussion therein). Its CO proÐle has pre-Elias 1978viously been modeled, using a smaller database of labor-atory mixtures, by et al. Elias 18 provides anChiar (1995).important comparison to the other embedded objects inthis paper, so the modeling of its CO proÐle is repeated hereusing all the currently available laboratory mixtures. TheCO spectrum is broad in nature, with a signiÐcant contribu-tion from the polar component. The best Ðt upper(Fig. 2,left) is given by (100 :50 :25 :32, 10 K) andCO:O2 :N2 :CO2the irradiated mixture of (2 :1, 67 K) for theH2O:CH3OHnonpolar and polar components, respectively. Other goodÐts are also given by nonpolar mixtures that contain10%È12% (see The Ðts are consistent withCO2 Table 5).the one presented in et al. in which the proÐleChiar (1995),was Ðtted by a mixture with a high percentage.CO2L1489 IRS is a class I protostar, with an associated COoutÑow et al. embedded in the L1489(Rodriguez 1989),
dense core in the Taurus dark cloud mag ;(AV
D 29 Myerset al. We present the Ðrst detection of solid CO in this1987).line of sight upper right). The proÐle is similar in(Fig. 2,shape to that of Elias 18. The best Ðt is given by a mixturewith a substantial amount of CO2, CO:O2 :N2 :CO2(100 :50 :25 :32, 10 K) combined with (4 :1, 100 K).H2O:COUnfortunately, the low S/N of this spectrum makes it diffi-cult to constrain the precise chemical composition of theCO-containing mantles ; there are 80 Ðts that come within20% of the lowest value However, generalsl2 (Table 5).conclusions may be drawn; all of the nonpolar mixturesthat provide good Ðts (combined with various polarmixtures) contain large amounts of (10%È52%) or areCO2UV irradiated.
Our ground-based data strongly suggest the presence onin embedded objects in Taurus. Direct detection ofCO2 in the quiescent cloud medium and toward embeddedCO2objects in Taurus has recently been accomplished by ISO
et al.(Whittet 1998).
4.2. R CrA IRS 1, IRS 2, IRS 7The YSOs R CrA IRS 1, IRS 2, and IRS 7 are embedded
in the Corona Australis complex near the young star RCorona Austrina. R CrA IRS 1 Strom, & Grasdalen(Strom,
is an intense infrared source associated with the1974),Herbig-Haro nebula HH100. The source is located about25A northeast of the optical nebula but coincident with apeak in the line emission from dense molecular gas
et al. It is part of the newly formed star(Anglada 1989).cluster embedded in the R CrA dark cloud. R CrA IRS 1has a circumstellar disk & Me� nard and(Bastien 1990)drives a bipolar outÑow et al. In compari-(Anglada 1989).son to other infrared sources associated with Herbig-Haroobjects, the millimeter (1300 km) Ñux of R CrA IRS 1 is lowrelative to its bolometric luminosity by at least a factor of 2
et al. indicating that it is no longer deeply(Reipurth 1993),embedded in accreting material. Thus, this source is prob-ably a preÈmain-sequence star that is situated behind amolecular core obscured by D25 mag of visual extinction

724 CHIAR ET AL. Vol. 498
et al. The CO spectrum of R CrA IRS 1,(Whittet 1996).shown in the middle left panel of is best Ðt withFigure 2,pure CO combined with (4 :1, 10 K). AlthoughH2O:COvarious polar mixtures also provide good Ðts (along withpure CO) to the proÐle, only pure CO gives a reasonable Ðtto the nonpolar component. In fact, nonpolar mixtures withas little as 1% (combined with any of the polarH2Omixtures) result in substantially poorer Ðts. A deep 4.27 km
feature has recently been detected by ISO in this line ofCO2sight et al. As the CO proÐle does not(Gerakines 1998).show evidence for it is likely that the resides in aCO2, CO2grain population separate from the CO. In other words,there is separation of processed and unprocessed grainsalong the line of sight.
Taylor, & Storey have classiÐed R CrAWilking, (1986)IRS 2 as a class I protostar ; the object is surrounded bydust at a wide range of temperatures and is still deeplyembedded in its placental cloud mag). The CO(A
VD 35
absorption toward R CrA IRS 2, previously detected byet al. is saturated at the center of the feature.Tanaka (1994),
Our spectrum middle right) has high S/N in the(Fig. 2,wings of the proÐle, thus an estimate of the peak opticaldepth, is predicted from the Ðtting results.q4.67\ 4 ^ 1This relatively narrow proÐle is best Ðt with pure CO and
(4 :1, 100 K) to the nonpolar and polar com-H2O:COponents, respectively. The weakness of the broad featuremakes it difficult to constrain the composition of the polarmantle component ; any of the other polar mixtures pro-vides comparable Ðts. IRS 2 also seems to lack the stronggas-phase absorption lines present in the spectra of IRS 1and IRS 7. Although it is possible that gas-phase lines witha Doppler width less than 2 km s~1 (making the lines barelydetectable ; could be present in theTTGB; Helmich 1996)spectrum, comparison of the ““ wiggles ÏÏ in the IRS 2 spec-trum to positions of known gas-phase lines does notsupport this speculation.
R CrA IRS 7 is also classiÐed as a class I protostaret al. it is deeply embedded in the R CrA(Wilking 1986) ;
core obscured by mag of extinction et al.AV
[ 35 (HarjuRadio continuum observations reveal emission1993).
around the source and may represent shock-excited innerportions of a thick accretion disk surrounding a preÈmain-sequence star with a stellar wind The CO(Brown 1987).spectrum of R CrA IRS 7 lower left) is broader in(Fig. 2,nature than that of R CrA IRS 1 and IRS 2 and is best Ðttedwith (100 :50 :21, 30 K) combined with theCO:O2 :CO2polar mixture (4 :1, 10 K). This proÐle can also beH2O:COÐt with the nonpolar mixture above along with the polarmixtures (4 :1, 10È35 K). The available pure COH2O:COand nitrogen-containing mixtures result in signiÐcantlypoorer Ðts to the data.
Diversity of chemical composition of the ice mantlesbetween IRS 1, IRS 2, and IRS 7 could be related to theproximity of IRS 7 to the reÑection nebulosity associatedwith the R CrA core ; both IRS 1 and IRS 2 are locatedfarther away from this central condensation. The CO proÐlemay also reÑect the di†erent evolutionary stages of grainmantle growth toward these objects. This idea is discussedin more detail in ° 6.
The amount of gas-phase CO for IRS 1 and IRS 7 cannotbe directly determined from the infrared lines as they arenot fully resolved. The spectrum of IRS 2 lacks detectablegas-phase lines ; narrow lines, undetectable without echelle-grating resolution, could exist if there is no CO outÑow
along our line of sight. However, the lack of detectablegas-phase CO in the spectrum of IRS 2 could imply highCO depletion in the line of sight. Whereas toward IRS 1and IRS 7, a signiÐcant amount of CO remains in the gas,much of the CO toward IRS 2 is in the solid phase (possiblyas much as 50%). This conclusion is supported by the high
ratio for IRS 2 (D0.6, among the highest observedCO/H2Oratio in any source) compared to the much lower ratios forIRS 1 and IRS 7 (D0.1È0.2).
5. HIGH-MASS EMBEDDED OBJECTS
5.1. W 33AW33A is a highly luminous young stellar object (L D 105
deeply embedded in the W33 dense molecular cloudL_)
core mag ; Gillett, & Knacke(AV
D 50È150 Capps, 1978).Because of slightly lower resolution (RD 1200), the gas-phase lines in this spectrum are not as clearly separated asthose in the R CrA sources. The best Ðt to the solid-statefeature is achieved with a combination of Pure CO at 10 Kand the irradiated mixture of (2 :1, 10 K) toH2O:CH3OHthe nonpolar and polar components, respectively. Compa-rable Ðts include nonpolar mixtures of pure CO or(Table 5)CO mixed with signiÐcant amounts of and andO2 N2various warm (T º 35) or irradiated polar mixtures.
A higher resolution spectrum is necessary to fully accountfor the presence of gas-phase absorption lines in this spec-trum; however, general conclusions regarding the composi-tion of the mantles may be drawn. Our study suggests thatthere are two di†erent grain populations toward W33A: acold component, located in the denser more shielded regionof the W33 molecular cloud, and a thermally processedcomponent closer to the embedded object. High-resolutiongas-phase CO observations have also shown two distincttemperature regimes along the line of sight, one at 23 K andone at 120 K Allen, & Maillard W33A has(Mitchell, 1988).the strongest XCN feature observed to date. As XCN isthought to be the product of energetic processing of simpleN-containing ices the strong XCN feature is suggestive(° 1),of a dust population that has been processed by irradiation,such as UV irradiation or ion bombardment et al.(Lacy
et al. Methanol (3.54 km;1984 ; Tegler 1993). Allamandolaet al. and (4.27 km; et al. products1992) CO2 Gu� rtler 1996),of energetic processing, are also detected in W33A withabundances of 5% and D15% et al. rela-(Gerakines 1998)tive to H2O.
5.2. GL 961EGL 961E is a B3-B2 zero-age main sequence star that is
the exciting source of a compact H II region et al.(CastelazThe visual extinction for this source is D17 mag. The1985).
CO proÐle is best Ðtted with the nonpolar UV irradiatedmixture of (100 :50, 10 K) combined with a sub-CO:CO2stantial contribution from the polar mixture H2O:CO(20 :1, 20 K). Comparable Ðts are also given by nonpolarmixtures that have a high percentage of (D17%), com-CO2bined with strong polar mixtures 10È30(H2O:CO \ 20 :1,K). Modeling of the ice feature et al.H2O (Smith 1989)showed that the ice temperature is less than D30 K; this isconsistent with the Ðt to the CO proÐle. Independent evi-dence for the presence of in this line of sight is givenCO2by detection of the 15.2 km feature made via theCO2low-resolution spectrometer (LRS) on board IRAS
& Jourdain de Muizon The fact that(dÏHendecourt 1989).

No. 2, 1998 PROCESSING OF ICY MANTLES IN PROTOSTELLAR ENVELOPES 725
the CO proÐle can be Ðtted with a mixtureCO2-containingmeans that CO and may coexist in the same mantleCO2layer. This is in contrast to the scenario proposed for theR CrA sources (IRS 1 and IRS 2) discussed above ; inthese sight lines, CO and reside in separate grainCO2populations.
5.3. Mon R2 IRS 2Mon R2 IRS 2 is a protostellar source, obscured by D21
mag of extinction, which illuminates a shell-like IR reÑec-tion nebula in the Monoceros R2 molecular cloud &(AspinWalther et al. The CO proÐle of Mon1990 ; Beckwith 1976).R2 IRS 2 is best Ðtted with a nonpolar mixture of CO:H2O(10 :1, 10K) and a polar mixture of either (4 :1, 10H2O:COor 25 K) or (20 :1, 10 K). Some of the Ðts listed inH2O:CO
suggest that there are warm (T º 35 K) ices in thisTable 5sight line ; e.g., one Ðt utilizes a polar mixture of atH2O:CO50 K. However, modeling of the 3 km ice featureH2Oshows that the polar ice is at a temperature lower than D30K et al. Thus, the nature of the ice composi-(Smith 1989).tion suggested by these Ðts (which use warm polar mixtures)are not as probable as that implied by the other Ðts.
5.4. NGC7538 IRS 9IRS 9, a young stellar object deeply embedded in the
NGC7538 molecular cloud, is associated with an infraredreÑection nebula et al. Obscured by D84(Werner 1979).mag of extinction et al. this source is(Allamandola 1992),bipolar and is surrounded by a dust torus Gomez, &(Eiroa,Lenzen The CO proÐle is best Ðt with1988). CO:H2O(10 :1, 10 K) and (4 :1, 100 K) for the nonpolarH2O:COand polar features, respectively. Like W33A, gas-phase COstudies of NGC 7538 IRS 9 show both cold (26 K) and hot(180 K) gas components along this line of sight et(Mitchellal. consistent with the weakness of the polar com-1990),ponent. Other comparable Ðts include(Table 5)
(100 :50 :4, 10 K) with (4 :1, 10 andCO:O2 :CO2 H2O:CO25 K). The nonpolar component dominates the CO featurein this line of sight suggesting that there is a grain popu-lation or mantle layer that is dominated by CO (possiblymixed with O2). and have been detected in NGCCO2, CH3OH, CH47538 IRS 9 ; abundances of these molecules, relative to H2Oice, are calculated to be D15% for Graauw et al.CO2 (de
D5% for et al.1996), CH3OH (Allamandola 1992 ; Chiar,Adamson, & Whittet and 2% for et al.1996), CH4 (Lacy
et al. If energetic processing produces1991 ; Boogert 1996).and along this sight line, these moleculesCO2 CH3OH
probably exist in grain mantles closer to the embeddedobject. Energetic processing is most likely responsible forthe production of XCN, which is also detected toward NGC7538 IRS 9 et al. The CO-containing(Pendleton 1998).mantles are separated along the line of sight and probablyreside in a more protected dust layer farther from theembedded object.
There do not appear to be any systematic di†erences inthe CO Ðts between the high- and low-mass objects (see
except that XCN is present in a greater percentageTable 4),of the high-mass objects. Both types of objects show evi-dence for distinct cold and processed grain componentsalong the line of sight. Column densities for the CO and
ice features are listed in The ratioH2O Table 6. CO/H2Oappears to be fairly consistent among the high- and low-
mass objects. With the exception of R CrA IRS 2, CO/H2Ois in the range 0È0.3 for both groups.
6. DISCUSSION : THE EVOLUTION OF ICY MANTLES
Past studies of the CO feature toward embedded objectsin the Taurus dark cloud have shown that these objectshave distinctly di†erent CO proÐles compared to the Ðeldstars. CO proÐles for the embedded stars (e.g., Elias 1 and18 ; et al. are broad in nature and show evidenceChiar 1995)for thermal processing of the grain mantles in the vicinity ofthe embedded object ; whereas those of Ðeld stars show thatthe icy mantles in these sight lines are cold (andunprocessed) and the CO exists in (almost) pure form. Datafor YSOs presented in this paper show that the CO proÐlesof embedded objects do not always reÑect thermal or ener-getic processing of the mantles. Although it is expected thatsight lines toward luminous embedded objects will sampleprocessed dust, it is important to remember that, in manycases, there is also a quiescent cloud component that con-tributes to the observed features. In addition, our line ofsight could intersect a circumstellar disk edge-on. Withthese possibilities in mind, it is not surprising that the sameline of sight may show evidence for both processed andunprocessed ices.
One of the possible signatures of processed ices is a COproÐle consistent with CO in a mixture etCO:CO2 (Tielensal. et al. this paper, First direct1991 ; Chiar 1995 ; Table 4).detection of solid via the strong 4.27 km CxO stretch-CO2ing resonance was achieved by ISO Graauw et al.(de 1996 ;
et al. et al. Results showGu� rtler 1996 ; dÏHendecourt 1996).that is a ubiquitous constituent of ices in molecularCO2clouds associated with embedded YSOs ; the total line-of-sight abundance of is typically 10%È20% of theCO2 H2Oabundance in sources studied to date Graauw et al.(de
However, is also seen in Ðeld stars toward the1996). CO2Galactic center Graauw et al. and the Taurus(de 1996)cloud et al. indicating that the presence(Whittet 1997),of a local embedded radiation source is not a prerequisitefor the occurrence of in the ices. This latter resultCO2requires a reassessment of the supposed mechanisms bywhich solid forms in the interstellar medium (ISM) ;CO2energetic processing of CO-rich or icesCH3OH-rich (° 1)is unlikely to be a major source of in quiescent molec-CO2ular clouds (unless processing by cosmic rays is sufficientlyrapid). An alternative model proposes that interstellar
ice is formed through grain surface reactions ofCO2atomic O with CO & Hagen The(Tielens 1982).ratios reÑect relative accre-CO/CO2/H2O/H2CO/CH3OH
tion rates and reaction probabilities on the grain surface& Hagen et al. In this case,(Tielens 1982 ; Charnley 1992).
observed variations in the ratio are a natural con-CO/CO2sequence of the varying composition of the accreting gasresulting from, for example, density variations.
Embedded objects for which ice absorption data areavailable can be roughly divided into three groups, rep-resenting an evolutionary trend These are(Chiar 1997b).roughly illustrated in which plots the nonpolarFigure 7,CO column density versus the ice column density.H2OWater ice column densities are from et al.Willner (1982),
& Hodapp et al. et al.Eiroa (1989), Smith (1989), Tanakaand Sources in which solid CO has been(1990), Table 6.
detected are represented in groups I and II. In group I, thereis no evidence of processing of the CO-containing ices. Asshould be expected, the background objects Elias 16

0 20 40 60 80 100
0
2
4
6
8
10
12
El29 GL961E
MonR2/2
W33A
El18
El32
WL12
L1489/IRS
IRS7
NGC7538/IRS9
WL5
IRS1
El16
SVS4S
CK3
VS17 WL6
CK2
IRS2
GL2591 S140
726 CHIAR ET AL. Vol. 498
FIG. 7.ÈPlot of nonpolar CO column density versus ice columnH2Odensity for YSOs in several star-forming regions. Taurus, R CrA, Serpens,and o Oph sources are represented by Ðlled circles, open circles, opendiamonds, and Ðlled squares, respectively. High-mass YSOs are represent-ed by open squares and Ðlled triangles (upper limits for nonpolar COcolumn density). The background stars Elias 16 (Taurus) and CK2(Serpens) are shown for comparison. The solid lines divide the plot intothree zones discussed in the text.
(Taurus) and CK2 (Serpens) are among the objects in thiscategory, which occupy the area above the uppermost linein The CO spectrum is dominated by deep non-Figure 7.polar CO and the polar component is weak (with the excep-tion of SVS4S in Serpens). The ratio of isCO/H2Orelatively high (25%È60%) and XCN is not generally
Carbon dioxide has been detected in Elias 16detected.4et al. NGC 7538 IRS 9 Graauw et al.(Whittet 1998), (de
R CrA IRS 1, IRS 2 et al. and may1996), (Boogert 1998),exist in a separate grain population along the line of sight
et al. et al.(Gerakines 1998 ; Boogert 1998).In the intermediate cases, the ratio is muchCO/H2Osmaller (D0%È20%). These sources are located in zone II in
Polar CO accounts for 40%È50% of the total COFigure 7.abundance for many of these sources. In some cases, thenonpolar component shows evidence for (Elias 18,CO2R CrA IRS 7, GL961E). Independent detection of inCO2R CrA IRS 7 et al. and Elias 18 et(Boogert 1998) (Whittetal. by ISO conÐrms its presence in the grain mantles.1997)For objects such as IRS 7, and CO may coexist in theCO2same mantle layer. Zone II also consists of objects in whichthe nonpolar component can only be Ðtted with mixturescontaining more than 90% CO (W33A, Mon R2 IRS 2,o Oph-Elias 29, Elias 32, WL5, WL12). Solid has beenCO2detected by ISO in W33A et al. CO and(Gu� rtler 1996) ;
are probably spatially separated along the line of sight.CO2The detection of XCN in R CrA IRS 7, W33A, GL961E,Mon R2 IRS 2, and Elias 18 is indicative of processing ofthe icy mantles in these sight lines (this work ; etPendletonal. et al.1998 ; Tegler 1995).
4 XCN is detected toward NGC 7538 IRS 9 et al. The(Pendleton 1998).o Oph and Serpens data do not have sufficient wavelength coverage tosearch for XCN.
The Ðnal group of embedded objects (zone III), containstwo sources, S140 and GL 2591. In these objects, solid COis not detected, but ice is known to be present (basedH2Oon detection of the 3.1 km ice feature). For theseH2Oobjects, the CO has been partially evaporated (conÐrmedthrough observations of gas-phase CO lines ; e.g., Mitchellet al. Dishoeck et al. and partly converted1989 ; van 1996)to (and/or other species). ISO has conÐrmed the pres-CO2ence of in these sight lines Graauw et al.CO2 (de 1996).Somewhat surprisingly, neither source has an XCN detec-tion ; more generally, all sources in which XCN has beendetected also show solid CO. This suggests that XCN is atransient molecule that does not survive in the harsherenvironments of evolved protostars.
7. SUMMARY
We have analyzed the CO proÐles of a sample of youngstellar objects that span a range of mass and luminosity.Our s2 minimization routine and our procedure for deter-mining a cuto† for acceptable Ðts show that several com-binations of polar and nonpolar mixtures are capable ofproviding comparable matches to the observed proÐle.These ““ alternate ÏÏ Ðts generally imply similar chemicalcomposition and temperature for the ice mantles towardindividual objects. In some sight lines, and CO appearCO2to be intimately mixed in the same mantle layer ; whereas inothers, modeling of the CO proÐle implies that CO exists in(nearly) pure form. Toward some sources in both groups,
has been independently detected by ISO, conÐrmingCO2its presence somewhere along the line of sight.We have proposed an evolutionary scheme to explain the
chemical diversity of the grain mantles in di†erent sightlines. This scheme is based on comparison between the non-polar CO column density, which traces the volatile CO-richgrain mantle, and the ice column density, which tracesH2Othe total less volatile polar-ice column density. YSOs withice detections are roughly divided into three groups : groupI contains sources whose CO proÐles are dominated by thenonpolar component, group II contains sources that have arelatively strong polar CO component, and the Ðnal group(III) contains sources in which CO is not detected.
There do not appear to be any systematic di†erences, inthe CO proÐles or column densities, between the high- andlow-mass objects. However, presently the database of high-mass young stellar objects that have high-resolution(R[ 1200) CO data is sparse. The evolutionary status ofmany high-mass YSOs is also not well known, making itmore difficult to correlate the evolution of grain mantleswith age. We have undertaken a study to observe a largersample of YSOs in an e†ort to trace the a†ect of mass, age,and parent cloud on grain mantle evolution. Our studies, inconjunction with additional observational and laboratoryinvestigations, of molecules such as NH3, CH4, CH3OH,and will help unravel the chemical and physical pro-CO2,cesses a†ecting grain mantle composition.
We would like to thank Tom Geballe and the UKIRTService Programme for the observations of some of the datapresented here. The service data were obtained in collabo-ration with D. Weintraub and S. Tegler. We are grateful toA. Chrysostomou for providing us with the W33A spec-trum. UKIRT is operated by the Joint Astronomy Centreon behalf of the UK Particle Physics and Astronomy

No. 2, 1998 PROCESSING OF ICY MANTLES IN PROTOSTELLAR ENVELOPES 727
Research Council. This work has made use of the StarlinkProject software. J. E. C. currently holds a NationalResearch Council-ARC Research Associateship. D. C. B. W.and J. E. C. acknowledge support from NASA grants
NAG5 3339 (Long-Term Space Astrophysics) and NAGW4039 (Infrared Space Observatory). A. J. A. is partly fundedby the UK STARLINK project and partly by the Uni-versity of Central Lancashire.
REFERENCESL. J., Sandford, S. A., Tielens, A. G. G. M., & Herbst, T. M.Allamandola,
1992, ApJ, 399, 134L. J., Sandford, S. A., & Valero, G. 1988, Icarus, 76,Allamandola, 225
G., Rodriguez, L. F., Torrelles, J. M., Estalella, R., Ho, P. T. P.,Anglada,Canto, J., Lopez, R., & Verdes-Montenegro, L. 1989, ApJ, 341, 208
C., & Walther, D. M. 1990, A&A, 235,Aspin, 387P., & Me� nard, F. 1990, ApJ, 364,Bastien, 232
S., Evans, N. J., II, Becklin, E. E., & Neugebauer, G. 1976, ApJ,Beckwith,208, 390
M. P., Sandford, S. A., Allamandola, L. J., Chang, S., &Bernstein,Scharberg, M. A. 1995, ApJ, 454, 327
A. C. A., et al. 1996, A&A, 315,Boogert, L3771998, inÈÈÈ. preparationA. 1987, ApJ, 322,Brown, L31M. 1992, Proc. Astron. Soc. Australia, 10,Burton, 52R. W., Gillett, F. C., & Knacke, R. F. 1978, ApJ, 226,Capps, 863
M. W., Grasdalen, G. L., Hackwell, J. A., Capps, R. W., &Castelaz,Thompson, D. 1985, AJ, 90, 1113
S. B., Tielens, A. G. G. M., & Millar, T. J. 1992, ApJ, 399,Charnley, 71W. P., & Graham, J. A. 1993, ApJ, 409,Chen, 319J. E. 1997a, Orig. Life Evol. Biosphere, 27,Chiar, 791997b, Ph.D. thesis, Rensselaer PolytechnicÈÈÈ. Institute
J. E., Adamson, A. J., Kerr, T. H., & Whittet, D. C. B. 1994, ApJ,Chiar,426, 240
1995, ApJ, 455,ÈÈÈ. 234J. E., Adamson, A. J., & Whittet, D. C. B. 1996, ApJ, 472,Chiar, 665
A., Hough, J. H., Whittet, D. C. B., Aitken, D. K., Roche,Chrysostomou,P. F., & Lazarian, A. 1996, ApJ, 461, L61Graauw, Th., et al. 1996, A&A, 315,de 345
L. B., Allamandola, L. J., Grim, R. J. A., & Greenberg, J. M.dÏHendecourt,1986, A&A, 158, 119
L. B., & Jourdain de Muizon, M. 1989, A&A, 223,dÏHendecourt, L5L. B., et al. 1996, A&A, 315,dÏHendecourt, L365
P., Boogert, A. C. A., Gerakines, P. A., Jansen, D. J., Schutte,Ehrenfreund,W. A., Tielens, A. G. G. M., & van Dishoeck, E. F. 1996, A&A, 315, 341
P., Boogert, A. C. A., Gerakines, P. A., Tielens, A. G. G. M.,Ehrenfreund,& van Dishoeck, E. F. 1997, A&A, 328, 649
C., Gomez, A. I., & Lenzen, R. 1988, A&A, 190,Eiroa, 283C., & Hodapp, K.-W. 1989, A&A, 210,Eiroa, 345J. H. 1978, ApJ, 224,Elias, 857J., Allamandola, L. J., & Sandford, S. A. 1997, ApJ, 479,Elsila, 818
T. R. 1986, A&A, 162,Geballe, 248P. A., Schutte, W. A., & Ehrenfreund, P. 1996, A&A, 312,Gerakines, 289P. A., Schutte, W. A., Greenberg, J. M., & van Dishoeck, E. F.Gerakines,
1995, A&A, 296, 810P. A., et al. 1998, inGerakines, preparation
J. A., & Chen, W. P. 1991, AJ, 102,Graham, 1405R. J. A., & Greenberg, J. M. 1987, ApJ, 321,Grim, L91
J., Henning, Th., Ko� mpe, C., Pfau, W., Kra� tschmer, W., & Lemke,Gu� rtler,D. 1996, A&A, 315, 189
J., Haikala, L. K., Mattila, K., Mauersberger, R., Booth, R. S., &Harju,Nordh, H. L. 1993, A&A, 278, 569
F. P. 1996, Ph.D. thesis, Univ.Helmich, LeidenT. H., Adamson, A. J., & Whittet, D. C. B. 1993, MNRAS, 262,Kerr, 1047
J. H., Bass, F., Allamandola, L. J., Persson, S. E., McGregor, P. J.,Lacy,Lonsdale, C. J., Geballe, T. R., & van de Bult, C. E. P. M. 1984, ApJ, 276,533
J. H., Carr, J. S., Evans, N. J., II, Baas, F., Achtermann, J. M., &Lacy,Arens, J. F. 1991, ApJ, 376, 556
H. P., Davis, D. S., Black, J. H., & Fink, U. 1985, ApJ, 299,Larson, 873H. G., & Rydgren, A. E. 1981, AJ, 86,Marraco, 62G. F., Allen, M., & Maillard, J.-P. 1988, ApJ, 333,Mitchell, 55G. F., Curry, C., Maillard, J.-P., & Allen, M. 1989, ApJ, 341,Mitchell, 1020G. F., Maillard, J.-P., Allan, M., Beer, R., & Belcourt, K. 1990,Mitchell,
ApJ, 363, 554P. C., Fuller, G. A., Mathieu, R. D., Beichman, C. A., Benson, P. J.,Myers,
Schild, R. E., & Emerson, J. P. 1987, ApJ, 319, 340M. E., & Strazzulla, G. 1993, A&A, 269,Palumbo, 568Y. J., Tielens, A. G. G. M., Tokunaga, A. T., & Bernstein, M. P.Pendleton,
1998, ApJ, submittedB., Chini, R., Krugel, E., Kreysa, E., & Sievers, A. 1993, A&A,Reipurth,
273, 221L. F., Myers, P. C., Cruz-Gonzalez, I., & Terebey, S. 1989, ApJ,Rodriguez,
347, 461S. A., & Allamandola, L. J. 1990, ApJ, 355,Sandford, 357S. A., Allamandola, L. J., Tielens, A. G. G. M., & Valero, G. J.Sandford,
1988, ApJ, 329, 498S., Nagata, M., & Yamamoto, T. 1990, ApJ, 359,Sato, 192
B., Greenberg, J. M., & Grim, R. J. A. 1989, ApJ, 340,Schmitt, L33W. A., & Greenberg, J. M. 1997, A&A, 317,Schutte, L43
R. G., Sellgren, K., & Tokunaga, A. T. 1989, ApJ, 344,Smith, 413K. M., Strom, S. E., & Grasdalen, G. L. 1974, ApJ, 187,Strom, 83M., Nagata, T., Sato, S., & Yamamoto, T. 1994, ApJ, 430,Tanaka, 779M., Sato, S., Nagata, T., & Yamamoto, T. 1990, ApJ, 352,Tanaka, 724
K. N. R., & Storey, J. W. V. 1984, MNRAS, 209,Taylor, 5PS. C., Weintraub, D. A., Allamandola, L. J., Sandford, S. A., Rettig,Tegler,
T. W., & Campins, H. 1993, ApJ, 411, 260S. C., Weintraub, D. A., Rettig, T. W., Pendleton, Y. J., Whittet,Tegler,
D. C. B., & Kulesa, C. A. 1995, ApJ, 439, 279A. G. G. M., & Hagen, W. 1982, A&A, 114,Tielens, 245A. G. G. M., Tokunaga, A. T., Geballe, T. R., & Baas, F. 1991, ApJ,Tielens,
381, 181 (TTGB)Dishoeck, E. F., et al. 1996, A&A, 315,van L349
M. W., Becklin, E. E., Gatley, I., Matthews, K., Neugebauer, G., &Werner,Wynn-Williams, C. G. 1979, MNRAS, 188, 463
D. C. B., Adamson, A. J., Duley, W. W., Geballe, T. R., &Whittet,McFadzean, A. D. 1989, MNRAS, 241, 707
D. C. B., Adamson, A. J., McFadzean, A. D., Bode, M. F., &Whittet,Longmore, A. J. 1988, MNRAS, 233, 321
D. C. B., & Blades, J. C. 1980, MNRAS, 191,Whittet, 309D. C. B., Bode, M. F., Longmore, A. J., Baines, D. W. T., & Evans,Whittet,
A. 1983, Nature, 303, 218D. C. B., Longmore, A. J., & McFadzean, A. D. 1985, MNRAS,Whittet,
216, 45PD. C. B., et al. 1996, ApJ, 458,Whittet, 3631998, ApJ,ÈÈÈ. submittedB. A., Taylor, K. N. R., & Storey, J. W. V. 1986, AJ, 92,Wilking, 103S. P., et al. 1982, ApJ, 253,Willner, 174
Note added in proof.ÈAfter our paper went to press, we became aware of the paper by Teixera, Emerson, & Palumbo(A&A, 330, 711 [1998]) ; their work is a valuable addition to the database of solid CO proÐle analyses.