systems/circuits ... · y-shapedmazewithasymmetricalarmlengths.ourfindingssug-gest that swrs and...
TRANSCRIPT

Systems/Circuits
Hippocampal Replay Captures the Unique TopologicalStructure of a Novel Environment
Xiaojing Wu and David J. FosterSolomon H. Snyder Department of Neuroscience, Johns Hopkins University School of Medicine, Baltimore, Maryland 21205
Hippocampal place-cell replay has been proposed as a fundamental mechanism of learning and memory, which might support naviga-tional learning and planning. An important hypothesis of relevance to these proposed functions is that the information encoded in replayshould reflect the topological structure of experienced environments; that is, which places in the environment are connected with whichothers. Here we report several attributes of replay observed in rats exploring a novel forked environment that support the hypothesis.First, we observed that overlapping replays depicting divergent trajectories through the fork recruited the same population of cells withthe same firing rates to represent the common portion of the trajectories. Second, replay tended to be directional and to flip therepresented direction at the fork. Third, replay-associated sharp-wave–ripple events in the local field potential exhibited substructurethat mapped onto the maze topology. Thus, the spatial complexity of our recording environment was accurately captured by replay: theunderlying neuronal activities reflected the bifurcating shape, and both directionality and associated ripple structure reflected thesegmentation of the maze. Finally, we observed that replays occurred rapidly after small numbers of experiences. Our results suggest thathippocampal replay captures learned information about environmental topology to support a role in navigation.
IntroductionThe hippocampus is critical for learning and memory, particu-larly spatial memory (Olton and Samuelson, 1976; O’Keefe andNadel, 1978) and memory for events (Scoville and Milner, 1957;Gaffan, 1994; Steele and Morris, 1999). Neurons in the hip-pocampus fire at specific locations in the environment, and henceare termed “place cells” (O’Keefe and Dostrovsky, 1971; O’Keefeand Nadel, 1978). It is now well established that hippocampalplace cells engage in extended spiking sequences across neuronalensembles that match sequences from previous behavioral epi-sodes, often in a temporally condensed form during 100 –200 mssharp-wave–ripple (SWR) events in the hippocampal local fieldpotential (LFP; Louie and Wilson, 2001; Lee and Wilson, 2002;Foster and Wilson, 2006; Csicsvari et al., 2007; Diba and Buzsaki,2007; Ji and Wilson, 2007; Davidson et al., 2009; Karlsson andFrank, 2009; Gupta et al., 2010). While SWR-associated place-cellsequences are associated with memory consolidation, particu-larly during sleep (Girardeau et al., 2009; Ego-Stengel and Wil-son, 2010; O’Neill et al., 2010; Carr et al., 2011), there is growingevidence that they also contribute to navigational learning andplanning (Buckner, 2010; Foster and Knierim, 2012; Jadhav et al.,2012). Place-cell sequences occur during the awake state duringpauses in behavior at reward sites, in which the previously expe-
rienced behavioral sequence is replayed in reverse order (Fosterand Wilson, 2006; Diba and Buzsaki, 2007; Davidson et al., 2009;Karlsson and Frank, 2009), and in a manner likely to be modu-lated by reward (Singer and Frank, 2009), hence providing anideal representation for associating locations with predictions ofexpected future reward (Montague et al., 1996; Foster and Wil-son, 2006). More recently, it has been demonstrated that SWR-associated place-cell sequences occurring immediately beforemovement in a spatial memory task depict the future trajectorythat the animal will take to the remembered goal location (Pfe-iffer and Foster, 2013). Therefore, hippocampal SWR-associatedplace-cell sequences might provide a mechanism by which thebrain addresses the learning, memory, and planning demandsinherent in memory-based navigation (Tolman, 1948; O’Keefeand Nadel, 1978).
A key aspect of the navigation problem is dealing with thetopological structure of the terrain, that is, which places are con-nected to, or accessible from, which other places. This structuredetermines the set of available paths that can be traversed, as wellas the barriers that must be avoided. Navigational schemes thatignore topological structure, such as simple dead reckoning, canwork well in open, unobstructed environments such as thoseencountered by certain species of desert ant (Gallistel, 1990), butin more complex environments successful navigation is likely torequire modes of planning that incorporate topological structure(O’Keefe and Nadel, 1978).
We hypothesized that hippocampal SWR-associated place-cell sequences would capture the spatial topology of the environ-ment, rather than capturing only the temporal structure ofexperiences in the environment as independent episodes. Wetested this hypothesis by recording place-cell activity while ratsexplored a novel environment with an unpredictable structure: a
Received Aug. 9, 2013; revised March 13, 2014; accepted March 20, 2014.Author contributions: X.W. and D.J.F. designed research; X.W. performed research; X.W. and D.J.F. analyzed data;
X.W. and D.J.F. wrote the paper.This work was supported by the Alfred P. Sloan Foundation, the Whitehall Foundation, and National Institutes of
Health Grant RO1 MH085823.The authors declare no competing financial interests.Correspondence should be addressed to Solomon H. Snyder Department of Neuroscience, Johns Hopkins Univer-
sity School of Medicine, Baltimore, MD 21205. E-mail: [email protected]:10.1523/JNEUROSCI.3414-13.2014
Copyright © 2014 the authors 0270-6474/14/346459-11$15.00/0
The Journal of Neuroscience, May 7, 2014 • 34(19):6459 – 6469 • 6459

Y-shaped maze with asymmetrical arm lengths. Our findings sug-gest that SWRs and associated place-cell sequences do indeedcapture the learned topological structure of the environment.
Materials and MethodsElectrophysiology and behavioral task. Male Long–Evans rats, 3.5– 4.5months in age, were pretrained to run back and forth on a linear track forchocolate milk reward available at both track ends under moderate fooddeprivation. Pretraining was ended when animals reached the perfor-mance criterion of running �30 laps within 30 – 40 min, usually after 1–2weeks. Custom-designed microdrives consisting of 40 independently ad-justable tetrodes were then implanted with half the tetrodes targeting theright dorsal CA1 area (�3.6, �2.2 mm from bregma), and the other halftargeting the right medial prefrontal cortex (�3.2, �0.8 mm from breg-ma; data not presented). Tetrodes were gradually moved into the CA1pyramidal cell layer with one tetrode left in the white matter above thecell layer to provide a reference signal to all other tetrodes.
When all tetrodes were in position, the first recording day, on whichrats were first exposed to a modified Y maze, began. The Y maze wascomposed of one long arm (145 cm run segment) and two short arms (65cm run segment), all of which were separated by 120 o. Each arm had awider reward area at the end (16 cm in length). One short arm was chosento be the central (C) arm; the other two arms [right (R); left (L)] weretermed “alternating arms.” The rat was placed at the baited end of thecentral arm, and was allowed to freely explore the Y maze and rewardedaccording to the following alternation rule: the first arrival at an alternat-ing end was rewarded; thereafter, returns to the central arm were re-warded while visits to the alternating arms were rewarded only if the armidentity was different from the last alternating arm rewarded.
Spiking activities and LFP signals were recorded (Neuralynx) and on-line digitally filtered in different frequency bands (600 – 6000 Hz forspikes and 0.1–500 Hz for LFP). Rats’ positions were signaled by a redLED and a green LED attached to the drive, and were recorded from anoverhead camera. Recording sessions lasted 1–2.5 h and were endedwhen rats stopped running.
Recordings lasted 6 – 8 d with one session run on each day and wereterminated when cell yield became poor. Rats were killed, and lesionswere made on selected tetrodes by passing current (30 �A for �5 s)through each tetrode. Animals were then perfused with formalin. Brainswere removed, sectioned, and stained for cresyl violet to verify tetroderecording locations.
The spike data were manually clustered in custom software Xclust2(written by M. Wilson, Massachusetts Institute of Technology, Cam-bridge, MA). Each visually discernable cluster was separated by graduallyrefining its boundary iteratively in each plot of spike waveform peakamplitudes on a pair of tetrode channels (i.e., each of the six two-dimensional projections in the four-dimensional spike peak amplitudespace). A cluster was considered as a putative pyramidal single unit whenits complex spike index (CSI), a measurement for the bursting tendencyof the unit characteristic of hippocampal pyramidal neurons (Nakazawaet al., 2002), was �5%; a cluster was considered to be well isolated andlargely free of noise when its cross-CSI with every other cluster from thesame tetrode was �3%. Many of the clusters included in our study hadsingle-unit CSIs �10% and cross-CSIs �1%. Cluster stability was veri-fied with the plot of peak amplitudes against time during the entirerecording session. Data from the very first sessions of Rats 1 and 3 arepresented in this article. Rat 2 did not explore all three arms in his firstsession (he made only one trip to the reward area of the R arm and ranback to the C reward area, where he stayed during the rest of the session),and data from his second session on the following day are presented here.
Position linearization and place-field computation. Recorded positionswere projected onto three centerlines (defined by the experimenter)aligned with the three arms of the Y maze. The three lines were thenconcatenated to produce a linear axis (Fig. 1). Nondirectional place fieldswere computed by using all spike data (1.8 –1.9 cm position bins) andsmoothed with a Gaussian filter (SD � 5 bins). Note that firing rates onthe three arms were separately smoothed to minimize misestimation ofplace fields around the choice point. Putative interneurons (mean peak-
to-trough spike width �0.34 ms) and neurons with insignificant placefields (peak firing rate on the Y maze �1 Hz) were excluded from a totalof 99, 79, and 62 single units recorded from Rats 1–3. The rest of thesingle units were considered putative place cells (88 from Rat 1, 67 fromRat 2, 58 from Rat 3) and were used in the following analyses.
Candidate events and trajectory-specific subregions. For each recordingsession, a smoothed spike density function was computed with all spikesfrom all putative place cells (10 ms time bins; Gaussian filter SD � 15ms). Candidate events were defined as epochs of spikes during whichspike densities were above the mean of the function, and contained peaksabove 2 SDs over the mean. Only candidate events that occurred when arat’s speed was �5 cm/s were considered (2514 from Rat 1, 3222 from Rat2, 2902 from Rat 3). A Bayesian decoding algorithm (Davidson et al.,2009) was then applied to the candidate events, which calculated theprobability of the ensemble of neurons representing each position binduring each time bin.
Single-arm replays representing each individual arm and three types ofjoint replay extended across each pair of arms (C7 R, C7 L, and R7L, referred to as CR, CL, and RL) were considered. To maximize thelikelihood of detecting all six types of replay in an unbiased manner, wesegmented the posterior probability matrix of each candidate event inboth position and time to further define trajectory-specific subregions.Each candidate event was first separated along the position axis into threesegments corresponding to the three arms (Fig. 1C). We defined a max-imum a priori probability (MAP) function as the largest probabilityacross all positions per time bin, smoothed in time with a Gaussian filter(SD, 10 ms; Fig. 1C center, blue curves). Each single-arm segment wasthen segmented in time, and a trajectory-specific subregion was createdaround the largest peak of the MAP function to include time bins whoseMAP values were above a threshold of five times the chance level, namely(1/total # position bins) � 5 (a fixed threshold only dependent on the sizeof the track and not the quality of neuronal data). The trajectory-specificsubregions of the single arms were then combined in pairs to create those ofthe joint arms, which expanded from the earliest to the latest time bins of thetwo corresponding single-arm subregions and contained all position binsbelonging to the two corresponding single arms (Fig. 1C, right). It should benoted that all single-arm and joint-arm subregions were continuous in time(i.e., arm segments were not shifted across time bins so that they could bepieced together to form a longer sequence); thus, this segmentation methoddoes not artificially create coherent coding of one arm and then another.
Replay identification. To determine whether the posterior probabilitieswithin a trajectory-specific subregion gave rise to a replay sequence, thefollowing three variables were calculated: (1) length of subregion in time;(2) arm coverage [a position bin was considered to be represented in thesubregion if its largest probability across time is above the threshold(1/total number of position bins) � 5, and the percentage of representedpositions out of all positions within the subregion was defined to be thearm coverage]; and (3) weighted correlation, which is an adapted form ofthe Pearson’s correlation, measuring the strength of correlation betweenthe changes in probability values across time and position, and using allpixels in the subregion, given by the following:
Weighted mean: mx; w � �i�1
M �j�1
N
wijxi��i�1
M �j�1
N
wij
Weighted covariance: covx, y; w �
�i�1
M �j�1
N
wijxi � mx; wyj � my; w��i�1
M �j�1
N
wij
Weighted correlation: corrx, y; w �
covx, y; w/�covx, x; wcovy, y; w,
Where xi is the ith time bin, yj is the jth position bin, wij is the probabilityof pixel (i, j), and M and N are the total numbers of the time and positionbins of a given subregion.
A single-arm subregion was determined to contain the correspondingsingle-arm replay if the following three criteria were met: (1) subregion
6460 • J. Neurosci., May 7, 2014 • 34(19):6459 – 6469 Wu and Foster • Hippocampal Replay Captures Topological Structure

length �50 ms (five time bins); (2) arm coverage of �50%; and (3)absolute weighted correlation � 0.5.
A joint-arm subregion was determined to contain the correspondingjoint replay if the following two criteria were met: (1) absolute weightedcorrelation �0.5; and (2) both of the constituent single-arm subregionsmeet criteria 1 and 2 for single-arm replays and have the same signs ofweighted correlation as that of the joint-arm subregion.
Finally, for a candidate event to be considered to contain a single-armreplay, none of the joint-arm subregions should contain any replays; fora candidate event to be considered to contain a joint replay, neither of theother joint-arm subregions should contain any replays. It is important to
note that the detection of replay structure within a candidate event ishighly dependent on the recorded cell assembly, as the recording of aninsufficient number of cells participating in an actual replay event willlikely generate a false-negative result.
Cumulative replay numbers and place-field modular shuffle. To quantifyreplay occurrence, we focused on changes in replay number across stop-ping periods, periods of time spent between runs at a reward area, wherethe majority of reactivation activities occurred. For each joint replay type,the cumulative number of identified replays was counted for each stop-ping period, starting from the one immediately following the first lap oftraversal across the corresponding arms.
A B
C
Figure 1. Place-cell activities in modified Y maze. A, Modified Y maze. B An example epoch of 106 s of recording. Top, Linearized running trajectory of Rat 1. Horizontal dashed lines indicate armboundaries. Colored arrows on right indicate arm alignment along linear axis (same below). The rat ran through center3 C3 center3 R3 center3 L3 center. Middle, Simultaneouslyrecorded spike trains from 88 putative place cells, ordered by locations of the peak firing rates of the cells on linearized maze. Bottom, Position estimation based on these spikes, where posteriorprobabilities of position representations in each 250 ms window were indicated by a hot scale. C, Illustration of definition of trajectory-specific subregions within a candidate event for replaydetection. An example candidate event (left) was first segmented in position into three segments, with each one corresponding to an individual arm: center top, the L arm; center middle, the R arm;and center bottom, the C arm. Blue curves are MAP functions, defined as the largest posterior probability across all positions per time bin, and calculated separately for each segment. Vertical dashedlines indicate the windows within which MAPs were above the threshold (1/total number of position bins)� 5, which is marked by red lines, thus defining trajectory-specific subregions for the threesingle-arm segments. In this example, only C and R subregions passed all criteria for containing replay structure, which were combined to define the subregion for the joint-arm path CR (right). Thiscandidate event was finally determined to contain a joint replay of CR.
Wu and Foster • Hippocampal Replay Captures Topological Structure J. Neurosci., May 7, 2014 • 34(19):6459 – 6469 • 6461

A place-field modular shuffle was used todetermine the stopping period by which thecumulative number of a replay first reached asignificant level, which circularly shifted eachcell’s place field by a random number of posi-tion bins. This method preserved each cell’sspike train and local place-field structure. Thesame algorithm described in the previous twosections was applied to cells’ shuffled placefields and original spike trains to create sampledistributions of cumulative replay numbers(5000 shuffles), from which Monte Carlo p val-ues of the original cumulative numbers werecalculated. The first significant stopping pe-riod was defined by p � 0.05. The number oflaps (running from one arm end to another)of corresponding arm traversals was used toquantify the amount of physical experienceacquired before the first significant stoppingperiod. The total number of replays in eachsession, from original and shuffled data, wasused for Figure 2E.
Comparison of cell activities in joint replaycommon segments. To understand the underly-ing neuronal firing patterns of joint replays, wecompared individual neuronal firing activitiesduring the overlapping segments of joint re-plays that represented a common arm, betweenjoint replays depicting diverging paths. Takejoint CR and CL replays for example. First, wefound all the cells that ever fired a spike duringthe C segment of CR (set 1) or CL (set 2) re-plays. The size of intersection of the two setswas compared with that of either set to quan-tify overlap. Next, firing rates during the C seg-ment of each joint replay were calculated forcells belonging to the union of the two sets. Thefiring rates of each cell in CR and CL replayswere compared by using the Kolmogorov–Smirnov two-sample test. Last, the distributionof the absolute differences between cells’ meanfiring rates in CR and CL was compared withshuffles in which the types of the joint replayswere randomized (group sizes were kept thesame), also by using the Kolmogorov–Smirnovtwo-sample test.
Due to the small numbers of joint replays ofRat 2 (Fig. 2E), we used only its CR and RLreplays in the analyses in this section.
Directionality of replay. Directional placefields were calculated using spikes and positiondata from only inbound or only outbound lapsfor each arm. Joint probabilities estimated overboth position and direction (Davidson et al.,2009; time bin � 10 ms) were computed for allidentified replays. Two variables were calcu-lated to quantify directionality by using jointprobabilitieswithinthecorrespondingtrajectory-specific subregions.
The first variable, “directional,” was definedas follows:
1
M�i�1
Mabs��
j�1
N
w1ij � �j�1
N
w2ij��j�1
N
w1ij � �j�1
N
w2ij
,
where w1ij and w2ij are the joint probabilities of the inbound and out-bound directions of pixel (i, j), and measures on average how directional
a replay is during each of its time bins. It has a range of 0 –1, with 0indicating totally not directional and 1 indicating totally directional. Re-plays with values �0.3 were considered directional, otherwise they wereconsidered nondirectional. The threshold is fixed so that it is indepen-dent of the data (same below).
For a replay determined to be directional, the second variable “bias”defined by the following:
Figure 2. Joint replays were detected from neuronal data in significant numbers. A, Linearized position as a function of time forRat 1 during first exposure to the modified Y maze. Colored ticks mark when and where example replays in B, C, and D occurred.B, C, D, Examples of identified replay events representing CR, RL, and CL trajectories from a single rat (Rat 1), in which theposition is decoded from neuronal spike trains in nonoverlapping 10 ms bins. Horizontal dashed lines mark arm boundaries.Replays in each row are ordered by the time of occurrence. The duration of each event (in milliseconds) is shown below eachexample. E, For each pair of joint arms, the probability of observing the number of identified joint replays by chance isexpressed as the distribution of the numbers of replays representing the same joint arms sampled from 5000 shuffles asfractions of the number of joint replays actually observed (numbers in inset). Each type of replay from each animal washighly significant. F, Histograms of fractions of candidate event time windows occupied by single-arm replays and jointreplays are plotted for each animal, normalized by the total numbers of replays. Single-arm replays (0.6 � 0.0 across allrats) occupied significantly smaller fractions of spike density events than joint replays (0.8 � 0.0 across all rats; Rat 1: t(755)
� �14.6; p � 10 �42; Rat 2: t(385) � �5.8; p � 10 �7; Rat 3: t(267) � �10.1; p � 0.02).
6462 • J. Neurosci., May 7, 2014 • 34(19):6459 – 6469 Wu and Foster • Hippocampal Replay Captures Topological Structure

�i�1
M �j�1
N
w1ij � �i�1
M �j�1
N
w2ij
�i�1
M �j�1
N
w1ij � �i�1
M �j�1
N
w2ij
,
was then used to measure whether this replay as a whole was consistentlybiased toward representing either direction. It has a range of �1 to 1,with �1 indicating pure representation of the outbound direction and 1indicating pure representation of the inbound direction. Replays withvalues larger than 0.3 were considered to have stronger representations ofthe inbound direction over the outbound direction; those smaller than�0.3 were considered to have stronger representations of the outbounddirection over the inbound direction; and those between �0.3 and 0.3were considered to have mixed representations of both directions.
Finally, replays were determined to be forward if bias and motion werein the same direction, reverse if bias and motion were in opposite direc-tions and mixed if bias was mixed. For joint replays, directionalities oftheir two segments were separately determined using joint probabilitieswithin the two corresponding subregions.
Ripple and multiunit activity analyses. Ripple amplitude was calculatedas in Davidson et al. (2009), with minor changes. We filtered the LFPsignal from each selected channel in the ripple band (150 –250 Hz), andHilbert transformed the filtered signal to compute its envelope as theabsolute value of the transformation. The mean envelope averaged acrossall selected tetrodes (15, 13, and 13 of 19 tetrodes for Rats 1, 2, and 3) wassmoothed with a Gaussian window (SD � 8 ms) to represent a continu-ous mean ripple amplitude. Individual ripples were also detected as localpeaks in the ripple amplitude curve �2.5 SDs above the mean, whichwere both calculated across all stopping periods. We defined the timepoint at which replay “passes” the choice point as the mean of innerboundaries of the two corresponding single-arm trajectory-specific sub-regions. The ripple amplitude trace associated with each joint replay wasaligned to this time point to compare ripple amplitude between choicepoint representation and representations of the preceding and followingarms across all joint replays. Multiunit spikes were defined as all recordedspikes whose largest amplitudes across tetrode channels were �100 �V.Multiunit spike density was smoothed across 10 ms bins (Gaussian filter;SD � 6 ms).
ResultsMultitetrode recordings in the dorsal CA1 area of the hippocam-pus were conducted in three rats that were exploring the Y mazefor the first time. Rats were allowed free exploration and wererewarded with chocolate milk at arm ends according to a spatialalternation rule (see Materials and Methods). Putative CA1 py-ramidal single units were identified, and their place fields werecomputed. Only pyramidal cells with peak in-field firing ratesexceeding 1 Hz (88 from Rat 1, 67 from Rat 2, 58 from Rat 3) wereused in the following analyses.
Abundant joint replays spanning each two connecting armswere identifiedTo detect hippocampal replay, we first identified candidateevents (mean duration � 154.6 ms) as transient increases in spikedensity across all cells, occurring during stopping periods re-stricted to the three reward areas. A Bayesian decoding algorithm(Davidson et al., 2009) was used to estimate posterior probabili-ties of position during candidate events. Based on posterior prob-abilities, candidate events were segmented in position and timeinto trajectory-specific subregions (Fig. 1C). Within each subre-gion, replays were defined as events with a high correlation be-tween position and time, using a weighted correlation methodwith posterior probabilities as weights. We found large numbersof joint replays in all three animals, which extended across pairsof arms (CR, CL, and RL; Rat 1, N � 164; Rat 2, N � 32; Rat 3,N � 66; see examples in Fig. 2B–D). These joint replays were
readily identified after just the first few running laps across armsand then consistently throughout the recording sessions (Fig. 2A,time points of example replays).
The significance of replay was evaluated by applying the replayidentification method to shuffled data in which the individualspike train and place-field structure of each cell were preserved,but the spatial relationship between different cells was disruptedby circularly shifting the place field of each cell independently bya random number of position bins. For each rat, each type of jointreplay was highly significant in number compared with shuffles[Monte Carlo method, p � 0.001 (except for CL of Rat 2, p �0.025, and CL of Rat 3, p � 0.002); Fig. 2E].
We also observed large numbers of replays representing singlearms (Rat 1, N � 593; Rat 2, N � 355; Rat 3, N � 203). However,it is possible that many single-arm replays were partial joint re-plays where one of the arms was below the detection threshold. Insupport of this, the fraction of spike density events occupied bysingle-arm replays was significantly lower than for joint replays(Fig. 2F). As a result, we focused on joint replays in the followinganalyses, and also because the Y maze structure—the joining ofthree arms— could only be reflected in the joint replays.
Multiple trajectories were replayed in the samestopping periodFurther analyses of replay content revealed that across all stop-ping periods of the three animals 90.8 � 2.4% of the joint replaysstarted from the current arm, confirming the initiation bias thathas been reported (Foster and Wilson, 2006; Davidson et al.,2009). Previous reports of replay on a linear track demonstratedthat each stopping period was associated with multiple replayevents of the same trajectory (Foster and Wilson, 2006). This wasinterpreted as an efficient use of experience. Here we likewisefound that individual stopping periods yielded multiple replayevents (2.0 � 0.3 joint replays, and 8.9 � 1.5 single-arm replays).However, in contrast to the linear track, we observed that on theY maze individual stopping periods were associated with multiplereplays depicting different trajectories. A large fraction of stop-ping periods that exhibited joint replay contained replay of mul-tiple different trajectories (38.1%). Indeed, for stopping periodsexhibiting joint replay, on average 1.5 � 0.1 types of joint-armtrajectory (from a range of 1–3) were represented (Fig. 2A). Thus,stopping periods were associated with replays of more than oneexperience.
Neuronal sequences were bifurcatedWhile the use of position estimation allowed the informationcontent (i.e., trajectory) of replay sequences to be decoded, wefurther wished to identify the basis of this information content inthe responses of individual neurons. In particular, we consideredtwo models that might have accounted for the joint replays weobserved. Joint replays could have been encoded using indepen-dent populations of neurons (Fig. 3A); thus, the underlying neu-ronal sequences would be linear, which would in essence be thesame neuronal sequences encoding independent linear tracks.Alternatively, common arms of joint replays could have beenencoded by the same cells (Fig. 3B); thus, the underlying neuro-nal sequences would be bifurcated, truly encoding the forked Ymaze structure.
For each pair of joint replays proceeding from each arm, thecells that fired during the common segment were almost identi-cal: on average, 93.6 � 2.2% of the cells that fired in one replayalso fired in the other. Furthermore, these populations did notdiffer in firing rate between the two replays. For example, Figure
Wu and Foster • Hippocampal Replay Captures Topological Structure J. Neurosci., May 7, 2014 • 34(19):6459 – 6469 • 6463

3C shows cells from Rat 1 that partici-pated in firing during the C segments ofCR or CL replays. Despite the wide rangeof firing rates among different cells, eachindividual cell had almost identical firingrates between CR and CL replays (the al-most complete overlap between blue andmagenta curves). Across all three rats, anaverage of 98.0 � 0.5% of the participat-ing cells (94.9 � 1.7% of all cells) had nosignificant difference between their firingrates during the common segments (p �0.05, Kolmogorov–Smirnov two-sampletest). Finally, the distributions of abso-lute differences in mean firing ratebetween the two replays were not signif-icantly different from those of shufflesin which replay type was randomized(p � 0.10 for all comparisons, Kolmogo-rov–Smirnov two-sample test; Fig. 3D–F). These results demonstrate that thesame ensemble of cells fired during thecommon arm of overlapping joint replayswith equal firing rates, as if they did notdistinguish between the two types of re-play, implying that joint replays reflected,at the neuronal level, the bifurcating spa-tial structure of the maze.
Replays were highly directionalWe next asked whether directionality(Fig. 4A) was encoded by replay andwhether it might reflect the structure ofthe Y maze. Directional place fields werecalculated and were used to compute jointposterior probabilities over both positionand direction (Davidson et al., 2009), for the already identifiedreplays. The directionality of a replay was quantified using twoscores. “Directional” measured the extent to which the replaytended to be directional during each time bin regardless of whichdirection was preferred, on a scale of 0 –1. “Bias” measured theextent to which a directional replay as a whole favored one direc-tion over the other, on a scale of �1 (outbound) to 1 (inbound).We further compared bias with the direction of motion of replayto categorize replays as either forward (bias and motion in thesame direction) or reverse (bias and motion in opposite direc-tions). Across all three rats, the overwhelming majority of replaysequences (97.7%, including single-arm replays and the compo-nent segments of joint replays) had a directional score �0.3. Thisthreshold corresponds to a divergence between the marginalprobabilities in either direction such that the probability inone direction (0.65) was almost double that in the other(0.35). In fact, the mean directional score was 0.62 � 0.00,which corresponds to a fourfold difference in marginal prob-abilities (0.81 to 0.19). Thus, replays were highly directional.
We then asked whether the components of joint replays ex-hibited the same bias. Interestingly, while joint replays exhibitedvarious combinations of bias, only 8.0% were either consistentlyreverse (a reverse sequence of the outbound direction followed bya reverse sequence of the inbound direction, 4.6%; Fig. 4B) orconsistently forward (a forward sequence of the inbound direc-tion followed by a forward sequence of the outbound direction,3.4%; Fig. 4C). By contrast, 31.3% of joint replays were composed
of segments with opposing biases (e.g., reverse in the outbounddirection followed by forward in the outbound direction; Fig.4D). Thus, a large fraction of joint replays switched directionalitywhen “passing” the junctions of the two represented arms, im-plying the encoding of the choice point location in replaydirectionality.
We then asked whether joint replays with opposing biasesdisplayed random combinations or whether instead they obeyedan organizing principle. Strikingly, a far greater fraction of re-plays was reverse followed by forward (30.5%) rather thanforward followed by reverse (0.8%). Comparing different direc-tionalities for the joint replay segments separately, we found thatconsistently across stopping periods throughout a session, thefirst segment tended to be reverse (Fig. 4F, top) and the secondsegment tended to be forward (Fig. 4F, bottom). This consistencywas maintained across replays initiated in different arms (Fig. 4F,overbar). This pattern of organization was consistent across thethree animals. That is, for each of the three rats it was found thatfirst segments were significantly more reverse than forward (p �10�4 in each rat; Fig. 4G, top), whereas second segments weresignificantly more forward than reverse (p � 0.001 in each rat;Fig. 4G, bottom). Given the bias for replay to start from thecurrent location and proceed along multiple trajectories, thesedata suggest replays of the most immediate behavior were mostlyreverse, while more diversified and distant replays were mostlyforward.
Figure 3. The same group of cells fired during common segments of joint replays. A, B, Two hypotheses of how joint replaysmight be encoded. A, Three independent populations of place cells with three separate sequences of place fields on the Y maze.Each pair of joint arms is encoded by a separate sequence. B, Joint replays were generated by a neuronal network that captures thespatial structure of the Y maze. The common segment of each pair of joint replays is generated by two different groups ofcells in A and the same group of cells in B. C, Mean firing rates of cells from Rat 1 during the common segment C of joint CR(blue) and CL (magenta) replays. The included cells fired at least one spike during the C part of at least one CR or CL replay.Note that firing rates for the two replay types are highly similar across cells. D, E, F, Solid curves show cumulativedistributions of absolute differences between the mean firing rates of cells during the common segments of paired jointreplays (e.g., the blue and magenta curves in C). Dashed curves show distributions calculated from 5000 shuffles in whichreplay types (e.g., CR and CL) were randomized.
6464 • J. Neurosci., May 7, 2014 • 34(19):6459 – 6469 Wu and Foster • Hippocampal Replay Captures Topological Structure

Ripples were specifically associated with arms duringjoint replaysIn a 10-m-long linear track, Davidson et al. (2009) observed ex-tended replays covering several meters of the track, which wereassociated with multiple ripple events. Their findings suggestedthat replays in a large environment were not only extended induration but furthermore were composed of discrete, shortersubevents. Considering the Y maze as a relatively large environ-ment consisting of spatially distinct segments (the three arms),we wondered whether replay sequences would be associated withmultiple ripple subevents, and whether these events would ex-hibit a correspondence with the maze structure. Indeed, a major-ity of joint replays (79.5%) were accompanied by more than oneripple event (median � two ripple events; Fig. 5). Moreover, jointreplays representing the longer CL and RL trajectories were sig-nificantly longer and contained significantly more ripples thanthose representing the shorter CR trajectory (mean duration: CR,193.2 � 3.7 ms; CL, 234.9 � 13.7 ms; t(200) � �4.1, p � 10�4; andRL, 236.8 � 7.4 ms; t(227) � �5.7, p � 10�7; mean ripple num-ber: CR, 2.2 � 0.1; CL, 2.6 � 0.2; t(200) � �1.8, p � 0.068; and RL,2.7 � 0.2; t(227) � �2.9, p � 0.004, two-sided two-sample t tests),
Figure 5. Joint replays were associated with multiple ripples. The number of ripples de-tected during each joint replay (during the joint trajectory-specific subregion) was plottedagainst the duration (subregion length) of each replay, with each replay type plotted in adifferent color. For visualization purpose only, random noise was added to ripple numbers.Horizontal lines on left indicate mean ripple numbers. Histograms of replay durations are shownat bottom. Diagonal lines show linear regressions based on each replay type.
A
F G
B C D E
Figure 4. Joint replay directionality. A, The junction of the three arms is the choice point. Running toward the choice point is “inbound,” and running away is “outbound.” B–E,Examples of joint replay with different combinations of directionalities from Rat 1. Horizontal dashed lines indicate arm boundaries. Black diamond shapes mark the location of the ratwhen each replay occurred. The color scale is set so that maximally saturated colors correspond to the largest position probability of each replay. B, A consistent reverse replay of CR. C,A consistent forward replay of RL. D, A CR replay with a reverse C segment followed by a forward R segment. E, An RL replay with a reverse R segment followed by a mixed L segment. F,Each bar shows, for all joint replays with at least one directional segment identified during each stopping period, the percentage of the first segments (top) or the second segments(bottom) with each directionality type (see legend). The joint replay number and location of each stopping period are shown in the overbar. Data are from Rat 1. G, Percentages calculatedfor all stopping periods combined, for the three rats separately. The total number of joint replays (with at least one directional segment) is shown in each bar plot for each rat. For eachof the three rats, it was found that first segments were significantly more reverse than forward: Rat 1: reverse, 0.58 � 0.06; forward, 0.13 � 0.05; t(52) � 6.0; p � 10 �6; Rat 2: reverse,0.67 � 0.11; forward, 0; t(16) � 6.1; p � 10 �4; Rat 3: reverse, fraction of reverse play � 0.77 � 0.07; forward, 0.05 � 0.04; t(52) � 9.1; p � 10 �11. For each of the three rats, it wasalso found that the second segments were significantly more forward than reverse: Rat 1: reverse, 0.11 � 0.03; forward, 0.44 � 0.06; t(52) � �5.2; p � 10 �5; Rat 2: reverse, 0.01 �0.01; forward, 0.47 � 0.11; t(16) � �4.3; p � 10 �3; Rat 3: reverse, 0.00 � 0.00; forward, 0.63 � 0.08; t(52) � �7.5; p � 10 �9.
Wu and Foster • Hippocampal Replay Captures Topological Structure J. Neurosci., May 7, 2014 • 34(19):6459 – 6469 • 6465
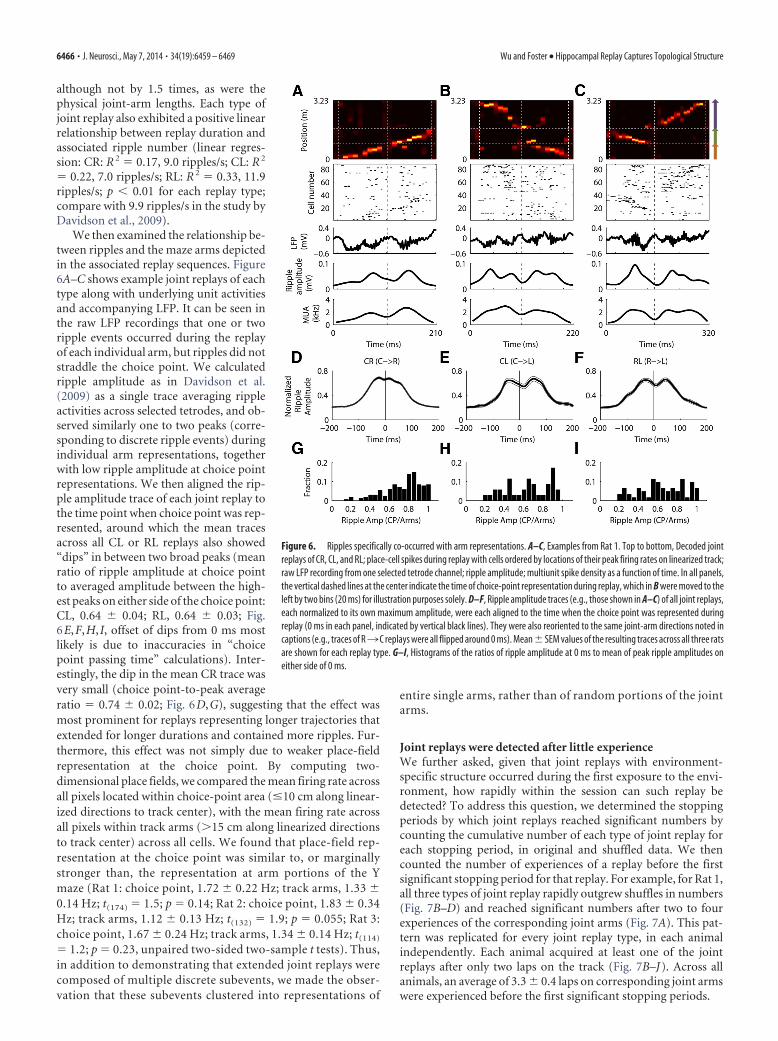
although not by 1.5 times, as were thephysical joint-arm lengths. Each type ofjoint replay also exhibited a positive linearrelationship between replay duration andassociated ripple number (linear regres-sion: CR: R 2 � 0.17, 9.0 ripples/s; CL: R 2
� 0.22, 7.0 ripples/s; RL: R 2 � 0.33, 11.9ripples/s; p � 0.01 for each replay type;compare with 9.9 ripples/s in the study byDavidson et al., 2009).
We then examined the relationship be-tween ripples and the maze arms depictedin the associated replay sequences. Figure6A–C shows example joint replays of eachtype along with underlying unit activitiesand accompanying LFP. It can be seen inthe raw LFP recordings that one or tworipple events occurred during the replayof each individual arm, but ripples did notstraddle the choice point. We calculatedripple amplitude as in Davidson et al.(2009) as a single trace averaging rippleactivities across selected tetrodes, and ob-served similarly one to two peaks (corre-sponding to discrete ripple events) duringindividual arm representations, togetherwith low ripple amplitude at choice pointrepresentations. We then aligned the rip-ple amplitude trace of each joint replay tothe time point when choice point was rep-resented, around which the mean tracesacross all CL or RL replays also showed“dips” in between two broad peaks (meanratio of ripple amplitude at choice pointto averaged amplitude between the high-est peaks on either side of the choice point:CL, 0.64 � 0.04; RL, 0.64 � 0.03; Fig.6E,F,H, I, offset of dips from 0 ms mostlikely is due to inaccuracies in “choicepoint passing time” calculations). Inter-estingly, the dip in the mean CR trace wasvery small (choice point-to-peak averageratio � 0.74 � 0.02; Fig. 6D,G), suggesting that the effect wasmost prominent for replays representing longer trajectories thatextended for longer durations and contained more ripples. Fur-thermore, this effect was not simply due to weaker place-fieldrepresentation at the choice point. By computing two-dimensional place fields, we compared the mean firing rate acrossall pixels located within choice-point area (�10 cm along linear-ized directions to track center), with the mean firing rate acrossall pixels within track arms (�15 cm along linearized directionsto track center) across all cells. We found that place-field rep-resentation at the choice point was similar to, or marginallystronger than, the representation at arm portions of the Ymaze (Rat 1: choice point, 1.72 � 0.22 Hz; track arms, 1.33 �0.14 Hz; t(174) � 1.5; p � 0.14; Rat 2: choice point, 1.83 � 0.34Hz; track arms, 1.12 � 0.13 Hz; t(132) � 1.9; p � 0.055; Rat 3:choice point, 1.67 � 0.24 Hz; track arms, 1.34 � 0.14 Hz; t(114)
� 1.2; p � 0.23, unpaired two-sided two-sample t tests). Thus,in addition to demonstrating that extended joint replays werecomposed of multiple discrete subevents, we made the obser-vation that these subevents clustered into representations of
entire single arms, rather than of random portions of the jointarms.
Joint replays were detected after little experienceWe further asked, given that joint replays with environment-specific structure occurred during the first exposure to the envi-ronment, how rapidly within the session can such replay bedetected? To address this question, we determined the stoppingperiods by which joint replays reached significant numbers bycounting the cumulative number of each type of joint replay foreach stopping period, in original and shuffled data. We thencounted the number of experiences of a replay before the firstsignificant stopping period for that replay. For example, for Rat 1,all three types of joint replay rapidly outgrew shuffles in numbers(Fig. 7B–D) and reached significant numbers after two to fourexperiences of the corresponding joint arms (Fig. 7A). This pat-tern was replicated for every joint replay type, in each animalindependently. Each animal acquired at least one of the jointreplays after only two laps on the track (Fig. 7B–J). Across allanimals, an average of 3.3 � 0.4 laps on corresponding joint armswere experienced before the first significant stopping periods.
Figure 6. Ripples specifically co-occurred with arm representations. A–C, Examples from Rat 1. Top to bottom, Decoded jointreplays of CR, CL, and RL; place-cell spikes during replay with cells ordered by locations of their peak firing rates on linearized track;raw LFP recording from one selected tetrode channel; ripple amplitude; multiunit spike density as a function of time. In all panels,the vertical dashed lines at the center indicate the time of choice-point representation during replay, which in B were moved to theleft by two bins (20 ms) for illustration purposes solely. D–F, Ripple amplitude traces (e.g., those shown in A–C) of all joint replays,each normalized to its own maximum amplitude, were each aligned to the time when the choice point was represented duringreplay (0 ms in each panel, indicated by vertical black lines). They were also reoriented to the same joint-arm directions noted incaptions (e.g., traces of R3C replays were all flipped around 0 ms). Mean � SEM values of the resulting traces across all three ratsare shown for each replay type. G–I, Histograms of the ratios of ripple amplitude at 0 ms to mean of peak ripple amplitudes oneither side of 0 ms.
6466 • J. Neurosci., May 7, 2014 • 34(19):6459 – 6469 Wu and Foster • Hippocampal Replay Captures Topological Structure

DiscussionY maze structure was captured by individual neuron andpopulation activitiesIn this study, we asked whether and how hippocampal place-cellsequences would reflect the topological structure of an environ-ment of unpredictable shape, with the hypothesis that naviga-tionally useful sequences should capture this structure. We foundthat patterns of replay developed during the first exposure to anonlinear environment that matched the sequential structure ofthe environment. This structure included unique elements suchas bifurcated paths, and unequal lengths of the track arms. Mostimportantly, this nonlinear structure was captured at the level ofthe individual neurons. Spatially overlapping episodes (i.e., thecommon part of pairs of joint-arm traversals) were not replayedby independent populations of neurons, but by the same neuronswith the same firing rates. Hence, the neuronal activities appearto be effectively “stitched together” in a manner reflecting theshape of the maze. Since the structure of the maze was unpredict-able, these findings suggest that the neural network mechanismsresponsible for generating these place-cell sequences involvelearning.
The common coding scheme for spatially overlapping replaysmay have functional implications. Even though the animals tra-versed one joint-arm trajectory at a time, the separate runningexperiences were integrated in the brain so as to reflect the correctconnectivity among the three track arms. This observed propertyof replay implies the construction of a map-like hippocampal
representation of the navigational envi-ronment as a whole, which importantlyenables the “prediction of what leads towhat” (O’Keefe and Nadel, 1978) andconsequently flexible calculations of effi-cient routes between any two locationswithin the environment. This form of rep-resentation may support the generation ofnovel routes, such as short cuts, as well asappropriate generalization in the face ofchanges to the environment (e.g., effectivedetours to avoid novel obstacles). Such ascheme has clear advantages for naviga-tion over the unintegrated representationof separate experiences, as would be thecase if bifurcated paths were encoded bydifferent populations of neurons, sincethis scheme would only support the selec-tion of paths from the limited repertoireof encoded paths gained through directexperience. This observation made in therelatively simple Y-maze may imply a ba-sic coding scheme for more generalizedenvironments, whereby the hippocampusencodes the complete spatial structure, asopposed to separate running experiences.
Additionally, we found that joint re-plays were accompanied by multiple rip-ple events, confirming a recent findingthat extended replays may be composed ofdiscrete subevents (Davidson et al., 2009).Moreover, ripple occurrence was con-fined within the boundaries of joint replaysegments that represented individualarms, which suggested that the precisetimes at which ripples were generated
during replay were not random. Instead, one or more subeventswere closely clustered to represent linear components of the en-vironment, while longer intervals between clusters accurately sig-naled the location of the arm intersection, again matching thespatial structure of the Y maze. Furthermore, the difference inarm lengths was also reflected by replay, in that physically longertrajectories (CL and RL) were represented by replays longer induration, and correspondingly larger numbers of ripple events.The ratios of replay duration and ripple number between CL/RLreplays and CR replays did not exactly match the ratios of tracklengths (1.2 compared with 1.5), but this might have been due tosystematic bias in the measurement of longer sequences whenrecording from limited numbers of hippocampal neurons.
Implications of joint replay directionalityThe directionality of replay sequences, and the existence of bothforward and reverse sequences, have been reported previously forlinear tracks and linear trajectories (Lee and Wilson, 2002; Fosterand Wilson, 2006; Csicsvari et al., 2007; Diba and Buzsaki, 2007;Davidson et al., 2009). Here, we further show that replays of thelinear pieces of a more complex environment are also over-whelmingly directional. Previous reports of replay on an ex-tended track indicated that replays did not always represent aconsistent directionality, but could flip between forward and re-verse (Davidson et al., 2009). Here we also see direction flipping,which in fact predominated among joint replays, with the addi-tional finding that replay tended to flip direction around the
Figure 7. Joint replays reached significant numbers rapidly. A, The first 10 stopping periods of Rat 1 (recorded position). Thenumbers of candidate events found during each stopping period are noted next to the stopping periods. Red letters indicatethe stopping periods by which the noted types of replay first reached significant numbers. B–D, Each panel demonstrates how thenumber of observed replays outgrows those counted from shuffles (data from Rat 1). Dotted black lines, Cumulative numbers ofreplays detected from the original data. Gray shadings, Mean � SD of cumulative numbers of replays of the same type detectedfrom 5000 sets of shuffled data. Colored dotted lines, Monte Carlo p values of the original cumulative numbers: blue, p � 0.05 (notsignificant); red, p � 0.05 (significant). The numbers of laps run on corresponding joint-arms before the first significant stoppingperiods are noted in titles. E–J, Results for Rats 2 and 3 are shown in E–G and H–J.
Wu and Foster • Hippocampal Replay Captures Topological Structure J. Neurosci., May 7, 2014 • 34(19):6459 – 6469 • 6467

choice point, supporting the notion that replay captured theunique structure of the environment. We further found thatrather than the combination of forward and reverse componentsoccurring at random, there is a distinct organizational patternsuch that first segments of joint replays tended to be reverse, andsecond segments of joint replays tended to be forward. This find-ing combines in a fascinating way with two other findings in thistask. First, we find that replay tends to start in the current arm.Second, we find that successive replays during single stoppingperiods can proceed along different trajectories. Integratingacross these results, we can make the observation that joint re-plays tended to begin on the current arm and proceed in reverseorder, before switching at the choice point to proceed along ei-ther of the two other arms in forward order. This organizationsuggests that reverse and forward replays may have differentfunctions, with reverse replay representing a rewind of the imme-diate past, and forward replay representing the exploration ofalternative futures, perhaps for the purposes of planning futurebehavioral trajectories. It is important to distinguish this classifi-cation of forward and reverse based on the directional tuning ofplace fields during bidirectional running (i.e., replays extendingfrom point A to point B, or from point B to point A, can both beeither reverse or forward), as used in the original report of reversereplay (Foster and Wilson, 2006), from an alternative classifica-tion that has been used, based on whether replay extends alongthe same unidirectional running path imposed by the task, or theopposite, never experienced running direction (i.e., replays ex-tending from point A to point B are defined as forward, replaysextending from point B to point A are defined as reverse; Gupta etal., 2010).
Rapid occurrence of joint replaysRecurrent networks in the hippocampus have highly modifiablesynapses, which are likely to undergo rapid synaptic plasticityduring exploration (Buzsaki, 1989; Wilson and McNaughton,1994; Martin et al., 2000; O’Neill et al., 2010), giving rise to rap-idly reconfigured hippocampal circuits. Several computationalmodels of the hippocampus have established the feasibility ofusing experience-dependent synaptic plasticity to acquire novelsequences (Jensen and Lisman, 1996; Levy, 1996; Leibold andKempter, 2006; Molter et al., 2007; Koene and Hasselmo, 2008),in some cases after a single trial of behavioral experience. Consis-tent with these models, we found that joint replays were detectedin significant numbers after very few trials of experience. Forseveral reasons, these numbers of trials before significant replaywas detected are likely to be an overestimate. First, stopping pe-riod durations were at the discretion of the animal, and longerstopping periods would have increased the probability of observ-ing replay at earlier time points. Second, many single-arm replaysmay have been in fact joint replays for which one arm failed topass the detection threshold (Fig. 2F) because of inherent exper-imental limitations on our ability to measure replay, given thatthe number of neurons recorded represents only a tiny fraction ofthe total network. Rapid learning is a prominent feature of hip-pocampally dependent learning (Morris, 2001), and so the rapidlearning of replay sequences may play a fundamental role in hip-pocampal function.
Finally, while sequences can be encoded rapidly, they are alsorapidly fit into a structure that captures the sequential spatialstructure of the environment. Thus, while hippocampal replaymay be formed out of the experience of individual episodes, itsadaptive role may rather lie in the construction of predictiverepresentations to guide future behavior (Wood et al., 1999;
Frank et al., 2000; Schacter and Addis, 2007; Pfeiffer and Foster,2013). Determining the full relationship between hippocampalreplay and hippocampally dependent learning, memory, andplanning is a key future goal.
ReferencesBuckner RL (2010) The role of the hippocampus in prediction and imagi-
nation. Annu Rev Psychol 61:27– 48, C1–C8. CrossRef MedlineBuzsaki G (1989) Two-stage model of memory trace formation: a role for
“noisy” brain states. Neuroscience 31:551–570. CrossRef MedlineCarr MF, Jadhav SP, Frank LM (2011) Hippocampal replay in the awake
state: a potential substrate for memory consolidation and retrieval. NatNeurosci 14:147–153. CrossRef Medline
Csicsvari J, O’Neill J, Allen K, Senior T (2007) Place-selective firing contrib-utes to the reverse-order reactivation of CA1 pyramidal cells during sharpwaves in open-field exploration. Eur J Neurosci 26:704 –716. CrossRefMedline
Davidson TJ, Kloosterman F, Wilson MA (2009) Hippocampal replay ofextended experience. Neuron 63:497–507. CrossRef Medline
Diba K, Buzsaki G (2007) Forward and reverse hippocampal place-cell se-quences during ripples. Nat Neurosci 10:1241–1242. CrossRef Medline
Ego-Stengel V, Wilson MA (2010) Disruption of ripple-associated hip-pocampal activity during rest impairs spatial learning in the rat. Hip-pocampus 20:1–10. CrossRef Medline
Foster DJ, Knierim JJ (2012) Sequence learning and the role of the hip-pocampus in rodent navigation. Curr Opin Neurobiol 22:294 –300.CrossRef Medline
Foster DJ, Wilson MA (2006) Reverse replay of behavioural sequences inhippocampal place cells during the awake state. Nature 440:680 – 683.CrossRef Medline
Frank LM, Brown EN, Wilson M (2000) Trajectory encoding in the hip-pocampus and entorhinal cortex. Neuron 27:169 –178. CrossRef Medline
Gaffan D (1994) Scene-specific memory for objects: a model of episodicmemory impairment in monkeys with fornix transection. J Cogn Neuro-sci 6:305–320. CrossRef Medline
Gallistel CR (1990) The organization of learning. Cambridge, MA: MIT.Girardeau G, Benchenane K, Wiener SI, Buzsaki G, Zugaro MB (2009) Se-
lective suppression of hippocampal ripples impairs spatial memory. NatNeurosci 12:1222–1223. CrossRef Medline
Gupta AS, van der Meer MA, Touretzky DS, Redish AD (2010) Hippocam-pal replay is not a simple function of experience. Neuron 65:695–705.CrossRef Medline
Jadhav SP, Kemere C, German PW, Frank LM (2012) Awake hippocampalsharp-wave ripples support spatial memory. Science 336:1454 –1458.CrossRef Medline
Jensen O, Lisman JE (1996) Hippocampal CA3 region predicts memory se-quences: accounting for the phase precession of place cells. Learn Mem3:279 –287. CrossRef Medline
Ji D, Wilson MA (2007) Coordinated memory replay in the visual cortexand hippocampus during sleep. Nat Neurosci 10:100 –107. CrossRefMedline
Karlsson MP, Frank LM (2009) Awake replay of remote experiences in thehippocampus. Nat Neurosci 12:913–918. CrossRef Medline
Koene RA, Hasselmo ME (2008) Reversed and forward buffering of behav-ioral spike sequences enables retrospective and prospective retrieval inhippocampal regions CA3 and CA1. Neural Netw 21:276 –288. CrossRefMedline
Lee AK, Wilson MA (2002) Memory of sequential experience in the hip-pocampus during slow wave sleep. Neuron 36:1183–1194. CrossRefMedline
Leibold C, Kempter R (2006) Memory capacity for sequences in a recurrentnetwork with biological constraints. Neural Comput 18:904 –941.CrossRef Medline
Levy WB (1996) A sequence predicting CA3 is a flexible associator thatlearns and uses context to solve hippocampal-like tasks. Hippocampus6:579 –590. CrossRef Medline
Louie K, Wilson MA (2001) Temporally structured replay of awake hip-pocampal ensemble activity during rapid eye movement sleep. Neuron29:145–156. CrossRef Medline
Martin SJ, Grimwood PD, Morris RG (2000) Synaptic plasticity and mem-ory: an evaluation of the hypothesis. Annu Rev Neurosci 23:649 –711.CrossRef Medline
6468 • J. Neurosci., May 7, 2014 • 34(19):6459 – 6469 Wu and Foster • Hippocampal Replay Captures Topological Structure

Molter C, Sato N, Yamaguchi Y (2007) Reactivation of behavioral activityduring sharp waves: a computational model for two stage hippocampaldynamics. Hippocampus 17:201–209. CrossRef Medline
Montague PR, Dayan P, Sejnowski TJ (1996) A framework for mesen-cephalic dopamine systems based on predictive Hebbian learning. J Neu-rosci 16:1936 –1947. Medline
Morris RG (2001) Episodic-like memory in animals: psychological criteria,neural mechanisms and the value of episodic-like tasks to investigateanimal models of neurodegenerative disease. Philos Trans R Soc Lond BBiol Sci 356:1453–1465. CrossRef Medline
Nakazawa K, Quirk MC, Chitwood RA, Watanabe M, Yeckel MF, Sun LD,Kato A, Carr CA, Johnston D, Wilson MA, Tonegawa S (2002) Require-ment for hippocampal CA3 NMDA receptors in associative memory re-call. Science 297:211–218. CrossRef Medline
O’Keefe J, Dostrovsky J (1971) The hippocampus as a spatial map. Prelim-inary evidence from unit activity in the freely-moving rat. Brain Res 34:171–175. CrossRef Medline
O’Keefe J, Nadel L (1978) The hippocampus as a cognitive map. London:Clarendon.
Olton DS, Samuelson RJ (1976) Remembrance of places past: spatial mem-ory in rats. J Exp Psychol Anim Behav Process 2:97–116.
O’Neill J, Pleydell-Bouverie B, Dupret D, Csicsvari J (2010) Play it again:
reactivation of waking experience and memory. Trends Neurosci 33:220 –229. CrossRef Medline
Pfeiffer BE, Foster DJ (2013) Hippocampal place-cell sequences depict fu-ture paths to remembered goals. Nature 497:74 –79. CrossRef Medline
Schacter DL, Addis DR (2007) The cognitive neuroscience of constructivememory: remembering the past and imagining the future. Philos Trans RSoc Lond B Biol Sci 362:773–786. CrossRef Medline
Scoville WB, Milner B (1957) Loss of recent memory after bilateral hip-pocampal lesions. J Neurol Neurosurg Psychiatry 20:11–21. CrossRefMedline
Singer AC, Frank LM (2009) Rewarded outcomes enhance reactivation ofexperience in the hippocampus. Neuron 64:910 –921. CrossRef Medline
Steele RJ, Morris RG (1999) Delay-dependent impairment of a matching-to-place task with chronic and intrahippocampal infusion of the NMDA-antagonist D-AP5. Hippocampus 9:118 –136. CrossRef Medline
Tolman EC (1948) Cognitive maps in rats and men. Psychol Rev 55:189 –208. CrossRef Medline
Wilson MA, McNaughton BL (1994) Reactivation of hippocampal ensem-ble memories during sleep. Science 265:676 – 679. CrossRef Medline
Wood ER, Dudchenko PA, Eichenbaum H (1999) The global record ofmemory in hippocampal neuronal activity. Nature 397:613– 616.CrossRef Medline
Wu and Foster • Hippocampal Replay Captures Topological Structure J. Neurosci., May 7, 2014 • 34(19):6459 – 6469 • 6469