systems technology group and research division power ...€¦ · power-performance comparative...
TRANSCRIPT

Systems Technology Group and Research Division
© 2008 IBM CorporationHot Chips 2008 August 2008
Power-Performance Comparative Evaluationof Alternate Microarchitectures
Rick Eickemeyer, Michael Floyd, John Griswell, Alex Mericas, Balaram Sinharoy(IBM Systems and Technology Group)
Pradip Bose, Soraya Ghiasi, Hendrik Hamann, Hans Jacobson, Tom Keller, Victor Zyuban(IBM Research Division)
Acknowledgements: Brad McCredie & many others in processor/system design teams within IBM STG
+ members of the power-aware microarchitectures and systems departments within IBM Research

Systems and Technology Group + Research Division
© 2008 IBM Corporation2 | Hot Chips 2008 August 2008
Outline
Power Dissipation and Efficiency Basics
POWER4 vs. POWER5
POWER5 vs. POWER6
Roadrunner and Blue Gene System Efficiency
Conclusion
BACKUP: Looking Ahead: A Few Key Research Issues

Systems and Technology Group + Research Division
© 2008 IBM Corporation3 | Hot Chips 2008 August 2008
Server-Class Processor: Unconstrained Power
Issue Queues
32%
Completion Table9%
Dispatch6%
Other10%
Map Tables43%
IFU
6%
ISU
10%
LSU
19%
GX
1%
L2
23%
Clock Tree
10%
RAS
5%
FBC
3%
CIU
4%
ZIO
4%
FPU
5%Core Buffer
1%
FXU
4%IDU
3%L3 Tags
2%
Pre-silicon, POWER4-like superscalar design
D. Brooks, et. al. MICRO-03 (tutorial)L
3 D
ire
cto
ry/C
on
tro
l
L2 L2 L2
LSU LSUIFU
BXU
IDU IDU
IFU
BXU
FPU FPU
FX
U
FX
UISU ISU

Systems and Technology Group + Research Division
© 2008 IBM Corporation4 | Hot Chips 2008 August 2008
Processor Power Pie-Chart: Another View
High performance processors (prior/current generation) typically burn
most of their power in the clocked latches and arrays (registers,
caches).
9%
46%
12%
4%
28%
1%
Clks Dist
Latches
Logic
IO
Arrays
other
Pre-silicon ckt-sim based; assumes: no clock-gating
Example data
(taken from: Bose, Martonosi, Brooks: Sigmetrics-2001 Tutorial)

Systems and Technology Group + Research Division
© 2008 IBM Corporation5 | Hot Chips 2008 August 2008
Hotspots limit performance, reliability & increase costs
As we go forward (towards decreasing technology nodes):
- Hotspot factor (overhead) is likely continue to increase
- predictability of hotspots will be more difficult
(multicore, SoC, power / thermal management, variability etc.)
In addition: Non-uniform power distribution or hotspots aggravate
challenges significantly:
H. Hamann, from ISCA08 Tutorial
Non-uniform Power Distribution

Systems and Technology Group + Research Division
© 2008 IBM Corporation6 | Hot Chips 2008 August 2008
Metrics Overview: An architect’s View Performance metrics:
– delay (execution time) per instruction; MIPS
• CPI (cycles per instr): abstracts out the MHz
• SPEC (int or fp); TPM: factors in benchmark, MHz
energy and power metrics:
– joules (J) and watts (W)
joint metric possibilities (perf and power or temperature)
– watts (W): for ultra LP processors; also, thermal issues
– MIPS/W or SPEC/W ~ energy per instruction
• CPI * W: equivalent inverse metric
– MIPS2/W or SPEC2/W ~ energy*delay (EDP)
– MIPS3/W or SPEC3/W ~ energy*(delay)2 (ED2P)
– (Peak Temp) * (Execution Time)
us1us1+
us1
us2
us2-480
us3-1ghz
us3-1.4ghz
us3-1.7ghz
ppc620
p2scpower3-200mhz
power3+
power3-ii
power4
power4+
power5
19961997
19981999
20002001
20022003
0
2
4
6
8
10
12
14
16
sp
ec
int/w
att
19961997
19981999
20002001
20022003
0
5
10
15
20
25
30
sp
ec
int*
*3/w
(m
illio
ns
)
Com
paq A
lphaS
erve
r GS
Fujitsu
Prim
ePow
er20
00
HP S
uperDom
e-64
IBM
24-
way
p68
0
IBM
32-
way
p69
0
Sun E10
K
Sun F15
K
tpm
(T
PC
-C)/
Sy
ste
m W
atts
IBM
Sun
Single-core regime, through start of multi-cores
System-level perf/watt for commercial OLTP
is quite different from processor-level SPECint/watt !
Source: Berkeley CPU Center, spec.org, etc.
P. Bose, VLSI Design Conf. 2004
Jan. 2002
estimated from published
data for particular
assumed system
configurations

Systems and Technology Group + Research Division
© 2008 IBM Corporation7 | Hot Chips 2008 August 2008
Fundamental Efficiency Determinants
Fundamental microarchitectural knobs that determine efficiency
– optimal pipeline depth at the core-level
– optimal core complexity and number of cores
– type of clock-gating and power-gating (if applicable): coarse-grain vs. fine-grain
– adaptive microarchitectures: [to control unnecessary energy waste]
– etc…
Fundamental logic/circuit-level efficiency features
– support for clock-gating (area and verification-efficient)
– support for voltage and frequency scaling (performance, reliability and
verification-friendly)
– (Near)-optimal mix of low, medium and high-Vt devices
– area and power efficient latch design
– etc..

Systems and Technology Group + Research Division
© 2008 IBM Corporation8 | Hot Chips 2008 August 2008
Deducing Optimal Pipe DepthsV. Srinivasan et al., MICRO-35, 2002
00.10.20.30.40.50.60.70.80.9
1
710131619222528313437
Total FO4 Per Stage
Rel
ativ
e to
Opt
imal
FO
4
bipsbips^3/W
Power-performance optimal Performance optimal
SPEC2000 suite
Direction of shift of optimal point for commercial OLTP workloads
Direction of shift of optimal point
if leakage power component were to escalate

Systems and Technology Group + Research Division
© 2008 IBM Corporation9 | Hot Chips 2008 August 2008
Integrating Multiple Cores on Chip
With uniprocessor performance improvements slowing, multiple
cores per chip (socket) will help continue the exponential system performance growth
Exploit performance through higher levels of integration in chips,
modules, and systems
Invest power in chip-level performance rather than core performance
L3
Dir
ec
tory
/Co
ntr
ol
L2 L2 L2
LSU LSUIFU
BXU
IDU IDU
IFU
BXU
FPU FPU
FX
U
FX
UISU ISU
POWER 4: 2001180 nm, Cu, SOI
2 cores / chip
POWER 4+: 130 nm
POWER 5: 2004130 nm, Cu, SOI
2 cores / chip
2 way SMT / core
POWER5+: 90nm

Systems and Technology Group + Research Division
© 2008 IBM Corporation10 | Hot Chips 2008 August 2008
Adaptive Microarchitecture Principles
Basic concepts:
– use (i.e. power or clock) a storage, compute or interconnect (e.g. bus) resource only to the extent needed: adapt or reconfigure dynamically in tune with workload resources
• Predictive power-gating to reduce leakage
• Dynamic resizing of queues, buffers, caches
– dynamically change a bandwidth parameter to conserve power
• Adaptive fetch to minimize speculative waste
• Adaptive prefetch to conserve bus bandwidth and prefetch logic usage; reduce speculative waste (cache pollution)
• etc….
Issues that prevent widespread adoption in high-end processors:
– complexity (verification cost, overhead area/power)
– relatively small power savings, if performance loss is not tolerable
In general, dynamic voltage-frequency scaling (DVFS) offers the most efficient knob for power management

Systems and Technology Group + Research Division
© 2008 IBM Corporation11 | Hot Chips 2008 August 2008
Multithreaded Instruction Flow in Processor Pipeline(transition from POWER4 to POWER5)
MP ISS RF EA DC WB Xfer
MP ISS RF EX WB Xfer
MP ISS RF EX WB Xfer
MP ISS RF F6
Xfer
F6F6F6F6F6
CP
BR
LD/ST
FX
FPGroup Formation and
Instruction Decode
Instruction Fetch
Branch Redirects
Interrupts & Flushes
Out-of-Order Processing
WB
Fmt
D1 D2 D3 Xfer GDD0D0
Shared by two threads Resource used by thread 1Resource used by thread 0
Shared IssueQueues
CP
LSU0
FXU0
LSU1
FXU1
FPU0
FPU1
BXU
CRL
SharedExecution
Units
Read Shared Register Files
DynamicInstructionSelection
ThreadPriority
Group Formation,Instruction Decode,
Dispatch
SharedRegister
Mappers
Alternate
TargetCache
Branch Prediction
InstructionTranslation
InstructionCache
ProgramCounter
BranchHistory
Tables
ReturnStack
InstructionBuffer 1
InstructionBuffer 0
Write Shared Register Files
GroupCompletion
StoreQueue
DataCache
DataTranslation
L2Cache
IF BPICIF

Systems and Technology Group + Research Division
© 2008 IBM Corporation12 | Hot Chips 2008 August 2008
Energy Per Useful Instruction: POWER4+ vs. POWER5
ORACLE(p) TPCC(i) SAP(i) NOTES(i)0
100
200
300
400
500
Pe
r U
se
ful I
ns
tru
cti
on
Re
lati
ve
En
erg
y
P4 + P5 ST P5 SM T (no ga ting) P5 SM T (c loc k -ga te d)
Steady growth in single-thread performance:
• POWER4 POWER4+ POWER5
Efficient throughput increase in POWER5:
• typical OLTP:
40 % IPC growth at 20 % more power

Systems and Technology Group + Research Division
© 2008 IBM Corporation13 | Hot Chips 2008 August 2008

Systems and Technology Group + Research Division
© 2008 IBM Corporation14 | Hot Chips 2008 August 2008
Active Power Savings from Clock-Gating (% over baseline) (POWER5: pre-silicon projections)
STSMT
Note: post-silicon hardware-based analysis shows good agreement at the chip level
0
10
20
30
40
50
60
70
80
% power savings
over baseline
Notes (i) SAP (i) TPC-C (i) TPC-C(p) DAXPY SparseMV TPP
IFU
IDU
ISU
FXU
LSU
FPU
Core

Systems and Technology Group + Research Division
© 2008 IBM Corporation15 | Hot Chips 2008 August 2008
P. Chaudhary, SPSICOMP, Mar. 2008

Systems and Technology Group + Research Division
© 2008 IBM Corporation16 | Hot Chips 2008 August 2008
Benefit of Fine-Grain Clock Gating in POWER6 pre-silicon simulation
0
0.1
0.2
0.3
0.4
0.5
0.6
0.7
0.8
0.9
1
amm
gc
perlb
m
swim
tpcc
ora
trade
2ej
daxp
ydo
t fftrfc
thpo
p
lbm
hd
)rfcth(
ST
)pop(
ST
)lbm
hd(S
T
)daxp
y(ST
Power reduction due to
clock-gating (average)
– Floating point kernels 19%
– SPEC2K 24%
– Commercial 26%
– RFCTH 20%
– POP 25%
– LBMHD 23 %
SMT runs
unconstrained, max (normalized to 1)
RFCTH is as “hot” as
daxpy; POP is similar
To SPEC2K averageLeakage power
ST runs
Daxpy clock-gating factors – validated via direct post-silicon measurements

Systems and Technology Group + Research Division
© 2008 IBM Corporation17 | Hot Chips 2008 August 2008
Clock Gating – Temperature Benefit
Temperature Versus Frequency
60
70
80
90
100
110
120
130
140
150
3000 3200 3400 3600 3800 4000 4200 4400 4600 4800 5000
Frequency (MHz)
Te
mp
era
ture
(C
els
ius
)
DAXPY with Clock Gating DAXPY without Clock Gating
DAXPY without Clock Gating (estimated) NULL INS with Clock Gating
NULL INS without Clock Gating NULL INS without Clock Gating (estimated)
Prototype hardware, both cores good, real h/w measurements (POWER6)
Twarn
Tcrit

Systems and Technology Group + Research Division
© 2008 IBM Corporation18 | Hot Chips 2008 August 2008
Comparative Summary on Clock-Gating Efficiency
Clock gating benefit
– POWER4: performance-centric, with minimal clock-gating
– POWER5: SMT throughput boost, matched with fine-grain clock-gating to manage power
– POWER6: High frequency performance boost with aggressive, fine-grain clock-gating to manage power and thermals
Net: progressive improvement with POWER6 being the best

Systems and Technology Group + Research Division
© 2008 IBM Corporation19 | Hot Chips 2008 August 2008
Peak Temperature: SMT vs. CMP
335
340
345
350
355
360
365
STST
(area
enlar
ged)
SMT
SMT(o
nly ac
tivity
facto
r)
CMP
CMP (o
ne co
re rot
ated)
Ave
rage
Pea
k T
empe
ratu
re (
K)
3 heat-up mechanisms
Unit self heatingdetermined by the power density of the unit
Lateral thermal coupling between neighboring units
Global heating through TIM (thermal interface material), heat spreader, and heat sink
P. Bose, VLSI Design 2005, quoted from Y. Li, Z. Hu et al. 2004
SMT: area-efficient, thermally-efficient

Systems and Technology Group + Research Division
© 2008 IBM Corporation20 | Hot Chips 2008 August 2008
A brief look now at a different system product space ….

Systems and Technology Group + Research Division
© 2008 IBM Corporation21 | Hot Chips 2008 August 2008
D. Grice, SCICOMP-14, March 2008; http://www.spscicomp.org/

Systems and Technology Group + Research Division
© 2008 IBM Corporation22 | Hot Chips 2008 August 2008
Hardware Integration in BlueGene/L:System-on-a-Chip ASIC
• IBM CU-11, 0.13 µm
• 11 x 11 mm die size
• 25 x 32 mm CBGA
• 474 pins, 328 signal
• 1.5/2.5 Volt
Integrated functionality• Two PPC 440 cores• Two “double FPUs”• L2 and L3 caches• Torus network• Tree network• JTAG• Performance counters• EDRAM

Systems and Technology Group + Research Division
© 2008 IBM Corporation23 | Hot Chips 2008 August 2008
Green500
Rank
MFLOPS/Watt Computer
(all IBM)
Total Power
(kW)
Top 500
Rank
1 488.14 Roadrunner
BladeCenter
QS2 –PowerXCell 8i
22.76 324
1 488.14 Roadrunner 18.97 464
3 437.43 Roadrunner 2345.50 1
4 371.75 Blue
Gene/P
31.50 304
4 371.75 BG/P 31.50 305
4 371.75 BG/P 94.50 306
7 371.67 BG/P 63.00 52
7 371.67 BG/P 94.50 75
7 371.67 BG/P 126.00 51
7 371.67 BG/P 63.00 37
The Green500 Top 10 (http://www.green500.org)
Systems and Technology Group + Research Division
© 2008 IBM Corporation24 | Hot Chips 2008 August 2008
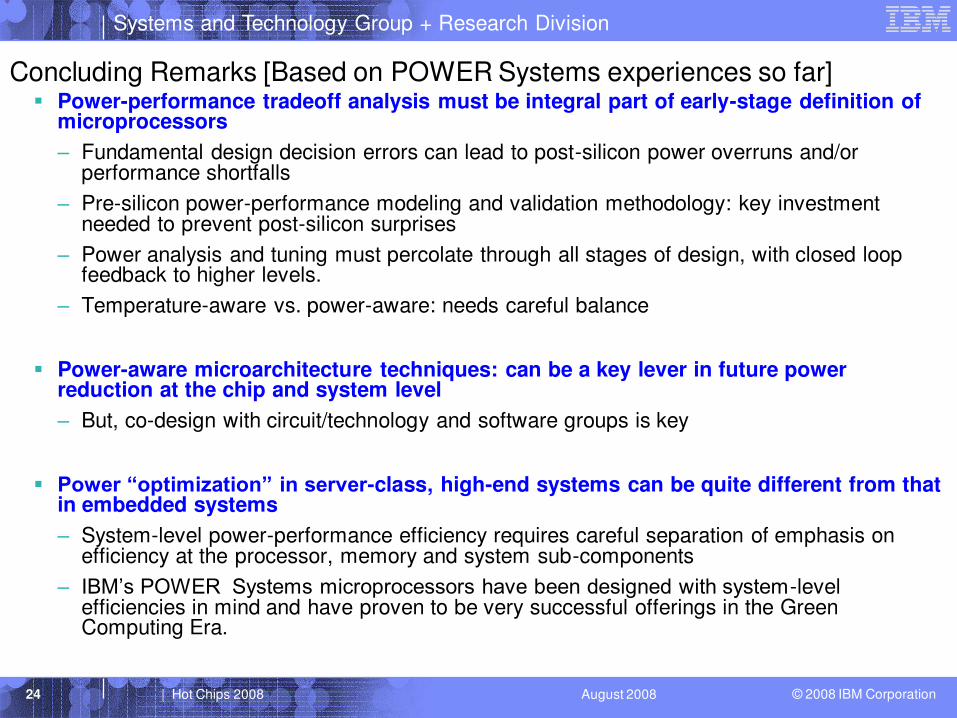
Concluding Remarks [Based on POWER Systems experiences so far] Power-performance tradeoff analysis must be integral part of early-stage definition of
microprocessors
– Fundamental design decision errors can lead to post-silicon power overruns and/or performance shortfalls
– Pre-silicon power-performance modeling and validation methodology: key investment needed to prevent post-silicon surprises
– Power analysis and tuning must percolate through all stages of design, with closed loop feedback to higher levels.
– Temperature-aware vs. power-aware: needs careful balance
Power-aware microarchitecture techniques: can be a key lever in future power reduction at the chip and system level
– But, co-design with circuit/technology and software groups is key
Power “optimization” in server-class, high-end systems can be quite different from that in embedded systems
– System-level power-performance efficiency requires careful separation of emphasis on efficiency at the processor, memory and system sub-components
– IBM’s POWER Systems microprocessors have been designed with system-level efficiencies in mind and have proven to be very successful offerings in the Green Computing Era.
Systems and Technology Group + Research Division
© 2008 IBM Corporation25 | Hot Chips 2008 August 2008
BACKUP: Some Key Research Issues of the Future

Systems and Technology Group + Research Division
© 2008 IBM Corporation26 | Hot Chips 2008 August 2008
Advancing the State-of-the-Art in Clock Gating
M1-level simulation (FPU)
– Transparent clock gated pipeline
FPU0 with Shallow Pipeline Morph (TSP)
0
10
20
30
40
50
60
70
80
90
100
fldax
py_f
lddivide
_TSP5
fldax
py_f
lddo
t_TSP5
fldax
py_f
ldfft
_TSP5
fldax
py_f
ldi4l0
1_TSP5
fldax
py_f
ldi4l0
2_TSP5
fldax
py_f
ldi4l2
0_TSP5
fldax
py_f
ldi4l2
3_TSP5
fldax
py_f
ldi4l2
9_TSP5
fldax
py_f
ldi4l3
5_TSP5
fldax
py_f
ldi4l4
1_TSP5
fldax
py_f
ldi4l4
2_TSP5
fldax
py_f
ldi4l4
3_TSP5
fldax
py_f
ldi4l5
9_TSP5
fldax
py_f
ldi4l5
9_p6
_TSP
5
fldax
py_f
ldi4l6
3_TSP5
fldax
py_f
ldi4m
atb_T
SP5
fldax
py_f
ldsq
rt_TSP
5
fldax
py_f
linti4
l02_
TSP5
fldax
py_f
lki4
l04_
TSP5
fldax
py_f
lki4
l05_
TSP5
fldax
py_f
lki4
l09_
TSP5
fldax
py_f
lmi4ld
0stm
2_TSP5
fldax
py_f
lmi4ld
1_TSP5
fldax
py_f
lmi4ld
16st
1_TSP5
fldax
py_f
lmi4ld
3stm
1_TSP5
fldax
py_f
lmi4ld
4st2
_TSP5
fldax
py_f
lmi4ld
4st2
_p6_
TSP5
fldax
py_f
lmi4ld
4st2
_sto
nly_T
SP5
fldax
py_f
lsdi
vide
_TSP5
fldax
py_f
lsi4
l41_
TSP5
fldax
py_f
lsi4
l42_
TSP5
fldax
py_f
lssq
rt_TS
P5
Clo
ck P
ow
er
in %
vs.
traditio
nal sta
ge-l
evel clo
ck g
ating
FPU0
0
10
20
30
40
50
60
70
80
90
100
aix_tpccora51_TSP5
as400_cpw252_TSP5
tpcc_db2-tpcc_TSP5
as400_testn3_TSP7
as400_trade2ejb52_TSP7
as400_testt_TSP7
as400_trade2ejb52j_TSP7
Clo
ck p
uls
es in
% f
or
TC
G v
s. o
paq
clk
gati
ng
FPU1
0
10
20
30
40
50
60
70
80
90
100
aix_tpccora51_TSP5
as400_cpw252_TSP5
tpcc_db2-tpcc_TSP5
as400_testn3_TSP6
as400_trade2ejb52_TSP6
as400_testt_TSP6
as400_trade2ejb52j_TSP5
FLTLOOPS
Commercial / TPC-C
Ref: H. Jacobson et al., ISLPED04, HPCA-05

Systems and Technology Group + Research Division
© 2008 IBM Corporation27 | Hot Chips 2008 August 2008
Dynamic mgmt of power, temperature, noise, reliability, performance….
Across-die monitored variability )in perf, power, temp, Vdd, …) will increase in themulti/many-core area. Effective control and management will require integrated,hierarchical, closed-loop feedback control mechanisms
•On-chip controller can also serveas static (v,f) setting device for effective yield and good baselineperformance•Per-core DFVS: costly and requiresasync interfaces to bus/fabric; alsofurther exacerbates soft error rates•Control loop stability issues mustbe analyzed (pre-silicon)•Simple, scalable global DVFS control algorithms: optimize perf for given power budget
Per-core power/perfinformation
Global Monitoring and Control
GLOBAL MANAGEMENT
Chip power budgetThread-core affinities
Global power/perf
information
Per-core power modes
OS
Application
Local Monitoring and Control
Thread/Resource
scheduling
Load balancing
Virtual
Machine
C. Isci, A. Buyuktosunoglu, C-Y-Cher, P. Bose, M. Martonosi, MICRO-39, 2006

Systems and Technology Group + Research Division
© 2008 IBM Corporation28 | Hot Chips 2008 August 2008
POWER6 Chip Overview
Ultra-high frequency dual-core chip
– 7-way superscalar, 2-way SMT core
– 9 execution units
• 2LS, 2FP, 2FX, 1BR, 1VMX,1DFU
– 790M transistors
– Up to 64-core SMP systems
– 2x4MB on-chip L2
– 32MB On-chip L3 directory and controller
– Two memory controllers on-chip
– Recovery Unit
Technology
– CMOS 65nm lithography, SOI
High-speed elastic bus interface at 2:1 freq
– I/Os: 1953 signal, 5399 Power/Gnd
Core
Core
L2
Ctrl
L2
Ctrl
L2
Data
L2
Data
L2
DataL2
Data
L3Ctrl
L3
Ctrl
MemCtrl
MemCtrl
I/O
CtrlSMP
Interconnect
RU
RUResearch Issue: power-efficient RAS microarchitecture
in the face of increasing SER and other sources of unreliability
K. Reick et al. Hot Chips-2007

Systems and Technology Group + Research Division
© 2008 IBM Corporation29 | Hot Chips 2008 August 2008
POWER5 Hotspot Patterns
Thermal map Power map
-50 different workloads for POWER5 imaged & analyzed•HotGen microbenchmark generator tool
- observed significant differences in circuit utilization
(H. Hamann et al., ISSCC-2006)
Systems and Technology Group + Research Division
© 2008 IBM Corporation30 | Hot Chips 2008 August 2008
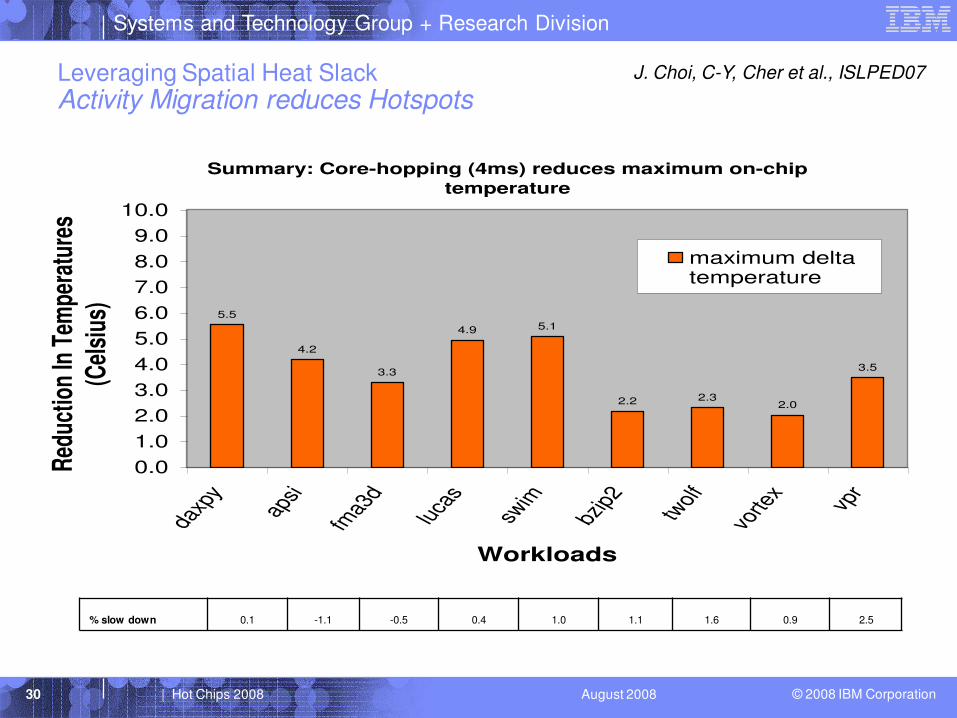
Leveraging Spatial Heat SlackActivity Migration reduces Hotspots
% slow down 0.1 -1.1 -0.5 0.4 1.0 1.1 1.6 0.9 2.5
Summary: Core-hopping (4ms) reduces maximum on-chip
temperature
5.5
4.2
3.3
4.9 5.1
2.2 2.32.0
3.5
0.0
1.0
2.0
3.0
4.0
5.0
6.0
7.0
8.0
9.0
10.0
daxp
yap
si
fma3
dlu
cas
swim
bzip
2tw
olf
vorte
xvp
r
Workloads
Red
uctio
n In
Tem
pera
ture
s
(Cel
sius
)
maximum deltatemperature
J. Choi, C-Y, Cher et al., ISLPED07

Systems and Technology Group + Research Division
© 2008 IBM Corporation31 | Hot Chips 2008 August 2008
A Page from IBM EnergyScale for POWER6 Systemshttp://www-03.ibm.com/systems/power/hardware/whitepapers/energyscale.html