systems biology of osmotic shock in antibody producing...
TRANSCRIPT

SYSTEMS BIOLOGY OF OSMOTIC SHOCK IN ANTIBODY PRODUCING CELL LINES
Thomas R. Kiehl NSF Graduate Research Fellow, Rensselaer Polytechnic Institute, School of Science, Multidisciplinary Science Doctoral Program. This doctoral candidacy proposal is comprised of proposed work and current progress toward a doctoral dissertation in Multidisciplinary Science.
1. Abstract Osmolarity has a significant impact on the growth and productivity of industrial mammalian cell cultures. Over the course of a fed-batch culture the osmolarity can increase from ~290mOsm/kg to 500mOsm/kg (Zhu 2005). Osmolarity increases of this magnitude are detrimental to mammalian cell cultures, reducing viability by as much as 50% (Kurano 1990). However, increases in osmolarity can increase specific production rates of antibodies and other recombinant proteins by as much as twofold (Ozturk 1991). In order to engineer mammalian cells for optimal recombinant protein production it is necessary to have a full understanding of the cellular response to osmotic stress. Recent literature has shown the importance of the transcription factor TonEBP/NFAT5/OREBP in the cellular response to osmotic shock (Irarrazaba 2004, Lopez-Rodrıguez 2004, Neuhofer 2002). NFAT5 has been proposed as central to the cellular osmotic response (Dmitrieva 2005). The importance of this transcription factor has been demonstrated in a number of mammalian cell lines including MDCK, HeLa and COS-7. We hypothesize that NFAT5 also plays a significant role in industrially relevant Chinese hamster ovary (CHO) and murine hybridoma OKT3 cell lines. To test this hypothesis, I propose to develop a model and experimentally characterize the response. The activity of NFAT5 will be measured experimentally. The experimental data will be incorporated into a computational model describing the role of NFAT5 in the osmotic stress response. The modeling effort will focus on NFAT5’s relationship to the independent variable of osmolarity and to the dependant synthesis and uptake of osmolytes. The model will be used to determine what portion of the osmotic response can be accounted for solely by NFAT5 or if other factors or feedback loops are required to explain the observed dynamics. Additional experimental work will be performed, as time and resources allow, in order to more fully characterize the osmotic response. Targets of these explorations include upstream signaling components as well as downstream osmolyte accumulation.

2. Contents 1. ABSTRACT.................................................................................................... 1
2. CONTENTS.................................................................................................... 2
3. INTRODUCTION.......................................................................................... 3 3.1. WHAT IS SYSTEMS BIOLOGY?..................................................................... 3 3.2. MODEL SCOPE ............................................................................................ 4
3.2.1. Cell Culture Framework ...................................................................... 5 3.2.2. Transcription Factor Activation .......................................................... 6 3.2.3. Osmolyte Accumulation and Cell Volume ........................................... 9 3.2.4. Important Constants............................................................................. 9
3.3. PRELIMINARY MODEL............................................................................... 10 3.4. ADDITIONAL CONCEPTS............................................................................ 11
3.4.1. Signaling ............................................................................................ 11 3.4.2. Osmotic Pressure ............................................................................... 12
4. ADDITIONAL BACKGROUND ............................................................... 13 4.1. MODEL SYSTEMS FOR OSMOPROTECTIVE MECHANISMS........................... 13 4.2. YEAST MODEL.......................................................................................... 14 4.3. MAMMALIAN PATHWAY ........................................................................... 15
5. PROPOSED WORK.................................................................................... 16 5.1. OSMOTIC SHOCK EXPERIMENT .................................................................. 16 5.2. QUANTIFYING TONEBP ACTIVATION ....................................................... 16 5.3. QUANTIFYING SIGNALING ELEMENTS....................................................... 17 5.4. ITERATING ON THE MODEL ....................................................................... 19
6. ADDITIONAL METHODS AND PUBLISHED DATA.......................... 19 6.1. PHYSIOLOGICAL EFFECTS AND ANTIBODY PRODUCTION .......................... 19 6.2. SIGNALING................................................................................................ 20
6.2.1. Activity Assays ................................................................................... 21 6.2.2. Protein Quantitation Assays .............................................................. 22
6.3. EXPRESSION DATA.................................................................................... 22 6.4. OSMOLYTE ACCUMULATION..................................................................... 22
6.4.1. Glycerophosphocholine (GPC).......................................................... 23 6.4.2. GPC Assay ......................................................................................... 23 6.4.3. Betaine ............................................................................................... 23 6.4.4. Betaine Assay ..................................................................................... 23 6.4.5. Myo-Inositol....................................................................................... 24 6.4.6. Sorbitol............................................................................................... 24 6.4.7. Myo-inositol and Sorbitol Assays ...................................................... 24 6.4.8. Aldose Reductase Assay..................................................................... 24
6.5. OTHER METABOLIC BYPRODUCTS ............................................................ 24 6.5.1. Lactate................................................................................................ 24

7. REMARKS AND FUTURE DIRECTIONS.............................................. 25
8. REFERENCES............................................................................................. 26
9. APPENDIX I: OTHER PURSUITS........................................................... 30 9.1. PEPTIDE CLASSIFICATION ......................................................................... 30
9.1.1. Method ............................................................................................... 30 9.2. BIOCHEMICAL REACTION NETWORK EVOLUTION..................................... 31 9.3. BATCH CULTURE MODEL ......................................................................... 32
10. APPENDIX II: BOOK CHAPTER EXCERPT...................................... 35
11. APPENDIX III: EVOLVING BIOCHEMICAL REACTION NETWORKS: FIRST STEPS............................................................................ 36
12. APPENDIX IV: HYBRID SIMULATION OF BIOCHEMICAL NETWORKS....................................................................................................... 37
13. APPENDIX V: SCOPE OF THE IET SYSTEMS BIOLOGY JOURNAL 38
3. Introduction Rensselaer’s multidisciplinary program is “designed for a new breed of student whose interests overlap several disciplines.” It is my hope that this proposal strongly reflects the ideals of this program. Within this proposal one will find diversified work ranging from the practical application of the workhorses of the biological sciences to the application and development of mathematical modeling tools. The work will also be informed by a partnership with chemical and biological engineering and a well-developed background in computer science and computational intelligence. This project is motivated by the rapidly growing markets for antibody related applications. Optimization of the complicated and expensive manufacturing processes is of key importance for making antibody-based tools and therapeutics more readily available. Our project is focused on the optimization of the organism itself which produces these antibodies. The ultimate goal of this work is a comprehensive model of the mammalian antibody production. On the way toward that view is a model of the cellular response to osmotic shock. This work is just one of the many necessary steps toward those goals. The idealized system-wide view would allow one to fully optimize the pertinent parameters affecting antibody production. This system-wide view is an important component of the vision of “systems biology.”
3.1. What is Systems Biology? To some, systems biology is a new, exciting, rapidly-evolving, field of study. At the other end of the spectrum, systems biology is simply another catch phrase for work that would be happening even if the phrase didn’t exist. I

suspect that there is truth in each of these observations. Indeed the biological sciences are experiencing a renaissance of sorts with enormous amounts of information becoming available every day through the use of tools and capabilities which are developing at heretofore unfathomable rates.
“I am a Biologist, and I work on systems. I guess that makes me a Systems Biologist.” -Howard Berg, ICSB 2005
If you take some time to search out the various definitions which have been proffered (Kitano 2002, Hood 2003), you will find a few observable threads or themes that run through each of these descriptions. First, the notion of complexity is present in most of these descriptions indicating the need for new tools for deciphering the activity in these systems or making sense of the data that can be obtained from relevant experiments. Some of these descriptions use words like “components” or “levels” which are abstractions for objects that may contribute to the overall behavior of something larger; the system. The recognition of the need for and the contributions of computational tools, and even concepts or approaches, is also present in all of these descriptions. One of the strongest themes of systems biology is the cross-disciplinary approach. This portion of the description is unique among these themes in that it speaks to the people doing the work, not just to the tools or the biological questions to which they are applied. This simply recognizes that future progress will be enabled and enhanced by bringing the wisdom of a number of fields to bear on these problems. One could view an idealized systems biology exploration in light of an iterative cycle of experimental and computational work. Each of these phases would inform the next. Experimental work would provide further data to enhance the computational model. Hypotheses could be tested in-silico to determine what experimental technique would best refine the model, or provide the most useful information in regard to current data.
3.2. Model Scope This exploration seeks to lay the groundwork for a comprehensive systems view of antibody production. I expect to contribute a conceptual framework, experimental data and computational components. The experimental and computational results from this endeavor should be able to stand on their own. The framework utilized here should allow for the integration of future experimental and computational work. I propose an ordinary differential equation (ODE) model to capture the dynamics of interest of the cellular response to increased osmolarity. While some of the elements in the model will explicitly fit experimental data, other
“Systems biology is the study of the interactions between the components of biological systems, and how these interactions give rise to the function and behavior of that system (for example, the enzymes and metabolites in a metabolic pathway). A subtle variation of the standard scientific method, the systems biology approach is a cycle composed of theory, computational modelling to propose specific testable hypotheses, experimental validation, and then using the newly acquired quantitative description of cells or cell processes to refine the computational model or theory. Since the objective is a model of all the interactions in a system, the experimental techniques that most suit systems biology are those that are system-wide and attempt to be as complete as possible. Therefore, transcriptomics, metabolomics, proteomics and high-throughput techniques are used to collect quantitative data for the construction and validation of models.” – Wikipedia, Systems Biology Entry
Refine model
Experiment
In-silico experiment

portions of the model will neccesarily generalize many of the known biological phenomena. An initial model will capture three main concepts.
1. The insult of osmolarity within the context of the cell culture life-cycle 2. The dependence of TonEBP activation on osmolarity 3. TonEBP-dependant osmolyte accumulation.
The model will exist within the context of a general cell culture life-cycle and the experimental protocol for osmotic stress. Our interpretation of this context will determine how we set up the independent variables in the system, namely osmolarity and osmotic gradient.
3.2.1. Cell Culture Framework In the lab our cells are cultured in batch as opposed to the large fed-batch cultures used in industry. In fed-batch cultures osmolarity becomes problematic both due to the addition of nutrients as well as the production of waste products, primarily lactic acid. Lactic acid acidifies the culture, necessitating the addition of base to control the pH. In doing so, the osmolarity of the culture increases over time. The cell culture timeline, or life-cycle, has three main phases after inoculation. Initially there is a lag phase as the newly inoculated cells establish themselves. The culture will then progress through an exponential growth phase and will eventually reach stationary phase. In stationary phase cell growth slows. Accumulation of toxic waste products contributes to the decline of viability. In batch cultures the depletion of nutrients compounds these effects. As shown in figure 1, our experimental protocol, described in detail later, adds some significant events into the timeline. The phenomena observed during these stages are important to include in our model. . The model should incorporate important mechanisms from each of these phases. This includes activation of signaling pathways during osmotic shock. Gene regulation and observable volume changes which present themselves during the “adaptation” phase should also be included.
Figure 1. Abstraction of cell culture phases In defining the independent variables associated with osmotic shock there are two main avenues which will be pursued, the initial shock and the

ongoing stress. The model should capture these input signals which we conceive as being available for the cell to act upon. The initial shock and physical response may be available to some of the rapid signaling machinery maintained in the cell. As such, one of the inputs to the model should be a rapidly decaying signal as the osmotic gradient between the extracellular and intracellular environments is rapidly equilibrated as water leaves the cell. The cell is also subject to an ongoing insult of generally higher osmolarity of the environment. This input could take two forms depending on the culture conditions we would like to fit. For short term batch cultures, this variable will be relatively constant. For longer fed-batch cultures the osmolarity will increase over time. If either of these inputs are not necessary than we would expect our model to be able to capture all of the pertinent behaviors of the system without a dependency on one or the other of these inputs. Basic linear optimization techniques can be used to determine whether or not the system can be reduced.
3.2.2. Transcription Factor Activation Activation of our transcription factor (TonEBP) bridges the scales between the aforementioned osmotic shock and adaptation phases. Existing molecules will be activated as signaling cascades respond to the initial insult. As the cell continues to adapt, it may be necessary for the cell to manufacture more of the relevant transcription factor(s). The primary transcription factor of interest to us is NFAT5/TonEBP/OREBP. Please note that each of these names are interchangeable. This transcription factor has been shown to bind osmotic responsive elements to regulate transcription during an osmotic response (Miyakawa 1999). However Miyakawa does not show us a useful time course of activation. Their studies only show the activation levels after 18 hours of incubation in isotonic vs. hypertonic medium as shown in Figure 2. Furthermore, the absence of NFAT5 results in a lack of osmoresponsive gene expression as shown in mouse studies(Lopez-Rodriguez 2004).

Figure 2. Western blot of TonEBP after 18 hours of incubation in isotonic (I) and hypertonic (H) medium (Miyakawa 1999) NFAT5 is the focal point of the model and a primary point of investigation both experimentally and computationally. Experimentally it will be necessary to quantify the activation of NFAT5 during osmotic shock in our system. Computationally, we will incorporate the experimentally determined activation levels of NFAT5. The model must also incorporate the synthesis of new NFAT5. This additional manufacture is evident in a number of different publications (Miyakawa 1999, Zhang 2005). From these publications, figures 2 and 4 show evidence of this additional synthesis in proportion to incubation time and osmolarity. Figure 2 shows the dependence on time quite dramatically. It could be argued that Figure 4 qualitatively shows an increase in total intensity as a relation to osmolarity, even over a much shorter time scale. Another dynamic that will be important in the overall cellular response is the localization of activated NFAT5. Under conditions of osmotic stress, nuclear localization of NFAT5 is increased (Zhang 2005, Tong 2006). This indicates that two different pools of NFAT5 exist at any given time. A complete model should maintain a pool of inactive, cytoplasmic, NFAT5 as well as activated, nuclear, NFAT5. The dynamics of NFAT5 activation should include a generalization of the transport kinetics for the activated form. Figures 3 and 4 demonstrate the existence of these pools.
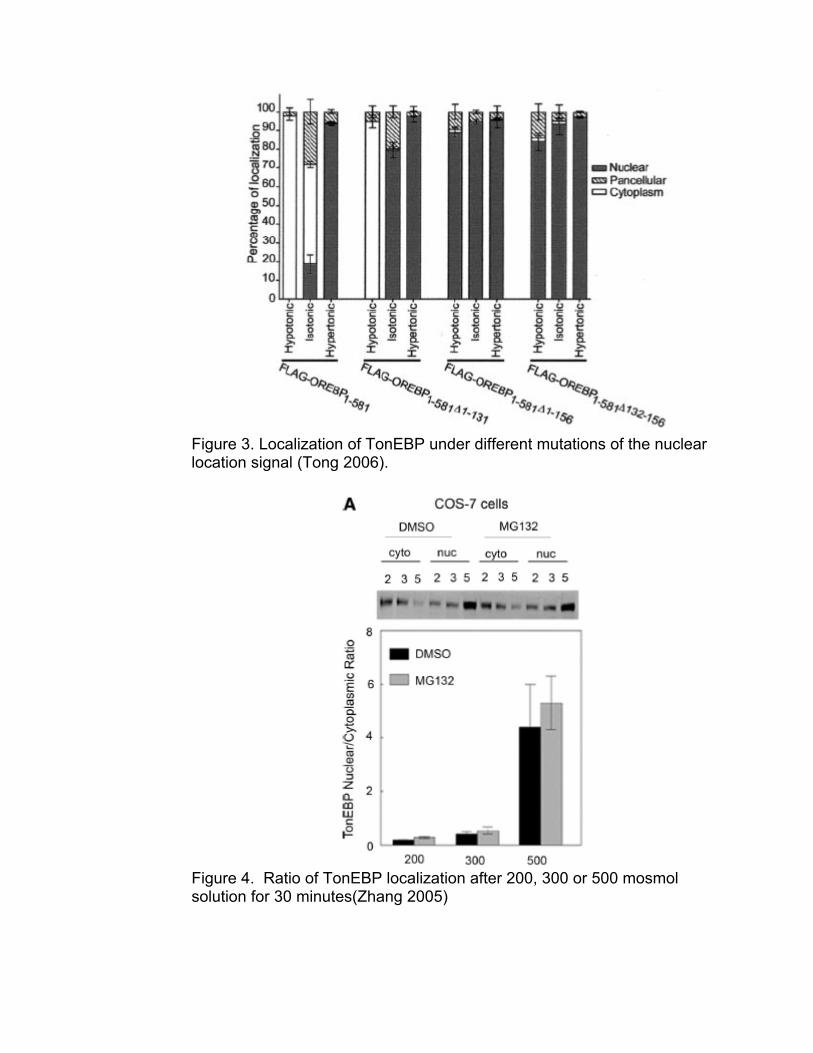
Figure 3. Localization of TonEBP under different mutations of the nuclear location signal (Tong 2006).
Figure 4. Ratio of TonEBP localization after 200, 300 or 500 mosmol solution for 30 minutes(Zhang 2005)

3.2.3. Osmolyte Accumulation and Cell Volume An initial, and accessible, proxy for osmolyte accumulation is cell volume. Cell volume can easily be quantified visually or by utilizing a FACs machine to perform forward light scattering (Bouvier 2001). Like many of the experiments described here we would be looking to determine relative volume changes over time and with respect to osmolarity. Initially we can utilize ratios expected from literature to scale the kinetic constants in our model. Of particular usefulness are measurements by Ozturk and Palsson which show time evolution of cell volume with respect to osmolarity (Ozturk 2001). Their results are shown in figure 5.
Figure 5. Cell volume vs. osmolarity and time. (Ozturk 2001) While later versions of this model should specifically fit data from osmolyte quantitation experiments, we expect that the accumulation of osmolytes should be strongly coupled to the changes in cell volume. See Section 6.4 for an extensive list of pertinent osmolytes and their respective quantitation methods.
3.2.4. Important Constants It should be noted that simulation constants can be estimated from literature sources or from our own experimental work. Using the data available from prior published work will help us to establish a baseline model. An example of such constants would simply be the half life of particular species. For example, the half life of TonEBP is approximately 10 hours (Na 2003). Such values are subject to the specific experimental conditions and cell lines. In cases where significant differences in conditions are understood, then these constants should be verified experimentally. Much of the experimental work in renal systems uses osmotic conditions which are an order of magnitude different from viable conditions for hybridoma or CHO cells. This opens up the possibility that much of the literature on osmotic shock in renal systems may not have significant bearing on the characterization of our hybridoma or CHO system. As such we will want to validate as much of the biological data being used in our model as possible.
(a) (b) (c)
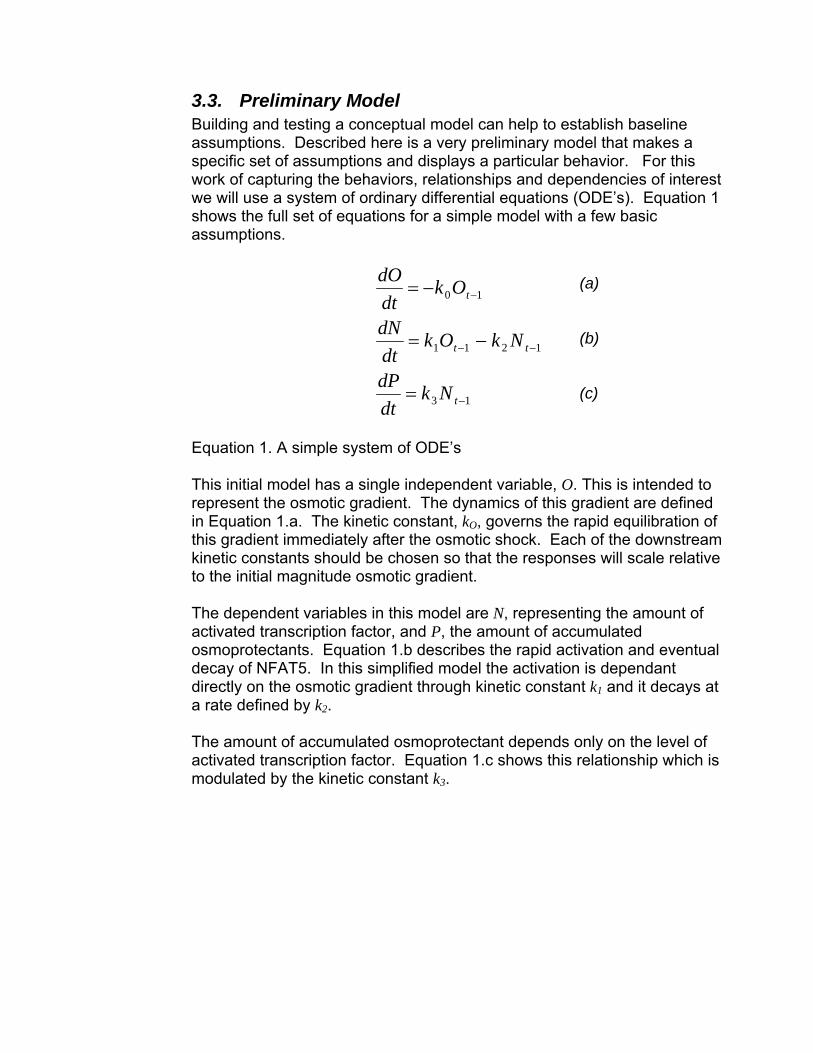
3.3. Preliminary Model Building and testing a conceptual model can help to establish baseline assumptions. Described here is a very preliminary model that makes a specific set of assumptions and displays a particular behavior. For this work of capturing the behaviors, relationships and dependencies of interest we will use a system of ordinary differential equations (ODE’s). Equation 1 shows the full set of equations for a simple model with a few basic assumptions.
13
1211
10
−
−−
−
=
−=
−=
t
tt
t
NkdtdP
NkOkdtdN
OkdtdO
Equation 1. A simple system of ODE’s This initial model has a single independent variable, O. This is intended to represent the osmotic gradient. The dynamics of this gradient are defined in Equation 1.a. The kinetic constant, kO, governs the rapid equilibration of this gradient immediately after the osmotic shock. Each of the downstream kinetic constants should be chosen so that the responses will scale relative to the initial magnitude osmotic gradient.
The dependent variables in this model are N, representing the amount of activated transcription factor, and P, the amount of accumulated osmoprotectants. Equation 1.b describes the rapid activation and eventual decay of NFAT5. In this simplified model the activation is dependant directly on the osmotic gradient through kinetic constant k1 and it decays at a rate defined by k2. The amount of accumulated osmoprotectant depends only on the level of activated transcription factor. Equation 1.c shows this relationship which is modulated by the kinetic constant k3.

Figure 6. Osmotic gradient, blue. Level of activated NFAT5, red. Accumulation of osmolytes, green. The overall behavior of the system is shown in figure 6. In a very general sense, this does seem to satisfy some of our intuition, but much is left to be desired in terms of fitting experimental data. One example of how this model is lacking is inherent in the single independent variable assumption. This assumption presumes that only the initial insult has an effect on the system. It is well understood that this is not the case and future development will need to add at least one other independent variable capturing the ongoing osmotic stress which the cell is subjected to.
3.4. Additional Concepts As time and resources permit additional variables will be added to the model based on experimental and published data. Each additional biological component for which we can acquire experimental data can be integrated in to the model and related to other appropriate variables in the system.
3.4.1. Signaling The first significant event after osmotic shock is the transduction of signals through the cell. Modeling the initial engagement of the cell’s information processing machinery can give important clues as to the mechanisms of control for the cell’s osmotic response. Biological experiments will be undertaken in an effort to characterize the pattern of activation during osmotic stress.
0 20 40 60 80 100 120 140 160 180 200-0.2
0
0.2
0.4
0.6
0.8
1
1.2Time course
Unitless Time
Rel
ativ
e co
ncen
tratio
ns

These pathways involve a number of common species. In particular we will be looking to quantitate the activation of various kinases. The specific species of interest are discussed in detail below. There are a number of questions we would like to be able to answer about the signaling component of the system. How is the signal transduced through the system? How do these signals connect to and effect transcription? How long do the signals remain active, and how are the signals quenched? Building a model on the principal data will give us a place to discover some of the boundaries of the system.
3.4.2. Osmotic Pressure The largest scale, physically as well as with respect to time, incorporated in this model is that of cell volume recovery. This recovery occurs on a scale of about 2 hours after osmotic shock (Ozturk 1991). Along with this recovery we should be able to determine the time course of osmotic pressure on a cell. How is osmolyte accumulation modulated by osmotic stress? The primary feedback loop in our system is dependant on osmolyte accumulation. As the cell is affecting the osmotic gradient it is also sensing it. One possible output for this model would be the time course for the osmotic gradient. This output would yield a measurable stopping condition. Cells detecting an osmotic gradient for a prolonged period of time must either adapt to that stress or remain in a stressed state. Longer term gene expression experiments show changes in expression profiles leading one to believe that the cell does not enter one persistant state during prolonged periods of stress. Determination of the time at which the cell stabilizes this volume and pressure can then be compared with the activity of the cell’s osmotic responses. Two of our primary references utilize the Boyle-Van’t Hoff relation (Van`t Hoff 1887, Nobel 1969) to interpret their biological data. Ozturk utilized this relation to describe the observed changes in cell volume (Ozturk 1991). Klipp also uses Boyle-Van’t Hoff for capturing the temporal evolution of the internal osmotic pressure in their yeast model (Klipp 2005). It is not immediately clear how to integrate this mechanism into our model.
00
0
0
1Vb
Vb
PP
VV
+⎟⎟⎠
⎞⎜⎜⎝
⎛−=
Equation 2. Boyle-Van’t Hoff for cell volume and osmotic pressure (Ozturk 1991)

( ) ( ) ⎟⎟⎠
⎞⎜⎜⎝
⎛−Π=Π
)()('
)()('
tVtV
tntntt
dtd os
ii
Equation 3. Boyle-Van’t Hoff and internal osmotic pressure (Klipp 2005)
4. Additional Background This work relies heavily on previous results from this lab and from literature. Data from various published sources, as it relates to our model, will be used as a part of the model or as a means to validate the model. Numerical approaches previously described will inform how our model is structured. There are three main sources of information which we will take advantage of. Firstly, previous osmotic stress literature, particularly related work on renal cells, will be an important source. Secondly, a previous model on the osmotic response of yeast will provide us with a scaffold for our modeling efforts. Thirdly, a recent review paper pointing out the major components of the mammalian pathway will provide our initial targets for experimental work. Each of these sources is described below. Another model which provides a useful reference, even though it is not directly related to osmotic stress, is a previously published model of IқB-NF-қB oscillations (Hoffmann 2002) and more recent developments (Nelson 2004). Such a model will be useful in an iterative process of testing various postulated hypotheses and directing experimental efforts towards the areas which will have significant impact on our ability to manipulate the physical system to achieve our desired results.
4.1. Model Systems for Osmoprotective Mechanisms Osmotic effects have been studied in great depth in a number different organisms. Renal cells provide an interesting mammalian system for the study of osmotic shock as they are one of a relatively few types of mammalian cells which live in an environment with widely fluctuating osmolarity. This fluctuation is well beyond the 300mOsm of plasma. For example, Neuhofer et al report ~800 mosomol/kgH2O of salt and over 1,000 mosomol/kgH2O of urea in rat renal medulla(Neuhofer 2002). Madin Darby Canine Kidney cells (MDCK) are commonly used in renal related research. Data from these papers will provide useful basis for modeling just as they have provided an indispensable resource for conceptual work. Fish and plants also must deal with varying osmotic pressures. Of particular interest are gill cells from euryhaline fish species. These fish species can adapt between fresh and salt water and it is therefore expected that their gill cells should exhibit unique osmoregulatory function. More information about osmoregulation in non-mammalian species can be found in Appendix II, which is my contribution excerpted from a recently published book chapter (Sharfstein, et al. 2007).
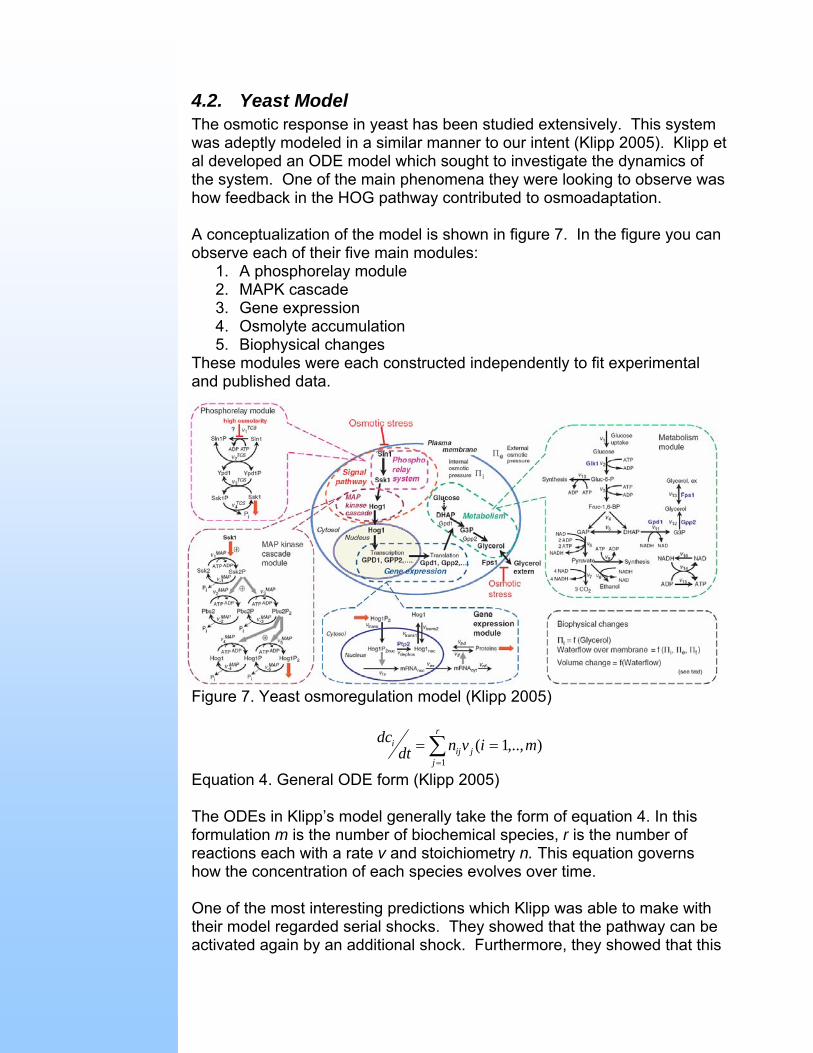
4.2. Yeast Model The osmotic response in yeast has been studied extensively. This system was adeptly modeled in a similar manner to our intent (Klipp 2005). Klipp et al developed an ODE model which sought to investigate the dynamics of the system. One of the main phenomena they were looking to observe was how feedback in the HOG pathway contributed to osmoadaptation. A conceptualization of the model is shown in figure 7. In the figure you can observe each of their five main modules:
1. A phosphorelay module 2. MAPK cascade 3. Gene expression 4. Osmolyte accumulation 5. Biophysical changes
These modules were each constructed independently to fit experimental and published data.
Figure 7. Yeast osmoregulation model (Klipp 2005)
∑=
==r
jjij
i mivndtdc
1),..,1(
Equation 4. General ODE form (Klipp 2005) The ODEs in Klipp’s model generally take the form of equation 4. In this formulation m is the number of biochemical species, r is the number of reactions each with a rate v and stoichiometry n. This equation governs how the concentration of each species evolves over time. One of the most interesting predictions which Klipp was able to make with their model regarded serial shocks. They showed that the pathway can be activated again by an additional shock. Furthermore, they showed that this

reactivation would not be possible if the pathway were structured such that the phosphatases provided the primary feedback control. They demonstrated that the gene transcripts for phosphatases should not increase by more than two-fold. This model provides us with a good scaffold after which to pattern our modeling efforts.
4.3. Mammalian Pathway Much of the planned work has been informed by a review paper from renal related literature (Dmitrieva 2005). This review sought to relate DNA damage and osmotic regulation. Shown in figure 8 is a conceptual view of some of the major components in this response.
Figure 8. Mammalian osmostress pathways (Dmitrieva 2005) This model can be separated into a few main stages. First, the signal transduction that takes place in response to the stimulus. In this stage, we also address activation of various kinases in the signaling pathways. Second, any change in gene expression that is controlled via the previous signal cascade. This portion of the model entails activation of transcription factors. Third, any accumulation of osmolytes or other significant changes in the proteomic profile of the cell. This portion of the model addresses the process of protein production and incorporates time constants which will capture transcription and translation, as well as any known post-translational processes. Finally, the osmolytes of interest are accumulated to balance the osmotic pressure. The work proposed will investigate many of the players outlined by Dmitrieva. The species of interest and the intended experimental methods are described below. In general terms, we are looking to map Dmitrieva’s conceptual model on to the structure provided by Klipp’s computational model. As such we will look to query many of the primary components of the physical system as described in the Dmitrieva paper.

5. Proposed Work I intend to undertake a number of experimental and numerical tasks to further develop and refine the model to a point where it accurately reflects our physical system.
5.1. Osmotic shock experiment All of the experimental work occurs within the context of osmotic shock. The samples for this work will be taken in accordance with the following protocol. Cells will be cultured into mid-exponential phase. Cells are cultured in MEM-alpha modified (CHO) or in IMDM (OKT3). The osmolarity of these media formulations is typically around 290mOsm, the standard accepted values for plasma, which makes these media isotonic w.r.t. plasma. At this point a pre-stress control sample will be taken and maintained in whatever buffer is required for the given assay. Osmotic shock is induced by increasing the osmolarity of the medium by 100 mOsm by the addition of NaCl. Samples are taken at 5, 10, 15, 30, 60 and 120 minutes after shock. This is our experimental handle on the independent variable in our model. Given our aforementioned assumption that the cells will respond proportionally to the magnitude of the stress, it will also be valuable to gather data from different levels of osmolarity. In this case the same protocol will be followed using a range of osmolarities. All subsequent data gathered from these samples will be indexed with respect to the induced osmolarity.
5.2. Quantifying TonEBP Activation Of primary importance is the quantification of transcription factor activation in our cell lines. Assays used in the literature such as Luciferase reporter plasmid (Na 2003; Irarrazabal 2004) and immunocytochemical (Na 2003) are not ideal when working with suspension cultures. ELISA techniques would be ideal but are currently unavailable for the specific transcription factor of interest. This leaves us with gel-shift techniques. We will be using an electrophoretic shift assay (EMSA) as utilized previously in literature (Irarrazabal 2004). I will be using a chemiluminescent EMSA kit from Pierce to measure the amount of available TonEBP over time. The kit from Pierce provides all the necessary reagents for the task excepting the biotin labeled DNA for the TonEBP concensus sequence. The TonEBP consensus binding sequence has been determined to be TGGAAANNYNY where N is any nucleotide and Y is any pyrimidine (Stroud 2002). Kojima et al utilized the sequence (5’-TGGAAAGGACCAG-3’), the tonicity response element from the Osp94 gene, for a similar EMSA analysis (Kojima 2004). Figure 9 shows the results from their EMSA.

For our analysis we will end up with a time sequence of slowly migrating bands. The relative intensities of these bands should be sufficient for estimating a curve of relative TonEBP availability. The kinetic constants in the model will be optimized to fit these curves. The numerical tools used to fit this data will depend on the order and linearity of the model. In the simplest case linear least squares will likely suffice. In addition to the time-dependant availability of TonEBP, we would like to further break this down into cytoplasmic and nuclear availability. The dynamics of the relationships between these curves will be analyzed to determine the kinetics of TonEBP activation in our system.
Figure 9. EMSA results, the slowly migrating band shows TonE/protein interaction (Kojima 2004).
5.3. Quantifying Signaling Elements We have already begun to measure some of the commonly expected signaling kinases. We are still in the process of optimizing two western blot kits from Cell Signaling Technologies for our application. We have some preliminary results which do show upregulation of species of interest in this system. In the process we have utilized both chemiluminscent and fluorescent secondary antibodies. The clearest result we have so far shows the increase of phosphorylated p53 in response to osmotic stress. Qualitatively we see, in figure 10, that p53 remains in this phosphorylated state throughout the duration of the stress experiment and is only slightly present in the control sample. Figure 11 shows previous results from literature which show similar results but at a different scale (Dmitrieva 2000).

Figure 10. This figure shows phosphorylated p53 presence in relation to osmotic shock (Kiehl unpublished results)
Figure 11. Changes in phosphorylated p53 in response to osmotic stress (Dmitrieva 2000) Working with another kit we have attempted to observe the state of a number of other kinases including SAPK, JNK, and HSP’s. We have not been able to get anything conclusive as of this writing, but we have shown that there are notable changes over time as shown in figure 12. Our goal as we continue to optimize this western blot is to get better separation and identification of the bands that appear more distinctly in those later time points as shown in the expanded portion of figure 12.
Figure 12. Initial results from SAPK/JNK Western blot
Control 5’ 10’ 15’ 30’ 60’ 120’
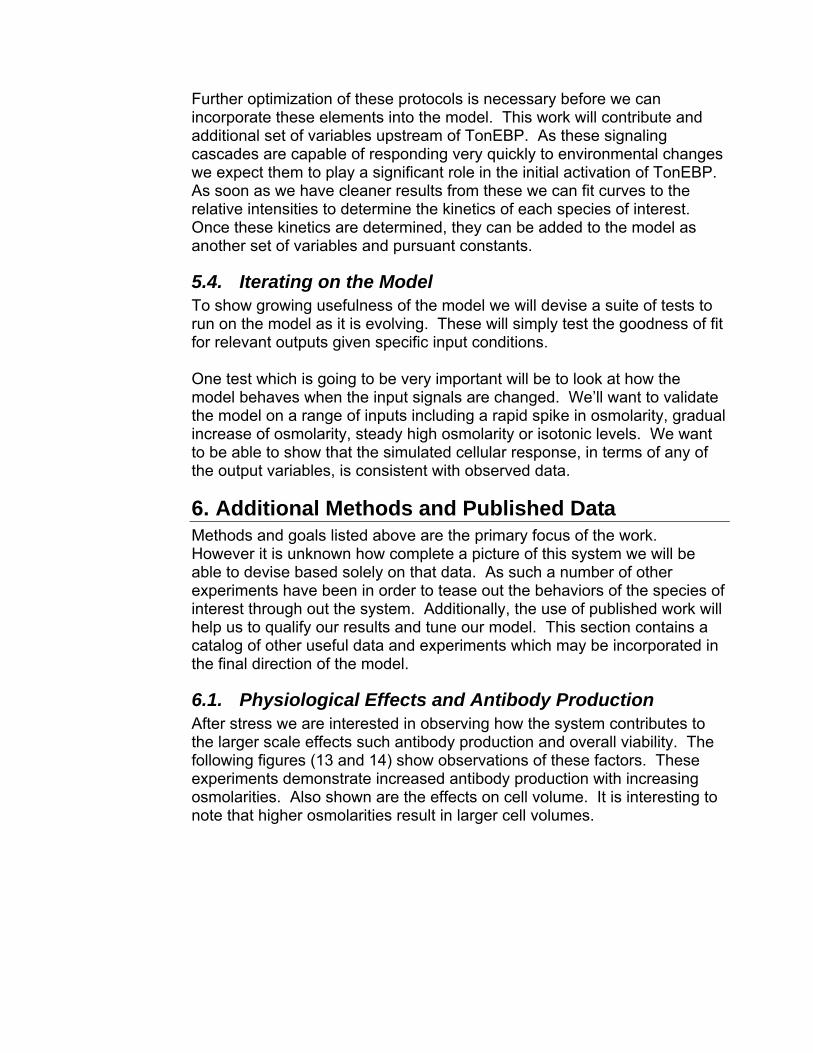
Further optimization of these protocols is necessary before we can incorporate these elements into the model. This work will contribute and additional set of variables upstream of TonEBP. As these signaling cascades are capable of responding very quickly to environmental changes we expect them to play a significant role in the initial activation of TonEBP. As soon as we have cleaner results from these we can fit curves to the relative intensities to determine the kinetics of each species of interest. Once these kinetics are determined, they can be added to the model as another set of variables and pursuant constants.
5.4. Iterating on the Model To show growing usefulness of the model we will devise a suite of tests to run on the model as it is evolving. These will simply test the goodness of fit for relevant outputs given specific input conditions. One test which is going to be very important will be to look at how the model behaves when the input signals are changed. We’ll want to validate the model on a range of inputs including a rapid spike in osmolarity, gradual increase of osmolarity, steady high osmolarity or isotonic levels. We want to be able to show that the simulated cellular response, in terms of any of the output variables, is consistent with observed data.
6. Additional Methods and Published Data Methods and goals listed above are the primary focus of the work. However it is unknown how complete a picture of this system we will be able to devise based solely on that data. As such a number of other experiments have been in order to tease out the behaviors of the species of interest through out the system. Additionally, the use of published work will help us to qualify our results and tune our model. This section contains a catalog of other useful data and experiments which may be incorporated in the final direction of the model.
6.1. Physiological Effects and Antibody Production After stress we are interested in observing how the system contributes to the larger scale effects such antibody production and overall viability. The following figures (13 and 14) show observations of these factors. These experiments demonstrate increased antibody production with increasing osmolarities. Also shown are the effects on cell volume. It is interesting to note that higher osmolarities result in larger cell volumes.

12 24 36 48 60 72 84 960.0×10-00
5.0×10-07
1.0×10-06
1.5×10-06
2.0×10-06
controlosmotic
Culture Time (hrs)
Ant
ibod
y Se
cret
ion
Rat
e( μ
g/ce
ll/hr
)
Figure 13. Left, viable cells over time and different osmolarities (Ozturk 2001). Right, antibody production with and without osmotic shock (Sun 2004).
Figure 14. Antibody production rates at various omolarities (Ozturk 2001)
6.2. Signaling Matsuda et al. provide an early glimpse into the activation cascades in rat 3Y1 cells(Matsuda 1995). They show activity within three minutes of stimulation by 0.5M NaCl and a peak at about 30-60 minutes after exposure (Figure 15). Kültz also identifies similar responses in Madin Darby Canine Kidney cells (MDCK) as shown in figure 16(Kultz 2001). Some of the primary enzymes involved in this process include p38, Fyn, PKAc, ATM and other SAPK/JNK's. Assaying the activity of these kinases will provide the upstream constants. Additionally, assaying Aldose Reductase will give us data on downstream effects.

Figure 15. Various activations after osmotic stress (Matsuda 1995)
Figure 16. Activity of various kinases after osmotic stress (Kultz 2001)
6.2.1. Activity Assays We have completed some initial experiments using Invitrogen’s Omnia lysate kits. These kits provide substrate for a fluorescent assay. These experiments can be run with cell lysate on a fluorescent plate reader. This makes it feasible to run a number of cell lines under the conditions outlined above. The activity of PKA was our first attempt at the use of one of these kits. We have determined that we need to further optimize the technique to ensure significant results. This will likely involve determining additional agents need to be included in the lysis buffer to ensure that the signal is not lost after the lysate is collected. Each of the various kinases in question can be probed with similar techniques

6.2.2. Protein Quantitation Assays As described earlier, we have also completed some initial experiments in quantitating the amounts of some of the species of interest. Utilizing western blot kits from Cell Signaling technologies we have begun to optimize this experiment. We are currently working with kits which have antibodies for a number of MAP kinases as well as stress activated kinases.
6.3. Expression Data Previous work in the Sharfstein lab entailed a series of microarray experiments (Shen 2005). The microarray was employed at several time points following osmotic stress. Ultimately one would like to be able to apply a method like network component analysis (Liao 2003) to elucidate the relationships between genes in response to osmotic shock. However the application of this method has a number of requirements which make it difficult to apply. These requirements are necessary in order to keep the linear system of equations well-formed. In order to meet these requirements, we would either have to over simplify our system or acquire a large amount of biological information. Network component analysis (NCA) can be quickly summarized as a least squares problem where E=AP. E is defined as the expression profile for particular genes. P holds similar time courses for a number promoter genes. A then provides connectivity between the promotors and the ultimate gene expression profiles in E. The difficulty in applying this method comes in defining A. This matrix must meet a number of numerical requirements in order to keep the problem well-formed. Also, one must be aware of all of the relevant promoter-gene connections. NCA then will solve for the relative weights for each of the connections in A. In parallel with the work here I will be pursuing some other techniques with professor Embrechts. These techniques offer similar benefits to SVD. The jury is still out as to how much can be derived from this data. Some say that SVD and PCA like techniques won’t render any interesting insights (Liao 2003).
6.4. Osmolyte Accumulation Production of osmolytes serves to balance osmotic pressure. To fully characterize the system we’ll want to watch a number of quantities over time. The total cell volume and the total amount of protein will be important quantities to track. An early review by Garcia-Perez and Berg(Garcia-Perez and Burg 1991) lists five primary osmolytes: sorbitol, glycerophosphorylcholine (GPC), getaine, inositol and taurine. It seems that this list has not changed significantly in 15 years as the same list, less taurine, appears in more

recent articles(Dmitrieva 2005). Beck et al provide an additional review of these osmolytes as summarized below (Beck 1998).
6.4.1. Glycerophosphocholine (GPC) Beck suggests that intracellular accumulation of glycerophosphocholine (GPC) comes primarily from reduced degradation rather than upregulated production. GPC:choline phosphodiesterase, which splits GPC into choline and phosphoglycerol is inhibited by high extracellular NaCl. Beck also speculates that another GPC degrading enzyme, non-specific alkaline phosphatase, may also be involved in this regulation. GPC concentrations also increase with increased extracellular urea concentrations more so than other osmolytes.
6.4.2. GPC Assay The YSI 2700 Biochemistry Analyzer can be used to quantify choline. Glycerophosphorylcholine can be converted to choline by incubation at 37oC for 30 min with phospholipase D (from Streptomyces chromofuscus, Boehringer, 6 units/cuvette) in the presence of albumin, 0.5 g/ml, and 10 mM CaC12. The choline level will be assayed using YSI biochemisty analyzer 2700. GPC level can be obtained by subtracting the measurement value of untreated sample.
6.4.3. Betaine Betaine is another significant osmolyte. Beck states that the primary contributor to the rise in intracellular betaine is due to increased activity of the Na+/Cl-/betaine cotransporter betaine gamma-amino-n-butyric acid transporter BGT1. BGT1 mRNA is differentially expressed in different regions of the kidney. BGT1 mRNA expression is enhanced by extracellular hypertonicity. Transcription of BGT1 peaks five hours after hypertonic stress event and remains significantly upregulated after eight hours. A tonicity-responsive enhancer element (TonE) is found in the 5' region of the BGT1 gene. Beck goes on to explain that phosphorylation of TonE or ORE binding proteins is not required for interaction with those domains, but it is required for them to upregulate transcription. Ryu et al show that addition of glycine betaine to cell culture medium can enhance specific productivity of certain Cho cell lines (Ryu 2000). In the presence of glycine betaine Ryu observed higher protein titers at osmolarities which previously would have suppressed cell growth.
6.4.4. Betaine Assay The betaine assay can be performed using near-infrared spectroscopy. The betaine peak is around 1660 nm, and the signal can be calibrated using the signal level at 1648 and 1672nm as baseline. (Harbeck 2004).

6.4.5. Myo-Inositol The polyol myo-inositol is another accumulated osmolyte. Beck describes a transport-mediated uptake process which is responsible for the accumulation of myo-inositol. This uptake is via the Na+ dependent myo-inositol cotransporter. This transporter is preferentially located in the basolateral plasma membrane indicating that the uptake of this osmolyte is from circulation. This transporter is encoded by the gene SMIT(SLC5A3) and transcription has been shown to be activated by hypertonicity. No specific "enhancer element" like BGT1 or ORE had been determined as of Beck's writing.
6.4.6. Sorbitol Sorbitol is another significant osmolyte. One factor contributing to the increased accumulation of sorbitol, in response to hypertonic stress, is the increased activity of aldose reductase (AR) which converts glucose to sorbitol. Meanwhile sorbitol dehydrogenase (SDH) which catalyses the conversion of sorbitol to fructose is downregulated under hypertonic stress. Beck states that the effect of SDH is less pronounced than the activation of AR. The increase in AR activity is preceded by a 12 hour incubation of cells in hypertonic medium with a maximum availability of AR mRNA occuring 24h after the increase in tonicity. The human AR gene has three OREs upstream from the transcription initiation site. ORE has strong homology with TonE and may be controlled by the same interacting compound. There is evidence that AR actiivity is decreased in the presence of 1M urea, and that other trimethylamines,notably GPC and betaine, reduce AR activity.
6.4.7. Myo-inositol and Sorbitol Assays Myo-inositol and sorbitol levels can be determined with NAD dependant enzymes by observing the increase of NADH via spectrophotometry.
6.4.8. Aldose Reductase Assay Aldose reductase is one downstream enzyme will also be measured. Aldose reductase activity from cell homogenates can be spectrophotometrically measured at 340 nm by following the decrease of absorption of NADPH with 10mM DL-glyceraldehyde as substrate at 37oC. (Bagnasco 1987)
6.5. Other Metabolic Byproducts Given that the cells undergo additional stress simply as a byproduct of their own metabolism it is important to quantitate the effect of the cell on it’s environment.
6.5.1. Lactate Principal among these byproducts is lactate. Lactate is an important waste product. Determining cell culture conditions which would limit lactate

production could significantly improve viability. As such we would like to incorporate extracellular accumulation of lactate into our model so that it can be related to the overall viability. This data may also be useful in one of the additional pursuits described in section 9.3. The lactate levels of the medium will be determined using a YSI 2700 Biochemistry Analyzer (Yellow Springs Instrument, Yellow Springs, OH).
7. Remarks and Future Directions Once a model has been constructed we can begin to query the model in a number of ways. A simple approach would be to conduct a sensitivity analysis to determine the stability and the boundaries of the model. These boundaries will be important to understand as one moves toward optimizing these systems. Ultimately the model should be used in an iterative fashion. This would involve first testing a hypothesis computationally. Secondly, a number of in-silico experiments could be ranked based on their overall predicted effect. Those with the most promising predictions would then be tested experimentally with resulting data being used to further tune the model. One of the first things we expect to learn from initial experiments as we construct the model is the importance of NFAT5 in our system. It should be apparent numerically, if not experimentally if NFAT5 is indeed as integral to the cell's response as literature currently indicates. Upstream of NFAT5 activation are a number of kinases and potential pathways feeding into the activation of NFAT5. Again, numerically we should be able to separate out the contributions of each of these pathways. Furthermore, we should also be able to determine if these pathways can account for the total activation of NFAT5. Going further downstream, simple time course analysis can help us to understand the interaction between the cell's short and long term responses. This could provide an experimental basis for engineering the cells' response. For example, one could use the model to determine whether upregulating a particular osmolyte could enhance cell viability or productivity. Furthermore, the model may be able to suggest which of the osmolytes appears to be a better candidate. Doing so would involve calculating the contribution of each the osmolytes to balancing the osmotic gradient.
This proposal does not account for mechanosensitive components. It is likely that this components play a significant role in the control of the cellular response. Future work should look to quantify their contribution and integrate their behaviors into the model.

This model should form a framework for integrating later experimental results relating to the dynamics of cellular osmotic response. Having an operational model system alongside the biological system can provide valuable insight into the system and even direction for other biological experiments.
8. References Bagnasco, S.M., Uchida, S., Balaban, R.S., Kador, P.F., Burg, M.B. (1987)
“Induction of Aldose Reductase and Sorbitol in Renal Inner Medullary Cells by Elevated Extracellular NaCl.” PNAS 84;1718-1720.
Bange, J., Zwick, E. and Ullrich, A. (2001). “Molecular targets for breast cancer therapy and prevention” Nature Medicine 7, 548 – 552
Beck, F.-X., A. Burger-Kentischer, et al. (1998). "Cellular response to osmotic stress in the renal medulla." Pflügers Archiv European Journal of Physiology. 436(6): 814-827.
Biocompare Surveys and Reports, (2007) “2007 Antibody Report: Current Trends and Future Outlook Executive Summary” http://www.biocompare.com/research/surveys_files/ExecSumm/antibodies_2007_execsumm.pdf
Bouvier, T., Troussellier, M., Anzil, A., et al. (2001). "Using Light Scatter Signal to Estimate Bacterial Biovolume by Flow Cytometry." Cytometry. 44:188–194
Bray, D., Lay, S. (1994). "Computer Simulated Evolution of a Network of Cell-Signalling Molecules." Biophysical Journal, 66: p. 972-977.
Crooks, G.E., Hon G., Chandonia J.M., Brenner S.E. (2004). "WebLogo: A sequence logo generator." Genome Research, 14:1188-1190
Deckard, A., Sauro, H.M. (2004). "Preliminary Studies on the In Silico Evolution of Biochemical Networks." ChemBioChem 5, 1423 – 1431
Dmitrieva, N., Kultz, D., et al. (2000). "Protection of Renal Inner Medullary Epithelial Cells from Apoptosis by Hypertonic Stress-induced p53 Activation" Journal of Biological Chemistry. 275 (24): 18243-18247.
Dmitrieva, N. I., M. B. Burg, et al. (2005). "DNA damage and osmotic regulation in the kidney 10.1152/ajprenal.00041.2005." Am J Physiol Renal Physiol 289(1): F2-7.
Gao, J., Gorenflo, G.M., Scharer, J.M., Budman, H.M. (2007) "Dynamic Metabolic Modeling for a MAB Bioprocess." Biotechnology Progress, 23, 168-181
Garcia-Perez, A. and M. B. Burg (1991). "Renal medullary organic osmolytes." Physiol. Rev. 71(4): 1081-1115.
François, P., Hakim, V. (2004) "Design of genetic networks with specified functions by evolution in silico." PNAS .101;580-585;
Harbeck, C., Faurie, R., Scheper, T. (2004) "Application of near-infrared spectroscopy in the sugar industry for the detection of betaine." Analytica Chimica Acta. 501: 2, 249-253(5)

Hucka M, Finney A, et al (2003) "The systems biology markup language (SBML): a medium for representation and exchange of biochemical network models." Bioinformatics. 19: 524-531.
Hoffmann, A., A. Levchenko, et al. (2002). "The Ikappa B-NF-kappa B Signaling Module: Temporal Control and Selective Gene Activation 10.1126/science.1071914." Science 298(5596): 1241-1245.
Hood, L. (2003) "Systems biology: integrating technology, biology and computation." Mechanisms of Ageing and Development, 124(1), 9-16.
Irarrazabal, C. E., J. C. Liu, et al. (2004). "ATM, a DNA damage-inducible kinase, contributes to activation by high NaCl of the transcription factor TonEBP/OREBP 10.1073/pnas.0403062101." PNAS 101(23): 8809-8814.
Kiehl T.R., Bonissone P.P. (2003). "Evolving Synthetic Biochemical Reaction Networks: First Steps." International Conference on Systems Biology, St. Louis, MO.
Kiehl, T.R., Mattheyses, R.M., Simmons, M.K. (2004). "Hybrid Simulation of Cellular Behavior." Bioinformatics, 20 (3):316,
Kitano, H. (2002), Systems Biology: a brief overview, Science, 295:1662-1664.
Kitano, H. (2002) Computational Systems Biology, Nature, 420:206-210. Klipp, E., B. Nordlander, et al. (2005). "Integrative model of the response of
yeast to osmotic shock." Nature Biotechnology 23(8): 975-982. Köhler G, Milstein C. (1975). “Continuous cultures of fused cells secreting
antibody of predefined specificity.” Nature 256(5517):495-497. Kojima, R., Randall, J.D., Ito, E. (2004). "Regulation of expression of the
stress response gene, Osp94 : identification of the tonicity response element and intracellular signalling pathways." Biochem. J. 380, 783–794.
Kultz, D. (2001). "Evolution of Osmosensory MAP Kinase Signaling Pathways" Integr. Comp. Biol. 41(4): 743-757.
Kurano, N., Leist, C., Messi, F., Kurano, S., Fiechter, A. (1990). "Growth behaviour of Chinese hamster ovary cells in a compact loop bioreactor. 2. Effects of medium components and waste products." J. Biotechnol. 15, 113-128.
Liao, J.C., Boscolo, R., et al (2003). "Network component analysis: Reconstruction of regulatory signals in biological systems" PNAS; 100(26): 15522–15527.
Lee MS, Kim KW, Kim YH, Lee GM. 2003. Proteome Analysis of Antibody-Expressing CHO Cells in Response to Hyperosmotic Pressure. Biotechnology Progress 19(6):1734-1741
Lopez-Rodrıguez, C., Antos C.L., et al. (2004) "Loss of NFAT5 results in renal atrophy and lack of tonicity-responsive gene expression." PNAS. 101 (8): 2392-2397
Matsuda, S., H. Kawasaki, et al. (1995). "Activation of Protein Kinase Cascades by Osmotic Shock " J. Biol. Chem. 270(21): 12781-12786.

Miyakawa, H., Woo, S.K., Dahl, S.C., Handler, J.S., Kwon, H.M. (1999). "Tonicity-responsive enhancer binding protein, a Rel-like protein that stimulates transcription in response to hypertonicity." PNAS 196;2538-2542
Na, K. Y., S. K. Woo, et al. (2003). "Silencing of TonEBP/NFAT5 Transcriptional Activator by RNA Interference." J Am Soc Nephrol 14(2): 283-288.
Nelson, D. E., A. E. C. Ihekwaba, et al. (2004). "Oscillations in NF-{kappa}B Signaling Control the Dynamics of Gene Expression." Science 306(5696): 704-708.
Neuhofer, W., S. K. Woo, et al. (2002). "Regulation of TonEBP transcriptional activator in MDCK cells following changes in ambient tonicity." Am J Physiol Cell Physiol 283(6): C1604-1611.
Nobel, P.S. (1969). “The Boyle-Van't Hoff relation.” Journal of Theoretical Biology 23; 3. 375-379.
Ozturk, S.S., Palsson, B.O. (1991) “Effect of Medium Osmolarity on Hybridoma Growth, Metabolism, and Antibody Production” Biotechnology and Bioengineering, Vol. 37, Pp. 989-993
Pfeiffer, T., Soyer, O.S., Bonhoeffer, S. (2005). “The evolution of connectivity in metabolic networks.” PLoS Biology 3(7): e228.
Protein kinase c-mediated phosphorylation of the bgt1 epithelial gamma-aminobutyric acid transporter regulates its association with lin7 pdz proteins massari, vanoni, lonhi, rosa, pietrini, jbc
Paladugu, S.R.. Chickarmane, V., Deckard, A., Frumkin. J.P., McCormack, M., Sauro, H.M. (2006) “In silico evolution of functional modules in biochemical networks” IEE Proceedings-Systems Biology, 153:4
Ryu, J. S., Kim, T. K., et al (2000). ‘Osmoprotective Effect of Glycine Betaine on Foreign Protein Production in Hyperosmotic Recombinant Chinese Hamster Ovary Cell Cultures Differs Among Cell Lines.” Biotechnology and Bioengineering Volume 70, Issue 2 (p 167-175)
Sannes, L. (2006). “Monoclonal Antibodies: From Magic Bullets to Successful Drugs “http://www.healthtech.com/news/strategic_briefings/2007/monoclonal_antibodies.asp
Sharfstein, S., Shen, D., Kiehl, T., Zhou,, R. (2007). "Molecular Response to Osmotic Shock," Cellular Engineering: Systems Biology, Volume 5, Chapter 7, pp213-236, Springer
Shen, D., Sharfstein, S.T. (2005). “Genome-wide analysis of the transcriptional response of murine hybridomas to osmotic shock.” Biotechnology and Bioengineering Volume 93, Issue 1 , Pages 132 - 145
Sliwkowski MX, Lofgren JA, Lewis GD, Hotaling TE, Fendly BM, Fox JA. (1999). “Nonclinical studies addressing the mechanism of action of trastuzumab (Herceptin).” Seminars in Oncology. 1999 Aug;26(4 Suppl 12):60-70.
Soyera, O.S., Pfeiffera, T., Bonhoeffer, S. (2006). “Simulating the evolution of signal transduction pathways.” Journal of Theoretical Biology 241 (2006) 223–232
Stroud, J.C., Lopez-Rodriguez, C., Rao, A., Chen, L. (2002). “Structure of a TonEBP−DNA complex reveals DNA encircled by a transcription factor.” Nature Structural Biology 9, 90 - 94
Sun, Z., Zhou, R., Liang, S., McNeeley, K.M., Sharfstein, S.T. (2004) “Hyperosmotic Stress in Murine Hybridoma Cells: Effects on Antibody Transcription, Translation, Posttranslational Processing, and the Cell Cycle.” Biotechnology Progress. 20, 576-589
Tong, E.H.Y., Guo, J-J, Huang, A.L. (2006). “Regulation of Nucleocytoplasmic Trafficking of Transcription Factor OREBP/TonEBP/NFAT5.” The Journal of Biological Chemistry. 281: 33, pp. 23870–23879,
Van`t Hoff, J.H. (1887) . “THE ROLE OF OSMOTIC PRESSURE IN THE ANALOGY BETWEEN SOLUTIONS AND GASES.” Zeitschrift fur physikalische Chemie vol. 1, pp. 481-508
Zhang,Z., Ferraris, J.D., Irarrazabal, C.E., et al (2005). “Ataxia telangiectasia-mutated, a DNA damage-inducible kinase, contributes to high NaCl-induced nuclear localization of transcription factor TonEBP/OREBP.” Am J Physiol Renal Physiology. 289: F506–F511.
Zhu, M.M, Goyal, A., Rank, D.L., et al (2005) “Effects of Elevated pCO2 and Osmolality on Growth of CHO Cells and Production of Antibody-Fusion Protein B1: A Case Study.” Biotechnology Progress. 21, 70-77.
9. Appendix I: Other Pursuits In addition to the primary project described above, the following projects are ongoing. I expect to be able to show some progress in each of these areas. It is likely that each of these projects will result in publication.
9.1. Peptide Classification In partnership with Charles Bergeron, a graduate student in the department of Mathematical Sciences, I have participated in the Comparative Evaluation of Prediction Algorithms 2006 (COePrA) competition. This competition has the stated goal of advancing modeling software and algorithms with emphasis on “the prediction of physico-chemical properties and biological activities from molecular descriptors derived from the chemical structure.” Together we submitted an entry for a problem involving the classification of short peptide sequences. Our entry placed eighth out of 16 entries. At face value this would appear to be an unremarkable result. However, our result was obtained without the advantage of utilizing the extensive set of descriptors provided for each peptide. This demonstrated the value of our submission in that our method was able to generate a competitive result while relying simply on the raw sequence. We have been invited to submit a paper for potential publication in the Journal of Computational Methods in Sciences and Engineering.
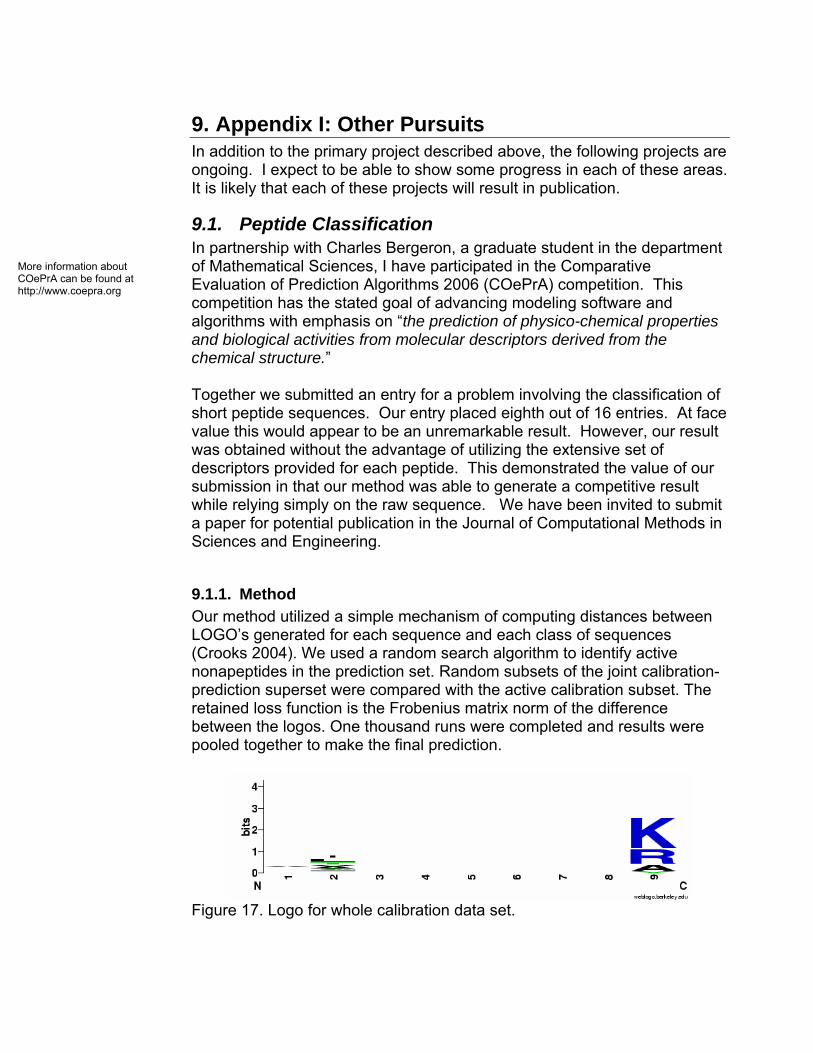
9.1.1. Method Our method utilized a simple mechanism of computing distances between LOGO’s generated for each sequence and each class of sequences (Crooks 2004). We used a random search algorithm to identify active nonapeptides in the prediction set. Random subsets of the joint calibration-prediction superset were compared with the active calibration subset. The retained loss function is the Frobenius matrix norm of the difference between the logos. One thousand runs were completed and results were pooled together to make the final prediction.
Figure 17. Logo for whole calibration data set.
More information about COePrA can be found at http://www.coepra.org

Figure 18. Logo for negative examples in calibration data set.
Figure 19. Logo for positive examples in calibration data set.
Figure 20. Logo for prediction data set Shown in figures 17-20 are visual representations of the Logos in question. The search algorithm seeks out a partitioning of the prediction data set (figure 20). An optimal partitioning would yield a positive and negative subset of the prediction data set such that their logos would show a minimal distance to the respective calibration logo (Figure 18 or 19).
9.2. Biochemical Reaction Network Evolution There is a slowly building body of literature around the concept of in-silico evolution of biochemical reaction networks. Early work in the area looked simply at the wide variety of dynamics that could be generated from a specific network topology simply by evolving the rates of the interactions in that network(Bray 1994). More current approaches have evolved a wide array of behaviors echoing those found in naturally occurring networks (Soyer 2006, Francois 2004, Pfeiffer 2005, Deckard 2004, Sauro 2006, Soyer 2006). These efforts typically focus on ODE based simulations and work primarily in a continuous regime. As time permits I intend to follow up previous work (Kiehl 2003) by evolving networks while taking advantage of the stochastic regime. Previous work simply targeted a specific set point as shown in figure 21. New experiments

will focus on the development of networks with bifurcating behavior. I would like to demonstrate that, while bifurcating networks can be described with ODEs, their specific distributions can only be examined with stochastic effects present.
Figure 21. Sample evolved networks and the time evolution of each dependant species (Kiehl 2003). Dashed line indicates desired set point for species “0.” These efforts will take advantage of previous simulator development (Kiehl 2004) and various computing resources on campus. The computing cluster maintained by Lealon Martin’s research group will be an invaluable resource for this work. Initial tests demonstrate feasible running times even taking into account numerous and potentially lengthy simulation times.
9.3. Batch Culture Model A recent publication demonstrated a model of metabolism in antibody producing CHO cells (Gao 2007). The model developed utilized metabolic flux analysis to fit the model to experimental data. The authors have done a nice job simplifying the model as shown in figure 22.
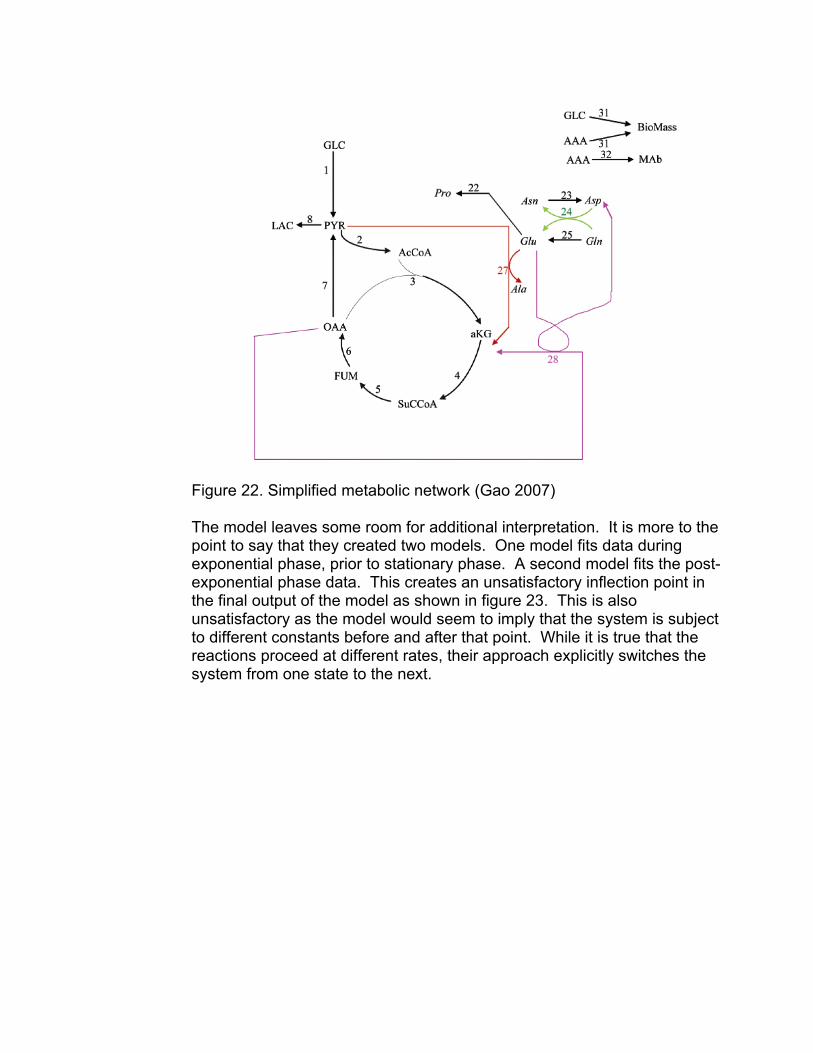
Figure 22. Simplified metabolic network (Gao 2007) The model leaves some room for additional interpretation. It is more to the point to say that they created two models. One model fits data during exponential phase, prior to stationary phase. A second model fits the post-exponential phase data. This creates an unsatisfactory inflection point in the final output of the model as shown in figure 23. This is also unsatisfactory as the model would seem to imply that the system is subject to different constants before and after that point. While it is true that the reactions proceed at different rates, their approach explicitly switches the system from one state to the next.

Figure 23. Simulation output for metabolic network (Gao 2007) Utilizing previously developed stochastic and hybrid simulation tools (Kiehl 2004) it is our intent to capture the dependencies inherent in this change of state. In extending the model we wish to capture the dependency on available energy. This should allow us to more accurately capture the transition. Utilizing stochastic methods will also allow us to observe how the distribution of behavior of an individual cell effects the global phase transition from exponential to stationary phase. The model will be converted to SBML(Hucka 2003) and executed using the Merged ODE Stochastic (MODESTO) simulation engine (Kiehl 2004).

10. Appendix II: Book Chapter Excerpt Find attached my contribution of an overview of non-mammalian osmotic
stress pathways.

11. Appendix III: Evolving Biochemical Reaction Networks: First Steps
Find attached a poster abstract from the International Conference on Biochemical Reaction Networks

12. Appendix IV: Hybrid Simulation of Biochemical Networks
Find attached a prior paper that appeared in the journal Bioinformatics.

13. Appendix V: Scope of the IET Systems Biology Journal
Included here is a statement regarding the scope of this systems biology journal. This is simply intended to show the broad territory that some claim for systems biology.
IET Systems Biology (formerly IEE Proceedings Systems Biology) covers intra- and inter-cellular dynamics, using systems- and signal-oriented approaches. Papers that analyse genomic data in order to identify variables and basic relationships between them are considered if the results provide a basis for mathematical modelling and simulation of cellular dynamics. Manuscripts on molecular and cell biological studies are encouraged if the aim is a systems approach to dynamic interactions within and between cells.
• Genomics, transcriptomics, proteomics, metabolomics, cells, tissue and the physiome • Molecular and cellular interactions; gene, cell and protein function • Networks and pathways • Metabolism and cell signalling • Dynamics, regulation and control • Systems, signals, and information • Experimental data analysis • Mathematical modelling, simulation and theoretical analysis • Biological modelling, simulation, prediction and control • Methodologies, databases, tools and algorithms for modelling and simulation

The Antibody Market Monoclonal antibodies (mAb’s) occupy a growing segment of the therapeutic market. Currently there are 17 monoclonal antibodies which are approved for therapeutic use with an additional 40 in late stage trials (Sannes 2006). In 2005 the therapeutic mAb market reached $13 billion, with half of that number coming from just two drugs (Sannes 2006). These numbers do not include those mAb’s which are being developed for in vivo or in vitro diagnostics and imaging. While these molecules are a product of the biotech industry, they are an important component of many tools of biotech research. Antibodies do a significant amount of heavy lifting in modern biotech research. The immunoassay market was an estimated $8.8 billion in 2006 and is expected to grow to $12.3 billion by 2010 (Biocompare 2007).
Herceptin, A prototypical Antibody Therapeutic One of the most well known mAb therapeutics on the market is Herceptin.™ This mAb targets a receptor which is over expressed in certain breast cancers(Bange 2001, Sliwkowski 1999). Herceptin targets the epidermal growth factor receptor, HER2, which is part of the ErbB family of tyrosine kinases. This targeting results in cell cycle arrest and suppression of tumor growth.
Antibody Producing Cell Lines In 1975 Köhler and Milstein first developed cell lines which could reliably produce monoclonal antibodies (Köhler 1975). These cell linesknown as hybridomas, were a fusion of an antibody-secreting murine lymphocyte cell with an immortal murine myleoma cell. From this process emerges an immortalized cell line which secretes antibodies that have been raised against a specific antigen.
Antibodies in Modern Medicine Antibodies are an important component of the body’s natural defenses.These glycoproteins recognize foreign substances and tag them for remediation by other parts of the immune system. Modern medicine and the biotechnology industry, in general, have developed methods toharness this “technology” for a number of purposes. While “synthetic” antibodies have not proven to be the “silver bullet” they were once heralded as, they are an effective part of a growing number of treatments, lab research, diagnostics and imaging.