systematic observation of physical activity and its ... · "depends upon complexity of system...
TRANSCRIPT

1
Thom McKenzie, Ph.D. Professor Emeritus, San Diego State University
Monica Lounsbery, Ph.D. Professor, University of Nevada, Las Vegas
Systematic Observation of Physical Activity and Its Contexts Overview
Ø Background Ø Research Issues Ø Practical Issues Ø Examples:
§ Home, School, & Park environments
Peaceful Playgrounds
Systematic Observation Ø Direct method for assessing physical activity Ø Permits simultaneous examination of physical
and social environment § (location, presence of others, prompts, consequences)
Ø History § (Bullen ‘54; Hovell ‘78)
Ø Method, not an instrument
Systematic Observation Ø Advantages
§ Direct and objective measure § High internal validity § Assesses contextual variables
§ (e.g., social and physical environment) § Suitable for aquatic environments § Low participant (i.e., subject) burden § Results understood by practitioners
Systematic Observation
Ø Disadvantages § Expense (observer time) § Accessibility to all locations § Potential subject reactivity
Feasibility of Direct Observation
Ø Training required § Depends upon complexity of system (number of activity
and contextual codes)
Ø Time for measurement § Real time plus travel § Data entry § Recording and playback if video is used
2
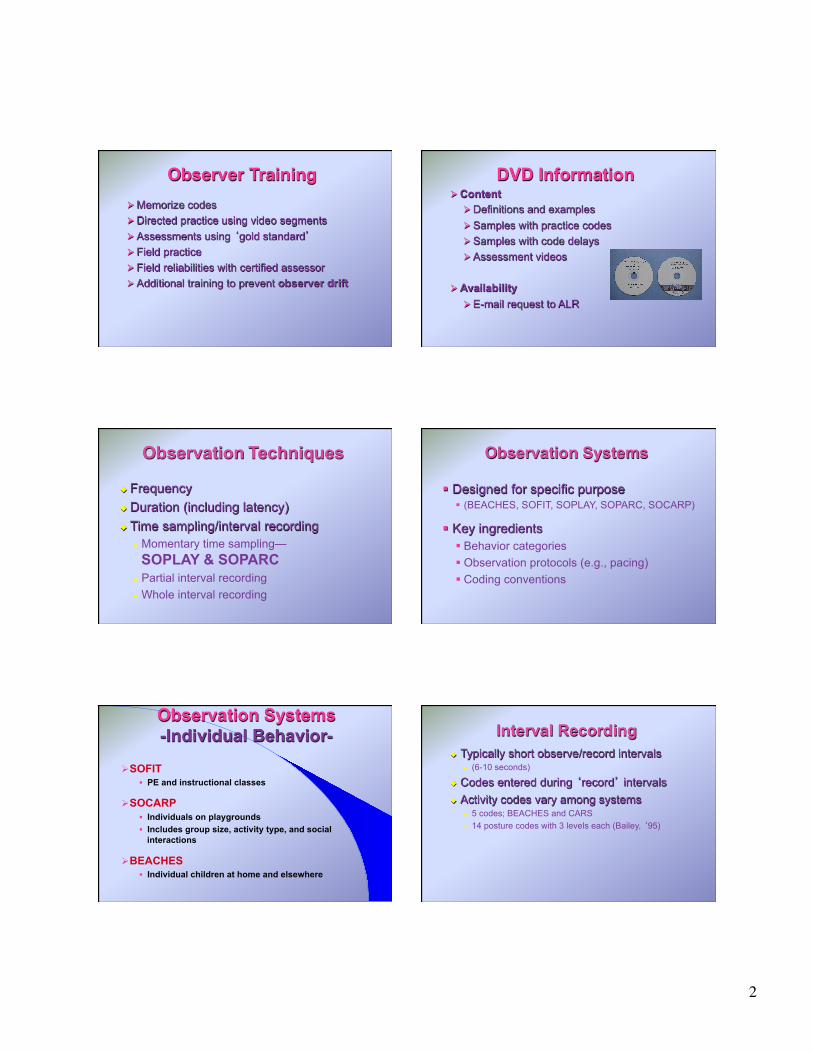
Observer Training Ø Memorize codes Ø Directed practice using video segments Ø Assessments using ‘gold standard’ Ø Field practice Ø Field reliabilities with certified assessor Ø Additional training to prevent observer drift
DVD Information Ø Content
Ø Definitions and examples Ø Samples with practice codes Ø Samples with code delays Ø Assessment videos
Ø Availability Ø E-mail request to ALR
Observation Techniques
Frequency
Duration (including latency) Time sampling/interval recording
Momentary time sampling—SOPLAY & SOPARC
Partial interval recording Whole interval recording
Observation Systems
§ Designed for specific purpose § (BEACHES, SOFIT, SOPLAY, SOPARC, SOCARP)
§ Key ingredients § Behavior categories § Observation protocols (e.g., pacing) § Coding conventions
Observation Systems -Individual Behavior-
Ø SOFIT § PE and instructional classes
Ø SOCARP § Individuals on playgrounds § Includes group size, activity type, and social
interactions
Ø BEACHES § Individual children at home and elsewhere
Interval Recording Typically short observe/record intervals
(6-10 seconds)
Codes entered during ‘record’ intervals Activity codes vary among systems
5 codes; BEACHES and CARS 14 posture codes with 3 levels each (Bailey, ‘95)

3
Pacing Observations Entering Data
Ø Duration (Computer; each key is toggle switch)
Ø Interval Ø Computer Ø Audiotape tape/CD/MP3/IPOD
Ø Data entry Ø Computer Ø Hand score
Ø Form Ø Scantron
Rotate observation among representative students (e.g., every 4 minutes) Boys/girls Those with/without a disability
Observation Systems -Areas and Facilities-
Ø SOPLAY § Group behavior at leisure at school
Ø SOPARC § Group behavior in parks and communities § Includes age and race/ethnicity groupings
Ø SOPARNA § Group behavior in wilderness areas § Includes group size, activity modes
Methodological Considerations (1)
Ø Validity of codes Ø Observer training Ø Reliability measures Ø Observer drift/instrument decay Ø Recalibration
§ “Gold-standard” videotapes
Methodological Considerations (2)
Ø Sampling Adequacy § Time periods (e.g., seasonality)
More than weather and temperature"§ Time of day § Week days vs. week ends § Enough teachers, students, parks
System Validation (1) § Activity codes:
§ heart rates, VO2max, accelerometers
§ Example: § SOFIT/SOPLAY Activity Codes
§ heart rates (lab and field; ages 4-17) § accelerometer (PE and recess)
Observer Variability Ø Within Observer
Ø Examined using video technology during training and recalibration
Ø Between observers Ø Called interobserver agreement or reliability Ø Reported in different ways:
Ø Kappa (controls for chance agreement) Ø Interval by Interval (I-I) Ø Intraclass correlations

4
Physical Activity Data Ø Typically summarized as:
§ Activity time in levels (minutes, hours) § Proportion of time (% of lesson or practice) § Estimated energy expenditure (kilocalories, METS)
§ Counts (e.g., steps taken) 0.029
0.047 0.051
0.096
0.144
0.000
0.050
0.100
0.150
0.200
LyingDown
Sit Stand Walk Vigorous
Estimated Energy Expenditure Kcal/kg/min
Sedentary
BEACHES Contexts (Newer version)
Ø 1. Activity Level § (lie down, sit, stand, walk, vigorous)
Ø 2 Physical Location § (e.g., inside home, outside)
Ø 3 People Present § (e.g., parents, sibling, others)
Ø 4 Behavior Motivated § PA; Sedentary
Ø 5 Motivator
§ (Adult; Child)
Ø 6 Views Media § (No; Yes)
Ø 7 Eats § (No; Yes)
RESULTS: Physical Activity at Home
§ OVERALL: Children were § Indoors 78% of the time § Sedentary 74% of the time § Vigorous only 11% of time
§ REDUCED ACTIVITY ASSOCIATED WITH:
§ Being indoors (p<.001) § Parents being present (p<.004) § Time viewing media (p<.001) § Time ingesting food (p<.05)
McKenzie et al., 2008, AJPH Aventuras para Niños
MVPA OF PRECHOOLERS AT RECESS AND HOME
10
20
30
40
50
EURO-AM MEXICAN-AM
BOYS-recessBOYS-homeGIRLS-recessGIRLS-home
PE
RC
EN
T M
VPA
(N= 351; McKenzie et al., 1992, JBDT)
RECESS
HOME
Prompts for Physical Activity at Home
0
5
10
15
20
Age 5 Age 7
BoysGirls
Perc
ent o
f Int
erva
ls
N=291 children; Elder et al., JDPB, 1998 *total verbal and physical prompts from adults and peers

5
School Settings
1. Physical Education 2. Recess/free play
“If Exercise is Medicine, PE is the Pill Not Taken”
Lack of regulation (policy, accountability) § Dosage (frequency, duration, intensity) § Prescriber (training) § Content (appropriateness, sound) § Delivery (palatable)
McKenzie & Lounsbery, AJLM, 2009
SOFIT Categories Ø Physical Activity
§ Lying Down, Sitting, Standing, Walking, Vigorous
Ø Lesson Context § Management, Knowledge,
Fitness, Skill Drills, Game Play, Other
Ø Instructor Behavior
Int Activity Context Interactions
1 1 2 3 4 5 M K F S G O I O N 2 1 2 3 4 5 M K F S G O I O N 3 1 2 3 4 5 M K F S G O I O N
SOFIT Entry Form Abbreviated
SOFIT Categories Ø Lesson Context:
(How the lesson content is delivered) § Management § Knowledge § Fitness § Skill Drills § Game Play § Free Play
M-SPAN PE: Effects on Student MVPA Minutes
14151617181920
Baseline Year 1 Year 2
InterventionControl
MV
PA M
in P
er L
esso
n
N=24 Schools; 214 Teachers; 1847 Lessons"
6
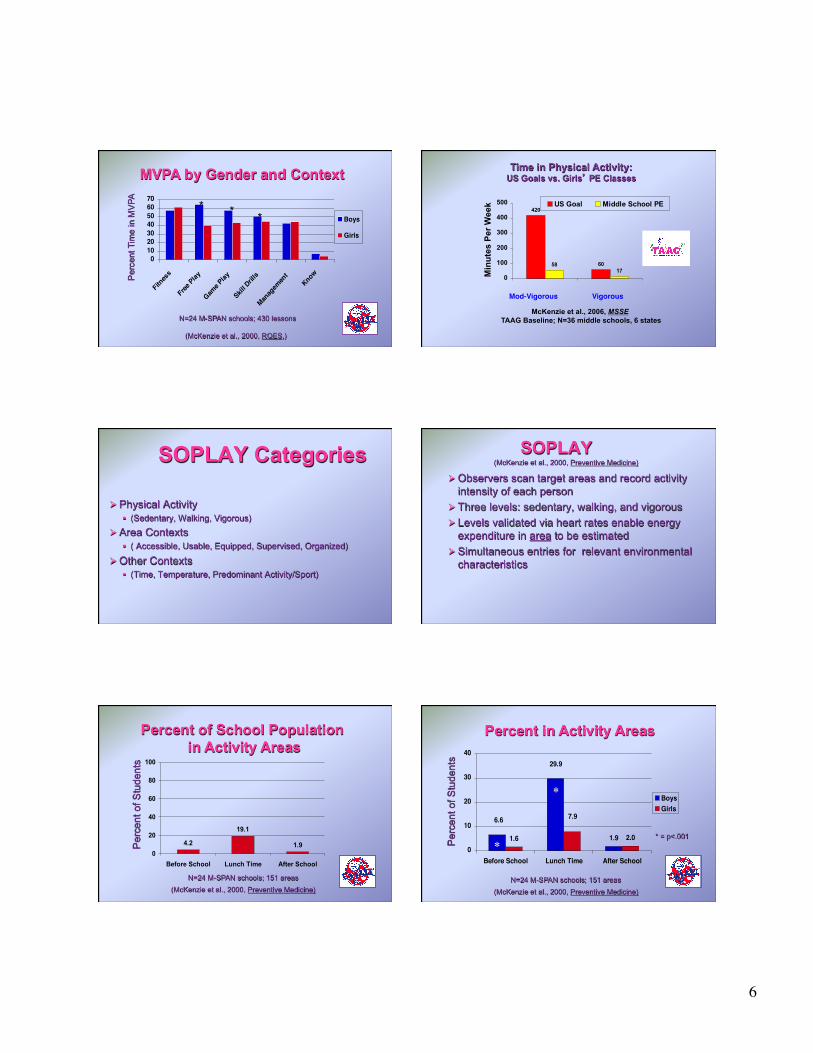
MVPA by Gender and Context
010203040506070
Fitnes
s
Free Play
Game P
lay
Skill D
rills
Manag
emen
tKnow
Boys
Girls
N=24 M-SPAN schools; 430 lessons (McKenzie et al., 2000, RQES,)
Per
cent
Tim
e in
MV
PA
*" *" *"420
6017
58
0
100
200
300
400
500 US Goal Middle School PE
Mod-Vigorous"
Min
utes
Per
Wee
k
Vigorous"
Time in Physical Activity: US Goals vs. Girls’ PE Classes
McKenzie et al., 2006, MSSE TAAG Baseline; N=36 middle schools, 6 states
SOPLAY Categories
Ø Physical Activity § (Sedentary, Walking, Vigorous)
Ø Area Contexts § ( Accessible, Usable, Equipped, Supervised, Organized)
Ø Other Contexts § (Time, Temperature, Predominant Activity/Sport)
SOPLAY Ø Observers scan target areas and record activity
intensity of each person Ø Three levels: sedentary, walking, and vigorous Ø Levels validated via heart rates enable energy
expenditure in area to be estimated Ø Simultaneous entries for relevant environmental
characteristics
(McKenzie et al., 2000, Preventive Medicine)
Percent of School Population in Activity Areas
4.2
19.1
1.90
20
40
60
80
100
Before School Lunch Time After School
N=24 M-SPAN schools; 151 areas
(McKenzie et al., 2000, Preventive Medicine)
Per
cent
of S
tude
nts
Percent in Activity Areas
1.91.6 2.0
6.6
29.9
7.9
0
10
20
30
40
Before School Lunch Time After School
BoysGirls
N=24 M-SPAN schools; 151 areas
(McKenzie et al., 2000, Preventive Medicine)
Per
cent
of S
tude
nts
* = p<.001
*
*
7
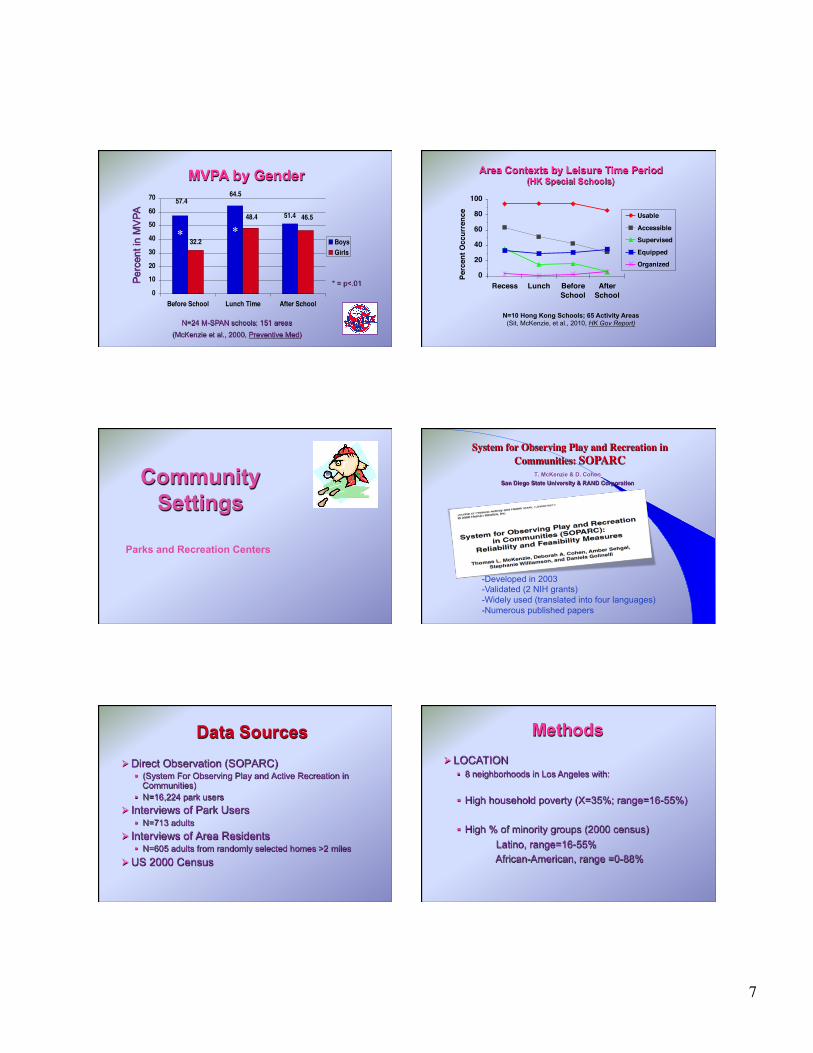
MVPA by Gender
51.4
32.2
57.464.5
46.548.4
0
10
20
30
40
50
60
70
Before School Lunch Time After School
BoysGirls
N=24 M-SPAN schools; 151 areas
(McKenzie et al., 2000, Preventive Med)
Per
cent
in M
VPA
* = p<.01
* *
0
20
40
60
80
100
Recess Lunch BeforeSchool
AfterSchool
Perc
ent O
ccur
renc
e
Usable
Accessible
Supervised
Equipped
Organized
Area Contexts by Leisure Time Period (HK Special Schools)
N=10 Hong Kong Schools; 65 Activity Areas (Sit, McKenzie, et al., 2010, HK Gov Report)
Community Settings
Parks and Recreation Centers
T. McKenzie & D. Cohen San Diego State University & RAND Corporation
System for Observing Play and Recreation in Communities: SOPARC
-Developed in 2003 -Validated (2 NIH grants) -Widely used (translated into four languages) -Numerous published papers
Data Sources Ø Direct Observation (SOPARC)
§ (System For Observing Play and Active Recreation in Communities)
§ N=16,224 park users Ø Interviews of Park Users
§ N=713 adults Ø Interviews of Area Residents
§ N=605 adults from randomly selected homes >2 miles Ø US 2000 Census
Methods Ø LOCATION
§ 8 neighborhoods in Los Angeles with:
§ High household poverty (X=35%; range=16-55%) § High % of minority groups (2000 census) Latino, range=16-55% African-American, range =0-88%

8
Observation Methods PARKS
§ 8 parks in multi-ethnic communities § Size: Range=3.4-16.0 acres; Mean = 7.8 acres § 165 Target Areas: Range/park =17-27; Mean =20.6
DATA COLLECTION § 8 assessors trained systematically § 56 clement days (7 in each park) § 4 one-hour periods/day (7:30AM; 11:30AM; 3:30PM; 6:30PM) § 4511 area visits
SOPARC Categories Ø User Physical Activity Levels
§ (Sedentary, Walking, Vigorous) Ø User Characteristics
§ (Gender, Age, Race/Ethnicity) Ø User Activity Modes
§ (e.g., soccer, picnicking) Ø Area Contexts
§ (Accessible, Usable, Equipped, Supervised, Organized) Ø Other Contexts
§ (Day, Time, Temperature)
(McKenzie et al., 2006)
Reliability Measures
BACKGROUND § Observer-pairs conducted 472 simultaneous measures in 125 activity
areas in 6 parks
AREA CHARACTERISTICS § Accessibility, 98%; Usability; 94%; Supervised, 97%, Organized, 97%;
Equipped, 99%
NUMBER COUNT FOR AREA § Correlation=.99 for both females and males § % Agreement= 92% females, 89% males
PEOPLE CHARACTERISTICS (Overall) § Age Grouping: Females, 95%; Males, 97% § Ethnic/Race Grouping: Females, 99%; Males, 99% § Physical Activity Level: Females, 90%; Males, 88%
§ 4 one-hour periods/day (7:30AM; 11:30AM; 3:30PM; 6:30PM)
§ 8 trained assessors
Characteristics of Activity Areas
2.8 2.1 2 1.3
42.7
92.5 88.9
020406080100
Usable
Accessible
Supervised
Equipped
Organized
Dark
Occupied
N=8 Parks; 165 Activity Areas; 4511 Visits
Per
cent
Occ
urre
nce
Proportion of Observations Activity Areas Occupied
60 59 58
38 37 36 3221
7363
020406080100
Track
Basketball
Gymnasium
Playground
Picnic
Baseball
Handball
Gymnastics
Fields
Volleyball
Per
cent
Occ
upie
d
Park Users: Gender and Age
27.9
2.5
13.3 15.4
2.2
20.2
11.56.9
0
10
20
30
40
Child Teen Adult Senior
Males Females
N=16,244 people; 165 activity areas; 56 days
Per
cent
Obs
erve
d
9
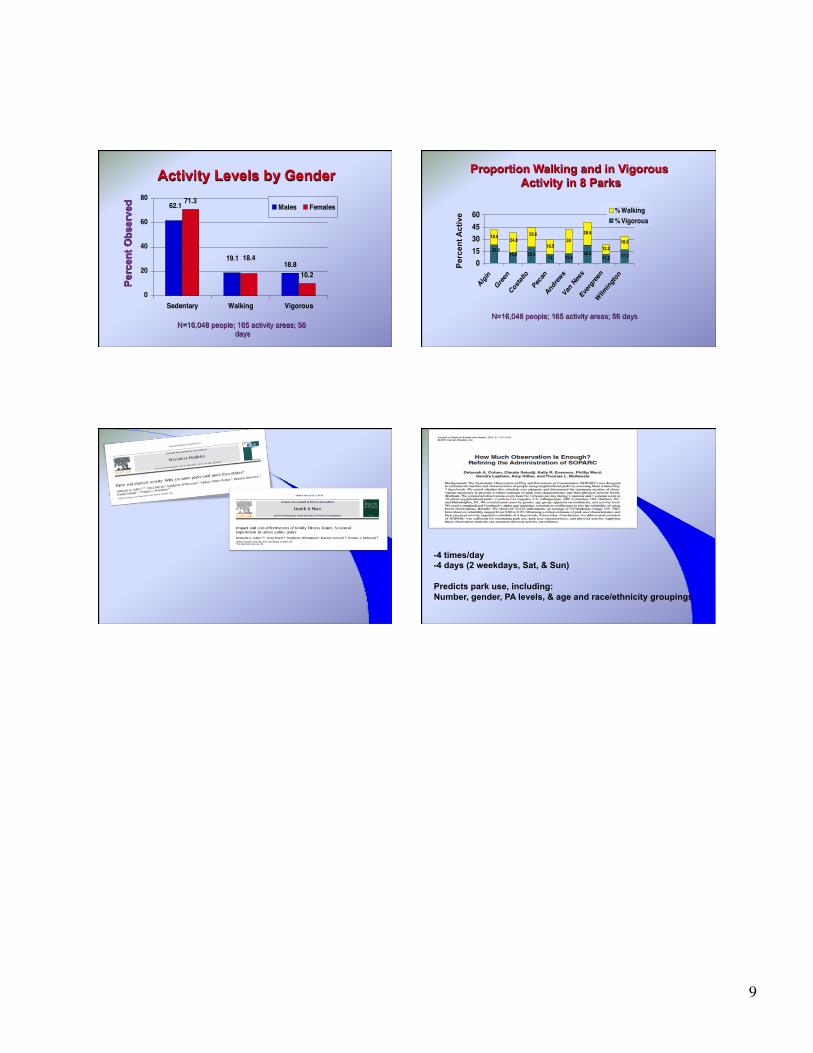
Activity Levels by Gender
18.8
71.3
10.2
62.1
19.1 18.4
0
20
40
60
80
Sedentary Walking Vigorous
Males Females
N=16,048 people; 165 activity areas; 56 days
Per
cent
Obs
erve
d
Proportion Walking and in Vigorous Activity in 8 Parks
20.311 12.4
22.511.2 17.2
18.5
18.530
28.5
12.216.6
22.913.2
23.624.8
015304560
Algin
Green
Costel
loPec
an
Andrew
s
Van N
ess
Everg
reen
Wilm
ingto
n
% Walking% Vigorous
Per
cent
Act
ive
N=16,048 people; 165 activity areas; 56 days
-4 times/day -4 days (2 weekdays, Sat, & Sun) Predicts park use, including: Number, gender, PA levels, & age and race/ethnicity groupings