systematic error and double gaussian fitting toshi gogami 3apr2014
TRANSCRIPT

Systematic error and
double Gaussian fitting
Toshi Gogami3Apr2014

Contents
Systematic error for binding/excitation energy 12
ΛB(1-,2-) state separation

Different distorted initial matrices
• Distorted matrix sample 6 (dist6)• Distorted matrix sample 7 (dist7)• Distorted matrix sample 8 (dist8)

Differential non-linearity (older sample)
Missing mass [GeV/c2]
12ΛB
7ΛHe 52
ΛV

Before and after the optimization(dist6)
dist6
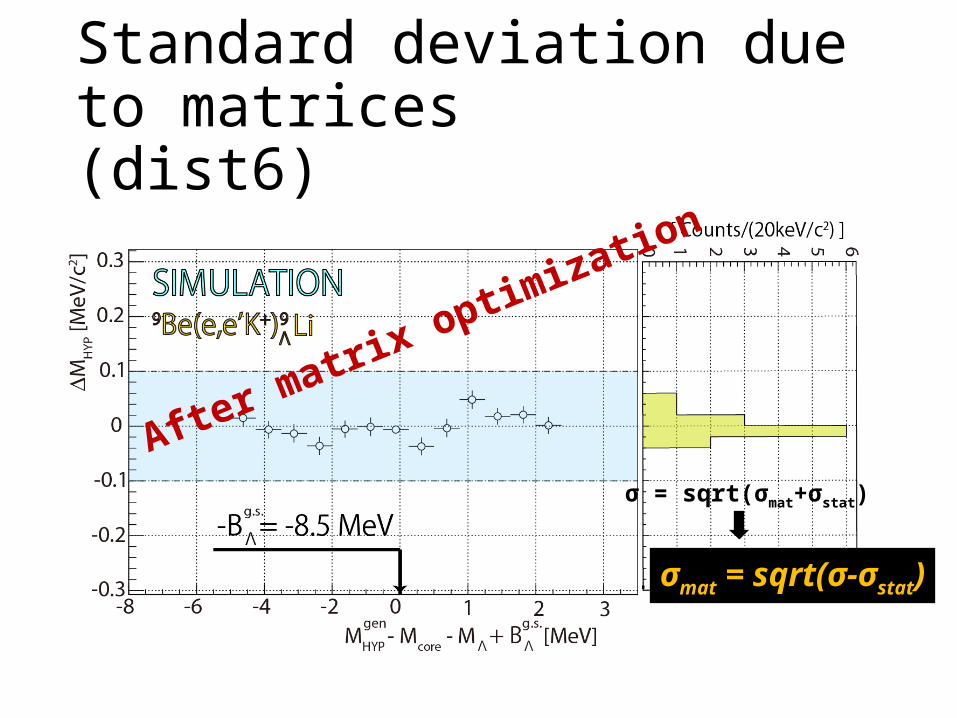
Standard deviation due to matrices(dist6)
σ = sqrt(σmat+σstat)
σmat = sqrt(σ-σstat)
After matrix optimization

Results for (dist8)(g.s. fitting mean )– Mgen
[keV]A
σmat [keV]
BLambda -4.211.0 21.2Sigma -15.313.0 44.37
ΛHe +44.06.8 23.09
ΛLi -25.435.0 17.510
ΛBe +48.83.3 19.912
ΛB +12.75.8 15.652
ΛCr +65.34.2 5.2

Results for (dist7)(g.s. fitting mean )– Mgen
[keV]A
σmat [keV]
BLambda -2.410.6 6.8Sigma -26.113.1 26.77
ΛHe -11.99.2 16.69
ΛLi -72.37.0 29.110
ΛBe -40.68.1 24.212
ΛB -10.111.1 26.652
ΛCr -61.411.6 27.6

Results for (dist6)(g.s. fitting mean )– Mgen
[keV]A
σmat [keV]
BLambda -11.110.9 32.9Sigma +1.712.5 43.07
ΛHe +20.57.0 32.89
ΛLi -66.15.2 29.210
ΛBe -10.05.2 9.612
ΛB -48.56.2 33.052
ΛCr -19.17.2 37.0

Summary1[Systematic errors]
Fitting mean - Mgen < 80 keV (A: shift of mean value)σmat < 50 keV (B: standard deviation in the interested region)
ΔBmat = sqrt(80*80+50*50) = 94 keVΔEmat = 50 keV
5% of target thickness uncertaintyΛ, Σ0 : < 50 keVHypernucleus : < 20 keV
ΔBmat = 110 keVΔEmat = 50 keV

Decomposition of 1- and 2-
-BΛ[MeV]
Coun
ts
Mean1
Amp1
Amp2
Mean2
Chunhua’s spectrum

Test conditions
Common conditions for testsNpoint = 100Step = 0.002 MeVMean1: -11.45 – Step * i (i<Npoint)Mean2: -11.45 + Step * i (i<Npoint)
Parameters• Chunhua’s spectrum
• σ = 0.231 (fixed)
• Han’s spectrum• σ = 0.300 (fixed)
• Toshi’s spectrum • σ = 0.200 (fixed)

|χ2-1.0| distributionreal data

|χ2-1.0| distribution (Chunhua2009)
Mean1 [MeV]
Mean2 [MeV]
σ = 231 keV (fixed)
paper
Mean1 – Mean2 = 162 keV
Mean1 [MeV]
Mea
n2 [M
eV]
|χ2 -1
.0|
|χ2-1.0|

|χ2-1.0| distribution(Han2009)
Mean1 [MeV]
Mean2 [MeV]
σ = 300 keV (fixed)
paper
Mean1 – Mean2 = 162 keV
Mean1 [MeV]
Mea
n2 [M
eV]
|χ2 -1
.0|
|χ2-1.0|

|χ2-1.0| distribution (Toshi2009)
Mean1 [MeV]
Mean2 [MeV]
σ = 220 keV (fixed)
Mean1 – Mean2 = 162 keV
Mean1 [MeV]
Mea
n2 [M
eV]
|χ2 -1
.0|
|χ2-1.0|

SIMULATION

Test conditions (Simulation)
Npoint = 100Step = 0.002 MeVMean1: -11.32 – Step * i (i<Npoint)Mean2: -11.32 + Step * i (i<Npoint)

Generated dummy data
Assumptions 100 + 600 = 700 events 160 keV separation (-BΛ
g.s. = -11.38 MeV) Gaussian distribution (σ = 0.200 MeV) No background
-BΛ [MeV]
[Cou
nts/
240
keV]
SIMULATION

Fitting results (1)
Mean1 [MeV]
Mean2 [M
eV]
Mean1 [MeV]
Mea
n2 [M
eV]
X
σ = 180 keV σ = 190 keV σ = 200 keV
Assumed width for fitting
Answer
Answer Answer
Mean1 – Mean2 = 160 keV
SIMULATION SIMULATION SIMULATIONAnswer

Fitting results (2)
Mean1 [MeV]Mean2 [MeV]
Mean1 [MeV]
Mea
n2 [M
eV]
X
σ = 210 keV σ = 220 keV σ = 230 keV
Assumed width for fitting
Answer
Answer Answer
Mean1 – Mean2 = 160 keV
SIMULATION SIMULATION SIMULATION

Fitting results (4)
Mean1 [MeV]
Mean2 [MeV]
Mean1 [MeV]
Mea
n2 [M
eV]
X
σ = 240 keV
Answer
Mean1 – Mean2 = 160 keV
SIMULATION

Samples
Answer
Mean1 [MeV]
Mea
n2 [M
eV]
[MeV] [MeV]
[MeV]
[MeV]

Summary 2[About 12
ΛB(1-,2-) separation]• What we can say from this study
• We could not reproduce paper values….(E01-011 data could be reproduced though)(I would like to see Hampton’s side study)
• What we thought from this study• In the case of simple Gaussian
• Difficult to find the answer with this method…• In the real case (peaks are not simple Gaussian distributions)
• If this method works well after some analysis improvements, we need to confirm whether the method works or not for peaks which affected by energy straggling, production point displacement from matrix origin, detector resolutions, spectrometer acceptance, beam raster and so on. Can be checked by blind analyses.
• Is there any good cut (selection) condition to find the answer ? need further study.
English ver.