system-wide performance improvement: alegent’s new … · revealing early successes of with the...
TRANSCRIPT

8/9/2012
1
COMBINING DATA-DRIVEN ANALYTICS WITH RAPID CYCLE IMPROVEMENT
ANGELA WARD, RPH, MSBQUALITY & ANCILLARY SERVICES EXECUTIVE
SHARON ESTABROOK, RN-BCSENIOR NURSE NAVIGATOR
NICHE COORDINATOR
System-Wide Performance Improvement:
Alegent’s New Approach
Road Map
2
3
4
1
2
Integrating Rapid Cycle Improvement across the System
Revealing Early Successes of with the Fall Initiative
Sharing Key Lessons
Taking a DRG-Based Approach
8/9/2012
2
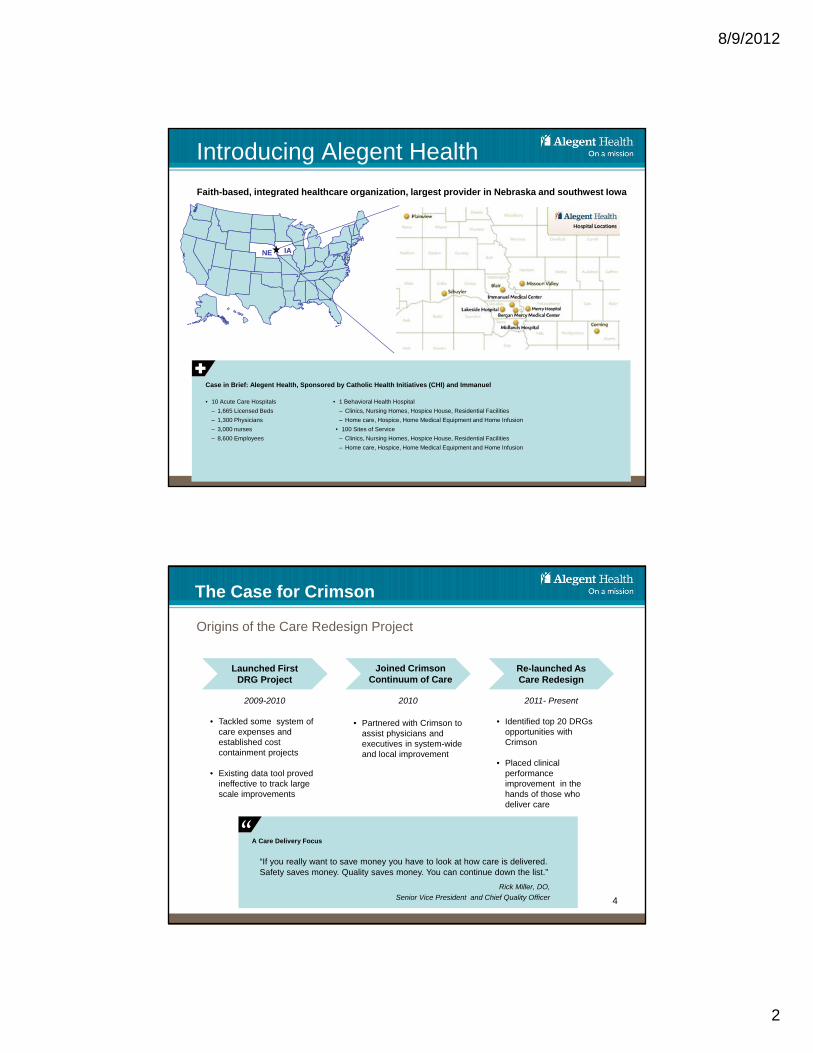
Introducing Alegent Health
3
NE IA
Case in Brief: Alegent Health, Sponsored by Catholic Health Initiatives (CHI) and Immanuel
• 10 Acute Care Hospitals
– 1,665 Licensed Beds
– 1,300 Physicians
– 3,000 nurses
– 8,600 Employees
• 1 Behavioral Health Hospital
– Clinics, Nursing Homes, Hospice House, Residential Facilities
– Home care, Hospice, Home Medical Equipment and Home Infusion
• 100 Sites of Service
– Clinics, Nursing Homes, Hospice House, Residential Facilities
– Home care, Hospice, Home Medical Equipment and Home Infusion
Faith-based, integrated healthcare organization, largest provider in Nebraska and southwest Iowa
2010
• Partnered with Crimson to assist physicians and executives in system-wide and local improvement
4
The Case for Crimson
2011- Present
• Identified top 20 DRGs opportunities with Crimson
• Placed clinical performance improvement in the hands of those who deliver care
2009-2010
• Tackled some system of care expenses and established cost containment projects
• Existing data tool proved ineffective to track large scale improvements
A Care Delivery Focus
“If you really want to save money you have to look at how care is delivered. Safety saves money. Quality saves money. You can continue down the list.”
Rick Miller, DO,
Senior Vice President and Chief Quality Officer
”
Origins of the Care Redesign Project
Re-launched As Care Redesign
Launched FirstDRG Project
Joined Crimson Continuum of Care
8/9/2012
3
5
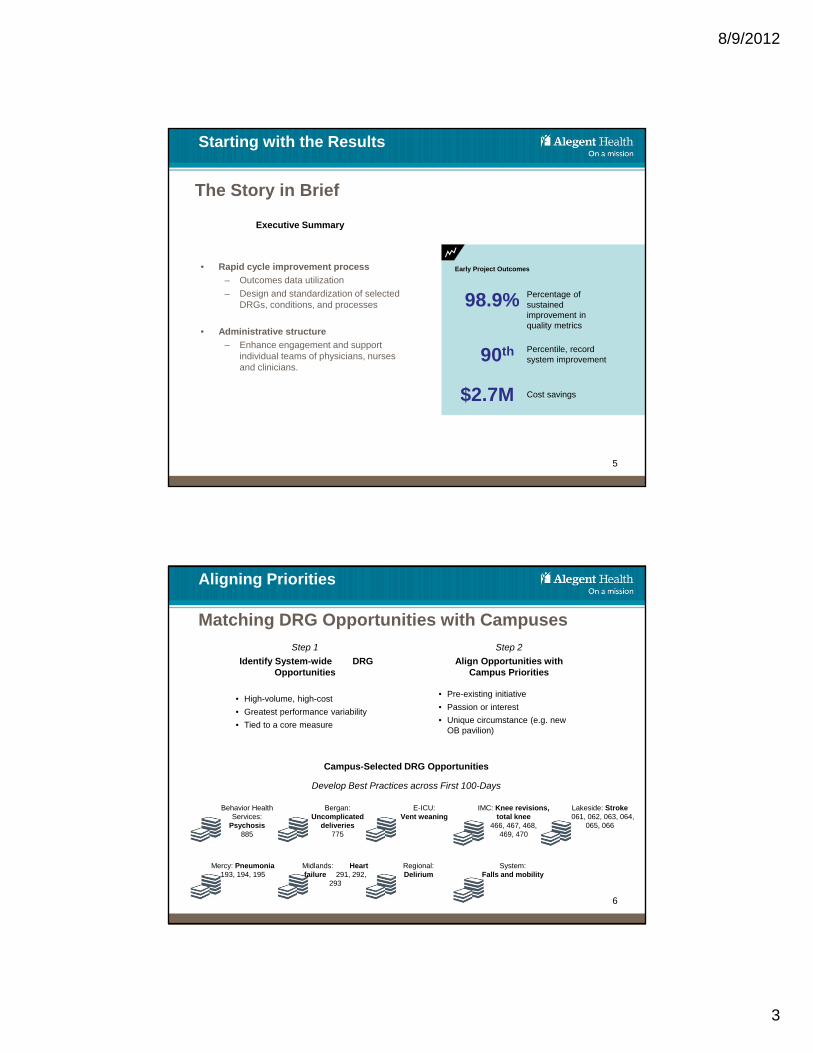
• Rapid cycle improvement process
– Outcomes data utilization
– Design and standardization of selected DRGs, conditions, and processes
• Administrative structure
– Enhance engagement and support individual teams of physicians, nurses and clinicians.
The Story in Brief
Early Project Outcomes
98.9% Percentage of sustained improvement in quality metrics
90th Percentile, record system improvement
$2.7M Cost savings
Executive Summary
Starting with the Results
6
Matching DRG Opportunities with Campuses
Step 1
Identify System-wide DRG Opportunities
• High-volume, high-cost
• Greatest performance variability
• Tied to a core measure
Aligning Priorities
Step 2
Align Opportunities with Campus Priorities
• Pre-existing initiative
• Passion or interest
• Unique circumstance (e.g. new OB pavilion)
Campus-Selected DRG Opportunities
Behavior Health Services:
Psychosis 885
Bergan: Uncomplicated
deliveries775
E-ICU: Vent weaning
IMC: Knee revisions, total knee
466, 467, 468, 469, 470
Lakeside: Stroke061, 062, 063, 064,
065, 066
Midlands: Heart failure 291, 292,
293
Mercy: Pneumonia193, 194, 195
Regional:Delirium
System: Falls and mobility
Develop Best Practices across First 100-Days

8/9/2012
4
Road Map
2
3
4
1
7
Integrating Rapid Cycle Improvement across the System
Revealing Early Successes with the Fall Initiative
Sharing Key Lessons
Taking a DRG-Based Approach
8
Breaking Down the Rapid Improvement Cycle Process
First 100 Days
1. Strategy
• Assign or select DRG, condition or process
DESIGN
1-3
2. Model Development• Review Crimson data• Develop campus DRG teams• Establish “100 Day”
improvement cycle• Check best practices on all
campuses/entities• Engage the service line• Develop consistent change
model• Design review with DA
4. Development• Review products from owner • Review data/products• Review assessment & gap analysis
EVALUATE
4
3. Refinement Plan• Select optimal metrics/
outcomes• Implementation plan• Communication plan• Coaching plan
6. Functional Check• Identify lessons• Validate & refine care standard• Define install plan & timeline
REVIEW & ADJUST
6
30 Day Improvement Cycle
7. Freeze• Standard defined• Metrics collected/reviewed• Knowledge sharing• Primary owners approve
further iterations
5. Enhancement• Identify
improvements
REFINE
5
STANDARD
7

8/9/2012
5
9
Engaging Staff to Drive Program Adoption and Rollout
Campus Project Sponsors Drive Initiative Locally
• Chief Nursing Officer
• Chief Quality Officer
• Chief Operating
or Finance Officer
Leaders Spearhead Each Initiative
Steering Committee of system and campus leaders:
• Evaluates opportunities• Selects initiative• Plans for system-wide
rollout• Assesses rollout during
regular conference calls
Campus leaders:
• Reallocate staff resources
• Communicate initiative with staff
• Involve specialty-specific staff and committees organized around DRG
Campus project drivers:
• Launch project locally across first 100 days
• Evaluate progress based on best-practice project management tools
• Report progress to Steering Comm. every 30 days
Senior-most executive on campus
At System Level At Campus Level At the Front Line
Local project drivers
Front-line staff execute initiative
10
Reaching Hundreds of Our Staff

8/9/2012
6
Administrative Processes Provide the Framework for Execution
11
Weekly Conference Calls Accountability and Progress
• Campus/entity and system leaders/members
• Weekly report out of progress
• Steering team conference call to follow report out
• Conference call technology works, all are on their own phones/computers
Overall Project Management Support and Documentation
• 100-day trade show
• 30-day report outs
• Updates and minutes, agenda provided in advance of call
A Different Topic or Frame Each Week
12
STEEEP Think Lean
Category Examples
SafetyCentral line bundle, hand washing, time outs
TimelySTEMI- Door to balloon, Stroke – door to needle
EfficientMinimum necessary testing, less “daily” orders
EffectiveBest practices, evidence based care, care pathways
Equitable Age, sex, ethnicity, etc.
Patient CenteredHCAHPS measures, coordination of care, patient education and communication
Source of Waste Examples
OverproductionExcessive ordering of tests or treatments
WaitingDelays due to multiple visits on the last day
TransportMinimize the transport of IV pumps
Extra Processing
Rework – returns to surgery
InventoryMinimum supplies to efficiently operate
MotionReducing the distance to get IV supplies
Defects Hospital acquired infections

8/9/2012
7
Supporting Staff
• Physician and nursing leadership partnership
• Campus resources and clinical teams
• Project management
• Crimson support and user training
• Financial support
• Quality team
• Lean training and support
• Enterprise Intelligence team
• Education and patient team support
• Marketing and communications
13
Reorganizing Support of Current Resources
“Whenever anyone brings up a good idea, someone always brings up the
budget.”
Charles Schulz, 1983
”
Budget Neutral Project
14
What? Who? When? Where?
• Those responsible for achieving the future state or those directly impacted by the future state
Business Case
• Importance of the problem• Note relevant background information necessary to fully understand the issue
• Consider the size and scope of the problem• Include data
Current State
• Diagram/Description of the current process• Label the diagram so that anyone could understand
• Note major problems • Include quantified measures of the extent of the problem
Critical Processes
• Processes, Tasks, Behaviors, Functions or Procedures necessary to transition from Current State to Future State
• Perform a Root Cause Analysis•List the problems•Decide what is most important to address first•Ask “Why” questions to reach the root cause
Key Stakeholders
Desired (Future) State
• Diagram/Description of the desired process• List the countermeasure(s) that will address the root cause(s) identified
• Include measureable targets (quantity, time)
Implementation Plan
Success Measures
• Actual Results
• How will you check the effects?
• When will you check them?
• Date check done• Results• Compare to predicted
• Plan
Analyzing Performance Using 30-Day Reports

8/9/2012
8
Creating the Care Redesign Performance Standard
15
Standardized Products
Marked with a Seal of Approval
• order sets
• care pathways
• patient road maps
• staff and patient teaching tools
• work flow charts
• discharge follow up
• communication plan for physicians and staff
Enhanced Care
Patient-Focused PI
• Care Delivery
– Review, assess and design work/care flow
• Milestones
– Not LOS or days
– Focus on most effective treatments and evidence of progress
• Delays of Care
– Identify opportunities to eliminate
Rolling-Out Best Practices across the System
16
Trade Show Facilitates Best-Practice Sharing
Teaching Lessons Broadly
Leaders Rally around Causes at Trade Shows
1st InitiativeDay 100
2nd InitiativeDay 130
3rd Initiative Day 160
4th Initiative Day 190
5th InitiativeDay 220
Campus-led DRG
Stroke
“Each campus had the opportunity to be both the teacher and the student in different phases of the project.”
Angela Ward,
Value Leader
”
• Each campus tackles assigned opportunity and distills best-practice processes
• Stoke project leaders help other campuses adopt new stroke protocols locally

8/9/2012
9
17
Supplementing Best Practices with Resources
Care Redesign Products Assist Care Delivery
Evaluating the Care Redesign Project
18
Tracking Project Performance
• Analytic process
– Clinical utilization patterns (Crimson)
– Financial
– Safety and Quality
– Patient Experience
– Readmissions
• Three stages of analysis
– Historical, one year retrospective
– Post design and gap analyses
– Diffusion into all entities/campuses
Assessing Early Gains
• Executive scorecard
– Financial (Margin per DRG/group)
– Quality (Alegent 40)
– Patient Experience (system)
– Readmission rate (system)
• Local campus/entity steering team scorecards
– Financial
– Quality
– Patient Experience
– Readmission rate
– Process Metrics

8/9/2012
10
Presenting Key Metrics with Executive Scorecards
19
DRG GroupingsChange in Margin Avg Per Case
Change in Margin Overall YTD
Ischemic Stroke (DRG 61, 62, 63) ($1.269.99) ($21,590)
Hemorrhagic Stroke (DRG 64, 65, 66) $65.41 $17,987
Simple Pneumonia & Pleurisy w/ MCC (DRG 193)
($832.46) ($101,560)
Simple Pneumonia & Pleurisy w/o MCC (DRG 194 & 195)
$97.58 $37,179
Heart Failure & Shock (DRG 291, 292, 293) $781.14 $356,983
Revision of Knee Replacement (DRG 466, 467, 468 w/ Knee Px Cd)
$977.22 $94,791
Total Knee Replacement (DRG 469 & 470 w/ Knee Px Cd) previous effort, implant costs
$1,994.05 $1.456.293
Vaginal Delivery w/o CC (DRG 775) $66.86 $132.785
Behavioral, Psychosis (DRG 885) $325.16 $779.726
Total Estimated Savings $2,732,546
Care Redesign Total Estimated Savings - Year to Date May 2012
Quality98.8%
Experience 78.6% 90th
ReadmissionAMI 9.7% HF 3.8% PN 1.1% I Stroke 5.8%
Road Map
2
3
4
1
20
Integrating Rapid Cycle Improvement across the System
Revealing Early Successes with the Fall Initiative
Sharing Key Lessons
Taking a DRG-Based Approach

8/9/2012
11
• Tom Frederickson, MD
• Jill Powers, OL Rehab
• Jane Carmody CNO
• Martha Snyder, Admin. IFH
• Brenda Bergman-Evans,PHD
DRG Spotlight: The Fall Mobility Initiative
Develop Best Practice Facilitates System-Adoption
Physician Chair: Campus Chief
QualityDr. Myles Gart
Fall / Mobility Steering Team
Sharon Estabrook RN-BC Lead
Clinical Experts Executive Project Sponsors
Co-Chair: Chief Nurse Executive
Kathryn Koehler MSN,MBA, RN
• Mike Tiesi, Pharmacy OD
• Susan Lorkovic, CN
Information Officer
• Sheree Keely, VP Behavioral
• Amy Knott, CFO
• Laura Hertzig, RN MHA
Patient Safety Officer
Evidence Based Practice

8/9/2012
12
Fall Mobility Initiative Products
23
Deliverables Developed
• Gap Analysis: Minnesota Road Map
• Modified Risk Assessment Tool
• Post Fall Root Cause Analysis Team
• Road Map for Patient & Family
• Fall Prevention Communication Tools
• Education and Competency
• Accountability : Hourly Rounding
• Score Card

8/9/2012
13

8/9/2012
14
27
Unlocking Key Success FactorsCommunication CommitmentEducation
• Providing education to physicians, nursing and ancillary staff, patient and family around fall prevention.
• Ex: Every Patient is My Patient ; Stay Safe and Active While in the Hospital.
• Share information: post fall analysis; High risk shift hand off Interdisciplinary Rounding , white board .
• Ex: Post fall email alerts, e-report documentation of in-house falls
• Ensuring staff are devoted to continuous performance improvement
• Ex: Reward and Remind, Senior Leadership Support
• Trending monitoring• Score Card- “ We’re all in it
together.”
• Ex: Monthly sharing of AH-HA events across the system.
Continuum-Focus
• Evaluate, Strengthen, Educate staff and patients.
• Every Patient Is My Patient
• Assessment of risk; Education, Hourly Rounding, Plan of Care
Nursing
AncillaryPT/OT

8/9/2012
15

8/9/2012
16

8/9/2012
17
Road Map
2
3
4
1
34
Integrating Rapid Cycle Improvement across the System
Revealing Early Successes of with the Fall Initiative
Sharing Key Lessons
Taking a DRG-Based Approach

8/9/2012
18
Reflecting on Key Lessons
35
Begin with Best Practices Involve the ED Engage Experts
Instill Accountability Communicate Effectively Manage Efficiently
• Primary campus/entity “owns” the DRG/assigned work and are accountable for:
• Effective roll out
• Implementation and maximization of their work;
• Approval of iterations and ongoing changes
• The project is bigger than “DRGs” but the name has stuck...it is really a Care Re-design Project
• Project management is needed to start
• Lean support is needed later
• As the primary campus/entity, launches a project they should collect best practices from other campuses
• Many care process begin in the ED, include the ED team on in the process
• If primary DRG is part of/or the work of a service line and leader, engage them from the beginning and ensure their support and leadership in the effort
• Clinical progress/milestones rather than “days“ of care
• Early mobilization
• Avoiding over-ordering outpatient tests as inpatients
• Medication de-escalation e.g. “antibiotic stewardship”
• Medication debridement
• Readmission risk
• Discharge process, follow up phone calls
• Scheduling and follow up appointments
• Medication affordability36
Common Themes and Opportunities
Uncovering Universal Improvement Opportunities
Identifying Focus Areas that Cut across Care Conditions

8/9/2012
19
So What?
37
Care Redesign Results
• All members of the care team speak the same language, use common products/tools
• Organizational-wide commitment and culture of care improvement
• Improved clinical care by organizing its delivery, e.g. Stroke certification, noted as best practice
• Robust quality improvements reduce waste and costs
– Reduction of delays, tests, medication and type, LOS
“The real opportunities are not in those back-office areas anymore, the primary cost drivers are actual clinical processes because that generates 85% of the cost of care”
Michael Rowan, CHI, 2012Health Leaders
”
Attention to specific diagnosis/conditions, uncovered care and communication processes that cut across most or all initiatives
Using Crimson data to improve practice
Dissemination and communication strategies for physicians
Engaging physicians in leadership roles in process improvement
Learn how evidence-based physician orders sets and care pathways work together and complement each other
Payer/funding requests for initiatives
38
Now What?
More to come
• Hip and femur procedures• AMI• COPD
• Inductions• C-sections • Gallbladder surgery

8/9/2012
20
39
Questions?