system optimization in digital color imaging 1. introductiongsharma/papers/sysoptdcispmag.pdf ·...
TRANSCRIPT

1
System Optimization in Digital Color Imaging
Raja Bala+, Gaurav Sharma*
+ Xerox Innovation Group, Xerox Corporation, Webster, NY 14580
* ECE Dept, Univ of Rochester, Rochester, NY 14627
1. Introduction
For reasons of tractability and modular design, it is common practice to partition digital color imaging
systems into components based on the functionality they provide. Examples of these components include
image segmentation, enhancement, compression, color characterization, and halftoning. Indeed many of
these topics are described in detail in other papers in this issue. Typically the components are individually
designed and optimized, and the partitioning has the unintended consequence that engineers working on
specific components acquire expertise limited to those components and think within the "box" for solving
problems they encounter. This article highlights the system interactions among these components and
illustrates through a series of examples how knowledge of system interactions may be beneficially
exploited to improve color quality and/or performance of the end-to-end system. Examples are specifically
chosen to highlight concepts in color image processing, and a set of illustrative images is included with the
examples. In our presentation we assume that the reader is familiar with the basics of color imaging and
device characterization. The introductory article of this issue [1] provides a brief primer and additional
background material can be found in [2].
Section 2 presents an overview of a color imaging system and its elements. Section 3 highlights a collection
of techniques in the literature that attempt to account for system interactions for improved quality or
performance. Sections 4 and 5 present in greater detail two specific examples of approaches that take into
account interactions between elements that are normally treated independently. Concluding remarks are
presented in Section 6.
2. Color Imaging System Elements

2
The diagram of Fig. 1 illustrates the components that are commonly identified as the building blocks of an
end-to-end digital color imaging system. A more detailed example illustrating the elements of a digital
camera (which is a specific input digital imaging system) may be found in a companion article in this issue
[3] and in [4]. The chain typically begins with analog images that exist as real world scenes or as hardcopy
images on a physical medium. Image capture devices such as scanners and digital cameras are used to
capture and digitize these analog images. The capture step is typically followed by digital image
processing elements that perform input related processing tasks. For digital color cameras, such tasks
include de-mosaicing [5,6], white balance correction for the illumination under which the image is
captured, and input color management to correct for the camera color characteristics [7]. For scanners, the
processing involves correction of optical artifacts such as integrating cavity effect [8], descreening for
halftoned input [9,10,11,12], segmentation of the scanned image into regions corresponding to text,
graphics, and pictorials, and color management to correct for the scanner’s color response [7]. The next
step in the imaging chain normally consists of processing for the purpose of image archival, exchange, and
transmission and includes steps such as transformation to standard color spaces, dynamic range reduction
[13], quantization and compression [14]. For synthetic computer generated imagery, these are typically the
first processing steps. On the output side of the digital color imaging chain, the digital output processing
includes steps preliminary to output rendition – primary among these are color characterization for the
output device [7], gamut mapping [13], color quantization for palettized displays [15], and halftoning [16].
The final step on the output side consists of image rendition on a printer or a display and produces as an
end result an image on a physical medium. The human visual system (HVS) is typically the end consumer
of imagery generated from the system, and in some scenarios may be involved in comparing the original
(or recollection thereof) with the output from the system. Characteristics of the HVS are therefore
commonly exploited throughout the imaging system. Note that this end-to-end representation of an
imaging system is intended primarily for conceptual understanding and for illustration of the inter-relations
among the individual elements. In practical systems, a single device may encapsulate a number of elements
including some that are not necessarily sequential and not all the elements that are discussed here may be
present in every imaging system.

3
compressionquantizationcolor transformation
descreeningsegmentationcolor management
printerdisplay
papertransparencydisplay
papertransparencyscene
scannerdigital camera
Physicalmedium
Physicalmedium
Imagecapture
Imagerendition
Image archival,exchange,
transmission
Digitalinput
processing
color managementgamut mappinghalftoning
Digitaloutput
processing
Analogdomain
Digitaldomain
HumanVisual System
Imagesynthesis
Figure 1 Overview of digital color imaging system. Digital imaging operations are listed in red text.
The design of digital color imaging systems incorporates some understanding of the overall system
elements and their interactions. In particular, for imagery intended for a human observer, the characteristics
of the HVS influence the design of several of the components – specific examples being the compression
and halftoning operations that exploit the low-pass characteristics of the HVS. Particular examples related
to color processing are the use of luminance-chrominance (e.g. YIQ) encodings for image compression
with significantly smaller bandwidths for the chrominance channel in comparison to the luminance; the use
of device independent color description for de-coupling input and output color devices [17], and a power-
law nonlinearity for encoding color values. However, once the individual elements have been defined they
are often optimized individually without regard to the interplay among the components. It is our goal in this
article to illustrate that a system-wide understanding can often be exploited further when considering
several of the elements either jointly or individually to better exploit cost, performance, and quality trade-

4
offs in digital imaging systems. It is our belief that these system optimization opportunities offer the best
trade-offs and potential for improvement in today’s digital color imaging devices.
3. Examples of System Optimization in Digital Color Imaging Systems
Recent literature in the area of digital color imaging offers a number of approaches that illustrate the
benefits of exploiting interactions among system elements in the optimization process. This section
contains a brief overview of some of these techniques. Two detailed examples are then presented in
Sections 4 and 5.
A common theme in several of the approaches is the joint treatment of color and spatial dimensions, which
are normally handled independently and separably. Consider the example of JPEG-compressed color
images that must be rendered to a printer. The normal workflow is to first perform decompression,
followed by a printer characterization transform that maps the input image, typically in a device-
independent color space such as YCbCr, to printer CMYK. Klassen et al [18] have developed a technique
to combine the decompression and color characterization operations in a manner that significantly enhances
computational performance. The basic idea is to parse the printer characterization transform into an
expensive 3-D correction and a simple 1-D correction, and apply the former only to a small N×N subblock
within each 8×8 image block (N<<8) in the Discrete Cosine Transform domain afforded by the JPEG
model. In a similar vein, McCleary [19] addresses the problem of noise introduced by color correction of
digital camera images. Observing that these images are then subsequently JPEG-compressed, he proposes a
method to synergistically combine the color correction and JPEG compression in order to reduce the noise.
A problem commonly encountered in halftoning for CMYK printing is color moiré [20,21], an
objectionable low-frequency beat pattern resulting from the superposition of multiple high-frequency
halftone screens. Traditional methods to combat color moiré involve carefully optimizing the halftone
screen angles to minimize the visibility of the artifact. Balasubramanian and Eschbach [22] have observed
that the moiré can also be reduced by adjusting the continuous tone signals driving the halftone screens.
This adjustment occurs in the color characterization function executed prior to the halftoning step. Thus
moiré minimization is treated as an objective in the joint optimization of color characterization and
halftoning.

5
For devices with limited color capabilities or limited memory for image display, it is common practice to
quantize the colors to a smaller palette and then approximate the desired image using colors from the
palette [15]. The former operation is typically referred to as color quantization and the latter is a
generalized halftoning step. The need for color quantization first arose in desktop displays with limited
image memory for display. While these displays are now rare in desktop systems, there is renewed interest
in color quantization for wireless devices whose displays are restricted in their size, memory, and power
consumption [23]. While most work in color quantization treats the color quantization and halftoning steps
independently and sequentially the performance can be improved by jointly optimizing these operations.
Puzicha et al [24] have recently proposed an elegant solution to this problem. They formulate a visually
motivated cost function that encapsulates the combined cost of palletization and of the assignment of pixels
to the palette colors. Efficient algorithms based on multi-scale deterministic annealing determine a
“spatially quantized” image that optimizes the cost function. The results are a significant improvement
over sequential processing, particularly, for small thumbnails that are often necessary on mobile devices.
Illustrative results from their technique may be found online at [25]. The technique can also be applied to
the case where the output images are binary halftones, for which its cost function becomes similar to that
used for other model-based halftoning techniques [26, 27, 28, 29], which themselves are examples of
system optimization that explicitly incorporate the human observer instead of developing heuristic
techniques based on HVS characteristics. Benefits from system optimization have also been realized in
color output rendering for hardcopy through the use of techniques that consider printed color separations
jointly rather than individually. Specifically, for clustered-dot halftoning schemes the use of non-
orthogonal halftone screens [16, 26, 30] offers the capability for reduced moiré through suitable selections
of a set of screens corresponding to the separations [16]. While a similar concept has been the basis of
analog halftone screens for lithographic printing for a long time, the issue has only recently been addressed
in the context of the rectilinear grids necessitated by digital halftoning. Robust system optimization
techniques for this problem have also been proposed earlier in [31]. Similarly, for dispersed dot screens and
error diffusion, joint considerations of color texture from overlap of multiple separations in print has
yielded significant improvements with little additional computational cost [32,33]. Some recent work in

6
this field also incorporates considerations from mis-registrations in halftoning/halftone design [34,35]
thereby addressing system wide robustness that goes even beyond the color imaging components.
Finally, we highlight one more example of joint spatial and color considerations applicable for scan to print
applications involving halftone input and halftone reproduction. In such systems, the interaction between
input and output halftones can generate objectionable “re-screening” moiré even though the input sampling
satisfies the well understood Nyquist sampling criterion. Traditionally, this problem has been addressed by
de-screening the scanned image prior to halftoning on the output side- a process that corresponds to a form
of low-pass filtering (potentially non-linear) and invariably leads to loss of high frequency detail. Novel
approaches that do not suffer from this limitation have been proposed to address this problem in recent
work [36], [37]. Instead of considering the spatial halftoning operation independently of the color, these
techniques employ a combined spatial and color model of the output device. This model enables predition
of the output spatial image, which includes the halftone spatial structure and therefore also mimics the re-
screening moiré. Low pass differences between the predicted output image and the desired image represent
the prediction of the moiré, which can be pre-compensated for in the input. The resulting algorithm may be
understood in signal processing terms as a feedback compensation scheme as opposed to the heuristic low-
pass filtering techniques.
In the following sections, we present in some detail two specific examples that illustrate how the interplay
among system elements can be beneficially exploited in system optimization.
4. Low-cost color lookup table transforms exploiting spatial interactions
A primary goal of color management in hardcopy imaging systems is to achieve consistent and accurate
color reproduction across different devices. This necessitates the derivation and application of color
correction transformations that correct for the nonlinear behavior of both the device and the HVS. The
color transformations are typically complex multidimensional functions, which makes the the real-time
processing of image data a computationally prohibitive task. To reduce the computational cost, the
functions are typically implemented as multidimensional lookup tables (LUTs).

7
For hardware economy, the LUTs constitute a sparse sampling grid of nodes that partition the 3-
dimensional input color space into a set of rectangular cells. An example is shown in Fig. 2 for a
transformation from CIELAB to printer CMYK. Given an input color, the LUT transformation comprises
two basic steps: i) retrieval of a set of nodes lying on the enclosing rectangular cell; and ii) 3-D
interpolation among these nodes. LUTs are invariably built on a regular rectangular grid so that the cell
retrieval step can be performed with minimal computation. Most of the computational cost thus lies in the
interpolation step. Many interpolation schemes exist. In 3 dimensions, these include trilinear, prism,
pyramid, and tetrahedral interpolation [38]. Of these, tetrahedral interpolation requires the fewest
computations, and all three require comparable storage and memory.
CMYK storedat nodes
a*
b*
input L*a*b*L*
Figure 2: Example of a 3-D LUT transformation from CIELAB to CMYK. The white circle is the input
point to be mapped, and the surrounding black circles are the points used for interpolation.
For some applications the computational cost of 3-D interpolation can be prohibitive. Examples of such
applications include very high speed printing, and rendering on devices with limited computational
resources. It is beneficial in these instances to improve the performance of the LUT transformation, while
yet maintaining acceptable output quality. A promising approach for reducing this cost is to apply
multilevel halftoning among neighboring nodes of the LUT [39,40]. For each input color, exactly one of the
neighboring nodes in the enclosing cell is selected for output based on a spatial dither mask. The basic idea
behind these approaches is that the halftoning introduces a high-spatial frequency pattern that is least
noticed (effectively averaged) by the visual system. In other words, the intermediate levels normally

8
obtained by interpolation are thus achieved via visual averaging of a high-spatial-frequency halftone
pattern. This technique exploits several interactions and dependencies. First, it recognizes that human color
perception is a function of spatial dimensions, being far less sensitive to color variations at high spatial
frequencies. Secondly, for binary output devices, the impact on visual quality can be minimized by
exploiting the fact that the output signals from the LUT undergo subsequent binary halftoning. This is thus
another good example of exploiting system interactions to improve performance.
A variant of the aforementioned approach exploits the fact that the human visual system is even less
sensitive to high-frequency variations in chrominance than in luminance [41]. Assuming the input color
space of the LUT transformation is a luminance-chrominance representation, multilevel halftoning is
applied only in the two chrominance dimensions; while 1-D interpolation is applied in the luminance
dimension. This is shown schematically in Fig. 3. The dither matrix employed in this approach was the
Bayer dispersed dot matrix [42, 41].
b*
a*
inputcolor
a*1 a*2
b*2
b*1
L*2
L*1
1D interpolation
a*
L*
b*
inputcolor
Dithermatrix
(a) (b)
Figure 3 (a) Multilevel halftoning along the two chrominance (a*, b*) dimensions using a spatial dither
matrix; (b) 1-D interpolation along luminance or lightness (L*)
Fig. 4 compares the output from standard 3-D tetrahedal interpolation with that of the proposed
chrominance halftoning scheme. The input image was represented in CIELAB coordinates, and was
converted to CMYK for a Xerox 5795 laser printer. A 16x16x16 LUT, with nodes uniformly distributed
along each of the L*, a*, and b* axes was used to perform the conversion using either the standard or

9
proposed LUT transformation techniques. The CMYK images were then converted to CIELAB using a
printer model, then transformed to sRGB for inclusion in this document. Fig. 4 is thus a softproof of the
printed output.1 The differences between the standard and proposed techniques manifest themselves mostly
as high-frequency chrominance textures in the smooth background regions. Recall that the image actually
undergoes an additional binary halftoning step before printing. This step, which cannot be effectively
simulated in the softproofs in Fig. 4, often serves to mask the high-frequency textures introduced by the
multilevel chrominance halftoning. Another observation is that from our experiments, the use of multilevel
halftoning in all 3 dimensions of the LUT (as proposed by [39] and [40]) introduces textures in the
luminance channel as well as chrominance. The luminance textures are more easily perceived by the human
visual system, and more difficult to mask in the binary halftoning step. Finally, the textures can be reduced
by simply increasing the size of the LUT along the dimensions in which multilevel halftoning is performed.
Figure 4: (included at the end for space considerations).
Table 1 compares the computational cost of standard interpolation techniques (tetrahedral and trilinear)
with the proposed approach of chrominance halftoning in conjunction with 1-D luminance interpolation. It
is evident that significant computational savings can be had with the proposed technique. The cost benefit
comes from the fact that halftoning is far less computationally intensive than 3-D interpolation.
Table 1: Cost analysis comparing standard and proposed LUT transformation techniques. N is the number
of output signals. M, A, C, and S denote multiplications, additions, comparisons, and shift operations,
respectively. T denotes the real execution time in µsec to perform the interpolation for each pixel on a Sun
Sparc20 workstation with a CPU clock speed of 75 MHz.
Interpolation Algorithm M A C S T (µ-sec)
1. Trilinear 7N 7N+2 0 2 18.0
2. Tetrahedral 3N 3N+2 2.5 2 12.0
3. Proposed method N N+4 0 2 5.9
1 Note that re-printing of these images on an uncalibrated printer can produce additional errors and artifacts. The reader is encouraged to judge color quality on a standard CRT with characteristics similar to sRGB.

10
4. % Savings from (2) to (3) 67 43 100 0 51
5. Color correction exploiting media characteristics
It is well known that the color characteristics of input and output devices are quite strongly dependent on
the “medium” being captured or rendered to, respectively [43, 44, 45 (page 290), 46], where medium refers
to the combination of colorants and substrates for hardcopy prints and more generally to spectral
characteristics of the input for capture devices such as digital cameras. For input devices the problem can
be minimized through an optimized design of capture device’s spectral sensitivities. This is achieved by
using a comprehensive system-wide metric that incorporates the impact of the end human observer, the
statistical characteristics of the input, and the system noise [47, 48, 49, 50]. However, such optimization is
rare in current consumer image capture devices. In many systems, the characterization for input or output
is optimized for only one medium, and utilized for the multiple different media used in practice. This
simplification occurs mainly because re-characterization for every new medium is time consuming and
costly. For output devices, recent work [46] has shown that it is possible to use an accurate
characterization for a single reference medium and a minimal number of additional measurements, to
characterize the device for each new media. There still remains the challenge of associating, at the system
level, the correct characterization profile for a given document based on the user’s selection of medium. In
the remainder of this section, we highlight how using wider system knowledge the problem for color
scanners in particular can be mitigated.
The spatial characteristics of the input can aid the selection of an appropriate color characterization profile
for color scanners. The technique relies on the fact that typical inputs for these devices are themselves color
hardcopy reproductions from other imaging systems. The images in Fig. 5 depict scans from images printed
with different printing technologies, captured at a resolution of 600dpi. The scans correspond to small
uniform regions in each print and are shown in a blown-up view here in order to illustrate the micro-
structure of the printed images. From the images, it is clear that their spatial structure identifies the printing
technology. Since the photograph is a continuous tone process, its scan shows almost no spatial variation
while the scans from other technologies illustrate their halftone structure. Since halftoning techniques are

11
typically matched to the printing technology for reasons of robustness and image quality [16, 51], the
knowledge of the spatial characteristics may be exploited in order to classify the scanned input to the
corresponding print technology, which in turn can be used to identify a color characterization profile (or
group of profiles) for the input.
The principle of the technique is illustrated in Fig. 6 where the estimated power spectra of the scanned
images corresponding to the different marking technologies are shown. These images represent the 2-D
power spectrograms [52,53] for the scanned images where the dark regions represent concentrations of
energy and the color of each region indicates the concentration of energy in corresponding scanner color
channels. The estimated power spectra clearly highlight the differences among the printing processes. The
halftone technologies are all readily distinguished from the photograph by the much higher concentration of
high frequency energy in the corresponding power spectra. Among the halftone technologies, the
periodicity of the halftones in lithographic and xerographic input images gives rise to sharp peaks in the
power spectra at the locations of the halftone frequencies and their harmonics. These are therefore readily
distinguished from the inkjet input where no peaks are observed in the power spectrum (other than the DC
component) because the halftones are aperiodic. The periodic clustered halftones for lithographic and
xerographic printing show considerable similarity but can be distinguished based on the placement of the
peaks in the power spectra and the noise characteristics. Additional details for the classification process can
be found in [54] and computationally simpler techniques for the identification of the halftone process from
the scanned data and comprehensive results are included in [55]. It is worth noting that spatial analysis of
the input scanned image is often already conducted the purposes of de-screening/enhancement. Hence the
proposed scheme often does not entail significant additional computation in the overall system.
The above example illustrated how analysis of spatial characteristics of scanned images can be exploited
for improving the accuracy of color characterization. In the example that follows we illustrate that an exact
knowledge of the input can often enable not only a recovery of color but also the complete spectral
reflectance from scanner RGB values. Fig. 7 illustrates the concept. The scanner senses the reflectance
distribution at its input and reduces it to a 3-dimensional RGB representation as illustrated in the rightmost
two blocks of Fig. 7. In the absence of additional information, the three dimensional “color” information is

12
clearly insufficient for accurately reconstructing the object spectral reflectance r(λ). In most color scanning
applications, however, the “original” input image that is to be electronically captured is itself a
reproduction. This is the case, for instance, when a photographic print is to be scanned or a Xerographically
produced color document is to be copied. Since these reproductions are produced by exploiting the
trichromacy of human vision, they are typically produced by using only three independent color controls2
2 Even for four color CMYK printing devices (and other devices employing process colors), typically only three independent controls are exercised in practice and the situation of Fig. 7 applies.

13
Figure. 5. Scanned image regions from prints produced with different printing technologies.
Figure. 6. Two-dimensional power-spectra of scanned images produced with different printing
technologies.
(a) Photo (b) Inkjet
(c) Lithographic (d) Xerographic
(a) Photo (b) Inkjet
(c) Lithographic (d) Xerographic

14
ColorOutputProcess
ReflectanceSpectrum
(λ)r3−dimensional
SignalsE.g. RGB/CMY
Device Control
λ
3−dimensional
Mapping F( . )
( One−to−one )
Mapping G( . )
ScannerRGB Values
Scanner
Figure 7. Block diagram illustrating the relationship between scanner RGB output, device signals used for
creation of the input and the reflectance spectra.
as illustrated by the rightmost two blocks of Fig. 7. If we consider the complete end-to-end system
illustrated in Fig. 7, under normal imaging conditions the mapping F(.) from the 3-D device control signals
used for printing to the corresponding scanner RGB values is one-to-one (ignoring quantization and noise
artifacts). This one-to-one nature arises because the color production systems are designed to produce
different colors in response to different input control signals and even though scanners have confusion
among scanned spectra the confusion exists only among spectra for different media. The one-to-one nature
of the mapping assures its invertibility and therefore there exists a mapping F−1(.) that can map the
colorimetric values back to the 3-D device control signals that were used to produce the corresponding
output. Fig. 7 also illustrates the forward device response function G(.), which represents the mapping from
3-D device control values to the reflectance spectrum produced on the output device in response to those
control values. A concatenation of the mappings F−1(.) and G(.) therefore allows scanner RGB values to be
mapped to the corresponding spectral reflectance values for the given color production system. This is
illustrated in Fig. 8. Therefore, for the case where the input is known exactly, it is feasible to extract
complete spectral reflectance data from scanner RGB data. A practical system for performing this spectral
recovery in general situations is presented in [56]. The work uses a neural network to estimate the mapping
H(.) and enables spectral reconstruction that has an error of under 1 ∆E*94 units across multiple illuminants.
15
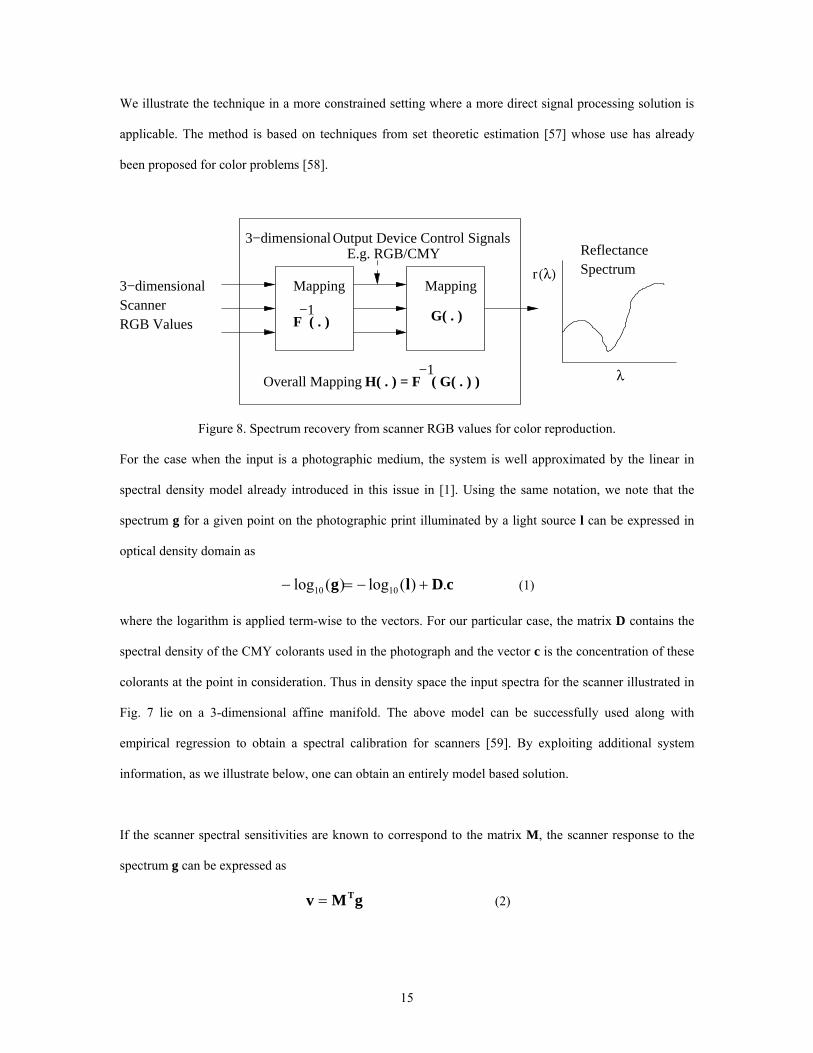
We illustrate the technique in a more constrained setting where a more direct signal processing solution is
applicable. The method is based on techniques from set theoretic estimation [57] whose use has already
been proposed for color problems [58].
ReflectanceSpectrum
λ
(λ)r
F ( . )−1
Mapping
E.g. RGB/CMY
Overall Mapping
Mapping
G( . )
H( . ) = F ( G( . ) )−1
3−dimensionalScannerRGB Values
Output Device Control Signals 3−dimensional
Figure 8. Spectrum recovery from scanner RGB values for color reproduction.
For the case when the input is a photographic medium, the system is well approximated by the linear in
spectral density model already introduced in this issue in [1]. Using the same notation, we note that the
spectrum g for a given point on the photographic print illuminated by a light source l can be expressed in
optical density domain as
cDlg .)(log)(log 1010 +−=− (1)
where the logarithm is applied term-wise to the vectors. For our particular case, the matrix D contains the
spectral density of the CMY colorants used in the photograph and the vector c is the concentration of these
colorants at the point in consideration. Thus in density space the input spectra for the scanner illustrated in
Fig. 7 lie on a 3-dimensional affine manifold. The above model can be successfully used along with
empirical regression to obtain a spectral calibration for scanners [59]. By exploiting additional system
information, as we illustrate below, one can obtain an entirely model based solution.
If the scanner spectral sensitivities are known to correspond to the matrix M, the scanner response to the
spectrum g can be expressed as
gMv T= (2)

16
Thus knowledge of the scanner RGB values v constrains its spectrum by 3 linear equations in the domain
of spectral reflectance. If this constraint is used jointly with the constraint imposed by the model for the
photographic medium, the spectrum may be uniquely determined from the scanner RGB values v. One
challenge remaining, however, is a robust algorithm for solving these joint constraints. While both sets of
constraints are linear3, they lie in different domains and therefore cannot be solved using simple linear
algebra or by conventional convex set theoretic estimation schemes [57] that require constraints to be
convex in the same domain. The problem can be simplified however by using a novel set theoretic
estimation technique [60] that maps the problem into a product space. The technique provides not only a
robust solution to the specific problem considered here but also a general formulation [61] that is applicable
to a wider set of problems in subtractive color.
The problem of estimating the spectra of photographic prints from scanner RGB data is reduced to a
problem of joint satisfaction of convex closed constraints through an application of the results in [60] to the
models of Eqns. (1) and (2). The method of projections onto convex sets (POCS) [62] therefore provides a
robust technique for solving the problem. Of course, practical use of the algorithm also requires knowledge
of the spectral density D. For typical situations, where this knowledge is not explicitly available it may be
estimated to within a non-singular transform by using principal components analysis on a small number of
measured density values from the photograph being scanned itself [61,]. This allows one to have a target-
less scheme for spectral calibration of scanners [63], wherein the spectral sensitivity of the scanner along
with a few spectral measurements from the image being scanned allow the scanner to accurately estimate
spectral data from the scanned RGB values. Illustrative results from this technique are presented in Fig. 9,
where four estimated spectral reflectances (shown as broken lines) are compared against the corresponding
measured values (shown as solid lines). From these plots it is apparent that the technique provides accurate
estimates of the spectra. Over a typical photographic calibration target the above technique provides
accuracy of around 1.8 ∆E*ab units which is quite comparable to other non-spectral calibration schemes
[63]. The spectral calibration offers advantages over the conventional color calibration methods in that the
3 Technically the constraint in density space is affine.

17
colorimetry under different viewing illuminants may be subsequently calculated, which is not possible if
only a colorimetric calibration is available.
400 450 500 550 600 650 7000
0.1
0.2
0.3
0.4
0.5
0.6
0.7
Wavelength (nm)
Ref
lect
ance
MeasuredEstimate
Figure 9. Representative results illustrating measured photographic reflectance spectra versus estimates
from model-based scanner calibration.
6. Conclusions
We have attempted to show, via several examples, that the optimization of the quality and performance of a
color imaging system is indeed a system-wide problem that must take into account interactions among the
various components. In additional to the examples described in Sections 3-5, other instances of color
imaging system interactions can be conceived. For example, hidden interactions between input and output
device characterization functions can result in image artifacts unless accounted for. Take the instance of an
International Color Consortium (ICC) profile for an sRGB device [64]. The sRGB standard is defined for
D65 white point, while the “profile connection space” in the ICC standard is defined for D50 white point
[65]. A chromatic adaptation transform (CAT) is thus needed to convert from one white point to another.
Different vendors of sRGB profiles employ different CATs to perform this conversion. Thus an sRGB
source profile from one vendor using one CAT, combined with an sRGB destination profile from another

18
vendor using a different CAT, can introduce significant color shifts into a process that ought to produce an
identity transformation.
We believe that in general, a systems approach rooted in signal processing principles typically offers
improved “operating points” in the computation and quality trade-off “operating curves”. In many cases,
the systems approach can actually simplify the optimization of the individual components- as is illustrated
by the example of joint optimization of device characterization and halftoning to minimize moiré [22]. In
other cases, overall system performance is improved at no additional cost. Our second example illustrated
this where the intelligent use of spatial side information obtained in the scanning process improved input
color characterization accuracy. The article will hopefully provoke more engineers working on color
imaging to also think in terms of systems and create additional examples of the benefits of such thinking.

19
Figure 4 (a)

20
Figure 4(b)
Figure 4: Images comparing (a) 3-D tetrahedral interpolation with (b) chrominance halftoning and 1-D
luminance interpolation.

21
7. References
1. H. J. Trussell, M. J. Vrhel, E. Saber, “Overview of the Color Image Processing Issue “, IEEE Signal
Processing Magazine, (this issue), pp. TBD.
2. G. Sharma, Ed., Digital Color Imaging Handbook, CRC Press, 2003.
3. R. Ramnath, W. E. Snyder, Y. F. Foo, M. S. Drew, “Color image processing in digital still cameras”,
IEEE Signal Processing Magazine, (this issue), pp. TBD.
4. K. Parulski, K. Spaulding, “Color Image Processing for Digital Cameras”, Chapter 12, in Digital Color
Imaging Handbook, G. Sharma, Ed., CRC Press, 2003.
5. H. J. Trussell, R. E. Hartwig, “Mathematics for demosaicking”, IEEE Transactions on Image
Processing, vol. 11., no. 4 , Apr 2002, pp. 485 -492.
6. D. Taubman, “Generalized Wiener reconstruction of images from colour sensor data using a scale
invariant prior”, Proc. International Conference on Image Processing, 2000, vol. 3, pp. 801 –804.
7. R. Bala, “Device Characterization”, Chapter 5 of Digital Color Imaging Handbook, Gaurav Sharma
Ed., CRC, 2003, Boca Raton.
8. K. T. Knox, “Integrating cavity effect in scanners,” Proc. IS&T/OSA Optics and Imaging in the
Information Age, 20-24 Oct. 1996, Rochester, NY, pp. 83-86.
9. J. Luo, R. de Queiroz, Z. Fan, “A robust technique for image descreening based on wavelet
decomposition”, IEEE Trans. on Signal Processing, Special issue on Theory and Applications of
Filterbanks and Wavelets, Apr. 1998, pp 1179-1184.
10. Z. Fan, “Unscreening using a hybrid filtering approach”, Proc. IEEE 1996 International Conference on
Image Processing, Lausanne, Switzerland, Sept. 1996, pp.351-354.
11. Z. Fan, “Retrieval of gray images from digital halftones”, Proc. 1992 IEEE International Symposium
on Circuits and Systems, San Diego, California, May, 1992, pp. 313-316.
12. Z. Xiong, M. T. Orchard, and K. Ramchandran, "Inverse halftoning using wavelets", IEEE Trans. Image Processing, vol., 8, pp. 1479-1482, October 1999.

22
13. J. Morovic, “Gamut mapping”, Chapter 10 of Digital Color Imaging Handbook, Gaurav Sharma Ed.,
CRC, 2003, Boca Raton, FL.
14. R. deQueiroz, “Compression of Color Images”, Chapter 8 of Digital Color Imaging Handbook, Gaurav
Sharma Ed., CRC, 2003, Boca Raton, FL.
15. L. Brun, A. Tremeau, “Color Quantization”, Chapter 9, in Digital Color Imaging Handbook, G.
Sharma, Ed., CRC Press, 2003, Boca Raton, FL.
16. C. Hains, S. Wang, K. T. Knox, “Digital Color Halftones”, Chapter 6, in Digital Color Imaging
Handbook, G. Sharma, Ed., CRC Press, 2003, Boca Raton, FL.
17. E. J. Giorgianni and T. E. Madden, “Digital Color Management: Encoding Solutions”, Addison
Wesley, Reading, MA, 1998.
18. R. V. Klassen, R. Balasubramanian, R. deQueiroz, "Color correcting JPEG compressed images", Proc.
IS&T and SID's 5th Color Imaging Conference, pp. 83-87, (1997).
19. B. McCleary, “Methods to reduce the amplication of random noise in the color processing of imager
data”, Proc. IS&T’s PICS Conf., pp. 50-57, 2003.
20. Isaac Amidror, Theory of the Moiré Phenomenon, Kluwer Academic, Boston, 2000. 21. P. A. Delabatista “Screening techniques, moiré in four color printing”,. Proc. TAGA, pp. 44-65 (1992).
22. R. Balasubramanian, R. Eschbach, “Reducing multi-separation color moiré via a variable undercolor
removal and gray-component replacement strategy”, Journ. Imaging Science & Technology, Vol 45,
No. 2, pp. 152-160, March/April 2001.
23. J. Luo, A. Singhal, G. Braun, R. T. Gray, O. Seignol, and N. Touchard, “Displaying Images on Mobile Devices: Capabilities, Issues, and Solutions”, Proceedings 2002 IEEE International Conf. Image Proc., pp. I-13—I-16.
24. J. Puzicha, M. Held, J. M. Buhmann, D. W. Fellner“, On Spatial Quantization of Color Images”, IEEE
Transactions on Image Processing, vol. 9, no. 4, April 2000, pp. 666-682.
25. http://www-dbv.informatik.uni-bonn.de/quant/ 26. A. U Agar, F. A Baqai, J. P. Allebach, “Human visual model-based color halftoning”, Chapter 7,
Digital Color Imaging Handbook, CRC Press, Boca Raton, FL, 2003.

23
27. D.J. Lieberman and J.P. Allebach, “A dual interpretation for direct binary search and its implications
for tone reproduction and texture quality”, IEEE Transactions on Image Processing, vol. 9., no. 11,
Nov 2000, pp. 1950 –1963.
28. T.N. Pappas, D.L. Neuhoff, “Least-squares model-based halftoning”, IEEE Transactions on Image
Processing, vol. 8., no. 8, Aug 1999, pp. 1102 –1116.
29. Mulligan, J. B., Ahumada, A. J., Jr., “Principled Halftoning Based On Human Vision Models”, (1992) Proc. SPIE/SPSE Conference on Human Vision, Visual Processing, and Visual Display III, vol. 1666, pp. 109-121.
30. J.P. Allebach, F.A. Baqai, “Computer-aided design of clustered-dot color screens based on a human
visual system model”, Proc. IEEE , vol. 90, no. 1, Jan 2002, pp. 104 –122.
31. I. Amidror, R.D. Hersch, V. Ostromoukhov, Spectral Analysis and Minimisation of Moiré patterns in Colour Separation, Journal of Electronic Imaging, 3 (3), pp. 295-317, 1994.
32. Z. Fan, S. Harrington, “Improved quantization methods in color error diffusion," Journal of Electronic
Imaging, vol. 8, pp. 430-437, Oct. 1999. 33. S. J. Harrington, “Color images having multiple separations with minimally overlapping halftone dots
and reduced interpixel contrast”, US Patent, 5,631,748, issued May 20, 1997. 34. Z. Fan, G. Sharma, Shen-ge Wang, “Error-diffusion robust to mis-registration in multi-pass printing”,
Proceedings PICS 2003, pp. 376-380. 35. G. Sharma, Shen-ge Wang, Z. Fan, “Stochastic screens robust to misregistration in multipass
printing”, scheduled for presentation at the IS&T/SPIE Electronic Imaging Conference, Jan 2004. . 36. S. Wang, Z. Fan, “Moiré-free color halftoning using 2x2 printer modeling”, Proc. SPIE vol. 4300, pp.
397-403.
37. R. Levien, “Moiré suppression screening”, in Proc. SPIE, vol. 3963, pp. 402-407.
38. R. Bala, R. V. Klassen, “Efficient color transformation implementation”, Chapter 11 of Digital Color
Imaging Handbook, Gaurav Sharma Ed., CRC, 2003, Boca Raton.
39. K. E. Spaulding, K. C. Scott, “Method and apparatus employing mean preserving spatial modulation
for transforming a digital color image signal”, US Patent 5377041, awarded December 27, 1994.
40. S. F. Weed, T. J. Cholewo, “Color space binary dither interpolation”, Proc. IS&T and SID's 10th Color
Imaging Conference, pp. 183-189, (2002).
41. R. Balasubramanian , “Reducing the cost of lookup table based color transfomations”, Journ. Imaging
Science & Technology, 44(4):321-327, (2000).

24
42. B.E. Bayer, "An Optimum Method for Two-Level Rendition of Continuous-Tone Pictures", IEEE
1973 International Conf. on Communications, Vol. 1, 26.11 - 26-15. 43. H. Haneishi, T. Hirao, A. Shimazu, and Y. Mikaye, “Colorimetric precision in scanner calibration
using matrices,” in Proc. 3rd IS&T/SID Color Imaging Conf.: Color Science, Systems and Applications, Nov. 1995, pp. 106–108.
44. P. C. Hung, “Colorimetric calibration for scanners and media,” in Proc. SPIE, 1991, vol. 1448, pp.
164–174. 45. H. Kang, Color Technology for Electronic Imaging Devices, SPIE Press, 1997. 46. M. Shaw, G. Sharma, R. Bala, E. Dalal, “Minimal effort characterization of color printers for
additional substrates”, Proc. IS&T and SID's 10th Color Imaging Conference, pp. 202-207, (2002).
47. M.Wolski, C. A. Bouman, J. P. Allebach, and E.Walowit, “Optimization of sensor response functions for colorimetry of reflective and emissive objects,” in Proc. IEEE Int. Conf. Image Processing ’95, pp. II323–II326.
48. G. Sharma and H. J. Trussell, ``Figures of merit for color scanners,'' IEEE Trans. Image Proc., vol. 6,
no. 7, pp. 990-1001, Jul. 1997. 49. G. Sharma, H. J. Trussell, and M. J. Vrhel, ``Optimal non-negative color scanning filters ,'' IEEE
Trans. Image Proc., vol. 7, no. 1, pp. 129-133, Jan. 1998. 50. Shuxue Quan, Noboru Ohta, Mitchell Rosen, Naoya Katoh: Fabrication Tolerance and Optimal
Design of Spectral Sensitivities for Color Imaging Devices. PICS 2001: 277-282. 51. H.R. Kang. Digital Color Halftoning. SPIE Press, 1999. 52. J. S. Lim, Two-Dimensional Signal and Image Processing, Prentice-Hall, 1990. 53 . S. M. Kay, Modern Spectral Estimation: Theory and applications. Englewood cliffs, NJ: Prentice-
Hall, 1988. 54. G. Sharma, , “Methods and apparatus for identifying marking process and modifying image date based
on image spatial characteristics," US Patent # 6353675, issued Mar. 05, 2002 55. G. Unal, G. Sharma. R. Eschbach, “Marking process identification from scanned image data”, in
preparation for submission. 56. G. Sharma and S. Wang, ``Spectrum recovery from colorimetric data for color reproductions,'' in Proc.
SPIE, vol. 4663, pp. 8-14.
57. P. L. Combettes, “The Foundation of Set Theoretic Estimation”, Proceedings IEEE, vol. 82, no. 2, Feb. 1993, pp. 182—208.
58. H. J. Trussell, “Applications of set theoretic methods to color systems”, Color Research and
Application, vol. 16, no. 1, Feb 1991, pp. 31-41. 59. R. S. Berns, M. J. Shyu, “Colorimetric characterization of a desktop drum scanner using a spectral
model”, J Elect Imag, vol 4, 1995, pp. 360 –372.

25
60. P.L. Combettes, “Generalized convex set theoretic image recovery”, in Proceedings ICIP 1996. 61. G. Sharma, “Set theoretic estimation for problems in subtractive color”, Color Research and
Application, vol. 25, no. 4, Oct 2000, pp. 333-348.
62. Bregman LM, “The method of successive projection for finding a common point of convex sets”, Dokl Akad Nauk USSR, 1965; vol. 162, pp. 487–490.
63. G. Sharma, ``Target-less scanner color calibration ,'' J. Imaging Sci. and Tech., vol. 44, no. 4, pp. 301-
307, Jul./Aug. 2000.
64. M. Nielsen, M. Stokes, “The creation of the sRGB ICC profile”, available at www.srgb.com.
65. International Color Consortium, www.color.org.