system of profound knowledge - western mch nutrition...
TRANSCRIPT
Slide 1 API, 2013
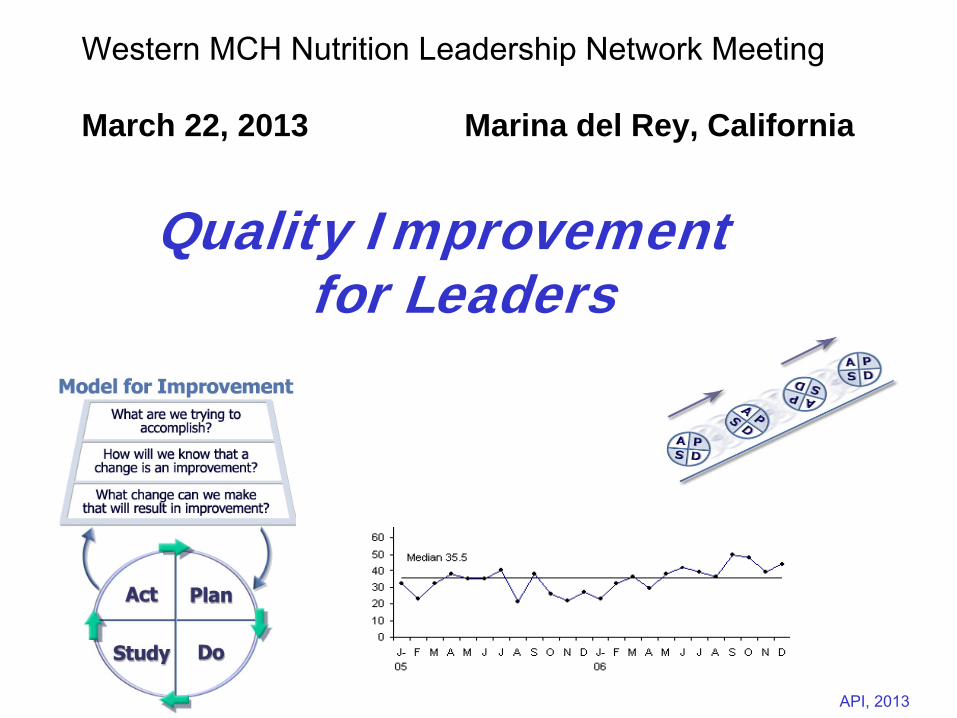
Quality Improvement
for Leaders
Western MCH Nutrition Leadership Network Meeting
March 22, 2013 Marina del Rey, California
Lloyd ProvostAssociates in Process Improvement
Slide 2 API, 2013
Quality Improvement for Leaders
Objectives:
Understand the foundation of improvement methods from the science of improvement.
Provide tools and methods to support improvement and innovation in member organizations.
Describe the use of the Model for Improvement as a roadmap for improvement initiatives.
Understand the use of data for improvement.
Describe the use of collaborative innovation networks to accelerate improvement across a system
Slide 3 API, 2013
Quality Improvement for Leaders - Agenda
8:30 Welcome and overview of the dayLeading improvement in organizations (QI and QA)The Science of Improvement
10:30 Break10:45 The Model for Improvement12:00 Lunch 1:00 Developing an aim statement and measurement
strategyCollaborative Improvement
3:00 Discussion and Wrap-up
Slide 4 API, 2013
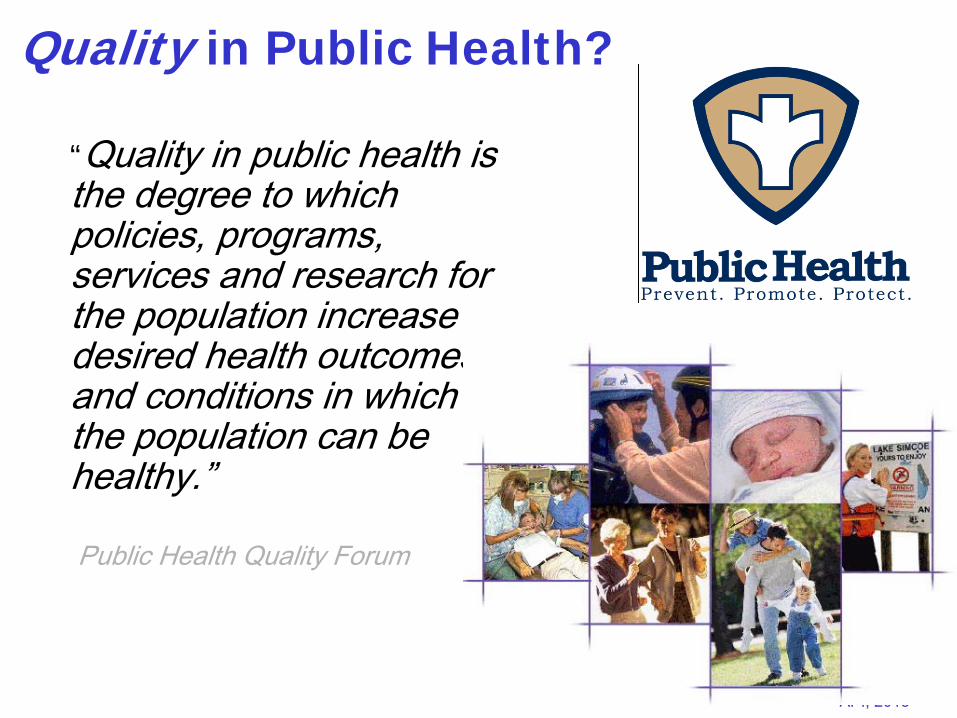
Quality in Public Health?
“Quality in public health is the degree to which policies, programs, services and research for the population increase desired health outcomes and conditions in which the population can be healthy.”
Public Health Quality Forum
4
Slide 5 API, 2013
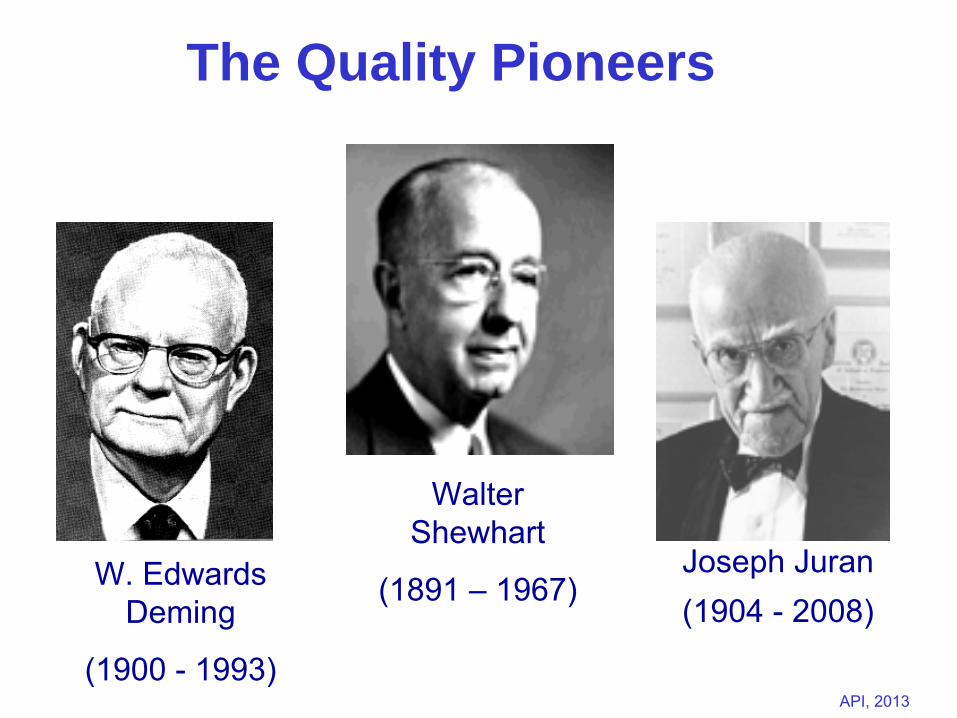
Walter Shewhart
(1891 –
1967)Joseph Juran(1904 -
2008)
W. Edwards Deming
(1900 -
1993)
The Quality Pioneers
Slide 6 API, 2013
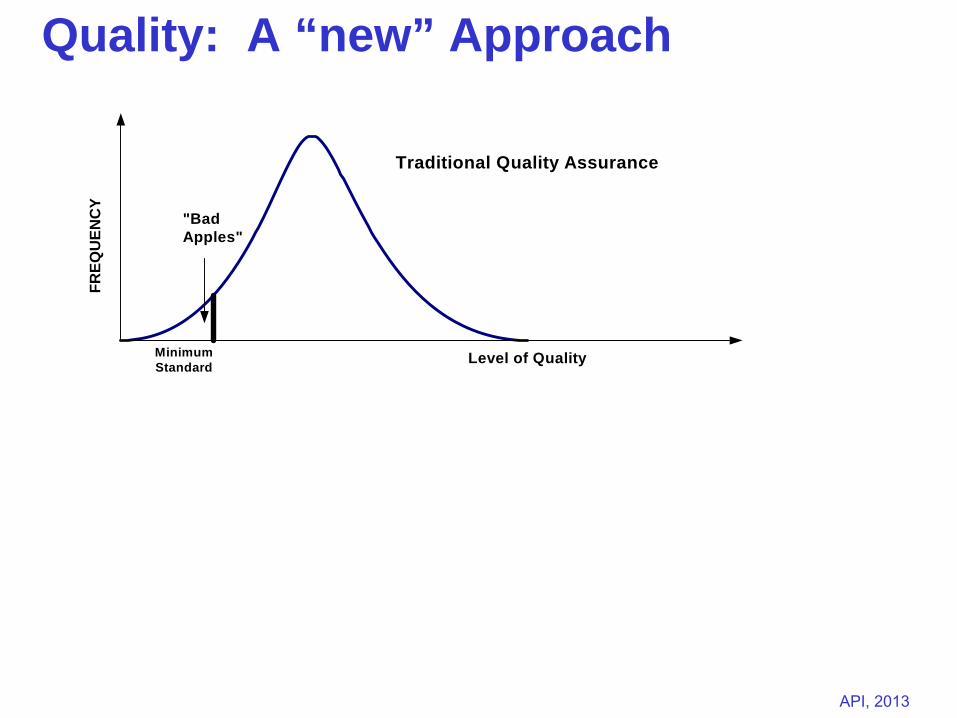
Continuous Quality Improvement
FREQ
UEN
CY
FREQ
UEN
CY
"BadApples"
MinimumStandard Level of Quality
Level of Quality
Traditional Quality Assurance
Quality: A “new” Approach
Slide 7 API, 2013
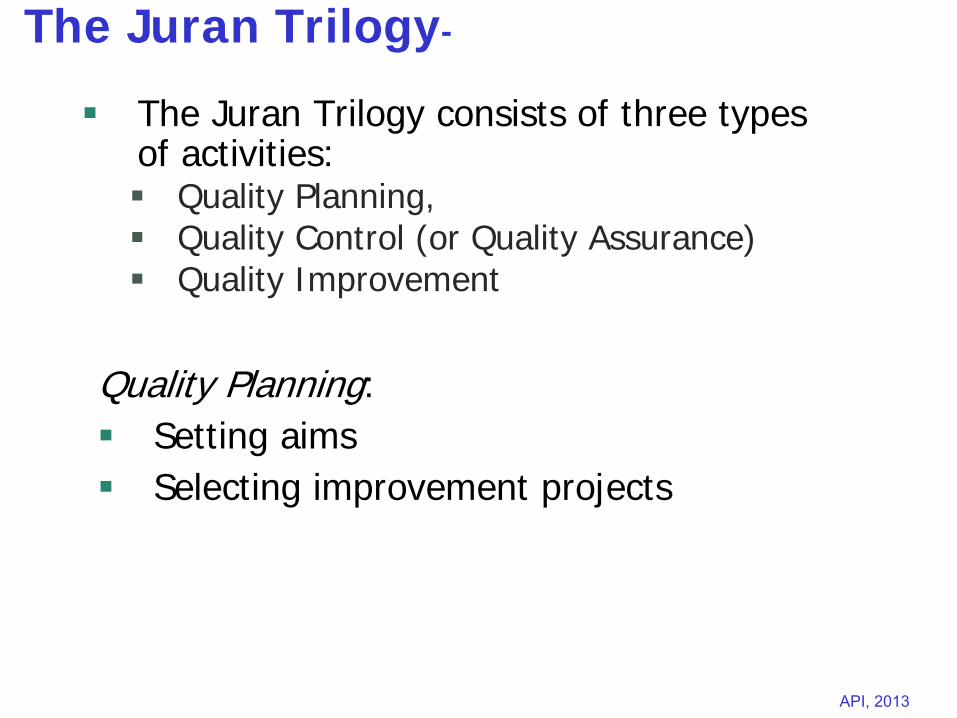
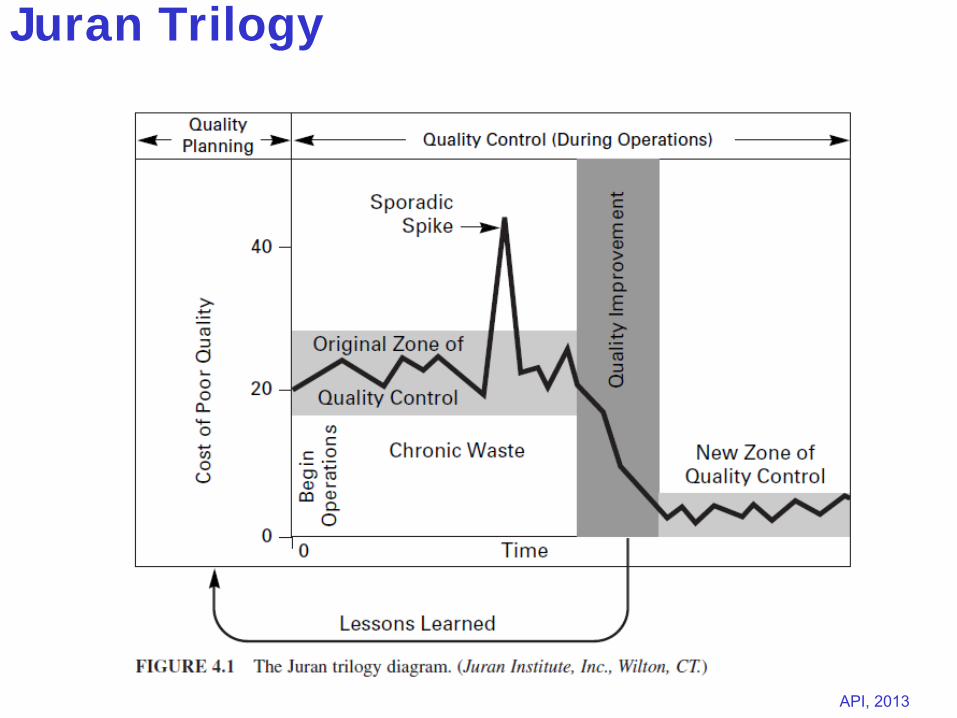
The Juran Trilogy-
The Juran Trilogy consists of three types of activities:
Quality Planning,
Quality Control (or Quality Assurance)
Quality Improvement
Quality Planning:
Setting aims
Selecting improvement projects
Slide 8 API, 2013
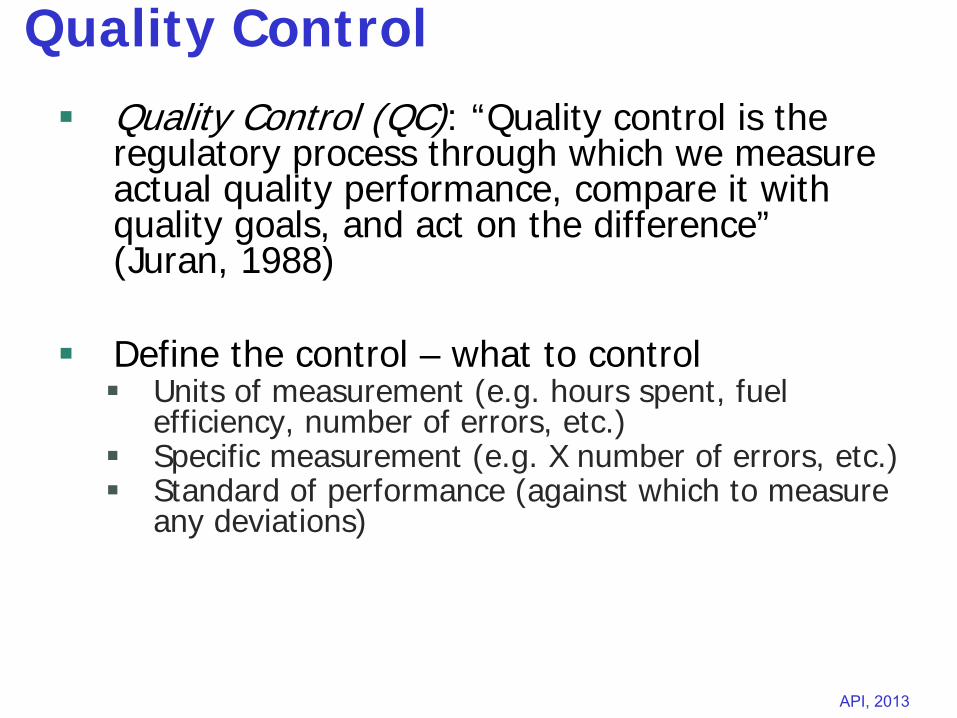
Quality Control
Quality Control (QC): “Quality control is the regulatory process through which we measure actual quality performance, compare it with quality goals, and act on the difference” (Juran, 1988)
Define the control – what to control
Units of measurement (e.g. hours spent, fuel efficiency, number of errors, etc.)
Specific measurement (e.g. X number of errors, etc.)
Standard of performance (against which to measure any deviations)
Slide 9 API, 2013
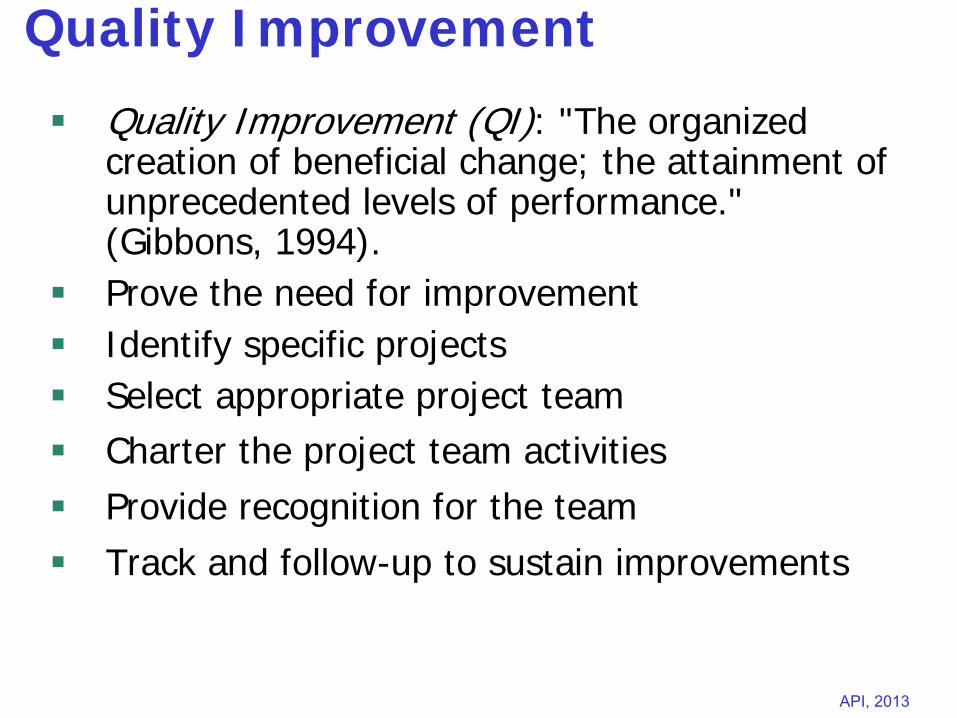
Quality Improvement
Quality Improvement (QI): "The organized creation of beneficial change; the attainment of unprecedented levels of performance." (Gibbons, 1994).
Prove the need for improvement
Identify specific projects
Select appropriate project team
Charter the project team activities
Provide recognition for the team
Track and follow-up to sustain improvements
Slide 10 API, 2013
Juran Trilogy
Slide 11 API, 2013
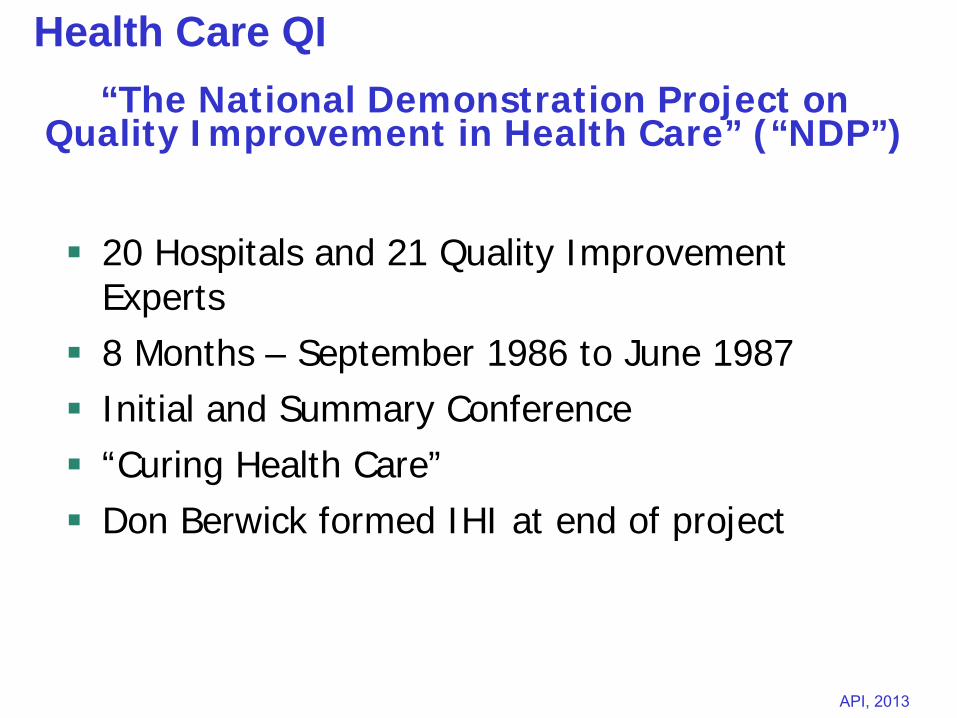
“The National Demonstration Project on Quality Improvement in Health Care” (“NDP”)
20 Hospitals and 21 Quality Improvement Experts
8 Months – September 1986 to June 1987
Initial and Summary Conference
“Curing Health Care”
Don Berwick formed IHI at end of project
Health Care QI
Slide 12 API, 2013
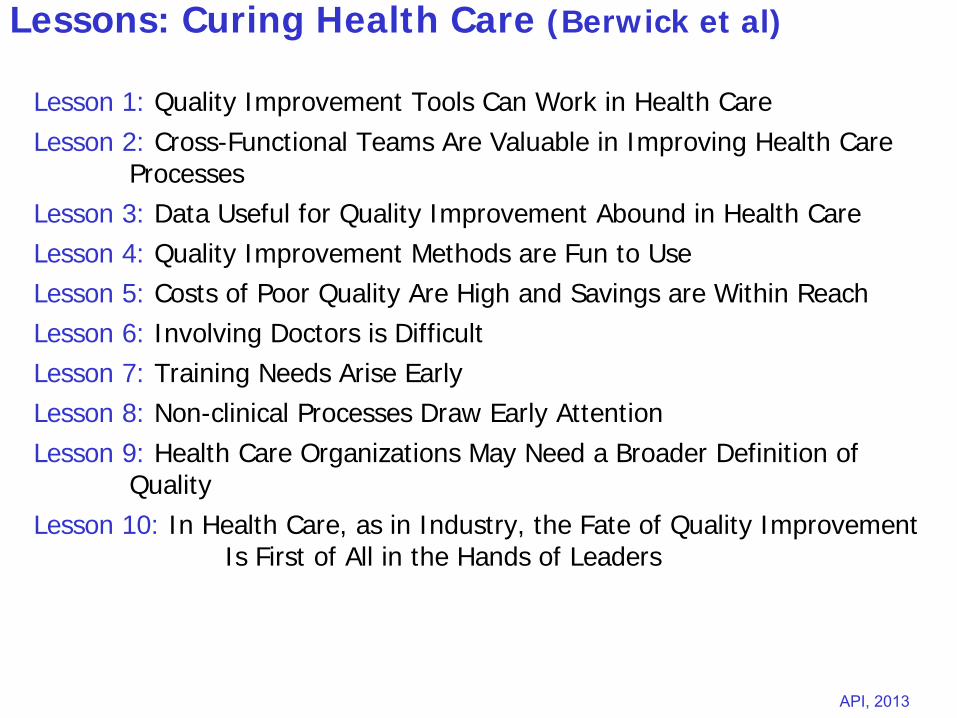
Lessons: Curing Health Care (Berwick et al)
Lesson 1: Quality Improvement Tools Can Work in Health CareLesson 2: Cross-Functional Teams Are Valuable in Improving Health Care
ProcessesLesson 3: Data Useful for Quality Improvement Abound in Health CareLesson 4: Quality Improvement Methods are Fun to UseLesson 5: Costs of Poor Quality Are High and Savings are Within ReachLesson 6: Involving Doctors is DifficultLesson 7: Training Needs Arise EarlyLesson 8: Non-clinical Processes Draw Early AttentionLesson 9: Health Care Organizations May Need a Broader Definition of
QualityLesson 10: In Health Care, as in Industry, the Fate of Quality Improvement
Is First of All in the Hands of Leaders
Slide 13 API, 2013
This article discusses a definition of quality improvement in public health and describes a continuum of quality improvement applications for public health departments.
Quality improvement is a distinct management process and set of tools and techniques that are coordinated to ensure that departments consistently meet the health needs of their communities.
Public Health Management Practice, 2010, 16(1), 5–7Copyright C 2010 Wolters Kluwer Health | Lippincott Williams & Wilkins
Slide 14 API, 2013Associates in Process Improvement, 2013
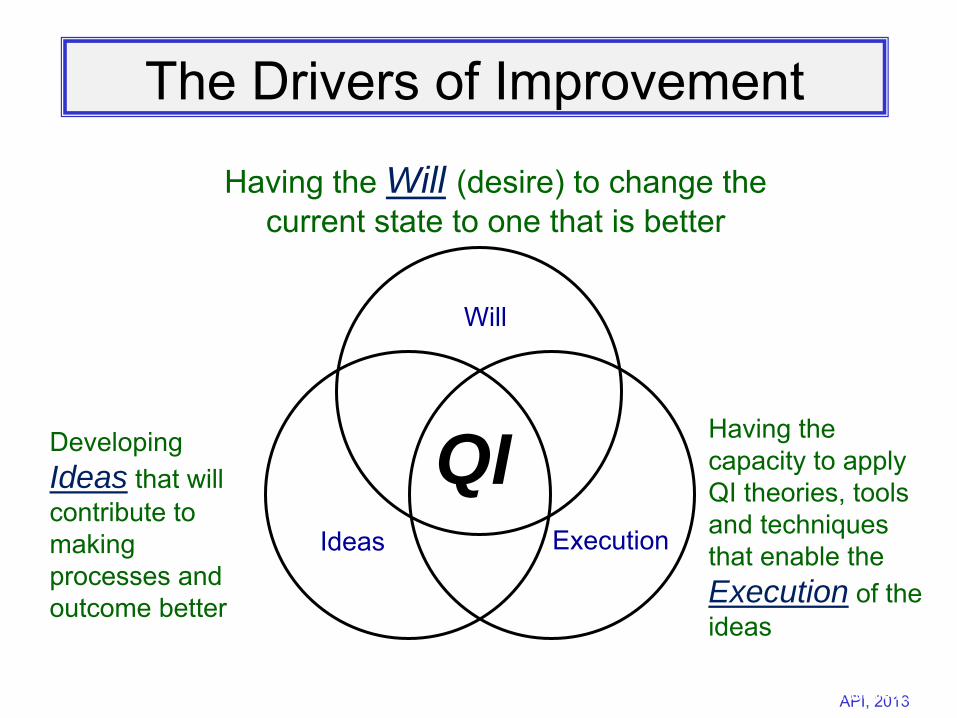
The Drivers of Improvement
Will
Ideas Execution
QI
Having the Will (desire) to change the current state to one that is better
Developing
Ideas that will contribute to making processes and outcome better
Having the capacity to apply QI theories, tools and techniques that enable the Execution of the ideas
Slide 15 API, 2013
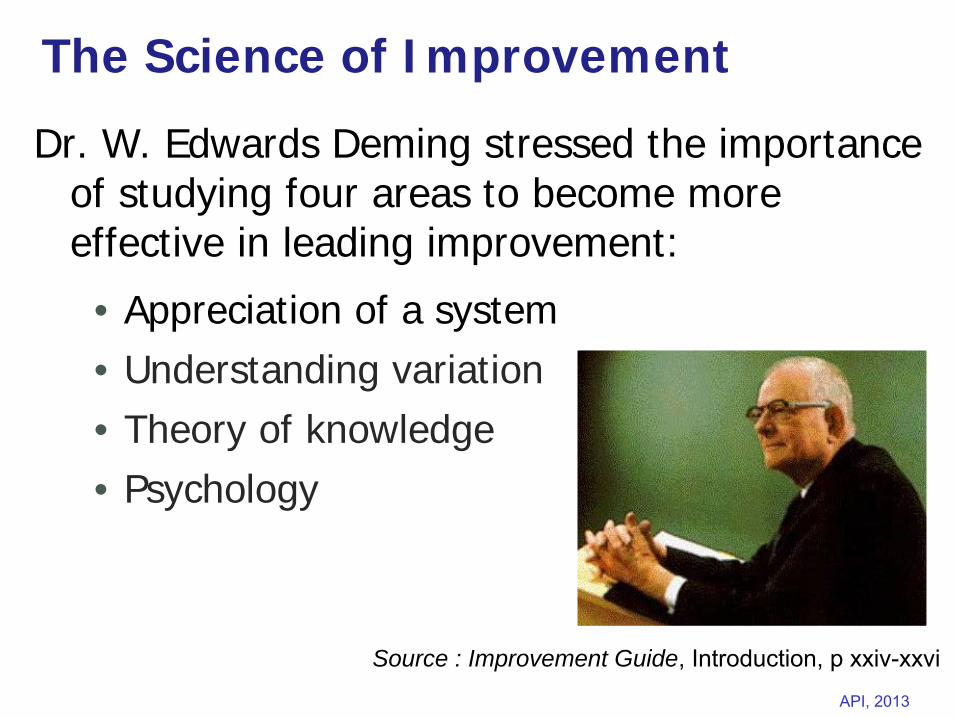
The Science of Improvement
Dr. W. Edwards Deming stressed the importance of studying four areas to become more effective in leading improvement:
• Appreciation of a system• Understanding variation• Theory of knowledge• Psychology
Source : Improvement Guide, Introduction, p xxiv-xxvi
Slide 16 API, 2013
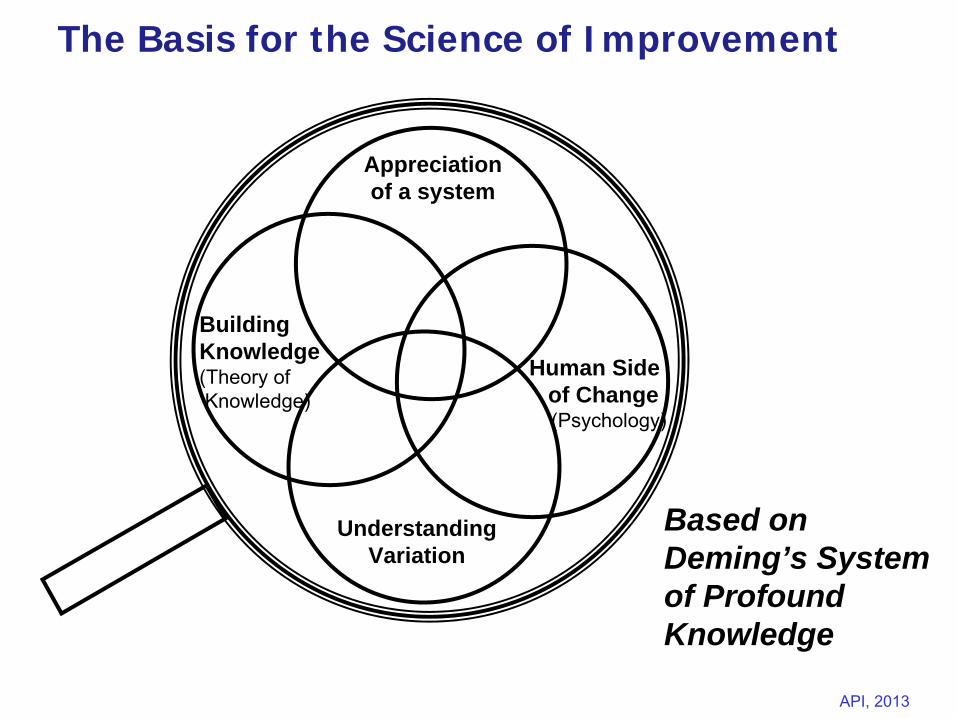
The Basis for the Science of Improvement
Human Sideof Change(Psychology)
Appreciation of a system
Building Knowledge (Theory of Knowledge)
Understanding Variation
Based on Deming’s System of Profound Knowledge
Slide 17 API, 2013
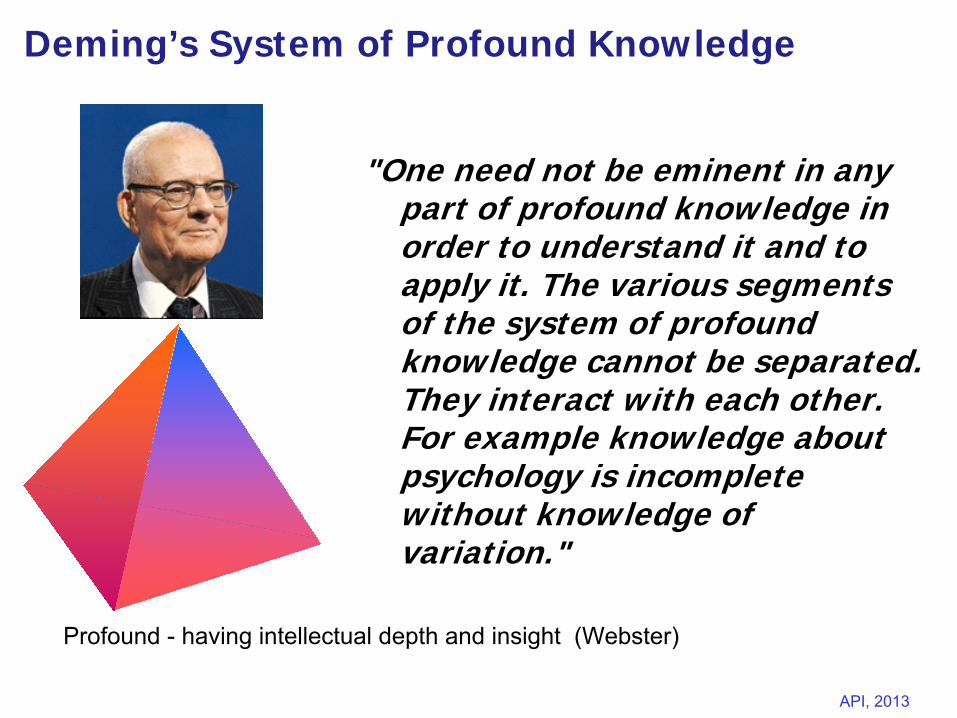
Deming’s System of Profound Knowledge
"One need not be eminent in any part of profound knowledge in order to understand it and to apply it. The various segments of the system of profound knowledge cannot be separated. They interact with each other. For example knowledge about psychology is incomplete without knowledge of variation."
Profound -
having intellectual depth and insight (Webster)
Slide 18 API, 2013
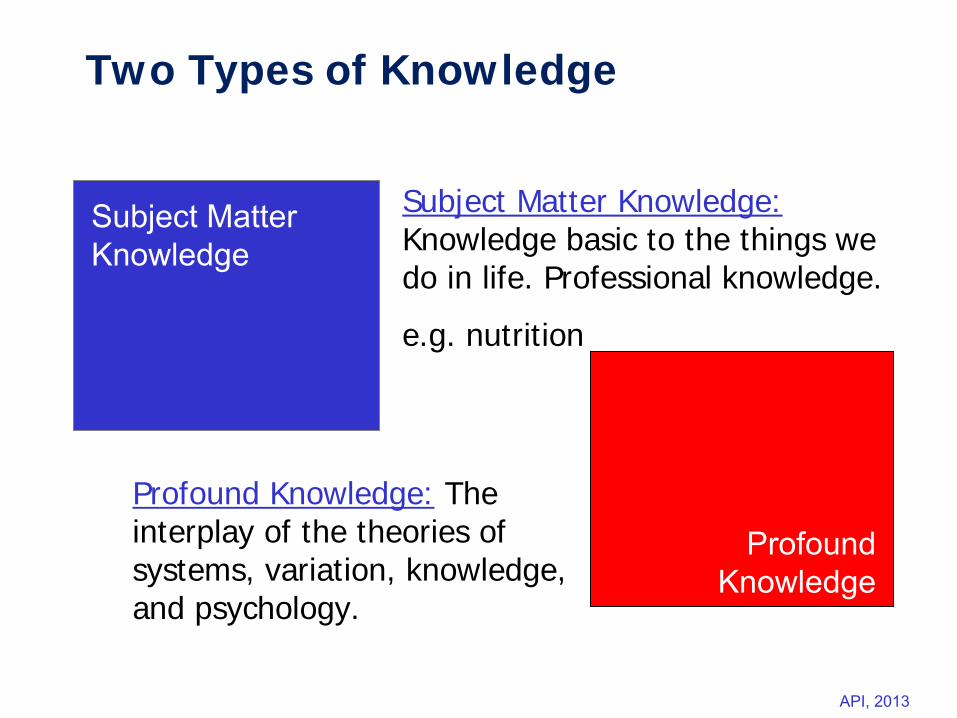
Two Types of Knowledge
Profound Knowledge
Subject Matter Knowledge
Profound Knowledge: The interplay of the theories of systems, variation, knowledge, and psychology.
Subject Matter Knowledge: Knowledge basic to the things we do in life. Professional knowledge.
e.g. nutrition
Slide 19 API, 2013
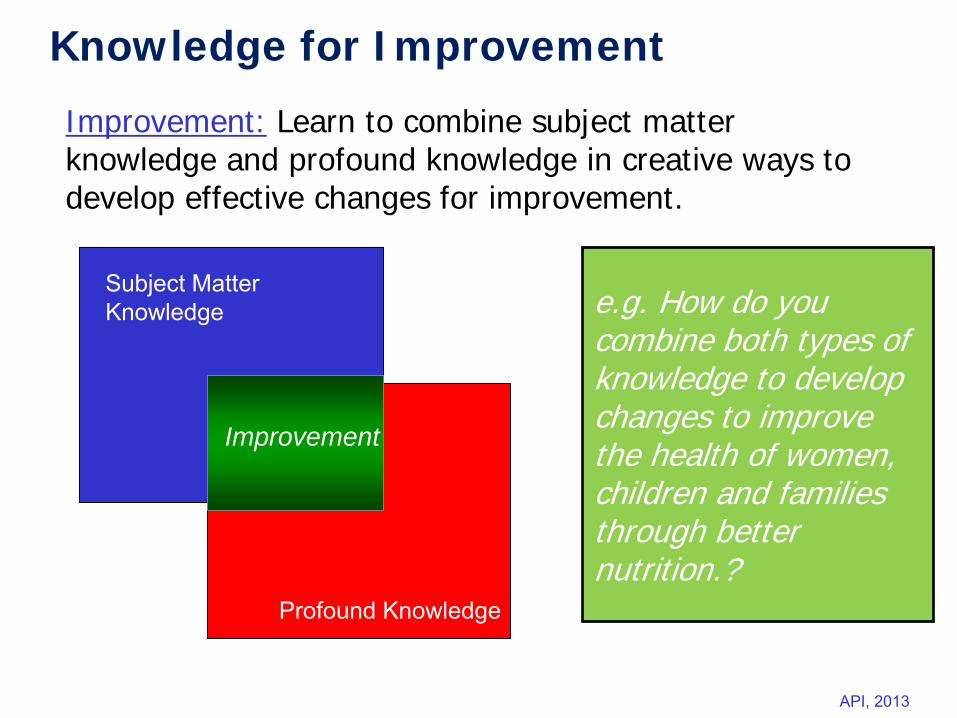
Knowledge for Improvement
Profound Knowledge
Subject Matter Knowledge
Improvement: Learn to combine subject matter knowledge and profound knowledge in creative ways to develop effective changes for improvement.
Improvement
e.g. How do you combine both types of knowledge to develop changes to improve the health of women, children and families through better nutrition.?
Slide 20 API, 2013
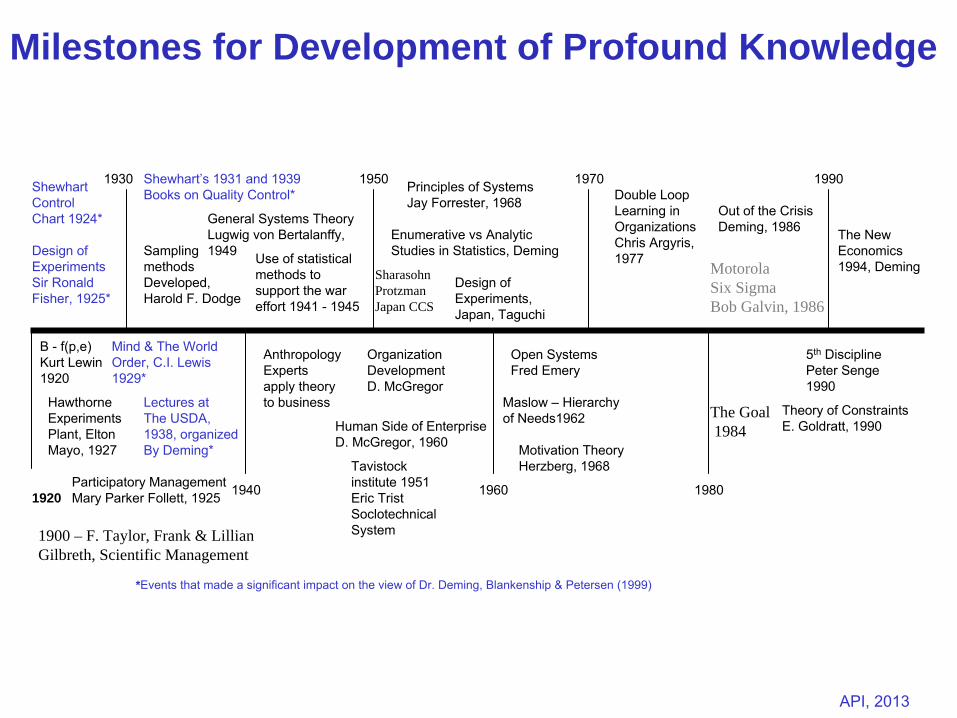
1920
ShewhartControlChart 1924*
Design ofExperimentsSir RonaldFisher, 1925*
*Events that made a significant impact on the view of Dr. Deming,
Blankenship & Petersen (1999)
SamplingmethodsDeveloped,Harold F. Dodge
Use of statisticalmethods tosupport the wareffort 1941 -
1945
Principles of SystemsJay Forrester, 1968
Design ofExperiments,Japan, Taguchi
1930 1950 1970 1990
B -
f(p,e)Kurt Lewin1920
Hawthorne ExperimentsPlant, EltonMayo, 1927
AnthropologyExpertsapply theoryto business
OrganizationDevelopmentD. McGregor
Tavistockinstitute 1951Eric TristSoclotechnicalSystem
Open SystemsFred Emery
Maslow –
Hierarchy of Needs1962
1940 1960 1980
Enumerative vs AnalyticStudies in Statistics, Deming
Mind & The World Order, C.I. Lewis1929*
General Systems TheoryLugwig von Bertalanffy,1949
Shewhart’s 1931 and 1939Books on Quality Control*
5th
DisciplinePeter Senge1990
Theory of ConstraintsE. Goldratt, 1990
Participatory ManagementMary Parker Follett, 1925
Human Side of EnterpriseD. McGregor, 1960 Motivation Theory
Herzberg, 1968
Double LoopLearning in OrganizationsChris Argyris,1977
Out of the CrisisDeming, 1986
Lectures atThe USDA,1938, organizedBy Deming*
The NewEconomics1994, DemingMotorola
Six SigmaBob Galvin, 1986
The Goal1984
SharasohnProtzmanJapan CCS
1900 – F. Taylor, Frank & LillianGilbreth, Scientific Management
Milestones for Development of Profound Knowledge
Slide 21 API, 2013
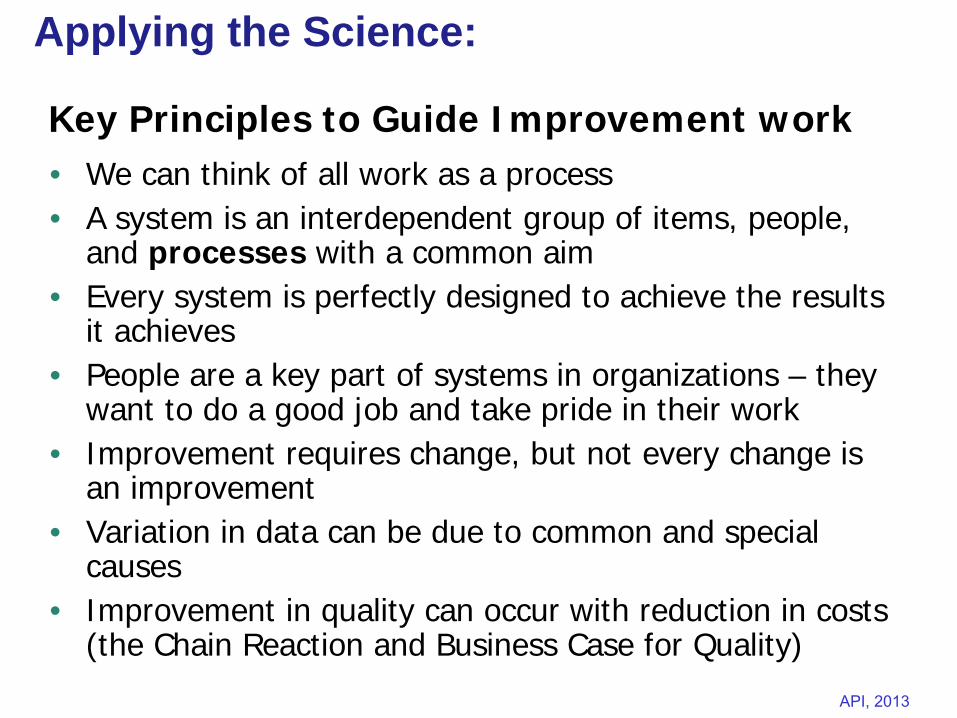
Key Principles to Guide Improvement work• We can think of all work as a process • A system is an interdependent group of items, people,
and processes with a common aim• Every system is perfectly designed to achieve the results
it achieves• People are a key part of systems in organizations – they
want to do a good job and take pride in their work• Improvement requires change, but not every change is
an improvement• Variation in data can be due to common and special
causes• Improvement in quality can occur with reduction in costs
(the Chain Reaction and Business Case for Quality)
Applying the Science:
Slide 22 API, 2013
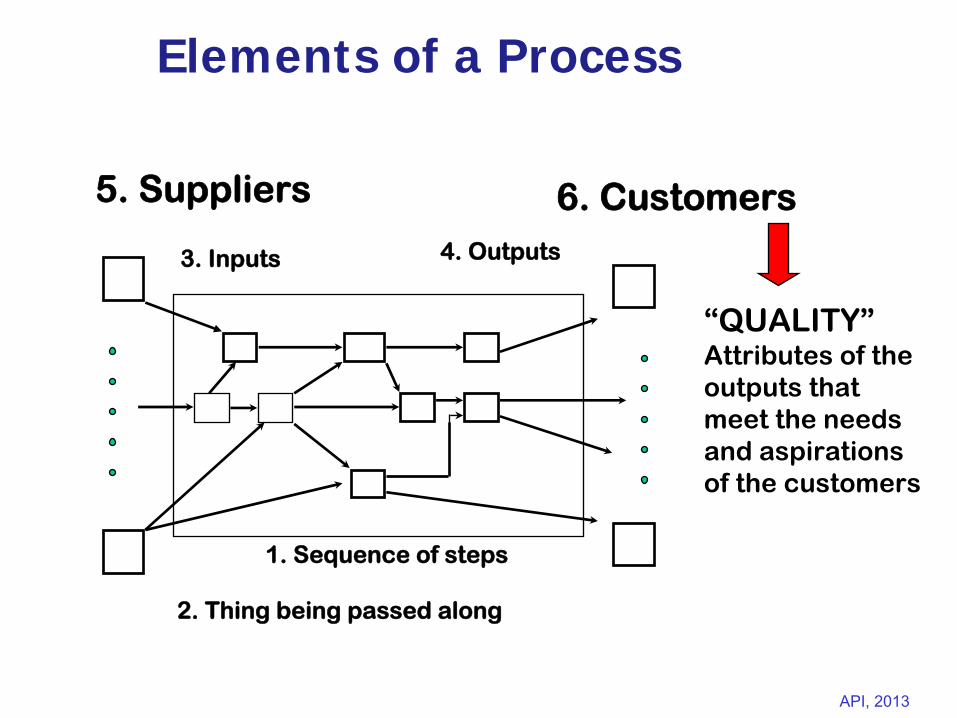
Elements of a Process
5. Suppliers 6. Customers
2. Thing being passed along
3.
Inputs 4. Outputs
1. Sequence of steps
“QUALITY”Attributes of the outputs that meet the needs and aspirations of the customers
Slide 23 API, 2013
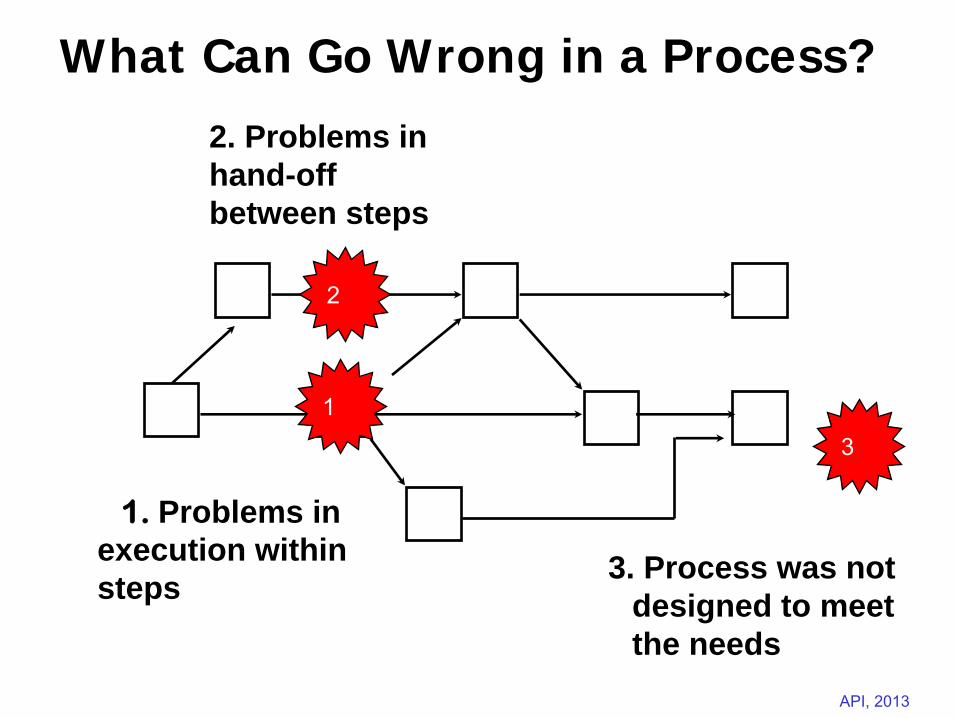
What Can Go Wrong in a Process?
1. Problems inexecution withinsteps
2
1
2. Problems inhand-offbetween steps
3
3. Process was not designed to meet the needs
Slide 24 API, 2013
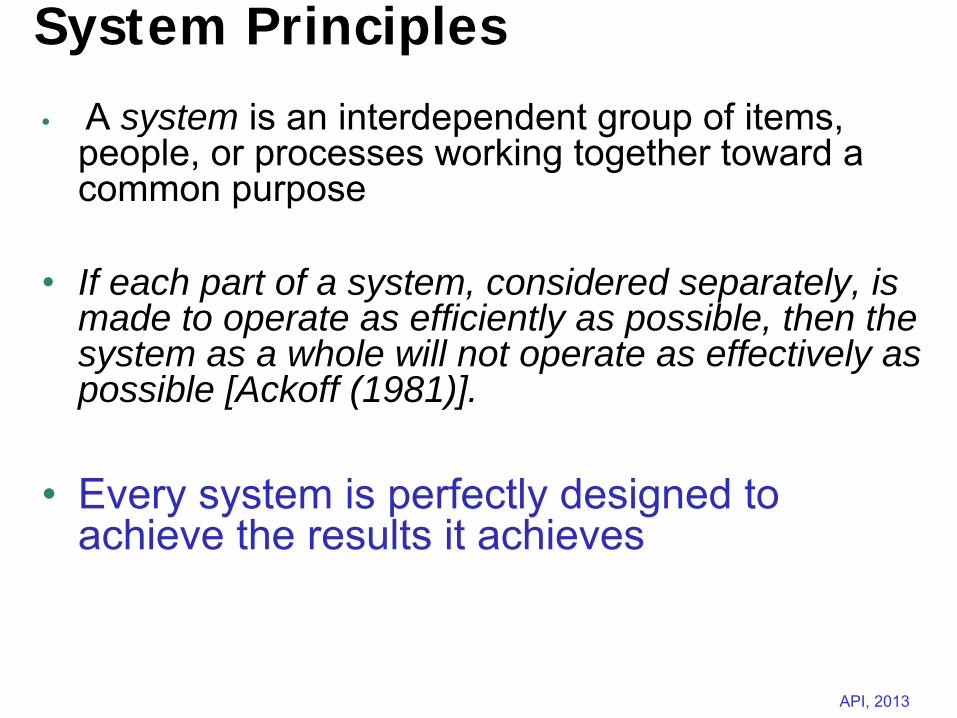
System Principles
• A system is an interdependent group of items, people, or processes working together toward a common purpose
•
If each part of a system, considered separately, is made to operate as efficiently as possible, then the system as a whole will not operate as effectively as possible [Ackoff (1981)].
•
Every system is perfectly designed to achieve the results it achieves
Slide 25 API, 2013
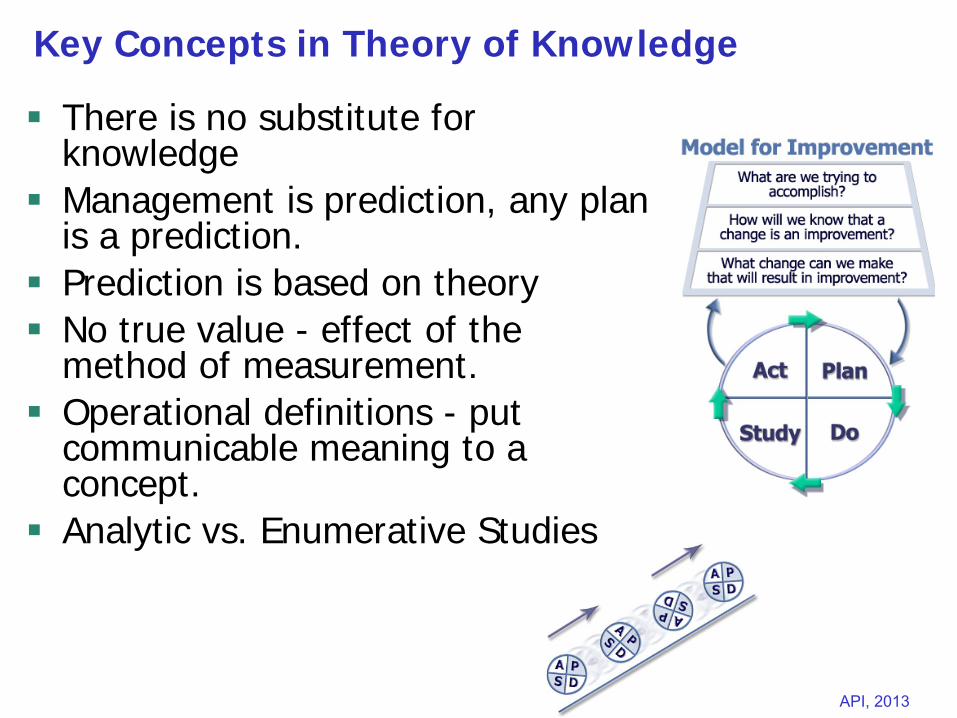
Key Concepts in Theory of Knowledge
There is no substitute for knowledge
Management is prediction, any plan is a prediction.
Prediction is based on theory
No true value - effect of the method of measurement.
Operational definitions - put communicable meaning to a concept.
Analytic vs. Enumerative Studies
Slide 26 API, 2013
Appreciation of a System
Theory of Knowledge
Psychology
UnderstandingVariation
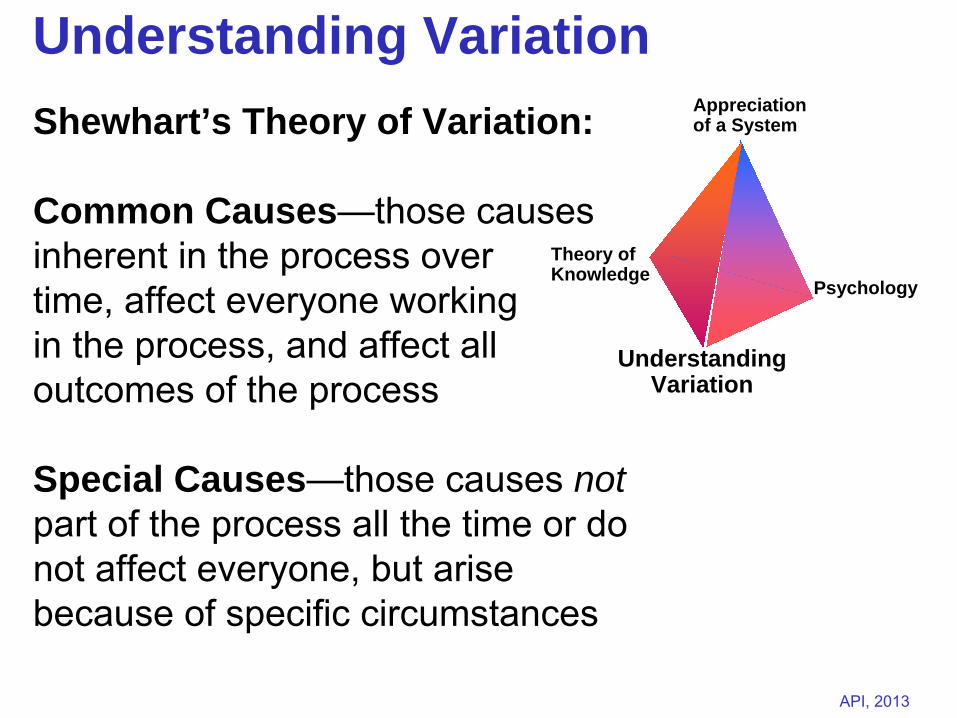
Understanding VariationShewhart’s Theory of Variation:
Common Causes—those causes inherent in the process over time, affect everyone working in the process, and affect all outcomes of the process
Special Causes—those causes not part of the process all the time or do not affect everyone, but arise because of specific circumstances
Slide 27 API, 2013
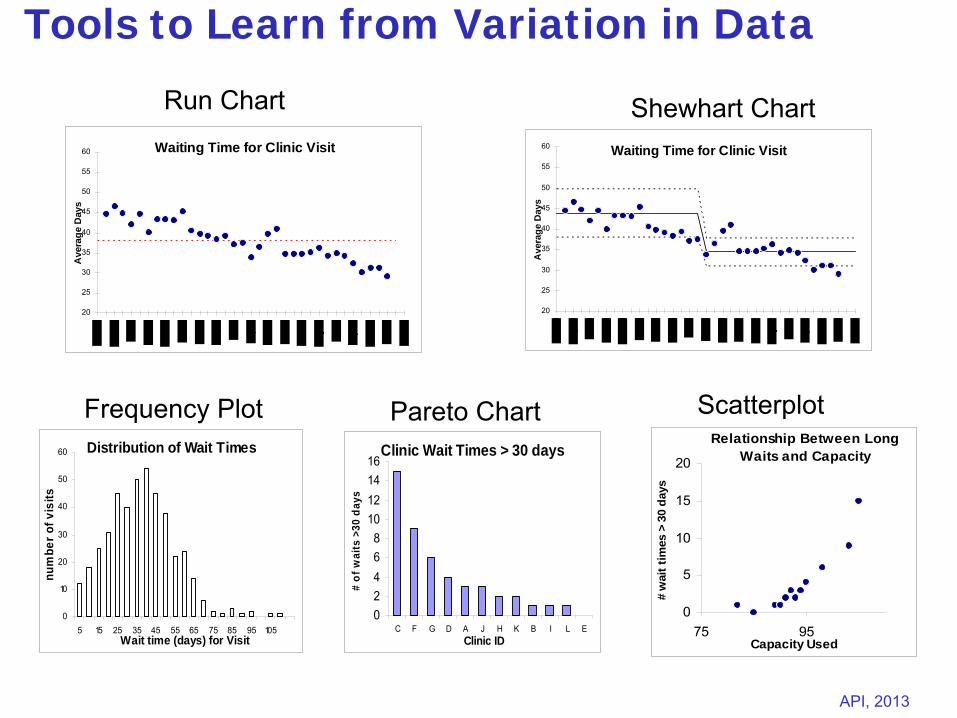
Tools to Learn from Variation in Data
Waiting Time for Clinic Visit
20
25
30
35
40
45
50
55
60
Ave
rage
Day
s
Waiting Time for Clinic Visit
20
25
30
35
40
45
50
55
60
Ave
rage
Day
s
Distribution of Wait Times
0
10
20
30
40
50
60
5 15 25 35 45 55 65 75 85 95 105Wait time (days) for Visit
num
ber o
f vis
its
Clinic Wait Times > 30 days
02468
10121416
C F G D A J H K B I L EClinic ID
# of
wai
ts >
30 d
ays
Relationship Between Long Waits and Capacity
0
5
10
15
20
75 95Capacity Used
# w
ait t
imes
> 3
0 da
ys
Run Chart Shewhart Chart
Frequency Plot Pareto Chart Scatterplot
IH p. 8-34
Slide 28 API, 2013
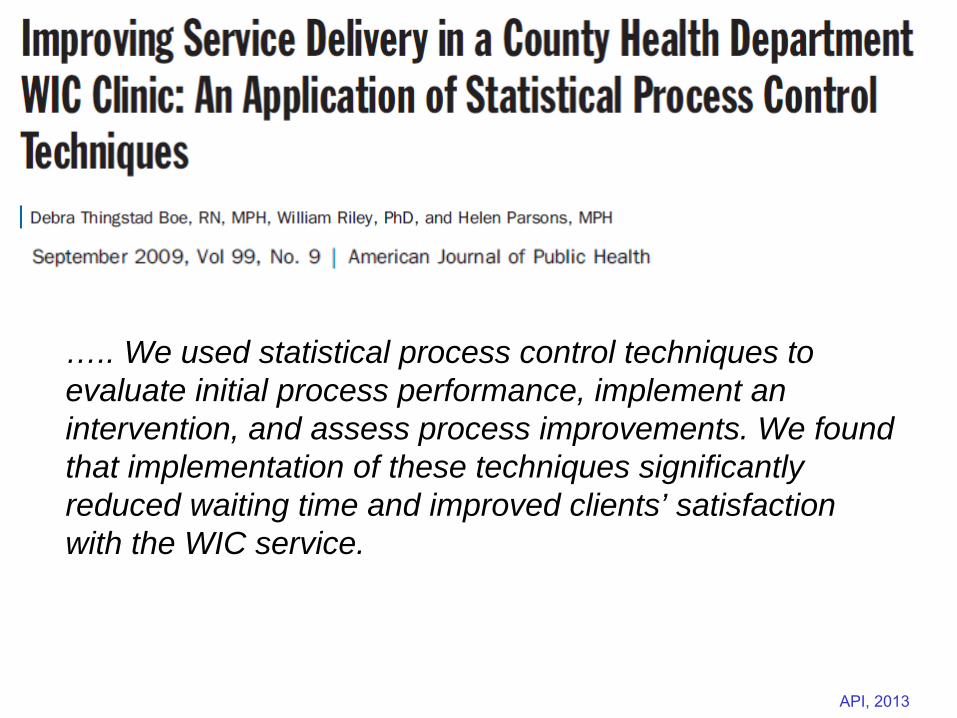
….. We used statistical process control techniques to evaluate initial process performance, implement an intervention, and assess process improvements. We found that implementation of these techniques significantly reduced waiting time and improved clients’ satisfaction with the WIC service.
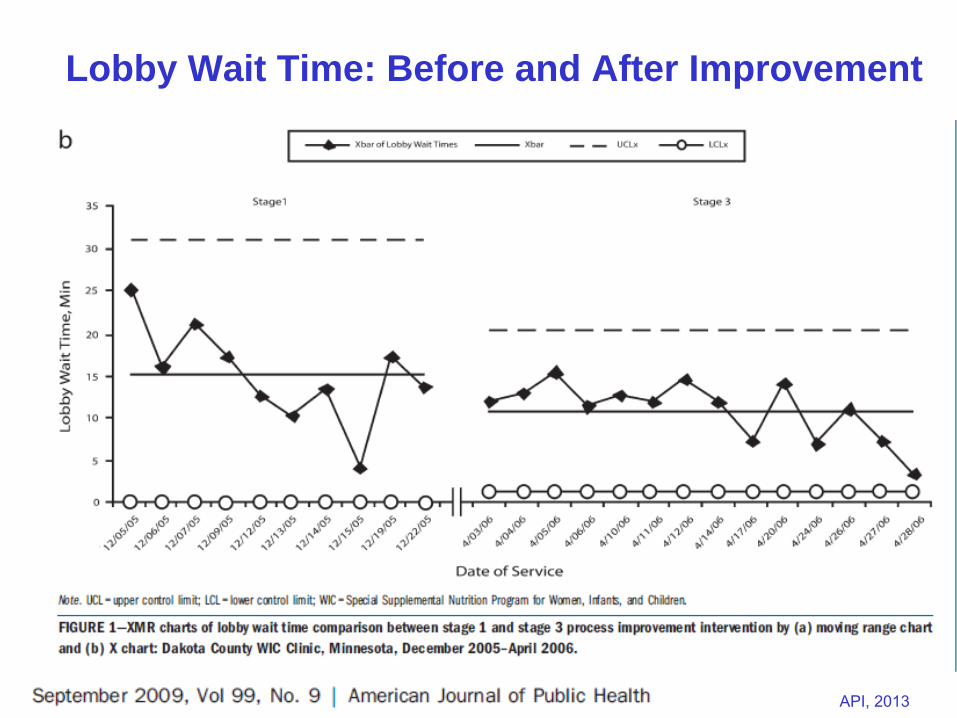
Slide 29 API, 2013
Lobby Wait Time: Before and After Improvement
Slide 30 API, 2013
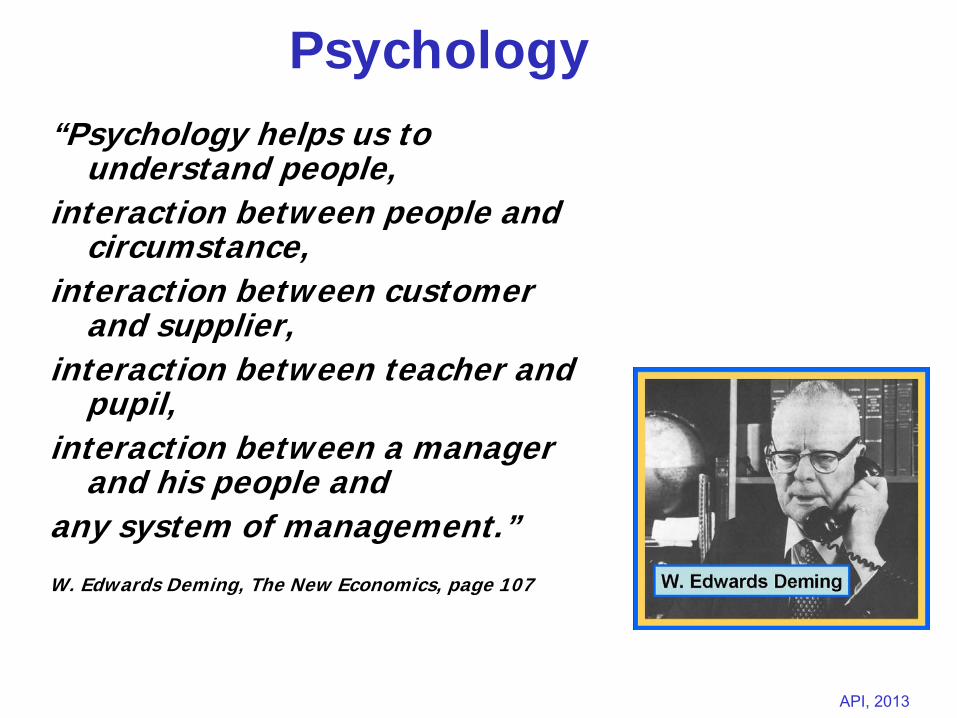
Psychology “Psychology helps us to
understand people, interaction between people and
circumstance, interaction between customer
and supplier, interaction between teacher and
pupil, interaction between a manager
and his people and any system of management.”
W. Edwards Deming, The New Economics, page 107
Slide 31 API, 2013
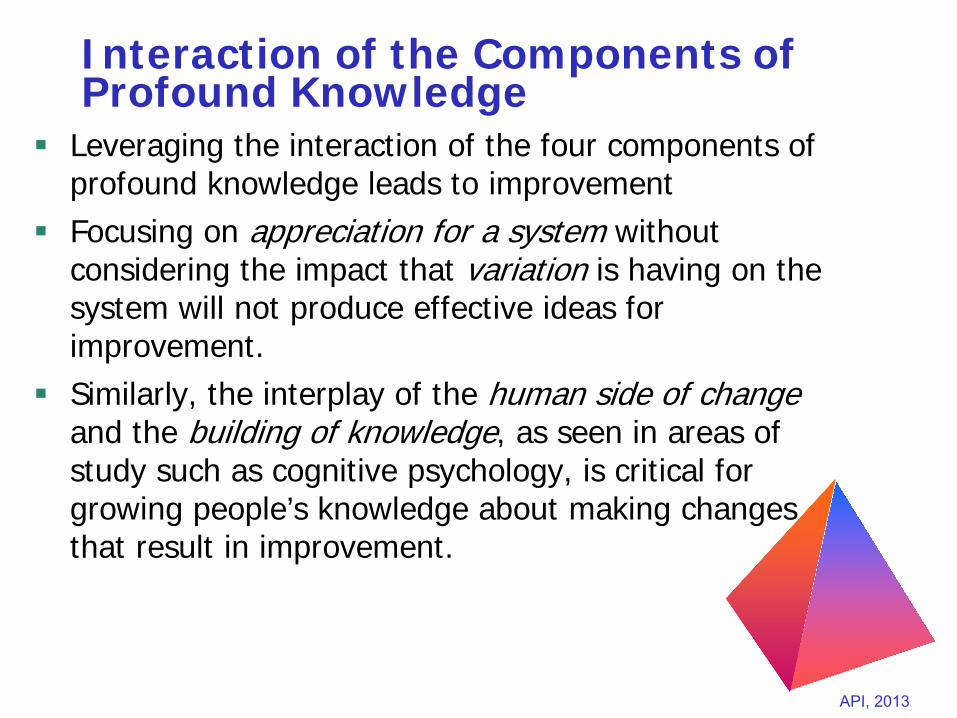
Interaction of the Components of Profound Knowledge
Leveraging the interaction of the four components of profound knowledge leads to improvement
Focusing on appreciation for a system without considering the impact that variation is having on the system will not produce effective ideas for improvement.
Similarly, the interplay of the human side of change and the building of knowledge, as seen in areas of study such as cognitive psychology, is critical for growing people’s knowledge about making changes that result in improvement.
Slide 32 API, 2013
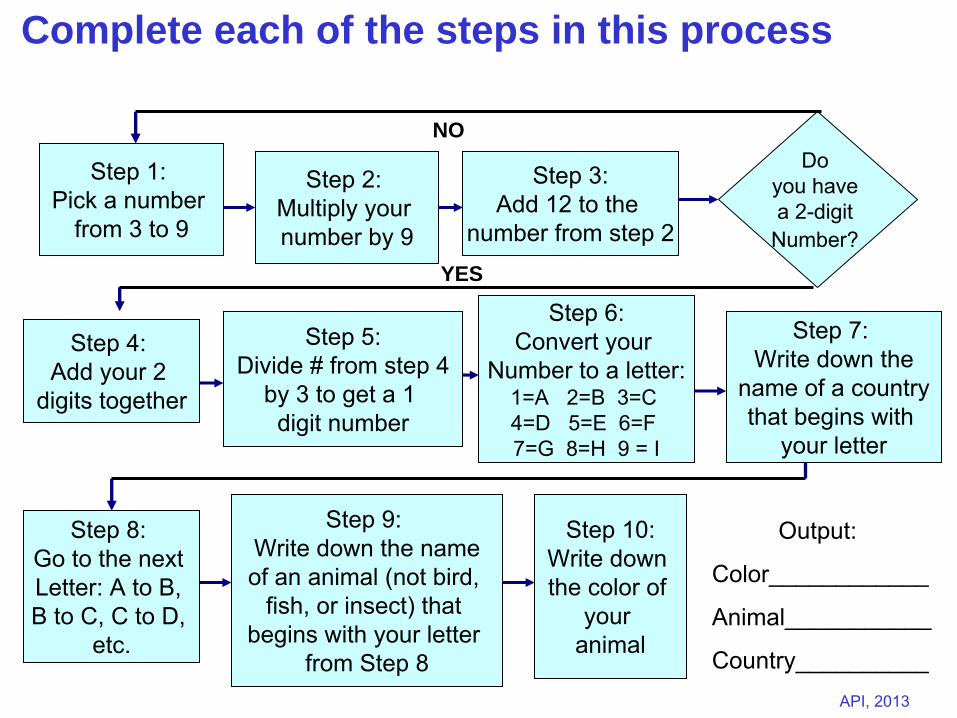
Step 1: Pick a number
from 3 to 9
Step 2: Multiply your number by 9
Step 3:Add 12 to the
number from step 2
Step 7: Write down the
name of a countrythat begins with
your letter
Step 4: Add your 2
digits together
Step 5:Divide # from step 4
by 3 to get a 1 digit number
Step 6:Convert your
Number to a letter:1=A 2=B 3=C 4=D 5=E 6=F 7=G 8=H 9 = I
Step 8: Go to the next Letter: A to B, B to C, C to D,
etc.
Step 9: Write down the nameof an animal (not bird,
fish, or insect) that begins with your letter
from Step 8
Step 10:Write down the color of
your animal
Do you have a 2-digit
Number?
Complete each of the steps in this process
NO
YES
Output:
Color____________
Animal___________
Country__________
Slide 33 API, 2013
A Gray Elephant
in Denmark
“Every system is perfectly designed to achieve exactly the results that it gets”
Slide 34 API, 2013
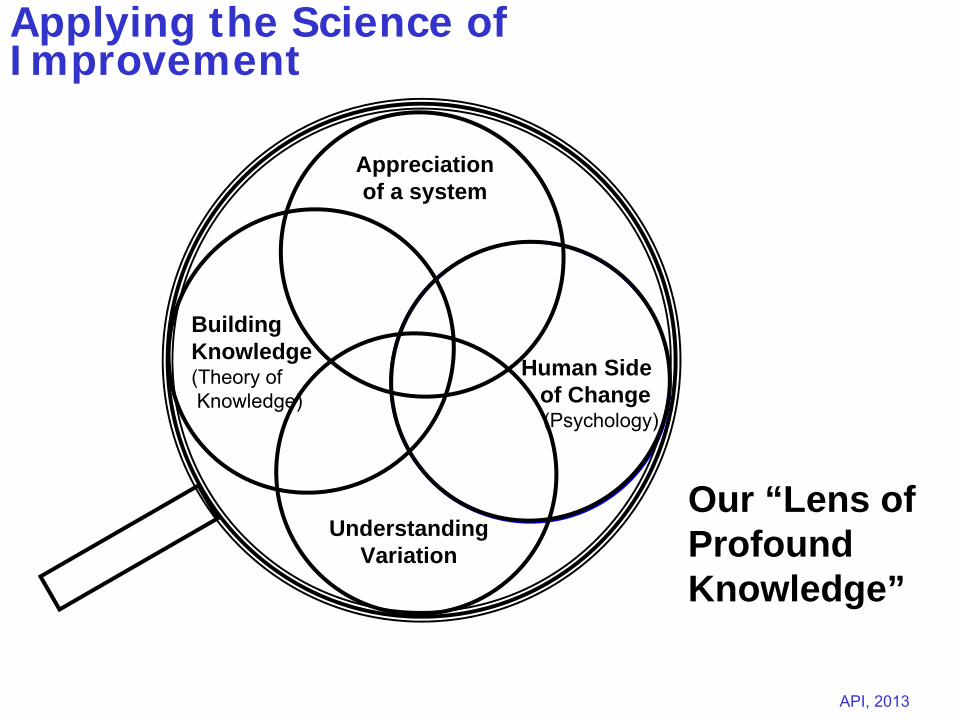
Applying the Science of Improvement
Human Sideof Change(Psychology)
Appreciation of a system
Building Knowledge (Theory of Knowledge)
Understanding Variation
Our “Lens of Profound Knowledge”
Slide 35 API, 2013Associates in Process Improvement, 2013
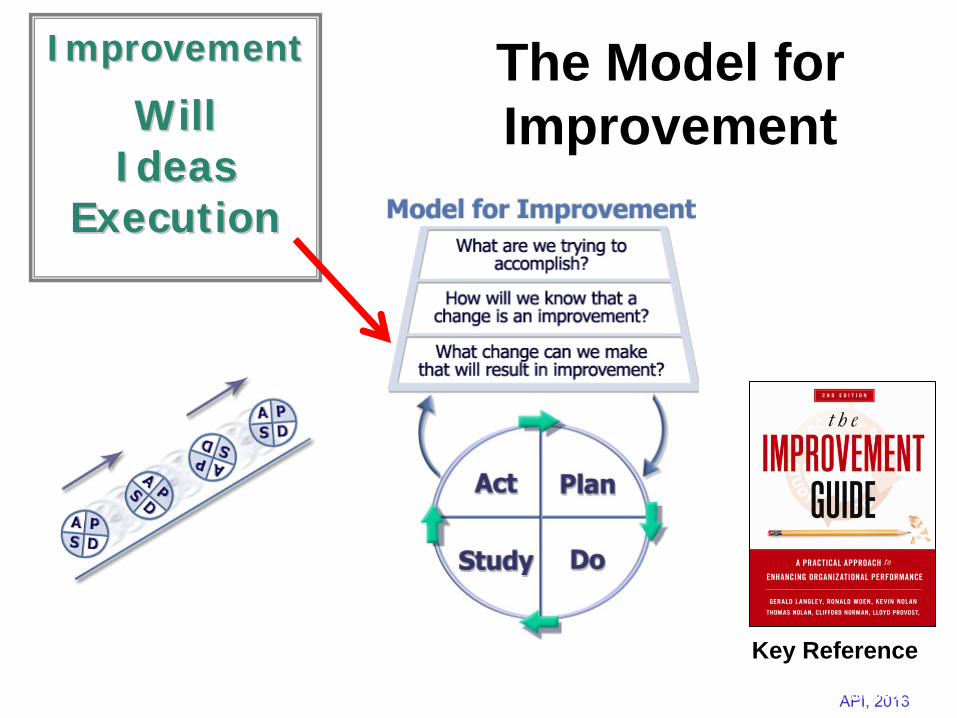
ImprovementImprovement
WillWill IdeasIdeas
ExecutionExecution
Key Reference
The Model for Improvement
Slide 36 API, 2013
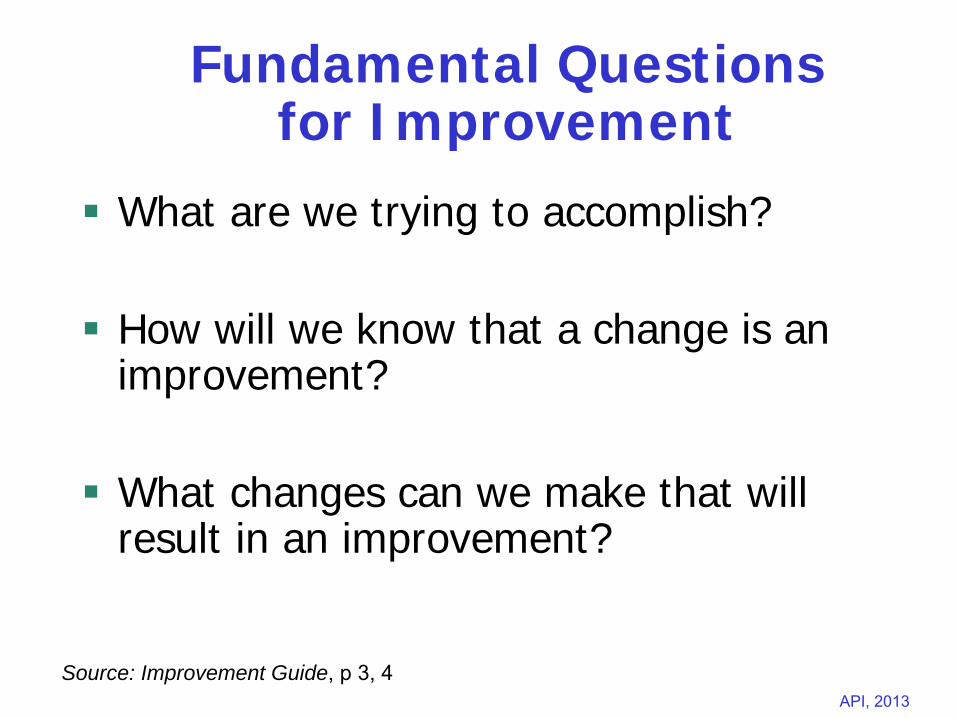
Fundamental Questions for Improvement
What are we trying to accomplish?
How will we know that a change is an improvement?
What changes can we make that will result in an improvement?
Source: Improvement Guide, p 3, 4
Slide 37 API, 2013
Act Plan
Study Do
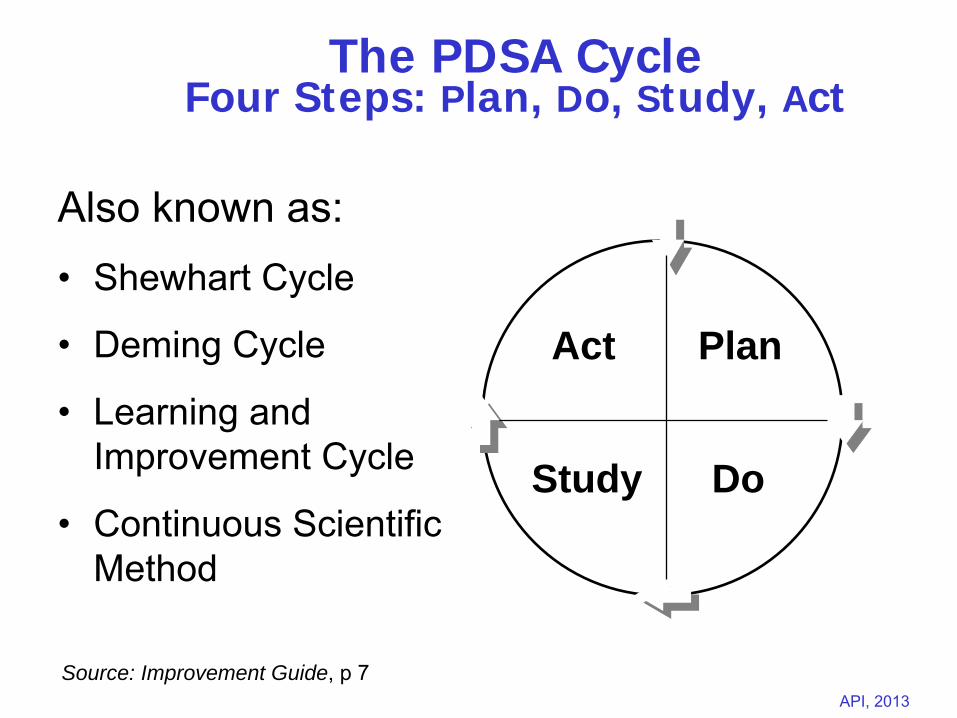
The PDSA Cycle Four Steps: Plan, Do, Study, Act
Also known as:•
Shewhart Cycle
•
Deming Cycle
•
Learning and Improvement Cycle
•
Continuous Scientific Method
Source: Improvement Guide, p 7
Slide 38 API, 2013
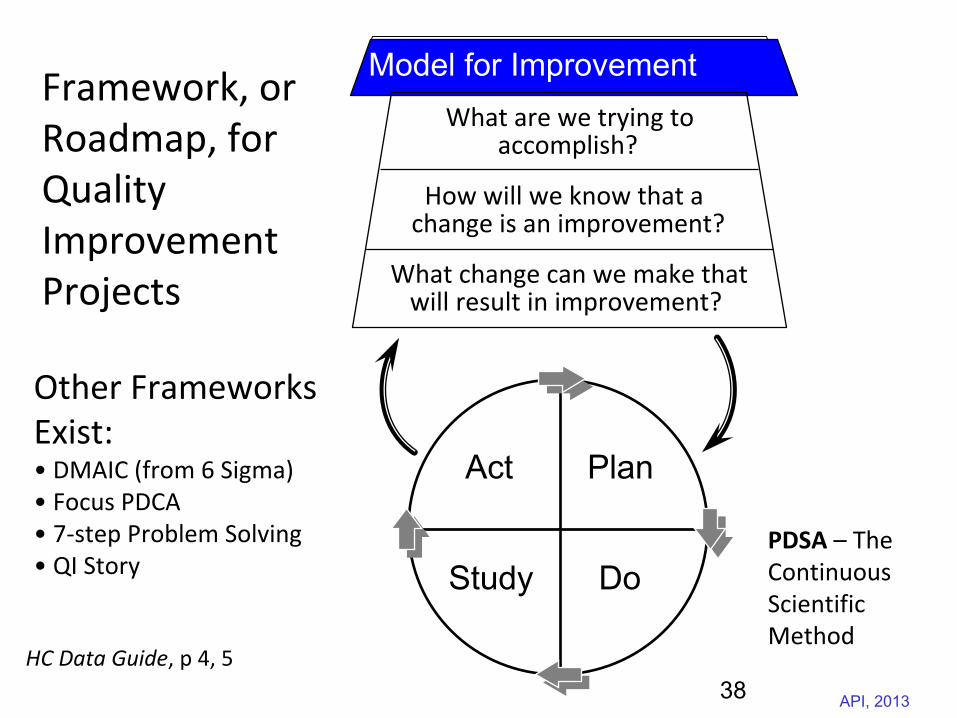
What are we trying toaccomplish?
How will we know that achange is an improvement?
What change can we make thatwill result in improvement?
Model for Improvement
Act Plan
Study Do
HC Data Guide, p 4, 5
Framework, or Roadmap, for
Quality Improvement
Projects
Other Frameworks Exist:• DMAIC (from 6 Sigma)• Focus PDCA• 7‐step Problem Solving• QI Story
PDSA
– The
Continuous
Scientific
Method
38
Slide 39 API, 2013
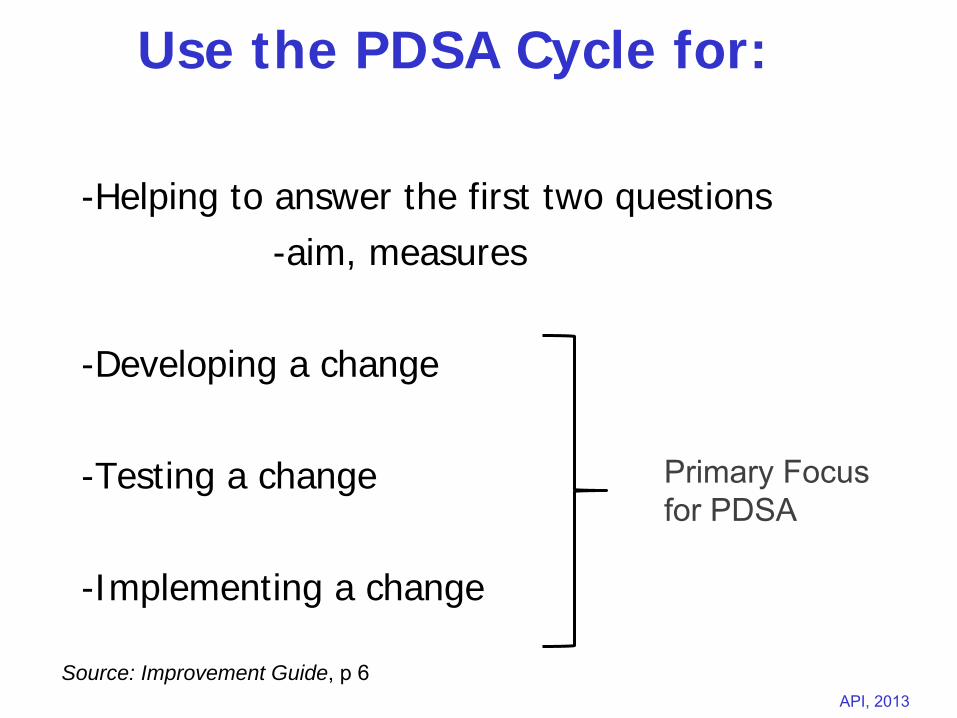
Use the PDSA Cycle for:
-Helping to answer the first two questions-aim, measures
-Developing a change
-Testing a change
-Implementing a change
Source: Improvement Guide, p 6
Primary Focus for PDSA
Slide 40 API, 2013
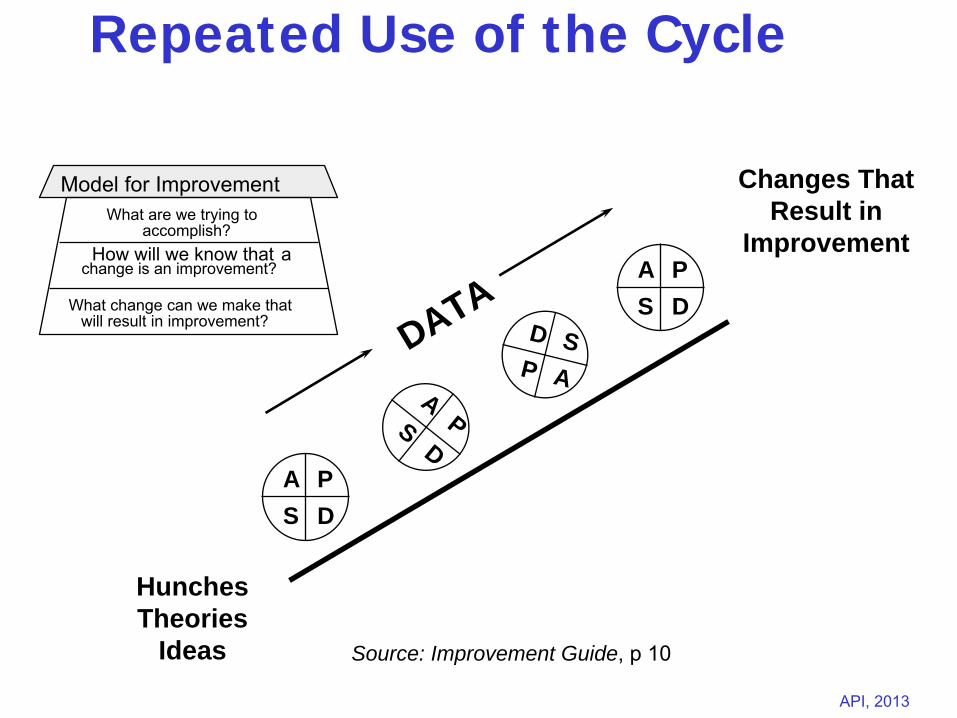
Repeated Use of the Cycle
Hunches Theories
Ideas
Changes That Result in
Improvement
A PS D
APS
D
A PS D
D SP A
DATA
What are we trying toaccomplish?
How will we know that
achange is an improvement?
What change can we make thatwill result in improvement?
Model for Improvement
Source: Improvement Guide, p 10
Slide 41 API, 2013
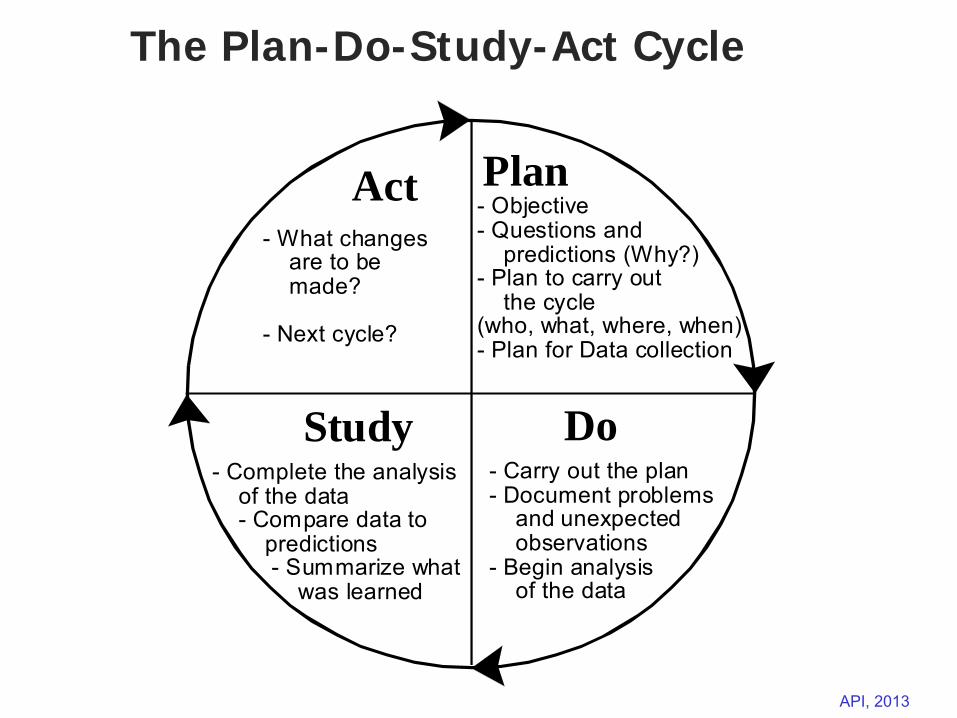
The Plan-Do-Study-Act Cycle
PlanAct
DoStudy
- Objective- Questions and predictions (Why?)- Plan to carry out the cycle(who, what, where, when)- Plan for Data collection
- Carry out the plan- Document problems and unexpected observations- Begin analysis of the data
- Complete the analysis of the data - Compare data to predictions - Summarize what was learned
- What changes are to be made?
- Next cycle?
Slide 42 API, 2013
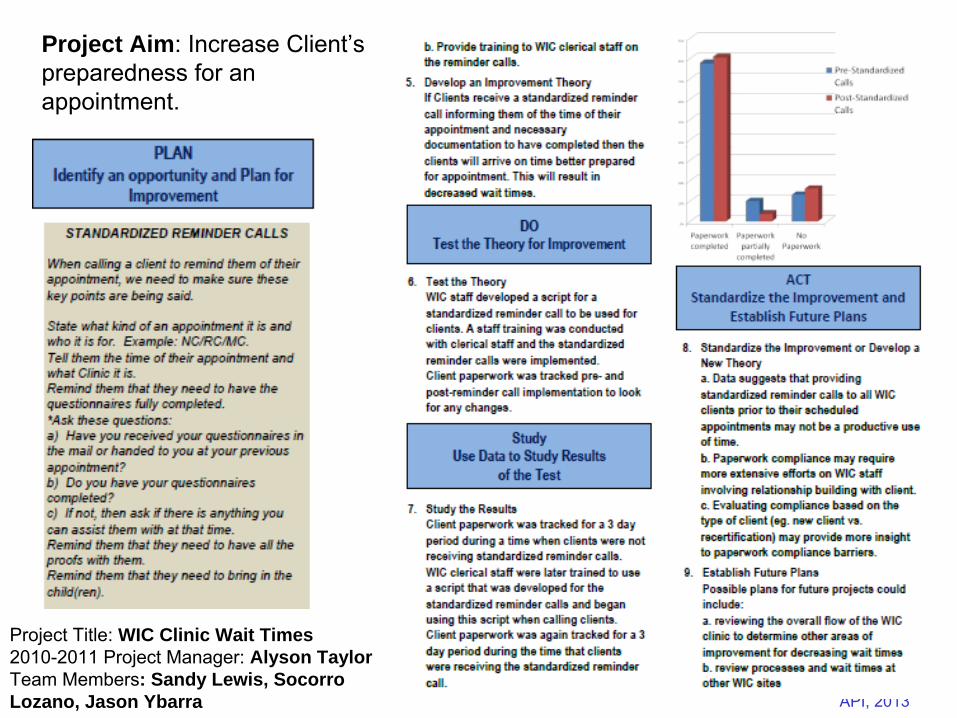
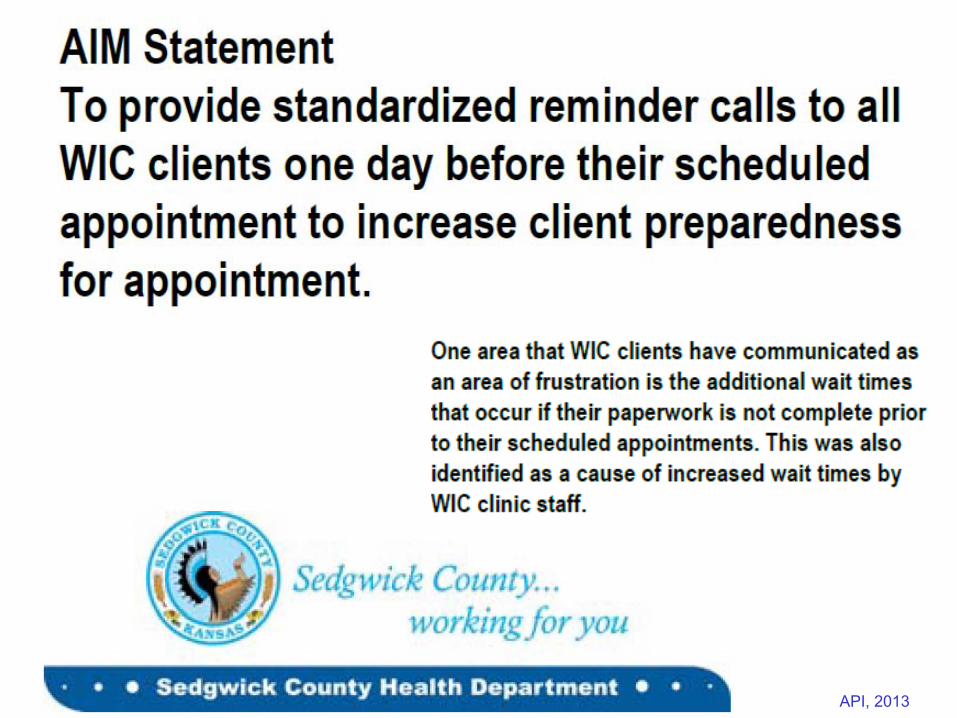
Project Title: WIC Clinic Wait Times2010-2011 Project Manager: Alyson TaylorTeam Members: Sandy Lewis, Socorro Lozano, Jason Ybarra
Project Aim: Increase Client’s preparedness for an appointment.
Slide 43 API, 2013
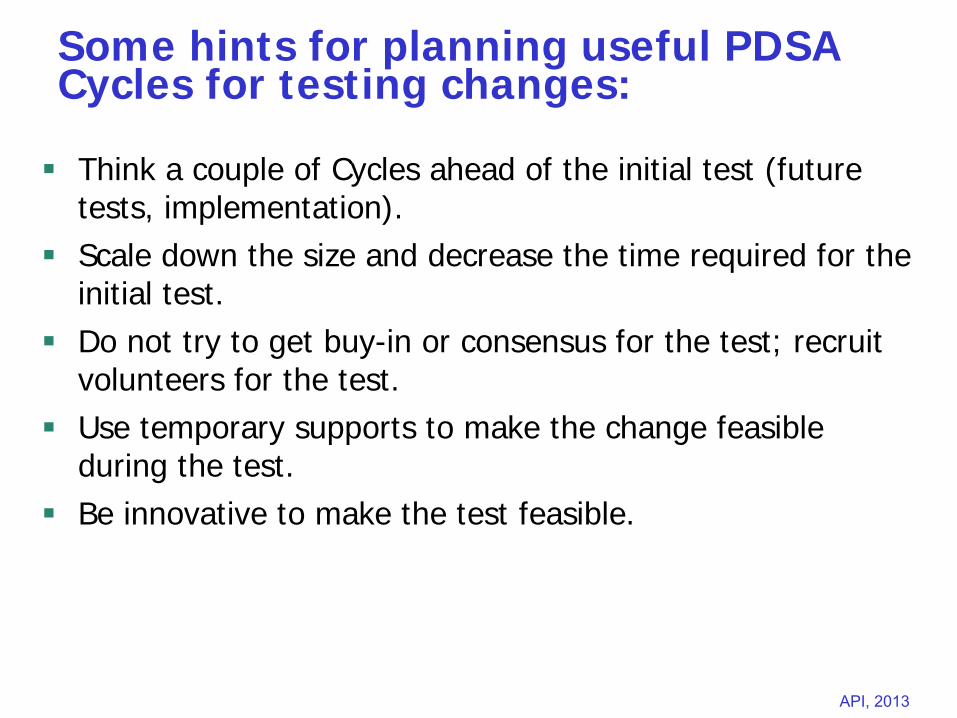
Some hints for planning useful PDSA Cycles for testing changes:
Think a couple of Cycles ahead of the initial test (future tests, implementation).
Scale down the size and decrease the time required for the initial test.
Do not try to get buy-in or consensus for the test; recruit volunteers for the test.
Use temporary supports to make the change feasible during the test.
Be innovative to make the test feasible.
Slide 44 API, 2013
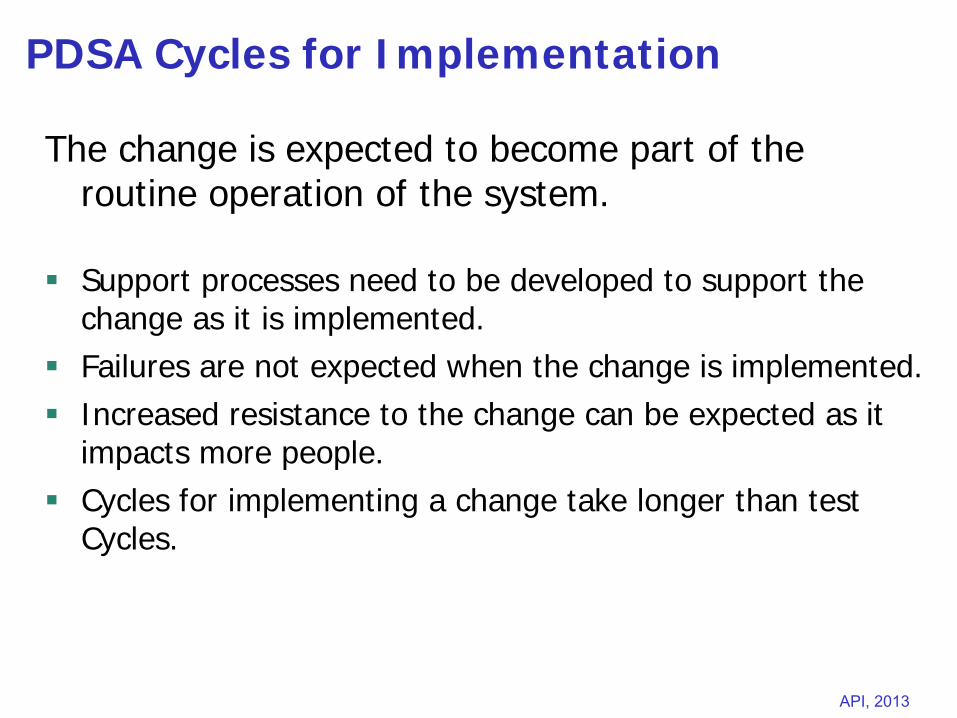
PDSA Cycles for Implementation
The change is expected to become part of the routine operation of the system.
Support processes need to be developed to support the change as it is implemented.
Failures are not expected when the change is implemented.
Increased resistance to the change can be expected as it impacts more people.
Cycles for implementing a change take longer than test Cycles.
Slide 45 API, 2013
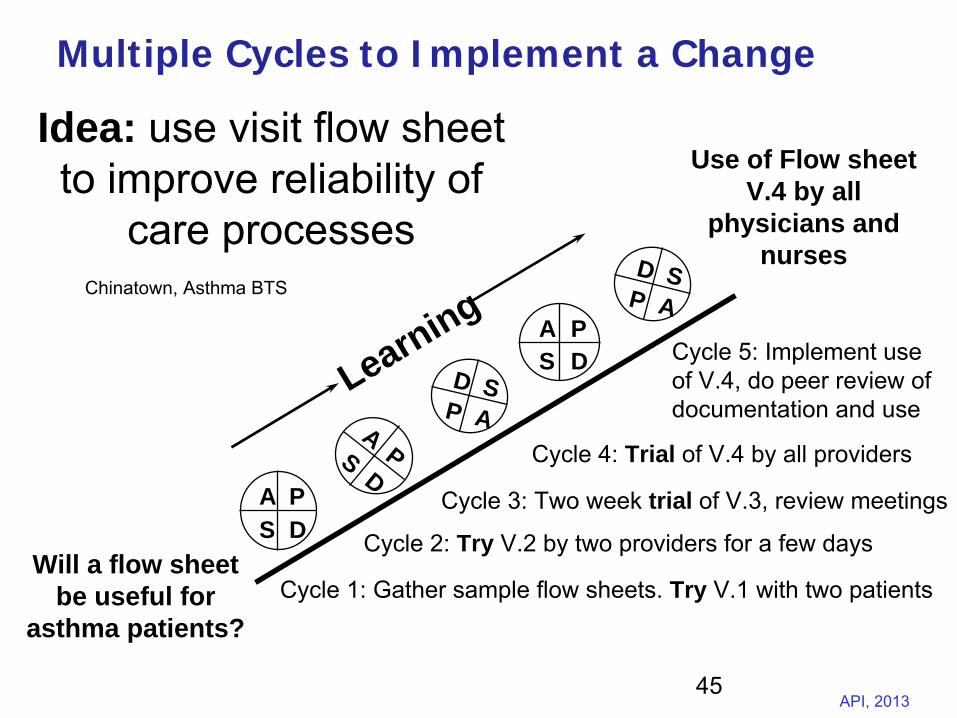
Multiple Cycles to Implement a Change
Will a flow sheet be useful for
asthma patients?
Use of Flow sheet V.4 by all
physicians and nurses
A PS D
APS
D
A PS D
D SP A
LearningD S
P A
Cycle 1: Gather sample flow sheets.
Try V.1 with two patients
Cycle 2: Try V.2 by two providers for a few days
Cycle 3: Two week trial of V.3, review meetings
Cycle 4: Trial of V.4 by all providers
Cycle 5: Implement use of V.4, do peer review of documentation and use
Idea: use visit flow sheet to improve reliability of
care processesChinatown, Asthma BTS
45
Slide 46 API, 2013
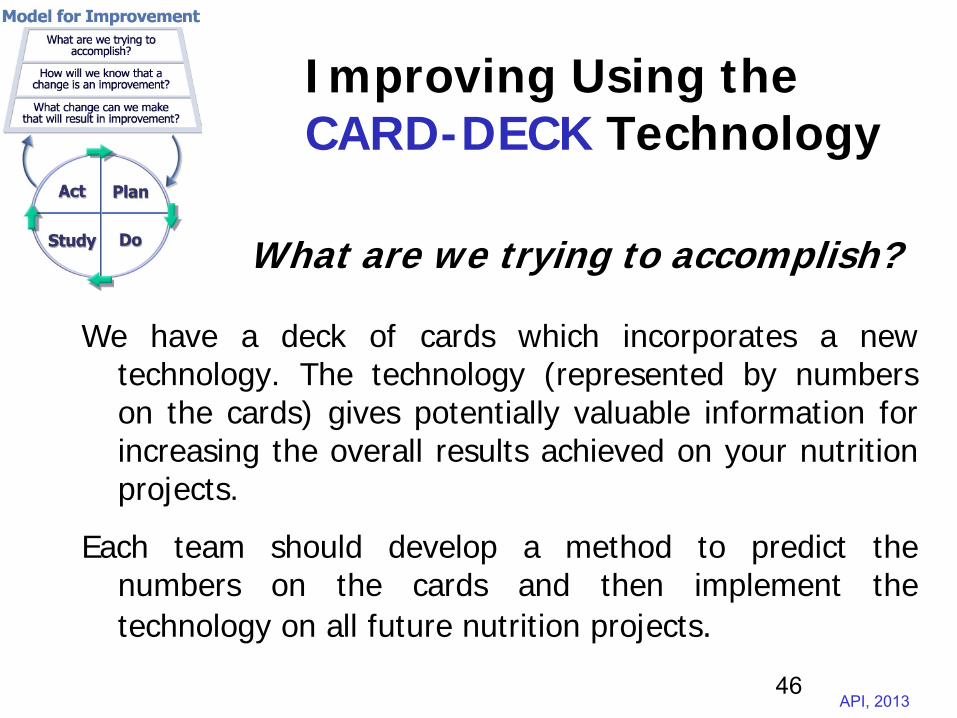
Improving Using the CARD-DECK Technology
What are we trying to accomplish?
We have a deck of cards which incorporates a new technology. The technology (represented by numbers on the cards) gives potentially valuable information for increasing the overall results achieved on your nutrition projects.
Each team should develop a method to predict the numbers on the cards and then implement the technology on all future nutrition projects.
46
Slide 47 API, 2013
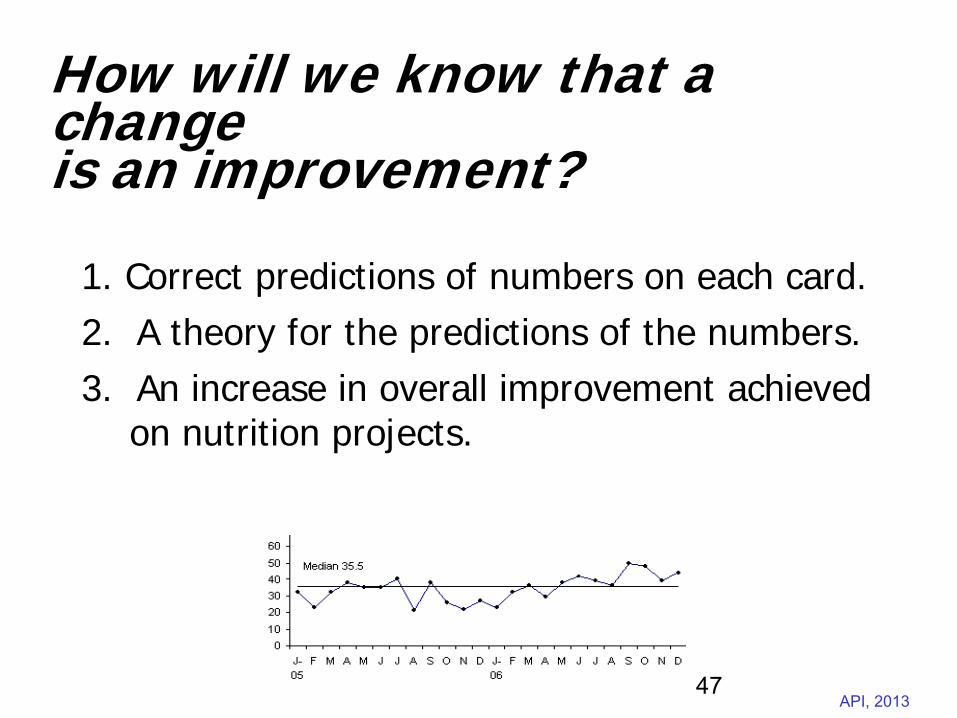
How will we know that a change is an improvement?
1. Correct predictions of numbers on each card.2. A theory for the predictions of the numbers.3. An increase in overall improvement achieved
on nutrition projects.
47
Slide 48 API, 2013
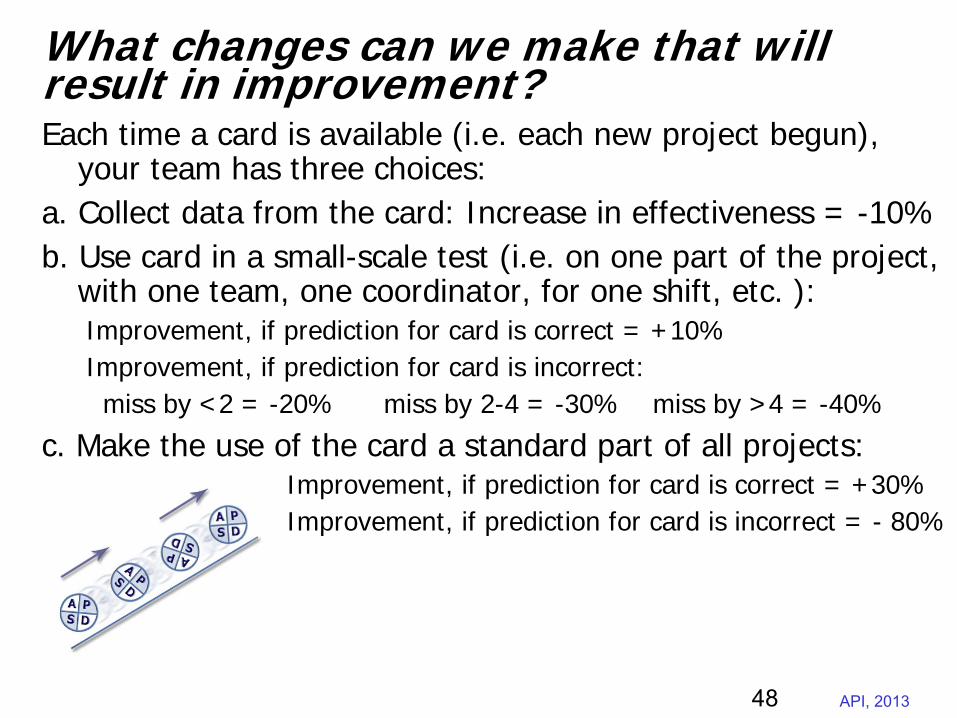
What changes can we make that will result in improvement?Each time a card is available (i.e. each new project begun),
your team has three choices:a. Collect data from the card: Increase in effectiveness = -10%b. Use card in a small-scale test (i.e. on one part of the project,
with one team, one coordinator, for one shift, etc. ):Improvement, if prediction for card is correct = +10%Improvement, if prediction for card is incorrect:miss by <2 = -20% miss by 2-4 = -30% miss by >4 = -40%
c. Make the use of the card a standard part of all projects:Improvement, if prediction for card is correct = +30%Improvement, if prediction for card is incorrect = - 80%
48
Slide 49 API, 2013
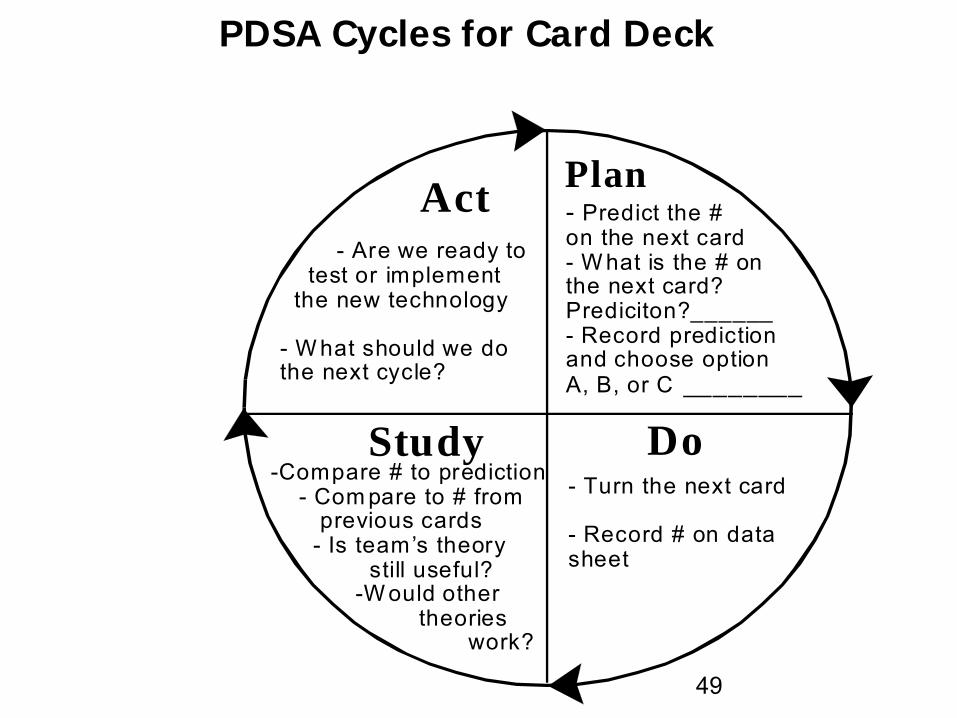
PDSA Cycles for Card Deck
PlanAct
DoStudy
- Predict the # on the next card- W hat is the # on the next card? Prediciton?______- Record predictionand choose option A, B, or C ________
- Turn the next card
- Record # on datasheet
-Compare # to prediction - Com pare to # from previous cards - Is team’s theory still useful? -W ould other theories work?
- Are we ready to test or implement the new technology
- W hat should we dothe next cycle?
49
Slide 50 API, 2013
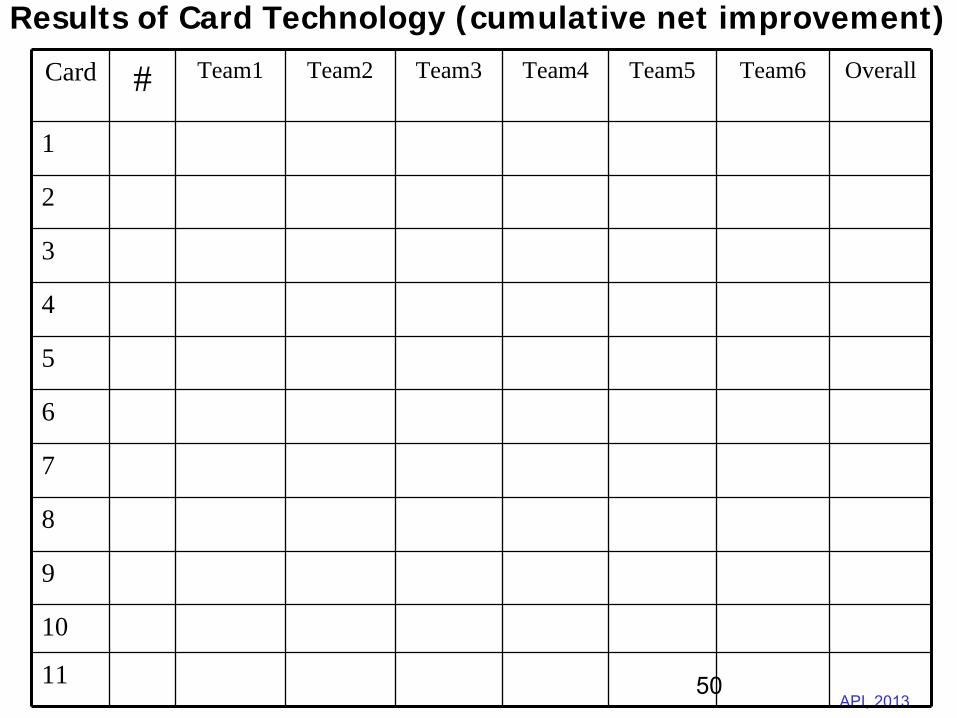
Results of Card Technology (cumulative net improvement)
Card # Team1 Team2 Team3 Team4 Team5 Team6 Overall
1
2
3
4
5
6
7
8
9
10
11 50
Slide 51 API, 2013
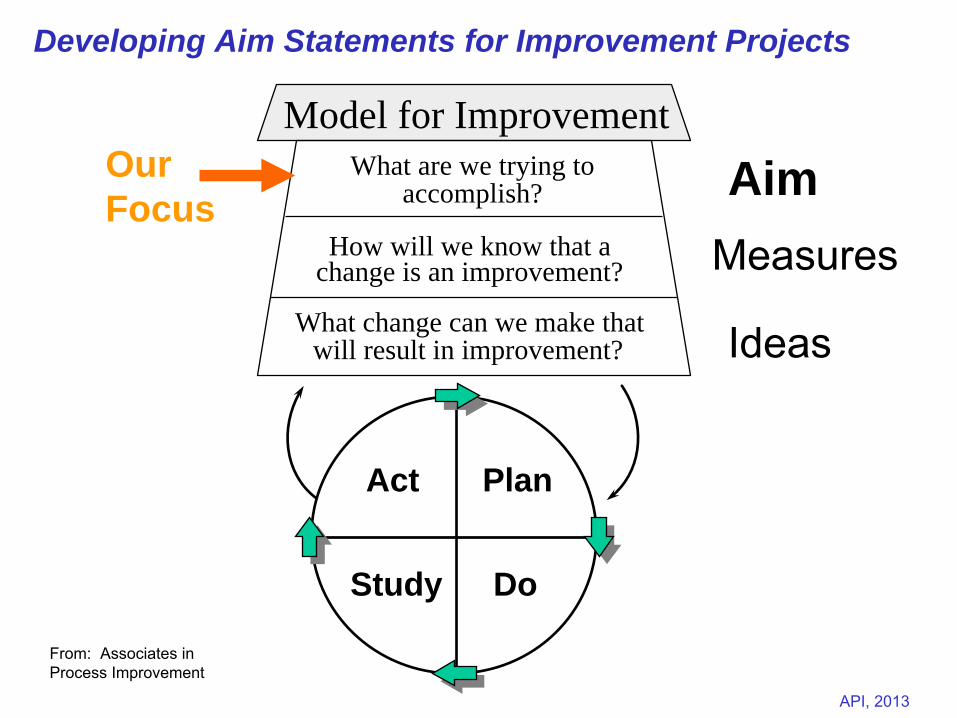
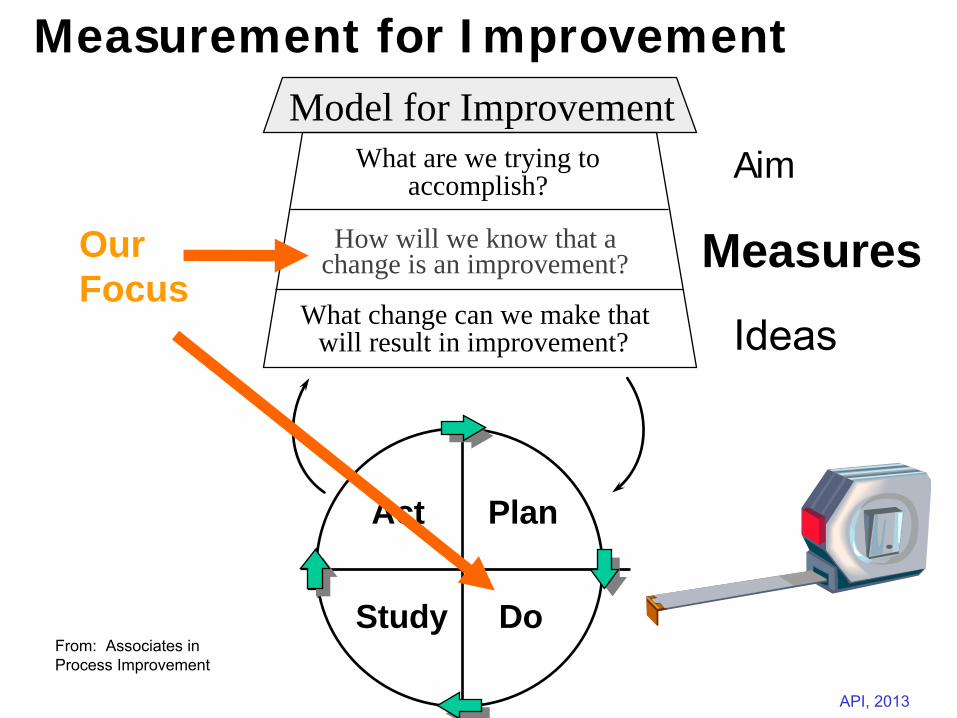
What are we trying toaccomplish?
How will we know that achange is an improvement?
What change can we make thatwill result in improvement?
Model for Improvement
Act Plan
Study DoFrom: Associates in Process Improvement
AimMeasures
Ideas
Act Plan
Study Do
Our Focus
Developing Aim Statements for Improvement Projects
Slide 52 API, 2013
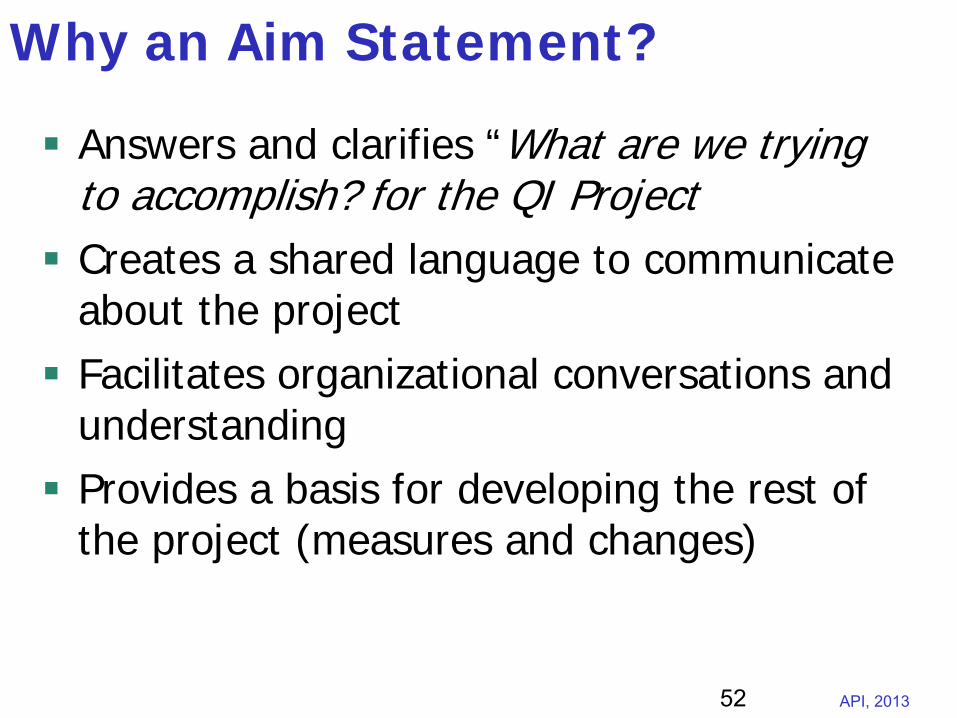
Why an Aim Statement?
Answers and clarifies “What are we trying to accomplish? for the QI Project
Creates a shared language to communicate about the project
Facilitates organizational conversations and understanding
Provides a basis for developing the rest of the project (measures and changes)
52
Slide 53 API, 2013
Aim: What Are We Trying to Accomplish?
A team’s aim statement should include:• What is expected to happen • The system to be improved or the target population• Specific numerical goals• Time frame • Guidance for activities, such as strategies for the effort, or limitations (include if appropriate)
53
Slide 54 API, 2013
Slide 55 API, 2013
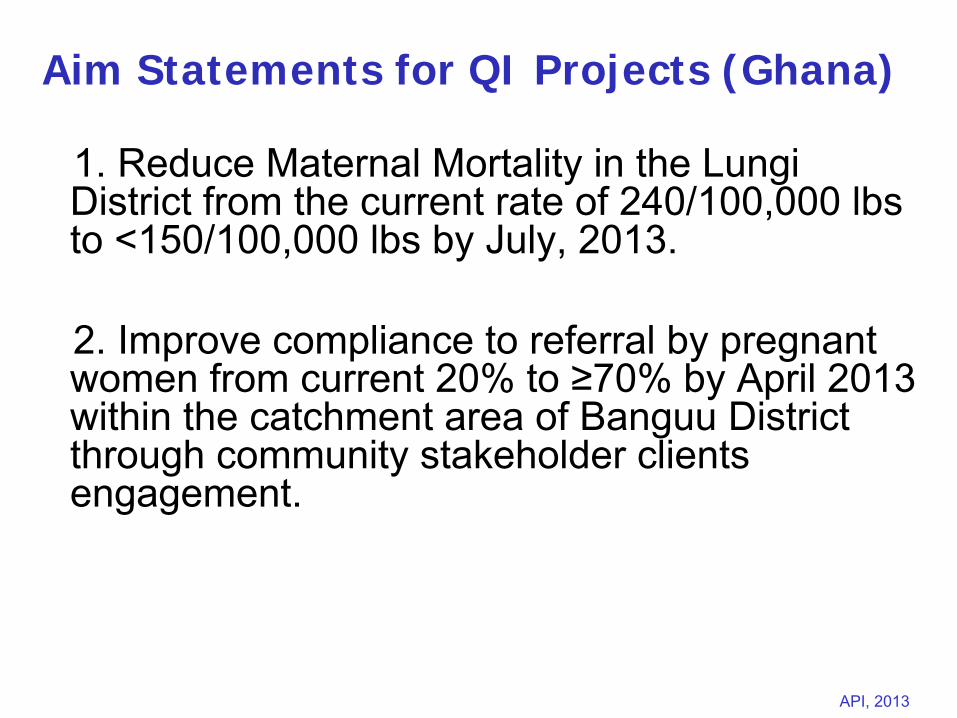
1. Reduce Maternal Mortality in the Lungi District from the current rate of 240/100,000 lbs to <150/100,000 lbs by July, 2013.
2. Improve compliance to referral by pregnant women from current 20% to ≥70% by April 2013 within the catchment area of Banguu District through community stakeholder clients engagement.
Aim Statements for QI Projects (Ghana)
Slide 56 API, 2013
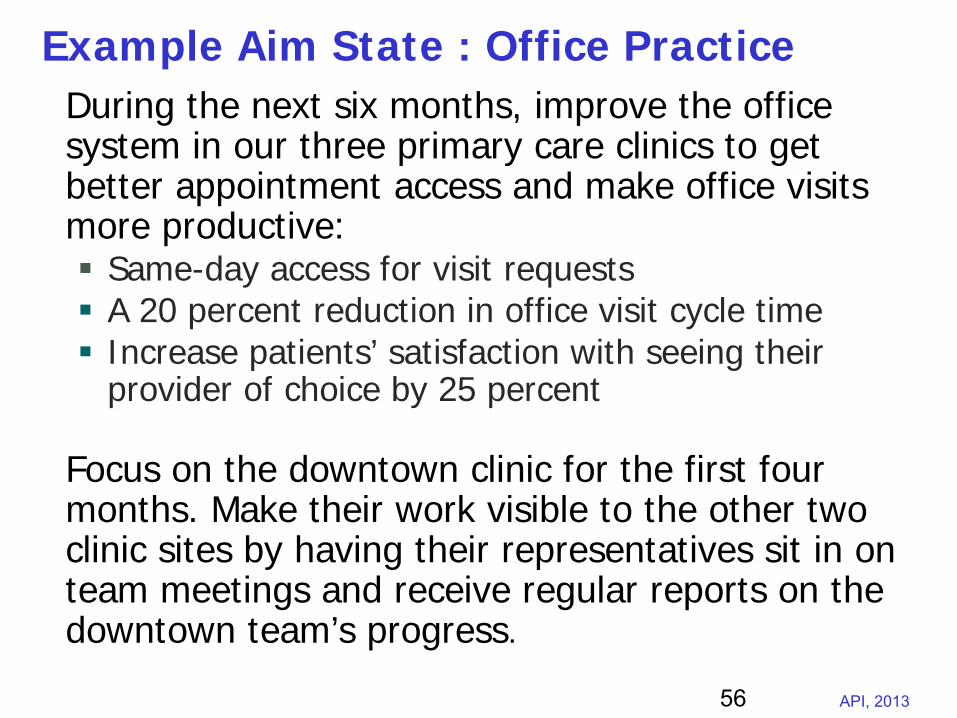
Example Aim State : Office PracticeDuring the next six months, improve the office system in our three primary care clinics to get better appointment access and make office visits more productive:
Same-day access for visit requests
A 20 percent reduction in office visit cycle time
Increase patients’ satisfaction with seeing their provider of choice by 25 percent
Focus on the downtown clinic for the first four months. Make their work visible to the other two clinic sites by having their representatives sit in on team meetings and receive regular reports on the downtown team’s progress.
56
Slide 57 API, 2013
What are we trying toaccomplish?
How will we know that achange is an improvement?
What change can we make thatwill result in improvement?
Model for Improvement
Act Plan
Study DoFrom: Associates in Process Improvement
Aim
MeasuresIdeas
Act Plan
Study Do
Our Focus
Measurement for Improvement
Slide 58 API, 2013
“You can’t fatten a cow by weighing it.” --Palestinian Proverb
Using Measurement
Slide 59 API, 2013
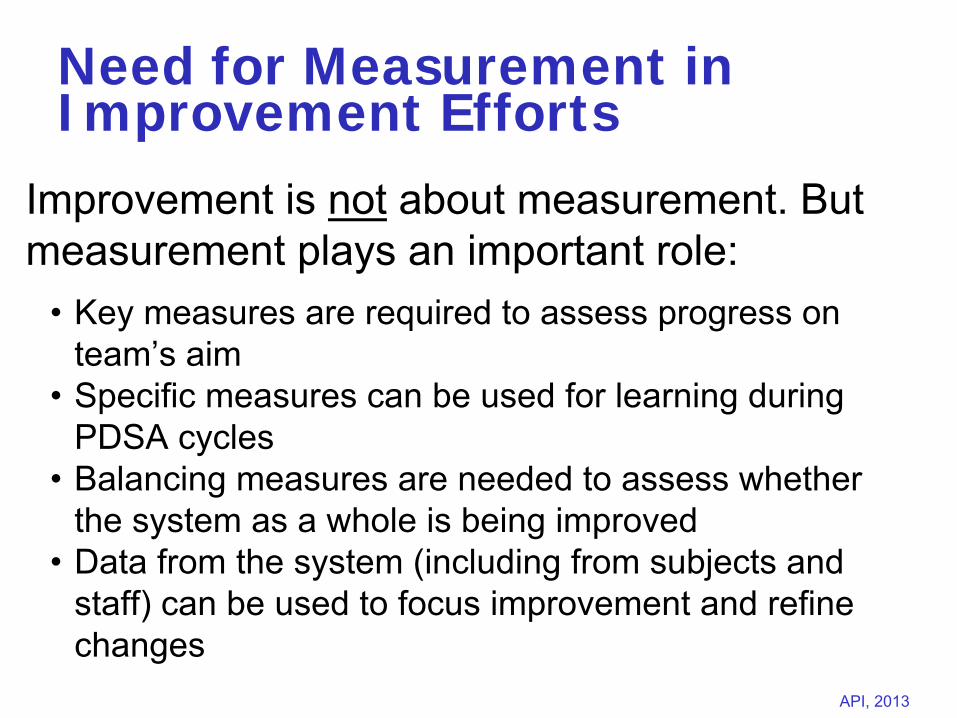
Improvement is not
about measurement. But measurement plays an important role:
•
Key measures are required to assess progress on team’s aim
•
Specific measures can be used for learning during PDSA cycles
•
Balancing measures are needed to assess whether the system as a whole is being improved
•
Data from the system (including from subjects and staff) can be used to focus improvement and refine changes
Need for Measurement in Improvement Efforts
Slide 60 API, 2013
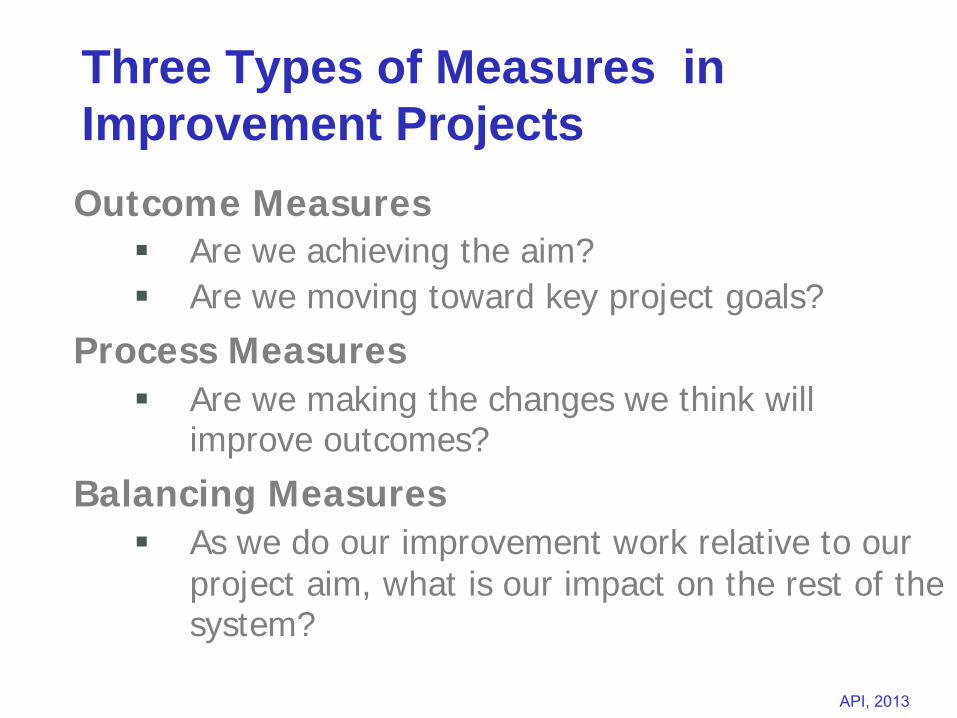
Three Types of Measures in Improvement ProjectsOutcome Measures
Are we achieving the aim?
Are we moving toward key project goals?
Process Measures
Are we making the changes we think will improve outcomes?
Balancing Measures
As we do our improvement work relative to our project aim, what is our impact on the rest of the system?
Slide 61 API, 2013
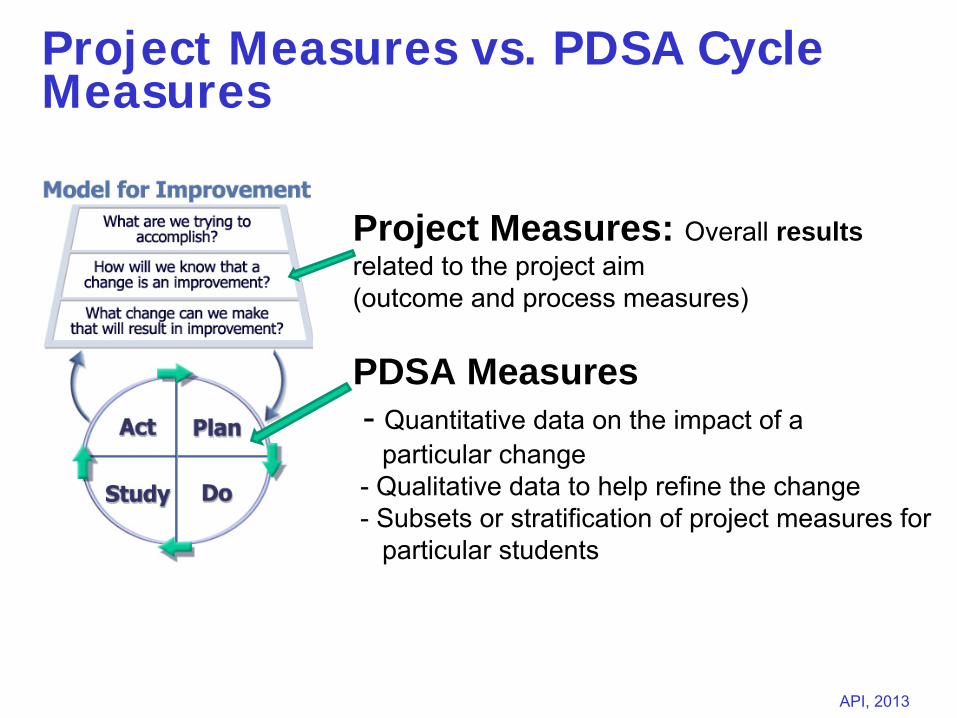
Project Measures vs. PDSA Cycle Measures
Project Measures: Overall results related to the project aim (outcome and process measures)
PDSA Measures-
Quantitative data on the impact of a particular change
-
Qualitative data to help refine the change-
Subsets or stratification of project measures forparticular students
Slide 62 API, 2013
Measurement Guidelines for QI Projects
• A few key measures that clarify a team’s aim and make it tangible should be reported each month
• Be careful about over-doing process measures• Make use of available data systems for
measurement• Integrate measurement into the daily routine• Plot data on the key measures each week or
each month during the project
Slide 63 API, 2013
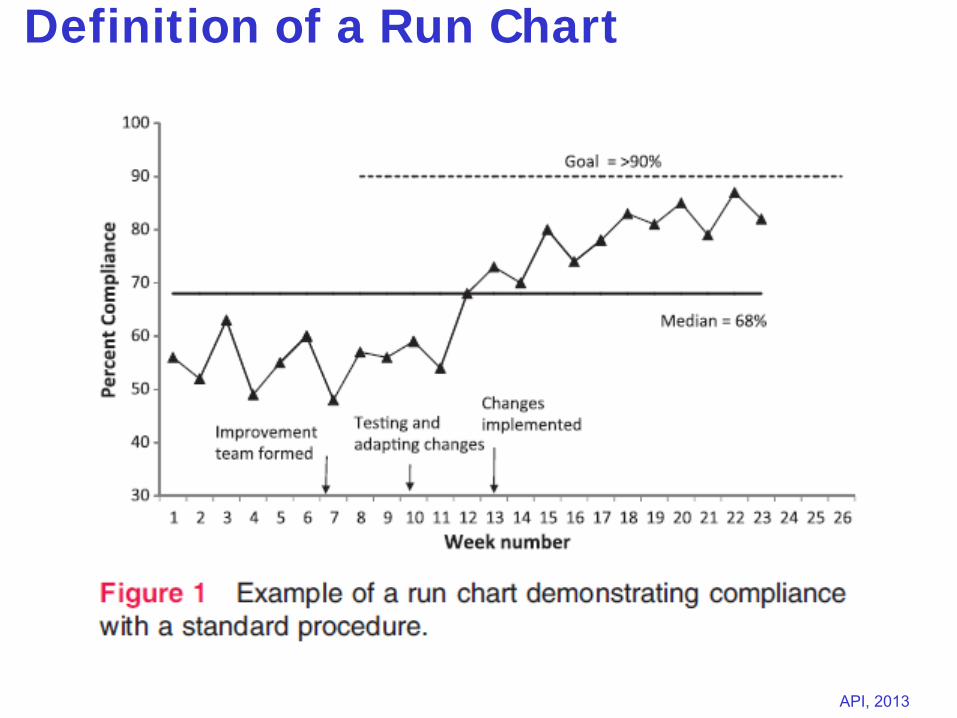
Definition of a Run Chart
Slide 64 API, 2013
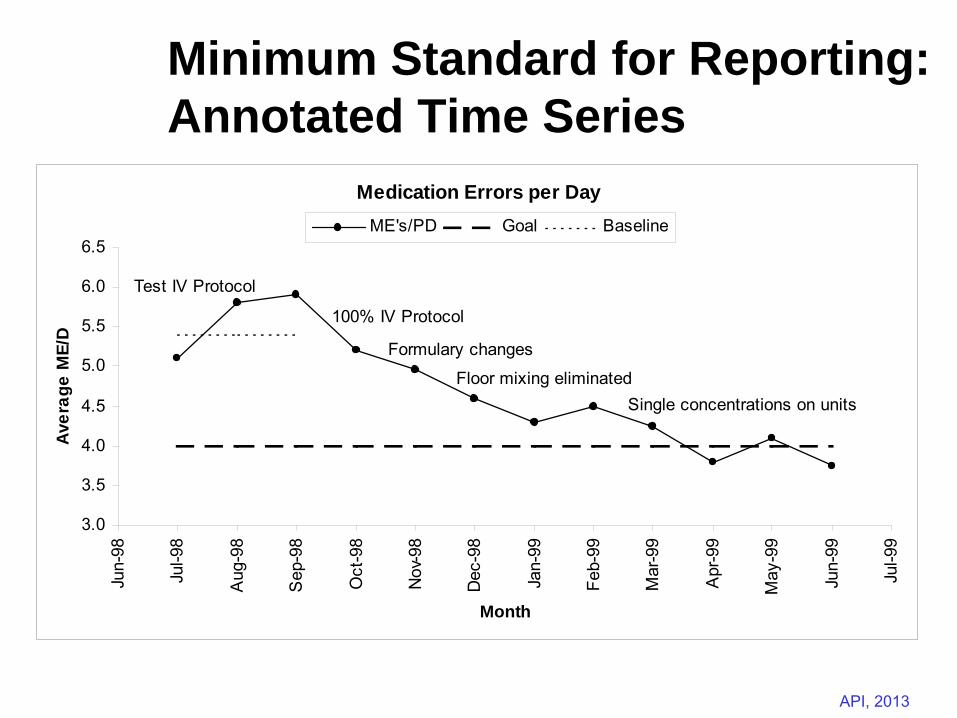
Minimum Standard for Reporting: Annotated Time Series
Medication Errors per Day
3.0
3.5
4.0
4.5
5.0
5.5
6.0
6.5
Jun-
98
Jul-9
8
Aug
-98
Sep
-98
Oct
-98
Nov
-98
Dec
-98
Jan-
99
Feb-
99
Mar
-99
Apr
-99
May
-99
Jun-
99
Jul-9
9
Month
Aver
age
ME/
D
ME's/PD Goal Baseline
100% IV Protocol
Test IV Protocol
Formulary changes
Floor mixing eliminatedSingle concentrations on units
Slide 65 API, 2013
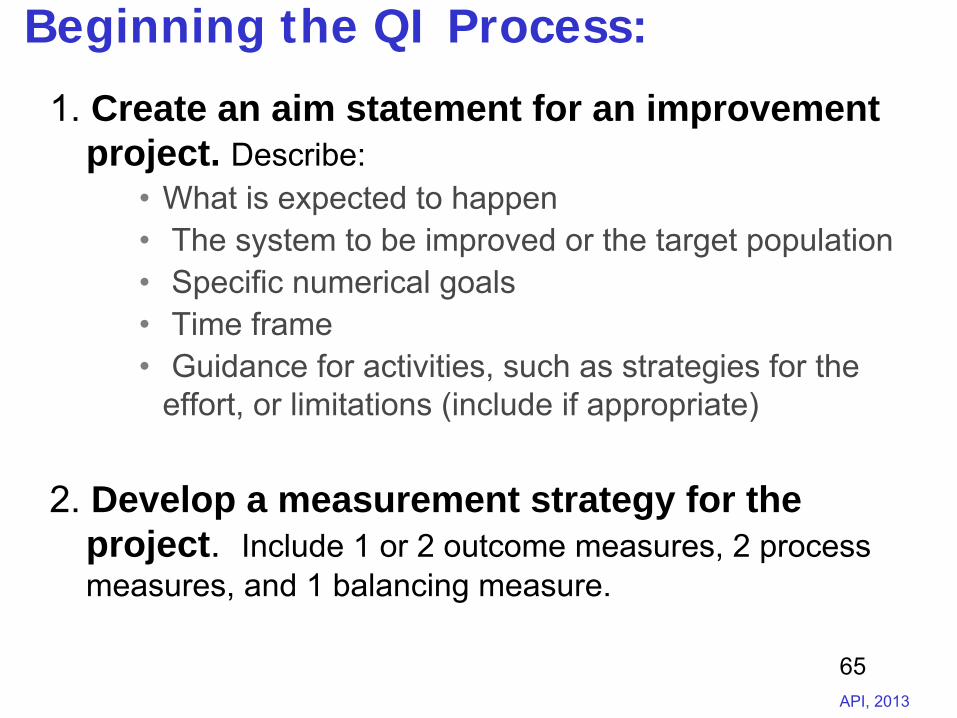
Beginning the QI Process:
1. Create an aim statement for an improvement project. Describe:
•
What is expected to happen •
The system to be improved or the target population
•
Specific numerical goals•
Time frame
•
Guidance for activities, such as strategies for the effort, or limitations (include if appropriate)
2. Develop a measurement strategy for the project. Include 1 or 2 outcome measures, 2 process measures, and 1 balancing measure.
65
Slide 66 API, 2013
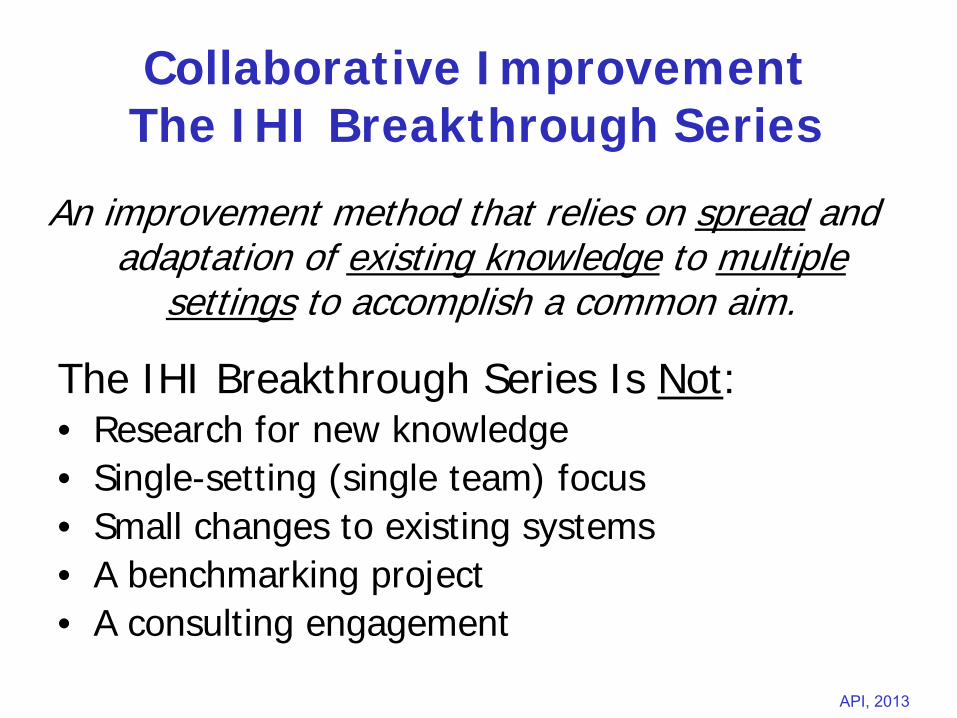
Collaborative Improvement The IHI Breakthrough Series
An improvement method that relies on spread and adaptation of existing knowledge to multiple
settings to accomplish a common aim.
The IHI Breakthrough Series Is Not:• Research for new knowledge• Single-setting (single team) focus• Small changes to existing systems• A benchmarking project• A consulting engagement
Slide 67 API, 2013
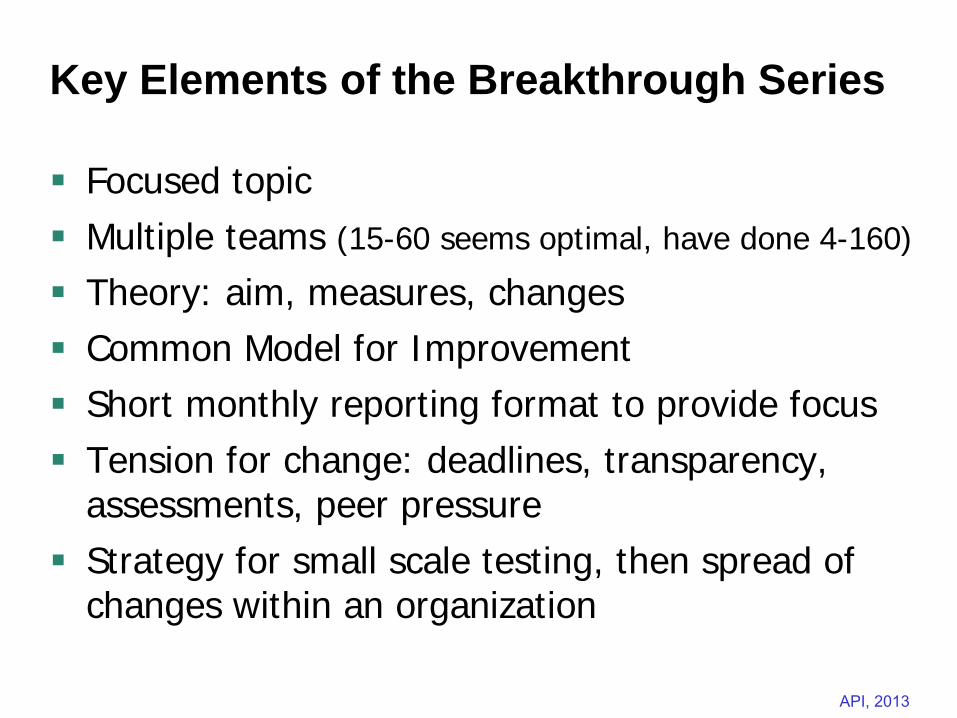
Key Elements of the Breakthrough Series
Focused topic
Multiple teams (15-60 seems optimal, have done 4-160)
Theory: aim, measures, changes
Common Model for Improvement
Short monthly reporting format to provide focus
Tension for change: deadlines, transparency, assessments, peer pressure
Strategy for small scale testing, then spread of changes within an organization
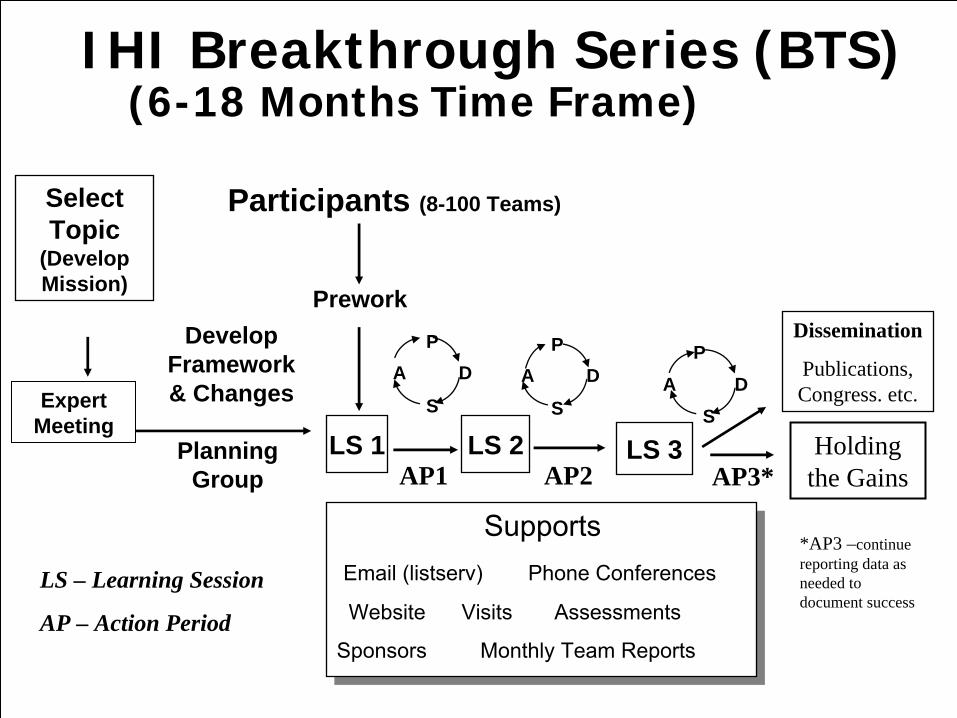
Slide 68 API, 2013
IHI Breakthrough Series (BTS) (6-18 Months Time Frame)
Select Topic
(Develop Mission)
Planning Group
Develop Framework & Changes
Participants (8-100 Teams)
Prework
LS 1
P
S
A DP
S
A D
LS 3LS 2
SupportsEmail (listserv)
Phone Conferences
Website Visits Assessments
Sponsors Monthly Team Reports
Dissemination
Publications, Congress. etc.A D
P
SExpert
Meeting
AP1 AP2 AP3*
LS – Learning Session
AP – Action Period
*AP3 –continue reporting data as needed to document success
Holding the Gains
Slide 69 API, 2013
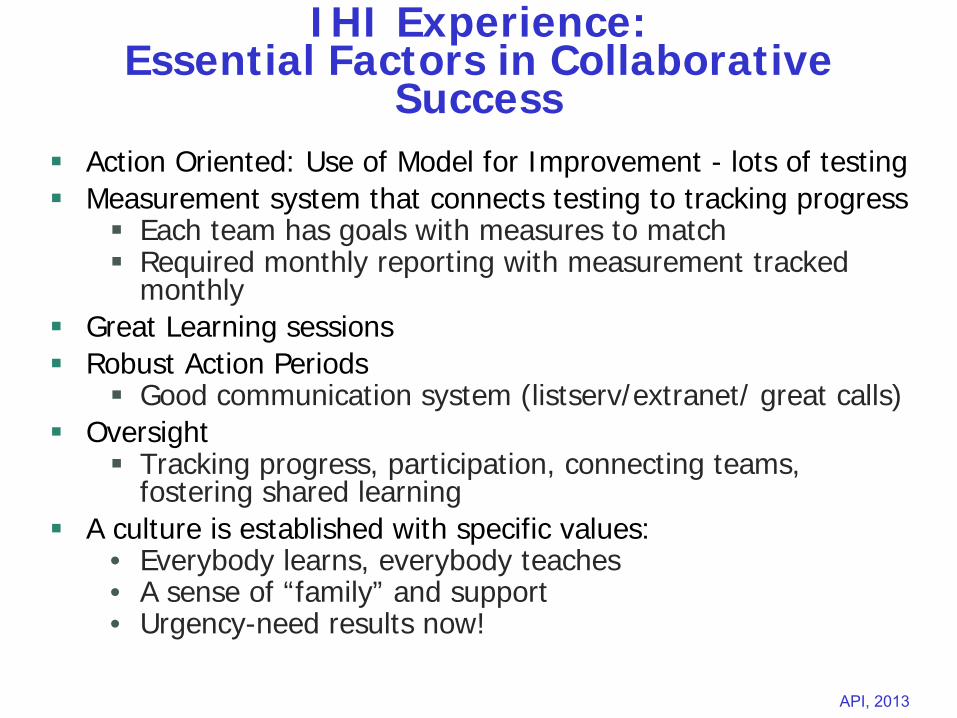
IHI Experience: Essential Factors in Collaborative
Success
Action Oriented: Use of Model for Improvement - lots of testing
Measurement system that connects testing to tracking progress
Each team has goals with measures to match
Required monthly reporting with measurement tracked monthly
Great Learning sessions
Robust Action Periods
Good communication system (listserv/extranet/ great calls)
Oversight
Tracking progress, participation, connecting teams, fostering shared learning
A culture is established with specific values:
• Everybody learns, everybody teaches• A sense of “family” and support• Urgency-need results now!
Slide 70 API, 2013
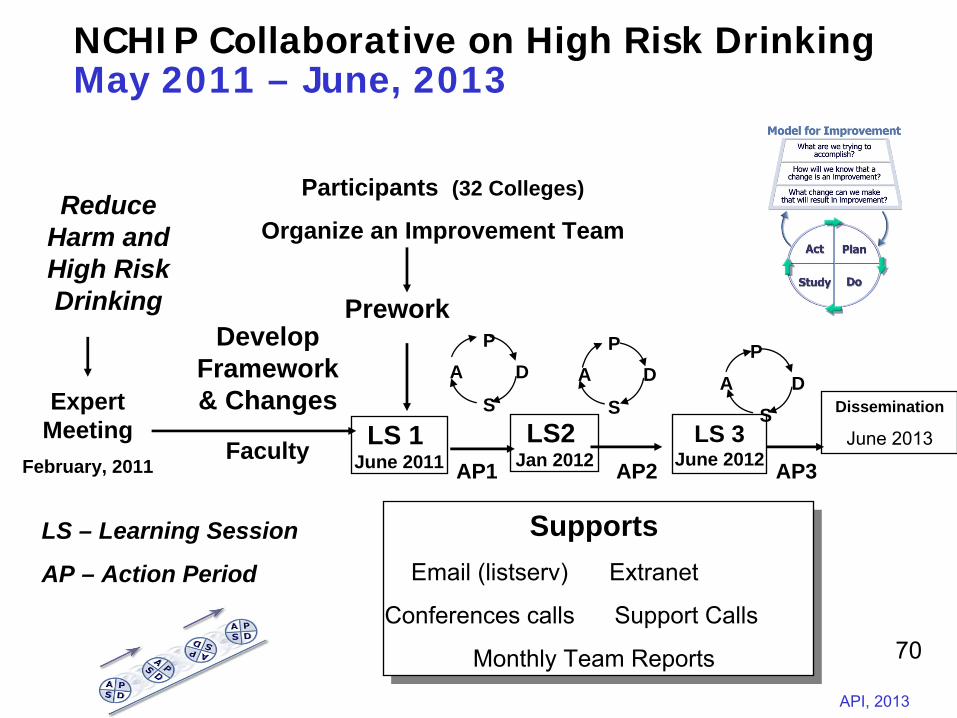
NCHIP Collaborative on High Risk Drinking May 2011 – June, 2013
Reduce Harm and High Risk Drinking
Faculty
Develop Framework & Changes
Participants (32 Colleges)
Organize an Improvement Team
Prework
LS 1 June 2011
P
S
A DP
S
A D
LS 3June 2012
LS2 Jan 2012
SupportsEmail (listserv)
Extranet
Conferences calls Support Calls
Monthly Team Reports
Dissemination
June 2013
A DP
SExpert Meeting
February, 2011 AP1 AP2 AP3
LS – Learning Session
AP – Action Period
70
Slide 71 API, 2013
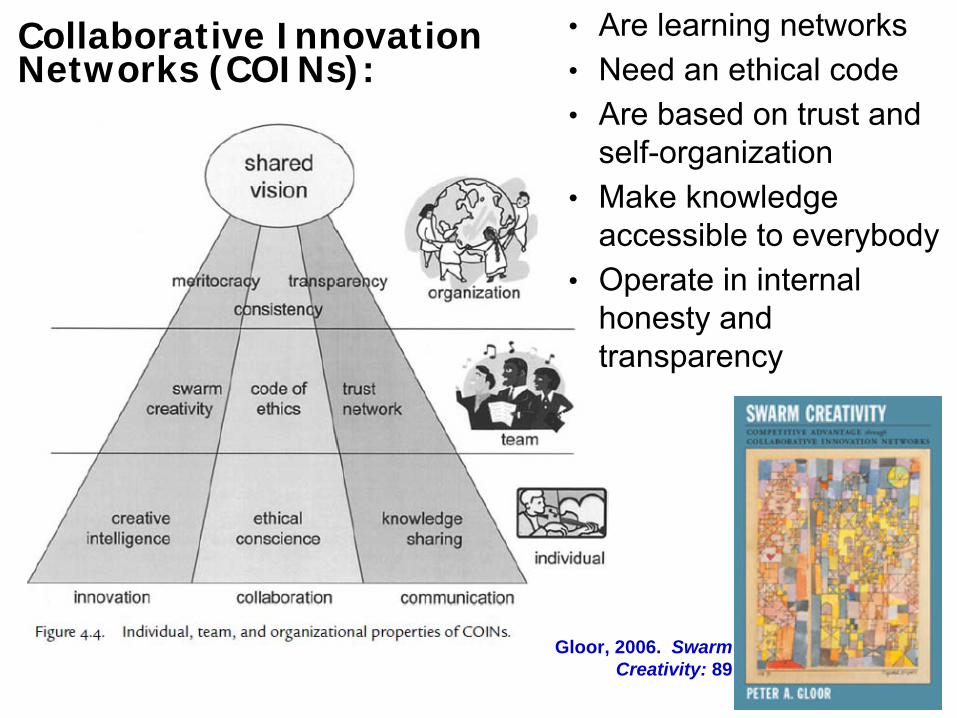
Collaborative Innovation Networks (COINs):
•
Are learning networks•
Need an ethical code•
Are based on trust and self-organization
•
Make knowledge accessible to everybody
•
Operate in internal honesty and transparency
Gloor, 2006. Swarm Creativity: 89
Slide 72 API, 2013
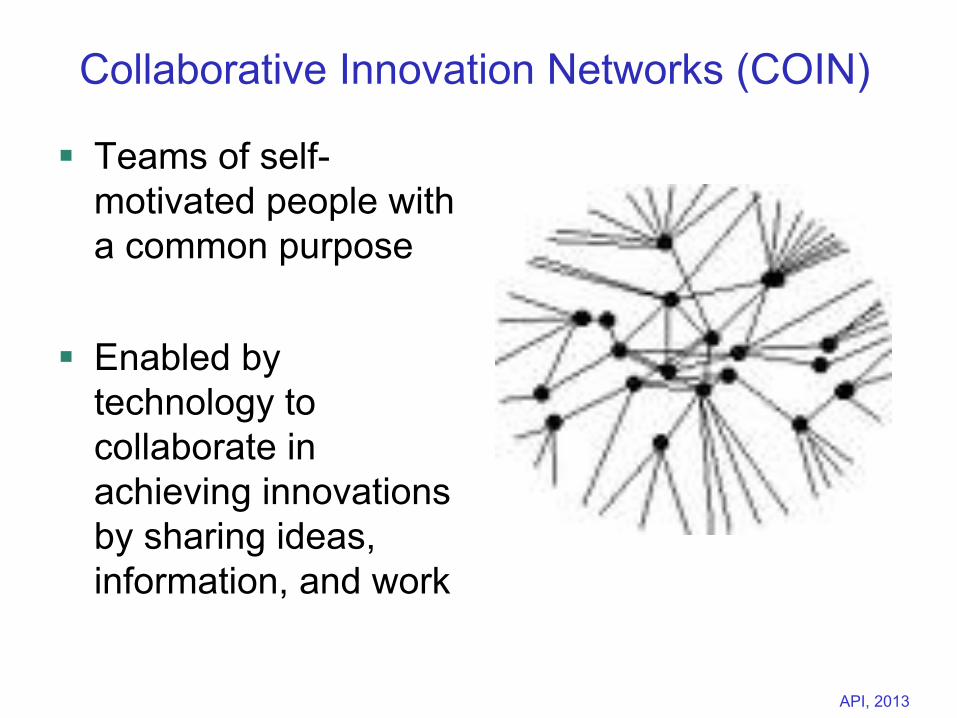
Collaborative Innovation Networks (COIN)
Teams of self- motivated people with
a common purpose
Enabled by technology to collaborate in achieving innovations by sharing ideas, information, and work
Slide 73 API, 2013
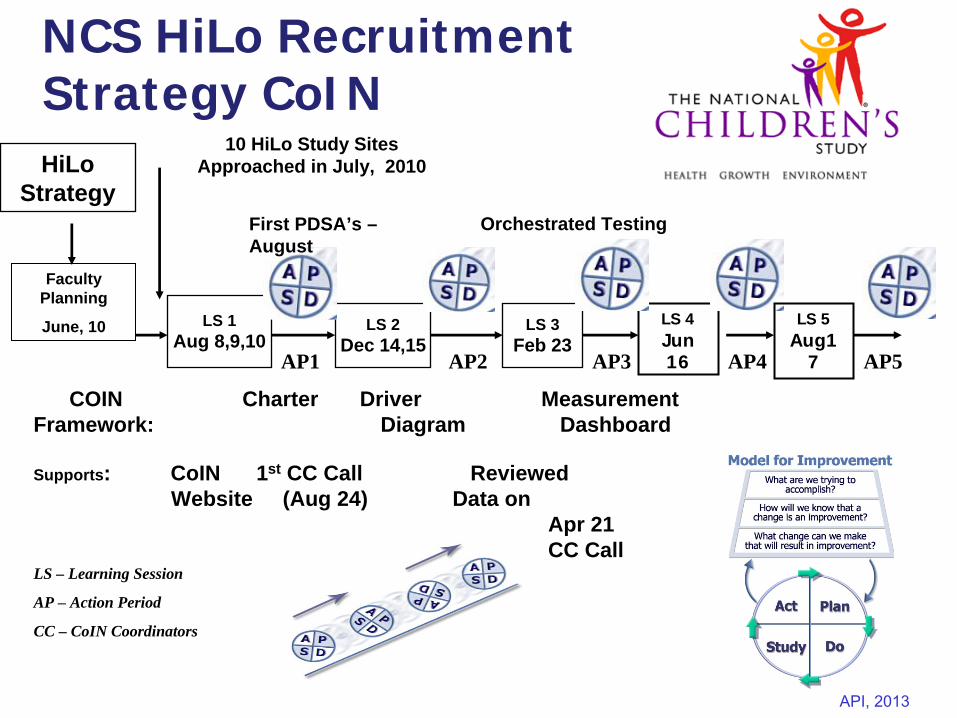
NCS HiLo Recruitment Strategy CoINHiLo
Strategy
COIN Charter Driver MeasurementFramework: Diagram Dashboard
10 HiLo Study SitesApproached in July, 2010
LS 1Aug 8,9,10
LS 3Feb 23
LS 2Dec 14,15
Supports: CoIN 1st CC Call Reviewed Website (Aug 24) Data on
Apr 21 CC Call
Faculty Planning
June, 10
AP1 AP2 AP3
LS – Learning Session
AP – Action Period
CC – CoIN Coordinators
LS 4Jun 16 AP4
LS 5Aug1
7
First PDSA’s – August
Orchestrated Testing
AP5
Slide 74 API, 2013Associates in Process Improvement, 2013
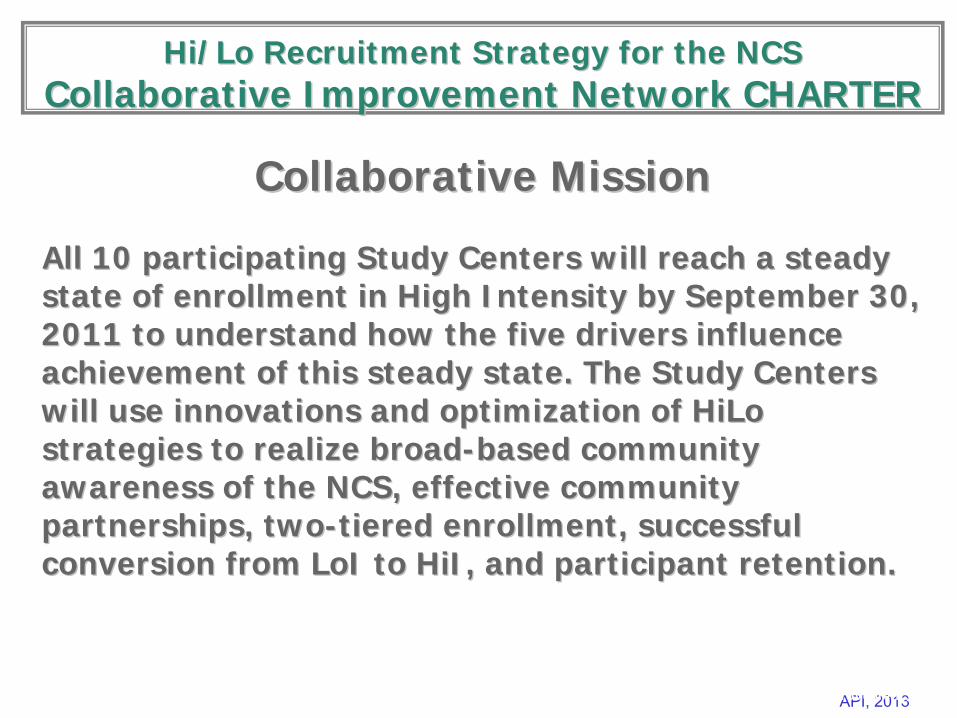
Hi/Lo Recruitment Strategy for the NCSHi/Lo Recruitment Strategy for the NCS Collaborative Improvement Network CHARTERCollaborative Improvement Network CHARTER
Collaborative MissionCollaborative Mission
All 10 participating Study Centers will reach a steady All 10 participating Study Centers will reach a steady state of enrollment in High Intensity by September 30, state of enrollment in High Intensity by September 30, 2011 to understand how the five drivers influence 2011 to understand how the five drivers influence achievement of this steady state. The Study Centers achievement of this steady state. The Study Centers will use innovations and optimization of HiLo will use innovations and optimization of HiLo strategies to realize broadstrategies to realize broad--based community based community awareness of the NCS, effective community awareness of the NCS, effective community partnerships, twopartnerships, two--tiered enrollment, successful tiered enrollment, successful conversion from LoI to HiI, and participant retention.conversion from LoI to HiI, and participant retention.
Slide 75 API, 2013Associates in Process Improvement, 2013
““OrchestratedOrchestrated”” TestingTesting Testing multiple interventions at onceTesting multiple interventions at once
Factorial DesignFactorial Design
Slide 76 API, 2013
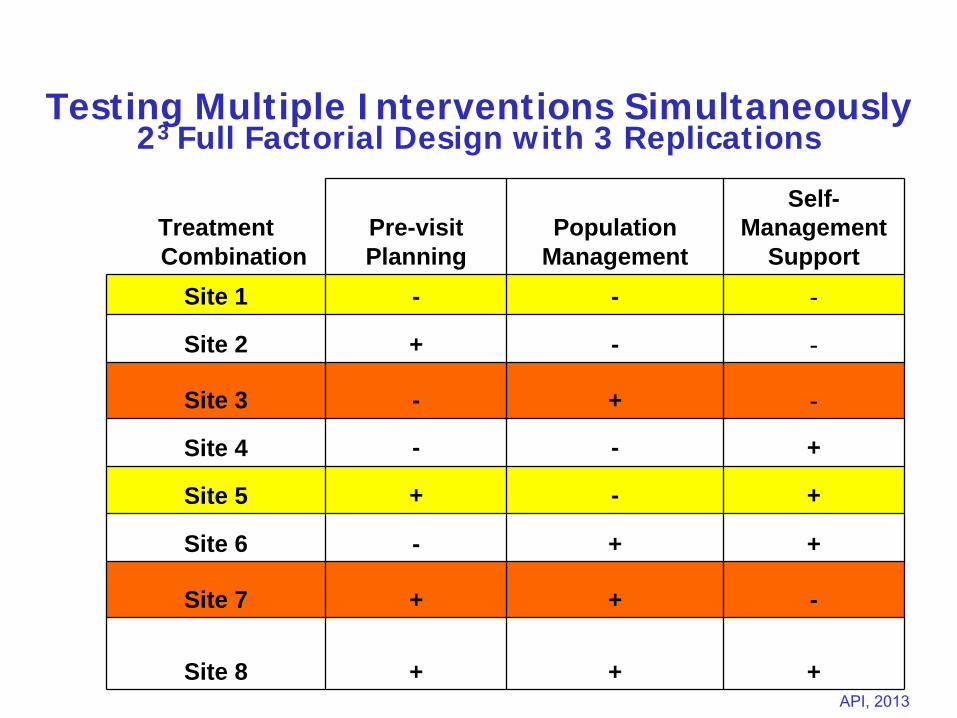
Testing Multiple Interventions Simultaneously 23 Full Factorial Design with 3 Replications
Treatment Combination
Pre-visit Planning
Population Management
Self- Management
SupportSite 1 - - -
Site 2 + - -
Site 3 - + -
Site 4 - - +
Site 5 + - +
Site 6 - + +
Site 7 + + -
Site 8 + + +
Slide 77 API, 2013
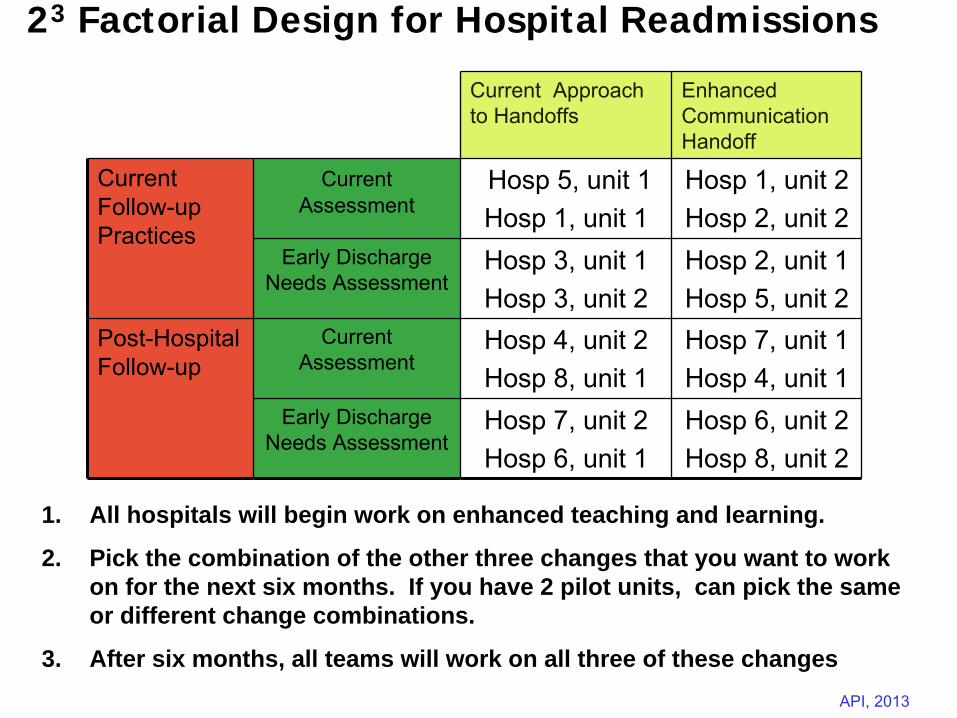
23 Factorial Design for Hospital Readmissions
Current Approach to Handoffs
Enhanced Communication Handoff
Current Follow-up Practices
Current
Assessment
Hosp 5, unit 1Hosp 1, unit 1
Hosp 1, unit 2Hosp 2, unit 2
Early Discharge Needs Assessment
Hosp 3, unit 1Hosp 3, unit 2
Hosp 2, unit 1Hosp 5, unit 2
Post-Hospital Follow-up
Current Assessment
Hosp 4, unit 2Hosp 8, unit 1
Hosp 7, unit 1Hosp 4, unit 1
Early Discharge Needs Assessment
Hosp 7, unit 2Hosp 6, unit 1
Hosp 6, unit 2Hosp 8, unit 2
1. All hospitals will begin work on enhanced teaching and learning.
2. Pick the combination of the other three changes that you want to work on for the next six months. If you have 2 pilot units, can pick the same or different change combinations.
3. After six months, all teams will work on all three of these changes
Slide 78 API, 2013
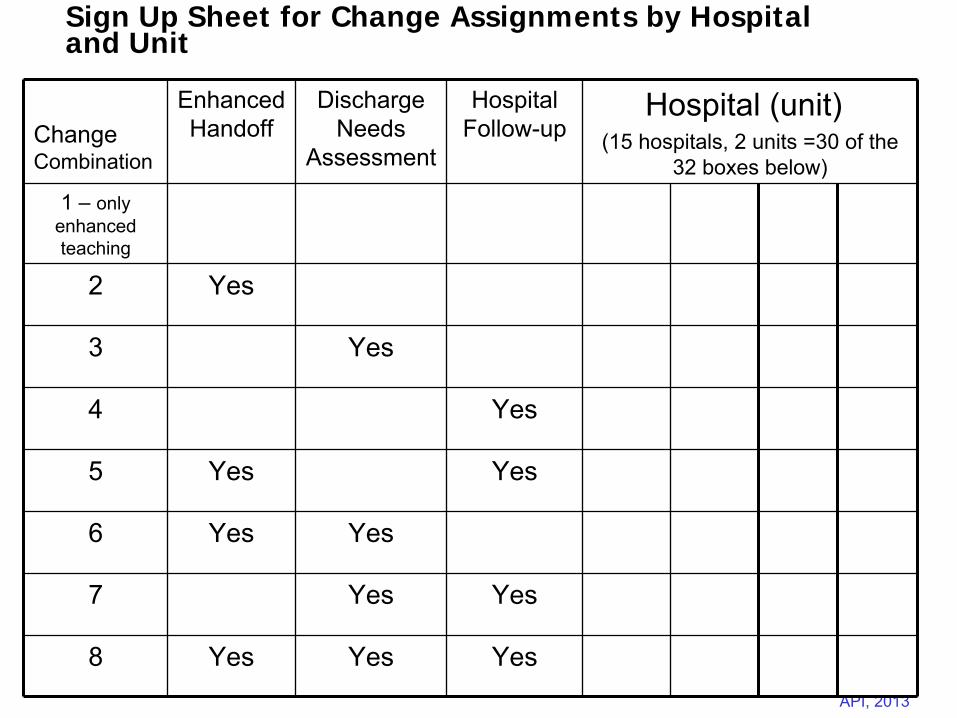
Sign Up Sheet for Change Assignments by Hospital and Unit
Change Combination
Enhanced Handoff
Discharge Needs
Assessment
Hospital Follow-up
Hospital (unit)(15 hospitals, 2 units =30 of the
32 boxes below)1 –
only enhanced teaching
2 Yes
3 Yes
4 Yes
5 Yes Yes
6 Yes Yes
7 Yes Yes
8 Yes Yes Yes
Slide 79 API, 2013
Quality Improvement for Leaders
Western MCH Nutrition Leadership Network Meeting
March 22, 2013 Marina del Rey, California