system of measures for evaluating the ... of measures for evaluating the financial performance of...
TRANSCRIPT
UNIVERSITY OF LJUBLJANA FACULTY OF ECONOMICS
and
INTERNATIONAL CENTER FOR PROMOTION OF ENTERPRISES
(ICPE), LJUBLJANA
MASTER’S DEGREE THESIS
SYSTEM OF MEASURES FOR EVALUATING THE FINANCIAL PERFORMANCE OF THE
COMPANY LAŠKO
Ljubljana, June, 2006 Darja Jermaniš
1

Author's statement I, Darja Jermaniš, hereby certify to be the author of this Master's Degree thesis, which was written under mentorship of Dr. Metka Tekavčič and in compliance with the Act of author's and Related Rights – Para. 1, Article 21. I herewith agree this thesis to be published on the website pages of ICPE and the Faculty of Economics. Ljubljana, June 30, 2006 Signature………………………
2

CONTENTS
1. INTRODUCTION...................................................................................................................... 1
2. SUCCESS OF THE COMPANY IN THE INFORMATION ERA ....................................... 4 2.1. DIFFERENT INTERESTS IN THE COMPANY ................................................................ 4 2.2. GOAL OF THE COMPANY................................................................................................ 5 2.3. ADAPTATION OF COMPANIES TO A MODERN BUSINESS ENVIRONMENT ........ 6
2.3.1. Competing in the Information Age................................................................................. 8 2.4. EVALUATING THE PERFORMANCE OF THE COMPANY.......................................... 9
2.4.1. Problems with defining the performance of the company............................................ 12 2.4.2. Traditional versus contemporary performance measurement ..................................... 13 2.4.3. Core differences between traditional and contemporary performance measurement. 13 2.4.4. The contingency theory and contemporary performance measurement ...................... 14 2.4.5. Performance measurement in large Slovenian companies .......................................... 16
3. TRADITIONAL METHOD FOR EVALUATING THE PERFORMANCE OF THE COMPANY...... 18 3.1. ANALYSIS OF FINANCIAL STATEMENTS ................................................................. 18
3.1.1. Ratio Analysis .............................................................................................................. 19 3.1.1.1. Liquidity Ratios..................................................................................................... 21 3.1.1.2. Asset Management Ratios ..................................................................................... 22 3.1.1.3. Debt Management Ratios...................................................................................... 24 3.1.1.4. Profitability Ratios................................................................................................ 25 3.1.1.5. Market Value Ratios ............................................................................................. 27
3.1.2. The use of Ratio Analysis ............................................................................................. 28 3.1.3. Limitations of Ratio Analysis ....................................................................................... 29
3.2. NEW PERFORMANCE MEASURES............................................................................... 30 3.2.1. Free cash flow (FCF)................................................................................................... 30 3.2.2. Capital Asset Pricing Model (CAPM) ......................................................................... 31
3.2.2.1. The Concept of Beta.............................................................................................. 31 3.2.2.2. Some concerns about Beta and the CAPM ........................................................... 33
3.2.3. Market Value Added (MVA)......................................................................................... 34 3.2.4. Economic Value Added ................................................................................................ 34
4. MODERN APPROACHES OF IMPROVING THE PERFORMANCE OF THE BUSINESS.............. 36 4.1. TOTAL QUALITY MANAGEMENT (TQM)................................................................... 36
4.1.1. Achieving business excellence ..................................................................................... 37 4.1.2. Procedure for implementing the model........................................................................ 39 4.1.3. Benefits and Barriers to TQM...................................................................................... 40
4.2. THE BALANCED SCORECARD (BSC) .......................................................................... 41 4.2.1. The Basic Concept and Structure of the Balanced Scorecard ..................................... 42 4.2.2. The Widespread Use of the Balanced Scorecard......................................................... 44 4.2.3. The criticism of the Balanced Scorecard ..................................................................... 44
3
4.3. CLEAN TECHNOLOGY MANAGEMENT ..................................................................... 46 4.3.1. Integrated Pollution and Control Directive (IPPC) .................................................... 47 4.3.2. ISO 14000 .................................................................................................................... 48
4.3.2.1. ISO 14001 ............................................................................................................. 50
5. SYSTEM OF RATIOS IN THE COMPANY LAŠKO......................................................... 52 5.1. DESCRIPTION OF THE COMPANY............................................................................... 52
5.1.1. Short History................................................................................................................ 52 5.1.2. Important events........................................................................................................... 53
5.2. BUSINESS REPORT.......................................................................................................... 54 5.2.1. Sales ............................................................................................................................. 54 5.2.2. Slovene market ............................................................................................................. 56 5.2.3. Foreign Markets........................................................................................................... 57
5.3. OWNERSHIP STRUCTURE ............................................................................................. 58 5.3.1. Shares........................................................................................................................... 59
5.3.1.1. Dividend policy ..................................................................................................... 60 5.3.2. Development strategy................................................................................................... 60
5.4. EXISTING SYSTEM OF RATIOS .................................................................................... 61 5.4.1. Summary of the ratio analysis...................................................................................... 61 5.4.2. Extension of the financial – accounting model ............................................................ 63
5.5. THE DU PONT CHART .................................................................................................... 63 5.6. CAPM ................................................................................................................................. 65
5.6.1. Estimation of the risk-free rate rRF............................................................................... 65 5.6.2. Estimation of the current expected market risk premium RPM .................................... 65 5.6.3. Estimating Beta............................................................................................................ 66 5.6.4. Required rate of return on the stock ............................................................................ 66
5.7. MVA ................................................................................................................................... 67 5.8. EVA..................................................................................................................................... 67 5.9. ENVIRONMENTAL REPORT.......................................................................................... 68
5.9.1. Environmental standard, IPPC.................................................................................... 70
6. CONCLUSION......................................................................................................................... 71 7. LITERATURE ......................................................................................................................... 73 8. SOURCES:................................................................................................................................ 76
4

1. INTRODUCTION Successful operation, performance, and long-term viability of any business depend on a continuous sequence of sound decisions made individually or collectively by the management team. Every decision ultimately causes, for better or worse, an economic impact on the business. In essence, the process of managing any enterprise amounts to making an ongoing series of economic choices, every time trading off costs and benefits. These choices in turn activate specific shifts in the physical and financial resources supporting the business, ultimately resulting in movements of cash. Some decisions are major, such as investing in a new manufacturing plant, raising large amounts of debt, or adding a new line of products or services. Most other decisions are part of the day-to-day processes through which every functional area is managed. Common to all, however, is the basic concept of an economic trade-off, that is, before every decision the manager must weight the cash benefits obtained against the cash cost incurred. In normal day-to-day decisions, these underlying trade-offs may be quite apparent. In complex situations, however, managers must carefully evaluate whether the resources committed directly or indirectly by the decision are likely to be profitably recovered over time. The combined effect of trade-off analyses and decisions ultimately impacts both the performance and value of the business. Such results are judged periodically, either by means of financial statements or with the help of special economic analyses. Fundamentally, managers make decisions on behalf of the owners of the business. Managers are responsible for deploying available internal and external resources in ways that create an economic gain for the owners – a gain reflected over time in the combination of dividends and share price appreciation received by the shareholders. This concept, called total shareholder return (TSR), is one of the key criteria for measuring the success of the company relative to its peers and the market as a whole (Helfert, 2000, p. 4-5). Despite the great variety of issues faced every day by managers of different businesses, their tasks are sufficiently similar in principle that we can effectively group all business decisions into three basic areas: • the investment of resources; • the operation of the business using these resources; • the proper mix of financing that funds these resources. In its operation, a company is always in touch with the environment in which it is performing. We can say that a company leaves behind some traces and everybody who gets in touch with it can judge how the company is doing either intuitively or on the basis of some analysis.
1

Those who are especially interested can collect information showing the success of the company. It is not so rare that some bad decisions are made in firms because of lack of knowledge in some phases of the decision-making process. This is the reason why everybody faced with these decisions is interested to get enough information on the basis of which appropriate decisions can be made. A commonly used tool of financial analysis is ratio analysis since it makes related information comparable and, hence, more meaningful, relevant and useful. Ratio analysis in its many forms is an essential toolkit for analytically oriented persons of any viewpoint, as they evaluate the financial/economic performance and outlook of any business. In order to judge how well a business firm has performed, it is imperative that its performance (as shown by the ratio analysis) is compared. The objective of this analysis is to identify the strengths and weaknesses of a firm. It is an important diagnostic tool to pinpoint the »grey« areas, which require corrective action. There are three types of comparisons involved in the ratio analysis: historical or trend ratio comparison, external/inter-firm comparison (benchmarking) and comparison with firm’s own set standards or plan (Wheelen, Hunger, 1995, p. 402). The reliability of ratios depends, to a great extent, upon the quality of data on which they are based; the ratios are as good or as bad as the data itself and financial ratios should be used with caution. Notwithstanding the limitations of ratio analysis, it is widely reckoned as an important tool of financial analysis (Jain, 2003, p. 48). My intention is to convert figures from financial statements into more meaningful and comparable forms on a concrete case of company Laško. I will try to explain the ratio values, reasons for them and whether these values are at a satisfactory level or not. In case some inefficiencies are shown by the analysis, I will try to develop suggestions about the approaches the company can adopt to improve the situation. The purpose is also to show developments in the area of getting information for decision-making, ranging from the “classical” to the financial-accounting ratios, and finally “sophisticated” non-financial ratios. In this way I would like to get a detailed picture of the company and its position on the market. In short, the purpose is to monitor how efficiently this company uses its assets, debt, inventories, and the like. In order to get useful information and judge how well a business firm has performed, the ratio analysis for the selected company will be based on the data for 4 years instead of a single year. Besides the financial analysis, some other methods will also be presented. My aim is to develop a system of ratios, which would serve company Laško as a better source of information and would allow them to take quick and right decisions. As we know,
2

management can react to demands of the market only with an appropriate and complete system for measuring performance. Those ratios that have an impact on the company’s problems will be additionally selected and discussed. The master thesis is divided into six chapters. This chapter describes the background and the problem of the study. It presents its purpose and its main goals. At the end, it outlines the thesis structure. Chapter 2 aims to provide the reader with the necessary background information regarding different factors which may influence the success of a company and which have to be considered by the management in its activity. Chapter 3 describes the traditional method of evaluating the company’s performance. It presents its continuing importance and wide use of this analysis in today’s information age companies. Special attention is dedicated to financial ratios, which are most commonly used in evaluations of financial statements. At the end, it outlines the limitations of this analysis and proposes some new performance measures. Chapter 4 presents how the traditional way of evaluating company’s performance can be complemented with modern methods. Its last part is dedicated to environment management, since the pressures on industry to become more ‘environmentally friendly’ are stronger than ever before. Chapter 5 applies the theory on a concrete case of the selected company Laško. First the company, its history and recent important events are briefly described. A more comprehensive presentation of the ownership structure and the company’s business report follows. Special attention has been given to the analysis of financial statements and to the CAPM approach. As an alternative to the traditional evaluation methods, two new performance measures, Market Value Added and Economic Value added, have been discussed in following sections. The chapter ends with the description of the company’s efforts to find a balance between its goals and principles of sustainable development. Chapter 6 contains my conclusions and recommendations.
3
2. SUCCESS OF THE COMPANY IN THE INFORMATION ERA 2.1. DIFFERENT INTERESTS IN THE COMPANY There are many different individuals and groups interested in the success or failure of a given business, but the most important are (Helfert, 2000, p. 82): • managers; • owners (investors); • lenders or creditors. Closest to the business from a day-to-day standpoint, but also responsible for its long-range performance, is the management of the organisation, whether its members are professional managers or owner/managers. Managers are responsible and accountable for operative efficiency, for the effective deployment of capital, useful human effort, appropriate use of other resources, and current and long-term results, all within the context of sound business strategies. Managers are empowered by the owners of the firm – the shareholders – to make decisions. However, managers have personal goals that compete with shareholder wealth maximisation, and these conflicts of interest are addressed by agency theory. An agency relationship arises whenever someone, called a principal, hires someone else, called an agent, to perform some service and delegates decision-making authority to that agent. In financial management, the primary agency relationships are between stockholders and managers and between stockholders and debt-holders (Brigham, Daves, 2002, p. 13). (There is also a three-way agency conflict between stockholders, managers, and creditors when firms go into bankruptcy). Next are the various owners of the business, who are especially interested in the current and long-term returns on their equity investment. They usually expect growing earnings, cash flows, and dividends, which in combination, will bring about growth in the economic value of their “stake”. They are affected by the way a company’s earnings are used and distributed, and by the relative value of their shares within the general movement of the security markets. Finally, there are the providers of “other people’s money”, lenders and creditors who extend funds to the business for various lengths of time. They are mainly concerned about the company’s liquidity and cash flows, affecting its ability to make the interest payments due them and eventually to repay the principal. They’ll also be concerned about the degree of financial leverage employed, and the availability of specific residual asset values that will give them a margin of protection against the risk. Other groups such as employees, government and society have, of course, specific objectives of their own – the business’ ability to pay wages, the stability of employment, the reliability
4
of tax payments, and the financial wherewithal to meet various social and environmental obligations, for instance. Financial performance indicators are useful to these groups in combination with a variety of other data (Helfert, 2000, p. 83). 2.2. GOAL OF THE COMPANY Today’s business world has infinite variety. Enterprises of all sizes engage in activities such as trade, manufacturing, finance, and myriad services, using widely different legal and organisational structures, and often involving international operations and far-flung investments. Common to all businesses, however, is the following definition of the basic economic purpose of sound management: Strategic deployment of selected resources in order to create, over time, economic value sufficient to recover all of the resources employed while earning an acceptable economic return on these resources under conditions that match the owners’ expectations of risk (Helfert, 2000, p. 4-5). A fundamental assumption underlines the theory of financial management: management has one basic, overriding goal – to create value for stockholders. Stockholders own the firm – it legally belongs to them. That ownership position gives stockholders the right to elect the directors, who then hire the executives who actually run the company. The directors, as representatives of the stockholders, determine managers’ compensation, presumably rewarding them if performance is superior or replacing them if performance is poor. For most companies and at most times, managers do focus on shareholder value maximisation, because in the long run stockholders do remove directors and managers who fail in their fiduciary duty. The reasons why managers must put the interest of stockholders first are different. First, stock ownership has become increasingly concentrated in the hands of institutional investors, and their holdings are so large that they would depress a stock’s price if they simply dumped it. Therefore, institutional investors are now using proxy fights and take-overs to force changes in poorly performing companies. Furthermore, the threat of forced managerial changes has motivated operational changes in many firms. Also, regulatory and accounting reforms, along with vigorous prosecutions of managers who break the law to feather their own nests, are quickly leading us back to the goal of shareholder wealth maximization (Brigham, Daves, 2002, p. 5).
5
2.3. ADAPTATION OF COMPANIES TO A MODERN BUSINESS ENVIRONMENT The internationalisation and globalisation of world markets has forever changed how companies must conduct business. Although the terms globalisation and internationalisation appear to mean the same thing, in reality they’re used differently. Internationalisation connotes expanding interfaces between nations. In business, internationalisation means the flow of business, goods, or capital from one country into another (Sera, 1992, p. 93). Globalisation, in contrast, looks at the whole world as being borderless and without nations. Goods, capital, and people have to move freely. In the current corporate environment, borders between countries have less significance, and people are less and less concerned about their nationality. Globalisation is a trend that has emerged out of the contemporary world’s needs. Internationalisation was dominant over globalisation until the 1980s. At that time, people experienced unprecedented changes in their lives and life-styles, not the least of which is they became wealthier. Citizens in developed countries enjoyed an upgrade in the quality of goods and services they could afford. People have also become more discerning and diversified in their purchases and life-styles. Any company that fails to respond to these recent trends and adapt to the new global environment will have a hard time (McKenna, 1991, p. 72). Global business causes the flow of goods, services, culture, and ideas around the world. Continuous changes in the economies of countries have made isolationism for them impossible. No nation can go it alone or exist without interacting with other nations. A nation’s failure to become part of the global community and participate in global markets virtually ensures that it will suffer declining economic influence and a lower standard of living for its citizens. On the other hand, a country’s successful participation in global business and global markets should lead to a better life and society for its citizens (Czinkota et. al., 2001, p. 4). We are living in the new economy characterised by rapid unpredictable change and volatility. Volatility and chaos aren't bad or good - they are just realities. While associated with strife, hardship, and discontent, volatility and chaos are also synonyms for fundamental change, breakthroughs, discoveries, and optimist. "In this new world, leaders must anticipate, rush to think, reach out, build enduring bonds with customers and stakeholders, and get comfortable with leading at the edge of chaos (Volatility Leadership: Leading in the Rapidly Changing Business, 2004). Today, we are living in a chaotic transition period to a new age defined by global competition, rampant change, faster flow of information and communication, increasing business complexity, and pervasive globalisation. The pace of change has become so rapid that it took a different type of firms to be dominating and marked an entirely new era of business. “More far-reaching technological advances and a consumer who has adjusted to this quicker pace and whose fickle preferences are revised with the speed of a television commercial” also characterise this new environment.
6
There is a big difference between anticipating and guessing. Anticipation means expecting, being aware of something in advance, to regard it as possible. The ability to anticipate is one of the key ingredients of efficient speed and change management. "Being able to anticipate that which is likely to occur in the next few months and the next few years is enough to give you an edge over 99% of the population who simply go along with whatever happens". To be able to think fast, you need to "understand the primary drivers of change, work at staying plugged in, constantly search for new combinations, and work on developing a sense of heightened perception". The fastest companies in the world think fast because of their ability to (Jennings, Haughton, 2002, p. 11-59): • anticipate; • spot trends; • create environment that does let the best idea - regardless of origin – win; • assess accurately and quickly the potential of new ideas. While you cannot predict the future, you can get a handle on trends, which is a way to take advantage of change and convert risks into opportunities. The ability to spot trends before others is vital if you want to think faster and thus be ahead of your competition (Index of/business_guide/crosscuttings, 2004). It is generally recognised that the developed world is moving towards the new economy based on computers, knowledge, and networks. The Internet is becoming a part of households faster than anyone could ever believe. New rules, new dynamics, and new success drivers will mark the business and the whole life of the incoming electronic era. In such circumstances, it is high time for companies to prepare themselves for the future challenges (Tekavčič, 2003, p. 1). Organisation’s external environment consists of all the outside institutions and forces that have an actual or potential interest or impact on the organisation’s ability to achieve its objectives: competitive, economic, technological, political, legal, demographic, cultural, and ecosystem. Environmental forces create challenges and opportunities for the organisation. Managers must react and adapt to changes in their internal and external environment. Globalisation is an example of an opportunity for an organisation. Improving technologies, such as transportation and communications, have enabled companies to expand into global or worldwide markets. Globalisation affects how organisations are managed. Managers must learn to deal effectively with multiple cultures and political systems in the midst of rapidly changing markets and technology. They must be able to anticipate this changing environment and develop the vision and competencies at all levels in their organisations to embrace this dynamic future (Business Environment, 2004).
7
In order to succeed in the new economy environment, companies should base their business on knowledge and customer orientation. Since the Internet business is still in the early phase of development, the first movers will gain a considerable advantage over the followers. In Europe, specific limitations of the Internet development lie in cultural and language differences among the countries. These specifics are even more important in the CEE countries, as the population is not used to the western way of life and the market economy. For these reasons, the additional key success factors for doing e-business in the CEE markets are especially the regional experience and the ability of combining specifics of the local market with the global trends (Tekavčič, 2003, p. 12-13). 2.3.1. Competing in the Information Age Companies are in the midst of a revolutionary transformation. Industrial age competition is shifting to information age competition. During the industrial age, from 1850 to about 1975, companies succeeded by how well they could capture the benefits from economies of scale and scope (Chandler, 1990, p. 23). Technology mattered, but, ultimately, success accrued to companies that could embed the new technology into physical assets that offered efficient, mass production of standard products. During the industrial age, financial control systems were developed in companies, such as General Motors, DuPont, Matsushita, and General Electric, to facilitate and monitor efficient allocations of financial and physical capital (Chandler, 1977, p. 46). A summary financial measure such as a return-on-capital-employed (ROCE) could both direct the company’s internal capital to its most productive use and monitor the efficiency by which operating divisions used financial and physical capital to create value for shareholders. The emergence of the information era, however, in the last decades of the twentieth century, made obsolete many of the fundamental assumptions of industrial age competition. No longer could companies gain sustainable competitive advantage by merely deploying new technology into physical assets rapidly, and by excellent management of financial assets and liabilities. The impact of the information era is even more revolutionary for service organisations than for manufacturing companies. Many service organisations, especially those in the transportation, utility, communication, financial, and health care industries, existed for decades in comfortable, non-competitive environments. They had little freedom in entering new business and in pricing their output. In return, government regulators protected these companies from potentially more efficient or more innovative competitors, and set prices at a level that provided adequate returns on their investment and cost base. Clearly, the past two decades have witnessed major deregulatory and privatisation initiatives for service companies throughout the world as information technology created the “seeds of destruction” of industrial-era regulated service companies (Kaplan, Norton, 1996, p. 4). The information age
8

environment for both manufacturing and service organisations requires new capabilities for competitive success. The ability of a company to mobilise and exploit its tangible or invisible assets has become far more decisive than investing and managing physical, tangible assets (Itami, 1978, p. 61). Intangible assets enable an organisation to: • develop customer relationships that retain the loyalty of existing customers and enable
new customer segments and market areas to be served effectively and efficiently; • introduce innovative products and services desired by targeted customer segments; • produce customised high-quality products and services at low cost and with short lead
times; • mobilise employee skills and motivation for continuous improvements in process
capabilities, quality, and response times; • deploy information technology, data base, and systems. 2.4. EVALUATING THE PERFORMANCE OF THE COMPANY Regardless of how thoughtful and insightful management is in developing plans, there is no guarantee that people in the organisation are carrying them out properly. For example, objectives give people specific direction. However, just stating is no guarantee that the necessary actions will be accomplished. The effective manager, therefore, needs to follow up to ensure that the actions that others are supposed to achieve are, in fact, being taken and achieved. This follow-up is referred to as control and every organisation needs it. Control is the process of monitoring activities to ensure that they are being accomplished as planned and of correcting any significant deviations. Activities that have been done in different units of the company should be evaluated and the actual performance should be compared with the desired standards. It helps to think of the control process as consisting of three separate and distinct steps (Robbins, 2000, p. 171): 1. measuring actual performance; 2. comparing actual performance against a standard; 3. taking a managerial action to correct deviations or inadequate standards.
9
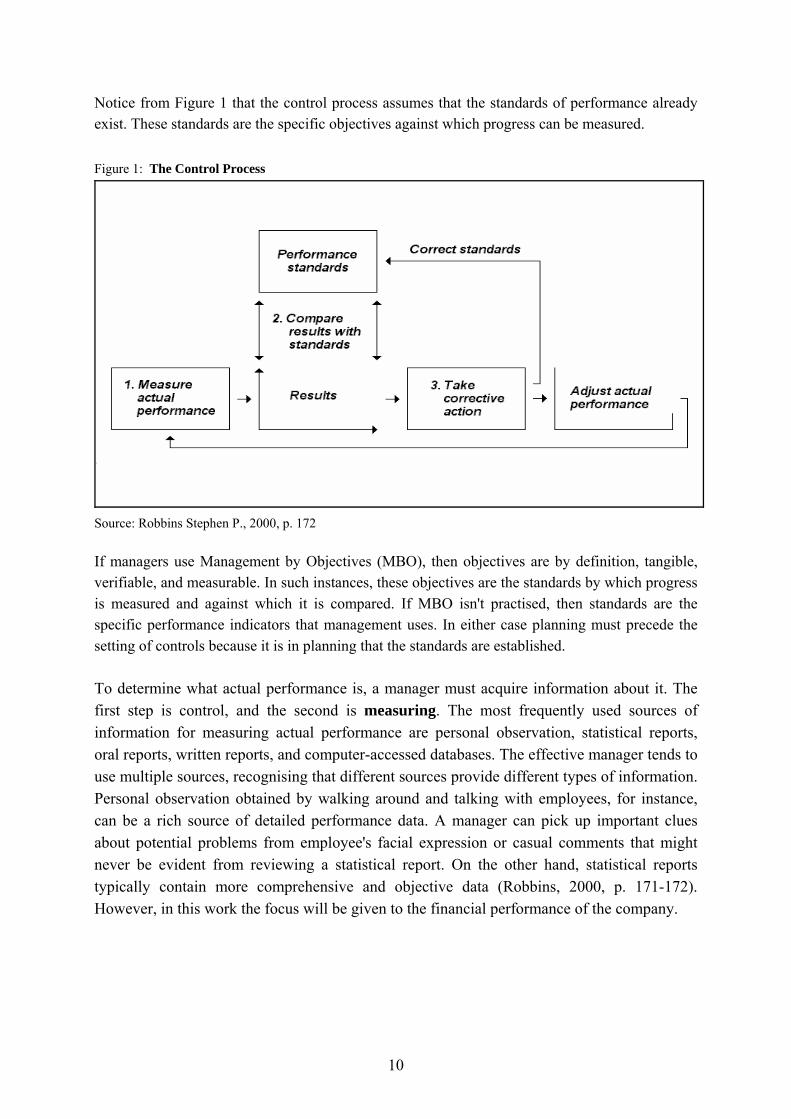
Notice from Figure 1 that the control process assumes that the standards of performance already exist. These standards are the specific objectives against which progress can be measured. Figure 1: The Control Process
Source: Robbins Stephen P., 2000, p. 172 If managers use Management by Objectives (MBO), then objectives are by definition, tangible, verifiable, and measurable. In such instances, these objectives are the standards by which progress is measured and against which it is compared. If MBO isn't practised, then standards are the specific performance indicators that management uses. In either case planning must precede the setting of controls because it is in planning that the standards are established. To determine what actual performance is, a manager must acquire information about it. The first step is control, and the second is measuring. The most frequently used sources of information for measuring actual performance are personal observation, statistical reports, oral reports, written reports, and computer-accessed databases. The effective manager tends to use multiple sources, recognising that different sources provide different types of information. Personal observation obtained by walking around and talking with employees, for instance, can be a rich source of detailed performance data. A manager can pick up important clues about potential problems from employee's facial expression or casual comments that might never be evident from reviewing a statistical report. On the other hand, statistical reports typically contain more comprehensive and objective data (Robbins, 2000, p. 171-172). However, in this work the focus will be given to the financial performance of the company.
10

The financial performance of a corporation is of vital interest to many different groups and individuals. Lenders are concerned with the corporation's ability to repay loans as well as whether it is abiding by loan contracts. Purchasing agents for other companies are concerned with its viability as a supplier of goods or services for its products. Potential investors are interested in determining the financial strength of a company as an element in assessing the company's value. In addition to these external analysts, managers within the corporation are also concerned with analysing its financial performance. These internal analysts compare the actual performance of the company and its divisions and lines of business with plans, budgets, or objectives; they also compare the company's performance with that of current and potential competition. The primary sources of information these analysts use to evaluate a firm's performance are its financial statements, the historical record of its past performance. Performance assessment via financial statement analysis is based on past data and conditions from which it may be difficult to extrapolate future expectations. Any decision to be made as a result of such performance assessment can affect only the future – the past is gone, or sunk. While past performance is interesting, many managers and analysts are more interested in what will happen in the future. The past performance of a company, as shown in its financial statements, may be used to help predict future performance (Harrington, Wilson, 1989, p. 1). When analysing financial statements, one must keep in mind the purpose of the analysis. Since different analysts are interested in different aspects of a corporation's performance, no single analytical technique or type of analysis is appropriate for all situations. However, there are several general things the analyst should bear in mind in reviewing data on financial statements. First, all financial statements data are historical. Although one may make projections based on such data, the accuracy of these projections depends on the forecaster’s ability and the continued pertinence of the historical relationships to current or future operations and industry and economic conditions. Second, historical data are collected and reported on the basis of particular accounting conventions. These accounting principles and rules vary among countries. Even within a country, several approaches may change over time. Although notes to financial statements summarise some of the significant accounting policies, and changes in these policies, analysts are still faced with comparability problems.
11

Third, because of the variability of seasonal funds flows and requirements for some business, the timing of the reporting period should be considered. For companies in highly seasonal or cyclical industries, comparisons of different reporting periods should be approached cautiously. Despite these concerns, an analyst can develop an insightful examination of a corporation's financial performance. The most common method of analysing financial statements is the use of ratios. These ratios are simple mathematical relationships between various items on financial statements. The analytical skill lies not in computing the ratios but in determining which ratios to use in each case and interpreting the results. Just by themselves the ratios are relatively meaningless. Only by comparing ratios over time and between companies – and by determining the underlying causes of the differences among them – does ratio analysis help the analyst or manager gain insight into corporate performance. The primary ratios used for analysing the internal performance of a company can be categorised into five groups: • liquidity ratios; • asset management ratios; • debt management ratios; • profitability ratios; • market value ratios. These ratios can be combined to determine the rate of return for a company and its owners and the rate at which the company can grow - the sustainable rate of growth. By adding data about the company's stock market performance, the analyst can gain insight into how financial markets view the company's performance (Harrington, Wilson, 1989, p. 8). 2.4.1. Problems with defining the performance of the company Performance measurement is crucial to evolution and control. The lack of quantifiable objectives or performance standards and the inability of the information system to provide timely, valid information are two obvious control problems. Without objective and timely measurements, making operational, let alone strategic, decisions would be extremely difficult. Nevertheless, the use of timely, quantifiable standards doesn’t guarantee adequate performance. The very act of monitoring and measuring performance may cause side effects that interfere with overall corporate performance. Among the most frequent negative side effects are short-term orientation and goal displacement (Wheelen, Hunger, 1995, p. 296).
12
2.4.2. Traditional versus contemporary performance measurement Performance measurement is an important topic in the field of management today. Some authors argue that since the beginning of the 1990s performance measurement has been undergoing a revolution (Eccles, 1991, p. 131-137). At the heart of the revolution lies a shift from treating financial figures as the foundation of performance measurement to treating them as one of a border set of measures. One tentative and almost exclusive reason for this shift is the inadequacy of the traditional performance measurement system that was devised during the 1920s when the internal and external environments of most manufacturing organisations were very different from those of today. In the search for competitiveness, most organisations around the world have implemented new technologies, information systems, and change management programs. However, performance measurement itself has not kept pace with these changes. As Kaplan (1991) put it, “efforts to revitalise manufacturing industries cannot succeed if outdated accounting and control system remain unchanged”. It is doubtful whether numbers themselves can successfully run a company, but certainly the numbers generated by traditional performance systems provide a poor basis for managerial decisions. Managers require both improved financial figures and non-financial indicators of performance. For companies competing in highly competitive and dynamic environments in times when success is largely subject to relevant and timely information, a performance measurement system can be seen as an organisational capability, a potential source of competitive advantage (Rejc, 2003, p. 117). 2.4.3. Core differences between traditional and contemporary performance measurement The literature on performance measurement can be divided into two main phases. The first phase was from the late 1880s to the 1980s when the emphasis was laid on financial and productivity measures and most developments related to traditional management accounting. The performance of an organisation was considered from its owners, point of view, therefore, owners determinated what was the primary objective of the company and set the fundamental criteria for measuring performance – return on capital (ROE). Return on assets (ROA) appeared as an alternative to ROE, encompassing both the owners; as well as other financial investors; investments. Financial metric dominated the traditional measurements of performance at the highest levels and was accompanied by other accounting, largely financial measures at lower levels (Lipovec, 1970, p. 117). Many managers have tracked quality, market share, and other non-financial measures for years; yet have not given them equal (or even greater) status in determining strategy, promotions, bonuses, and other rewards.
13

The second phase began in the late 1980s and continues today. The emphasis has changed in favour of balanced (financial and non-financial measures beyond productivity) and integrated performance measures, which are more appropriate to the new internal and external operational conditions of most organisations. Contrary to the traditional concept of performance, contemporary conception pays equal attention to both the purposes and objectives of an organisation as well as to processes and other drivers of success. The reasoning behind this is that the results we seek are often not immediately or clearly apparent, or are difficult to measure. Even if the results are measurable and apparent, it is usually more important to know what caused the results than the result themselves. In the contemporary conception, the purpose of doing business relates to the interests of all parties involved – customers, owners, employees, managers, business partners, local communities and other potentially important stakeholders – not only the owners. Following the multiple nature of purpose, companies’ objectives are also multiple. Emmanuel, Otley and Merchant (1990) thought that the typical business enterprise does not have clear-cut organisational objectives. This is because the various participants connected with the organisation each have their own separate objectives and hold comparable amounts of power with which to achieve their aims. Even in the restricted context of a business enterprise where the participants are solely interested in their own economic welfare, the interests of different groups are conflicting. Shareholders are interested in the return on their investment, employees in their wages and workplace stability, customers and suppliers in obtaining a favourable price, and the local community in having a healthy local economy. However, despite such conflicts there is also likely to be some basic level of agreement. It is usually in the interest of all involved that the firm continues to exist as an entity. In these circumstances, performance measurement needs to incorporate a portfolio of integrated financial and non-financial performance measures forcing managers to focus on the most critical strategic success factors and the most important business results, thereby helping them understand their interrelationships and contribute to correct decision-making. To get a complementary and concise view of an organisation’s performance, financial performance measures need to be balanced with non-financial performance measures (Rejc, 2003, p. 119). 2.4.4. The contingency theory and contemporary performance measurement Unlike the traditional approach to performance measurement where performance measurement is comparable across industries and the measures are alike, contemporary performance measurement pays attention to the particular characteristics of a company. Even performance measurement system following the same approach (such as, for example, the Balanced Scorecard) may only be partly comparable with one another. The actual choice of performance measures differs not only among companies active in different industries but also among companies competing within the same industry.
14

These differences may stem not only from the fact that some managers conduct the affairs of their company so as to achieve only a satisfactory and not the maximum level of the objectives (Cyert, March, 1963, p. 144-148). Or, as theory of limited rationality says, they may emerge because human beings differ in their abilities to process and understand large quantities of information. The systems approach that established itself as a popular tool for studying organisations in the 1950s and the contingency theory of management accounting can be used as theoretical foundations to explain these differences. The central feature of the open systems approach is that it seeks to study the activities of an organisation by reference to the context of the wider environment in which is set, while the contingency approach to management accounting is based on the premise that there is no universally appropriate accounting system, which applies equally to all organisations in all circumstances (Otley, 1980, p. 417). Since a performance measurement system is considered part of the management accounting system or at least depends on it in great part, the contingency approach to performance measurement can be formulated in the same way. It is based on the premise that there is no universally appropriate performance measurement system applicable to all organisations in all circumstances. Instead, a contingency theory attempts to identify specific aspects of a performance measurement system that are associated with certain defined circumstances and to demonstrate appropriate matching (Rejc, 2003, p. 120). It is important, that in our research, we identify specific features of an organisation's context that impact on particular features of performance measurement design. Three main classes of contingent factor have been identified as influencing the accounting system design: the environment, organisational structure and technology (Emmanuel, Otley, Merchant, 1990, p. 57). Relevant features of the organisation's environment affecting its accounting system design that have been suggested include its degree of predictability, the level of competition faced in the market place, the number of different product/market encountered, and the degree of hostility exhibited. Structural features suggested include size, interdependence, decentralisation and resource availability. Technological factors include the nature of the production process, its degree of routines, how well means-end relationships are understood and the level of task variety. Of these, environmental factors have most often been researched2. A consideration of corporate strategy has, quite surprisingly, not been prominent in studies or control design despite some arguments that differences in corporate strategies should logically lead to differences in planning and control systems' design. More often, the influence of organisational culture on organisational culture on control system is empirically researched. Emmanuel, Otley and Merchant (1990) mentioned some of them. The key question here, then, is which classes of contingent factor can be identified as influencing performance measurement in Slovenian companies.
2 Khandwalla was one of the first accounting researches to examine the effects of the external environment on management control practices. He concluded that the sophistication of an accounting information system was influenced by the intensity of the competition faced by the firm (Khandwalla, 1977, p. 100-267).
15

2.4.5. Performance measurement in large Slovenian companies3
In Slovenia, evidence of how performance is being measured at the highest level in organisations is still fragmented in terms of financial (accounting) and non-financial performance measures. A thorough performance-related study could reveal Slovenian economy’s strengths in this area. Since gaining its independence in 1991, Slovenia has undergone important economic and political changes. Companies that previously made sales mostly to ex-Yugoslav republics needed an urgent reorientation toward other, mostly Western European markets to become part of a unified global economy whose competitiveness and dynamic changes easily presented danger to newcomers. Past research has shown that the majority of Slovenian companies had already ended the period of their transition determined by legal, financial, and strategic restructuring. Today, most structural changes have come to an end and the size and structure of Slovenian companies already resembles those in most foreign enterprises (99,6%), but the importance of large companies in terms of employment, revenues and cross-industry dependence confirms that these companies are important pillars of Slovenia's economy. They should follow the best practices of the leading companies abroad. Contemporary performance measurement is certainly one of determining factors influencing their competitive position so companies should adopt these ideas to survive and thrive in the long term. A research on performance measurement in large Slovenian companies was launched in the winter of 2000. Large companies were selected as a research population, because they are, first of all, important for the Slovenian economy, and second, they are also mostly export-oriented. One would certainly expect them to be the first to follow the best practices of leading companies abroad. The conclusion of the research was that since contemporary performance measurement has become one of the determinant factors influencing the competitive position of a company, Slovenian companies should adopt these ideas to survive and thrive in the long term. In the survey the core hypothesis was – that at least some large companies have taken progressive steps toward contemporary performance measurement in terms of both the fundamental criterion and the non-financial performance measurement. This hypothesis has proven to be correct. Of all companies included, more than a third still considers return on equity (ROE) to be the fundamental criteria of performance, therefore pursuing the traditional imperatives. Yet important ranks have also been given to value added and cash flow related measures such as cash flow stability and cash flow growth. However, when asked what the successful performance of a company relates to, remarkably many managing directors answered that all stakeholders need to be satisfied. 3 Short resumption of the findings of the survey published in Economic Business Review – Vol. 5 no. ½ (April/June 2003).
16

Interestingly, the stakeholder theory did not affect the managing directors' attitudes related to the fundamental measure of performance but, when discussing what successful performance is, almost 50% of all answers ranked stakeholders interests' and their satisfaction in the first place. The highly appreciated measurement of non-financial leading indicators of future performance additionally implies that contemporary performance measurement imperatives are on their way. Customer satisfaction and the quality of products and services were ranked as very important which reveals that satisfying customers with quality products and services and regular on-time delivery is considered to be the right way to achieve financial success. Employee satisfaction as well as care for the environment was also given a high score, revealing the importance of "vital signs". Yet significant differences can in fact be found in the way managing directors consider and measure their company's performance and these led the involved in the research project for potential contingent factors. Among the five assumed, they succeeded in isolating three that today seem to influence performance measurement in large Slovenian companies: the power of unions, growth strategies, and the impact of a company's production on the environment (Kaplan, Norton, 1996, p. 7).
17
3. TRADITIONAL METHOD FOR EVALUATING THE PERFORMANCE OF THE COMPANY All the new programs, initiatives, and change management processes of information age companies are being implemented in an environment governed by quarterly and annual financial reports. The financial-reporting process remains anchored to an accounting model developed centuries ago for an environment of arm’s-length transactions between independent entities. This venerable financial accounting model is still being used by information age companies as they attempt to build internal assets and capabilities, and to forge linkages and strategic alliances with external parties (Elliot, 1992, p. 77). Ideally, this financial accounting model should have been expanded to incorporate the valuation of a company’s intangible and intellectual assets, such as high-quality products and services, motivated and skilled employees, responsive and predictable internal processes, and satisfied and loyal customers. Such a valuation of intangible assets and company capabilities would be especially helpful since, for information age companies, these assets are more critical to success than traditional physical and tangible assets. If intangible assets and company capabilities could be valued within the financial accounting model, organisations that enhanced these assets and capabilities could communicate this improvement to employees, shareholders, creditors, and communities. Conversely, when companies depleted their stock of intangible assets and capabilities, the negative effects could be reflected immediately in the income statement. Realistically, however, difficulties in placing a reliable financial value on such assets as the new product pipeline; process capabilities, employee skills, motivation, and flexibility, customer loyalty, data bases, and systems will likely preclude them from ever being recognised in organisational balance sheets. Yet these are the very assets and capabilities that are critical for success in the competitive environment of today’ and tomorrow’. 3.1. ANALYSIS OF FINANCIAL STATEMENTS The financial statements, namely, Income Statement, Balance Sheet and Cash Flow Statements, of a business firm contain substantial and extremely useful information about its financial health. This vas set of information may also be useful to the management for judging the business firm from all perspectives such as (Jain, 2003, p. 74): • the firm should be able to pay short-term maturing obligations as well as long-term
maturing obligations as and when they become due; • it should make available a satisfactory rate of return on investments made by
shareholders; • above all, management should ensure that every resource/asset at its disposal is efficiently
utilised.
18

In contrast, the other analysts would be focusing only on that part of the analysis, which serve their needs. For instance, investors would be interested more in profitability analysis; suppliers of goods on credit would be concerned more with the firm’s ability to pay their bills (liquidity analysis); the focus on long-term lenders would be on its solvency position. Evidently, the focus of financial analysis is contingent to the objective of analyst. Basically it is a process of evaluating the relationship between the two significantly related components of financial statements so that the firm’s financial position and performance may be understood better. For instance, the two related figures might be Earnings After Tax (EAT) and Shareholders Funds to determine Rate of Return (ROR) earned by the corporate firm on its owners funds. Likewise, Gross Profit and Sales constitute another set of related figures to calculate the gross profit margin of a business firm. However, no useful purpose would be served by relating the cost of stationery used with cost of machinery purchased. As there does not exist any logical relationship between these two component parts of the financial statements for which ratio(s) is (are) computed. The analysis is important, because accounting data do influence stock prices, and to understand why a company is performing the way it is and to forecast where it is heading, one needs to evaluate the accounting statements. Financial statements can be used by different interest groups: by managers to improve performance, by lenders to evaluate the likelihood of collecting on loans, and by stockholders to forecast earnings, dividends, free cash flow, and stock prices. If management is to maximise a firm’s value, it must take advantage of the firm’s strengths and correct its weaknesses. Financial statement analysis involves (Brigham, Daves, 2002, p. 229): 1. comparing the firm’s performance with that of other firms in the same industry; 2. evaluating trends in the firm’s financial position over time. These studies help managers identify deficiencies and then take actions to improve performance. In brief, the financial analyst first needs to select the information relevant to the analysis under consideration from the total information contained in the financial statements. The second step involved in this analysis is to arrange the information in such a way as to highlight significant relationships. The final step is the interpretation and drawing of inferences and conclusion (Jain, 2003, p. 76). 3.1.1. Ratio Analysis Financial statements report both a firm’s position at a point in time and its operations over some past period. However, the real value of financial statements lies in the fact that they can be used to help predict future earnings, dividends, and free cash flow. Financial ratios are designed to help evaluate financial statements.
19

From an investor’s standpoint, predicting the future is what financial statement analysis is useful both to help anticipate future conditions and, more important, as a starting point for planning actions that will improve the firm’s future performance (Brigham, Daves, 2002, p. 229). Calculating the ratios or percentages is relatively simple. The critical ingredient in a useful analysis is the analyst’s interpretation of these figures. To interpret the ratios, analysts generally compare performance (Harrington, Wilson, 1989, p. 26-30): 1. from various time periods; 2. with that of one or more companies in the same industry; 3. with the average performance of the industry. The easiest first step in making historical comparisons is to do a full analysis of the components in the sustainable growth rate. The purpose of this comparison is to determine whether any significant changes occurred during the years that have been considered. Percentage change analysis can be used to determine the relative change in an item (expense, income, asset, or liability) over time, since the magnitude of raw data can mask the changes. Another type of analysis that is useful for analysing a particular company’s performance is to contrast two or more companies. Because financial requirements and uses of funds differ among industries, it is important that companies chosen for comparison should be limited to those within the same industry. Comparisons can be expanded to include several companies or all of the industry. Typically, industry wide comparisons are based on industry averages. These averages are available from several sources that collect and publish data. Because of financial differences in companies of differing sizes, analysts commonly select from the industry a sample of companies that correspond in size with the target company (Harrington, Wilson, 1989, p. 30). It should be noted that an industry average is not a magic number that all firms should strive to maintain – in fact, some very well-managed firms are above the average while other good firms are below it (Brigham, Daves, 2002, p. 232). However if a firm’s ratios are far removed from the averages for its industry, this is a red flag, and analysts should be concerned about why the variance occurs. Proper interpretation requires an understanding of the company as well as the environment. Critical issues that need to be considered are general economic conditions, the competitive situation, and the business and financial strategy of the company. All of these factors, individually and in combination, affect the financial result for the company and the value that will be earned by the company’s owners, its shareholders (Harrington., Wilson, 1989, p. 30).
20
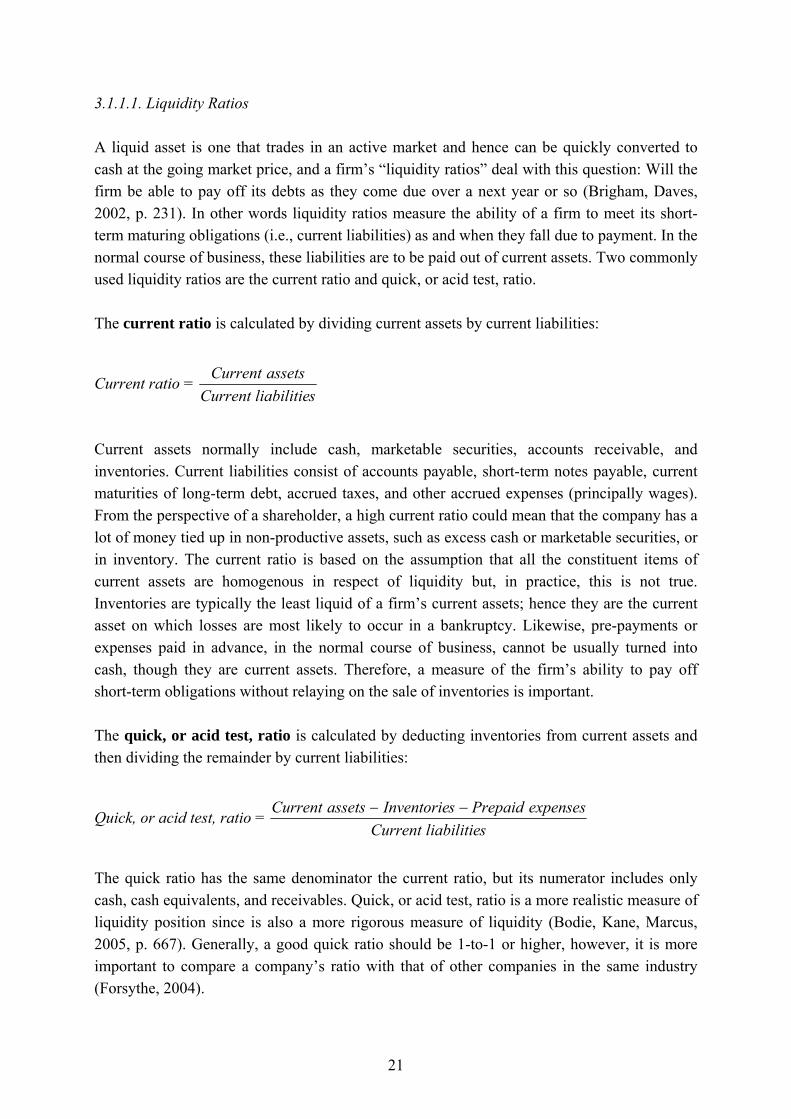
3.1.1.1. Liquidity Ratios A liquid asset is one that trades in an active market and hence can be quickly converted to cash at the going market price, and a firm’s “liquidity ratios” deal with this question: Will the firm be able to pay off its debts as they come due over a next year or so (Brigham, Daves, 2002, p. 231). In other words liquidity ratios measure the ability of a firm to meet its short-term maturing obligations (i.e., current liabilities) as and when they fall due to payment. In the normal course of business, these liabilities are to be paid out of current assets. Two commonly used liquidity ratios are the current ratio and quick, or acid test, ratio. The current ratio is calculated by dividing current assets by current liabilities:
Current ratio = sliabilitieCurrent
assetsCurrent
Current assets normally include cash, marketable securities, accounts receivable, and inventories. Current liabilities consist of accounts payable, short-term notes payable, current maturities of long-term debt, accrued taxes, and other accrued expenses (principally wages). From the perspective of a shareholder, a high current ratio could mean that the company has a lot of money tied up in non-productive assets, such as excess cash or marketable securities, or in inventory. The current ratio is based on the assumption that all the constituent items of current assets are homogenous in respect of liquidity but, in practice, this is not true. Inventories are typically the least liquid of a firm’s current assets; hence they are the current asset on which losses are most likely to occur in a bankruptcy. Likewise, pre-payments or expenses paid in advance, in the normal course of business, cannot be usually turned into cash, though they are current assets. Therefore, a measure of the firm’s ability to pay off short-term obligations without relaying on the sale of inventories is important. The quick, or acid test, ratio is calculated by deducting inventories from current assets and then dividing the remainder by current liabilities:
Quick, or acid test, ratio = sliabilitieCurrent
expensesPrepaidsInventorieassetsCurrent −−
The quick ratio has the same denominator the current ratio, but its numerator includes only cash, cash equivalents, and receivables. Quick, or acid test, ratio is a more realistic measure of liquidity position since is also a more rigorous measure of liquidity (Bodie, Kane, Marcus, 2005, p. 667). Generally, a good quick ratio should be 1-to-1 or higher, however, it is more important to compare a company’s ratio with that of other companies in the same industry (Forsythe, 2004).
21
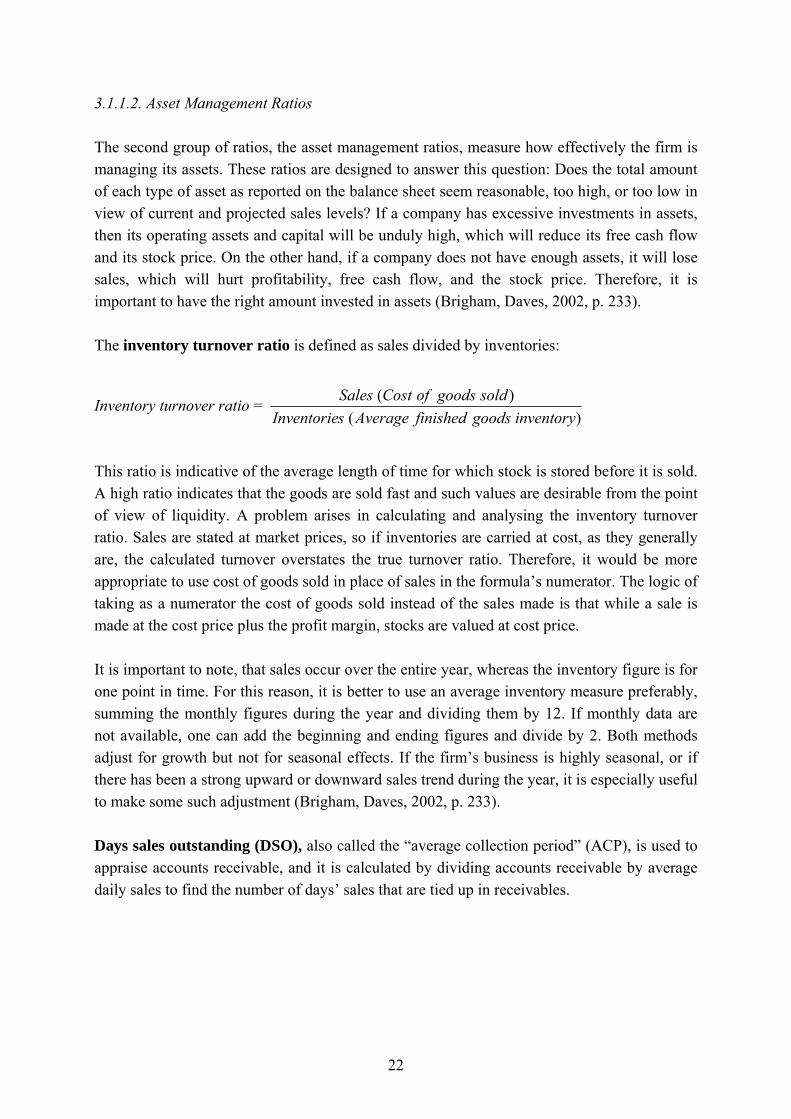
3.1.1.2. Asset Management Ratios The second group of ratios, the asset management ratios, measure how effectively the firm is managing its assets. These ratios are designed to answer this question: Does the total amount of each type of asset as reported on the balance sheet seem reasonable, too high, or too low in view of current and projected sales levels? If a company has excessive investments in assets, then its operating assets and capital will be unduly high, which will reduce its free cash flow and its stock price. On the other hand, if a company does not have enough assets, it will lose sales, which will hurt profitability, free cash flow, and the stock price. Therefore, it is important to have the right amount invested in assets (Brigham, Daves, 2002, p. 233). The inventory turnover ratio is defined as sales divided by inventories:
Inventory turnover ratio = )(
)(inventorygoodsfinishedAveragesInventorie
soldgoodsofCostSales
This ratio is indicative of the average length of time for which stock is stored before it is sold. A high ratio indicates that the goods are sold fast and such values are desirable from the point of view of liquidity. A problem arises in calculating and analysing the inventory turnover ratio. Sales are stated at market prices, so if inventories are carried at cost, as they generally are, the calculated turnover overstates the true turnover ratio. Therefore, it would be more appropriate to use cost of goods sold in place of sales in the formula’s numerator. The logic of taking as a numerator the cost of goods sold instead of the sales made is that while a sale is made at the cost price plus the profit margin, stocks are valued at cost price. It is important to note, that sales occur over the entire year, whereas the inventory figure is for one point in time. For this reason, it is better to use an average inventory measure preferably, summing the monthly figures during the year and dividing them by 12. If monthly data are not available, one can add the beginning and ending figures and divide by 2. Both methods adjust for growth but not for seasonal effects. If the firm’s business is highly seasonal, or if there has been a strong upward or downward sales trend during the year, it is especially useful to make some such adjustment (Brigham, Daves, 2002, p. 233). Days sales outstanding (DSO), also called the “average collection period” (ACP), is used to appraise accounts receivable, and it is calculated by dividing accounts receivable by average daily sales to find the number of days’ sales that are tied up in receivables.
22

Thus, the DSO represents the average length of time that the firm must wait after making a sale before receiving cash, which is the average collection period.
DSO = daypersalesAverage
sReceivable = 365/salesAnnual
sReceivable
In the event that the trend in DSO over the past few years has been rising, but the credit policy has not been changed, this would be strong evidence that steps should be taken to expedite the collection of accounts receivable. The fixed assets turnover ratio measures how effectively the firm uses its plant and equipment. It is the ratio of sales to net fixed assets:
Fixed assets turnover ratio = )(
)(assetsfixedAverageassetsfixedNet
soldgoodsofCostSales
This ratio is concerned with assessing how efficiently the total fixed or long-term assets that are measured on the basis of net of depreciation are utilised by the business firm. Obviously, the higher is the ratio, the greater is the utilisation of fixed assets. A potential problem can exist when interpreting the fixed assets turnover ratio, because fixed assets reflect the historical costs of the assets. Inflation may cause the value of many assets that were purchased in the past to be seriously understated. Therefore, if we were comparing an old firm that had acquired many of its fixed assets years ago at low prices with a new company that had acquired many of its fixed assets only recently, we would probably conclude that the old firm had the higher fixed assets turnover ratio. However, this would be more reflective of the difficulty accountants have in dealing with inflation than of any inefficiency on the part of the new firm. The accounting profession is trying to devise ways to make financial statements reflect current values rather than historical values. If balance sheets were actually stated on a current value basis, this would help us make better comparisons, but at the moment the problem persists. Because financial analysts typically do not have the data necessary to make these adjustments, they simply recognise that a problem exists and deal with it judgementally (Brigham, Daves, 2002, p. 235). The final asset management ratio, the total assets turnover ratio, measures the turnover of the entire firm’s assets; it is calculated by dividing sales by the total assets:
Total assets turnover ratio = )(
)(assetstotalAverageassetsTotal
soldgoodsofCostSales
23

It is a single statistic measure that shows the extent of utilisation of total assets, current assets and fixed assets as a group. If the ratio is below the industry average, this indicates that the company is not generating a sufficient volume of business given its total asset investment. Sales should be increased, some assets should be sold, or a combination of these steps should be taken. 3.1.1.3. Debt Management Ratios The extent to which a firm uses debt financing, or financial leverage, has three important implications: 1. By raising funds through debt, stockholders can maintain control of a firm without
increasing their investment. 2. If the firm earns more on investments financed with borrowed funds than it pays in
interest, then its shareholders’ returns are magnified, or “leveraged”, but their risk are also magnified.
3. Creditors look to the equity, or owner-supplied funds, to provide a margin of safety, so the higher proportion of funding supplied by stockholders, the less risk creditors face.
The ratio of total liabilities to total assets is called the debt ratio, or some times the total debt ratio. It measures the percentage of funds provided by sources other than equity:
Debt ratio = assetsTotal
sliabilitieTotal
Creditors prefer low debt ratios because a lower ratio means a greater cushion against creditors’ losses in the event of liquidation. Stockholders, on the other hand, may want more leverage because it magnifies expected earnings. A variety of factors determine a company’s optimal debt ratio. The times-interest-earned (TIE) ratio is determined by dividing earnings before interest and taxes (EBIT) by the interest charges:
Times-interest-earned (TIE) ratio = schargeInterest
EBIT
The TIE ratio measures the extent to which operating income can decline before the firm is unable to meet its annual interest costs. Failure to meet this obligation can bring legal action by the firm’s creditors, possibly resulting in bankruptcy.
24

The TIE ratio is useful for assessing a company’s ability to meet interest charges on its debt, but this ratio has two shortcomings: 1. Interest is not the only fixed financial charge – companies must also reduce debt on
schedule, and many firms lease assets and thus must make lease payments. If they fail to repay debt or meet lease payments, they can be forced into bankruptcy.
2. EBIT does not represent all the cash flow available to service debt, especially if the firm has high depreciation and/or amortisation charges. To account for these deficiencies, bankers and others have developed the EBITDA coverage ratio, defined as follows:
EBITDA coverage ratio = paymentsLeasepaymentsPrincipalInterest
paymentsLeaseEBITDA++
+
Different analysts define the EBITDA coverage ratio in different ways. For example, some would omit the lease payment information, and others would “gross up” principal payments by dividing them by (-T) because these payments are not tax deductions, hence must be made with after-tax cash flows. I included lease payments because, for many firms, they are quite important, and failing to make them can lead to bankruptcy just as surely as can failure to make payments on “regular” debt. I did not gross up principal payments because, if a company is in financial difficulty, its tax rate will probably be zero, hence the gross up is not necessary whenever the ratio is really important. 3.1.1.4. Profitability Ratios These ratios go on to show the combined effects of liquidity, asset management, and debt on operating results. They are of crucial significance for investors. In fact, the only reason why investors or the owners invest in a business firm is that they expect that they will earn adequate return on the investment made. The profit margin on sales, calculated by dividing net income by sales, gives the profit per dollar of sales:
Profit margin on sales = Sales
rsstockholdecommontoavailableincomeNet
25

The basic earning power (BEP) ratio is calculated by dividing earnings before interest and taxes (EBIT) by total assets:
Basic earning power ratio (BEP) = assetsTotal
EBIT
This ratio shows the raw earning power of the firm’s assets, before the influence of taxes and leverage, and it is useful for comparing firms with different degrees of financial leverage. Return on assets (ROA) it is measured conventionally in terms of net profits after taxes (EAT) and average total assets. Symbolically:
ROA = assetstotalAverage
EAT * 100
The ROA based on the equation above would be an underestimate of profitability as EAT is a reward to shareholders, whereas assets are financed both by shareholders’ funds and debt-holders’ funds. Conceptually, numerator should also include rewards/payments made both to the owners and lenders. It is for this reason that the numerator should be inclusive of the interest paid to debt-holders (Jain, 2003, p. 33). Accordingly, real ROA is computed as per this equation:
ROA = assetstotalAverage
InterestEAT + * 100
Return on Shareholders’ Equity (ROE) measures the profitability in relation to total shareholders’ funds. EAT (earnings after tax) are obviously in the numerator, as these are the only earnings to which shareholders are entitled (Jain, 2003, p. 34).
ROE = equityrsshareholdetotalAverage
EAT'
* 100
Where, total shareholder’s equity consists of: • Equity funds, comprising Equity share capital Plus reserves and surplus Minus
accumulated losses, if any; • Preference share capital.
26

Ultimately, this is the most important, or “bottom line”, accounting ratio, since stockholders invest to get a return on their money and this ratio tells how well they are doing in accounting sense (Brigham, Daves, 2002, p. 240). 3.1.1.5. Market Value Ratios This group of ratios relates the firm’s stock price to its earnings, cash flow, and book value per share. These ratios give management an indication of what investors think of the company’s past performance and future prospects. If the liquidity, asset management, debt management, and profitability ratios all look good, then the market value ratios will be high, and the stock price will probably be as high as can be expected. The price/earnings ratio shows us how much investor’s are willing to pay per unit of money of reported profits.
Price/Earnings (P/E) ratio = shareperEarnings
shareperPrice
(P/E) is the most widely used and misused of all multiples (Damodaran, 2002, p. 468). High ratio normally signifies that investors expect the profits of the corporate firm to grow. In some industries, stock price is tied more closely to cash flow rather than net income. Consequently, investors often look at the price/cash flow ratio4:
Price/cash flow = shareperflowCash
shareperPrice
Market/Book Ratio gives another indication of how investors regard the company.
Book value per share = goutstandinShares
equityCommon
Market/book (M/B) ratio = sharepervalueBookshareperpriceMarket
4 Some analysts look at multiples beyond just the price/earnings and the price/cash flow ratios. Depending on the industry, some may look at measures such as price/sales, price/customers, or price/EBITDA per share. Ultimately, though, value depends on free cash flow, so if these »exotic« ratios do not forecast free cash flow, they may turn out to be misleading.
27
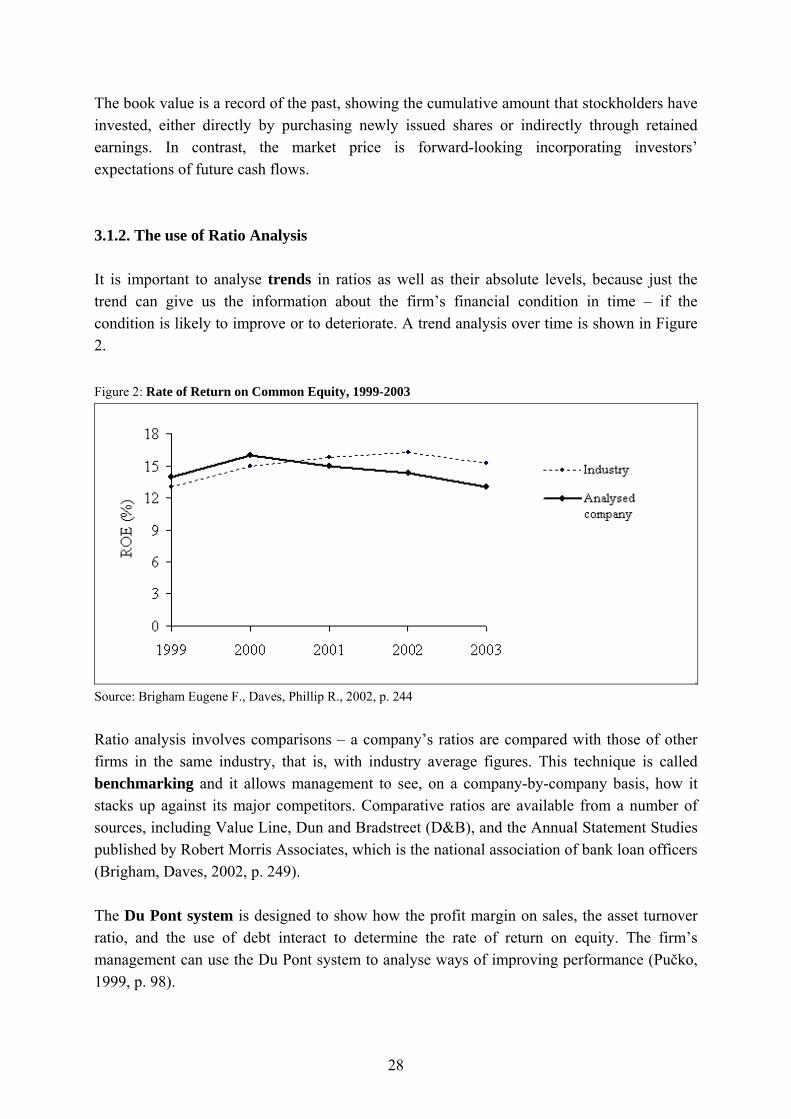
The book value is a record of the past, showing the cumulative amount that stockholders have invested, either directly by purchasing newly issued shares or indirectly through retained earnings. In contrast, the market price is forward-looking incorporating investors’ expectations of future cash flows. 3.1.2. The use of Ratio Analysis It is important to analyse trends in ratios as well as their absolute levels, because just the trend can give us the information about the firm’s financial condition in time – if the condition is likely to improve or to deteriorate. A trend analysis over time is shown in Figure 2. Figure 2: Rate of Return on Common Equity, 1999-2003
Source: Brigham Eugene F., Daves, Phillip R., 2002, p. 244 Ratio analysis involves comparisons – a company’s ratios are compared with those of other firms in the same industry, that is, with industry average figures. This technique is called benchmarking and it allows management to see, on a company-by-company basis, how it stacks up against its major competitors. Comparative ratios are available from a number of sources, including Value Line, Dun and Bradstreet (D&B), and the Annual Statement Studies published by Robert Morris Associates, which is the national association of bank loan officers (Brigham, Daves, 2002, p. 249). The Du Pont system is designed to show how the profit margin on sales, the asset turnover ratio, and the use of debt interact to determine the rate of return on equity. The firm’s management can use the Du Pont system to analyse ways of improving performance (Pučko, 1999, p. 98).
28

3.1.3. Limitations of Ratio Analysis While ratio analysis can provide useful information concerning a company’s operations and financial condition, it does have limitations that necessitate care and judgement. Some potential problems are listed below (Brigham, Daves, 2002, p. 249): 1. Many large firms operate different divisions in different industries, and for such
companies it is difficult to develop a meaningful set of industry averages. Therefore, ratio analysis is more useful for small, narrowly focused firms than for large, multidivisional ones.
2. Most firms want to be better than average, so merely attaining average performance is not necessarily good. As a target for high-level performance, it is best to focus on the industry leader’ ratios. Benchmarking helps in this regard.
3. Inflation may have badly distorted firm’s balance sheets - recorded values are often substantially different from “true” values. Further, because inflation affects both depreciation charges and inventory costs, profits are also affected. Thus, a ratio analysis for one firm over time, or a comparative analysis of firms of different ages, must be interpreted with judgement.
4. Seasonal factors can also distort a ratio analysis. For example, the inventory turnover ratio for a food processor will be radically different if the balance sheet figure used for inventory is the one just before versus just after the close of the coming season. By using monthly averages for inventory (and receivables) when calculating turnover ratios the problem can be minimised.
5. Firms can employ “window dressing” techniques to make their financial statements look stronger.
6. Different accounting practices can distort comparisons. As noted earlier, inventory valuation and depreciation methods can affect financial statements and thus distort comparisons among firms. Also, if one firm leases a substantial amount of its productive equipment, then its assets may appear on the balance sheet. At the same time, the ability associated with the lease obligation may not be shown as a debt. Therefore, leasing can artificially improve both the turnover and the debt ratios.
7. It is difficult to generalise about whether a particular ratio is “good” or “bad”. For example, a high current ratio may indicate a strong liquidity position, which is good or excessive cash, which is bad (because excess cash in the bank is a non-earning asset). Similarly, a high fixed asset turnover ratio may denote either that a firm uses its assets efficiently or that it is undercapitalised and cannot afford to buy enough assets.
8. A firm may have some ratios that look “good” and other that look “bad”, making it difficult to tell whether the company is, on balance, strong or weak. However, statistical procedures can be used to analyse the net effects of a set of ratios.
29

Many banks and other lending organisations use discriminate analysis, a statistical technique, to analyse firm’s financial ratios, and then classify the firms according to their probability of getting into financial trouble.
9. Effective use of financial ratios requires that the financial statements upon which they are based are accurate. Revelations in 2001 and 2002 of accounting fraud by such industry giants as WorldCom and Enron showed that financial statements are not always accurate; hence information based on reported data can be misleading.
Ratio analysis is useful, but analysts should be aware of these problems and make adjustments as necessary. Ratio analysis conducted in a mechanical, unthinking manner is dangerous, but used intelligently and with good judgement, it can provide useful insights into a firm’s operations. 3.2. NEW PERFORMANCE MEASURES Joel Stern and Bennett Stewart, co-founders of the consulting firm Stern Stewart & Company, developed concepts of two new performance measures, MVA, or Market Value Added, and EVA, or Economic Value Added. Stern Stewart copyrighted the terms “EVA” and “MVA”, so other consulting firms have given other names to these values. Still, EVA and MVA are the terms most commonly used in practice (Stewart G. Bennett, 1991, p. 76). A commonly used approach to measure the performance is also calculating Free Cash Flows. 3.2.1. Free cash flow (FCF) FCF is the cash flow actually available for distribution to investors after the company has made all the investment in fixed assets and working capital necessary to sustain ongoing operations. The stream of cash flow that the operations will generate now and in the future determines the value of a company’s operations. To be more specific, the value of operations depends on all the future expected free cash flows (FCF), defined after tax operating profit minus the amount of new investment in working capital and fixed assets necessary to sustain the business. Thus, free cash flow represents the cash that is actually available for distribution to investors. Therefore, the way for managers to make their companies more valuable is to increase free cash flows. As a result, the value of a company depends on its expected future FCFs. FCF = NOPAT – Net investment in operating capital
30
3.2.2. Capital Asset Pricing Model (CAPM) The required return on stock can be found using the Capital Asset Pricing Model (CAPM), an important tool used to analyse the relationship between risk and rates of return5. The primary conclusion of the CAPM is this: The relevant risk of an individual stock is its contribution to the risk of a well-diversified portfolio. The stock can be quite risky held by itself, but if half of its risk can be eliminated by diversification, then its relevant risk, which is its contribution to the portfolio’s risk, is much smaller than its stand-alone risk. All risk except that related to broad market movements, can be diversified away. The risk that remains after diversifying is market risk, or the risk that is inherent in the market, and it can be measured by the degree to which a given stock tends to move up or down with the market. 3.2.2.1. The Concept of Beta The primary conclusion of the CAPM is that the relevant risk of an individual stock is the amount of risk an individual stock contributes to a well-diversified portfolio. The benchmark for a well-diversified stock portfolio is the market portfolio, which is the portfolio containing all stocks. Therefore, the relevant risk of an individual stock, which is called its beta coefficient, is defined under the CAPM as the amount of risk that the stock contributes to the market portfolio (Mramor, 1993, str. 331). In CAPM terminology, ρiM is the correlation between the ith stock return and the return on the market, σi is the standard deviation of the ith stock’s return, and σM is the standard deviation of the market’s return. In the literature on the CAPM, it is proved that the beta coefficient of the ith stock, denoted by βi, can be found as follows: βi = (σi / σM ) ρiM
This tells us that a stock with a high standard deviation, σi, will tend to have a high beta. This makes sense, because if all other things are equal, a stock with high stand-alone risk will contribute a lot of risk to the portfolio. A stock with a high correlation with the market, ρiM, will also have a large beta, hence be risky. This also makes sense, because a high correlation means that diversification is not helping much, hence the stock contributes a lot of risk to the portfolio.
5 Indeed, the 1990 Nobel Prize was awarded to the developers of the CAPM, Professors Harry Markowitz and William F. Sharpe.
31
The CAPM estimate of cost of common stock (rs) begins with the risk free rate, to which is added a risk premium set equal to the risk premium on the market, scaled up or down to reflect the particular stock’s risk as measured by its beta coefficient: rs = rRF + (RPM) * βi rs = rRF + (rM - rRF) * βi rRF = risk-free rate RPM = market risk premium rM = required rate of return on a market portfolio (portfolio consisting of all stocks) βi = beta coefficient The main points of the Capital Asset Pricing Model (CAPM) are: A stock’s risk consists of two components, market risk and diversifiable risk. Diversifiable risk can be eliminated by diversification, and most investors do indeed diversify, either by holding large portfolios or by purchasing shares in a mutual fund. They are left then with the market risk, which is caused by general movements in the stock market and which reflects the fact that most stocks are systematically affected by events like war, recessions, and inflation. Market risk is the only relevant risk to a rational, diversified investor because such an investor would eliminate diversifiable risk. Investors must be compensated for bearing risk. The greater is the risk of a stock, the higher its required return. However, compensation is required only for risk that cannot be eliminated by diversification. The market risk of a stock is measured by its beta coefficient, which is an index of the stock’s relative volatility. Betas with the value lower than one are less risky than an average stock and betas with the value that is higher than one are more risky in comparison with the average stock. A portfolio consisting of low-beta securities will itself have a low beta, because the beta of a portfolio is a weighted average of its individual’s securities betas:
βp = w1β1 + w2β2 +………+ wnβn = ∑wiβi=
n
i 1
Here βp is the beta of the portfolio, and it shows how volatile the portfolio is in the relation to the market; wi is the fraction of the portfolio invested in the ith stock; and βi is the beta coefficient of the ith stock. Since a stock’s beta coefficient determines how the stock affects the risk of the diversified portfolio, beta is the most relevant measure of any stock’s risk.
32

The CAPM is an ex ante model, which means that all of the variables represent before-the-fact, expected values. In particular, the beta coefficient used by investors should reflect the expected volatility of a given stock’s return versus the return on the market during some future period. However, people generally calculate betas using data from some past period, and then assume that the stock’s relative volatility will be the same in the future as in the past. 3.2.2.2. Some concerns about Beta and the CAPM The Capital Asset Pricing Model (CAPM) is more then just an abstract theory described in textbooks – it is also widely used by analysts, investors, and corporations. However, despite the CAPM's intuitive appeal, a number of studies have raised concerns about its validity. In particular, a study by Eugene Fama of the University of Chicago and Kenneth French of Yale cast doubt on the CAPM. Fama and French found two variables that are consistently related to stock returns (Fama, French, 1993, p. 460): • the firm’s size; • it’s market/book ratios. After adjusting for other factors, they found that smaller firms have provided relatively high returns, and that returns are relatively high on stocks with low market/book ratios. At the same time, and contrary to the CAPM, they found no relationship between a stock’s beta and its return (Fama, French, 1992, p. 39). As an alternative to the traditional CAPM, researchers and practitioners have begun to look to more general multi-beta models that expand on the CAPM and address its shortcomings. The multi-beta model is an attractive generalisation of the traditional CAPM model’s insight that market risk, or the risk that cannot be diversified away, underlies the pricing of assets. In the multi-beta model, market risk is measured relative to a set of risk factors that determine the behaviour of assets returns, whereas the CAPM gauges risk only relative to the market return. It is important to note that the risk factors in the multi beta model are all non-diversifiable sources of risk. Empirical research investigating the relationship between economic risk factors and security returns is ongoing, but it has discovered several risk factors including the bond default premium, the bond term structure premium, and inflation, that affect most securities. Practitioners and academicians have long recognised the limitations of the CAPM, and they are constantly looking for ways to improve it. The multi-beta model is a potential step in that direction (Brigham, Daves, 2002, p. 64-65).
33
3.2.3. Market Value Added (MVA) The primary goal of most firms is to maximise shareholders’ wealth. This goal obviously benefits shareholders, but it also helps to ensure that scarce resources are allocated efficiently, which benefits the economy. Shareholder wealth is maximised by maximising the difference between the market value of the firm’s stock and the amount of the equity capital that was supplied by shareholders. This difference is called Market Value Added (MVA): MVA = Market value of stock – Equity capital supplied by shareholders = (Shares outstanding) (Stock price) – Total common equity The value of this equation represents the difference between the money that the company’s stockholders have invested in the corporation since it’s founding – including retained earnings – versus the cash they could get if they would sold the business. The higher it is the MVA, the better the job management is doing for the firm’s shareholders. Sometimes MVA is defined as the total market value of the company minus the total amount of investor-supplied capital: MVA = Total market value – Total capital = (Market value of stock + Market value of debt) – Total capital For most companies, the total amount of investor-supplied capital is the sum of equity, debt, and preferred stock. We can calculate the total amount of investor-supplied capital directly from their reported values in the financial statements. The total market value of a company is the sum of the market values of common equity, debt, and proffered stock. It is easy to find the market values of equity, since stock prices are readily available, but it is not always easy to find the market value of debt. Hence, many analysts use the value of debt that is reported in the financial statements, or the debt’s book value, as an estimate of its market value (Brigham, Daves, 2002, p. 208). 3.2.4. Economic Value Added More and more firms are using a relatively new metric, Economic Value Added (EVA), to measure managerial performance for compensation purposes. When accountants calculate net income, the cost of debt capital (interest expense) is deducted, but no cost is deducted to reflect the cost of common equity. Therefore, net income overstates “true” economic income. EVA overcomes this flaw in conventional accounting and thus is a better metric than EPS or ROE for measuring managerial performance. Whereas MVA measures the effects of managerial actions since the very inception of a company, Economic Value Added (EVA) focuses on managerial effectiveness in a given year (Bodie, Kane, Marcus, 2005, p. 671).
34

The EVA basic formula is as follows: EVA = Net operating profit after taxes (NOPAT) – After-tax cost of capital used to support operations = EBIT (1 – Corporate tax rate) – (Operating capital) (WACC) Operating capital is the sum of the interest-bearing debt, preferred stock, and common equity used to acquire the company’s net operating assets, that is, its net operating working capital plus net plant and equipment. EVA can be also calculated in terms of ROIC: EVA = (Operating capital) (ROIC – WACC) As this equation shows, a firm adds value – that is, has a positive EVA, if it’s ROIC is greater than its WACC. If WACC exceeds ROIC, then new investments in operating capital will reduce the firm’s value. EVA is an estimate of a business’s true economic profit for the year, and it differs sharply from accounting profit. The reason for this is that the cost of equity capital is deducted when EVA is calculated. Other factors that could lead to differences include adjustments that might be made to depreciation, to research and development costs, to inventory valuations, and so on. These other adjustments also can affect the calculation of investor-supplied capital, which affects both EVA and MVA (Bennett, 1991, p. 303).
35

4. MODERN APPROACHES OF IMPROVING THE PERFORMANCE OF THE BUSINESS 4.1. TOTAL QUALITY MANAGEMENT (TQM) TQM stands for Total Quality Management. Total means that everyone in the organisation is involved in the final product or service to the customer. Quality means conformance to requirements. Management recognises that TQM will not happen by accident. This is a managed process, which involves people, systems and supporting tools and techniques. TQM is therefore a change agent, which is aimed at providing a customer-driven organisation (Macdonald, 2003, p. 6). Before the concepts and ideas of TQM were formalised, much work had taken place to reach this stage. In the early days of manufacturing, there was the birth of the quality control department. In the early 1920’s, Japan’s industrial system was at an all time low. The Japanese solved their problems using quality management practices and became serious competition for their western counterparts. Then the quality revolution started with the introduction of total quality management (TQM) programs. Total quality management (TQM) is an ongoing and constant effort by all of an organisation’s functions to find new ways to improve the quality of the organisation’s goods and services. In many companies, the initial decision to adopt a TQM approach signals a radical change in the way they organise their activities. Once TQM is adopted by an organisation, however, it leads to continuous, incremental change, and all functions are expected to co-operate with each other to improve quality (George, Jones, 1999, p. 688-691). One of the basic elements of TQM is the “process chain”. Work is not isolated within the “departmental fortresses”; it is divided into a series of activities or processes. Each work process links with another process and the work output of one process forms the input for another (Macdonald, 2003, p.11). In fact, every organisation operates through a chain of inter-linked processes, which works through and across departmental boundaries. This customer driven management philosophy focuses on both, internal and external customers. This means that parts of the company involved in this process of assuring quality have to operate as a customer to some functions and as a supplier to others. For example the Engineering department is a supplier to downstream functions such as Manufacturing and Field Service, and has to treat these internal customers with the same sensitivity and responsiveness as it would external customers. TQM is also about changing the traditional communication culture by changing the behaviour of management. The two key changes in behaviour that are needed are learning to listen and empowering employees to set the agenda for communication. The
36

last important thing is also to bring joy to work, which can be possible by ensuring that the system works and setting the objectives in a way that can create trust and collaboration. Figure 3: Core elements of TQM
Source: From Quality to Excellence, 2004 The core of TQM is the customer-supplier interfaces, both externally and internally, and at each interface lie a number of processes. This core must be surrounded by commitment to quality, communication of the quality message, and recognition of the need to change the culture of the organisation to create total quality. These are the foundations of TQM, and they are supported by the management necessities of people, processes and systems in the organisation (From Quality to Excellence, 2004). 4.1.1. Achieving business excellence Business excellence refers to cost efficient link-up of activities within all organisational units, continuous improvement of business processes, and products / services designed to fulfil customer needs. Business excellence requires extremely flexible performance that enables companies to respond quickly to changes in the business environment and to adapt correctly to new customers’ needs (Tekavčič, Peljhan, 2002, p. 106). Spurred by ideas from Japanese management and global competition, American managers have reawakened an interest in attaining high-quality products through human resource management. The most notable publication in this area is In Search of Excellence by Peters and Waterman. The book reported a study of U.S. companies, including Digital Equipment, 3M, Bechtel, Dow, Johnson&Johnson, Disney, Fluor, Caterpillar, Procter&Gamble, and
37
McDonald’s. These companies showed above-average performance for several years, and Peters and Waterman’s research sought to uncover why. The findings revealed eight excellence characteristics that reflected these companies’ management values and corporate culture (Peters, Waterman, 1993, p. 119-306). 1. Bias toward Action. Successful companies value action, doing, and implementation.
They do not talk problems to death or spend all their time creating exotic solutions. 2. Closeness to the Customer. Successful companies are customer driven. A dominant
value is customer need satisfaction, whether through excellent service or through product innovation. Managers often call customers directly and learn their needs. Successful companies value sales and service overkill.
3. Autonomy and Entrepreneurship. Organisation structure in excellent corporations is designed to encourage innovation and change. Technical people are located near marketing people so that they can lunch together. Organisational units are kept small to create a sense of belonging and adaptability.
4. Productivity through People. Rank-and-file employees are considered the roots of quality and productivity. People are encouraged to participate in production, marketing, and new-product decisions. Conflicting ideas are encouraged rather than suppressed. The ability to move ahead by consensus preserves trust and a sense of family, increases motivation, and facilitates both innovation and efficiency.
5. Hands On, Value Driven. Excellent companies are clear about their value system. Mangers and employees like to know what the company stands for. Leaders provide a vision of what can be accomplished and give employees a sense of purpose and meaning. Leaders are willing to roll up their sleeves and become involved in problems at all levels.
6. Sticking to the Knitting. Successful firms stay close to the business they know and understand. Successful firms are highly focused. For example, Boeing, Intel; and Genentech confine themselves to a single product line of commercial aircraft, integrated circuits, and genetic engineering, respectively. Successful companies do what they know best.
7. Simple form, Lean staff. The underlying structural form and systems of excellent companies are elegantly simple, and few personnel are employed in staff positions. Large companies are subdivided into small divisions that allow each to do its job. For example, when Jack Reichert took over Brunswick Corporation, the headquarters’ staff was reduced from 560 to 230 people. The vertical hierarchy was reduced to only five layers of management (Robbins, 2000, p. 66).
8. Simultaneous Loose-Tight Properties. This may seem like a paradox, but excellent companies use tight controls in some areas and lose controls in others. Tight, centralised control is used for the firm’s core values. At McDonald’s, no exceptions are made to the core values of quality, service, cleanliness, and value. At IBM, top management will tolerate no disagreement with the cultural value of respect for the individual. Yet in other
38
areas employees are free to experiment, to be flexible, to innovate, and to take risks in ways that will help the organisation achieve its goals (Robbins, 2000, p. 67).
In Peters and Waterman’s original study and subsequent research, not every company scored high on all eight values, but a preponderance of these values was often part of their management culture. Excellence guidelines and Japanese management practices are not a panacea for all companies. Indeed, some of the high-performance companies originally studied are no longer performing well. But the general approach seems more than a passing fad. These ideas reflect management’s response to international competitive forces that have increased the need to fully utilise all employees. They represent a major new trend in the international environment (Robbins, 2000, p. 67). In the research findings of the survey “Cost management in Slovenian companies” conducted during the winter of 2000/2001, showed that a common understanding of the concept of TQM is pretty good – 76.9% of the companies were familiar with the concept (Cost management in Slovenian companies, 2005). 4.1.2. Procedure for implementing the model The simplest model of TQM is shown in the diagram below. The model begins with understanding customer needs. TQM organisations have processes that continuously collect, analyse, and act on customer information. Activities are often extended to understanding competitor's customers. Developing an intimate understanding of customer needs allows TQM organisations to predict future customer behaviour. TQM organisations integrate customer knowledge with other information and use the planning process to orchestrate action throughout the organisation to manage day-to-day activities and achieve future goals. Plans are reviewed at periodic intervals and adjusted as necessary. The planning process is the glue that holds together all TQM activity. TQM organisations understand that customers will only be satisfied if they consistently receive products and services that meet their needs, are delivered when expected, and are priced for value.
39

Figure 4: TQM Model
Source: Total Quality Management
TQM organisations use the techniques of process management to develop cost-controlled processes that are stable and capable of meeting customer expectations. TQM organisations also understand that exceptional performance today may be unacceptable performance in the future so they use the concepts of process improvement to achieve both breakthrough gains and incremental continuous improvement. Process improvement is even applied to the TQM system itself! The final element of the TQM model is total participation. TQM organisations understand that all work is performed through people. This begins with leadership. In TQM organisations, top management takes personal responsibility for implementing, nurturing, and refining all TQM activities. They make sure people are properly trained, capable, and actively participate in achieving organisational success. Management and employees work together to create an empowered environment where people are valued (Total Quality Management, 2004). 4.1.3. Benefits and Barriers to TQM The benefits of TQM can be summarised as: • a greatly improved product or service; • a major decrease in wasted resource; • a massive leap in productivity; • the best opportunity to increase profit; • a long-term increase in market share; • a sustained competitive advantage;
40

• a real release of the potential of people; • a motivated workforce; • the elimination of much hassle and frustration involved in management. There are also some barriers, since interia and the power of tradition are not easy obstacles to overcome. Research shows that a substantial proportion of companies are disappointed. Usually they all improve, but they don't meet their original expectations. The reasons for disappointment with TQM can be summarised as: • a lack of management commitment; • a lack of vision and planning; • a satisfaction with the “quick fix”; • the process of change became “tool-bound”; • the world quality became constraining; • the culture change and project approach conflicted; • quality management became bureaucratic; • management did not change its behaviour; • the people were not really involved; • a lack of business measurable to measure TQM. 4.2. THE BALANCED SCORECARD (BSC) Since its publication in Harvard Business Review in early 1992, the balanced Scorecard (BSC) has become the best known and the most widely implemented multidimensional performance measurement model throughout the world. It was created by Kaplan, professor of management accounting at Harvard Business School, and Norton, consultant at Renaissance Solutions Int.. Its advocacy of a balanced and integrated performance measurement system using four perspectives on organisational performance is recognised as representing a significant step forward from the old non dimensional focus on financial performance measures of primary interest to shareholders. Its recognition of employees and customers as vital to organisational success has broadened the range of stakeholders catered for in performance measurement and management system. In many organisations it has led to the use of non-financial performance measures to supplement or supplanted by new financial metrics such as EVA (Kandžija, Kumar, 2004, p. 365).
41
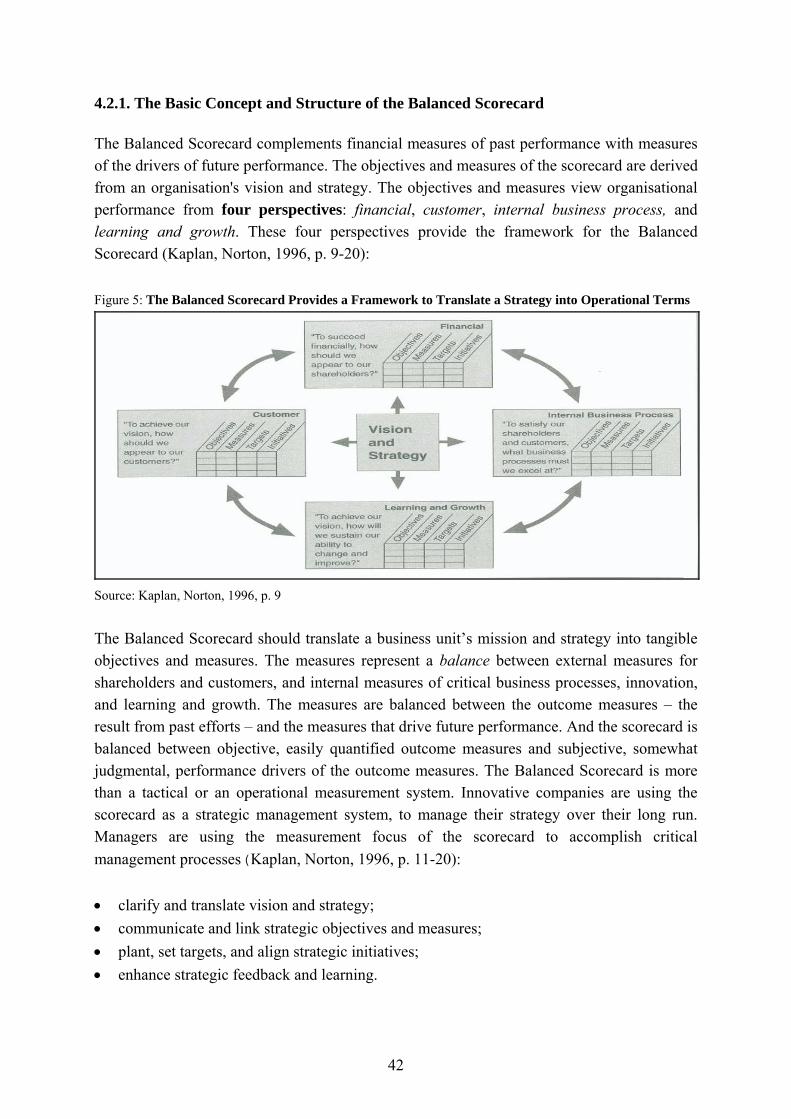
4.2.1. The Basic Concept and Structure of the Balanced Scorecard The Balanced Scorecard complements financial measures of past performance with measures of the drivers of future performance. The objectives and measures of the scorecard are derived from an organisation's vision and strategy. The objectives and measures view organisational performance from four perspectives: financial, customer, internal business process, and learning and growth. These four perspectives provide the framework for the Balanced Scorecard (Kaplan, Norton, 1996, p. 9-20): Figure 5: The Balanced Scorecard Provides a Framework to Translate a Strategy into Operational Terms
Source: Kaplan, Norton, 1996, p. 9 The Balanced Scorecard should translate a business unit’s mission and strategy into tangible objectives and measures. The measures represent a balance between external measures for shareholders and customers, and internal measures of critical business processes, innovation, and learning and growth. The measures are balanced between the outcome measures – the result from past efforts – and the measures that drive future performance. And the scorecard is balanced between objective, easily quantified outcome measures and subjective, somewhat judgmental, performance drivers of the outcome measures. The Balanced Scorecard is more than a tactical or an operational measurement system. Innovative companies are using the scorecard as a strategic management system, to manage their strategy over their long run. Managers are using the measurement focus of the scorecard to accomplish critical management processes(Kaplan, Norton, 1996, p. 11-20): • clarify and translate vision and strategy; • communicate and link strategic objectives and measures; • plant, set targets, and align strategic initiatives; • enhance strategic feedback and learning.
42

Figure 6: Balanced Scorecard as a strategic Framework for Action
Source: Kaplan, Norton, 1996, p. 11 The balanced scorecard is a set of measures that gives top managers a fast but comprehensive view of the business. It includes financial measures that tell the result of actions already taken and it complements them with operational measures on customer satisfaction, internal processes, and the organisation’s innovation and improvement activities that are drivers of future financial performance (Kaplan, Norton, 1992, p. 71). All measures are derived from the vision and strategy of the organisation. The essence of this approach is that the drivers of financial performance are the relationships a company develops with its customers and the internal business processes that it designs and manages to achieve customer satisfaction define and shape customer relationships. Kaplan and Norton have developed a model of how process results create customer satisfaction that, in turn, creates owner results (Atkinson, Waterhouse, Wells, 1997, p. 25-37). As such, the balanced scorecard meets several managerial needs: • it incorporates many of the seemingly disparate elements of a company’s competitive
agenda into a single management report; • it guards against sub-optimization. By forcing managers to consider all the important
operational measures together, the BCS lets them see weather improvement in one area may have been achieved at the expense of another;
• by requiring managers to select a limited number of critical indicators within each of the four perspectives, the scorecard helps focus the strategic vision of the company.
43

4.2.2. The Widespread Use of the Balanced Scorecard Data presented at the 2001-Balanced Scorecard Summit suggest that 52% of companies world-wide are using a BSC, 21% are planning to use it soon, and 23% are considering using a balanced scorecard (Dowing, 2001, p. 15). The BSC is, however, not equally popular in all countries. In the United States, Gartner Group (2001) predicted that 40% of Fortune 1000 companies would have attempted to implement the balanced scorecard by the end of 2000, and others are expecting this figure to be closer to 60% by the end of 2001. Recent studies show that the uptake of the scorecard in the UK is not running far behind the States. Tonge et al. in year 2000 found from their exploratory research into adoption of the scorecard by FTSE 100 companies that 39% were actively using the scorecard. However, the story is not the same across Europe with only 3% of companies in France and a similar number in Portugal using the Balanced Scorecard. In France, the Tableau de Bord6 is far more widely deployed (Tonge, Larsen, Pepper, 2000, p. 293-310). In Germany, the BSC is again well known. In Slovenia, the BSC was formally introduced in September 2000 and by now, Slovenian managers are familiar with the BSC, but the model is in use only in a handful of companies. This may well be related to the shortage of consulting experience in this field. There are at least two possible explanations for the popularity of the Balanced scorecard. On one hand, it is the model itself; the nature and scope of an integrated model of strategic performance measurement. On the other hand, the authors succeeded to make a quick and successful entry to the market that has before been practically non-existing. Kaplan and Norton were not the only “suppliers”, but they marketed the product in the exemplary fashion (Kandžija, Kumar, 2004, p. 367). 4.2.3. The criticism of the Balanced Scorecard After a decade of both extensive studies and practical use of the Balanced Scorecard, critiques appear, too. Some authors argue that the Balanced Scorecard is incomplete. Others believe that it lacks a formal reliance on some theory of company behaviour. Also, little or no quantitative empirical research has yet been done to prove scientifically how the Balanced Scorecard helps companies achieve better performance. Firstly, a whole range of the BSC literature has neglected the insights of institutional theory, which explicitly recognises the importance of relative bargaining power in determining whose interests will predominate in an organisation and the consequent effects on what aspects of 6 Tableau de bord is a performance measurement concept that has been the focus of attention in Europe, particularly France, for at least forty years. The primary message of the tableau de bord is that managers need a set of relevant indicators to monitor the process or system for which they are responsible.
44

performance are measured, reported and acted upon (DiMaggio, Powell, 1983, p. 157). This has implications for balance and integration in performance measurement system and hence for the possibility of successfully implementing the BSC. Contrary to the accepted wisdom, many performance measurement systems (PMS) will not be balanced and integrated, but rather some managers may decouple their PMSs to maintain balance among stakeholders of unequal power. While relations among a company’s managers and its shareholders, customers and employees respectively are all subject to company, contract and employment law (Owen, 2001, p. 279), in practice the shareholders will dominate. So, while managers may pay lip service to the idea of a balanced set of performance measures meeting the needs of a range of stakeholders, in practice measures of financial results for shareholders will tend to dominate, as the limited research in this area confirms (Ittner, Larcker, 1998, p. 214). Thus, in practice, financial measures for shareholders are frequently decoupled from non-financial measures of interest to other stakeholders. Secondly, Bringall argues that the possible interrelationships among performance variables are not confined to universally valid one-chain of cause and effect not a series of interdependencies as it is assumed in the BSC. The BSC is typically a system of leading and lagging indicators of performance and follows a one-way linear approach to performance management, starting with the learning and growth perspective and culminating in financial results (or outcomes) for shareholders. However, there are many examples in practice where the sequence of events is different. Bringall rather indicates that there are different classes of possible relationships, plus the possibility of no relationship at all (Bringall, 2002, p. 85-92). The central criticism of the Balanced Scorecard is that it neglects several important stakeholders whose need for performance-related information is worthy of recognition. Some of the first to criticise the BSC from the perspective of the stakeholders were Atkinson, Waterhouse and Wells. They argued that the BSC failed to adequately highlight the contributions that employees and suppliers make to help the company achieve its objectives. They also argued that it fails to identify the role of community in defining the environment in which the company works (Atkinson, Waterhouse, Wells, 1197, p. 25-37). The issues relating to employees, suppliers and the community implied in Kaplan and Norton’s balanced scorecard would be included in the activities that they refer to as learning and growth. However, the Kaplan and Norton’s view fails to recognise that stakeholders issues, including what stakeholders want from and offer to the organisation, are issues that must be considered simultaneously rather than sequentially. Bringall, on the other hand, recognise three key organisational stakeholders in the BSC: shareholders (financial perspective), customers (customer perspective) and employees (organisational innovation, learning and growth), but adds that several other stakeholders are omitted. While there are some overlaps among the interests of differing stakeholders and hence one such stakeholder might be chosen as a rough proxy for the others, for some
45
stakeholders’ interests there are no clear and adequate proxies (Bringall, 2002, p. 89). Two keys stakeholders whose needs are not proxied by at least one of the three key stakeholders identified above are the environment and social matters, whose needs may be subject to legislation and regulation. In their recent book, Kaplan and Norton refer briefly to environmental, health and safety aspects (EHS). They argue, “When such regulatory and environmental, health and safety considerations are vital for a successful strategy, companies include several objectives in a ‘good corporate citizen’ strategic scheme in the internal perspective”. Kaplan and Norton believe that companies whose operations entail environmental, health and safety risks need to achieve a reputation as a leader in EHS performance to enhance their ability to recruit and retain valuable employees and to maintain and expand their physical presence in communities (Kaplan, Norton, 2001, p. 122). Bringall considers this to be a managerial proposition. BSC is an important new form of organisational accounting with implications for political economy, which has along with some other multidimensional performance measurement system, hitherto been captured and controlled by managerial interests (Bringall, 2002, p. 91). Furthermore, the effects on wider societal matters have been largely ignored in most of the research into their design, implementation and use. A consideration of societal and environmental aspects of organisational performance in contemporary performance measurement models is particularly relevant at this time. Even the authors of the BSC admit that the scorecard’s four perspectives are not fixed and could therefore be expanded to include social and environmental aspects. 4.3. CLEAN TECHNOLOGY MANAGEMENT An Environmental Management System (EMS) is a method of incorporating environmental care throughout the corporate structure. EMS includes strategic planning activities, the organisational structure and implementation of the environmental policy as an integral part of the manufacturing process. It is a useful tool to improve compliance with legislation, address stakeholder pressure and improve corporate image and raise awareness within the organisation of environmental issues. EMS is a problem-identification and problem-solving tool, based on the concept of continual improvement that can be implemented in an organisation in many different ways, depending on the sector of activity and the needs perceived by management. In particular, International Organisation for Standardisation (ISO) and the European Commission – Eco-Management and Audit Scheme (EMAS) has developed standards for EMS (Environmental Management Tools, 2004).
46
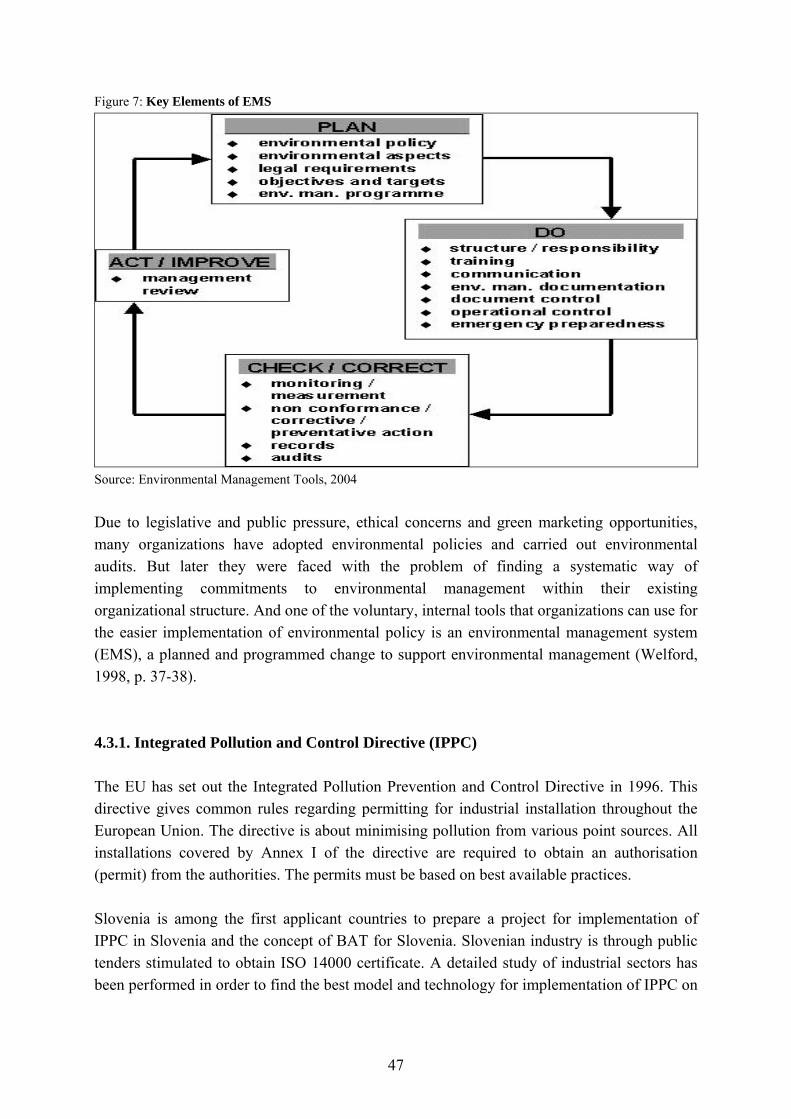
Figure 7: Key Elements of EMS
Source: Environmental Management Tools, 2004 Due to legislative and public pressure, ethical concerns and green marketing opportunities, many organizations have adopted environmental policies and carried out environmental audits. But later they were faced with the problem of finding a systematic way of implementing commitments to environmental management within their existing organizational structure. And one of the voluntary, internal tools that organizations can use for the easier implementation of environmental policy is an environmental management system (EMS), a planned and programmed change to support environmental management (Welford, 1998, p. 37-38). 4.3.1. Integrated Pollution and Control Directive (IPPC) The EU has set out the Integrated Pollution Prevention and Control Directive in 1996. This directive gives common rules regarding permitting for industrial installation throughout the European Union. The directive is about minimising pollution from various point sources. All installations covered by Annex I of the directive are required to obtain an authorisation (permit) from the authorities. The permits must be based on best available practices. Slovenia is among the first applicant countries to prepare a project for implementation of IPPC in Slovenia and the concept of BAT for Slovenia. Slovenian industry is through public tenders stimulated to obtain ISO 14000 certificate. A detailed study of industrial sectors has been performed in order to find the best model and technology for implementation of IPPC on
47

company level (Prešeren, 2004, p. 5-6). The EU agreed with Slovenia on a number of transitional periods with regards to the environment. For adopting EU standards on packaging waste, Slovenia got an adjustment period until 2008. Slovene companies will have a breathing space until 2011 to adjust to tougher environmental standards in industry (IPPC). Moreover, Slovenia also got extra time, until 2015, to bring itself completely in line with EU standards on urban water waste (sewerage) (FAO, 2004). 4.3.2. ISO 14000 The ISO 9000 and ISO 14000 families are among ISO's most widely known standards ever. ISO 9000 and ISO 14000 standards are implemented by some 634000 organisations in 152 countries. ISO 9000 has become an international reference for quality management requirements in business-to-business dealings, and ISO 14000 is well on the way to achieving as much, if not more, in enabling organisations to meet their environmental challenges. In today’s global economy, organisations are increasingly called upon to demonstrate sound management of economic, social and environmental issues. Evidence suggests that a focus on this “triple bottom line” results in advantages in financing, insurance, marketing, regulatory treatment, and other areas. The vast majority of ISO standards are highly specific to a particular product, material, or process. However, the standards that have earned the ISO 9000 and ISO 14000 families a worldwide reputation are known as "generic management system standards". Generic means that the same standards can be applied: • to any organization, large or small, whatever its product; • including whether its "product" is actually a service; • in any sector of activity; • whether it is a business enterprise, a public administration, or a government department. "Generic" also signifies that no matter what the organisation’s scope of activity, if it wants to establish a quality management system or an environmental management system, then such a system has a number of essential features for which the relevant standards of the ISO 9000 or ISO 14000 families provide the requirements.
48

Figure 8: The model of ISO 14000 Family of International Standards
Source: Environmental Management Tools, 2004 Although the ISO 14000 standards are designed to be mutually supportive, they can also be used independently of each other to achieve environmental goals. The whole ISO 14000 family provides management tools for organisations to control their environmental aspects and to improve their environmental performance. Together, these tools can provide significant tangible economic benefits, including: • reduced raw material/resource use; • reduced energy consumption; • improved process efficiency; • reduced waste generation and disposal costs; • utilization of recoverable resources.
49
Of course, associated with each of these economic benefits are distinct environmental benefits too. This is the contribution that the ISO 14000 series makes to the environmental and economic components of sustainable development and the triple bottom line Environmental Management Tools (Environmental Management Tools, 2004). 4.3.2.1. ISO 14001 An Environmental Management System (EMS) is a structured approach to addressing the environmental bottom line. ISO 14001 is the world’s most recognised EMS framework – accepted from Argentina to Zimbabwe – that helps organisations both to manage better the impact of their activities on the environment and to demonstrate sound environmental management. Since the publication of ISO 14001, many companies have implemented the standard and, by the end of 2001, nearly 37 000 organisations in 112 countries had their EMS certified as conforming to its requirements. ISO 14001 is designed to be flexible enough to be applied to any sized organisation in both the private and public sectors. The bottom line is that certification to ISO 14001 can improve environmental management and enables equal access to a growing “green” market place. The ISO 14001 environmental management system standard helps companies’ track, understand and improve their environmental management. Unlike sector-specific certifications, ISO 14001 does not require specific principles or guidelines to be followed. Companies can “self-certify” compliance with the standard, but most seek independent verification. Critics maintain that ISO 14001 says nothing about a company’s environmental performance, addressing only the effectiveness of its environmental management system. ISO 14001 can be useful, however, in that it forces companies to acknowledge and address environmental issues (Halle, 2000, p. 48). ISO 14001 is also the starting point for companies that want to use other environmental management tools developed by ISO/TC 207. For example, ISO 14004 provides additional guidance and useful explanations and complements ISO14001. Of course, an EMS will only be of maximum benefit if it is properly implemented. Environmental audits are important tools for assessing whether an EMS is properly implemented and maintained. The new auditing standard, ISO 19011, is equally useful for EMS and quality management system audits. It provides guidance on principles of auditing, managing audit programmers, and the conduct of audits and on the competence of auditors. ISO 19011 replaces the ISO 14010, ISO 14011 and ISO 14012 first generations of environmental auditing standards in the ISO 14000 family. Organisations implementing ISO 14001 can expect to improve their environmental performance. ISO 14031 provides guidance on how an organisation can evaluate its environmental performance. The standard also addresses the selection of suitable performance indicators, so that performance can be
50

assessed against criteria set by management. This sort of information can be used as a basis for internal and external reporting on environmental performance. Communication on the environmental aspects of products and services is an important way to use market forces to influence environmental improvement. Truthful and accurate information provides the basis on which consumers can make informed purchasing decisions. The ISO 14020 series of standards address a range of different approaches to environmental labels and declarations, including self-declared environmental claims, Eco-labels (seals of approval) and quantified environmental information about products and services. ISO 14001 addresses not only the environmental aspects of an organisation’s processes, but also those of its products and services. Therefore ISO/TC 207 developed additional tools to assist in addressing such aspects. Life Cycle Assessment (LCA) is a tool for identifying and evaluating the environmental aspects of products and services from the “cradle to the grave": from the extraction of resource inputs to the eventual disposal of the product or its waste. The ISO 14040 standards give guidelines on the principles and conduct of LCA studies that provide an organisation with information on how to reduce the overall environmental impact of its products and services (Environmental Management Tools, 2004).
51

5. SYSTEM OF RATIOS IN THE COMPANY LAŠKO 5.1. DESCRIPTION OF THE COMPANY Laško Brewery is the heir to more than 175 years of brewing tradition in Laško. In the fifty years from the end of WWII it raised itself from fifth position to become one of the leading breweries in the former Yugoslavia. Today they are one of the top Slovenian brewers. Over 1.300.000 hl (22.000.000 gallons) of beer with the famous trademarks Zlatorog, Zlatorog Club, Temno Laško (Laško Dark), Export Pils and the newest recipes of Lahko Laško (Laško Light), Netopir and the hop beverage Gren are being brewed and sold annually. Since June 1997 they have also produced soft drinks and a mixture of beer and lemonade (Roler) in co-operation with Vital from Mestinje. Laško Brewery d.d, the leading Slovenian Brewery, is today heading towards an intensive business development. Their basic business orientation is to offer top quality beer to their customers and to provide a good market supply. In pursuit of this they develop suitable products and marketing programmes, which are supported by investment in modern brewing technology, computer guided manufacturing and business information science. As a joint stock company - owned by 10.000 Slovenian shareholders – with a solid capital base, they run their business according to world standards and use the most modern brewing technology. This enables them to produce beer of consistently excellent quality, which delights beer fans in Slovenia and enables us to increase sales in foreign markets (Brewery Laško d.d., 2005). 5.1.1. Short History Brewing in Laško can be traced back over 170 years. In 1825 Franz Geyer, producer of mead and ginger bread, used the building of the previous Valvasorjev Špital for brewing purposes. For fifteen years this first brewer in Laško probably brewed stone beer (Steinbeer) in the Carinthian way. Possibly he also knew how to produce Bavarian beer, which was technologically more complicated to produce. In 1838 the brewery was bought by Heinrich August Ulrich, known today as the founder of the reputation of Laško beer (Alibegovič, 2004, p. 64-65). Being the owner of the baths in Rimske Toplice, he must have served his beer to his foreign guests. He also used his Trieste origins for distributing his beer in Trieste, a city of trade, where the customers were demanding a high quality of beer and cuisine. As a wholesaler, he put even more effort into it and his beer was also drunk in India and Egypt. Anton Larisch, the next owner, built a new brewery in 1867. It was situated at the foot of the hills Sv. Krištof and
52
Šmihel. Records show that his brewery was the largest in Spodnja Štajerska (Lower Styria). The owner did not only personally supervise the quality of the beer and took care that it did not deteriorate, but he also improved it and increased the capacities of the brewery (Brewery Laško d.d., 2005). 5.1.2. Important events Laško’s most productive year in history was 1990, when they sold 132.169.000 litres (29.077.180 gallons) of beer. After Slovenia gained independence, the brewery lost 40% of its market, and as a consequence the sales of beer in the former Yugoslavian market were reduced by approx. 50.000.000 litres (11.000.000 gallons). From 1992 to 1996 sales of their beer increased by 30% - their reputation as the leading brewer in Slovenia finally became assured. In 1996 115.990.000 litres (25.517.800 gallons) were sold, in 1997 117.800.000 litres (25.916.000 gallons), in 1998 110.726.800 litres (24.359.896 gallons), in 1999 111.589.000 litres (24.549.580 gallons), in 2000 122.343.800 litres (26.915.636 gallons), and last year the record of 137.139.700 litres (30.170.734 gallons). In 2001, when the operating conditions were even harsher, particularly in the food-processing industry, such a business orientation again brought favourable business results. Pivovarna Laško, d.d. achieved record volume indicators in 2001. It placed over 1.370.000 hl and 35.000 hl of bottled drinking water on the market. The well-known trademark for Laško beer (Zlatorog) achieved a record near - 54% market share in Slovenia, an increase of 2.7 percentage points on the previous year. Then, in the period from 2002 to 2004 the sales of their bear dropped by 15% (Brewery Laško d.d., 2005). On 18 June 2004, the Administrative Court of the Republic of Slovenia nullified the decision of the Competition Protection Office of the Republic of Slovenia in the case of Pivovarna Laško d.d., Pivovarna Union, d.d., and Interbrew Central European Holding B.V. from Netherlands, in which the Competition Protection Office granted its conditional approval to Pivovarna Laško for a notified concentration with Pivovarna Union. In the event that the former were to acquire an interest in excess of 50%, it would have to suspend the marketing of certain brands for a specific period. The court referred the matter back to the Competition Protection Office for reassessment. On 10 December 2004, Pivovarna Laško acquired a further 27.011 shares, increasing their shareholding to 242.939 shares or 53.85%. On 11.02.2005 the company bought 186.400 shares issued by the company Pivovarna Union, d.d., Ljubljana from the company Interbrew Central European Holding B.V, Netherlands and together with already possessed shared became the owner of 95.173% of the equity capital and voting rights (SEOnet, 2005).
53

5.2. BUSINESS REPORT Good performance during 2003 saw Pivovarna Laško extend its run of successful years. The company ended the 2003 financial year with good results, allowing it to meet its objectives while providing its employees with security and reward. The company’s performance in recent years has been assessed as exceptional, significantly exceeding the average results and performance in the foodstuffs industry and the commercial sector in Slovenia. In 2004, Pivovarna Laško continued its policy of consolidating beverage producers in Slovenia and sought alliances with the industry’s strategic partners in south-eastern Europe. The results achieved in 2004 were positive, but were still below expectations. It must be noted that the synergetic effects of capital ties become evident only after a certain period of time. The Group’s associated companies, comprising Pivovarna Laško, Radenska, Jadranska Pivovara and Vital did not perform as well as in previous years. 5.2.1. Sales In 2004, the company’s sales of beer were down 14.3% from the previous year, and a drop in sales of Oda mineral water of 18.3%. Operational results were lower than in previous years. Figure 9: Annual beer and water sales
Source: Laško's annual report 2004. We may conclude that several years of exceptional success have temporarily been suspended. Considering that Pivovarna Laško concluded all major restructuring investments during this period, and that no major manufacturing investments are planned for the future, the results are sufficient to ensure uninterrupted operations and development over the next few years. The business results continue to provide sufficient social security.
54

Figure 10: Annual beer and water sales
Source: Laško's annual report 2004. Figure 11: Sales structure according to the type of beer in 2004
Source: Laško's annual report 2004. Figure 12: Sales structure according to the type of beer in 2004
Source: Laško's annual report 2004. The problems faced by Pivovarna Laško, namely, smaller demand for beer and other beverages in 2003, were shared by almost all producers of beverages. Such market conditions were the result of poor weather during the high season, which was not favourable to the consumption of beer and soft drinks. The competition on the Slovene market also became keener after Slovenia joined the EU in May 2004. Most of the decline in sales can be attributed to foreign markets, primarily in Bosnia-Herzegovina and Serbia and Montenegro. Domestic sales of beer and water are also lower than in 2003. Despite these setbacks,
55

Pivovarna Laško remains the leading beer producer in Slovenia with a market share of 53.7% in 2004. 5.2.2. Slovene market The total consumption of all beers (domestic and foreign) available on the market in 2004 was 1.530.000 hl and remains at the 2003 level (an index of 100.5). In 2004, Slovene beer was faced with competition from cheaper imports, primarily Spar and Tuš brands, however, the impact of other cheaper brands cannot be overlooked. Imports of standard beer also increased, both for retail and catering. Catering in particular has been the target of investment by foreign competitors, the most active of which are Goesser from Austria and Staropramen from the Czech Republic (direct investment into beer taps and other equipment). Slovenia’s joining the European Union (1 May 2004) also contributed to a harsher environment. Pivovarna Laško adopted a series of measures in 2004 to adapt to the changing market conditions. The following organisational changes were implemented for the purpose of cost reduction and achieving synergetic effects (Pivovarna Laško - Radenska): • closure of the Krško and Rogaška branches (the procedure for closing down the Lucija
branch started in December 2004); • reorganization of transportation routes; • relocation of Pivovarna Laško’s Ljubljana branch to Radenska’s renovated Radenci
facility in Ljubljana; • reorganization of the promotion department; • reorganization of the services department. Their price policy of maintaining unchanged prices resulted in an actual reduction of sales prices, whilst greater emphasis on special offers and bigger rebates for customers enabled them to maintain their competitive advantage over cheaper imported beers. Despite these measures, there was a fall in the market share of both Slovene breweries, as had been anticipated. Pivovarna Laško’s market share fell from 56.2% in 2003 to 53.7%, while Pivovarna Union’s market share fell from 39.8% to 37.4%. At the same time, beer imports increased from 3.8% to 8.9%. Figure 13: Market structure of the two largest Slovene breweries
Source: Laško's annual report 2004.
56
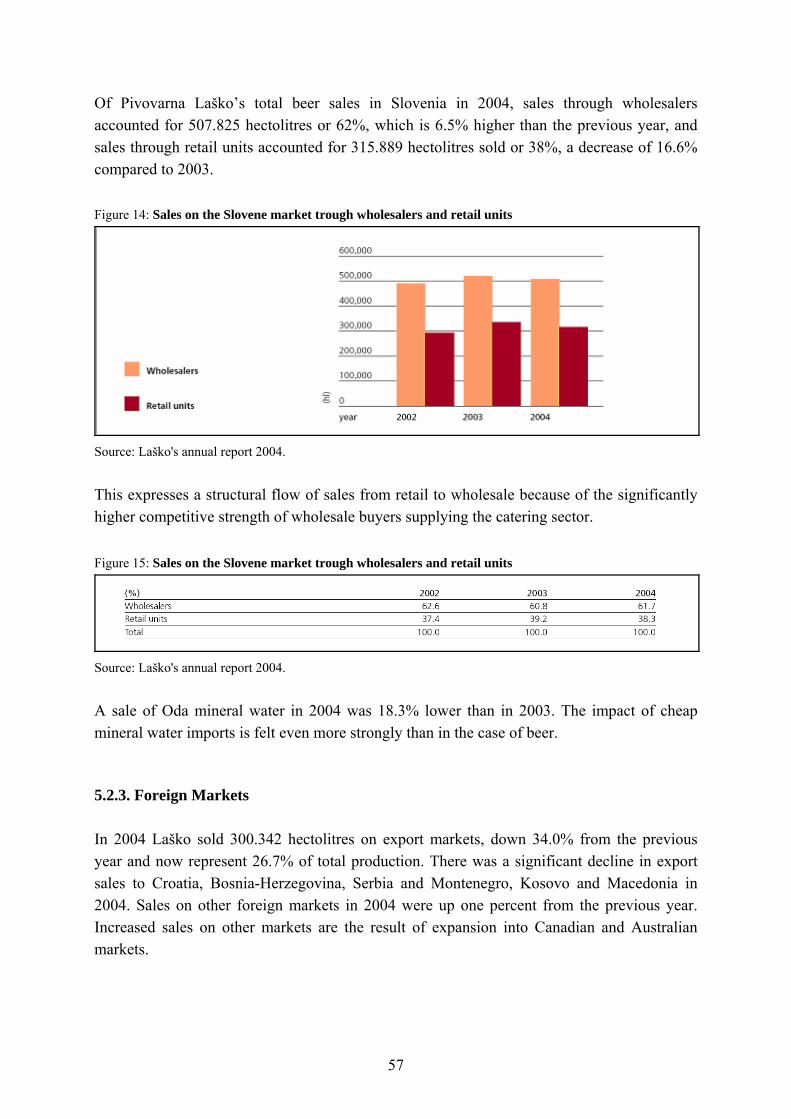
Of Pivovarna Laško’s total beer sales in Slovenia in 2004, sales through wholesalers accounted for 507.825 hectolitres or 62%, which is 6.5% higher than the previous year, and sales through retail units accounted for 315.889 hectolitres sold or 38%, a decrease of 16.6% compared to 2003. Figure 14: Sales on the Slovene market trough wholesalers and retail units
Source: Laško's annual report 2004. This expresses a structural flow of sales from retail to wholesale because of the significantly higher competitive strength of wholesale buyers supplying the catering sector. Figure 15: Sales on the Slovene market trough wholesalers and retail units
Source: Laško's annual report 2004. A sale of Oda mineral water in 2004 was 18.3% lower than in 2003. The impact of cheap mineral water imports is felt even more strongly than in the case of beer. 5.2.3. Foreign Markets In 2004 Laško sold 300.342 hectolitres on export markets, down 34.0% from the previous year and now represent 26.7% of total production. There was a significant decline in export sales to Croatia, Bosnia-Herzegovina, Serbia and Montenegro, Kosovo and Macedonia in 2004. Sales on other foreign markets in 2004 were up one percent from the previous year. Increased sales on other markets are the result of expansion into Canadian and Australian markets.
57

5.3. OWNERSHIP STRUCTURE Pivovarna Laško quoted as a public limited company in 1995. At the close of the financial year as at 31 December 2004, shares were divided among 10.727 shareholders, 2.6% fewer than at the end of 2003. Figure 16: Ownership structure of Pivovarna Laško d.d. as of 31 December 2004
Source: Laško's annual report 2004. As on 31 December 2004, the company’s share capital amounted to 8.747.652.000 tolars, divided into 8.747.652 shares with a nominal value of 1.000 tolars, all paid up in full. Figure 17: Ownership structure of Pivovarna Laško d.d. as of 31 December 2004
Source: Laško's annual report 2004. Figure 18: Ownership structure of Pivovarna Laško d.d. as of 31 December 2004
Source: Laško's annual report 2004.
58

There were no major changes in the ownership structure of Pivovarna Laško in 2004. The biggest shareholder remains Infond Holding d.d. with 12.04%, followed by Kapitalska družba d.d. with 7.06%. Major shareholders are Slovenska odškodninska družba d.d., Triglav steber I PID d.d., Infond ID d.d. and Banka Celje d.d.. The remaining shareholders hold less than 3% of the shares. Figure 19: Ownership structure of Pivovarna Laško d.d. as of 31 December 2004
Source: Laško's annual report 2004. 5.3.1. Shares Shares in Pivovarna Laško d.d. are listed on the Ljubljana Stock Exchange under the designation PILR. Figure 20: Average market value of PILR in 2004
Source: Laško's annual report 2004. All the shares are ordinary, registered shares issued as book-entry securities. Each share gives its owner voting rights at the annual general meeting of shareholders and participation in the profits. Figure 21: Average market value of PILR in 2004
Source: Laško's annual report 2004.
59

The book value of the shares as at 31 December 2004 was 5.469,47 tolars, but the market value was 31.3% higher at 7.183,06 tolars. Figure 22: Average book value of PILR shares as at 31 December for 1995 – 2004
Source: Laško's annual report 2004. As of 31 December 2004, the company held 1.019 lots of treasury stock in its portfolio, or 0.0116% of all the shares. Figure 23: Average book value of PILR shares as at 31 December for 1995 – 2004
Source: Laško's annual report 2004. 5.3.1.1. Dividend policy In previous years, the company has paid out almost 50% of annual net profits as dividends, with the remainder being allocated to investment and the formation of provisions. The company management intends to support this long-term policy regarding dividends in future. Real growth of dividends is expected to correspond to growth in business operations. 5.3.2. Development strategy Policies and priorities for 2005 at Laško are clear. They intend to complete the process of building a consolidated beverage industry in Slovenia and exploit the resulting synergetic effects. Their new marketing approach, which unites products of the highest quality under the Laško pivo brand name, should provide the brand recognition for a uniform venture into all markets. In 2005 they plan to increase the group’s sales by 10.7% and to improve their profitability (Brewery Laško d.d., 2005).
60

5.4. EXISTING SYSTEM OF RATIOS Company Laško as many other Slovene companies is using, as a major measure for evaluating the performance of the company, ratios mainly related to traditional management accounting. Information’s about the performance of the company are gained in three basic ways: 1. With “horizontal analysis”, this means comparing all the data from balance sheet and
from income statement with the same data of one year ago. In this manner we can find differences that occurred in one year.
2. With “vertical analysis”, this means, expressing all the data from balance sheet as a percentage of the balance result and again expressing all the data from income statement as a percentage of profit or loss.
3. With financial ratios that are calculated on the basis of financial statements. Pivovarna Laško group prepared these ratios in conformity with the Slovenian Accounting Standards.
5.4.1. Summary of the ratio analysis Liquidity Ratios The current ratio with the value around 1:1 is in my opinion too low, especially if we are looking from the perspective of creditors. The calculated value is also considerably below the industry average7. Although there is no hard and fast rule, conventionally a current ratio of 2:1 is considered optimum. In the case of the analysed company the value of the ratio shows that the short-term solvency is far from being optimal. The interpretation of the position in the case of the current acid test can’t be better. Although the ratio has improved through the analysed period, its value is still under one. Asset Management Ratios Inventory turnover of approximately 8 is in my opinion, at a satisfactory level, although it is a little below the industry average. The calculated value suggests that the company is not holding too much inventory. The day’s sales’ outstanding ratio was decreasing throughout the analysed period from 60 days in 2001 to 38 days in 2003. Then, in 2004 the ratio has gone up by 3 days. The calculated data implies that the credit policy of the company is successful, since there is a trend of DSO declining almost all the time over the past few years. If these
7 The data on industry average was used from E*TRADE Financial (E*Trade, 2005), Yahoo Finance (Yahoo Finance, 2005) and Ibbotson Beta Book (Ibbotson Beta Book, 2005), which are just three of numerous providers of such data.
61

two ratios are pretty good, the picture on the side of the utilisation of fixed and total assets is reverse and critical. The fixed assets turnover ratio didn’t exceed the value 0.70 within the analysed period and the total assets turnover ratio reached its maximum only with the value of 0.54. We can conclude that the company’s utilisation of its assets is very poor which can be additionally implied also from the decline of these two ratios as per trend. Debt Management Ratios Debt ratio of the year 2004 implies that debt has been a source of financing to the extent of 37% of its total assets. The value of the ratio is at a satisfactory level, especially if we are looking from the point of view of external liability-holders. In other words, there is a safety margin of 63% available to lenders and creditors. Safety margin, in turn, signifies that the firm would be able to meet their claims even if the value of the assets decline by 63%. The TIE ratio, especially in the year 2001, reinforces the conclusion from our analysis of the debt ratio that the company Laško would not face difficulties if it attempted to borrow additional funds. The value of TIE in 2004 is negative, because the net interest charges were negative, since the company reached a level where it had higher interest revenues than interest charges. Profitability Ratios Laško’s profit margin is below the industry average of 6% because its costs are too high. High costs, in turn, generally occur because of inefficient operations. We can also see that the raw earning power of the firm’s assets, before the influence of taxes and leverage is not very good. Laško’s 1.36% return on total assets is well below the 9.51% percent average for the industry. This low return results from the company’s low basic earning power, which is causing net income to be relatively low. Also the return on common equity is below the industry average. Market Value Ratios Laško’s earnings per share were growing till 2003, but in 2004 this trend stopped with a big decline. The main reason for this decline is the fall of the net sale in 2004 as a consequence of adverse market conditions, unfavourable sales of beverages and keener competitions. Still, the comparison with the industry average of EPS and P/E ratio suggests that the company is regarded as being somewhat riskier than most, or having poorer growth prospects, or both. Also the price/cash flow ratio with the value of 12 times in 2004 once again suggests the same thing. The market/book ratio with the value of 1.3 times in 2003 and 2004 also deviates from market values and reflects that investors are willing to pay relatively little for one SIT of Laško’s book value.
62
5.4.2. Extension of the financial – accounting model In the ideal case the above-mentioned financial-accounting model should be extended and valuations of intangible and intellectual assets should be included also. Such assets are: • products and services of high quality; • motivated and trained employers; • responsive and predictable internal processes; • satisfied and loyal customers. In practice it is very difficult to set very stable financial values for such assets and because of these difficulties these assets most probably are never going to form a part of balance sheets, although their importance is crucial for the success in the competing environment of today and tomorrow (Kaplan, Norton, 2000, p. 19). 5.5. THE DU PONT CHART The chart depicted in Figure 24 is called a modified Du Pont chart, since this approach was developed for evaluating performance. Working from the bottom up, the left-hand side of the chart develops the profit margin on sales. The various expense items are listed and then summed to obtain Laško’s total costs, which are subtracted from sales to obtain the company’s net income.
63

Figure 24: Modified Du Pont Chart for of Pivovarna Laško d.d.
Source: Own calculation.
64

5.6. CAPM To estimate the cost of common stock using the Capital Asset Pricing Model (CAPM) as discussed in chapter 3, we proceed as follows: 1. estimate the risk-free rate, rRF; 2. estimate the current expected market risk premium, RPM; 3. estimate the stock’s beta coefficient, βi and use it as an index of the stock's risk. The i
signifies ith company's beta. 4. substitute the preceding values into the CAPM equitation to estimate the required rate of
return on the stock in question: rs = rRF + (RPM)βi rs = rRF + (rM - rRF)βi where rRF = risk-free rate RPM = market risk premium rM = required rate of return on a market portfolio (portfolio consisting of all stocks) βi = beta coefficient 5.6.1. Estimation of the risk-free rate rRF
Since it is impossible in practice to find a truly risk-less rate upon which to base the CAPM, I will use the rate of return of long-term Treasury bonds issued by the Republic of Slovenia. In this case I used the yield on 10-yaear T-bonds as the proxy for the risk-free rate, which was for the year 2004 on an average 4,389% (Banka Slovenije, 2004). 5.6.2. Estimation of the current expected market risk premium RPM
The risk premium of an average company in the developed market economies is between 8% and 12%. In the mentioned interval of values I decided to take for this case a market risk premium of 8%.
65
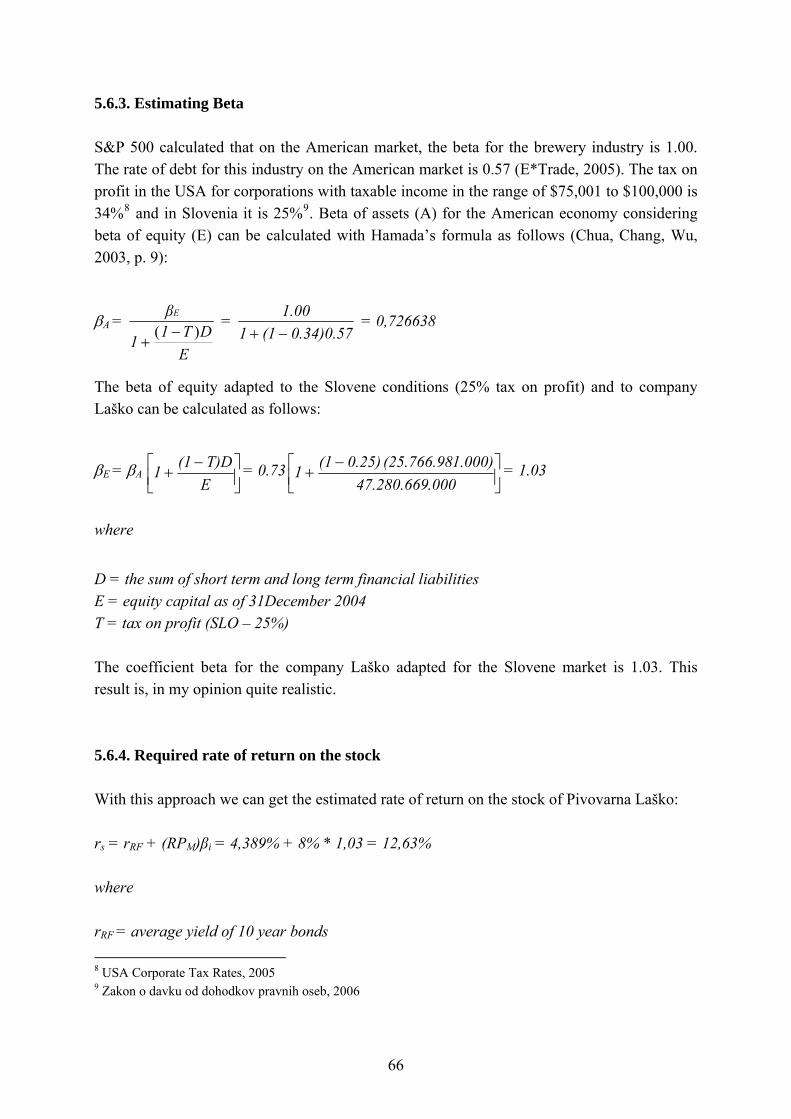
5.6.3. Estimating Beta S&P 500 calculated that on the American market, the beta for the brewery industry is 1.00. The rate of debt for this industry on the American market is 0.57 (E*Trade, 2005). The tax on profit in the USA for corporations with taxable income in the range of $75,001 to $100,000 is 34%8 and in Slovenia it is 25%9. Beta of assets (A) for the American economy considering beta of equity (E) can be calculated with Hamada’s formula as follows (Chua, Chang, Wu, 2003, p. 9):
βA =
ΕDΤ11
βΕ)−(
+ =
0.34)0.57(111.00−+
= 0,726638
The beta of equity adapted to the Slovene conditions (25% tax on profit) and to company Laško can be calculated as follows:
βE = βA ⎥⎦⎤
⎢⎣⎡ −+
ET)D(11 = 0.73 ⎥⎦
⎤⎢⎣⎡ −+
.00047.280.6691.000)(25.766.980.25)(11 = 1.03
where D = the sum of short term and long term financial liabilities E = equity capital as of 31December 2004 T = tax on profit (SLO – 25%) The coefficient beta for the company Laško adapted for the Slovene market is 1.03. This result is, in my opinion quite realistic. 5.6.4. Required rate of return on the stock With this approach we can get the estimated rate of return on the stock of Pivovarna Laško: rs = rRF + (RPM)βi = 4,389% + 8% * 1,03 = 12,63% where rRF = average yield of 10 year bonds 8 USA Corporate Tax Rates, 2005 9 Zakon o davku od dohodkov pravnih oseb, 2006
66
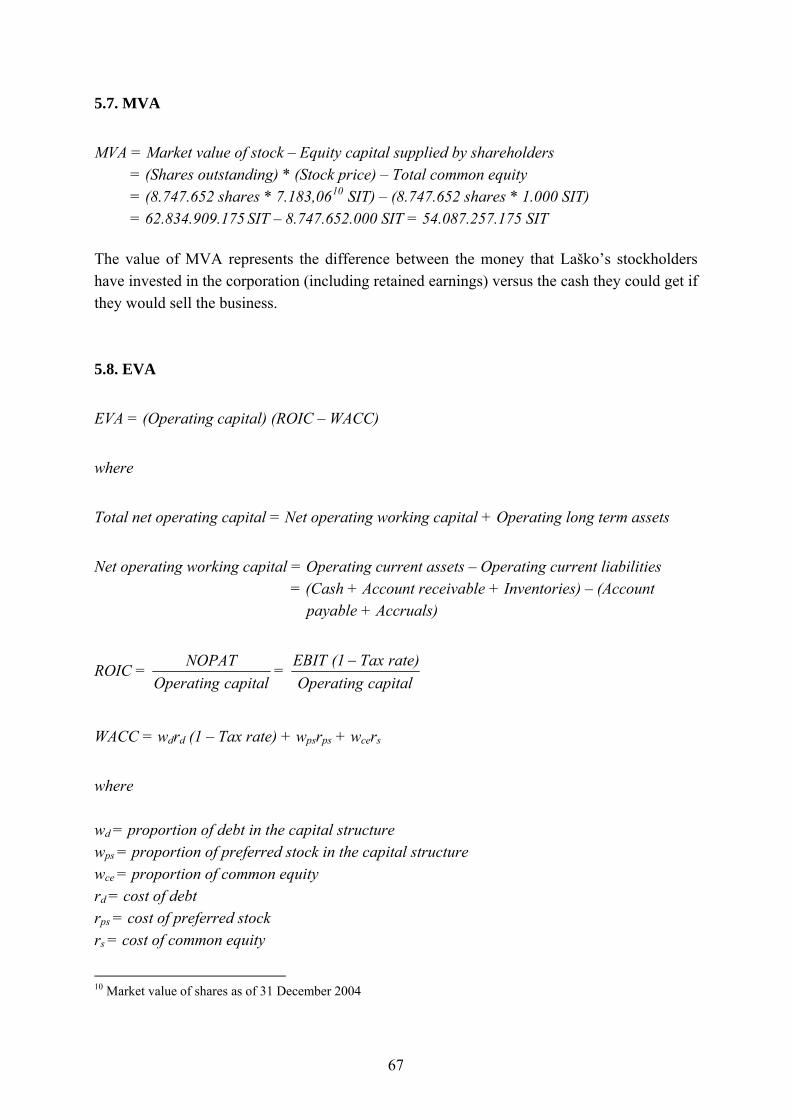
5.7. MVA MVA = Market value of stock – Equity capital supplied by shareholders = (Shares outstanding) * (Stock price) – Total common equity = (8.747.652 shares * 7.183,0610 SIT) – (8.747.652 shares * 1.000 SIT) = 62.834.909.175 SIT – 8.747.652.000 SIT = 54.087.257.175 SIT
The value of MVA represents the difference between the money that Laško’s stockholders have invested in the corporation (including retained earnings) versus the cash they could get if they would sell the business. 5.8. EVA EVA = (Operating capital) (ROIC – WACC) where Total net operating capital = Net operating working capital + Operating long term assets Net operating working capital = Operating current assets – Operating current liabilities = (Cash + Account receivable + Inventories) – (Account payable + Accruals)
ROIC = capitalOperating
NOPAT = capitalOperating
rate)Tax(1EBIT −
WACC = wdrd (1 – Tax rate) + wpsrps + wcers
where wd = proportion of debt in the capital structure
wps = proportion of preferred stock in the capital structure
wce = proportion of common equity rd = cost of debt rps = cost of preferred stock rs = cost of common equity
10 Market value of shares as of 31 December 2004
67

computations: Net operating working capital = (3.956.195.000 + 57.866.000 + 3.451.042.000 + 255.909.000 + 7.531.000) – (4.586.640.000 + 147.954.000) = 2.993.949.000 Total net operating capital = 2.993.949.000 + 28.541.292.000 + 233.200.000 = 31.768.441.000
ROIC = .00031.768.441
0,25)(10877.942.00 − 100 = 2.07%
WACC = 0.39 * 3.21% (1 – 0.25) + 0.61 * 12.63% = 8.6%
EVA = (31.768.441.000) (2.07% – 8.6%) = -2.074.479.197 Assuming from this result, managerial effectiveness was not appropriate in 2004. The firms WACC exceeds ROIC. The true economic profit for the year 2004 differs sharply from accounting profit. A negative value is a consequence of a concrete fall of the net operating profit after taxes in 2004. 5.9. ENVIRONMENTAL REPORT There is a saying at Pivovarna Laško: “An environment-friendly company entails a pleasant working environment and coexistence with our neighbours”. This can be achieved only by applying all the environmental protection standards. At Pivovarna Laško they have been aware for long time that in their daily endeavours to increase productivity and profit they cannot ignore an important factor that will determine their lives and work in the future: the environment. Only an environmentally friendly company can provide security for future generations, and for this reason the company is working hard on comprehensive environmental protection. In the second half of 2003, they began separating beer from yeast waste using a device based on the principle of tangential membrane filtration. With this procedure, about 40 percent of the total quantity of yeast waste, which was previously discarded, is returned to the manufacturing process as beer. They reduced the quantity of beer in wastewater as well as quantities of the latter. Previously, tanks for the separation of beer and yeast were equipped with fixed taps. The yeast settled at the bottom of the tank whilst the beer floating on top was poured out. The discarded beer is then released into the sewer system or as industrial waste water. The filtered beer is then collected in special tanks and returned to the manufacturing
68
process, whilst the yeast is thickened to 20 percent dry weight and dried. Another important improvement is the fact the separated beer has a very high sensory quality and can be returned to the manufacturing process without lowering the end quality. The dry brewer’s yeast is a by-product of beer fermentation and is sold as animal feed or for pharmaceutical requirements. They have thus reduced the loss of beer by approximately one percent of annual sales. By reducing ullage during the manufacturing process, the company could also reduce the quantities of waste water released into the environment and the consumption of raw materials per unit of production. In addition, more condensed yeast requires less drying time, which means less consumption of energy. During the replacement of equipment and software for the purpose of automation, they reexamined and optimised the displacement in several processes. In the same way, they reduced the quantity of water used in cellars and for cleaning agents, and thus the quantities of emissions in waste water. They optimised the procedures for cultivating pure yeasts for fermentation and implemented improvements in the fermentation process itself. These measures helped them to achieve a significant improvement in the sedimentation of yeast after fermentation, thus contributing towards the improvement of filtered beer and to lower filtration costs. The quantities of water, cleaning agents, filtration agents and, most importantly, the total quantity of waste filtration agents have been reduced at annual level. In 2004, the company continued its work on the construction of an autonomous anaerobic purification plant for treating waste water. In cooperation with the municipality, they continued the construction of the purification plant’s second treatment phase, where pre-treated industrial water is finally purified to the limit values before being released into the environment. For a variety of reasons, this construction was not completed by 2004 as planned, and a test run is now expected to take place in the first half of 2005. Full operation of the purification plant is expected in 2006. This will finally solve the issue of releasing untreated waste water into the environment. In 2004, Pivovarna Laško signed a contract with SLOPAK, pursuant to the Rules on management of packaging and packaging waste (Official Gazette of the Republic of Slovenia, nos. 104/00 and 12/02). The contract transfers the responsibility of reprocessing, recycling and removal to Slopak. Slopak charges the client for its services, which include handling all waste packaging intended for the end user on the Slovene market in the prescribed manner. The costs for waste packaging in 2004 amounted to 42,754,470 tolars. In order to provide safe drinking water, the company began preparations in 2003 for the introduction of the HACCP system, and successfully underwent the first inspection by an authorised inspection authority in 2004. Laško pays a lot of attention to drinking water, industrial water and the public water supply. A new preventive disinfection system for drinking water has been installed for the most problematic sources of water, using chlorine dioxide (ClO2) as a disinfectant. Chlorine dioxide has fewer negative effects and enhances the
69

residual effect and thus provides better disinfection. In response to the increasingly common dry spells and the consequent fall in the level of ground water, Pivovarna Laško and the municipality of Laško have began searching for new sources of water. The focus in 2004 was the source near Malič, where they began preparations for the construction of a well. They also purchased a new flow meter for the waterworks, thus enhancing their ability to detect faults and losses. In 2004, they were finally awarded with a concession for abstracting underground water from the permeable Perm-Carbon layer at the Lurd water source for bottling Oda mineral water (Official Gazette. of the Republic of Slovenia no. 125/2004, Decree on the concession for the abstraction of underground water from the ZB1, ZB2, ZB3, ZB4, ZB5, ZB6 and ZB7 Lurd water sources for the manufacture of beverages). This finally settles the issue of abstracting underground water, regarding which the Decree charges them with the big responsibility of properly handling of this water source. In accordance with the HACCP standard, the quality of drinking water is controlled internally using physical, chemical and microbiological analyses. Contractual specialists from the health protection institutes in Celje and Maribor carry out additional controls using regular and expanded analyses and consultation. 5.9.1. Environmental standard, IPPC A fundamental goal is to turn around all negative effects and to begin implementing seriously the ISO 14001 environmental standard by 2006, and thus chart the course for handling materials that burden the environment. Figure 25: Laško’s investments in the environment
Water (SIT) Investments in water sources 8.981.473 Water sources – land 10.409.615 Costs of waterworks 99.087.455 Contributions for water compensation 9.917.556 TOTAL 128.396.099 Waste water (purification plant) Purification plant – investment underway 574.146.231 Provisions – drawing of long-term provisions 207.708.669 TOTAL 781.854.900 Waste packaging (SLOPAK) Environmental protection – packaging costs 42.754.470 TOTAL 42.754.470 Other Angling club – compensation 4.000.000 TOTAL 4.000.000 GRAND TOTAL 957.005.469
Source: Laško's annual report 2004.
70
Because of the volume of its production, Pivovarna Laško is subject to the IPPC Directive. All documentation necessary for obtaining an environmental permit is being compiled and they expect to obtain it by October 2007. 6. CONCLUSION The brewing industry has recently experienced increasing saturation in mature markets, changes in production processes, greater variations in consumer behaviour, vertical integration and development of distribution chains, increased internationalisation, use of strategic alliances and other collaborative arrangements, and industry consolidation (Larimo, p. 2). That Slovenia doesn’t represent an exception in this process toward consolidation became clear at the beginning of the year 2005 when Pivovarna Laško acquired 95.17% stake of Pivovarna Union. In 2004 the industry of beverages faced adverse market conditions, unfavourable sales of beverages and keener competitions. The problems faced by Pivovarna Laško, namely, smaller demand for beer and other beverages in 2004, were shared by almost all producers of beverages. Such market conditions were the result of poor weather during the high season, which was not favourable to the consumption of beer and soft drinks. Consequently, the results were poorer than plans for the year 2004. In such circumstances the need for prompt and right decisions based on an adequate control system is becoming more and more important. The development of the supervisory board’s function was parallel to the progress of business environments. For performing the control function in the industrial age, it was enough to use the accounting model. Later on, since the accounting method did not show an adequate picture of the business success any more, the need of the economic expression of profit appeared. Differently from the traditional accounting data, this model incorporates a charge for the use of equity capital. Soon, this model also became insufficient, since it relies totally on accounting data. The need for non-accounting ratios was growing consistently and among other models the Balanced Scorecard was developed. Today it is not enough to examine just accounting measures, which are oriented to the past, because these do not tell us much about the behaviour of the company in the future. For companies in modern business environments it is relevant to set up a clear vision and strategy that would enable them to achieve their vision.
71
Although the analysed company’s strategy was clearly set up, it would be sensate to control properly the way Laško is following it. The existing performance measurement approaches of the company Laško are quite obsolete, since they are relying only on financial accounting measures. At this stage, prompt and quality information is very important. In processing the estimation of the business success a further step should be taken. Presently, too much attention is paid to the profitability of capital, which in my opinion, does not give a complete picture since it does not take into account the cost of equity capital. With a bigger focus on modifying accounting data such as free cash flow and by introducing measures such as MVA and EVA, some improvement could be achieved. The Balanced Scorecard does not bring us many new ideas, since we know more models that combine financial and non-financial ratios. It is understandable, simple and it uses a marketable approach and for all those reasons it is so successful. Even it is a little more comprehensive, it would be sensate for a company to develop it.
72
7. LITERATURE 1. Alibegovič Zlatko: Značilnosti procesa združevanja in prevzemov v pivovarski industriji
v EU in Sloveniji. Magistrsko delo. Ljubljana: Ekonomska fakulteta, 2004, 107 p. 2. Atkinson Anthony A., Waterhouse John H., Wells Robert B.: Stakeholder Approach to
Strategic Performance Measurement. Cambridge: Sloan Management Review, Spring, 1997, p. 25-37.
3. Bennett Stewart. G.: The quest for value: the EVA management guide. New York: Harper Business, 1991, 781 p.
4. Bodie Zvi, Kane Alex, Marcus Alan J.: Investments. (6th ed.), Boston: Irwin McGraw-Hill, 2005, 1090 p.
5. Brigham Eugene F., Daves Philip R.: Intermediate financial management. (7th ed.), South-Western London: Thomson Learning, 2002, 988 p.
6. Bringall Stan: The Unbalanced Scorecard: A social and Environmental Critique. Proceedings from the 3rd International Conference on Performance Measurement and Management – PMA. Cranfield: Cranfield School of Management, July, 2002, p. 85-92.
7. Chandler Alfred D.: Scale and Scope: The Dynamics of Industrial Capitalism. Cambridge, London: Harvard University Press, 1990, 860 p.
8. Chandler Alfred D.: The Visible Hand: The Managerial Revolution in American Business. Cambridge, London: Harvard University Press, 1977, 608 p.
9. Chua Jess, Chang Philip, Wu Zhenyu: The Full Information Approach for Estimating Divisional Costs of Capital: Infeasibility and Transformation. Calgary: Haskayne School of Business, 2003, 20 p.
10. Cyert Richard M., March James G.: A Behavioral Theory of the Firm. Englewood: Prentice-Hall, 1963, p. 332.
11. Czinkota Michael R. et. al.: Global Business. (3rd ed.), Fort Worth: Harcourt College Publishers, 2001, 549 p.
12. Damodaran Aswath: Investment Valuation: Tools and Techniques for Determining the Value of Any Asset. New York: John Willey & Sons, 2002, 992 p.
13. DiMaggio Paul J., Powell Walter W.: The Iron Cage Revisited: Institutional Isomorphism in Organizational Fields. Yale University: American Sociological Review, Vol. 48, 1983, p.147-160.
14. Dowing L.: Global BSC Community: A special Report on Implementation Experience from Scorecard users World-wide, Perspectives on Performance. Performance Measurement Association, Vol. 1, 2001, 17 p.
15. Eccles Robert G.: The Performance Measurement Manifesto. Boston: Harvard Business Review 69 (1), 1991, p. 131-137.
16. Elliot Robert K.: The third Wave Breaks on the Shores of Accounting. Lexington: Accounting Horizons, June, 1992, p. 61-85.
17. Emmanuel Clive R., Otley David T., Merchant Kenneth: Accounting for Management Control. (2nd ed.), London: Chapman & Hall, 1990, 518 p.
73
18. Fama E. F., French K. R.: Common Risk Factors in the Returns on Stocks and Bonds. Journal of Finance, Vol. 33, 1993, p. 3-56.
19. Fama E. F., French K. R.: The Cross-Section of Expected Stock Returns. Journal of Finance, Vol. 47, 1992, p. 427-465.
20. Forsythe G.: Measuring a Company’s Financial Health. Investing Strategies. [URL:htpp://www.schwab.com/SchwabNOW/SNLibrary/SNLib123/SNI123Article/0,5637,873,412,00html], 6.20.2005.
21. George Jennifer M., Jones Gareth R.: Understanding and managing organizational behavior. (2nd ed.), Upper Saddle River: Prentice-Hall, 1999, 724 p.
22. Halle Mark: United Nations Environment Programme. Economics and Trade Unit: Environment and Trade (Handbook). Hartfordshire: International Institute for Sustainable Development, 2000, 84 p.
23. Harrington Diana R., Wilson Brent D.: Corporate Financial Analysis. (3rd ed.), Boston: Irwin Inc., 1989, 316 p.
24. Helfert Erich A.: Techniques of Financial Analysis: A Guide to value creation. (10th ed.) Boston: Irwin McGraw-Hill, 2000, 556 p.
25. Itami Hiroyuki: Mobilizing Invisible Assets. Cambridge: Harvard University Press, 1978, 186 p.
26. Ittner Christoper D., Larcker David F.: Innovations in Performance Measurement: Trends and Research Implications. East Lansing: Journal of Management Accounting Research, no. 10, 1998, p. 205-238.
27. Jain P. K.: Financial and Cost Accounting (Selected chapters). ICPE study material, 2003, 280 p.
28. Jennings Jason, Haugton Laurence: It's Not the Big that Eat the Small...It's the Fast that Eat the Slow: how to use speed as a competitive tool in business. (1st ed.), New York: Harper Business, 2002, 262 p.
29. Kandžija Vinko, Kumar Andrej: Theory and practice of transition and accession to the EU (4. International Conference). (1st ed.), Ljubljana: Faculty of Economics, 2004, 770 p.
30. Kaplan Robert S., Norton David P.: Balanced Scorecard: Measures That Drive Performance. Boston: Harvard Business Review, Jan/Feb., 1992, p. 71-79.
31. Kaplan Robert S., Norton David P.: The Balanced Scorecard: Translating strategy into action. Boston: Harvard Business School Press, 1996, 323 p.
32. Kaplan Robert S., Norton David P.: The Strategy Focused Organization: How Balanced Scorecard Companies Thrive in the New Business Environment. Boston: Harvard Business School Press, 2001, 400 p.
33. Kaplan Robert S., Norton David P.: Uravnoteženi sistem kazalnikov: preoblikovanje strategije v dejanja. Ljubljana: Gospodarski vestnik, 2000, 343 p.
34. Khandwalla Pradip N.: The design of organizations. New York: Harcourt, 1977, 713 p. 35. Larimo Jorma: The brewing markets in central and Eastern Europe in the period 1990-
2003. [http://www.tukkk.fi/pei/NewEurope/SessionB1/Larimo_Marinov_Marinova.pdf], 6.20.2005
74

36. Lipovec Filip.: Mere uspešnosti in gospodarski razvoj. Ljubljana: Cankarjeva založba, 1970, 215 p.
37. Macdonald John.: Understanding Total Quality Management in a week. (2nd ed.), London: Institute of Management Foundation, 2003, 96 p.
38. McKenna Regis: Marketing is everything. Boston: Harvard Business Review, February, 1991, p. 65-79.
39. Mramor Dušan: Uvod v poslovne finance. Ljubljana: Gospodarski vestnik, 1993. 381 p. 40. Otley D.T.: The Contingency Theory of Management Accounting. Achievement and
Prognosis, Accounting, Organization and Society, 5 (4), 1980, p. 413-428. 41. Owen David L., Swift Tracey, Hunt Karen: Questioning the Role of Stakeholders
Engagement in Social and Ethical Accounting, Auditing and Reporting. Sheffield: Accounting Forum, Vol. 1, 2001, p. 9.
42. Peters Thomas J., Waterman Robert H.: In Search of Excellence: lessons from America’s best-run companies. New York: Harper Collins, 1993, 360 p.
43. Prešeren Saša: IPPC – Integrated Pollution Prevention and control: Clean Production. Ljubljana: Mednarodni center za trajnostni razvoj, 2004, p. 20.
44. Pučko Danijel: Analiza in načrtovanje poslovanja, Ljubljana: Ekonomska fakulteta, 1999, 196 p.
45. Rejc Adriana: Traditional vs. contemporary performance measurement: evidence from large Slovenian companies. Economic and business review, Vol. 5, April/June, 2003, p. 117-135.
46. Robbins Stephen P.: Managing Today. (2nd ed.), Upper Saddle River: Prentice Hall, 2000, 650 p.
47. Sera Koh: Corporate Globalization: A New Trend. Academy of Management Executive, 1992, 6, p. 89-96.
48. Tekavčič Metka, Peljhan Darja: The Importance of Cost Management Tools and Their Use in Companies Operating in Transition Economies: The case Of Large Slovenian Companies. International Business and Economics Research Journal, Vol. 1, Numb. 10, October, 2002, p. 105-117.
49. Tekavčič Metka: Key success factors in doing business by the rules of the new economy in the CEE countries - The case of Studio Moderna (Working papers). Ljubljana: Faculty of Economics, 2003, 20 p.
50. Tonge R., Larsen P., Pepper J.: Balanced Scorecards and the FTSE: exploratory research. Switzerland: International Journal of Performance Management, 2000, Vol. 2, Numb. 4, p. 293 - 310.
51. Welford Richard: Corporate Environmental Management 1. (2nd ed.), London: Earthscan Publications Ltd, 1998, 261 p.
52. Wheelen Thomas L., J. Hunger David: Strategic management and business policy. (5th ed.), Upper Saddle River: Prentice-Hall, 1995, 1217 p.
75

8. SOURCES: 1. Banka Slovenije (http://www. bsi.si/), 9.28.2004. 2. Brewery Laško d.d. (http://www.pivo-lasko.si/eng/index.html), 8.28.2005. 3. Brewery Laško’s Annual report 2002 4. Brewery Laško’s Annual report 2003 5. Brewery Laško’s Annual report 2004 6. Business Environment (http://ollie.dcccd.edu/mgmt1374/book_contents/1overview/business_environment/bus_ envior.htm), 7.3.2004. 7. USA Corporate Tax Rates (http://www.infoplease.com/ipa/A0005946.html), 9.24.2005. 8. Cost management in Slovenian companies (http://www.efri.hr/english/prikaz.asp?txt_id=608), 9.24.2005. 9. Envioronmental Management Tools
(http://www.uneptie.org/pc/pc/tools/ems.htm), 9.23.2004 10. E*TRADE Financial (https://us.etrade.com/e/t/home), 11.22.2005 11. FAO
(http://www.mic.org.mt/EUINFO/qeua/q&a50.htm), 9.23.2004 12. From Quality to Excellence
(http://www.dti.gov.uk/quality/6i.htm), 9.24.2004 13. Ibbotson Beta Book
http://www.ibbotson.com/Products|/Catalog), 11.22.2005 14. Index of/business_guide/crosscuttings
(URL:http://www.1000ventures.com/business_guide/crosscuttings/leadership_volatility. html), 7.3.2004. 15. SEOnet
(htpp://www.ljse.si), 10.20.2005 16. Total Quality Management (http://www.tqe.com/tqm.html), 9.23.2004. 17. Volatility Leadership: Leading in the Rapidly Changing Business
(www.1000ventures.com/business_guide/crosscuttings/leadership_volatility.html), 8.28.2004 18. Yahoo Finance (http://biz.yahoo.com/p/3conameu.html), 9.24.2005. 19. Zakon o davku od dohodkov pravnih oseb (Uradni list RS, št. 33/2006).
76


9. LIST OF APPENDICES: 1. Consolidated Balance Sheet as of 31 December 2004 2. Consolidated Income statement for January 1 to December 31 2004 3. Consolidated Cash flow statement for January 1 to December 31 2004 4. Consolidated Statement of Changes in Equity Capital January 1 to December 31 2004 5. Per-Share data 6. Summary of Laško’s Basic Financial Ratios 7. Additional financial indicators
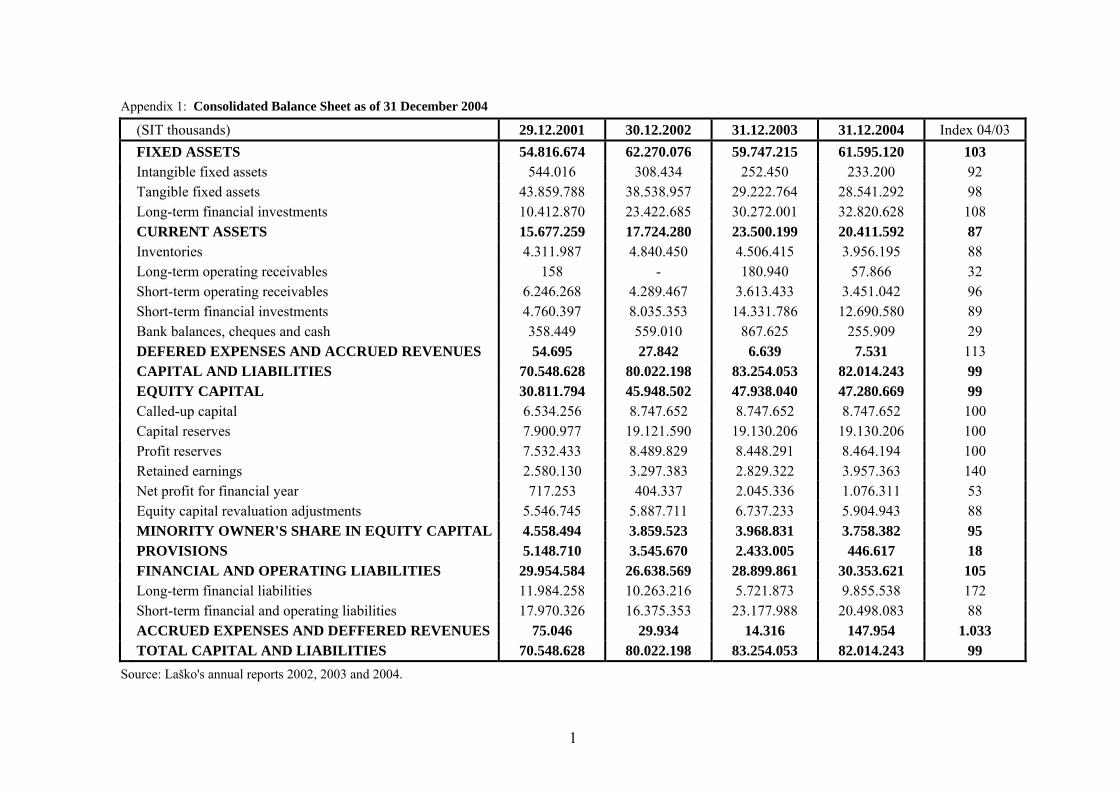
Appendix 1: Consolidated Balance Sheet as of 31 December 2004
(SIT thousands) 29.12.2001 30.12.2002 31.12.2003 31.12.2004 Index 04/03
FIXED ASSETS 54.816.674 62.270.076 59.747.215 61.595.120 103 Intangible fixed assets 544.016 308.434 252.450 233.200 92 Tangible fixed assets 43.859.788 38.538.957 29.222.764 28.541.292 98 Long-term financial investments 10.412.870 23.422.685 30.272.001 32.820.628 108 CURRENT ASSETS 15.677.259 17.724.280 23.500.199 20.411.592 87 Inventories 4.311.987 4.840.450 4.506.415 3.956.195 88 Long-term operating receivables 158 - 180.940 57.866 32 Short-term operating receivables 6.246.268 4.289.467 3.613.433 3.451.042 96 Short-term financial investments 4.760.397 8.035.353 14.331.786 12.690.580 89 Bank balances, cheques and cash 358.449 559.010 867.625 255.909 29 DEFERED EXPENSES AND ACCRUED REVENUES 54.695 27.842 6.639 7.531 113 CAPITAL AND LIABILITIES 70.548.628 80.022.198 83.254.053 82.014.243 99 EQUITY CAPITAL 30.811.794 45.948.502 47.938.040 47.280.669 99 Called-up capital 6.534.256 8.747.652 8.747.652 8.747.652 100 Capital reserves 7.900.977 19.121.590 19.130.206 19.130.206 100 Profit reserves 7.532.433 8.489.829 8.448.291 8.464.194 100 Retained earnings 2.580.130 3.297.383 2.829.322 3.957.363 140 Net profit for financial year 717.253 404.337 2.045.336 1.076.311 53 Equity capital revaluation adjustments 5.546.745 5.887.711 6.737.233 5.904.943 88 MINORITY OWNER'S SHARE IN EQUITY CAPITAL 4.558.494 3.859.523 3.968.831 3.758.382 95 PROVISIONS 5.148.710 3.545.670 2.433.005 446.617 18 FINANCIAL AND OPERATING LIABILITIES 29.954.584 26.638.569 28.899.861 30.353.621 105 Long-term financial liabilities 11.984.258 10.263.216 5.721.873 9.855.538 172 Short-term financial and operating liabilities 17.970.326 16.375.353 23.177.988 20.498.083 88 ACCRUED EXPENSES AND DEFFERED REVENUES 75.046 29.934 14.316 147.954 1.033 TOTAL CAPITAL AND LIABILITIES 70.548.628 80.022.198 83.254.053 82.014.243 99
Source: Laško's annual reports 2002, 2003 and 2004.
1

Appendix 2: Consolidated Income Statement for January 1 to December 31 2004
(SIT thousands) 31.12.2001 31.12.2002 31.12.2003 31.12.2004 Index 04/03 Net sales revenues 38.272.882 37.183.947 36.769.572 31.093.994 85 Change in inventories of products and work in progress 128.604 90.978 73.798 -34.597 -47 Capitalised own products and services - - 72.698 - - Other operating revenues 239.620 399.793 329.614 573.823 174 Cost of goods, material and services 23.275.921 22.639.353 23.063.040 19.866.655 86 Labour costs 7.281.317 6.988.867 5.569.987 5.324.358 96
Amortisation, depreciation and revaluation operating expenses for intangible fixed assets and tangible fixed assets 5.138.705 4.697.537 4.588.741 4.157.036 91
Write-downs 466.617 359.211 246.788 620.341 251 Other operating expenses 584.463 739.470 560.126 786.888 140 OPERATING PROFIT 1.894.083 2.250.280 3.217.000 877.942 27 Financial revenues from equity capital interests 100.775 458.794 681.848 602.248 88 Financial revenues from long-term receivables 1.834.086 1.611.126 217.978 128.180 59 Financial revenues from short-term receivables 872.800 1.184.540 2.063.861 2.612.351 127
Financial expenses for long-term and short-term financial investments write-downs 1.773.363 2.122.129 1.798.981 1.485.771 83
Interest expenses and financial expenses from other liabilities 1.076.307 1.777.996 1.667.991 1.337.511 80
PROFIT FROM ORDINARY ACTIVITIES 1.852.074 1.604.615 2.713.715 1.397.439 51 Extraordinary revenues 570.807 363.672 645.161 98.088 15 Extraordinary expenses 472.662 146.520 664.389 82.935 12 PROFIT FROM EXTRAORDINARY ACTIVITIES 98.145 217.152 -19.228 15.153 -79 Tax on profit 414.374 301.823 513.527 298.918 58 NET PROFIT FOR ACCOUNTING PERIOD 1.535.845 1.519.944 2.180.960 1.113.674 51 Minority owner's share of net profit 139.663 141.905 135.624 37.363 28 CONTROLLING COMPNAY'S SHARE ON PROFIT 1.396.182 1.378.039 2.045.336 1.076.311 53
Source: Laško's annual reports 2002, 2003 and 2004.
2

Appendix 3: Consolidated Cash flow statement for January 1 to December 31 2004
(SIT thousands) 1 Jan - 31 Dec 2003
1 Jan - 31 Dec 2004
CASHFLOWS FROM OPERATING ACTIVITIES 37.334.125 31.482.044 Operating revenues 37.245.851 31.667.816 Extraordinary revenues associated with operations 28.409 98.088 Opening minus closing operating receivables 61.351 -282.968 Opening minus closing defended expenses -1.486 -892 OUTFLOWS FROM OPERATING ACTIVITIES 29.583.458 26.494.727
Operating expenses excluding amortisation, depreciation and long-term provisions 29.125.256 25.892.485
Extraordinary expenses associated with investing activities 167.572 82.935 Tax on profit and other taxes not included in operating expenses 513.527 298.918 Operating minus closing inventories -303.748 -475.682 Operating minus operating debts 80.851 696.071
NET INFLOWS (OUTFLOWS) FROM INVESTING ACTIVITIES 7.750.667 4.987.317
CASHFLOWS FROM FINANCING ACTIVITIESINFLOWS FROM FINANCING ACTIVITIES 2.039.323 2.296.566
Financial revenues associated with financing activities 1.285.179 1.403.829 Offset decrease in intangible fixed assets 754.144 – Offset decrease in tangible fixed assets – 892.737 OUTFLOWS FROM INVESTING ACTIVITIES 9.988.894 7.485.535 Offset increase in intangible fixed assets 42.234 66.102 Offset increase in tangible fixed assets 3.081.914 3.417.215 Offset increase in long-term financial investments 6.864.746 4.002.218
NET INFLOWS (OUTFLOWS) FROM INVESTING ACTIVITIES -7.949.571 -5.188.969
CASHFLOWS FROM FINANCING ACTIVITIESINFLOWS FROM FINANCING ACTIVITIES 8.058.893 1.965.622
Offset increase in long-term financial debts – 3.990.687 Offset increase in short-term financial debts 8.058.893 -2.025.065 OUTFLOWS FROM FINANCING ACTIVITIES 7.474.363 2.375.686 Financial expenses associated with investing activities 1.673.556 1.090.043 Decrease in equity capital (excluding net profit) 929.008 1.096.432 Offset increase in long-term provisions 1.014.355 189.211 Offset increase in long-term financial debts 3.857.444 –
NET INFLOWS (OUTFLOWS) FROM FINANCING ACTIVITIES 584.53 -410.064
CLOSING BALANCE OF CASH AND EQUIVALENTS 867.625 255.909 Net cash flow for period 385.626 -611.716 Opening balance of cash and equivalents 481.999 867.625
Source: Laško's annual report 2004.
3

Appendix 4: Consolidated Statement of Changes in Equity Capital January 1 to December 31 2004
(SIT thousands) Share capital
Capital reserves
Legal reserves
Reserves for
treasury stock
Other profit
reserves
Total profit
reserves
Retained earnings
Net profit for
financial year
General equity capital
revaluation adjustment
Specific equity capital
revaluation adjustment
Total
OPENING BALANCE as of 1 Jan 2004 8.747.652 19.130.206 6.136.412 83.286 2.228.593 8.448.291 2.829.322 2.045.336 5.546.745 1.190.488 47.938.840
EQUITY C. INFLOWS Entry of net profit for
financial year – – – – – – – 1.076.311 – – 1.076.311
Entry of specific equity capital revaluation for Delo d.d. capital
– – – – – – – – – 182.224 182.224
– – – – – – – 1.076.311 – 182.224 1.258.535 EQUITY C. INFLOWS Transfer of net profit for
previous year – – – – – – 2.045.336 2.045.336 – – –
Elimination of reserves for treasury stock – – – -76.762 92.665 15.903 – – – – 15.903
– – – -76.762 92.665 15.903 2.045.336 2.045.336 – – 15.903 EQUITY CAPITAL
OUTFLOWS
Utilisation of specific equity capital revaluation adjustment - Pivovarna Union d.d.
– – – – – – – – – -563.272 -563.272
Utilisation of specific equity capital revaluation adjustment - Delo d.d.
– – – – – – – – – -415.548 -415.548
Payment of dividend – – – – – – -917.295 – – – -917.295 Other eliminated equity
capital components – – – – – – – – – -35.694 -35.694
– – – – – – -917.295 – – -1.014.514 -1.931.809 CLOSING BALANCE
as of 31 Dec 2004 8.747.652 19.130.206 6.136.412 6.524 2.321.258 8.464.194 3.957.311 1.076.311 5.546.745 358.198 47.280.669
Source: Laško's annual report 2004.
4

Appendix 5: Per-Share data
2001 2002 2003 2004 Earnings per share (EPS) 176 SIT 174 SIT 249 SIT 127 SIT Dividends per share (DPS) / 100 SIT 105 SIT 50 SIT Book value per share (BVPS) 3.522 SIT 5.253 SIT 5.480 SIT 5.405 SIT Cash flow per share (CFPS) 763 SIT 711 SIT 774 SIT 603 SIT
Source: Own calculation. Appendix 6: Summary of Laško’s Basic Financial Ratios
2001 2002 2003 2004 Liquidity Ratios Current ratio 0,9 1,1 1,0 1,0 Quick, or acid test, ratio 0,6 0,8 0,8 0,8 Asset Management Ratios Inventory turnover ratio 8,9 7,7 8,2 7,9 Days sales outstanding (DSO) 60 days 42 days 38 days 41 days Fixed assets turnover ratio 0,7 0,6 0,6 0,5 Total assets turnover ratio 0,5 0,5 0,4 0,4 Debt Management Ratios Debt ratio 42,5% 33,3% 34,7% 37,0% Times-interest-earned (TIE) ratio 45,1 3,5 6,4 -1,7 Profitability Ratios Profit margin on sales 4,0% 4,1% 5,9% 3,6% Basic earning power ratio (BEP) 2,7% 2,8% 3,9% 1,1% Return on total assets (ROA) 2,2% 1,9% 2,6% 1,4% Return on common equity (ROE) 5,0% 3,3% 4,5% 2,4% Market Value Ratios Price/Earnings Ratio (P/E) ratio / / 29,0 56,4 Price/cash flow / / 9,6 12,0 Market/book ratio / / 1,3 1,3
Source: Own calculation.
5

Appendix 7: Additional financial indicators
2001 2002 2003 2004 Self-financing ratio (equity capital/liabilities)
0,44 0,57 0,58 0,58
Long-term financing ratio
(equity capital+long-term liabilities+ long-term operating receivables/total assets)
0,61 0,70 0,65 0,70
Fixed assets investment ratio (fixed assets/assets)
0,63 0,49 0,35 0,35
Long-term investment ratio
((fixed assets+long-term financial investments +long-term operating receivables)/liabilities)
0,78 0,78 0,72 0,75
Equity capital to fixed asstes ratio (equity capital/fixed assets)
0,69 1,18 1,63 1,64
Operating efficiency ratio (operating revenues/operating expenses)
1,05 1,06 1,09 1,03
Net return on equity
(net profit for financial year/equity capital (excluding profit of the financial year))
0,05 0,03 0,05 0,02
Dividend to share capital ratio
(total dividend paid in financial year/share capital)
/ / / 0,01
Source: Own calculation.
6