system integration costs - esig.energy
TRANSCRIPT
Falko Ueckerdt & Lion Hirth 1
Falko Ueckerdt & Lion Hirth
ESIG Webinar | 25 May 2021
System Integration Costs

Falko Ueckerdt & Lion Hirth 2
System integration costs (SIC)
The claim
• Renewables give rise to all kind of costs across the power system, beyond the asset
System integration costs come by many names
• (System) integration costs
• System-level / grid-level costs
• Whole system costs
• Hidden costs

Falko Ueckerdt & Lion Hirth 3
Defining system integration costs
• “system costs in excess of system costs incurred by equivalent amounts of energy delivered to the system on firm, fixed schedules” (Dragon & Milligan 2003)
• “an increase in power system operating costs” (Milligan & Kirby 2009)
• “the additional cost of accommodating wind and solar” (Milligan et al. 2011)
• “the extra investment and operational cost of the nonwind part of the power system when wind power is integrated” (Holttinen et al. 2011)
• “the cost of managing the delivery of wind energy” (EnerNex Corporation 2011)
• “comprising variability costs and uncertainty costs” (Katzenstein & Apt 2012)
• “the total costs above plant-level costs” (NEA 2012)
• “additional costs that are required in the power system to keep customer requirement (voltage, frequency) at an acceptable reliability level” (Holttinen et al. 2013)
• “all additional costs in the non-VRE part (residual system) of the power system when VRE are introduced” (Ueckerdt et al. 2013)

Falko Ueckerdt & Lion Hirth 4
Agenda
1. Value perspective (market value)
2. Cost perspective (system integration costs)
3. Equivalence of cost and value
4. Profile cost and the utilization effect
5. The components of system integration costs
6. Quantifying system integration costs
7. Outlook

Falko Ueckerdt & Lion Hirth 5
Value perspective

Falko Ueckerdt & Lion Hirth 6
German day-ahead spot price. 13-17 March 2014. On Sunday morning, the instantaneous wind penetration rate exceeded 50%.
German spot prices during five days
For economics, it matters when electricity is produced

Falko Ueckerdt & Lion Hirth 7
Market value: average wholesale revenue per MWh
𝑀𝑎𝑟𝑘𝑒𝑡 𝑣𝑎𝑙𝑢𝑒𝑖 = 𝑡=1
𝑇 𝑔𝑖,𝑡 ∙ 𝑝𝑡
𝑡=1𝑇 𝑔𝑖,𝑡
The market value is also...
• ... the average revenue per unit of generation (€/MWh)
• … the “capture price” or “realized price”
• ... the production-weighted average electricity price (“wind-weighted”)
• … the price of electricity produced by generator type 𝑖
Absent market failures, the market value corresponds to economic value
• ... the marginal economic value of electricity produced by generator type 𝑖
• … the “levelized value of energy” (LVOE)
𝑔𝒊,𝒕 Generation (MWh)
𝑖 Technology i
𝑡 Hour t
𝑝𝑡 Price (EUR per MWh)
𝑇 Time steps per year

Falko Ueckerdt & Lion Hirth 8
Value factor
𝑉𝑎𝑙𝑢𝑒 𝑓𝑎𝑐𝑡𝑜𝑟𝑖 =𝑚𝑎𝑟𝑘𝑒𝑡 𝑣𝑎𝑙𝑢𝑒𝑖
𝑏𝑎𝑠𝑒 𝑝𝑟𝑖𝑐𝑒
The value factor is …
• … the relative price of electricity of a certain source
• … also: “capture rate”
Value factor depends on dispatch
• Base load plants have a value factor of 1 (“average value electricity”)
• Peakers have a value factor (way) above 1 (“high value electricity”)
• Plants that produce disproportionally at times of low prices have a value factor below 1 (“low value electricity”)
𝑏𝑎𝑠𝑒𝑝𝑟𝑖𝑐𝑒
Average electricity price during one year

Falko Ueckerdt & Lion Hirth 9
Value factor: the relative price of wind energy
Wind on land in Germany
Base price
(€/MWh)
Market Value (Capture Price)(€/MWh)
Value Factor(Capture Rate)(1)
2001 23.1 22.7 0.96
... ... ... ...
2018 45 42 0.86
Simple averageprice
Wind-weighted price
Ratio
𝑃𝑤𝑖𝑛𝑑 = 𝑡=1
𝑇 𝑊𝑡 ∙ 𝑃𝑡
𝑡=1𝑇 𝑊𝑡
𝑃 = 𝑡=1
𝑇 𝑃𝑡
𝑇𝑉𝐹𝑤𝑖𝑛𝑑 =
𝑃𝑤𝑖𝑛𝑑
𝑃

Falko Ueckerdt & Lion Hirth 10
The value drop of wind and solar energy
Relative value of wind and solar energy diminishes with market share
“Self-cannibalization effect”, or simply: decreasing returns
For climate policy and power system transformation, it is of utmost relevance to understand how far the market value will drop
Value Factor = Market value / base price. Each symbol represents one year. Extrapolation suggests that at 30% wind share its value factors is 0.5; at 15% solar its value is 0.56.. Updated from Hirth (2013): Market value.
2018
2018
?
Solar/wind premium
30%
20%
10%
0%
-10%
-20%
Falko Ueckerdt & Lion Hirth 11
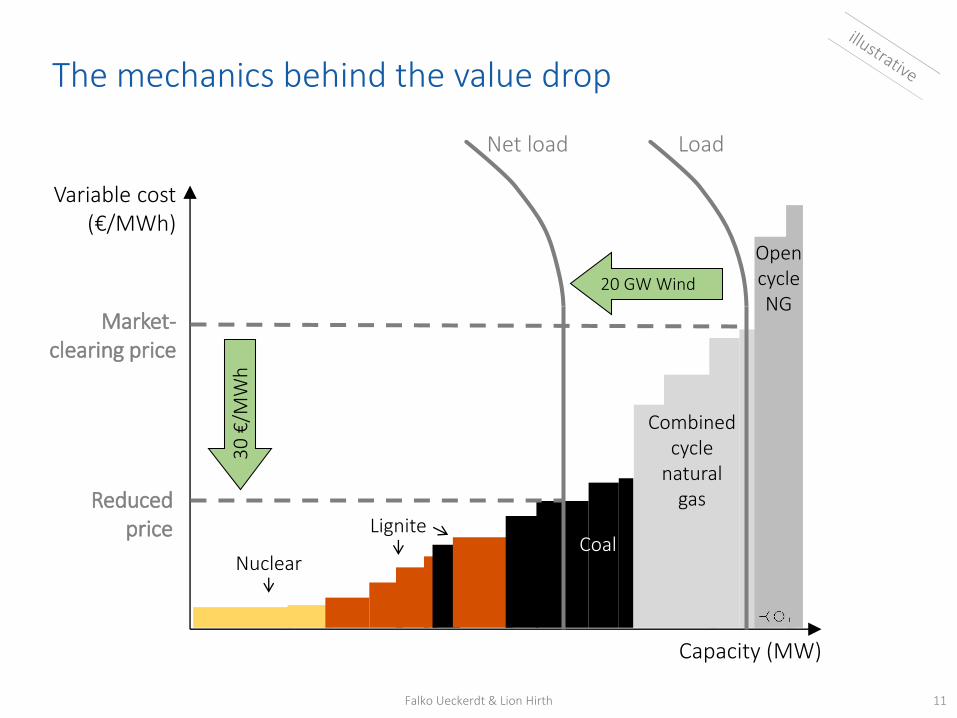
The mechanics behind the value drop
Capacity (MW)
Market-clearing price
Nuclear
LigniteCoal
LoadNet load
20 GW Wind
30
€/M
Wh
Reducedprice
Variable cost(€/MWh)
Combinedcycle
naturalgas
OpencycleNG

Falko Ueckerdt & Lion Hirth 12
The US picture
LBNL / Mills et al. (2021): Solar-to-Grid: Trends in System Impacts, Reliability, and Market Value in the United States with Data Through 2019 (Link)
CAISO data implies a drop of 3.9 percentage points per percentage point (4.0 in Germany)
Falko Ueckerdt & Lion Hirth 13
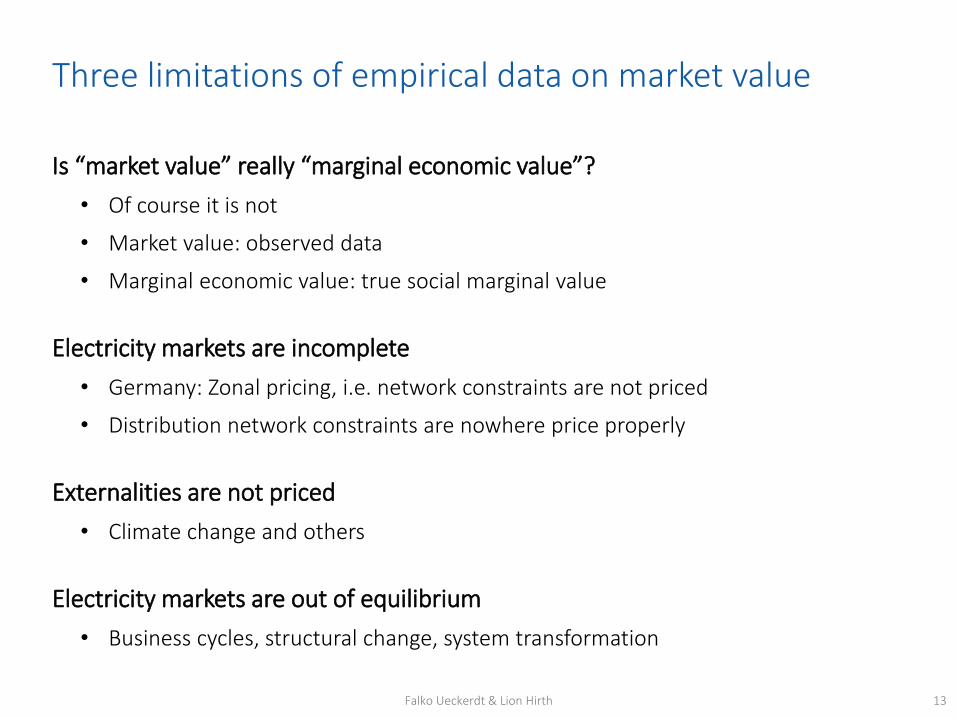
Three limitations of empirical data on market value
Is “market value” really “marginal economic value”?
• Of course it is not
• Market value: observed data
• Marginal economic value: true social marginal value
Electricity markets are incomplete
• Germany: Zonal pricing, i.e. network constraints are not priced
• Distribution network constraints are nowhere price properly
Externalities are not priced
• Climate change and others
Electricity markets are out of equilibrium
• Business cycles, structural change, system transformation

Falko Ueckerdt & Lion Hirth 14
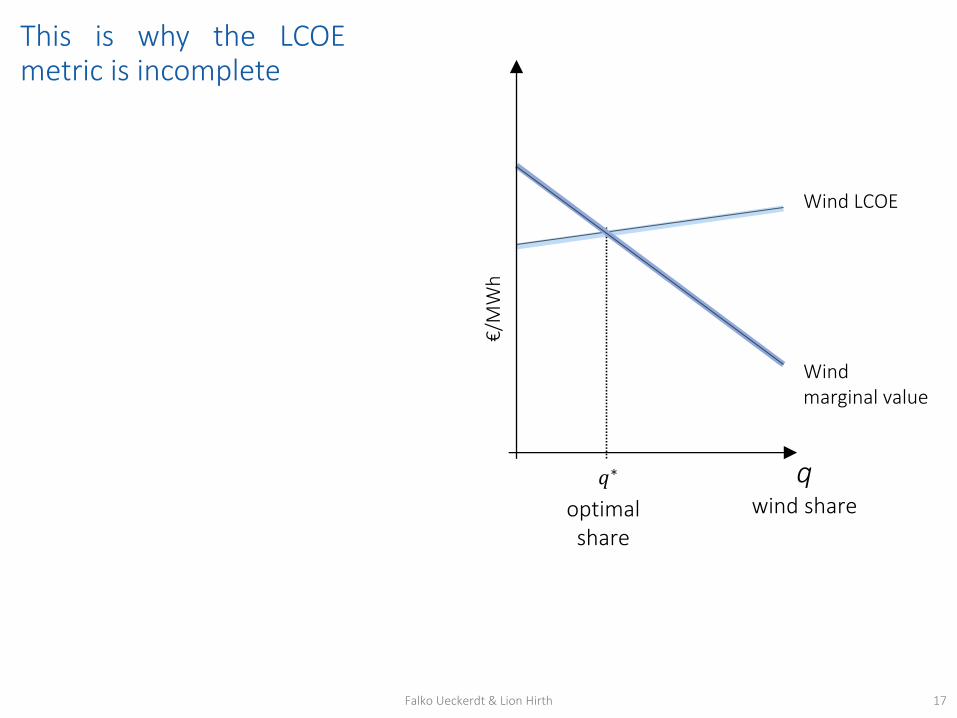
Implications for the optimal and cost-competitive market share
Cost and value determine deployment
• Optimal deployment (wind share) is determined by the intersection of marginal long-term cost (LCOE) and marginal economic value
• (This is a static perspective)
qwind share
Wind LCOE
𝑞∗
optimalshare
€/M
Wh
Wind marginal economic value
Averageelectricity price

Falko Ueckerdt & Lion Hirth 15
Defining system integration costs from a value perspective
Averageelectricity
price
IntegrationCosts
Windmarginal
value
€/M
Wh
qwind share
Integration costs
Wind LCOE
𝑞∗
optimalshare
€/M
Wh
Windmarginal value
Averageelectricity price

Falko Ueckerdt & Lion Hirth 16
Cost perspective
Falko Ueckerdt & Lion Hirth 17
qwind share
Wind LCOE
𝑞∗
optimalshare
€/M
Wh
Windmarginal value
This is why the LCOEmetric is incomplete

Falko Ueckerdt & Lion Hirth 18
This is why the LCOEmetric is incomplete
Peaking plants: high market value
and LCOE
Baseload plants: low market value and LCOE
Wind/solar value depends on variability, system flexibility and share
In long-termequilibrium
qwind share
Wind LCOE
𝑞∗
optimalshare
€/M
Wh
Windmarginal value
• Electricity from one tech has a different value than that produced by another tech
• Comparing LCOE across technologies and expecting them to be equal is misleading
• More theoretically: Technologies produce different economic goods

Falko Ueckerdt & Lion Hirth 19
This is why the LCOEmetric is incomplete
• Electricity from one tech has a different value than that produced by another tech
• Comparing LCOE across technologies and expecting them to be equal is misleading
• More theoretically: Technologies produce different economic goods
Peaking plants: high market value
and LCOE
Baseload plants: low market value and LCOE
• System LCOE = LCOE + integration costs;in equilibrium: techs have equal system LCOE
• System integration costs: the additional coststhat a technology causes on the system level(compared to a benchmark technology)
• Link to value: market value is the reduction in total costs when adding a unit of a tech
If “you” insist on comparing with a single metric: “System LCOE”
In long-termequilibrium
In long-termequilibrium
System integration costs
Wind/solar value depends on variability, system flexibility and share

Falko Ueckerdt & Lion Hirth 20
qwind share
WindSystem LCOE
Wind LCOE
𝑞∗
optimalshare
€/M
Wh
Averageelectricity price
Optimal deployment (e.g. wind share) is determined by the intersection of system LCOE and average electricity price
Integration costs

Falko Ueckerdt & Lion Hirth 22
Cost perspective Value perspective
qwind share
Wind LCOE
𝑞∗
optimalshare
€/M
Wh
Windmarginal value
Averageelectricity price
qwind share
WindSystem LCOE
Wind LCOE
𝑞∗
optimalshare
€/M
Wh
Averageelectricity price
Two perspectives on integration costs and optimality are equivalent
Integration costs
Integration costs

Falko Ueckerdt & Lion Hirth 23
Profile cost

Falko Ueckerdt & Lion Hirth 24
A thought experiment
Compare two power systems
• “No RE system”: little wind and solar, optimal thermal mix
• “40% RE system”: a lot of wind and solar, optimal thermal mix (more mid, peak load)
• Otherwise identical (country-size system, same load level and pattern, copperplate, electrical island, no storage, inflexible demand)
Thermal utilization differs
• Without RE, utilization of thermal generators averages round 70%
• With 40% wind and solar, utilization of thermal generators is around 45%
• As a consequence, the “levelized” capital cost per MWhthermal is higher (even though the thermal mix shifts towards less CAPEX-intensive technologies)

Falko Ueckerdt & Lion Hirth 25
Reduced utilization of residual power plants
Residual load duration curves
With increasing RE shares, the other power plants are utilized less.
Updated from Hirth et al. (2015): Integration costs revisited
Decreased utilization
Lower utilization implies higher per-MWh capital costs (€/MWhthermal). This is the “utilization effect“.
Source: updated from Hirth et al. (2015): Integration costs revisited

Falko Ueckerdt & Lion Hirth 26
Profile costs
“Profile costs” are the results of the time pattern of RE generation (“profile”)
• Excludes: costs that are a result of grids or uncertainty
Thermal utilization effect
• See above
• Increases the levelized capital cost of thermal generation (per MWhthermal)
Renewables utilization effect
• Curtailment as a consequence of oversupply (remember: no network constraints)
• Increases the levelized capital cost of renewable generation (per MWhRE)
Flexibility effect
• Ramping and cycling of thermal plants (start-up costs)
• But: shifting the mix towards mid/peak load reduces start-up costs

Falko Ueckerdt & Lion Hirth 27
Cost components

Falko Ueckerdt & Lion Hirth 28
Electricity is a heterogeneous good along 3 dimensions
Storage(Storing electricity is costly)
Transmission(Transporting elec. is costly)
Flexibility (Ramping & cycling is costly)
Electromagnetic energy
Kirchhoff‘s laws Frequency stability
Arbitrage constraint
Physics
Time(Price differs btw hours)
Space(Price differs btw locations)
Lead-time(Btw contract & delivery)
Dimension of heterogeneity
(Uniform) wholesale markets
LMP / zonal wholesale mrkts
Real-time / balancing markets
Electricity markets

Falko Ueckerdt & Lion Hirth 29
Wind does not always blow
Good sites are distant from load centers
“Variable“ renewable energy source (VRE)
Wind and sun: “intermittent” or “variable” sources
1 3
Difficult to predict
2

Falko Ueckerdt & Lion Hirth 30
Three properties of renewables and of electricity
Output is fluctuatingBound to certain
locationsWind/solar
property
Time(price differs between hours)
Space(price differs btw locations)
Electricity heterogeneity
“Costs” due to properties
+ +
“Profile costs“ “Grid costs“(“shaping costs“) (“locational / infrastructure costs“)
It is the interaction of VRE variability and price heterogeneity that is costly
1 2
Forecast errors
Lead-time(prices differs w.r.t. to lead-time
btw contract & delivery)
+
“Balancing costs“(“imbalance costs“)
3

Falko Ueckerdt & Lion Hirth 31
The market value of wind energy
€/MWh
Averageelectricity
price
Profilecosts
Balancingcosts
Gridcosts
Windmarginal economic
value
Effect of timing Effect of
forecast errors
Effect of location
1
3Value gap or system integration costs
2

Falko Ueckerdt & Lion Hirth 32
€/MWh
Averageelectricity
price
ProfileCosts
BalancingCosts
Grid-relatedCosts
Windmarginal economic
value
System integration
costs
€/MWh
Wind’sLCOE
ProfileCosts
BalancingCosts
Grid-relatedCosts
Wind’sSystemLCOE
In the long-term optimum, two equivalent optimality conditions hold:(1) Marginal economic value = LCOE
(2) Average Electricity Price = System LCOE
Effect of timing Effect of
forecast errors Effect of
location
Value gap and system integration costs

Falko Ueckerdt & Lion Hirth 33
Quantification (for VRE)

Falko Ueckerdt & Lion Hirth 34
Profile costs Balancing costs
• 2-13 €/MWh wind(at 15-40% wind,)
• Scarce and partly inconclusive data
Grid costsin €/MWh Wind
Literature review for wind from 2015
• Integration costs increase with VRE and can become high (~30€/MWh VRE at 40% wind)
• Profile costs are the largest cost component (at high shares in thermal power systems)

Scholz, Y., Gils, H.C., Pietzcker, R. (2016): "Application of a high-detail energy system model to derive power sector characteristics at high wind and solar shares". Energy Economics. 10.1016/j.eneco.2016.06.021
REMix model(German Aerospace Centre, DLR)
• Minimizes total system costs
• Linear optimization of hourly dispatch and investment (based on annuities)
• Represents Europe in 15 regions
• Endogenous DC transmission grid and storage (redox flow battery, pumped hydro and hydrogen storage)
Model estimation (REMix/DLR for Europe) (2016)

Integration costs with large grids and storage(€/MWh VRE, marginal )
mainly solar20:80
mainly wind80:20
Wind/solar50:50
1. Profile costsReducedutilization
Curtailment
2. Grid costs
Scholz, Y., Gils, H.C., Pietzcker, R. (2016): "Application of a high-detail energy system model to derive power sector characteristics at high wind and solar shares". Energy Economics. 10.1016/j.eneco.2016.06.021
Storage costs
Previous rangefor wind
Model estimation (REMix/DLR for Europe) (2016)

Falko Ueckerdt & Lion Hirth 37
2021: literature review
Heptonstall, P., Gross, R. (2021): "A systematic review of the costs and impacts of integrating variable renewables into power grids". Nature energy. https://doi.org/10.1038/s41560-020-00695-4

Falko Ueckerdt & Lion Hirth 38
“Coal lock-in as in IEA-NPS“ (quasi BROWNFIELD)(exogenous 421 GW coal, WEO, NPS) Optimal PV share ~0-20%(without: batteries, AC, DSM, CO2 price)
„Optimized expansion“ (quasi GREENFIELD)(endogenous 300-400GW coal) Optimal PV share ~0-20%(without: batteries, AC, DSM, CO2 price)
+ „Future AC demand profile“ (no flexibility) Optimal PV share ~10-23%(without: batteries, DSM, CO2 price)
+ Pricing externalities (50$/tCO2) Optimal PV share ~30-40%(without batteries, DSM)
+ Batteries, 2020 costs 188$/kWh (market deployment) Optimal PV share ~40-50%(without DSM)
+ Batteries, future costs 94$/kWh (market deployment) Optimal PV share >50%(without DSM, without electrification)
Source: PIK analysis (2019) by Murtaza Ershad, Robert Pietzcker, Falko Ueckerdt
DIETER Model (investment and economic dispatch)•Calibrated to India, exogenous wind generation 11%•No grids (copper plate assumption)•Hourly resolution
PVLCOErange
India 2040, Solar PV market value
The impact of CO2 pricing and battery storage
CO2 prices increase prices and market
values of low-carbon generators
Battery storage(India has a good seasonal
matching of solar and demand)

Falko Ueckerdt & Lion Hirth 39
Finally, considering electrification (direct and indirect)further decreases integration cost
Ruhnau, Oliver (2021) : How flexible electricity demand stabilizes
wind and solar market values: the case of hydrogen electrolyzers,
ZBW - Leibniz Information Centre for Economics, Kiel, Hamburg
Ueckerdt F, Dargaville R, Gils H-C, et al (2019) Australia’s power
advantage. Energy transition and hydrogen export scenarios

Falko Ueckerdt & Lion Hirth 40
The details: further readings
System LCOE Market value Integration cost Wind not coal
Thank you for your attention!