system: effects of motion on performance in the combat · pdf file ·...
TRANSCRIPT

0 orU.S. Army Research Institute
for the Behavioral and Social Sciences
Research Report 1504
< Target Acquisition and Analysis TrainingSystem: Effects of Motion on
Performance in the Combat VehicleIdentification (CVI) Training Program
Norman D. Smith, Otto H. Heuckeroth, and Gary L. ShopeU.S. Army Research Institute
William L. Warnick and Stephen S. EssigCanyon Research Group
DTICELECTE
APR2 0 1989
S~HDDecember 1988
.j. 2;'.'ATEMENT A
I ".: ... " "- c r . e I
-- --- ==- ,, ..ini ramm i inrollInlln nn nln
U.S. ARMY RESEARCH INSTITUTE
FOR THE BEHAVIORAL AND SOCIAL SCIENCES
A Field Operating Agency Under the Jurisdiction
of the Deputy Chief of Staff for Personnel
EDGAR M. JOHNSON JON W. BLADESTechnical Director COL, IN
Commanding
Technical review by
Barbara A. BlackGary G. Sarli
NOTICES
pI RI TIO Pr' d butio ti rt has P Pacr q~. s
FINAL DISPOSITION: This report may be destroyed when it is no longer needed. Please donot return it to the U.S. Army Research Institute for the Behavioral and Social Sciences.
NOTE: The findings in this report are not to be construed as an official Department of theArmy position, unless so designated by other authorized documents.

UNCLASSIFIEDSECURITY CLASSIFICATION OF THIS PAGE Ate2o70/_
I I Form ApprovedREPORT DOCUMENTATION PAGE 0M8 No. 0704-0188
Ia. REPORT SECURITY CLASSIFICATION lb. RESTRICTIVE MARKINGSUnclassified I
2a. SECURITY CLASSIFICATION AUTHORITYi 3. DISTRIBUTION /AVAILABILITY OF REPORTApproved for-public release;
2b. DECLASSIFICATION /DOWNGRADING SCHEDULE distribution unlimited.
4. PERFORMING ORGANIZATION REPORT NUMBER(S) 5. MONITORING ORGANIZATION REPORT NUMBER(S)
ARI Research Report 1504
6a. NAME OF PERFORMING ORGANIZATION 16b. OFFICE SYMBOL 7a. NAME OF MONIrORING ORGANIZATION(if applicable) U.S. Army Research Institute
U.S. Army Research Institute PERI-SH for the Behavioral and Social Sciences
6c. ADDRESS (City, State, and ZIPCode) 7b. ADDRESS (City, State, and ZIP Code)HQ TEXCOMFort Hood, TX 76544-5065 5001 Eisenhower Avenue
Alexandria, VA 22333-5600
8a. NAME OF FUNOING/SPONSORING 8b. OFFiCE SYMBOL 9. PROCUREMENT INSTRUMENT IDENTIFiCATION NUMBERORGANIZATION (If applicable)
8c. ADDRESS(City, State, and ZIP Code) 10. SOURCE OF FUNDING NUMBERS
PROGRAM PROJECT TASK WORK UNITELEMENT NO. NO. NO. ACCESSION NO.
63743 794 1.5.1 H.1
11. TITLE (Include Security Classification)Target Acquisition and Analysis Training System: Effects of Motion on Performance in the
Combat Vehicle Identification (CVI) Training Program
12. PERSONAL AUTHOR(S) Smith, Norman D., Heuckeroth, Otto H., Shope, Gary L. (ARI), Warnick,
Wlliam L., and Essig, Stephen S. (Canyon Research Group)
PJa. TYPE OF REPORT 13b. TIME COVERED 114 DATE OF REPORT (Year, Month',Day) 115. PAGE COUNTFinal FROM 82/10 TO 83/09 1988, December 51
16. SUPPLEMENTARY NOTATION
17. COSATI CODES ( 18. SUBJECT TERMS (Continue on reverse if necessary and identify by block numberl,
FIELD 1 GROUP SUB-GRO P4 Vehicle recognition., RetenLion) -
____________Vehicle identification Training)
Movement) Target acquisition. [')(Coned)
19. ABSTRACT (Continue on reverse if necessary and identify by block number)
- The purpose of this research was to determine (i) whether introducing motion into the
Basic Combat Vehicle Identification (CVI) Training Program produces improved performance
following initial and repeated training; (2) whether motion facilitates learning by soldiers
who were not training responsive (NTR) in acquiring recognition and identification (R&I)
skills, compared to soldiers who were training responsive (TR); and (3) whether motion helps
soldiers retain recognition and identification materials over an 18-hour period.
Soldiers from the 1st and 3rd Brigades of the 85th Army Reserve Division (Tng) [One
Station Unit Training], Arlington Heights, Illinois, received R&I training. Each soldier
received three training sessions with three modules from the CVI program with one of four
types of motion: (1) rotational, (2) circular, (3) straightline, and (4) static (no
motion). Useable data were obtained from 71 soldiers.(Continued)
20. DISTRIBUTION/AVAILABILITY OF ABSTRACT 21. ABSTRACT SECURITY CLASSIFICATION
C UNCLASSIFIED/UNLIMITED L SAME AS RPT. 0 OTIC USERS Unclassified
22a. NAME OF RESPONSIBLE INDIVIDUAL 22b. TELEPHONE (Include Area Code) i 22c. OFFICE SYMBOL
Norman D. Smith (817) 738-1316 1 PERI-SH
DD Form 1473, JUN 86 Previous editions are obsolete. SECURITY CLASSIFICATION OF THIS PAGE
UNCLASSIFIED
II II1 I I1 1 1 l llll llA

UNCLASSIFIED
SECURITY CLASSIFICATION OF THIS PAGE(Whamt Date Entered)
ARI RR 1504
18. SUBJECT TERMS (Continued)
Recognition IdentificationMotion Massed training
19. ABSTRACT (Continued)
,Major conclusions drawn from analyses of these data include the following:
" Motion (after repeated training) provides a small positive effect butdoes not appear to be an essential ingredient in learning ground-to-ground vehicle R&I using the Basic CVI Training Program. This is truefor both training responsive and nontraining responsive soldiers.
" Short term retention of learned R&I skills is not improved when motionis included in the training. i:-
I
Accesion For
14 T'Ui &
Distribution "A" -11
ARI3GR&
Per: Norman D. Smith" I
!JNflL-S STIED
SECURITY CLASSIFICATION OF THIS PAGE'Whief Data Enteed)
ii

Research Report 1504
Target Acquisition and Analysis Training System:Effects of Motion on Performance in the Combat
Vehicle Identification (CVI) Training Program
Norman D. Smith, Otto H. Heuckeroth, and Gary L. ShopeU.S. Army Research Institute
William L. Warnick and Stephen S. EssigCanyon Research Group
ARI Field Unit at Fort Hood, TexasGeorge M. Gividen, Chief
Systems Research LaboratoryRobin L. Keesee, Director
U.S. Army Research Institute for the Behavioral and Social Sciences5001 Eisenhower Avenue, Alexandria, Virginia 22333-5600
Office, Deputy Chief of Staff for PersonnelDepartment of the Army
December 1988
Army Project Number Education and Training2Q263743A794
iii

FOREVORD
The Fort Hood Field Unit of the U.S. Army Research Institute (ARI) hasdeveloped a series of target recognition and identification (R&I) trainingprograms and conducted related research as part of the research titled TargetAcquisition and Analysis Training System (TAATS). Both Training and DoctrineCommand (TRADOC) and Forces Command (FORSCOH) recognized the need forstandardized R&I training and requested that ARI develop such programs. Thiswork was performed for the Combined Arms Center (CAC), Fort Leavenworth,Kansas.
This research report examines whether R&I performance is enhanced byusing moving target vehicle images (video tape) during Combat VehicleIdentification (CVI) training rather than static target vehicle images. Itevaluates both the amount of material learned and the retention over time ofthis material. Inasmuch as R&I training done in the Army with the Basic CVIProgram uses static target vehicle images (35mm slides), and training withmotion uses video, the results have cost and training implications.Specifically, CVI training with moving (videotaped) images is projected to bemore costly than training with static 35mm slide images.
These results were briefed on 19 October 1984, to LTC Harold Fritz,proponent for vehicle identification, and copies were provided to CAC, FortLeavenworth.
EDGAR M. JOHNS NTechnical Director
v

TARGET ACQUISITION AND ANALYSIS TRAINING SYSTEM: EFFECTS OF MOTION ONPERFORMANCE IN THE COMBAT VEHICLE IDENTIFICATION (CVI) TRAINING PROGRAM
EXECUTIVE SUMMARY
Requirement:
The Target Acquisition and Analysis Training System (TAATS) researchprogram was established to provide a framework for development of logicallyrelated training programs. The impetus for such a system was provided by aseries of Human Resources Needs (HRN) requests dating from 1975 from bothTraining and Doctrine Command (TRADOC) and Force Command (FORSCOM). In 1980an integrated series of training programs was planned in conjunction with theArmy's proponent for vehicle recognition at the Combined Arms Center (CAC),Fort Leavenworth, Kansas. The first of the training programs was the BasicCombat Vehicle Identification (CVI) Training Program, produced in 1981 andadopted the same year by the Army as its standardized recognition andidentification (R&I) training program (GTA 17-2-9).
Some researchers thought that motion would be an important addition toCVI training programs. These advocates felt that motion would add realism,increase soldier motivation to learn, and provide cues about the vehicles thatwould facilitate learning. The purpose of this research is to first explorethe validity of the belief that using vehicles in motion (video tape) in theBasic CVI Training Program would improve performance over that achieved withstatic vehicles; and second, to determine whether motion differentiallyaffects training responsive and non-training responsive performers.
Procedure:
Data from the 85th Army Reserve Division (Tng), Arlington Heights,Illinois, were used to evaluate the effects of motion on performanceimmediately after repeated training and again, 18 hours after training.Soldiers (R-=120) were assigned to one of four conditions: circular motion,rotational motion, straightline motion, or static (no motion). The trainingmedium was videotape. Soldiers in each condition were pretested and thentrained on three modules comprising a total of 15 vehicles from the Basic CVITraining Program. Three training iterations were given to each condition.The first and last iteration were followed by a videotape test appropriate tothe type of motion used.
Findings:
Groups presented with vehicles in motion learned the vehicles no betterafter one training session than groups trained on static vehicles. Afterthree training sessions, all groups showed further improvement. However, therotational group improved most, while the static group improved least. Motiondid not contribute to improved performance in retention over an 18-hour period
vii

when compared with that achieved with static targets. When soldiers weredivided into training responsive (TR) and non-training responsive (NTR) groupsbased on their performance on the first post-training test, motion did notdifferentially improve performance by the NTR group when compared with the TRgroup.
Conclusions:
* Motion (after repeated training) provides a small positive effectbut does not appear to be an essential ingredient in learningground-to-ground vehicle R&I using the Basic CVI Training Program.This is true for both training responsive and non-trainingresponsive soldiers.
" Short term retention of learned R&I skills is not improved whenmotion is included in the training.
Utilization of Findings:
Motion is not a key requisite to improving performance in R&I. Thisinformation will be used in cost-benefit analyses of future trainingconsiderations.
viii

TARGET ACQUISITION AND ANALYSIS TRAINING SYSTEM: EFFECTS OF MOTION ONPERFORMANCE IN THE COMBAT VEHICLE IDENTIFICATION (CVI) TRAINING PROGRAM
CONTENTS
Page
INTRODUCTION .. ........... .................... 1
Background. ............. .................. 1Military Problem. ............ ................ 1Purpose and Scope of This Report .. ................... 2
METHOD .. ............ ...................... 3
General Description .. ........... ............... 3Personnel .. ............. .................. 3Procedure .. .............................. 4Collection and Presentation Materials. ... ... ........ 5Data Analysis .. ............ ................. 6Development of Training Responsiveness Concept. ............. 6
RESULTS. ............. ..................... 7
Effects of Motion During Training. .. .................. 7Motion and Training Responsiveness .. .................. 8Effects of Motion on R&I Performance With Individual Vehicles .... 10Effect of Motion on Retention .. ........... ......... 13Soldier Reaction Questionnaire. ............ ........ 13Characteristics of TR and NTR Soldiers. ............. ... 13
DISCUSSION AND CONCLUSIONS .. ............ ........... 17
Discussion .. ........................ ..... 17Conclusions. .. ........................ .... 18
REFERENCES. .. ....................... ....... 19
APPENDIX A. LIST OF VEHICLES USED IN TRAINING. .. ............ A-1
B. DATA COLLECTION INSTRUMENTS ... ................ B-1
C. SOLDIER REACTION QUESTIONNAIRE .. .............. C-1
D. SOURCES OF VARIANCE FOR ALL ANOVAs. ............... D- 1
E. MEANS, STANDARD DEVIATIONS, AND DUNCAN MULTIPLERANGE TEST ANALYSIS FOR VEHICLES .. ............. E-1
F. CHI-SQUARE ANALYSES OF TR AND NTR GROUPS..... .. .o. ....-
ix

CONTENTS (Continued)
Page
LIST OF TABLES
Table 1. Mean GT score for each motion group ...... ............. 4
2. Data collection schedule ......... ................... 5
3. Means and standard deviations of number of imagesidentified for each motion group on test 2 and test 3 . . . . 8
4. Means and standard deviations of number of vehicleimages identified for each motion and trainingresponsiveness group after one and threetraining sessions ........ ...................... ... 11
5. Soldier reaction questionnaire responses .. ........... ... 14
6. Use of the w2 statistic to estimate the proportion ofvariance accounted for by each ANOVA effect usingposttest data obtained following the third trainingsession ........... ........................... ... 17
LIST OF FIGURES
Figure 1. Mean number of vehicle images identified onpretraining test and posttraining tests (T2 and T3)by motion group after two additional trainingtrials ............. ........................... 9
2. Mean number of vehicle images identified onpretraining test and posttraining tests (T2 and T3)by motion and training responsiveness group(TR and NTR) ......... ........................ ... 12
x

TARGET ACQUISITION AND ANALYSIS TRAINING SYSTEM: EFFECTS OF MOTION ONPERFORMANCE IN THE COMBAT VEHICLE IDENTIFICATION (CVI) TRAINING PROGRAM
INTRODUCTION
Background
In 1980, the Target Acquisition and Analysis Training System (TAATS), apart of the research program at the Army Research Institute's Field Unit, FortHood, Texas, was established. The major objective of TAATS was to provide aframework within which to do research and develop interrelated targetacquisition training programs. Five have been developed, tested and turnedover to the Army. They are the Basic Combat Vehicle Identification (CVI)Training Program, the Basic Thermal Combat Vehicle Identification (TCVI)Training Program, the Aovanced Combat Vehicle Identification Training Program,the Flash Card Program, and the Combat Vehicle Identification Training Programfor the Remotely Piloted Vehicle (RPV).1 Three programs, the CVI, TCVI, andFlash Cards have been adopted and issued by the Army as standard training forvehicle identification designated as GTA 17-2-9, GTA 17-2-10, and GTA 17-2-11,respectively. The Advanced CVI program awaits issue by the Army. The RPVprogram was used to train RPV operators for Operational Test (OT) II in June1984.
Military Problem
Some trainers believed that if motion were to be added to CVI trainingprograms which use imagery, performance would be substantially improved.Certainly, motion does add realism to the extent that moving vehicles arefrequently confronted and this may have a motivating effect on performance.There is no question that movement generally attracts attention. Researchfindings in the vehicle visual detection area (Smith, W.M., 1951; Gottsdanker,R.M., 1957; Miller, J.W., 1960; and Gutmann, J.C. et al., 1979) concludedthat targets were usually more likely ,o be detected when in motion than whenstatic and greatest detection occurred as the target shifted from a static tomotion state when other factors such as target shape and size, contrast,clutter, etc., were held constant.
However, the objective of the CVI training programs is to teach recognitionand identification (R&I)2 , not detection. Merrill and Bunderson (1981, pg. 4)point out that "motion is necessary only if movement is a critical attributerequired for proper discrimination." The central research question here iswhether vehicle targets in motion result in better discrimination and thussignificantly better soldier performance on R&I than do static vehicle targetsunder similar environmental conditions. If motion is not required in trainingto achieve improved R&I performance, costs of training materials, production,and playback systems will probably be substantially less.
1A citation for the technical or research report on each of the training
programs is in the Reference Section.
2Detection is defined as being aware of the presence of a man-made object inthe field of view; recognition is being able to call the object a friend orthreat; identification is being able to give the name or number if the objectis a vehicle or aircraft.
1

Purpose and Scope of This Report
The major objectiver of this research were to determine (1) whetherintroduction of motion Into the Basic CVI Training Program produced betterperformance following initial and repeated training; (2) whether motion mightfacilitate learning by those soldiers who demonstrate difficulty in acquiringR&I skills; and (3) whether motion might affect retention of R&I materialsafter 18 hours.
2

METHOD
General Description
Four groups comprised of 30 soldiers each were employed. All groups weretrained on (videotaped) modules 3 thru 5 (for a total of 15 vehicles) of theArmy's Basic CVI Training Program (GTA 17-2-9). Each group was trained on oneof four conditions: a) video rotation, b) circular motion, c) straight linemotion, and d) standard static CVI images. The conditions indicated by thesegroup designations will be explained below.
In the video rotation group, vehicles were rotated about the center oftheir axes, completing a 1800 rotation in 7.5 seconds. The view obtained wasfrom one full side to the other full side view. Both clockwise (CW) andcounterclockwise (CCW) rotation were employed. Training was conducted showingeach vehicle for a 15 second period utilizing both the CCW and CW rotations.
3
Testing was accomplished using the CW and CCW rotations separately. In theposttraining test where the standard CVI slide sequence called for a frontview, the vehicle was presented CW; where an oblique view wab to be presented,the vehicle was shown CCW.
In the circular motion group, vehicles traveled through a 1800 circularpath in a 15 second period for the training imagery. The vehicle was seen fromone full side to the other full side. Both CW and CCW movements were employed.Scaled ground speed was 8 mph. Test imagery was the same except that thevehicles traversed a 1800 arc in 7.5 seconds. In order to keep the groundspeed at constant 8 mph, the diameter of the arc traversed was one-half thatemployed in the training imagery and the speed was doubled.
For the straight line motion group, training imagery consisted of 15 secondsequences with the vehicles following straight paths. Five paths wereutilized. These paralleled the views seen in the standard CVI program, i.e.,left side, left oblique, front, right oblique and right side. The test imageryconsisted of 7.5 second views edited out of the 15 second views used fortraining.
In the fourth group the standard CVI reproduced on video tape was used,i.e., static images. No new imagery was required.
Personnel
To conduct the research, 160 soldiers were requested--40 for each of thefour groups. For various reasons only 120 soldiers were ultimately madeavailable, thus reducing each group size to 30. Data from 71 soldiers met thetwo criteria for inclusion; 1) they were present for all training sessionsand tests, and 2) they responded on all test answer sheets. Final group sizeswere: Rotational 16, Circular 19, Straightline 15, and Static 21.
31t is important to not that exposure time to each vehicle was held constantacross all motion conditions--during training and testing.
3

Personnel trained were from the 1st and 3rd Brigades of the 85th ArmyReserve Division (Tng) [One Station Unit Training (OSUT) 19E/19D], ArlingtonHeights, Illinois. In view of the large number of soldiers who failed toqualify for inclusion in subsequent analyses, it seemed prudent to examine theremaining population for potential biases.
Previous research within TAATS (Shope, et al. 1984; Smith, et al. 1986)has pointed to the probable role of GT on R&I performance. It was, therefore,judged appropriate to verify that the useable data from the final four traininggroups were comparable on this factor. Results of an analysis of variance ofGT score for the four motion groups indicated no significant differences[F(3,66) -.30, y -.82]. Means and standard deviations to support this analysisare found in Table 1.
Table 1
Mean GT Score for Each Motion Groupa
Group n M SD
Rotational 15 109.20 20.45Circular 19 105.89 18.63Straight line 15 110.87 13.34Static 21 110.38 16.85
a GT information was unavailable for one person in Rotational group.
Procedure
Personnel were randomly assigned to seats but were asked to take the sameseat for all subsequent training and testing in order to maintain image sizeconstancy.
To insure that the three repeated training sessions could be completed inthe time available following extensive orientation for the soldiers on thefirst day, tests after all but the first and last training sessions wereomitted.
During training and testing soldiers were required to make a writtenresponse on prepared answer sheets each time a vehicle was projected. They hadfirst to make a recognition response--F for friend, T for threat or DK (?)for "don't know." This was followed by an identification response in which thename or number of the vehicle was stated, or a DK (?) response if it could not
4

be identified. For example, if a Soviet T-62 were projected, the soldiershould immediately write T for threat and follow it with T-62. Three modulesdealing with five vehicles each were used.
In Sections A and B of each module each vehicle was presented five timesfor a total of 50 presentations; in section C, the Module Test, threepresentations of each vehicle were shown. In the pretraining test (Test 1),static images consisting of five views of the 15 vehicles for a total of 75responses were used. The posttraining tests (Tests 2, 3, and 4) consisted ofthe same number of views and vehicles as the pretraining test but using themotion on which training took place. A listing of the vehicles can be foundin Appendix A.
On the morning of the second day time was allotted to test retention of theprevious days knowledge after a lapsed time of 18 hours.
The data collection schedule is presented in Table 2.
Table 2
Data Collection Schedule
Motion Group Testing/Training Schedule
Circular Test I Tng Test 2 Tng Tng Test 3 18 hours Test 4Pre-Tng LapsedTest Time
Rotational .Static ...
Straight line
A detailed description of The Basic CVI Training Program procedure and
instructions are found in GTA 17-2-9.
Collection and Presentation Materials
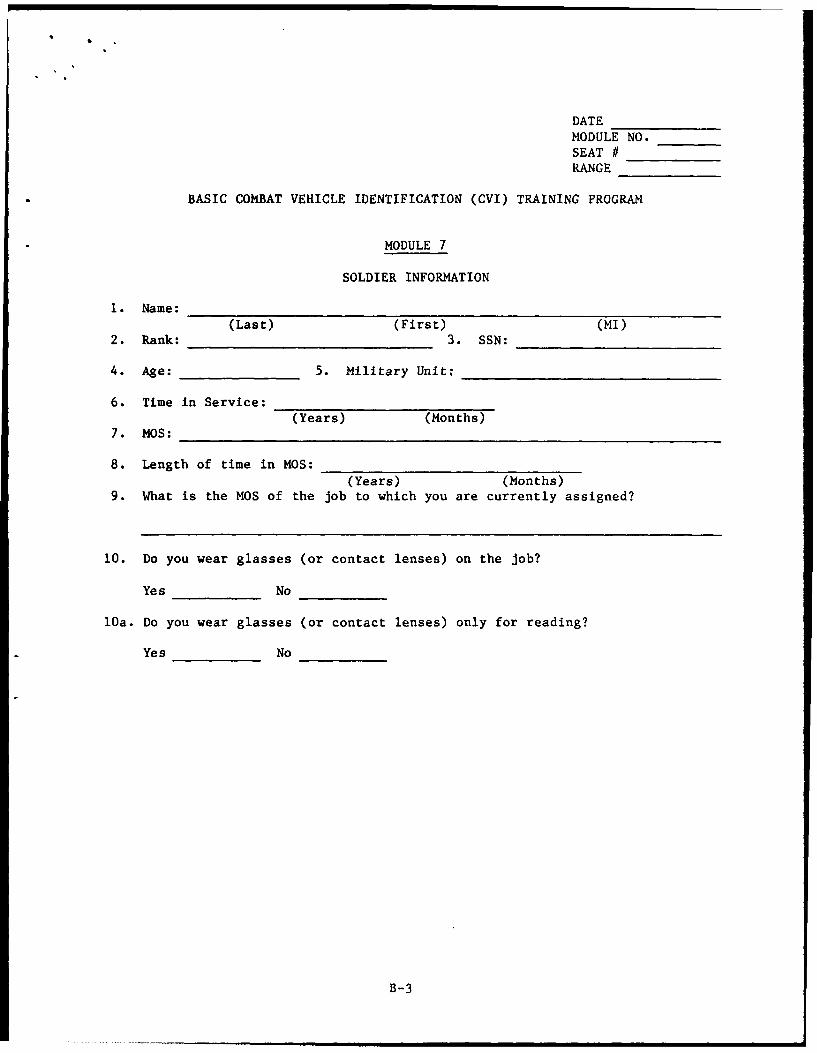
A training response form was required for each module. These formsprovided for responses for three presentations of five vehicles for each of thethree module sections (A, B and C). In addition, the pretraining andposttraining tests required a form providing for responses to fivepresentations of each of the 15 vehicles. (See Appendix B)
A Soldier Reaction Questionnaire composed of 10 items was administered atthe end of the research. (See Appendix C)
5

Five 3/4" videotape players and five 19" monitors were supplied by the 85thDivision. Classrooms that would provide each of 30 soldiers with deskarmchairs were used.
Data Analysis
In order to address study objectives several analyseb of variance wereperformed and, where appropriate, Duncan Multiple Range Tests. These statisticalanalyses were interpreted by use of tables and figures showing mean number ofimages identified.
Previous research (see references) with two dependent variables--vehicleimages (slides) recognized and vehicle images (slides) identified--has reliablyshown that the former is a relatively unstable measure of performance and aless sensitive measure for assessing treatment design differences. This is dueprimarily to the 50/50 probability of being correct if one guesses, and theconsistent disregard by soldiers of the instructions which attempt todiscourage guessing. For those reasons, only the number of images correctlyidentified was used as the dependent variable in this research.
Development of Training Responsiveness Concept
Research conducted within the TAATS program has focused primarily on testevaluation of prototype training. In these evaluations repeated training wasnot given and evaluations were based on pretraining test-postraining testcomparisons which, though statistically significant, left unanswered questionsof suitable performance criteria, retention, and retraining. Clearly theimpression that R&I is one of the more difficult skills to develop is created.More recently attention has shifted to exploring learning curves for individualsoldiers when repeated training and testing are conducted. This approach hasdemonstrated that although some soldiers are extremely responsive to theprogram, other soldiers, even with repeated training, are not responsive to R&Itraining as currently provided in the CVI program. In order to operationalizethe concept of training responsiveness as a preliminary research tool, soldierswho identified less than 50% of the vehicle images correctly on the firstposttraining test were defined as non-training responsive (NTR) and those whoidentified 50% or more of the images were defined as training responsive (TR)Using this definition in the present research, 27 (38%) soldiers wereconsidered as NTR and 44 (62%) as TR.
4Previous exploratory research (Smith, et al. 1986) involving repeated trainingant' testing indicated that this criterion resulted in significant absoluteper. uance curve differences for training responsiveness groups at eachtraining and test point. The consistency of these differences betweencomparable points on the performance curve for these groups was used as a basisfor inferring that these groups do differ in one or more important dimensionsrelated to R&I training.
6

RESULTS5
Effects of Motion During Training
Pretesting Before Training
Before training began a videotaped pretest (Test 1) using 75 staticvehicle images (5 views for each of 15 vehicles) was given to determine whetherthe knowledge of vehicles differed among soldiers assigned to groups. Ananalysis of variance (ANOVA) using the number of vehicle images identified asthe dependent variable found that no significant differences existed [F (3,882)< 1, y >.05]. Performance in this initial test was near zero, the means for thegroups were as follows: circular, .55; rotational, .46; static, .70; andstraightline, 1.03.
Initial Training. An ANOVA was completed on the identificationperformance data (number of vehicle images correctly identified) on the firstposttraining test (Test 2) to determine whether or not any of the motionconditions used led to training performance differences early in learning.Results of that analysis indicated that while absolute performance of thestatic group was lower than for each of the other motion conditions, nosignificant differences among the groups were found [1(3,63) = 1.79, T - .16].Means and standard deviations for each group on this test are found in Table 3.
Repeated Training. While performance differences among the four groupscould not be detected following an initial training session, it is neverthelessrelevant to ask whether motion conditions used show the same pattern oftraining effectiveness with repeated training. The plan was to give as manytraining periods as time allowed (rest periods intervening between each) duringa single work day of 8 hours. Bad weather delayed the start and foreshortenedthe duration so that a total of only three training periods was possible. AnANOVA was performed with identification performance data following the firstand last training session to address this question. Results of that analysisindicated that while all groups showed improvement from Test 2 to Test 3 afterrepeated training, the rotational group was responsible for the greatestimprovement. This accounts for the significant group by test interaction[E(3,63) - 5.05, y <.01]. Means and standard deviations to support thisanalysis are also presented in Table 3 and graphically depicted in Figure 1.Inspection of these data suggests that with repeated training, rotationalmotion of vehicles results in substantially greater improvement in performancecompared to other motion conditions (including the static no-motion group).
Finally, a separate ANOVA of only Test 3 identification performance datawas performed. It indicated significant differences among the groups [F(3,63)- 5.77, y <.011. A Duncan Multiple Range Test for these means indicated thatwhile differences existed among non-static motion conditions, performance inthe Static condition was significantly lower than for all other motionconditions (y <.05). Complete results of this test are summarized in Table 3.
5A summary of the sources of variance for all ANOVAs is found at Appendix D.
7

Table 3
Means and Standard reviations of Number of Images Identified for Each MotionGroup on Test 2 and Test 3
TestsTest 2 Test 3a
Motion Group n M SD M SD
Circular 19 46.21 17.42 58 .1 1a 19.88
Rotational 16 42.81 19.02 65.31b 9.22
Static 21 36.81 21.26 5 0 .7 1c 21.11
Straightline 15 51.00 21.04 6 3 .6 0ab 12.84
Total possible score = 75
aMeans with the same superscript on Test 3 are not significantly different
(p > .05) according to the results of a Duncan Multiple Range Test; becauseresults reported in the first paragraph of this section (for Test 2) indicateno significant differences among motion conditions, no further testing on meandifferences was statistically appropriate.
Motion and Training Responsiveness
Effects of Motion on Training Responsiveness. As discussed in a previoussection, exploratory analyses of performance data collected in previousresearch determined that the large variance in performance could be accountedfor by particular soldiers who manifest an inability or unwillingness to learnthis material. These findings were further explored in this research. Thedivision of the sample population was made empirically after examination of thedata--all soldiers who scored 50% or more correctly on the first posttrainingtest were labeled training receptive (TR) and those below 50% as non-trainingreceptive (NTR).
To first determine whether there was an overall performance differencebetween the TR and NTR groups for each of the four motion conditions, an ANOVAof their identification performance scores (number of vehicle imagesidentified) after three training periods was done. Results of that analysisindicated no overall differences existed [F(3,63) = 2.01, _ >.051.
8

70 +7+ - Static
S - Straightline65 +
• ..... Circ4ar
S _....- Rotational Of60 +I //
C I seA 551 I / *
I/ ,.
SI/50 /I / /
D IE / /N 45 + / *
1 /
oI ! I
E I '/D
35 + /*
Pretest I TeIs 2 Test 3
POSTTEST-
Figure 1. Mean Number of Vehicle Images Identified on Pretraining Test and
Posttraining Tests (T2, T3 ) by Motion Group After Two AdditionalTraining Trials
9

Effects of Motion and Repeated Training on Training Responsiveness. AsJust noted, there were no overall significant differences among trainingresponsiveness groups to different motion training conditions. It did seemrelevant however, to ask whether both training responsiveness groups showed thesame pattern of differences to different training conditions after one andthree training sessions. Results of an analysis of variance involving thesethree variables (motion type, training responsiveness group and test period)indicated that indeed significant differences did exist [f(3,63) = 6.18, y<.01]. Table 4 presents supporting means and standard deviations; Figure 2portrays this relationship pictorially. These data show that this significantdifference probably can be attributed to the fact that the NTR soldiers in therotational and straightline motion conditions show large increases inperformance after receiving two additional training sessions. The inferencecan be drawn that if additional training time is available, training withmotion might be useful for soldiers who experience difficulty in acquiring R&Iskills (NTR soldiers).
To investigate further the inference noted above, four additional simpleanalyses of variance were performed. These analyses involved comparison ofperformance to each motion condition for only: 1) TR soldiers after the firsttraining session; 2) TR soldiers after the third training session; 3) NTRsoldiers after the first training session; and 4) NTR soldiers after the thirdtraining session. Analyses for TR soldiers indicated no significantperformance differences among motion conditions [F(3,90) <] following eitherone or three training sessions. For NTR soldiers performance following thefirst training sessions showed no significant performance differences amongmotion conditions 11(3,23) <1]. For the NTR soldiers there were significantperformance differences among motion conditions following the third trainingsession [F(3,23) = 6.50, y<.005]. A Duncan Multiple Range Test for NTR soldierperformance following the third training session revealed that performance tothe Rotational motion condition was superior to all other training conditions(y<.05); no significant differences existed among any remaining trainingconditions for these soldiers.
Effects of Motion on R&l Performance With Individual Vehicles
While different motion conditions did not produce overall significantperformance differences during initial training (as noted above), it wasnevertheless relevant to expect that for some vehicles, motion might facilitatelearning. An ANOVA of number of vehicle images correctly identified on thefirst posttraining test (Test 2), however, indicated no significant difference[F(42,882) - 1.37, _ - .06]. A comparable analysis on the test performanceafter the last training session was, however, significant [.(42,882) - 1.70,< .01]. See Appendix E for means, standard deviations and the Duncan MultipleRange Test analysis.
10

Table 4
Means and Standard Deviations of Number of Vehicle Images Identified for EachMotion and Training Responsiveness Group After One and Three Training Sessions
Motion Training Test 2 Test 3Group Responsiveness n M SD M SD
TR 11 58.27 12.00 71.27 6.18Circular
NTR 8 29.62 5.58 40.00 17.74
TR 10 55.30 9.99 68.90 9.75Rotational
NTR 6 22.00 8.60 59.33 3.93
TR 11 53.64 12.72 68.27 6.23Static
NTR 10 18.30 9.90 31.40 12.47
TR 12 59.33 11.92 68.08 4.06Straightline
NTR 3 17.67 15.31 45.67 20.60
II

70 + Training ResponsiveI -- Static .
---- Straightline65 +
I ..... Circular
I ~ ~ Rotational P60 +
I I.'
55 +
M 50 +
AjE I /S 45+ JI
I :. * / Non-Training ResponsiveD I I /E 40 + I./ *..
NI IT III IF 35+ /
E I . ID I .h:!..*, I30- ... /
+ : .I .. *II .S / I
I i / I/
15 + . /i/
'00'I +
Pretest I Test 2 Test 3
POSTTEST
Figure 2o Mean Number of Vehicle Images Identified on Pretraining Testand Poettraining Tests (T2, T3) by Motion and TrainingResponsiveness Group (TR and NTR)
12igur 2. I eaI Nuabe of VeIcl I aeI I detfe nPeriigTs

Effect of Motion on Retention
The amount of learning which was retained after an eighteen hour lapse oftime was examined by comparing scores received on the test given after the lasttraining session (the last test administered after completion of training onone day) with scores from a test administered eighteen hours later. An ANOVAof number of images identified over these two tests was performed with fourmotion groups, two training responsiveness groups and 15 vehicles included asdesign variables. Results of that analysis indicated no significantdifferences in retention among motion conditions [F(3,63) = 1.23, T > .051 andno significant retention differences as a function of both motion and trainingresponsiveness conditions [F(3,63) - 2.40, S > .05].
Soldier Reaction Questionnaire
The responses to the questions on the Soldier Reaction Questionnaire weregenerally positive. In response to how effective or ineffective the soldiershad found the training, 95% thought circular motion to be either "veryeffective" or "effective," 89% gave Rotational Motion a similar rating,approximately 73% found Straightline Motion training to be either "veryeffective" or "effective," and 68% found static image training to be "veryeffective" or "effective." When asked how this training compared with previouscombat vehicle identification training they had received, approximately 91%indicated it was "much" or "somewhat" better. Frequencies supporting theseconclusions are presented in Table 5.
Characteristics of TR and NTR Soldiers
In order to better understand the dimensions characterizing TR and NTRsoldiers, and in order to assure that the effects of motion conditions andtraining responsiveness were not confounded, a Chi-square analysis of thedistribution of TR/NTR soldiers across motion groups was performed. Results ofthat analysis were non-significant. See Appendix D2. This finding isconsistent with the inference that TR and NTR soldiers were generallydistributed in about the same proportion in each motion treatment. Review ofdata in Appendix D2, Table 1 indicates NTR soldiers were between 21% and 47% ofthe sample in each motion group. To further examine the dimensionscharacterizing TR and NTR soldiers, additional Chi-square analyses wereperformed using the three GT groupings (<90, 90-109, 110 and up) which produceda significant X2 - 13.66, _E < .001 on 2 degrees of freedom (See Appendix F3).Inspection of the table in Appendix F3 suggests that this significantrelationship is due to the disproportionately large number of TR soldiers withCT > 109. Using ranks comprising Skill Level I (pay grades EI-E4) vs higherskill levels (pay grades E5-E8) and time in service arbitrarily grouped byyears, soidiers were found to be proportionately distiibuted in TR and NTRgroups, X - 2.20, y - .65 on 1 degree of freedom, X - 1.34, = .93 on 5degrees of freedom, respectively (See pages F4 and F5).
13

Table S
Soldier Reaction Questionnaire Responses
Responses
z a % n z n 1 n
Very VeryEffective Effective In Ftwan Ineffective Ineftfctlve
How effective/ineffective 14 35.00 15 37.50 9 22.50 2 5.00 0 0.00was the training uwlngstraight line motion foryou?
How effective/ineffective 21 53.85 16 41.03 2 11.43 0 0.00 0 0.00was the training usingcircular motion for you?
Mow effectlve/ineffective 16 45.71 15 42.86 4 11.43 0 0.00 0 O.0was the training usingrotational motion foryou?
How effective/ineffective 7 18.42 19 50.00 10 26.32 2 5.26 0 0.00was the t rainng usingstationary motion foryou?
cont'd
14

Table 5 (continued)
Soldier Reaction Questionnaire REsponses
Responses
Huch Somewhat Somewhat MuchBetter better The Same Uorbe Worse
Compared with other 35 55.56 22 34.93 3 4.76 3 4.76 0 0.00training In vehiclerecognition how wouldyou evaluate the trainingyou have Just received?
Yes No
Are you familiar with 38 55.88 30 44.12the basic CVI TrainingProgram?
Are you familiar with 4 7.27 51 92.73the Thermal TrainingProgram?
Did you participate in 26 38.24 42 bl.77the CVI training givenIn January?
15

DISCUSSION
Discussion
During the development of the CVI program an hypothesis evolved which heldthat if motion were added to training programs using static imagery,performance would be substantially improved. Realism (training fidelity) andmotivational effects caused by increased interest may be part of the reason forthis presumed improvement in performance; however, it seems appropriate to usemovement (motion) only when it is a critical attribute-which facilitatesimproved training performance.
Results of this research have indicated that during initial training,motion does not generally appear to contribute significantly to identificationperformance compared to presentation of static images. While repeated trainingwith motion did result in statistically significant overall performancedifferences compared to the static (no motion) condition, the improvement seemsto be of little practical significance. Table 6 shows that the proportion ofvariability in the data accounted for by motion is only about 3%. Further,while motion did appear to significantly increase identification performancewith the AMX30 and PT76 after repeated training, the proportion of variabilityin the data accounted for by motion and vehicles is only slightly over 1% (SeeTable 6). Finally, while use of motion did tend to significantly reduceperformance differences between TR and NTR soldiers with repeated training,the proportion of variability accounted for by this relationship was onlya little over 3$ (See Table 6).
Table 6
Use of the w2 Statistic to Estimate the Proportion of Variance Accounted for byEach ANOVA Effect Using Posttest Data Obtained Following the Third TrainingSessiond
Effect W2
Motion Group (G) .032Training Responsiveness (T) .208Vehicle (V) .068G x T .033G x V .012T x V .025Gx Tx V .008
a The proportion of variance accounted for by each effect is estimated by a
generalization of formulas presented by Hays, Statistics, p.407 by
SS effect - (df effect) x MS errorw y/effect -
SStotal + MSerror
17

In addition to the weakness of the training responsiveness and motionrelationship after repeated training, it is relevant to consider absoluteperformance levels attained by NTR soldiers compared to TR soldiers. In mostcases average performance of NTR soldiers after three training sessions doesnot reach the level attained by TR soldiers after a single training spssion.This raises two questions of some interest to the training community: (1)Should all soldiers be required to be proficient in R&I? (2) If so, sincemotion does not add significantly to their performance, what medium would berequired and would it be cost-effective to use it?
Finally, it appears that motion contributes nothing to either group's(NTR, TR) short term memory.
CONCLUSIONS
" Motion (after repeated training) provides a small positive effect butdoes not appear to be an essential ingredient in trainingground-to-ground vehicle R&I using the Basic CVI Training Program.This is true for both training responsive and non-training responsivesoldiers.
" Short term R&I retention is not improved when motion is included in thetraining.
18

REFERENCES
Foster, D. (1976). Target Detection in the Real World and From PhotographicProjection in the Laboratory - A Correlational Study of the Validity ofPhoto Simulation. Virginia Military Institute. (AD A041 233)
Gottsdanker, R. M. (1957). The Role of Form Discrimination in the Perceptionof Motion. In J. W. Wulfeck and J. H. Taylor (eds.), Form Discriminationas Related to Military Problems. Armed Forces, NRC Committee in Vision,Nat. Acad. Sci., Nat. Res. Council Publ. 561, 127-129.
Gutman, J. C., Snyder, H. L., Farley, W. V., & Evan, J. E. III. (1979). AnExperimental Determination of the Effect of Image Quality on EyeMovements and Search for Static and Dynamic Targets. Dept. of IndustrialEngineering & Opers. Research, Virginia Polytechnic Institute & StateUniversity, Blacksburg, VA. (AD A077 728)
Heuckeroth, 0. H., Smith, N. D., & Shope, G. L. (1988). Target Acquisitionand Analysis Training System: Retention and the Effects of Retraining.U.S. Army Research Institute for the Behavioral and Social Sciences. InPreparation.
Kinkade, R. G., Krumm, R. L., & Muckler, F. A. (1980). Comparative CostIndexes for Selection of Instructional Media. San Diego: EssexCorporation.
Merrill, P. F., & Bunderson, C. V. (1981). Preliminary Guidelines forEmploying Graphics in Instruction. Journal of Instructional Development,Summer, 4 (4).
Miller, J. W., & Ludvigh, Elek. (1960). Time Required for Detection ofStationary and Moving Objects as a Function of Size in Homogeneous andPartially Structured Visual Fields. Visual Search Techniques. Nat.Acad. Sci., Nat. Res. Council Publ. 712.
Shope, G. L., Smith, N. D., & Heuckeroth, 0. H. (1984). Evaluation of anAdvanced Combat Vehicle Identification (CVI) Training Program (Masking):A New Approach to Target Acquisition & Analysis Training. U.S. ArmyResearch Institute for the Behavioral and Social Sciences. ResearchReport 1368. (AD A148 911)
Smith, N. D., Heuckeroth, 0. H., Shope, G. L., Varnick, V. L., & Essig, S. S.(1989). Target Acquisition and Analysis Training System: Effects onCombat Vehicle Identification (CVI) Performance on Number of VehicleTrained and Training Frequency. U.S. Army Research Institute for theBehavioral and Social Sciences. In Preparation.
Smith, N. D., Heuckeroth, 0. H., Warnick, V. L., & Essig, S. S. (1980).Evaluation of a New Approach to Target Acquisition Training: The CVITraining Program. U.S. Army Research Institute for the Behavioral andSocial Sciences. Research Report 1304. (AD All 732)
19

Smith, N. D., Shope, G. L., Heuckeroth, 0. H., Warnick, W. L., & Essig, S. S.(1985). Target Acquisition & Analysis Training System: Development andEvaluation of the Basic Thermal Combat Vehicle Identification (TCVI)Training Program. U.S. Army Research Institute for the Behavioral andSocial Sciences. Research Report 1378. (AD A192 488)
Smith, N. D., Shope, G. L., Heuckeroth, 0. H., Warnick, V. L., & Essig, S. S.(1984). Target Acquisition & Analysis Training System: Comparison ofImage Quality of Three Presentation Media. U.S. Army Research Institutefor the Behavioral and Social Sciences. Technical Report 622.(AD A169 194)
Smith, V. M. (1951). The Sensitivity to Apparent Movement in Depth as aFunction of "Property of Movement." J. Exp. Psychol, 42, 143-152.
20

APPENDIX A
List of Vehicles Used in jrinn
A-- I

Table 1
Vehicles Used for All Groups
M48 MARDER
SALADIN T72
ZSU23-4 CHIEFTAN
BTR 5C ZSU57-2
AMX JO JAGD
PT76 T54/55
Scimitar ROLAND
Ml
A-2

APPENDIX B
Data Collection Instruments
1. Pre/Post-Test
2. Example of Training Response Sheetsfor one type of motion, Straightline.All others are the same.
iB-1

DATA REQUIRED BY THE PRIVACY ACT OF 1974IS U.S.C. Mai.
rITL.1 OF FOaM Basic Combat Vehicle 7.dentl.ficaiion (CVI) PRESCRI8ING OiRECTVE
Training Program - Soldier Information AR 70-11. AUTHORITY
10 uSC Sec 45032. PRINCIPAL PURPOSa(Si
The data collected with the attached form are to be used for researchpurposes only.
3. ROUTINE US"
This is an experimental personnel data collection form developed by theU.S. Army Research Institute for the Behavioral and Social Sciences- pursuantto its research mission as-prescribed in AR 70-1. When identifier (name orSocial Security Number) are requested they are to be used for administrativeand statistical control purposes only. Full confidentiality of the responseswill be maintained in the processing of these data.
4. MANOATORY OR VOLUNTARY DISCLOSURE AND EFFECT ON INOIVIOUAL NOT PROVIOING INFORMATION
Your participation in this research is strictly voluntary.. Individuals areencouraged to provide complete and accurate information in the interests ofthe research, but there will be no effect on individuals for not providingall or any part of the information. This notice may be detached from therest of the form and retained by the individual if so desired.
l FORM Privacy Act Statement - 26 Sep 75
*DA Form 4368-R. 1 May 75
B-2
DATEMODULE NO.
SEAT #RANGE
BASIC COMBAT VEHICLE IDENTIFICATION (CVI) TRAINING PROGRAM
MODULE 7
SOLDIER INFORMATION
1. Name:
(Last) (First) (MI)2. Rank: 3. SSN:
4. Age: 5. Military Unit:
6. Time in Service:(Years) (Months)
7. MOS:
8. Length of time in MOS:
(Years) (Months)9. What is the MOS of the job to which you are currently assigned?
10. Do you wear glasses (or contact lenses) on the job?
Yes No
10a. Do you wear glasses (or contact lenses) only for reading?
Yes No
B-3

Date: ____ __
MO1TION STUbfRow No. __
PRE/POSTTEST Seat No.Range
Name & Rank _____________________
Unit__________________________
Treatment:_______________
Friend/ Namne! Friend/ Name/No. Threat Model No. Threat Model
1 __ _ _ _ _ _ _ _ _ _ _ _27 _ _ _ _ _ _ _ _ _ _ _ _
2 __ _ _ _ _ _ _ _ _ _ _ _28 _ _ _ _ _ _ _ _ _ _ _ _
3 _ _ _ _ __ _ _ _ _ _ _ _ _29 _ _ _ _ _ _ _ _ _ _ _ _ _
4 __ _ _ __ _ _ _ _ _ _ _30 _ _ _ _ _ _ _ _ _ _ _
5 _ _ _ _ __ _ _ _ _ _ _ _ _31 _ _ _ _ _ _ _ _ _ _ _ _ _ _
6 _ _ _ _ __ _ _ _ _ _ _ _ _32 _ _ _ _ _ _ _ _ _ _ _ _ _
7 __ _ _ _ _ _ _ _ _ _ _ _33 _ _ _ _ _ _ _ _ _ _ _ _
8 __ _ _ __ _ _ _ _ _ _ _34 _ _ _ _ _ _ _ _ _ _
9 __ _ _ _ _ _ _ _ _ _ _ _35 _ _ _ _ _ _ _ _ _ _ _ _
10 __ _ _ __ _ _ _ _ _ _ _36 _ _ _ _ _ _ _ _ _ _ _
11 _ _ _ _ __________37 _ _ _ _ _ _________
12 __ _ _ _ _ _ _ _ _ _ _ _38 _ _ _ _ _ _ _ _ _ _ _ _ _
13 __ _ _ _ _ _ _ _ _ _ _ _39 _ _ _ _ _ _ _ _ _ _ _ _ _
14 __ _ _ __ _ _ _ _ _ _ _40 _ _ _ _ _ _ _ _ _ _ _
15 __ _ _ __ _ _ _ _ _ _ _41 _ _ _ _ _ _ _ _ _ _ _
16 _____ _ _ _ _ _ _ _ _42 _____ _ _ _ _ _ _ _ _
17 __ _ _ _ _ _ _ _ _ _ _ _43 _ _ _ _ _ _ _ _ _ _ _ _ _
18 __ _ _ __ _ _ _ _ _ _ _44 _ _ _ ___ _ _ _ _ _ _ _
19 __ _ _ _ _ _ _ _ _ _ _ _45 _ _ _ _ _ _ _ _ _ _ _ _ _
20 __ _ _ __ _ _ _ _ _ _ _46 _ _ _ _ _ _ _ _ _ _ _
21 _____ ________ 47 _____ _________
22 __ _ _ __ _ _ _ _ _ _ _48 _ _ _ _ _ _ _ _ _ _ _
23 _____ _ _ _ _ _ _ _ _49 _____ _ _ _ _ _ _ _ _
24 __ _ _ __ _ _ _ _ _ _ _50 _ _ _ _ _ _ _ _ _ _ _
25 _ _ _ _ __________51 _ _ _ _ _ _________
26 __ _ _ _ _ _ _ _ _ _ _ _52 _ _ _ _ _ _ _ _ _ _ _ _ _
B -4

Friend/ Name/ Friend/ Name/
No. Threat Model No. Threat Model
53 64
54 65
55 66
56 67
57 68
58 69
59 70
60 71
61 72
,62 73
63 74
75
B-5

MOTION STUDY Date:Row No.
MODULE 3 Seat No.Range
Straightline Motion Training Worksheet
Name & Rank
Unit
Section A: Video Presentation Sequence
Friend/ Name/ Friend/ Name/No. Threat Model No. Threat Model
0-1 _-14
D-2 15
D-3 D-16
4 D-17
D-5 18
6 D-19
D-7 D-20
0-8 0-21D-9 22
D-10 D-23
D-11' D-24
D-12 D-25
D-13
Section B: Video Presentation Sequence
D-26 39D-27 D-40
28 41
D-29 D-42
D-30 D-43
D-31 D-44
32 D-45
D-33 D-46
D-34 D-47
U-35 D-48
n-36 D-49
D-37 50
D-38
B-6

IRuw Nu.MODULE 3 Seat No.
Range
STRAIGHTLINE MOTION TEST ANSWER SHEET
Name & Rank
MOS Unit
Section C: Module Test(7.5 second exposure)
No. Friend/Threat Name/Model
2
3
4
5
6
7
9 Y
10
11
12
13
14
15
'B-7
1 " "_____mnu i ro n n _ll iiii in n _______m___

APPENDIX C
Soldier Reaction Questionnaire
c-I

SOLDIER REACTIONS
Motion Test85th Div
22-23 Oct 1983
Name Rank/GS
Organization
Position or Job Description
1. How realistic - unrealistic was the straight line motion you observed?
II 1 I INeither
Very Realistic nor VeryRealistic Realistic Unrealistic Unrealistic Unrealistic
2. How realistic - unrealistic was the circular motion you observed?
II I I INeither
Very Realistic nor Very-Realistic Realistic Unrealistic Unrealistic -Unrealistic
3. Now realistic - unrealistic was the rotational motion you observed?
I I I I INeither
Very Realistic nor VeryRealistic Realistic Unrealistic Unrealistic Unrealistic
4. If your response to 2, 3, or 4 was other than "Very Realistic" or"Realistic" please state your reasons.
5. Did you participate in the CVI training given in January of this year.Yes No
6. Compared with other training in vehicle recognition how would you evaluatethe training you have just received?
Much Better Better About The Poor Much PoorerThan Previous Than Same. Than Than Previous
Training Training
I.-

7. How offectivz/ineffective was the training USing SLrai-IL line Iotiun foryou?
I I
Very Effective In Between Ineffective VeryEffective Ineffective
8. How effective/ineffective was the training using circular motion for you?
Very Effective In Between Ineffective VeryEffective Ineffective
9. How effective/ineffective was the training using rotational motion foryou?
Very Effective In Between Ineffective VeryEffective Ineffective
10. How effective/ineffective was the training using stationary vehicles foryou?
I l I
Very Effective In Between Ineffective VeryEffective Ineffective
11. Are you familiar with the current vehicle training programs in the Army?
GTA 17-2-9 Basic CVI ( ) Yes ( ) NoGTA 17-2-10 Thermal CVI C ) Yes ( ) No
C-3

APPENDIX D
Sources of Variance for all ANOVAs
D-1

Table 1
Analysis of Variance of Number of Vehicle Images Identified Following theInitial and Third Training Session for Soldiers Participating in the MotionStudy
SV df SS MS F P
Between
Soldiers (S) 70 2582.32
Motion (M) 3 102.16 34.06 3.21 <.05
Training Respons-iveness (R) 1 1747.74 1747.74 164.73 <.001
MR 3 63.88 21.29 2.01 >.05
S/MR 63 668.54 10.61
Within Ss 2059 5272.57
Test (T) 1 589.03 589.03 147.63 <.001
Vehicle (V) 14 705.49 50.39 24.88 <.001
TV 14 134.51 9.61 8.08 <.001
MT 3 60.43 20.14 5.05 <.005
MV 42 151.78 3.61 1.78 <.01
MTV 42 50.69 1.21 1.02 >.05
RT 1 46.08 46.08 11.55 <.01
RV 14 137.72 9.84 4.85 <.01
RTV 14 41.10 2.94 2.47 <.01
MRT 3 74.01 24.67 6.18 <.01
MRV 42 140.82 3.35 1.65 <.01
MRTV 42 52.73 1.26 1.06 >.05
ST/MR. 63 251.11 3.99
SV/MR 882 1786.44 2.03
STV/HR 882 1050.63 1.19
T)-2

Table 2
Analysis of Variance of Number of Vehicle Images Identified During the InitialPosttest for Soldiers Participating in the Motion Study
SV df SS MS F P
Between
Soldiers (S) 70 1755.78
Motion (M) 3 42.41 14.14 1.79 >.05
Training Respons-
iveness (R) 1 1197.18 1197.18 151.69 <.001
MR 3 18.98 6.33 <1 >.05
S/MR 63 497.21 7.89
Within Ss 994 2686.18
Vehicle (V) 14 616.48 44.03 22.15 <.001
MV 42 114.49 2.73 1.37 >.05
RV 14 85.09 6.08 3.06 <.001
MRV 42 116.95 2.78 1.40 <.05
SV/MR 882 1753.17 1.99
D-3
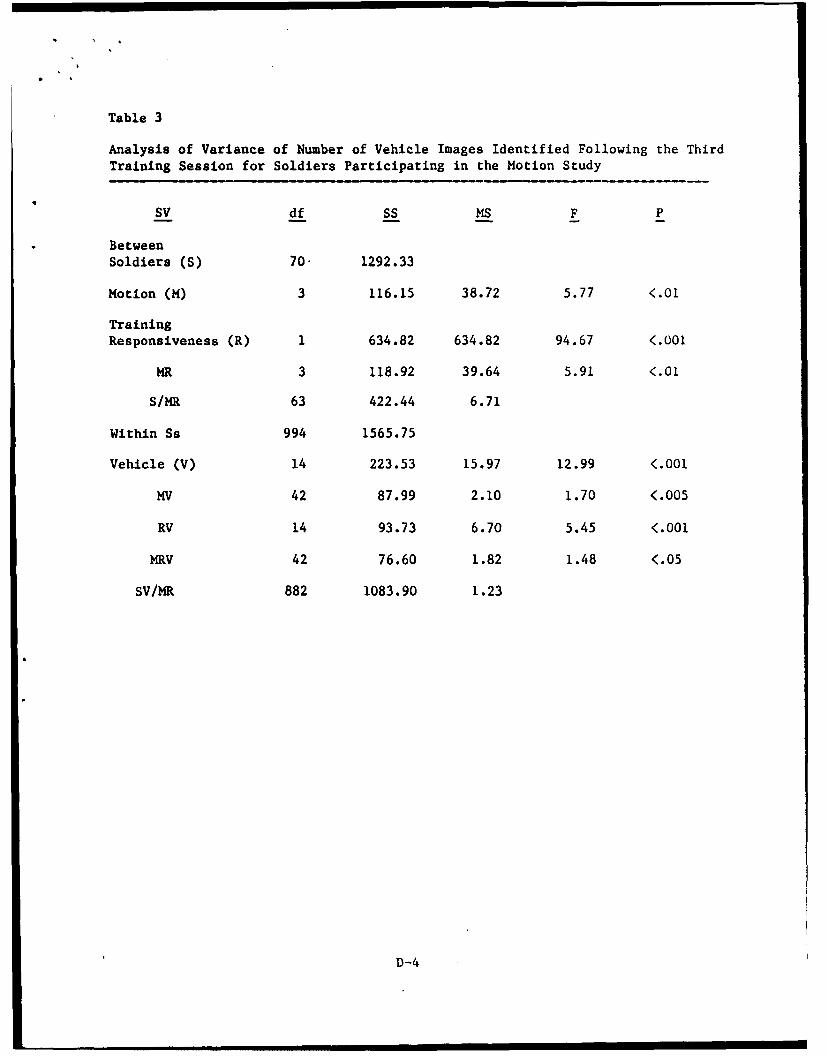
Table 3
Analysis of Variance of Number of Vehicle Images Identified Following the ThirdTraining Session for Soldiers Participating in the Motion Study
SV df SS MS F P
BetweenSoldiers (S) 70. 1292.33
Motion (M) 3 116.15 38.72 5.77 <.01
TrainingResponsiveness (R) 1 634.82 634.82 94.67 <.001
MR 3 118.92 39.64 5.91 <.01
S/MR 63 422.44 6.71
Within Ss 994 1565.75
Vehicle (V) 14 223.53 15.97 12.99 <.001
MV 42 87.99 2.10 1.70 <.005
RV 14 93.73 6.70 5.45 <.001
MRV 42 76.60 1.82 1.48 <.05
SV/MR 882 1083.90 1.23
D-4

Table 4
Analysis of Variance of Number of Vehicle Images Identified Following the ThirdTraining Session and a Retention Test the Following Day for SoldiersParticipating in the Motion Study
SV df SS MS F P
BetweenSoldiers (S) 70 2655.07
Motion (M) 3 229.98 76.66 5.65 <.005
TrainingResponsiveness (R) 1 1301.33 1301.33 95.94 <.001
MR 3 269.25 89.75 6.62 <.001
S/MR 63 854.51 13.56
Within Ss 2059 3422.39
Test (T) 1 3.82 3.82 2.21 >.05
Vehicle (V) 14 400.94 28.64 14.39 <.001
TV 14 15.00 1.07 1.73 >.05
MT 3 6.41 2.14 1.23 >.05
MV 42 176.82 4.21 2.12 <.001
MTV 42 36.52 .87 1.40 >.05
RT 1 1.12 1.12 <1 >.05
RV 14 163.70 11.69 5.87 <.001
RTV 14 7.35 .52 <1 >.05
MRT 3 12.49 4.16 2.40 >.05
MRV 42 157.15 3.74 1.88 <.01
MRTV 42 34.43 .82 1.32 >.05
ST/MR 63 109.10 1.73
SV/MR 882 1752.85 1.99
STV/MR 882 544.69 .62
D-5

a *
Table 5
Analysis of Variance of the Number of Vehicle Images Identified During thePretest for Soldiers Participating in the Motion Study
SV df SS MS F P
Between Soldiers (Ss) 70 1006.18
Motion (M) 3 18.05 6.02 <1 >.05
Training
Responsiveness (R) 1 200.85 200.85 16.21 <.0002
MR 3 6.88 2.29 <1 >.05
S/MR 63 780.40 12.39
Within Ss 994 1169.24
Vehicle (V) 14 162.34 11.60 11.83 <.0001
MV 42 38.85 .93 <1 >.05
RV 14 66.95 4.78 4.88 <.0001
HRV 42 36.35 .87 <1 >.05
SV/HR 882 864.75 .98
D-6
m ,.,=.,i m m llllmlllll I=MOM"I

APPENDIX E
Means, Standard Deviations, and Duncan Multiple
Range Test Analysis for Vehicles
E-1
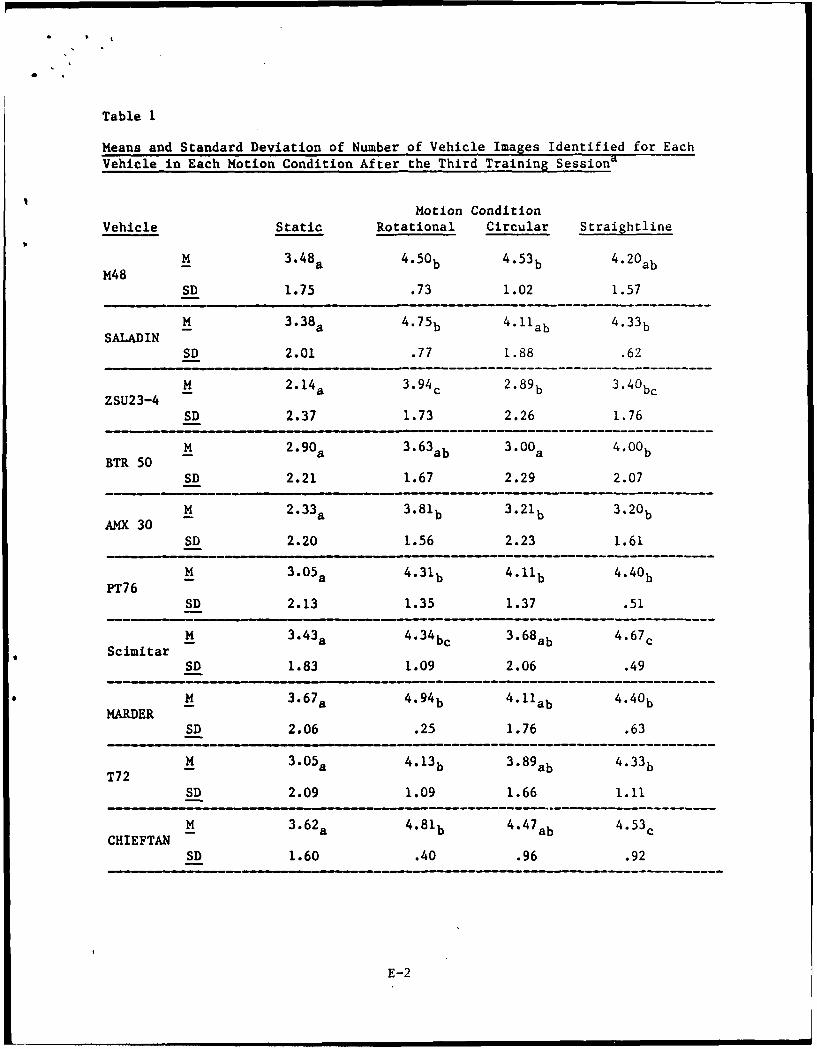
Table 1
Means and Standard Deviation of Number of Vehicle Images Identified for EachVehicle in Each Motion Condition After the Third Training Sessions
Motion ConditionVehicle Static Rotational Circular Strai ghtline
M4 M 348a 4 .50 b 4 .53 b 42a
SD 1.75 .73 1.02 1.57
M 3 .38a 4 .75 b 4.11 ab4.3SALAD IN
SD 2.01 .77 1.88 .62
ZU34 M 2 .14a 39c 2 .89b 3 .40 bc
SD 2.37 1.73 2.26 1.76
BT 0 M 2.90a 3.63a 3.00a .0
SD 2.21 1.67 2.29 2.07
AM 0 M 2.33 a 3 .8 1b 3 .21b3.0
SD 2.20 1.56 2.23 1.61
PT6 H 3 .05a 4 .31b 4 .1 1b4.0
SD 2.13 1.35 1.37 .51
ScmtrM 3.43a 4 .34 bc 3.68a 4.67c
SD 1.83 1.09 2.06 .49
M*DE H 3 .67 a 4 .94 b 4 .11ab4.0
SD 2.06 .25 1.76 .63
T2M 3.05a 4.13b 3.89ab4.3
SD 2.09 1.09 1.66 1.11
CHETNM 3 .62a 4 .81 b 4.47a4.3
SD 1.60 .40 .96 .92
E-2

Table I (cont'd)
Means and Standard Deviation of Number of Vehicle Images Identified for Vehiclein Each Motion Condition After the Third Training Session'
Motion Condition
Vehicle Static Rotational Circular Straightline
5 3.2 4a 4 .50bc 3.6 3ab 4.53 cZSU57-2
SD 2.14 1.10 1.80 1.13
S4. 43a 4 .81a 3.89a 4.13 aJAGD
SD 1.21 .54 2.00 1.77
3.38a 3.6 9a 3 .7 9a 4.20 aT54/55
SD 1.77 1.70 1.81 1.15
M 4.8 1a 4.50a 4.42a 4.87 aROLANDSD .68 .89 1.35 .52
M 3.81a 4 .6 3a 4 .3 7a 4 .4 0aM1
SD 1.69 1.09 1.30 1.59
aMeans followed by the same letter for a given vehicle are not significantly
different according to the Duncan Multiple Range Test (y > .05). Statisticaldifferences between vehicles are not reported.
E23

APPENDIX F
Chi-Square Analyses of TR and NTR Groupsby Background Variables
F-i

Table 1.
CUI-SQUARZ ANALYSIS OF TRAINING AND NON-TRAININC RESPONSIVENESSAND MOTION
Train Group
FrequencyPercentRaw PCTCOL Yet Circular I Rotational Static Straight Total
won- 8 6 10 3 2711.27 8.45 14.08 4.23 38.0329.63 22.22 37.04 11.11
42.11 37.50 47.62 20.00
Resp t1 10 11 12 44
I1.49 14.08 15.49 16.90 I 61.97
25.00 22.73 25.00 27.27
57.89 b2.50 52.38 U0.00
TOTAL 19 16 21 14 71
26.76 22.54 29.58 21.13 100.00
CI-SQUIJAE 3.024 UP - 3 Prob - 0.3879
Table 2.
CNI-SQUARE ANALYSIS OF TRAINING AND HotN-TvIAIUNG RESPONSIVENESS hY CT
Train CT
FrequencyPercentlowPC'T I J II
Col PCT - I Under 90 90 - 1091 Over 109 TOTAL-I I
Non- 0 9 91 9 27- 12.86 12.86 I 12.86 38.57
- 33.33 33.33 I 33.33
- 81.82 47.37 I 22.50- II JL-- I
easp 1 2 101 31 43
- 2.86 14.29 I 44.29 61.43
- 4.65 23.26 I 72.09
- 18.18 52.63 I 77.50
TOTAL - it 19 40 70
- 15.71 27.14 57.14 100.00
ChiLSquara 13.664 DF w 2 Prob - 0.0011
F-2
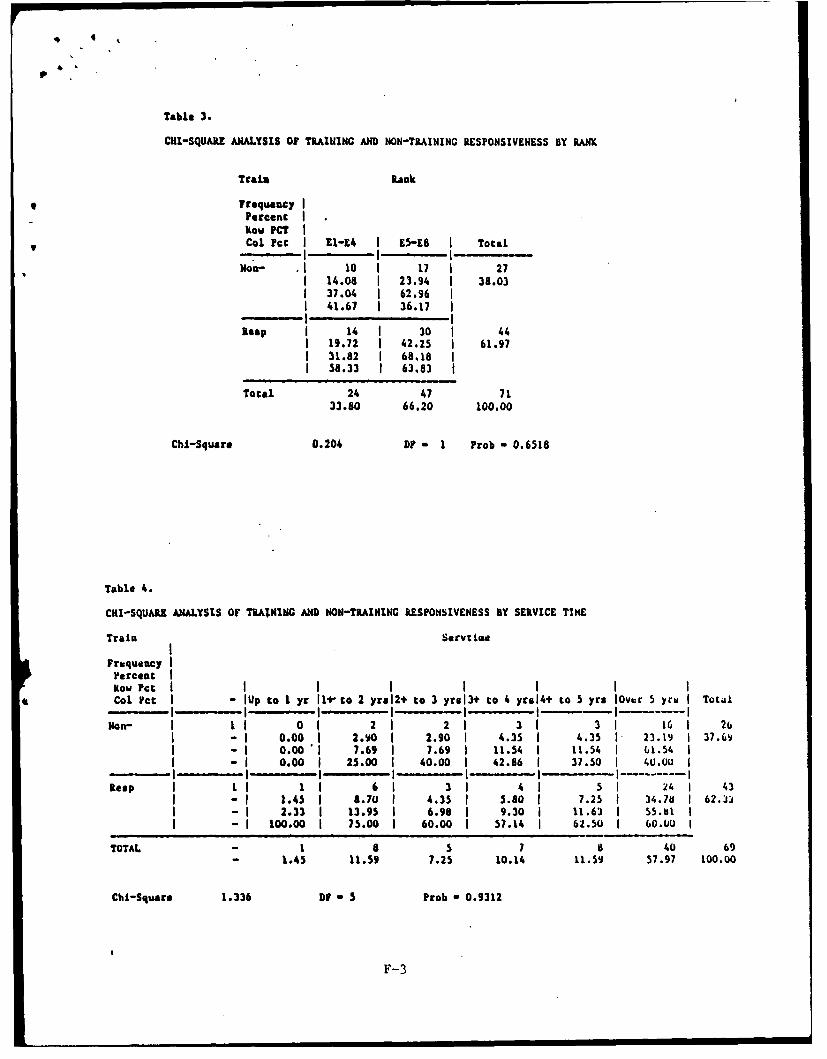
Table 3.
CHI-SQUARE ANALYSIS Of TRAINING AND NON-TRAINING RESPONSIVEESS BY RANK
TraLa RankI • Frequency
Percent
Row PCTCol Fcc ZI-E I 5-ES Total
Nom- 10 17 2714.08 23.94 38.0337.04 62.9641.67 36.17
Reep 14 I 30 4419.72 I 42.25 1 61.9731.82 I 68.18 158.33 I 63.83
Total 24 47 7133.80 66.20 100.00
Chi-Square 0.204 DP - 1 Prob - 0.6518
Table 4.
CHI-SQUAM ANALYSIS OF TRAINING AND NON-TRAINING RESPONSIVENESS BY SERVICE TIKE
Train Servtime
FrequencyPercentKow t I I I I I I
* Cal YcC - lUp to I yr 11+"to 2 yreI2 to 3 yrsl3+ to 4 yrul4+ to 5 yrs IOvr 5 yrs I Total
Non- L 0 2 21 31 31 161 26- 0.00 2.90 2.90 1 4.35 1 4.35 1 23.19 1 37.69- 0.00 7.69 7.69 I 11.54 1 11.54 1 61.54- 0.00 25.00 40.00 1 42.86 37.50 1 40.OU
Resp I 1 61 31 4 51 241 43- 1.45 8.70 4.35 I 5.80 7.25 34.? 62.- 2.33 13.95 6.98 9.30 11.63 55.u- 100.00 75.00 60.00 57.14 62.50 60.00
TOTAL - 8 S 7 8 40 69- 1.45 11.59 7.25 10.14 11.59 57.97 100.00
Chi-Square 1.336 DF 5 5 Prob - 0.9312
F-3