system definition draft
TRANSCRIPT

System Definition ‐ DRAFT

DRAFTSystemDefinition‐TOC Pagei
Table of Contents
1.1 Benefits of Resource Conservation, Waste Reduction, Waste Diversion and Resource Recovery…………………..………………………….…………………………………..1
1.2 Vision, Guiding Principles and Plan Goals…………………………………………………...........2 1.3 Needs Assessment and Baseline Assessment/Survey…………………………………………..3 1.4 Solid Waste Management Continuum and Waste Management Hierarchy……………………4 1.5 Preferred Path………………………………………………………………………………………..5 1.6 System Definition………………………………………………………………...…………………..7
1.6.1 Benefits and Costs………………………………………………………...………………..7 1.6.2 Source Reduction………………………………………………………………….………..7 1.6.3 Toxics Reduction ……………………………………………….…………………………..8 1.6.4 Yard Waste…………………………………………………………………………………..9 1.6.5 Residential Recycling and Diversion……………………….. …………………………..10 1.6.6 Commercial Recycling and Diversion………………………….………………………..11 1.6.7 Construction and Demolition Material Recycling………………………………………..13 1.6.8 Organic Waste Diversion (Composting) ……………………………….………………..14 1.6.9 Waste Conversion Technologies…………………………………………….…………..15 1.6.10 Municipal Solid Waste Disposal……………………………………………...…………..16 1.6.11 Construction and Demolition Waste Disposal…………………………………………..17 1.6.12 Bioreactor/Bio-Stabilization Technologies…………………………..…………………..18 1.6.13 Transfer Station and Processing Facilities….…………………….……………………..19
1.7 Diversion Rates and Resource Recovery…….………………………………..………………..20 1.8 Cost Summary………………………………….…………………………………………………..20 1.9 Implementation Considerations……………….…………………………………………………..20
1.9.1 Implementation Timeline…………….……………………………….……………………..26
List of Figures
1-1 - 2011 Waste Disposal and Diversion, by Percentage……………..……………………………..3 1-2 - Waste Management Hierarchy……………………………………………………….……………4 1-3 - Progression of Solid Waste Management Alternatives along a Continuum……...……………5
List of Tables
1-1 - Preferred Path for System Definition………………………………………………………………6 1-2 - Estimated Diversion by Scenario ……………………………………………….………………..21 1-3 - Evaluation/Screening Criteria for Solid Waste Management Options/Strategies…….………22 1-4 - Cost Information ……………………………………………………………………………….…..23 1-5 - Estimated Annualized Capital and Operating Expenses (2013$)……………………………..24 1-6 - Implementation Actions for System Definition Options……………………………………..…..25 1-7 - Implementation Timeline…………………………………………………………………………..27


System Definition Page 1
System Definition – DRAFT (June 2013)
The System Definition serves as the basis for the development of the Solid Waste Management Plan for
Lincoln and Lancaster County (Solid Waste Plan 2040). The System Definition combines information
on existing solid waste management programs and program options considered for managing solid
wastes in the future. The System Definition describes programs that move the integrated solid waste
management system from current levels of waste diversion and existing disposal practices toward
greater resource conservation, waste reduction, waste diversion and resource recovery efforts.
The System Definition will be presented to the public in one or more open-house formats and through an
on-line website. The Advisory Committee will consider feedback received from the public during these
open house(s) and the on-line website when developing the recommendations which will make up the
Solid Waste Plan 2040.
Reference documents listed in this System Definition can be found on the Solid Waste Plan 2040 website
(http://lincoln.ne.gov/city/pworks/waste/sldwaste/solidwasteplan2040/indes.htm). The Solid Waste Plan
2040 website may also be accessed by searching on the keywords: Solid Waste Plan at
www.lincoln.ne.gov.
1.1 Benefits of Resource Conservation, Waste Reduction, Waste Diversion and Resource Recovery
Resource conservation, waste reduction, waste diversion and resource recovery programs are essential
components of an integrated solid waste management system. An integrated solid waste management
system reduces the reliance on landfilling and has positive local, regional, and, in some cases, national
and global benefits. Select benefits are listed in the following paragraphs:
Economic
Enhances the economy through job creation and new business opportunities (recycling, reuse,
waste exchange)
Provides low cost resources – such as plastics, metals, glass, paper - for manufacturing new and
recycled content products
Produces a local source of compost which has economic benefits in terms of reducing erosion and
lowering water costs (prevents water loss when incorporated into soils)
Provides a management option for yard waste that is less expensive than landfilling
Reduces the community’s long term environmental and financial liability associated with landfills
Reduces costs to small businesses by providing programs whereby hazardous waste can be
managed properly without all of the financial burdens of regulatory compliance
Extends the number of years the current landfill has disposal capacity, and in doing so ensures
disposal capacity remains in close proximity to waste generators – which assists in limiting
transportation costs - and delays significant expenditures required for permitting and constructing
a new landfill
Energy
Decreases energy consumption associated with providing consumer products (made from
recycled materials)
Prevents increased fuel consumption associated with transporting waste to remote (away from
population centers) regional disposal facilities by conserving disposal capacity in the current
location
System Definition Page 2
Human Health and Environmental Protection
Reduces air, soil and water pollution and associated health impacts.
Reduces greenhouse gas emissions linked to climate change
Minimizes environmental degradation by reducing the need to extract, transport and process
raw/virgin materials
Reduces risks posed by toxic wastes, including poisoning of children and pets in households and
occupation exposure of employees in workplaces
Reduces risk posed by hazardous waste, including sometimes irreversible or long-term damage to
the environmental.
Natural Resource Conservation
Preserves and protects natural resources, such as timber, water oil and minerals for future
generations
Recovers valuable materials from the waste stream, thus minimizing the need for extraction of
finite natural resources
Waste management is one of seven priority sustainability indicator areas identified in the Sustainable
Lincoln Plan. The Sustainable Lincoln Plan establishes a target of developing a comprehensive,
integrated “Solid Waste Management Plan” for Lincoln and Lancaster County that promotes waste
prevention, toxicity reduction, diversion, reuse and recycling as waste management strategies with higher
and better use of natural resources that land disposal. Additionally, and as part of the Cleaner Greener
Lincoln initiative and the resulting Sustainable Lincoln Plan, Mayor Beutler has communicated to the
community his goal of “putting Lincoln in the fore at the green capital city of the Great Plains”.
1.2 Vision, Guiding Principles and Plan Goals
The vision statement in the Lincoln-Lancaster County 2040 Comprehensive Plan (LPlan 2040) begins,
“The core promise embedded in LPlan 2040 is to maintain and enhance the health, safety and welfare
of our community during times of change, to promote our ideals and values as changes occur, and to
meet the needs of today without sacrificing the ability of future generations to meet their needs.”
A Vision Statement, five Guiding Principles, and Plan Goals related to the Waste Management
Hierarchy (Figure 1-2) were developed early in the planning process; these can be found in the
document titled: Vision, Guiding Principles and Goals on the Solid Waste Plan 2040 website.
The Guiding Principles are:
engage the COMMUNITY
encourage PUBLIC-PRIVATE PARTNERSHIPS
ensure sufficient SYSTEM CAPACITY
emphasize the WASTE MANAGEMENT HIERARCHY
embrace SUSTAINABLE PRINCIPLES
Detailed technical papers were prepared for the Advisory Committee on a wide range of solid waste
management topics. The key information for each topic was presented to and reviewed with the
Advisory Committee.
System Definition Page 3
The technical papers/topics include:
Source Reduction
(Definitions/Framework/Options)
Zero Waste
Product Stewardship
Household Hazardous & Conditionally-
Exempt Small Quantity Generator
(Small Business) Hazardous Waste
Universal, Special and Unique Wastes
Yard Waste
Residential Recycling and Diversion
Commercial Recycling and Diversion
Construction and Demolition Materials
Recycling
Recycling Incentives
Organic Waste Diversion (Composting)
Waste Conversion Technologies
Municipal Solid Waste Disposal
Construction and Demolition Waste
Disposal
Collection Systems
Bioreactor/Bio-Stabilization
Technologies
Transfer Station and Processing
Facilities
Markets (for recovered/recycled
materials)
1.3 Needs Assessment and Baseline Assessment/Survey
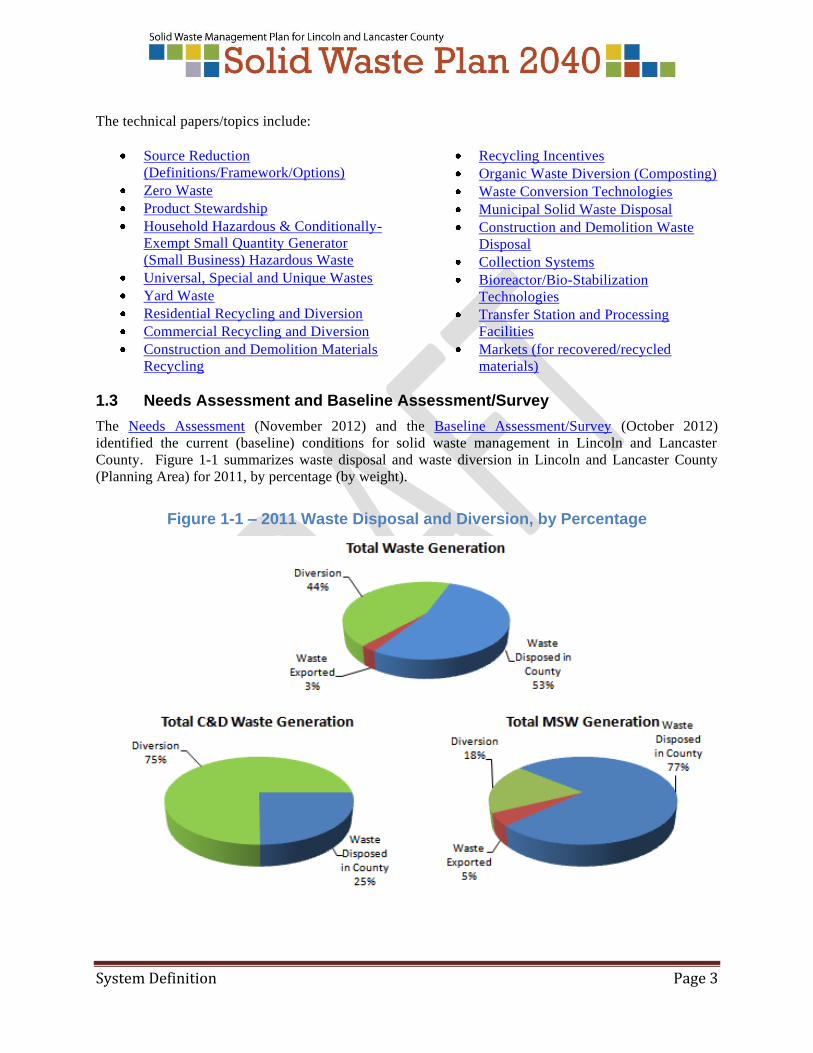
The Needs Assessment (November 2012) and the Baseline Assessment/Survey (October 2012)
identified the current (baseline) conditions for solid waste management in Lincoln and Lancaster
County. Figure 1-1 summarizes waste disposal and waste diversion in Lincoln and Lancaster County
(Planning Area) for 2011, by percentage (by weight).
Figure 1-1 – 2011 Waste Disposal and Diversion, by Percentage
System Definition Page 4
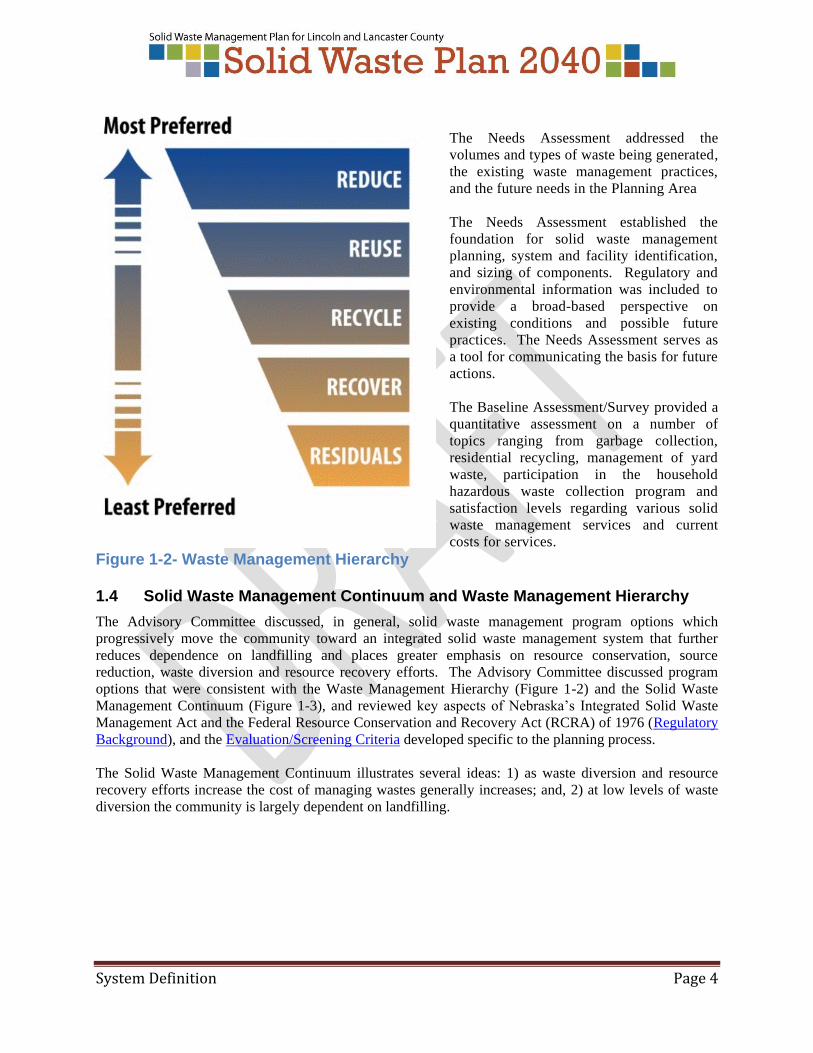
The Needs Assessment addressed the
volumes and types of waste being generated,
the existing waste management practices,
and the future needs in the Planning Area
The Needs Assessment established the
foundation for solid waste management
planning, system and facility identification,
and sizing of components. Regulatory and
environmental information was included to
provide a broad-based perspective on
existing conditions and possible future
practices. The Needs Assessment serves as
a tool for communicating the basis for future
actions.
The Baseline Assessment/Survey provided a
quantitative assessment on a number of
topics ranging from garbage collection,
residential recycling, management of yard
waste, participation in the household
hazardous waste collection program and
satisfaction levels regarding various solid
waste management services and current
costs for services.
Figure 1-2- Waste Management Hierarchy 1.4 Solid Waste Management Continuum and Waste Management Hierarchy
The Advisory Committee discussed, in general, solid waste management program options which
progressively move the community toward an integrated solid waste management system that further
reduces dependence on landfilling and places greater emphasis on resource conservation, source
reduction, waste diversion and resource recovery efforts. The Advisory Committee discussed program
options that were consistent with the Waste Management Hierarchy (Figure 1-2) and the Solid Waste
Management Continuum (Figure 1-3), and reviewed key aspects of Nebraska’s Integrated Solid Waste
Management Act and the Federal Resource Conservation and Recovery Act (RCRA) of 1976 (Regulatory
Background), and the Evaluation/Screening Criteria developed specific to the planning process.
The Solid Waste Management Continuum illustrates several ideas: 1) as waste diversion and resource
recovery efforts increase the cost of managing wastes generally increases; and, 2) at low levels of waste
diversion the community is largely dependent on landfilling.

System Definition Page 5
The first options for reducing the amount of materials sent to disposal are resource conservation, and
source reduction and material reuse, followed by recycling and composting. By themselves these are only
a partial solution to reducing the amount of materials that may require disposal (landfilling). The Solid
Waste Management Continuum recognizes that even with aggressive resource conservation, source
reduction, material reuse, and recycling and composting programs a significant amount of resources are
still available for recovery from the waste stream, and the community would still be dependent on
landfilling as a solid waste management strategy.
Figure 1-3 – Progression of Solid Waste Management Alternatives along a Continuum
Even with very progressive waste reduction and waste diversion programs targeting both residential and
commercial waste generators, it is unlikely that the combined efforts will exceed a 40 to 50 percent
reduction in the amount of wastes requiring disposal (landfilled).
Additional systems, facilities, programs and strategies, such as organic waste diversion and waste
conversion technologies, would likely be required to increase the amount of waste materials diverted
beyond the 40 to 50 percent range.
1.5 Preferred Path
The Advisory Committee reviewed program options for many solid waste management topics.
Following discussion of the program options for each solid waste management topic, an initial poll of the
Advisory Committee was taken to identify the program option most preferred. The poll results
(percentage of votes for each program option) were immediately reported to the Advisory Committee.
Additional discussion occurred among the Advisory Committee members after the initial poll. A final
poll of the Advisory Committee was then taken to confirm the program option the Advisory Committee
wished to be considered in developing the System Definition; the outcome of this process was the
“Preferred Path”. The five step process (depicted graphically below) was utilized for each of the solid
waste management topics reviewed by the Advisory Committee.

System Definition Page 6
The System Definition is based on the resulting direction – the Preferred Path – determined by the final
poll results for each solid waste management topic reviewed, and the general discussion of the Advisory
Committee regarding the major program options. Table 1-1 summarizes the Preferred Path.
Table 1-1 - Preferred Path for System Definition
Option/Topic Options Decision for System Definition
Source Reduction Expand Programs that Lead to Greater Source Reduction.
Toxics Reduction Expand the Toxics Reduction program and create a place to provide year
round access.
Yard Waste Maintain Status Quo (Seasonal Ban) Residential Recycling and
Diversion
Residential Curbside Recycling to be provided (1) to all single family and
duplex dwellings City wide.
Commercial Recycling and
Diversion
Commercial Recycling to be provided (2) to multi-family dwellings,
businesses, industries and institutions.
Construction and Demolition
Materials Recycling Preferred Path not yet identified
Organic Waste Diversion
(Composting)
Develop/Support programs to reduce the quantity of organics, especially
food waste, going to the City’s MSW disposal site.
Waste Conversion
Technologies
Pursue the development of Waste Conversion Technology(ies) as a part of a
long-term strategy for energy recovery and resource conservation.
Municipal Solid Waste
Disposal Expand on City-owned property to the east of the currently permitted site.
Construction and Demolition
Waste Disposal Expand on City-owned property.
Bioreactor/Bio-Stabilization
Technologies
No further consideration is given in the System Definition to pursuing the
development of a bioreactor/bio-stabilization technology.
Transfer Station and
Processing Facilities
Develop a municipal solid waste Transfer Station if a feasibility study shows
it can be cost effective.
Notes:
1. The term “provided” was explained in the meeting as meaning “Universally Available” which was further defined as being
mandatory that recycling services be provided to all single family and duplex dwellings but resident participation would be
voluntary. 2. The term “provided” was explained in the meeting as meaning “provided by ordinance” which would mean it would be
mandatory that it be provided to all multi-family dwellings, businesses, industries and institutions either as hauler provided
or building owner/operator provided.
The Preferred Path indicated a preference for status quo, new and enhanced resource conservation,
waste reduction, and waste diversion programs, and options to provide secure long-term disposal
capacity for the Planning Area. While not a specific polling topic, discussions suggested a desire to
achieve waste diversion levels at least equal to the national average (34 percent) as reported by the
USEPA.

System Definition Page 7
1.6 System Definition
The System Definition is based on the Preferred Path determined by the Advisory Committee. The Solid
Waste Plan 2040 will include recommendations for short- and long-term solid waste management
systems, facilities and programs for the Planning Area.
1.6.1 Benefits and Costs
The Advisory Committee received general information on the costs and environmental benefits associated
with various resource conservation, waste reduction, waste diversion and resource conservation program
options, through the technical papers prepared and reviewed for each solid waste management topic. Not
all program options are quantifiable in terms of short-term economic benefit, nor can they be evaluated
with a traditional cost/benefit ratio type analysis.
1.6.2 Source Reduction: Expand programs that lead to greater source reduction.
Strategies
Increase education and promote waste minimization.
o Expand outreach to K-12.
o Increase promotion in public places.
o Increase education and promotion to the commercial sector.
o Partner with existing education organizations such as Keep Lincoln-Lancaster County
Beautiful.
Support the efforts of the Nebraska Product Stewardship Coalition.
Increase support of reuse and waste exchange programs – non-City operated.
Develop additional reuse and waste exchange programs – private or City operated.
Qualitative/Quantitative Goals
1 to 2 percent increase in waste-reduction with education (behavioral change) programs alone.
2 to 4 percent increase in diversion with increased reuse and waste exchange programs.
4 percent increase when coupled with programs such as volume based fees for waste collection.
Benefits
Less materials requiring management or disposal.
Conservation of natural resources.
Decrease in greenhouse gas emissions.
Decrease in energy-consumption needed to produce new products and materials.
Economic benefits from material reuse.
Cost Considerations
Existing source reduction education efforts would remain in place. Additional costs are program specific.
Expanded education would support elements of other existing and new programs, such as increased
recycling, toxics-reduction, and other waste reduction and waste diversion efforts.
Capital Costs
None.
Operating Costs
Costs would be approximately $300,000 or $1 per person per year or the equivalent of $0.21 per single
family household per month. A very progressive program (e.g., zero waste) might cost $3 per person per
year.
System Definition Page 8
Funding
Occupation Tax and grants. Each $1 per ton of Occupation Tax generates about $300,000.
Diversion
A basic program could result in a 1 to 2 percent reduction in MSW going to the City’s landfills; roughly
4,100 and 8,200 tons. Additional education efforts, material exchange programs, or incentives could
increase this to 2 to 4 percent.
1.6.3 Toxics Reduction: Expand the toxics reduction program and create a place to provide year round access.
Strategies
Mobile Household Hazardous Waste (HHW) collection events paired with a hazardous
material/waste storage building.
Fixed and permanent household / small business materials hazardous waste facility.
o Reduced mobile events (e.g., 2-4 per year).
o Possibly including waste exchange for useable household products.
Qualitative/Quantitative Goals
Less than 1 percent increase in diversion.
Divert at least 100,000 pounds (50 tons) of toxic material per year from the landfill.
Increase small business participation opportunities.
Benefits
Protects human health and the environment by: reducing risks and exposures to hazardous
materials (e.g., accidental poisonings, injuries to waste handlers, etc.); assuring proper
management and disposal of special wastes; preventing hazardous waste from being illegally
disposed of in the environment or in the Bluff Road Landfill, which could adversely impact air,
water and land resources; and, preventing illness and disease caused by improper waste
management.
Increased safety for staff and residents or business employees who manage and utilize program
services.
Year round accessibility and convenience to residents and conditionally exempt small quantity
generator (CESQG) small businesses.
Increased toxics-reduction opportunities and processing may create additional jobs and possible
economic development opportunities.
Cost Considerations
Costs are very specific to program modifications and facility size.
Capital Costs
Capital costs for a small (modular) hazardous material/waste storage container is estimated at $30,000 -
$60,000; this is equivalent to less than $0.01 per single family household per month
Capital costs for a small waste storage building are estimated at $40,000 - $100,000; this is equivalent to
$0.01 per single family household per month.
Capital costs for a permanent facility would be in the range of $1,000,000 to $3,500,000 and are heavily
dependent upon building size (construction costs), land purchase costs and site development
requirements. This equivalent to $0.05 to $0.19 per single family household per month
System Definition Page 9
Operating Costs
In FY 2011, the costs for the Lincoln-Lancaster County Health Department’s (LLCHD) toxics-
reduction/hazardous materials management program for households and small businesses were $357,303.
With a permanent facility a decrease may be considered in the number of mobile events (e.g., from 6 to 8
(currently) to possibly 2 to 4 per year). Such a decrease in events would translate to an overall decrease
in program costs in the range of $20,000 - $40,000 per year. These savings could help offset operation of
a fixed and permanent facility that would provide year round access.
The operating costs for any toxic-reduction program expansion option will be driven in large part by the
quantities of waste handled and transported to disposal. With expanded waste collection via a
fixed/permanent facility, or other option allowing for year round collection, operational costs would
generally increase in direct correlation to the amount of waste collected and managed.
Reducing the number of mobile collections coupled with a permanent HHW facility (and assuming
additional annual program grant funding of approximately $100,000 per year), the City might expect a
$50,000 to $150,000 increase in annual operating costs. This is equivalent to approximately $0.03 to
$0.10 per household per month. When combined with capital costs for a permanent facility the total
program cost increase is in a range of $0.08 to $0.29 per household per month.
Funding
Occupation Tax and grants. Small businesses (CESQG) would continue to pay for their own waste
disposal costs.
Diversion
A fixed permanent household hazardous waste facility in combination with mobile collection events is
estimated to divert less than 1 percent of the Municipal Solid Waste. Added accessibility and
convenience would likely drive a considerable increase in public participation and quantity of waste
collected. This increase is estimated to be 50 tons per year or more.
1.6.4 Yard Waste: Maintain the status quo (seasonal ban on grass and leaves); long term consideration may be given to banning grass and leaves year round
Strategies
Maintain the current seasonal ban (status quo) on grass and leaves.
Implement a ban on grass and leaves year round.
Qualitative/Quantitative Goals
No change in landfill diversion rate with status quo.
1 to 2 percent increase in diversion rate with year round ban on grass and leaves.
Benefits
Continued diversion of the majority and grass and leaves from the landfill.
Conserves space in the landfill/extends the number of years the landfill is available to the
community for disposal.
Compost produced from grass and leaves will provide macro-and micro-nutrients, reduce erosion,
and prevent water loss when incorporated into clay rich soils.
System Definition Page 10
Cost Considerations
No increase or decrease in the City’s compost operation costs.
Capital Costs
None.
Operating Costs
The operating costs for the City’s composting program would not change if the seasonal ban remained in
place. A year round ban of grass and leaves is not anticipated to change the per ton user fee at the City’s
composting site. Costs for collection of yard waste might increase if a year round ban were implemented.
Funding
User fees, Occupation Tax, grants and revenues from the sale of compost fund the City’s composting
operation. Residents and businesses who subscribe to separate yard waste collection services pay for the
collection and hauling costs.
Diversion
There would be no additional diversion if the status quo is maintained. A year round disposal ban for
grass and leaves would result in an additional 1 to 2 percent of the MSW waste stream being diverted
from the City’s landfill; roughly 4,100 to 8,200 tons per year.
1.6.5 Residential Recycling and Diversion: Residential curbside recycling to be provided to all single family and duplex dwellings City-wide.
The term “provided” was explained in the Advisory Committee meeting as meaning “Universally
Available” which was further defined as being mandatory that recycling services be provided to all single
family and duplex dwellings but resident participation would be voluntary.
Strategies
Require waste haulers to provide a minimum level of service that includes curbside recycling.
Franchise recyclables collection and management.
o Exclusive or non-exclusive franchise.
Contract recyclables collection and management of recyclables.
Franchise or contract for both solid waste and recyclables collection and management of
recyclables.
Qualitative/Quantitative Goals
100 percent of all single family and duplex dwellings will be provided curbside recycling
services.
5 to 8 percent increase in total MSW diversion (10 to 15 percent increase in residential waste
diversion). This will be a function of number of materials targeted, convenience provisions (e.g.,
carts and containers) and participation levels.
8 to 10 percent increase in total MSW diversion (16 to 20 percent increases in residential waste
diversion) with incentivized fee structures (e.g., “volume based”) for garbage collection.
Benefits
Satisfies public desire for greater recycling convenience.
Conserves valuable and finite resources (timber, metal ores, coal and oil (energy), water, precious
metals, etc.).
System Definition Page 11
Conserves space in the landfill and extends the number of years the current landfill is available to
the community for disposal.
Reduces greenhouse gas emissions.
Potential cost reductions for current curbside recycling subscribers.
Creates additional jobs and economic development opportunities.
Cost Considerations
Costs are very program specific and will be a function of the implementation strategy and program
details. The costs presented are considered representative but may not represent actual costs paid by
residents in the Planning Area; it is possible that not all residents would experience cost increases.
Capital Costs
The annualized capital cost for standardized containers is estimated to be in the range of $6 to $8 per
household per year ($0.50 to $0.67 per household per month), assuming a ten year service life for the
containers.
Operating Costs
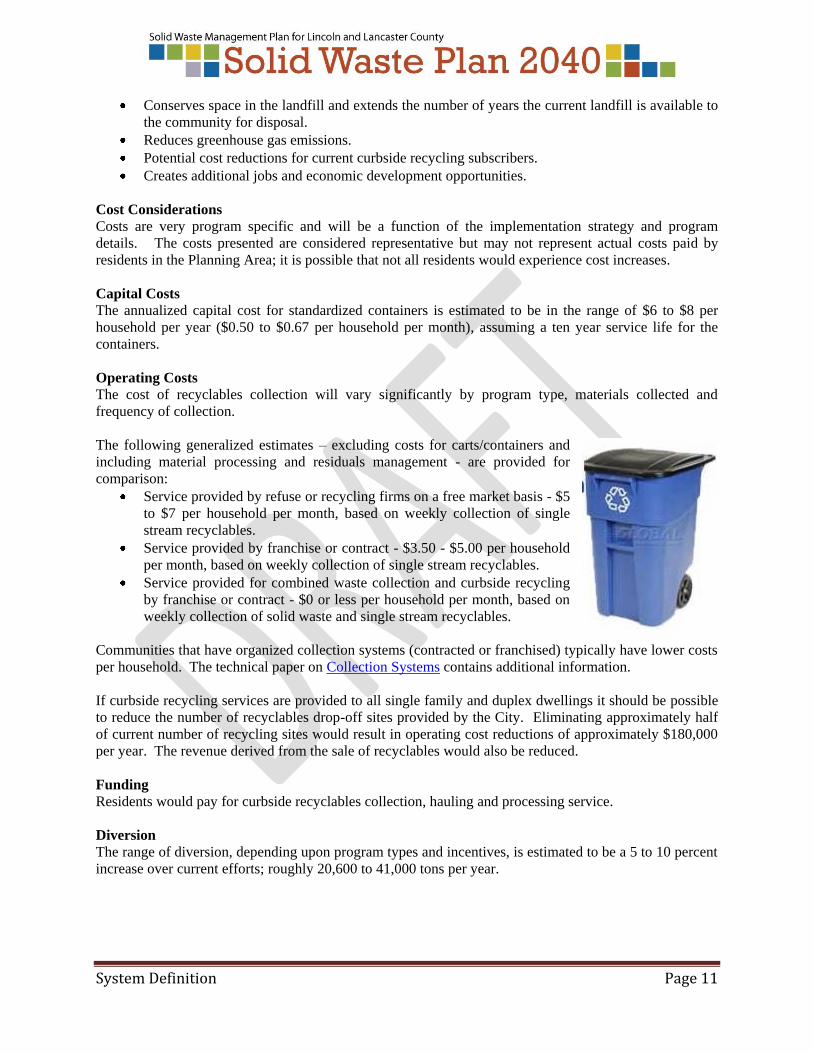
The cost of recyclables collection will vary significantly by program type, materials collected and
frequency of collection.
The following generalized estimates – excluding costs for carts/containers and
including material processing and residuals management - are provided for
comparison:
Service provided by refuse or recycling firms on a free market basis - $5
to $7 per household per month, based on weekly collection of single
stream recyclables.
Service provided by franchise or contract - $3.50 - $5.00 per household
per month, based on weekly collection of single stream recyclables.
Service provided for combined waste collection and curbside recycling
by franchise or contract - $0 or less per household per month, based on
weekly collection of solid waste and single stream recyclables.
Communities that have organized collection systems (contracted or franchised) typically have lower costs
per household. The technical paper on Collection Systems contains additional information.
If curbside recycling services are provided to all single family and duplex dwellings it should be possible
to reduce the number of recyclables drop-off sites provided by the City. Eliminating approximately half
of current number of recycling sites would result in operating cost reductions of approximately $180,000
per year. The revenue derived from the sale of recyclables would also be reduced.
Funding
Residents would pay for curbside recyclables collection, hauling and processing service.
Diversion
The range of diversion, depending upon program types and incentives, is estimated to be a 5 to 10 percent
increase over current efforts; roughly 20,600 to 41,000 tons per year.
System Definition Page 12
1.6.6 Commercial Recycling and Diversion: Commercial recycling to be provided to multi-family dwellings, businesses, industries and institutions.
The term “provided” was explained in the Advisory Committee meeting as meaning “provided by
ordinance” which would mean it would be mandatory that recycling be either hauler provided or building
owner/operator provided for all multi-family dwellings, businesses, industries and institutions.
Strategies
Recycling services will need to be tailored to the specific situation and needs of a given waste generator
and the types of recyclables generated. The technical paper on Commercial Recycling and Diversion
provides additional information on this topic. Ordinances would define a minimum level of service to be
provided.
Refuse hauler or recycler provided recycling services.
Franchise recyclables collection and management.
o Exclusive or non-exclusive franchise.
Contract recyclables collection and management of recyclables.
Owner/operator provided recycling services – direct contract between owner/operator and
selected service provider.
Post disposal processing facilities (select waste streams high in recyclables). This is not
considered a stand-alone program but may be used where separation of the materials at the source
is impractical or ineffective.
Qualitative/Quantitative Goals
6 to 12 percent increase in diversion if recycling is
required to be provided to all multi-family units, as
well as businesses, industry and institutions.
100 percent of the residents residing in multi-family
dwelling units would have access to on-site recycling
services.
100 percent of businesses would have a minimum level
of recycling service.
Benefits
Conserves valuable and finite resources (timber, metal ores, coal and oil (energy) water, precious
metals, etc.).
Conserves space in the landfill and extends the number of years the current landfill is available to
the community for disposal.
Reduces greenhouse gas emissions.
Potential cost reductions for some waste generators.
Create additional jobs and economic development opportunities.
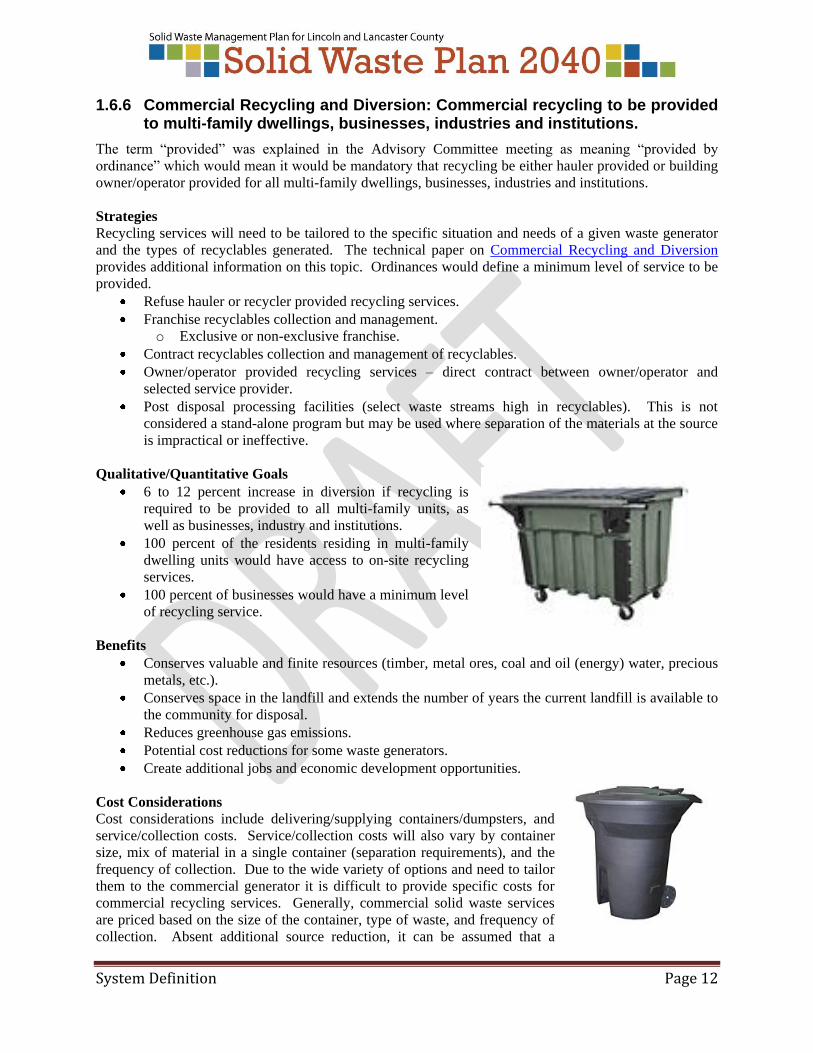
Cost Considerations
Cost considerations include delivering/supplying containers/dumpsters, and
service/collection costs. Service/collection costs will also vary by container
size, mix of material in a single container (separation requirements), and the
frequency of collection. Due to the wide variety of options and need to tailor
them to the commercial generator it is difficult to provide specific costs for
commercial recycling services. Generally, commercial solid waste services
are priced based on the size of the container, type of waste, and frequency of
collection. Absent additional source reduction, it can be assumed that a
System Definition Page 13
commercial waste generator will require the same amount of materials to be removed from the
generator’s site/location. The savings from less frequent waste collection and reduction in disposal costs
may (to varying degrees) offset the cost of an additional container for recyclables and collection of the
recyclables.
For certain high quality (and high volumes of) recyclables (e.g., office paper or clean corrugated
cardboard containers) the market/processors may be willing to provide free containers and collection
services (or possibly even revenue) in exchange for recyclables. For small quantity generators or
generators of mixed recyclables the collection cost may be similar to those for residential collection
services and may actually be provided by the same style of collection program (e.g., wheeled carts).
Capital Cost
As stated above, additional infrastructure will be required in conjunction with increases in commercial
recycling. The costs for this infrastructure are anticipated to be passed on to the waste generators in the
collection fees they pay. These costs may or may not be off-set by the value of the recyclables and
reduced waste disposal costs.
Operating Costs
Service/collection costs will vary by container size, materials handling and processing requirements,
frequency of collection, and any off-setting revenues. The cost of collection for commercial recycling
containers will likely be comparable to similar size solid waste containers; however, because the material
is recycled rather than landfilled, the management of the collected recyclables would be expected to be
less than the costs for the management of refuse (because of the disposal costs).
Funding
It is anticipated that any added cost for commercial recycling would be borne by the program participants
– building tenants, commercial establishments, institutions, etc.
Diversion
The amount of material diverted will depend on a number of factors including program types and
incentives. The range of diversion is estimated to be a 6 to 12 percent increase over current efforts;
roughly 24,700 to 49,400 tons per year.
1.6.7 Construction and Demolition Material Recycling: ((statement of Preferred Path not yet determined)).
Strategies
Continue to support and encourage private recycling/diversion efforts for concrete, asphalt and
other recyclable C&D materials.
Xxxxx
Qualitative/Quantitative Goals
Xxxxx
Benefits
Recovers valuable resources.
Conserves space in the landfill.
Increased recycling and processing may create additional jobs and possibly economic
development opportunities.
Xxxxxx
System Definition Page 14
Cost Considerations
Xxxxxxxxx
Capital Costs
Xxxxxxxx
Operating Cost
Xxxxxxxx
Funding
Based on current practices it would be anticipated that any added cost for C&D materials recycling would
be borne by the construction and demolition project.
Diversion
C&D materials recycled are not included in calculations of MSW recycling rates. The amount of
additional C&D materials diverted will depend on the targeted materials and the requirements for
separation; this may require further analysis.
1.6.8 Organic Waste Diversion (Composting): Develop/Support programs to reduce the quantity of organics, especially food waste, going to the City’s MSW disposal site.
Strategies
Monitor development of organic waste diversion programs and markets in the United States.
Identify opportunities for public-private partnerships.
o Processing.
o Marketing.
Undertake pilot program (up to 1,000 cubic yards per year) using commercial sources of waste.
Evaluate costs and implementation considerations for full-scale programs.
o Aerobic composting or anaerobic digestion with energy recovery.
o Co-composting with sewage sludge with energy recovery.
Qualitative/Quantitative Goals
Less than 1 percent diversion through added education.
Less than 1 percent through pilot program.
5 to 10 percent diversion through large volume programs.
Benefits
Conserves space in the landfill and extends the number of years the current landfill is available to
the community for disposal.
Reduces greenhouse gases.
Provides potential source of renewable energy (anaerobic digestion).
Provides compost and soil amendment.
Reduces long-term risk associated with biologic activity in landfill.
Create additional jobs and economic development opportunities.
Enhances reputation of business as an environmental steward
Cost Considerations
Costs are very program specific and would include collection, processing, possibly energy/power sales,
renewable energy credits, end-product distribution and utilization. Some revenue/cost reduction may be
System Definition Page 15
generated from the sale/use of the bio-gas (methane) as an energy source if anaerobic digestion is
implemented. Revenue from end-product will significantly affect total costs.
Capital Costs
The data available on organic composting/digestion facilities is generally presented on a per ton basis,
which combines construction debt, operation and maintenance, offset energy revenues, by-product
management, and residuals disposal.
Operating Costs
Tipping fees for an aerobic composting facility processing 75 to 100 tons per day are anticipated to be in
the range of $25 to $40 per ton (including construction debt, operation and maintenance, and offsets by
revenues from compost sales). Tipping fees for an anaerobic digestion facility processing 75 to 100 tons
per day are anticipated to be in the range of $70 to $100 per ton (including construction debt, operation
and maintenance, offset energy and compost revenues, by-product management, and residuals disposal).
Collection and transportation costs are not included in these tipping fee estimates.
The cost for organic waste collection can also be a function of the management technology utilized. If
food waste from residential sources is combined with yard waste the collection component of the costs
may be similar to current collection costs (plus the added costs for composting). If residential food waste
is collected separately from other wastes the cost per ton for collection is anticipated to be higher (due to
less tons per collection event and possibly the need for more frequent collection).
Commercial organic waste collection program costs will vary with container size and frequency of
collection.
Funding
It is anticipated that any added cost for organic waste composting/digestion would be borne by waste
generators and the program participants.
Diversion
The amount of organic material diverted will depend on a number of factors. A, large scale effort could
divert 5 to 10 percent; roughly 20,600 to 41,200 tons per year.
1.6.9 Waste Conversion Technologies: Pursue the development of Waste Conversion Technology(ies) as a part of a long-term strategy for energy recovery and resource conservation.
Strategies
Monitor costs of developing such facilities in other communities in the United States.
Develop facility(ies) as a form of alternative energy to off-set fossil fuel emissions.
o Energy generation may off-set fossil fuel usage for roughly 5,000 to 8,000 homes.
Develop facility(ies) in partnership with large scale energy user or utility company.
Develop facility(ies) as part of an integrated solid waste management program (resource
conservation, waste reduction, waste diversion and resource recovery).
Qualitative/Quantitative Goals:
40 to 50 percent reduction in quantity of MSW disposed of by landfilling.
Recover the energy value of waste which might otherwise be buried in a landfill.
Provide a new source of renewable energy.
System Definition Page 16
Benefits
Significantly extends the life of the City’s current landfill.
Reduces uncontrolled emissions from landfill and offsets fossil fuel emissions.
Provides significant source of renewable energy.
Recovers valuable energy resource from waste and provides opportunities to recover other
resources (e.g., metals).
Inert residue reduces long-term liabilities associated with landfilling.
Cost Considerations
Costs are very program specific and facility specific and are significantly influenced by factors such as
facility size, technology and revenue from the sale of energy.
Capital Costs:
Costs are generally presented on a per ton basis, which combines construction debt, operation and
maintenance, offset energy revenues, and residuals disposal.
Operating Costs:
Tipping fees for a facility processing 500 tons per day might be in the range of $120 per ton. Collection
and transportation costs are not included in this tipping fee estimate, but would be comparable to the cost
of collecting and transporting municipal solid waste to the Bluff Road Landfill. The cost per single
family and commercial waste generators could only be calculated once all the components of the
integrated solid waste management systems are established. Costs would need to be estimated when such
systems are given further consideration.
Funding
The capital cost would likely be financed with revenue bonds based upon current practices in the waste-
to-energy/waste conversion technology industry. Third party service providers are often involved in the
design, construction, operation and possibly ownership of such facilities. The combined cost for debt
service on the bonds, operating cost, and residuals disposal is paid for by a combination of tipping fees
and revenues from the sale of energy (and other recyclables). To guarantee repayment of debt some form
of waste flow control will be required to guarantee an adequate quantity of waste (generated in the facility
service area) is directed to the waste conversion facility.
Diversion
The amount of material diverted will depend on a number of factors. Up to 40 to 50 percent of the waste
generated might be anticipated to be managed by such a technology; the amount available would be
largely dependent upon the success of other diversion programs. Assuming an 80 percent reduction in
weight, and assuming 40 to 50 percent of the waste generated is managed with waste conversion
technologies, roughly 168,000 – 206,000 tons per year would be diverted from landfilling.
1.6.10 Municipal Solid Waste Disposal: Expand on City-owned property to the east of the currently permitted site.
Strategies
Modify the permit for the existing Bluff Road MSW Landfill to include the City property to the
east (of the current landfill) into the permitted site boundary.
Obtain all zoning and land-use approvals necessary to allow construction and ensure future use of
this site as a solid waste disposal area landfill.
Evaluate options to prevent conflicting development near the landfill boundary.
System Definition Page 17
Qualitative/Quantitative Goals
Provide disposal capacity for municipal solid waste beyond 2040.
Assure stable, long-term, low cost disposal option.
Benefits
Secures long-term disposal capacity beyond 2040 for the Planning Area.
Site is close to the City and provides a relatively short haul distance which helps keep long-term
costs low.
Soil excavated for the construction of the (new) landfill can be used as capping material for the
closure of the existing landfill.
Cost Considerations
A master plan would be needed for any expansion of the current Bluff Road Landfill. A master plan
would address additional roadway and infrastructure costs, sequence of site development and other
aspects necessary to permit the construction and operation of the new disposal area.
Capital Costs
Approximately $10,000,000 to $15,000,000 (2013$) would be necessary to fully develop the area to the
east of the current Bluff Road Landfill as the next disposal facility. This estimate includes an allowance
of $5,000,000 for additional off-site land acquisition and $500,000 for master planning and permitting.
The costs of developing a new landfill on land not owned by the City might be in the range of
$20,000,000 to $25,000,000 (2013$).
If the $10,000,000 to $15,000,000 is assumed to be accrued over the remaining volume of the Bluff Road
Landfill (ignoring cost escalation and time value of money) it would increase tipping fees approximately
$1.45 to $2.15 per ton to accumulate the money in advance of site development. This cost translates to
approximately $0.16 to $0.24 per single family household per month.
Operating Costs
The current tipping fee at the Bluff Road Landfill is $14.00 per ton, excluding the Occupation Tax. The
tipping fee revenue provides for capital expenditures and operations and maintenance expenditures for the
Bluff Road Landfill. Operating costs will increase over time as a function of inflation and in response to
overall costs of site development and closure; however, at this time the future expansion of the landfill on
the City owned property east of the Bluff Road Landfill is not projected to include elements that are
significantly different than current operations. As such the use of this adjoining property is not projected
to result in added operating costs.
Funding
Bonds (revenue or general obligation), which would be repaid from tipping fees.
Diversion
Not Applicable.
1.6.11 Construction and Demolition Waste Disposal: Expand on City property.
Strategies
Provide C&D waste disposal capacity beyond 2040.
Assure stable, long-term, low cost disposal.
For the North 48th Street site, C&D waste disposal provides a cost effective way to address on-
going site maintenance requirements.

System Definition Page 18
If C & D waste disposal were to be pursued at the Bluff Road site, the potential disposal location
would take advantage of existing excavation to provide a largely screened and concealed disposal
area and allow for the use of C&D waste to restore pre-existing site grades.
Qualitative/Quantitative Goals
Secure long-term C&D waste disposal capacity beyond 2040 for the Planning Area.
Preserves a relatively short haul distance for haulers, which helps keep long-term costs low.
Shared support with the transfer station and other solid waste services provides for cost effective
operations.
Benefits
Provides C&D waste disposal capacity beyond 2040.
Current location likely results in cost savings for transportation of C&D materials; more remote
sites (greater distance from the city) would add to overall C&D waste hauling costs.
Cost Considerations
A master plan will be needed to permit either of the North 48th Street site or the Bluff Road site for future
disposal of C&D wastes.
Capital Costs
Minimal costs are anticipated for expansion on the North 48th Street site.
Costs for master planning and permitting are estimated at $75,000 (2013$) if the future disposal area is
developed at the North 48th Street site. A similar cost might be anticipated for the Bluff Road site.
$150,000 may be needed for off-site land purchase for adequate buffer from operations of the landfill.
The costs of developing a new C&D waste landfill on land not owned by the City might be in the range of
$5,000,000 to $10,000,000.
If the $225,000 is accumulated over the remaining volume of the currently permitted North48th Street
C&D Landfill and the added volume is gained with a southern expansion (ignoring any time value of
money) it would represent an increase in tipping fees of approximately $0.10 per ton.
Operating Costs
The revenue collected from the tipping fee at the North 48th Street C&D Landfill funds the operation and
maintenance expenditures and capital expenditures for the landfill. Operating costs will increase over
time as a function of inflation however, at this time the future expansion of the landfill on City owned
property is not projected to include elements that are significantly different than current operations.
Funding
Tipping fee and, if necessary, the Occupation Tax, or from bonds issued by the City.
Diversion
Not Applicable
1.6.12 Bioreactor/Bio-Stabilization Technologies:
The System Definition does not discuss the bioreactor/bio-stabilization landfill technology.
System Definition Page 19
1.6.13 Transfer Station and Processing Facilities: Develop a municipal solid waste Transfer Station if a feasibility study shows it can be cost effective.
Strategies
Undertake a feasibility study to determine if implementing a new transfer station is cost effective.
o Evaluate transfer station alone.
o Evaluate transfer station in combination with a recycling processing or other waste
diversion programs (e.g., facility for year round management of HHW/Small Business
Hazardous Waste, waste processing, waste exchange).
If economically feasible begin land acquisition and additional siting, permitting and
implementation efforts.
o Possibly establish user agreements with waste haulers, if deemed appropriate.
Qualitative/Quantitative Goals
Reduced fuel consumption and air emissions due to shorter distances for collection vehicles.
0 to 5 percent increase in waste diversion assumes processing of select loads of wastes to remove
large quantities of recyclable materials.
Benefits
Convenience and reduced costs for waste haulers/users.
Reduce air pollution/emissions.
Strategically control waste delivery at the Bluff Road Landfill.
Facilitate recycling and other waste diversion programs, such as:
o Household and CESQG hazardous wastes.
o Waste exchanges.
o Drop-off area for select reuse and recyclable materials.
o Concentrated loads of recyclables.
Cost Considerations
A feasibility study would determine and present more detailed cost considerations.
Capital Costs
Approximately $6,000,000 to $8,000,000 (2013$) would be necessary to build a transfer station designed
to handle 300-400 tons of MSW per day; capital costs for additional processing and diversion capabilities
integral to a transfer station are heavily dependent upon the size and functions undertaken and are not
estimated.
Operating Costs
Operating and transportation costs are also very facility specific and are not estimated. To be considered
economically feasible the cost (tipping fee) for using the facility should be off-set by the savings realized
by not having to transport waste to the Bluff Road Landfill and the increased efficiency by returning
waste collection vehicles to their routes in a shorter amount of time.
Funding
Capital costs would be funded either by revenue from the Occupation Tax or by revenue bonds. The
facility operation and maintenance costs would be funded by tipping fee.
Diversion
A feasibility analysis would identify the additional diversion opportunities possible through additional
processing or ancillary functions integral to the transfer station.
System Definition Page 20
1.7 Diversion Rates and Resource Recovery
Diversion rates and levels of resource recovery are dependent upon a wide range of variables, including
program specific elements, degree of promotion and education/behavior change, and level of
participation.
Based on the Preferred Path identified by the Advisory Committee, three system scenarios have been
created to illustrate potential landfill diversion rates (see Table 1-2). These three system scenarios reflect
different levels of effort in terms of waste diversion and resource recovery strategies as well as short- and
long-term program outcomes.
Prior to the development of technical topic papers a common set of evaluation/screening criteria were
developed. Table 1-3 provides an evaluation of the listed options (Preferred Path) relative to the
evaluation/screening criteria.
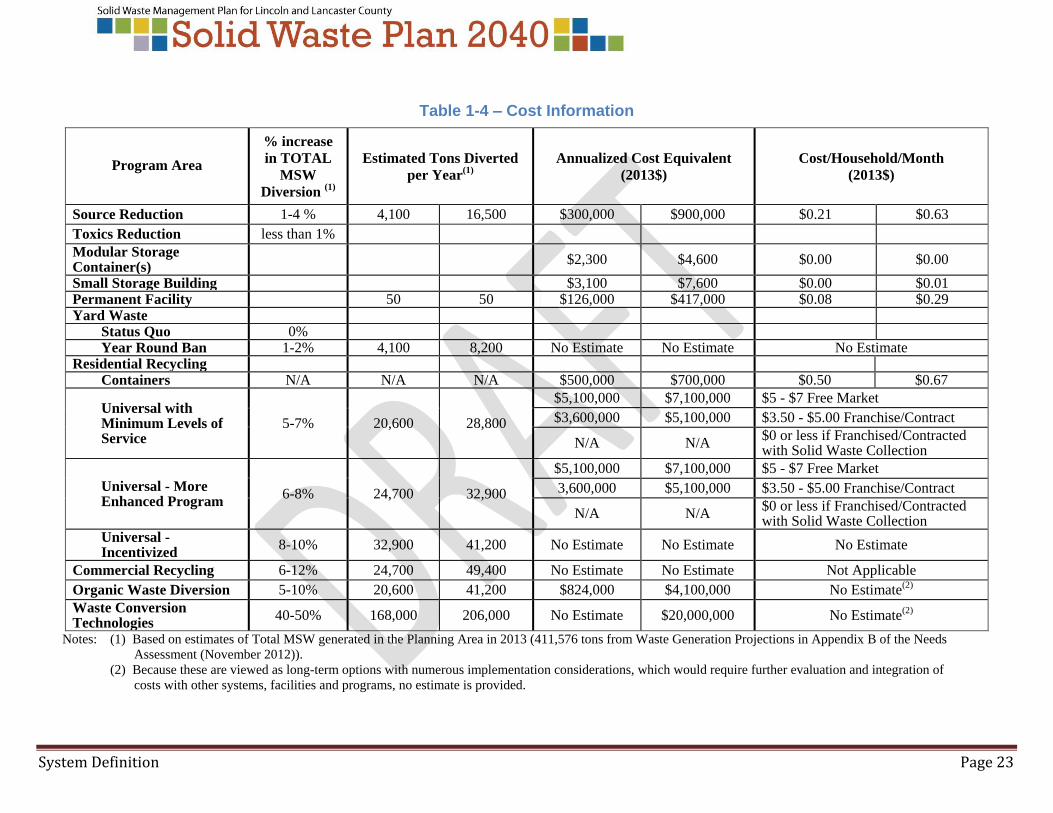
1.8 Cost Summary Table 1-4 summarizes cost information based on the above described programs and the Preferred Path
(options) identified for this System Definition.
Table 1-5 summarizes the estimated annualized capital and operating cost information for the described
programs and the Preferred Path.
It is important to recognize that the values in Table 1-4 were created to provide a general perspective on
how various options relate to increases in management costs. The timing of such expenditures and
refinement of values can, in most instances, only be determined when more specific implementation
strategies are determined. Additionally, while costs are forecast for expansion of the City owned/operated
landfill it is important to recognize that option of expanding on City owned property represents a
substantial cost savings over other options for a future disposal facility; no credit is provided for cost
saving because no revenue is generated by avoiding such expenditures.
1.9 Implementation Considerations
The process of implementing the solid waste management systems, facilities and programs described in
this System Definition, if ultimately incorporated into the Solid Waste Plan 2040, may consist of a wide
array of actions including the following:
Changing laws, regulations and ordinances.
Executing cooperative agreements or arrangements between units of government or private
entities.
Performing additional studies or evaluation.
Monitoring and enforcing laws, regulations, ordinances and policies.
Communicating with residents, businesses, and stakeholders.
Educating users of the system and promoting programs and the goals of the Solid Waste Plan
2040.
Table 1-6 provides a matrix of probable implementation actions.

System Definition Page 21
Table 1-2 - Estimated Diversion by Scenario
Scenario 1 Scenario 2 Scenario 3
Program Area Strategy
% increase in
TOTAL
MSW
Diversion
Strategy
% increase in
TOTAL
MSW
Diversion
Strategy
% increase in
TOTAL
MSW
Diversion
Source Reduction Increased Education 1 - 2%
Increased Education in
conjunction with more
progressive diversion
efforts
2-4%
Increased Education in
conjunction with
incentivized programs
(e.g., “volume-based”
residential recycling
and waste exchanges)
4-6%
Toxics Reduction Year round facility <1% Year round facility <1% Year round facility <1%
Yard Waste Status Quo 0%
Status Quo 0% Year round landfill ban
for grass and leaves 1-2%
Residential Recycling Universal with
Minimum Levels of
Service
5-7%
Universal - more
enhanced program 6-8%
Universal with
incentives (e.g. volume
based rates)
8-10%
Commercial Recycling Universal with
Minimum Levels of
Service
6-8%
Universal - more
enhanced program 8-10%
Universal with
incentives (e.g. volume
based rates and space
provisions for recycling
in new construction)
10-12%
Organic Waste Diversion Status Quo with added
educational emphasis <1%
Pilot program for food
composting 1%
Commercial scale
organics
composting/digestion,
food and soiled papers
5-10%
Waste Conversion Technologies Status Quo 0%
Status Quo 0%
Waste Conversion
facility targeting
majority of non-
diverted wastes
40 to 50%
Transfer Station Transfer Station with
no processing <1%
Transfer Station with
no processing <1%
Transfer Station with
limited diversion of
materials delivered as
waste
2-5%
% INCREASE in TOTAL MSW
Diversion (above current 18%) 12-18%
17-24%
57-62% (1)
% TOTAL MSW Diversion
(including current 18%) 30-36%
35-42%
75-80% (1)
Notes: (1) Values cannot be added directly. If direct addition is required it will be necessary to determine the split of waste materials to organics diversion, various recycling
programs and waste conversion technologies. The likely result being approximately 20 to 25% of waste goes to landfill.

System Definition Page 22
Table 1-3 – Evaluation/Screening Criteria for Solid Waste Management Options/Strategies
Waste
Reduction/ Diversion
Technical Criteria
Environmental Impact
Economic Impacts
Implementation Viability
Source Reduction
Toxics Reduction
Yard Waste -- -- -- -- --
Residential Recycling
and Diversion
Commercial Recycling
and Diversion
-- --
Construction and
Demolition Materials
Recycling
Organic Waste
Diversion (Composting)
--
Waste Conversion
Technologies
--
Municipal Solid Waste
Disposal --
Transfer Station and
Processing Facilities -- --
-- --
N/A – Not Applicable
Notes: Indicated option is favorable in terms of evaluation/screening criteria.
Indicated option is not favorable in terms of evaluation/screening criteria
-- Indicated option is neutral or has favorable or not-favorable aspects in terms of evaluation/screening criteria.
System Definition Page 23
Table 1-4 – Cost Information
Program Area
% increase
in TOTAL
MSW
Diversion (1)
Estimated Tons Diverted
per Year(1)
Annualized Cost Equivalent
(2013$)
Cost/Household/Month
(2013$)
Source Reduction 1-4 % 4,100 16,500 $300,000 $900,000 $0.21 $0.63
Toxics Reduction less than 1%
Modular Storage Container(s)
$2,300 $4,600 $0.00 $0.00
Small Storage Building $3,100 $7,600 $0.00 $0.01 Permanent Facility 50 50 $126,000 $417,000 $0.08 $0.29 Yard Waste
Status Quo 0% Year Round Ban 1-2% 4,100 8,200 No Estimate No Estimate No Estimate
Residential Recycling Containers N/A N/A N/A $500,000 $700,000 $0.50 $0.67
Universal with Minimum Levels of Service
5-7% 20,600 28,800
$5,100,000 $7,100,000 $5 - $7 Free Market
$3,600,000 $5,100,000 $3.50 - $5.00 Franchise/Contract
N/A N/A $0 or less if Franchised/Contracted with Solid Waste Collection
Universal - More Enhanced Program
6-8% 24,700 32,900
$5,100,000 $7,100,000 $5 - $7 Free Market
3,600,000 $5,100,000 $3.50 - $5.00 Franchise/Contract
N/A N/A $0 or less if Franchised/Contracted with Solid Waste Collection
Universal - Incentivized
8-10% 32,900 41,200 No Estimate No Estimate No Estimate
Commercial Recycling 6-12% 24,700 49,400 No Estimate No Estimate Not Applicable
Organic Waste Diversion 5-10% 20,600 41,200 $824,000 $4,100,000 No Estimate(2)
Waste Conversion Technologies
40-50% 168,000 206,000 No Estimate $20,000,000 No Estimate(2)
Notes: (1) Based on estimates of Total MSW generated in the Planning Area in 2013 (411,576 tons from Waste Generation Projections in Appendix B of the Needs
Assessment (November 2012)).
(2) Because these are viewed as long-term options with numerous implementation considerations, which would require further evaluation and integration of
costs with other systems, facilities and programs, no estimate is provided.

System Definition Page 24
Table 1-5 – Estimated Annualized Capital and Operating Expenses (2013$)
Option/Topic Annualized Capital
Expense
Annual Operating
Expense Total Annual Expenses
Source Reduction
(Education/Behavior Change) 0 $300,000 - $900,000 $300,000 - $900,000
Toxics Reduction
Modular Storage Container
Small Storage Building
Permanent Facility
$2,300 – $4,600
$3,100 - $7,600
$76,400 -
$267,000
$0
Not Estimated
$50,000-$150,000
$2,300 - $4,600--
Not Estimated
$126,000 - $417,000(1)
Yard Waste $0 N/A $0
Residential Recycling and Diversion
Containers
At $5 to $7 per household/month
At $3.50 - $5.00 per household/month
Containers Only
$500,000 -$700,000
Collection Only
$5,100,000 - $7,100,000
$3,600,000 - $5,100,000
$5,600,000 - $7,800,000(2)
$4,100,000 - $5,800,000(2)
Commercial Recycling and Diversion (3) (3) (3)
Construction and Demolition Materials
Recycling (3) (3) (3)
Organic Waste Diversion (Composting) (3) (3) $824,000 - $4,100,000(7)
• Waste Conversion Technologies (3) (3) $20,000,000(4)
Municipal Solid Waste Disposal
Expand on adjacent City property
$487,000-$722,000(5)
N/A
$487,000-$722,000(5)
Construction and Demolition Waste
Disposal
Expand on adjacent City property
$7,900(5)
N/A
$7,900(5)
Transfer Station and Processing
Facilities $450,000 - $610,000 Not Estimated Not Estimated(6)
N/A – Not Applicable
Notes:
(1) Annual costs are assumed to be reduced by grants and other funding sources for both capital and operations costs.
(2) Costs are a function of program and method of providing added services. Annual costs are estimated increases for
City-wide service and reflect the overall program cost. Collection costs are assumed to include all labor, equipment,
fuel, and other incidental costs and any revenue off-sets.
(3) No estimates of annual capital or operating costs are provided.
(4) Costs are based on $120 per ton and an assumed 168,000 tons per year managed by this technology.
(5) Assumes costs are accrued annually to fund future capital expenditures. Actual costs may need to be incurred on per
ton basis to reflect the effects of variations in tonnage on site life. This assumes advanced funding of future
construction, which has not been the method of cost accounting utilized in the past.
(6) Annual costs for debt, operations, maintenance, and hauling are assumed to be off-set by user fees if a facility is
deemed economically feasible.
(7) Costs are based on $40 to $100 per ton and 20,000 to 41,200 tons per year assumed to be managed by this
technology. Costs do not include collection.

System Definition Page 25
Table 1-6 – Implementation Actions for System Definition Options
Ch
an
ges
in
La
ws,
R
egu
lati
on
s a
nd
O
rdin
an
ces
Coo
per
ati
ve
Agre
em
ents
or
Arr
an
gem
ents
bet
ween
U
nit
s o
f G
ov
ern
men
t or
Pri
va
te E
nti
ties
Ad
dit
ion
al
Stu
die
s or
Eva
lua
tio
n
Mo
nit
ori
ng
an
d
En
forc
emen
t
Cost
s a
nd
Fu
nd
ing
Ed
uca
tio
na
l In
itia
tiv
es
an
d P
rom
oti
on
of
Beh
av
iora
l C
han
ges
Ch
an
ges
to E
xis
tin
g
Pro
gra
ms
Ma
rket
s
Source Reduction No - No No Yes Yes No -
Toxics Reduction - - Possibly No Yes Yes Yes No
Yard Waste No No No No Yes No No Yes
Residential Recycling
and Diversion Yes Yes Possibly Yes Yes Yes Yes Yes
Commercial Recycling
and Diversion Yes Yes Possibly Yes Yes Yes Yes Yes
Construction and
Demolition Materials
Recycling
Organic Waste
Diversion
(Composting)
Yes Yes Yes Yes Yes Yes Yes Yes
Waste Conversion
Technologies Yes Yes Yes Yes Yes Yes Yes Yes
Municipal Solid Waste
Disposal No No No No - No No No
Construction and
Demolition Waste
Disposal
No No No No - No No No
Transfer Station and
Processing Facilities Possibly Possibly Yes No Yes No Yes No
Changes in Laws, Regulations and Ordinances refers to major actions without which implementation
might not occur. An indication of “No” or “-” indicates that change would be minor in nature including
clarification, changes in definitions, changes incidental to the overall program change or to accommodate
program modification not anticipated to have major cost implications. This may also include changes
requiring legislative approval.
Cooperative Agreements or Arrangements between Units of Government or Private Entities refers
to formal agreements for services requiring approval by the City Council or Mayor. This does not include
agreements for such items as building construction. Examples of this might be processing agreements,
collection franchises or contracts, energy sales agreements, system operating agreements, or waste supply
agreements.
System Definition Page 26
Additional Studies or Evaluations refers to action that may be necessary to better define or help select
specific programs, program changes or to establish feasibility. This may also include assessment of
markets, costs or rate structures.
Monitoring and Enforcement refers to additional requirements anticipated to be necessary by the City to
assure that systems, facilities or programs are performing in accordance with applicable laws, regulations,
ordinances or agreements with the City.
Costs and Funding refers to program options where the stakeholders may incur added costs or where
municipal participation in funding may be required.
Educational Initiatives and Promotion of Behavioral Changes refers to public outreach and
educational efforts, efforts to promote or inform stakeholders of changes, and efforts to help ensure
program success or maximize outcomes.
Changes to Existing Programs refers to changes to the status quo. These would be changes deemed
necessary to implement the Preferred Path or to achieve a goal (e.g., reduced waste generation, increased
diversion of waste from landfill, resource conservation and recovery, reduction in air emissions, etc.).
Markets refers to the need to evaluate or secure markets as part of the implementation of an option or
program change.
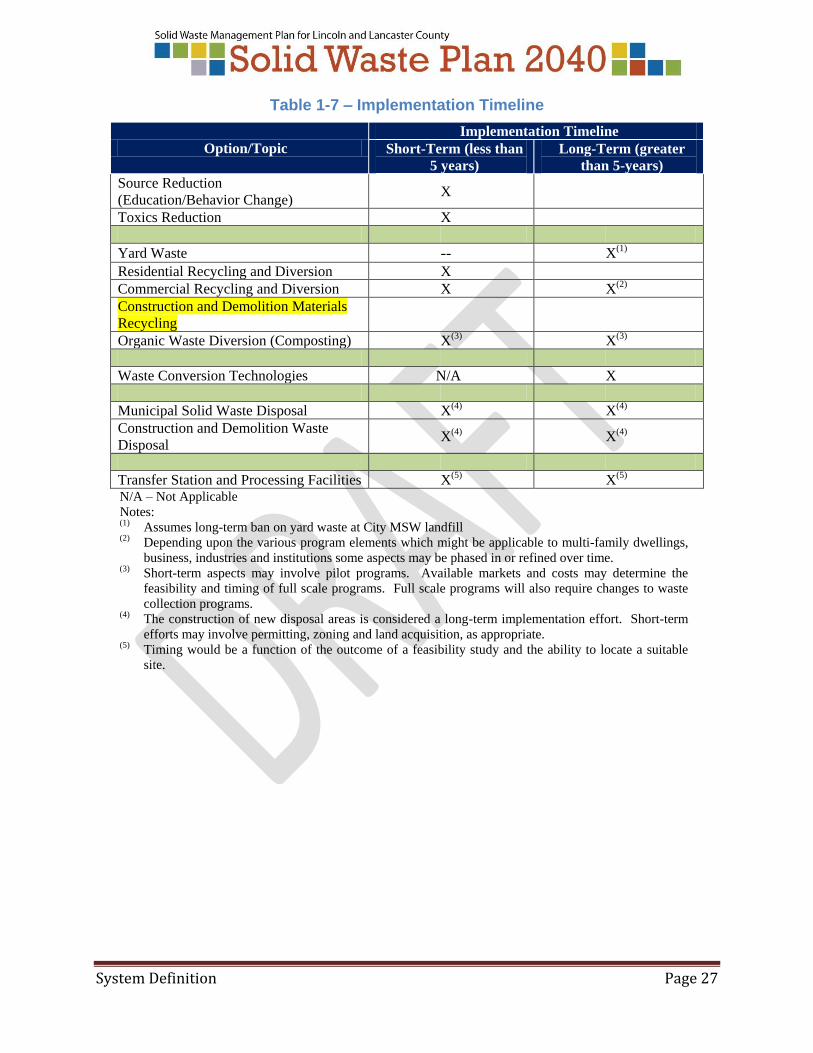
1.9.1 Implementation Timeline
As a part of the development of the final Solid Waste Plan 2040 an implementation timeline will be
developed. Ultimately decisions on the implementation timetable will fall upon elected officials.
If Preferred Path options are implemented, the general implementation timelines presented in Table 1-9
might be applicable.
System Definition Page 27
Table 1-7 – Implementation Timeline
Option/Topic
Implementation Timeline
Short-Term (less than
5 years)
Long-Term (greater
than 5-years)
Source Reduction
(Education/Behavior Change) X
Toxics Reduction X
Yard Waste -- X(1)
Residential Recycling and Diversion X
Commercial Recycling and Diversion X X(2)
Construction and Demolition Materials
Recycling
Organic Waste Diversion (Composting) X(3) X(3)
Waste Conversion Technologies N/A X
Municipal Solid Waste Disposal X(4) X(4)
Construction and Demolition Waste
Disposal X(4) X(4)
Transfer Station and Processing Facilities X(5) X(5) N/A – Not Applicable
Notes: (1) Assumes long-term ban on yard waste at City MSW landfill (2) Depending upon the various program elements which might be applicable to multi-family dwellings,
business, industries and institutions some aspects may be phased in or refined over time. (3) Short-term aspects may involve pilot programs. Available markets and costs may determine the
feasibility and timing of full scale programs. Full scale programs will also require changes to waste
collection programs. (4) The construction of new disposal areas is considered a long-term implementation effort. Short-term
efforts may involve permitting, zoning and land acquisition, as appropriate. (5) Timing would be a function of the outcome of a feasibility study and the ability to locate a suitable
site.