system analyzer 1 - texas instrumentsprocessors.wiki.ti.com/images/b/bc/mcsa1.1_user_guide.pdf ·...
TRANSCRIPT

System Analyzer 1.1
User’s Guide
Literature Number: SPRUH43DFebruary 2013
Preface
About This Guide
System Analyzer is a tool suite that provides visibility into the real-time performance and behavior of your software. It allows you to analyze the load, execution sequence, and timing of your single-core or multicore target applications. System Analyzer is made up of a number of components. Two key components of System Analyzer are:
• DVT. Various features of DVT provide the user interface for System Analyzer within Code Composer Studio (CCS).
• UIA. The Unified Instrumentation Architecture (UIA) target package defines APIs and transports that allow embedded software to log instrumentation data for use within CCS.
This document provides information about both the host-side and target-side components of System Analyzer.
Intended Audience
This document is intended for users of System Analyzer.
This document assumes you have knowledge of inter-process communication concepts and the capabilities of the processors available to your application. This document also assumes that you are familiar with Code Composer Studio, SYS/BIOS, and XDCtools.
See Section 3.1, Different Types of Analysis for Different Users for more about the categories of users for System Analyzer.
Notational Conventions
This document uses the following conventions:
• When the pound sign (#) is used in filenames or directory paths, you should replace the # sign with the version number of the release you are using. A # sign may represent one or more digits of a version number.
• Program listings, program examples, and interactive displays are shown in a mono-spaced font. Examples use bold for emphasis, and interactive displays use bold to distinguish commands that you enter from items that the system displays (such as prompts, command output, error messages, etc.).
• Square brackets ( [ and ] ) identify an optional parameter. If you use an optional parameter, you specify the information within the brackets. Unless the square brackets are in a bold typeface, do not enter the brackets themselves.
Documentation Feedback
If you have comments about this document, please provide feedback by using the link at the bottom of the page. This link is for reporting errors or providing comments about a technical document. Using this link to ask technical support questions will delay getting a response to you.
2 Preface SPRUH43D—February 2013Submit Documentation Feedback

www.ti.com Trademarks
Trademarks
Registered trademarks of Texas Instruments include Stellaris and StellarisWare. Trademarks of Texas Instruments include: the Texas Instruments logo, Texas Instruments, TI, TI.COM, C2000, C5000, C6000, Code Composer Studio, Concerto, controlSUITE, DaVinci, DSP/BIOS, eXpressDSP, Grace, MSP430, OMAP, RTDX, SPOX, TMS320, TMS320C2000, TMS320C5000, and TMS320C6000.
MS-DOS, Windows, and Windows NT are trademarks of Microsoft Corporation.
Linux is a registered trademark of Linus Torvalds.
All other brand, product names, and service names are trademarks or registered trademarks of their respective companies or organizations.
February 28, 2013
SPRUH43D—February 2013 Preface 3Submit Documentation Feedback

Contents
1 Overview of System Analyzer . . . . . . . . . . . . . . . . . . . . . . . . . . . . . . . . . . . . . . . . . . . . . . . . . . . . . . . . . 71.1 Introduction . . . . . . . . . . . . . . . . . . . . . . . . . . . . . . . . . . . . . . . . . . . . . . . . . . . . . . . . . . . . . . . . . . . . 8
1.1.1 What Analysis and Visualization Capabilities are Provided? . . . . . . . . . . . . . . . . . . . . . . . . 81.1.2 What the UIA Target Software Package Provides . . . . . . . . . . . . . . . . . . . . . . . . . . . . . . . . 9
1.2 System Analyzer Terminology . . . . . . . . . . . . . . . . . . . . . . . . . . . . . . . . . . . . . . . . . . . . . . . . . . . . 101.3 Using System Analyzer with Your Application Software. . . . . . . . . . . . . . . . . . . . . . . . . . . . . . . . . 11
1.3.1 Instrumenting Your Application Using UIA. . . . . . . . . . . . . . . . . . . . . . . . . . . . . . . . . . . . . 111.3.2 Capturing and Uploading Events Using UIA . . . . . . . . . . . . . . . . . . . . . . . . . . . . . . . . . . . 12
1.4 Communicating Over Non-JTAG Transports . . . . . . . . . . . . . . . . . . . . . . . . . . . . . . . . . . . . . . . . . 131.4.1 Communication for EVM6472 Single-Core . . . . . . . . . . . . . . . . . . . . . . . . . . . . . . . . . . . . 141.4.2 Communication for EVM6472 Multicore . . . . . . . . . . . . . . . . . . . . . . . . . . . . . . . . . . . . . . 141.4.3 Communication for EVMTI816x . . . . . . . . . . . . . . . . . . . . . . . . . . . . . . . . . . . . . . . . . . . . . 151.4.4 Communication for TCI6616 . . . . . . . . . . . . . . . . . . . . . . . . . . . . . . . . . . . . . . . . . . . . . . . 15
1.5 About this User Guide. . . . . . . . . . . . . . . . . . . . . . . . . . . . . . . . . . . . . . . . . . . . . . . . . . . . . . . . . . . 151.6 Learning More about System Analyzer. . . . . . . . . . . . . . . . . . . . . . . . . . . . . . . . . . . . . . . . . . . . . . 16
2 Installing System Analyzer . . . . . . . . . . . . . . . . . . . . . . . . . . . . . . . . . . . . . . . . . . . . . . . . . . . . . . . . . . 172.1 System Analyzer Installation Overview. . . . . . . . . . . . . . . . . . . . . . . . . . . . . . . . . . . . . . . . . . . . . . 182.2 Installing System Analyzer as Part of a Larger Product . . . . . . . . . . . . . . . . . . . . . . . . . . . . . . . . . 182.3 Installing System Analyzer as a Software Update . . . . . . . . . . . . . . . . . . . . . . . . . . . . . . . . . . . . . 192.4 Installing and Using UIA Outside CCS . . . . . . . . . . . . . . . . . . . . . . . . . . . . . . . . . . . . . . . . . . . . . . 19
3 Tasks and Roadmaps for System Analyzer . . . . . . . . . . . . . . . . . . . . . . . . . . . . . . . . . . . . . . . . . . . . 203.1 Different Types of Analysis for Different Users. . . . . . . . . . . . . . . . . . . . . . . . . . . . . . . . . . . . . . . . 213.2 Analyzing System Loading with System Analyzer . . . . . . . . . . . . . . . . . . . . . . . . . . . . . . . . . . . . . 223.3 Analyzing the Execution Sequence with System Analyzer . . . . . . . . . . . . . . . . . . . . . . . . . . . . . . . 243.4 Performing Count Analysis with System Analyzer . . . . . . . . . . . . . . . . . . . . . . . . . . . . . . . . . . . . . 253.5 Benchmarking with System Analyzer . . . . . . . . . . . . . . . . . . . . . . . . . . . . . . . . . . . . . . . . . . . . . . . 273.6 Troubleshooting System Analyzer Connections . . . . . . . . . . . . . . . . . . . . . . . . . . . . . . . . . . . . . . . 28
3.6.1 If You Cannot Connect to the Target with System Analyzer . . . . . . . . . . . . . . . . . . . . . . . 283.6.2 If No Events are Shown in System Analyzer Features . . . . . . . . . . . . . . . . . . . . . . . . . . . 293.6.3 If System Analyzer Events are Being Dropped . . . . . . . . . . . . . . . . . . . . . . . . . . . . . . . . . 293.6.4 If System Analyzer Packets are Being Dropped . . . . . . . . . . . . . . . . . . . . . . . . . . . . . . . . 293.6.5 If Events Stop Being Show Near the Beginning. . . . . . . . . . . . . . . . . . . . . . . . . . . . . . . . . 293.6.6 If System Analyzer Events Do Not Make Sense . . . . . . . . . . . . . . . . . . . . . . . . . . . . . . . . 303.6.7 If Data is Not Correlated for Multicore System. . . . . . . . . . . . . . . . . . . . . . . . . . . . . . . . . . 303.6.8 If the Time Value is Too Large. . . . . . . . . . . . . . . . . . . . . . . . . . . . . . . . . . . . . . . . . . . . . . 30
3.7 Creating Sample System Analyzer Projects . . . . . . . . . . . . . . . . . . . . . . . . . . . . . . . . . . . . . . . . . . 313.7.1 Notes for EVM6472 MessageQ Project Templates . . . . . . . . . . . . . . . . . . . . . . . . . . . . . . 323.7.2 Notes for EVMTI816x SimpleTask Project Templates. . . . . . . . . . . . . . . . . . . . . . . . . . . . 333.7.3 Notes for Single-Core Stairstep Project Templates . . . . . . . . . . . . . . . . . . . . . . . . . . . . . . 343.7.4 Notes for System Analyzer Tutorial Project Templates . . . . . . . . . . . . . . . . . . . . . . . . . . . 34
3.8 Special Features of System Analyzer Data Views . . . . . . . . . . . . . . . . . . . . . . . . . . . . . . . . . . . . . 353.8.1 Zoom (Graphs Only) . . . . . . . . . . . . . . . . . . . . . . . . . . . . . . . . . . . . . . . . . . . . . . . . . . . . . 36
4 Contents SPRUH43D—February 2013Submit Documentation Feedback
www.ti.com Contents
3.8.2 Measurement Markers (Graphs Only) . . . . . . . . . . . . . . . . . . . . . . . . . . . . . . . . . . . . . . . . 363.8.3 Bookmarks . . . . . . . . . . . . . . . . . . . . . . . . . . . . . . . . . . . . . . . . . . . . . . . . . . . . . . . . . . . . . 373.8.4 Groups and Synchronous Scrolling . . . . . . . . . . . . . . . . . . . . . . . . . . . . . . . . . . . . . . . . . . 383.8.5 Find . . . . . . . . . . . . . . . . . . . . . . . . . . . . . . . . . . . . . . . . . . . . . . . . . . . . . . . . . . . . . . . . . . 383.8.6 Filter . . . . . . . . . . . . . . . . . . . . . . . . . . . . . . . . . . . . . . . . . . . . . . . . . . . . . . . . . . . . . . . . . . 403.8.7 Export. . . . . . . . . . . . . . . . . . . . . . . . . . . . . . . . . . . . . . . . . . . . . . . . . . . . . . . . . . . . . . . . . 423.8.8 Cursor and Scroll Lock. . . . . . . . . . . . . . . . . . . . . . . . . . . . . . . . . . . . . . . . . . . . . . . . . . . . 423.8.9 Column Settings and Display Properties . . . . . . . . . . . . . . . . . . . . . . . . . . . . . . . . . . . . . . 42
4 Using System Analyzer in Code Composer Studio . . . . . . . . . . . . . . . . . . . . . . . . . . . . . . . . . . . . . . 434.1 Overview of System Analyzer Features . . . . . . . . . . . . . . . . . . . . . . . . . . . . . . . . . . . . . . . . . . . . . 444.2 Starting a Live System Analyzer Session . . . . . . . . . . . . . . . . . . . . . . . . . . . . . . . . . . . . . . . . . . . . 454.3 System Analyzer Features and Views . . . . . . . . . . . . . . . . . . . . . . . . . . . . . . . . . . . . . . . . . . . . . . 48
4.3.1 More Ways to Open Analysis Features . . . . . . . . . . . . . . . . . . . . . . . . . . . . . . . . . . . . . . . 494.3.2 More Ways to Open Views . . . . . . . . . . . . . . . . . . . . . . . . . . . . . . . . . . . . . . . . . . . . . . . . 51
4.4 Managing a System Analyzer Session . . . . . . . . . . . . . . . . . . . . . . . . . . . . . . . . . . . . . . . . . . . . . . 524.4.1 Closing a System Analyzer Session . . . . . . . . . . . . . . . . . . . . . . . . . . . . . . . . . . . . . . . . . 53
4.5 Configuring System Analyzer Transports and Endpoints . . . . . . . . . . . . . . . . . . . . . . . . . . . . . . . . 544.6 Opening CSV and Binary Files Containing System Analyzer Data . . . . . . . . . . . . . . . . . . . . . . . . 57
4.6.1 Opening a CSV File . . . . . . . . . . . . . . . . . . . . . . . . . . . . . . . . . . . . . . . . . . . . . . . . . . . . . . 574.6.2 Opening a Binary File . . . . . . . . . . . . . . . . . . . . . . . . . . . . . . . . . . . . . . . . . . . . . . . . . . . . 58
4.7 Using the Log View. . . . . . . . . . . . . . . . . . . . . . . . . . . . . . . . . . . . . . . . . . . . . . . . . . . . . . . . . . . . . 614.8 Using the Concurrency Feature . . . . . . . . . . . . . . . . . . . . . . . . . . . . . . . . . . . . . . . . . . . . . . . . . . . 65
4.8.1 Summary View for Concurrency . . . . . . . . . . . . . . . . . . . . . . . . . . . . . . . . . . . . . . . . . . . . 664.8.2 How Concurrency Works . . . . . . . . . . . . . . . . . . . . . . . . . . . . . . . . . . . . . . . . . . . . . . . . . . 66
4.9 Using the Count Analysis . . . . . . . . . . . . . . . . . . . . . . . . . . . . . . . . . . . . . . . . . . . . . . . . . . . . . . . . 674.9.1 Detail View for Count Analysis. . . . . . . . . . . . . . . . . . . . . . . . . . . . . . . . . . . . . . . . . . . . . . 684.9.2 Graph View for Count Analysis . . . . . . . . . . . . . . . . . . . . . . . . . . . . . . . . . . . . . . . . . . . . . 694.9.3 How Count Analysis Works . . . . . . . . . . . . . . . . . . . . . . . . . . . . . . . . . . . . . . . . . . . . . . . . 70
4.10 Using the CPU Load View . . . . . . . . . . . . . . . . . . . . . . . . . . . . . . . . . . . . . . . . . . . . . . . . . . . . . . . 704.10.1 Summary View for CPU Load . . . . . . . . . . . . . . . . . . . . . . . . . . . . . . . . . . . . . . . . . . . . . . 714.10.2 Detail View for CPU Load . . . . . . . . . . . . . . . . . . . . . . . . . . . . . . . . . . . . . . . . . . . . . . . . . 724.10.3 How CPU Load Works . . . . . . . . . . . . . . . . . . . . . . . . . . . . . . . . . . . . . . . . . . . . . . . . . . . . 72
4.11 Using the Printf Logs . . . . . . . . . . . . . . . . . . . . . . . . . . . . . . . . . . . . . . . . . . . . . . . . . . . . . . . . . . . 734.12 Using the Task Load View . . . . . . . . . . . . . . . . . . . . . . . . . . . . . . . . . . . . . . . . . . . . . . . . . . . . . . . 74
4.12.1 Summary View for Task Load . . . . . . . . . . . . . . . . . . . . . . . . . . . . . . . . . . . . . . . . . . . . . . 754.12.2 Detail View for Task Load . . . . . . . . . . . . . . . . . . . . . . . . . . . . . . . . . . . . . . . . . . . . . . . . . 764.12.3 How Task Load Works. . . . . . . . . . . . . . . . . . . . . . . . . . . . . . . . . . . . . . . . . . . . . . . . . . . . 76
4.13 Using Context Aware Profile . . . . . . . . . . . . . . . . . . . . . . . . . . . . . . . . . . . . . . . . . . . . . . . . . . . . . . 774.13.1 Detail View for Context Aware Profile . . . . . . . . . . . . . . . . . . . . . . . . . . . . . . . . . . . . . . . . 784.13.2 Graph Views for Context Aware Profile . . . . . . . . . . . . . . . . . . . . . . . . . . . . . . . . . . . . . . . 794.13.3 How Context Aware Profiling Works . . . . . . . . . . . . . . . . . . . . . . . . . . . . . . . . . . . . . . . . . 804.13.4 Profiling Functions Using Enter and Exit Hook Functions . . . . . . . . . . . . . . . . . . . . . . . . . 81
4.14 Using the Duration Feature. . . . . . . . . . . . . . . . . . . . . . . . . . . . . . . . . . . . . . . . . . . . . . . . . . . . . . . 824.14.1 Detail View for Duration Analysis. . . . . . . . . . . . . . . . . . . . . . . . . . . . . . . . . . . . . . . . . . . . 844.14.2 Graph View for Duration Analysis . . . . . . . . . . . . . . . . . . . . . . . . . . . . . . . . . . . . . . . . . . . 854.14.3 How Duration Analysis Works . . . . . . . . . . . . . . . . . . . . . . . . . . . . . . . . . . . . . . . . . . . . . . 85
4.15 Using the Task Profiler . . . . . . . . . . . . . . . . . . . . . . . . . . . . . . . . . . . . . . . . . . . . . . . . . . . . . . . . . . 864.16 Using the Execution Graph. . . . . . . . . . . . . . . . . . . . . . . . . . . . . . . . . . . . . . . . . . . . . . . . . . . . . . . 88
SPRUH43D—February 2013 Contents 5Submit Documentation Feedback
Contents www.ti.com
4.16.1 How the Execution Graph Works. . . . . . . . . . . . . . . . . . . . . . . . . . . . . . . . . . . . . . . . . . . . 894.17 Using System Analyzer with Non-UIA Applications . . . . . . . . . . . . . . . . . . . . . . . . . . . . . . . . . . . . 90
5 UIA Configuration and Coding on the Target . . . . . . . . . . . . . . . . . . . . . . . . . . . . . . . . . . . . . . . . . . . 915.1 Quickly Enabling UIA Instrumentation . . . . . . . . . . . . . . . . . . . . . . . . . . . . . . . . . . . . . . . . . . . . . . 92
5.1.1 Using XGCONF to Enable UIA Instrumentation . . . . . . . . . . . . . . . . . . . . . . . . . . . . . . . . 935.2 Configuring SYS/BIOS Logging . . . . . . . . . . . . . . . . . . . . . . . . . . . . . . . . . . . . . . . . . . . . . . . . . . . 95
5.2.1 Enabling and Disabling Load Logging . . . . . . . . . . . . . . . . . . . . . . . . . . . . . . . . . . . . . . . . 955.2.2 Enabling and Disabling Event Logging . . . . . . . . . . . . . . . . . . . . . . . . . . . . . . . . . . . . . . . 965.2.3 More About Diags Masks. . . . . . . . . . . . . . . . . . . . . . . . . . . . . . . . . . . . . . . . . . . . . . . . . . 975.2.4 Setting Diags Masks at Run-time. . . . . . . . . . . . . . . . . . . . . . . . . . . . . . . . . . . . . . . . . . . . 98
5.3 Customizing the Configuration of UIA Modules . . . . . . . . . . . . . . . . . . . . . . . . . . . . . . . . . . . . . . . 985.3.1 Configuring ti.uia.sysbios.LoggingSetup . . . . . . . . . . . . . . . . . . . . . . . . . . . . . . . . . . . . . . 985.3.2 Configuring ti.uia.services.Rta . . . . . . . . . . . . . . . . . . . . . . . . . . . . . . . . . . . . . . . . . . . . . 1025.3.3 Configuring ti.uia.runtime.ServiceMgr . . . . . . . . . . . . . . . . . . . . . . . . . . . . . . . . . . . . . . . 1035.3.4 Configuring ti.uia.runtime.LoggerCircBuf . . . . . . . . . . . . . . . . . . . . . . . . . . . . . . . . . . . . . 1065.3.5 Configuring ti.uia.runtime.LoggerSM . . . . . . . . . . . . . . . . . . . . . . . . . . . . . . . . . . . . . . . . 1085.3.6 Configuring ti.uia.sysbios.LoggerIdle . . . . . . . . . . . . . . . . . . . . . . . . . . . . . . . . . . . . . . . . 1135.3.7 Configuring ti.uia.runtime.LogSync . . . . . . . . . . . . . . . . . . . . . . . . . . . . . . . . . . . . . . . . . 1145.3.8 Configuring IPC . . . . . . . . . . . . . . . . . . . . . . . . . . . . . . . . . . . . . . . . . . . . . . . . . . . . . . . . 118
5.4 Target-Side Coding with UIA APIs . . . . . . . . . . . . . . . . . . . . . . . . . . . . . . . . . . . . . . . . . . . . . . . . 1185.4.1 Logging Events with Log_write() Functions . . . . . . . . . . . . . . . . . . . . . . . . . . . . . . . . . . . 1195.4.2 Enabling Event Output with the Diagnostics Mask . . . . . . . . . . . . . . . . . . . . . . . . . . . . . 1195.4.3 Events Provided by UIA . . . . . . . . . . . . . . . . . . . . . . . . . . . . . . . . . . . . . . . . . . . . . . . . . . 1205.4.4 LogSnapshot APIs for Logging State Information . . . . . . . . . . . . . . . . . . . . . . . . . . . . . . 1225.4.5 LogSync APIs for Multicore Timestamps. . . . . . . . . . . . . . . . . . . . . . . . . . . . . . . . . . . . . 1235.4.6 LogCtxChg APIs for Logging Context Switches. . . . . . . . . . . . . . . . . . . . . . . . . . . . . . . . 1245.4.7 Rta Module APIs for Controlling Loggers. . . . . . . . . . . . . . . . . . . . . . . . . . . . . . . . . . . . . 1245.4.8 Custom Transport Functions for Use with ServiceMgr . . . . . . . . . . . . . . . . . . . . . . . . . . 125
6 Advanced Topics for System Analyzer . . . . . . . . . . . . . . . . . . . . . . . . . . . . . . . . . . . . . . . . . . . . . . . 1286.1 IPC and SysLink Usage . . . . . . . . . . . . . . . . . . . . . . . . . . . . . . . . . . . . . . . . . . . . . . . . . . . . . . . . 1296.2 Linux Support for UIA Packet Routing . . . . . . . . . . . . . . . . . . . . . . . . . . . . . . . . . . . . . . . . . . . . . 1306.3 Rebuilding Target-Side UIA Modules . . . . . . . . . . . . . . . . . . . . . . . . . . . . . . . . . . . . . . . . . . . . . . 1316.4 Benchmarks . . . . . . . . . . . . . . . . . . . . . . . . . . . . . . . . . . . . . . . . . . . . . . . . . . . . . . . . . . . . . . . . . 133
6.4.1 UIA Benchmarks for EVM6472 . . . . . . . . . . . . . . . . . . . . . . . . . . . . . . . . . . . . . . . . . . . . 1336.4.2 UIA Benchmarks for EVMTI816x . . . . . . . . . . . . . . . . . . . . . . . . . . . . . . . . . . . . . . . . . . . 133
6 Contents SPRUH43D—February 2013Submit Documentation Feedback
Chapter 1
Overview of System Analyzer
This chapter provides an introduction to System Analyzer’s host-side and target-side components.
1.1 Introduction . . . . . . . . . . . . . . . . . . . . . . . . . . . . . . . . . . . . . . . . . . . . . . . 8
1.2 System Analyzer Terminology . . . . . . . . . . . . . . . . . . . . . . . . . . . . . . . 10
1.3 Using System Analyzer with Your Application Software. . . . . . . . . . 11
1.4 Communicating Over Non-JTAG Transports . . . . . . . . . . . . . . . . . . . 13
1.5 About this User Guide . . . . . . . . . . . . . . . . . . . . . . . . . . . . . . . . . . . . . 15
1.6 Learning More about System Analyzer . . . . . . . . . . . . . . . . . . . . . . . . 16
Topic Page
SPRUH43D—February 2013 Overview of System Analyzer 7Submit Documentation Feedback

Introduction www.ti.com
1.1 Introduction
Instrumenting software with print statements to provide visibility into the operation of the software at run-time has long been one of the keys to creating maintainable software that works. As devices become increasingly complex, the system-level visibility provided by software instrumentation is an increasingly important success factor, as it helps to diagnose problems both in the lab during development and in the field.
One of the key advantages of instrumented software is that, unlike debug sessions, the statements used are part of the code-base. This can help other developers figure out what is going on as the software executes. It can also highlight integration problems and error conditions that would be hard to detect otherwise.
As a result, many groups create their own logging APIs. Unfortunately, what often happens is that the logging APIs they create are closely tied to particular hardware and operating systems, use incompatible logging infrastructures, make assumptions about the acceptable amount of memory or CPU overhead, generate logs in a diverse range of formats, may not include timestamps, or may use different time-bases (ticks, cycles, wall-clock, etc.). All of these differences make it difficult to port code from one system to another, difficult to integrate software from different development groups, difficult or impossible to correlate events from different cores on the same device, and costly to create tooling to provide ease-of-use, analysis and visualization capabilities.
The System Analyzer tool suite provides a consistent and portable way to instrument software. It enables software to be re-used with a variety of silicon devices, software applications, and product contexts. It includes both host-side tooling and target-side code modules (the UIA software package). These work together to provide visibility into the real-time performance and behavior of software running on TI's embedded single-core and multicore devices.
1.1.1 What Analysis and Visualization Capabilities are Provided?
The host-side System Analyzer tools use TI's Data Visualization Technology (DVT) to provide the following features for target applications that have been instrumented with the UIA target software package:
• Advanced analysis features for data analysis and visualization. Features include the ability to view the CPU and thread loads, the execution sequence, thread durations, and context profiling.
• Multicore event correlation. Allows software instrumentation events from multiple cores on multicore devices to be displayed on the same timeline, allowing users to see the timing relationships between events that happened on different CPUs.
• Run-time analysis. For targets that support either the UIA Ethernet transport or real-time JTAG transport, events can be uploaded from the target to System Analyzer while the target is running without having to halt the target. This ensures that actual program behavior can be observed, without the disruption of program execution that occurs when one or more cores are halted.
8 Overview of System Analyzer SPRUH43D—February 2013Submit Documentation Feedback
www.ti.com Introduction
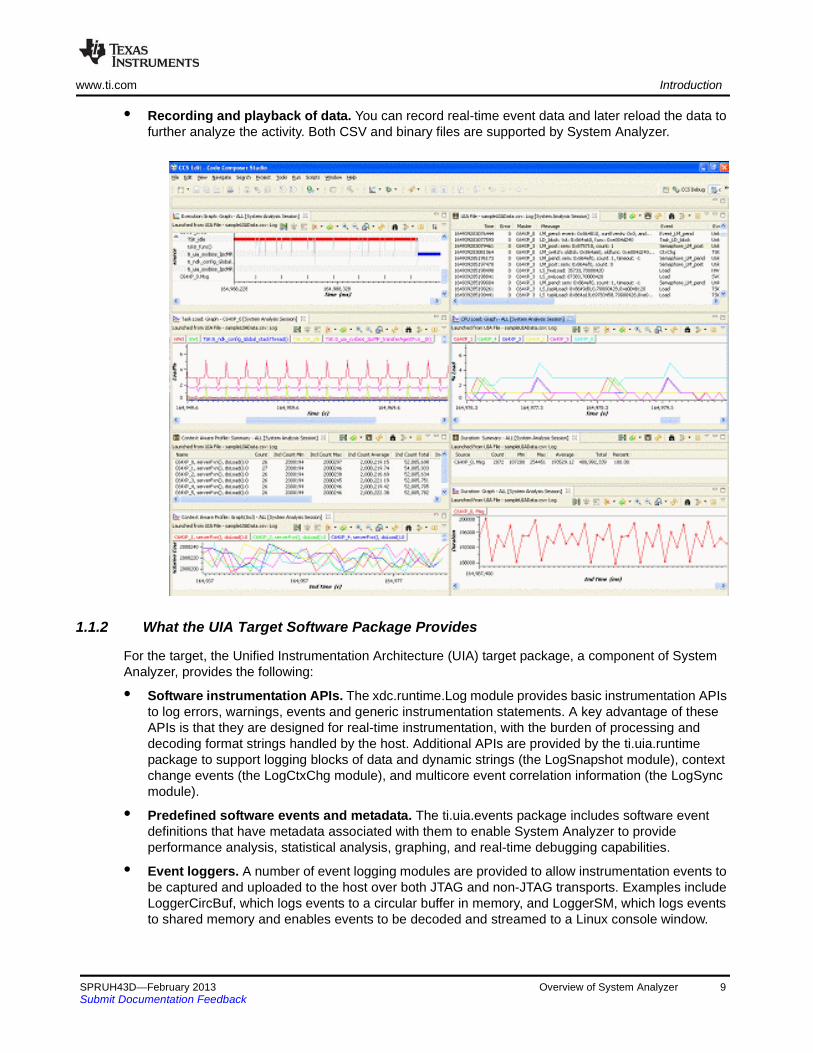
• Recording and playback of data. You can record real-time event data and later reload the data to further analyze the activity. Both CSV and binary files are supported by System Analyzer.
1.1.2 What the UIA Target Software Package Provides
For the target, the Unified Instrumentation Architecture (UIA) target package, a component of System Analyzer, provides the following:
• Software instrumentation APIs. The xdc.runtime.Log module provides basic instrumentation APIs to log errors, warnings, events and generic instrumentation statements. A key advantage of these APIs is that they are designed for real-time instrumentation, with the burden of processing and decoding format strings handled by the host. Additional APIs are provided by the ti.uia.runtime package to support logging blocks of data and dynamic strings (the LogSnapshot module), context change events (the LogCtxChg module), and multicore event correlation information (the LogSync module).
• Predefined software events and metadata. The ti.uia.events package includes software event definitions that have metadata associated with them to enable System Analyzer to provide performance analysis, statistical analysis, graphing, and real-time debugging capabilities.
• Event loggers. A number of event logging modules are provided to allow instrumentation events to be captured and uploaded to the host over both JTAG and non-JTAG transports. Examples include LoggerCircBuf, which logs events to a circular buffer in memory, and LoggerSM, which logs events to shared memory and enables events to be decoded and streamed to a Linux console window.
SPRUH43D—February 2013 Overview of System Analyzer 9Submit Documentation Feedback

System Analyzer Terminology www.ti.com
• Transports. Both JTAG-based and non-JTAG transports can be used for communication between the target and the host. Non-JTAG transports include Ethernet, with UDP used to upload events to the host and TCP used for bidirectional communication between the target and the host.
• SYS/BIOS event capture and transport. For example, when UIA is enabled, SYS/BIOS uses UIA to transfer data about CPU Load, Task Load, and Task Execution to the host.
• Multicore support. UIA supports routing events and messages across a central master core. It also supports logging synchronization information to enable correlation of events from multiple cores so that they can be viewed on a common timeline.
• Scalable solutions. UIA allows different solutions to be used for different devices.
• Examples. UIA includes working examples for the supported boards.
• Source code. UIA modules can be modified and rebuilt to facilitate porting and customization.
1.2 System Analyzer Terminology
You should be familiar with the following terms when using this manual.
• System Analyzer. A suite of host-side tools that use data captured from software instrumentation, hardware instrumentation, and CPU trace to provide visibility into the real-time performance and behavior of target applications.
• UIA. Unified Instrumentation Architecture. A target-side package that provides instrumentation services.
• DVT. Data Visualization Technology. Provides a common platform to display real-time SYS/BIOS and trace data as lists and graphically. Used in the System Analyzer features. Also used in such CCS features as STM Logic and Statistics Analyzer and Trace Analyzer.
• CCS. Code Composer Studio. The integrated development environment (IDE) for TI's DSPs, microcontrollers, and application processors.
• Analysis Feature. A System Analyzer tool provided by DVT for use in the analysis of instrumentation data. A feature typically consists of several related views. For example, "CPU Load" is an Analysis Feature that includes summary, detail, and graph views.
• Core. An embedded processor. Also called a CPU.
• Host. The processor that communicates with the target(s) to collect instrumentation data. For example, a PC running Code Composer Studio.
• Target. A processor running target code. Generally this is an embedded processor such as a DSP or microcontroller.
• UIA Packets. Generic term for either Events or Messages. A UIA packet can hold multiple events or a single message.
• Events. Instrumentation data sent from the target to the host For example, Log records.
• Messages. Actions that are sent between the host and target. For example, commands, acknowledgements, and results.
• Service. A component that supplies some type of host/target interaction. There can be multiple services in a system. An example is the Rta Service that provides XDC Log information.
• IPC. Inter-Processor Communication. A software product containing modules designed to allow communication between processors in a multi-processor environment.
10 Overview of System Analyzer SPRUH43D—February 2013Submit Documentation Feedback

www.ti.com Using System Analyzer with Your Application Software
• JTAG. Joint Test Action Group. IEEE specification (IEEE 1149.1) for a serial interface used for debugging integrated circuits.
• MADU. Minimum Addressable Data Unit. Also called MAU. The minimum sized data that can be accessed by a particular CPU. Different architectures have different size MADUs. For the C6000 architecture, the MADU for both code and data is an 8-bit byte.
• NDK. Network Developer’s Kit. Contains libraries that support the development of networking applications.
• SYS/BIOS. A real-time operating system for a number of TI's DSPs, microcontrollers, and application processors. Previously called DSP/BIOS.
• SysLink. Run-time software and an associated porting kit to simplify the development of embedded applications in which either General-Purpose microprocessors (GPPs) or DSPs communicate with each other.
• RTSC. Real-Time Software Components. A standard for packaging and configuring software components. XDCtools is an implementation of the RTSC standard.
• UART. Universal Asynchronous Receiver/Transmitter. A UART chip controls the interface to serial devices.
• XDCtools. A product that contains tools needed to create, test, deploy, install, and use RTSC components. RTSC standardizes the delivery of target content.
• xdc.runtime. A package of low-level target-software modules included with XDCtools that provides "core" services appropriate for embedded C/C++ applications, including real-time diagnostics, concurrency support, memory management, and system services.
1.3 Using System Analyzer with Your Application Software
System Analyzer provides flexible ways to instrument your application and to configure how logged events are uploaded to the host.
1.3.1 Instrumenting Your Application Using UIA
There are a number of different ways to take advantage of the real-time visibility capabilities provided by System Analyzer and the UIA target software:
• SYS/BIOS modules provide built-in software instrumentation that can be enabled to provide visibility into CPU Load, Task Load, and Task Execution "out of the box". (See Section 3.2 and Section 3.3).
• The UIA and xdc.runtime.Log APIs can be used in your C or C++ code directly to log software events to instrument your application code. You don't have to write RTSC modules; just #include the appropriate header files in your software and call the provided APIs. Examples are provided in Section 5.4 as well as in the help files that ship with the UIA target content.
• Macros can be used to wrap the UIA and XDC event logging APIs so that they can be called using the same API signature as other event logging APIs your software may already be using for software instrumentation. More information is provided on the wiki page at http://processors.wiki.ti.com/index.php/Multicore_System_Analyzer.
SPRUH43D—February 2013 Overview of System Analyzer 11Submit Documentation Feedback
Using System Analyzer with Your Application Software www.ti.com
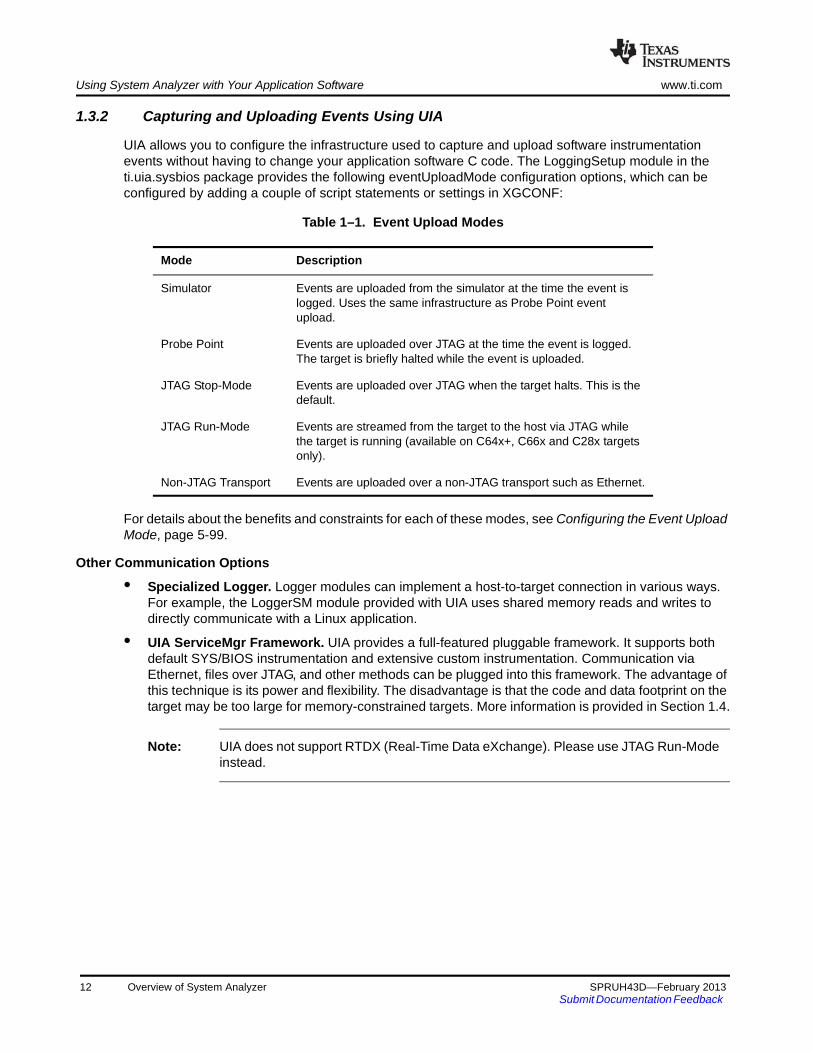
1.3.2 Capturing and Uploading Events Using UIA
UIA allows you to configure the infrastructure used to capture and upload software instrumentation events without having to change your application software C code. The LoggingSetup module in the ti.uia.sysbios package provides the following eventUploadMode configuration options, which can be configured by adding a couple of script statements or settings in XGCONF:
Table 1–1. Event Upload Modes
For details about the benefits and constraints for each of these modes, see Configuring the Event Upload Mode, page 5-99.
Other Communication Options
• Specialized Logger. Logger modules can implement a host-to-target connection in various ways. For example, the LoggerSM module provided with UIA uses shared memory reads and writes to directly communicate with a Linux application.
• UIA ServiceMgr Framework. UIA provides a full-featured pluggable framework. It supports both default SYS/BIOS instrumentation and extensive custom instrumentation. Communication via Ethernet, files over JTAG, and other methods can be plugged into this framework. The advantage of this technique is its power and flexibility. The disadvantage is that the code and data footprint on the target may be too large for memory-constrained targets. More information is provided in Section 1.4.
Note: UIA does not support RTDX (Real-Time Data eXchange). Please use JTAG Run-Mode instead.
Mode Description
Simulator Events are uploaded from the simulator at the time the event is logged. Uses the same infrastructure as Probe Point event upload.
Probe Point Events are uploaded over JTAG at the time the event is logged. The target is briefly halted while the event is uploaded.
JTAG Stop-Mode Events are uploaded over JTAG when the target halts. This is the default.
JTAG Run-Mode Events are streamed from the target to the host via JTAG while the target is running (available on C64x+, C66x and C28x targets only).
Non-JTAG Transport Events are uploaded over a non-JTAG transport such as Ethernet.
12 Overview of System Analyzer SPRUH43D—February 2013Submit Documentation Feedback
www.ti.com Communicating Over Non-JTAG Transports
1.4 Communicating Over Non-JTAG Transports
UIA manages communication between the target(s) and the host by providing a ServiceMgr module that is responsible for sending and receiving packets between the services on the target and the host.
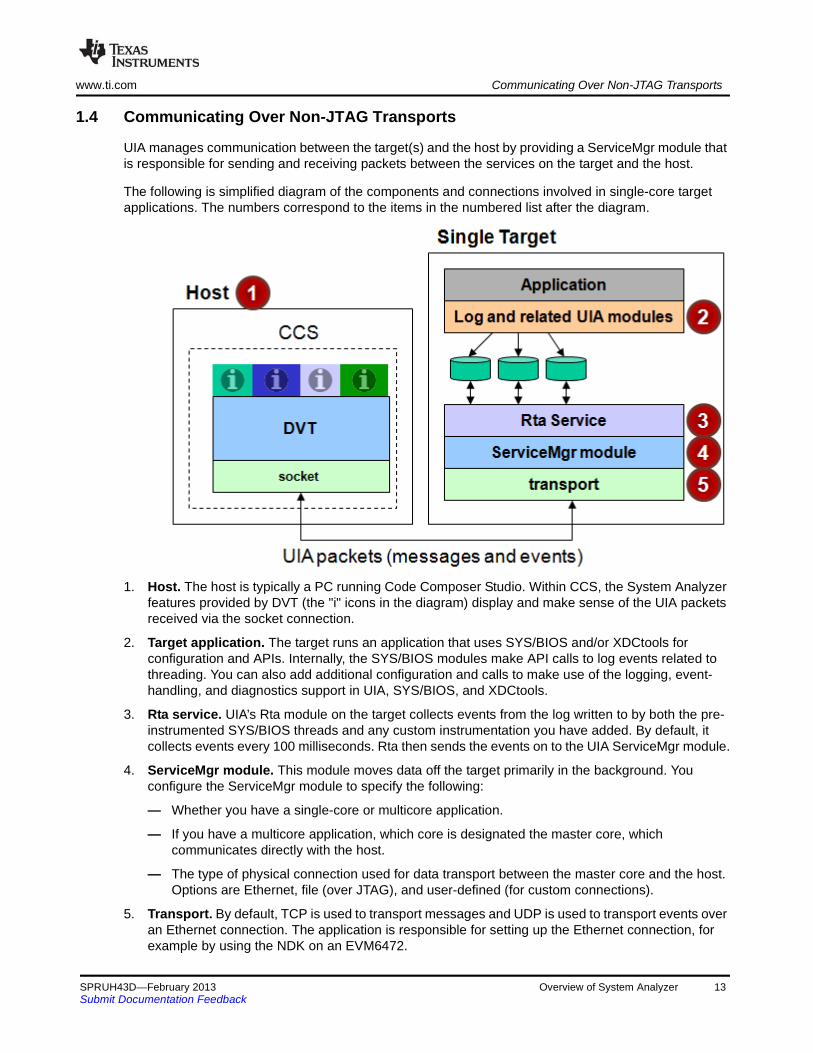
The following is simplified diagram of the components and connections involved in single-core target applications. The numbers correspond to the items in the numbered list after the diagram.
1. Host. The host is typically a PC running Code Composer Studio. Within CCS, the System Analyzer features provided by DVT (the "i" icons in the diagram) display and make sense of the UIA packets received via the socket connection.
2. Target application. The target runs an application that uses SYS/BIOS and/or XDCtools for configuration and APIs. Internally, the SYS/BIOS modules make API calls to log events related to threading. You can also add additional configuration and calls to make use of the logging, event-handling, and diagnostics support in UIA, SYS/BIOS, and XDCtools.
3. Rta service. UIA’s Rta module on the target collects events from the log written to by both the pre-instrumented SYS/BIOS threads and any custom instrumentation you have added. By default, it collects events every 100 milliseconds. Rta then sends the events on to the UIA ServiceMgr module.
4. ServiceMgr module. This module moves data off the target primarily in the background. You configure the ServiceMgr module to specify the following:
— Whether you have a single-core or multicore application.
— If you have a multicore application, which core is designated the master core, which communicates directly with the host.
— The type of physical connection used for data transport between the master core and the host. Options are Ethernet, file (over JTAG), and user-defined (for custom connections).
5. Transport. By default, TCP is used to transport messages and UDP is used to transport events over an Ethernet connection. The application is responsible for setting up the Ethernet connection, for example by using the NDK on an EVM6472.
SPRUH43D—February 2013 Overview of System Analyzer 13Submit Documentation Feedback
Communicating Over Non-JTAG Transports www.ti.com
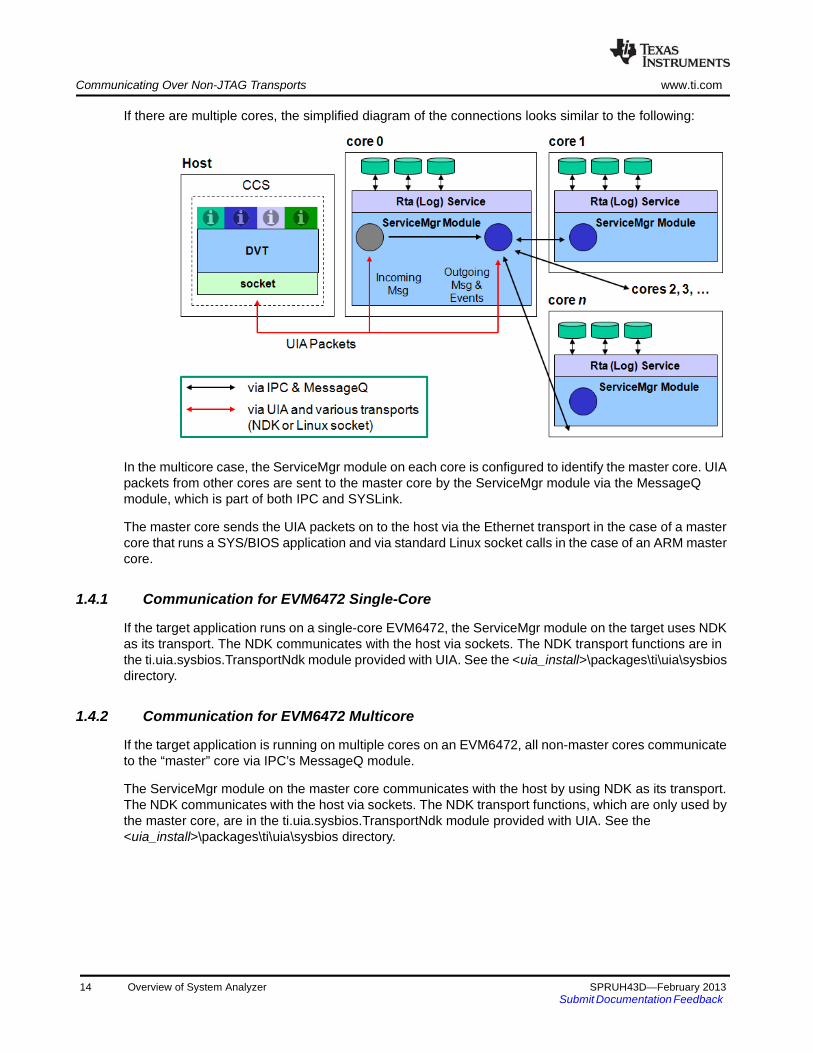
If there are multiple cores, the simplified diagram of the connections looks similar to the following:
In the multicore case, the ServiceMgr module on each core is configured to identify the master core. UIA packets from other cores are sent to the master core by the ServiceMgr module via the MessageQ module, which is part of both IPC and SYSLink.
The master core sends the UIA packets on to the host via the Ethernet transport in the case of a master core that runs a SYS/BIOS application and via standard Linux socket calls in the case of an ARM master core.
1.4.1 Communication for EVM6472 Single-Core
If the target application runs on a single-core EVM6472, the ServiceMgr module on the target uses NDK as its transport. The NDK communicates with the host via sockets. The NDK transport functions are in the ti.uia.sysbios.TransportNdk module provided with UIA. See the <uia_install>\packages\ti\uia\sysbios directory.
1.4.2 Communication for EVM6472 Multicore
If the target application is running on multiple cores on an EVM6472, all non-master cores communicate to the “master” core via IPC’s MessageQ module.
The ServiceMgr module on the master core communicates with the host by using NDK as its transport. The NDK communicates with the host via sockets. The NDK transport functions, which are only used by the master core, are in the ti.uia.sysbios.TransportNdk module provided with UIA. See the <uia_install>\packages\ti\uia\sysbios directory.
14 Overview of System Analyzer SPRUH43D—February 2013Submit Documentation Feedback

www.ti.com About this User Guide
1.4.3 Communication for EVMTI816x
If the target application is running on the ARM, DSP, and M3 cores of an EVMTI816x, the ServiceMgr module is used on all cores. The ARM core is configured to be the master core. The DSP and M3 cores communicate with the ARM core via SysLink’s MessageQ module. The ARM core communicates with the host via standard Linux socket calls. That is, the ARM core acts as a router for the UIA packets.
1.4.4 Communication for TCI6616
In the TCI6616 simulator the ti.uia.sysbios.TransportNyquistSim module provided with UIA uses WinPcap to send UIA packets to the host. See the release notes for the simulator for details. See the <uia_install>\packages\ti\uia\sysbios directory.
When the hardware is available, the ServiceMgr module on the master core will communicate with the host by using NDK as its transport.
1.5 About this User Guide
The remaining chapters in this manual cover the following topics:
• Chapter 2, "Installing System Analyzer", describes how to install the System Analyzer components.
• Chapter 3, "Tasks and Roadmaps for System Analyzer“, explains how to begin using System Analyzer.
• Chapter 4, “Using System Analyzer in Code Composer Studio“, describes the analysis features provided in Code Composer Studio for examining instrumentation data.
• Chapter 5, “UIA Configuration and Coding on the Target“, describes how to configure and code target applications using UIA modules.
• Chapter 6, “Advanced Topics for System Analyzer“, provides additional information about using System Analyzer components.
Note: Please see the release notes in the installation before starting to use System Analyzer. The release notes contain important information about feature support, issues, and compatibility information.
SPRUH43D—February 2013 Overview of System Analyzer 15Submit Documentation Feedback

Learning More about System Analyzer www.ti.com
1.6 Learning More about System Analyzer
To learn more about System Analyzer and the software products used with it, refer to the following documentation:
• UIA online reference help (also called "CDOC"). Open with CCSv5 online help or run <uia_install>/docs/cdoc/index.html. Use this help system to get reference information about static configuration of UIA modules and C functions provided by UIA.
• Tutorials. http://processors.wiki.ti.com/index.php/Multicore_System_Analyzer_Tutorials
• TI Embedded Processors Wiki. http://processors.wiki.ti.com
— System Analyzer. http://processors.wiki.ti.com/index.php/Multicore_System_Analyzer
— Code Composer Studio. http://processors.wiki.ti.com/index.php/Category:Code_Composer_Studio_v5
— SYS/BIOS. http://processors.wiki.ti.com/index.php/Category:SYSBIOS
— NDK. http://processors.wiki.ti.com/index.php/Category:NDK
— SysLink. http://processors.wiki.ti.com/index.php/Category:SysLink
— UIA cTools. http://processors.wiki.ti.com/index.php/UIAcTools
— cUIA. http://processors.wiki.ti.com/index.php/CUIA
• RTSC-Pedia Wiki. http://rtsc.eclipse.org/docs-tip for XDCtools documentation.
• TI E2E Community. http://e2e.ti.com/
— For CCS and DVT information, see the Code Composer forum at http://e2e.ti.com/support/development_tools/code_composer_studio/f/81.aspx
— For SYS/BIOS, XDCtools, IPC, NDK, and SysLink information, see the SYS/BIOS forum at http://e2e.ti.com/support/embedded/f/355.aspx
— Also see the forums for your specific processor(s).
• SYS/BIOS 6.x Product Folder. http://focus.ti.com/docs/toolsw/folders/print/dspbios6.html
• Embedded Software Download Page. http://software-dl.ti.com/dsps/dsps_public_sw/sdo_sb/targetcontent/index.html for downloading SYS/BIOS, XDCtools, IPC, and NDK versions.
16 Overview of System Analyzer SPRUH43D—February 2013Submit Documentation Feedback

Chapter 2
Installing System Analyzer
This chapter covers how to install the System Analyzer components.
2.1 System Analyzer Installation Overview. . . . . . . . . . . . . . . . . . . . . . . . 18
2.2 Installing System Analyzer as Part of a Larger Product . . . . . . . . . . 18
2.3 Installing System Analyzer as a Software Update . . . . . . . . . . . . . . . 19
2.4 Installing and Using UIA Outside CCS . . . . . . . . . . . . . . . . . . . . . . . . 19
Topic Page
SPRUH43D—February 2013 Installing System Analyzer 17Submit Documentation Feedback

System Analyzer Installation Overview www.ti.com
2.1 System Analyzer Installation Overview
System Analyzer support is available for the targets listed in the release notes and at http://processors.wiki.ti.com/index.php/Multicore_System_Analyzer. Specific example templates are provided for multicore targets such as the evm6472 and the evmTI816x. In addition, pre-built libraries are provided for a number of single-core targets.
System Analyzer v1.1 makes use of the following other software components and tools, which must be installed in order to use System Analyzer.
• Code Composer Studio (CCStudio) 5.2 or higher
• SYS/BIOS 6.33.04 or higher (installed as part of CCStudio)
• XDCtools 3.23.02 or higher (installed as part of CCStudio)
• IPC 1.24.02 or higher (version required depends on target)
• Code Generation Tools (version required depends on target, see the UIA release notes)
• NDK 2.20.04 or higher (for evm6472)
• PDK and simulator required for simTCI6616
• SysLink 2.10.03 or higher (for evmTI816x)
2.2 Installing System Analyzer as Part of a Larger Product
System Analyzer and the components it requires are automatically installed as part of the Code Composer Studio installation. Other installers, such as MCSDK, will also install System Analyzer. If you install one of these packages, you do not need to perform additional installation steps in order to make System Analyzer available.
System Analyzer and the components it requires will also be automatically installed as part of Code Composer Studio v5.1.
System Analyzer updates will be available through the CCS Update Installer. If you have installed CCSv5.2 or higher, you can check for updates by choosing Help > Check for Updates from the menus.
18 Installing System Analyzer SPRUH43D—February 2013Submit Documentation Feedback

www.ti.com Installing System Analyzer as a Software Update
2.3 Installing System Analyzer as a Software Update
If you have installed CCSv5.3 or higher, you do not need to install System Analyzer separately. System Analyzer is included with CCSv5.3. You can check for updates by choosing Help > Check for Updates from the menus.
If you have CCSv5.2, you can install System Analyzer 1.1 by following these steps:
1. Choose Help > Install New Software from the CCS menus.
2. Click Add to the right of the Work with field.
3. In the Add Repository dialog, type "System Analyzer 1.1" as the Name.
4. In the Location field, type the following URL and then click OK:
http://software-dl.ti.com/dsps/dsps_public_sw/sdo_ccstudio/DVT/SystemAnalyzer1.1
5. Check the box next to DVT, and click Next. (System Analyzer is installed as part of the Data Visualization Technology component of CCS.) Continue clicking Next as needed and accept the license agreement as prompted.
6. Click Finish to install or update the DVT software component. When the installation is complete, restart CCS as prompted.
2.4 Installing and Using UIA Outside CCS
You can also install the UIA target-side modules on a Linux machine for use outside the CCS environment. On a Linux machine, you should unzip the UIA target package in the same root directory where XDCtools and SYS/BIOS are installed.
If you want to build applications with UIA modules outside of CCS, add the UIA package path to your XDCPATH definition. The UIA package path is the /packages subfolder of the UIA target-side installation. For example, the package path may be the C:\Program Files\Texas Instruments\uia_1_#_#_#\packages folder.
SPRUH43D—February 2013 Installing System Analyzer 19Submit Documentation Feedback
Chapter 3
Tasks and Roadmaps for System Analyzer
This chapter explains how to begin using System Analyzer. It provides roadmaps for common tasks related to using System Analyzer.
3.1 Different Types of Analysis for Different Users . . . . . . . . . . . . . . . . . 21
3.2 Analyzing System Loading with System Analyzer. . . . . . . . . . . . . . . 22
3.3 Analyzing the Execution Sequence with System Analyzer . . . . . . . . 24
3.4 Performing Count Analysis with System Analyzer . . . . . . . . . . . . . . 25
3.5 Benchmarking with System Analyzer . . . . . . . . . . . . . . . . . . . . . . . . . 27
3.6 Troubleshooting System Analyzer Connections . . . . . . . . . . . . . . . . 28
3.7 Creating Sample System Analyzer Projects . . . . . . . . . . . . . . . . . . . . 31
3.8 Special Features of System Analyzer Data Views . . . . . . . . . . . . . . . 35
Topic Page
SPRUH43D—February 2013 Tasks and Roadmaps for System Analyzer 20Submit Documentation Feedback

www.ti.com Different Types of Analysis for Different Users
3.1 Different Types of Analysis for Different Users
A variety of users make use of System Analyzer, but different users perform different types of analysis. To find tasks that apply to your needs, choose the use case that matches your needs best from the following list:
1. Analyst for a deployed system. You have an existing system for which you need a performance analysis. You do not need to know about the actual target code, and are interested in using the GUI features of System Analyzer to find answers about CPU utilization. You will want to use the CPU Load and possibly the Task Load analysis features.
2. Linux developer. You have a multicore application with Linux on the master core and SYS/BIOS applications on other cores. You want data about how the SYS/BIOS applications are running, but do not want to modify these applications yourself. You should use the CPU Load, Task Load, and Execution Graph analysis features.
3. SYS/BIOS application developer (simple case). You want to analyze default information provided by SYS/BIOS, but do not want to add custom instrumentation code. You may be adding support for System Analyzer to a deployed application. You should use the CPU Load, Task Load, and Execution Graph analysis features.
4. SYS/BIOS application developer (custom instrumentation). You want to get additional information about threading and the time required to perform certain threads. In addition to the CPU Load, Task Load, and Execution Graph analysis features, you should use the Duration and Context Aware Profile features.
5. SYS/BIOS application developer (custom communication). You want to use System Analyzer on a multicore platform with a setup that varies from the defaults. You may want to modify the transport or modify the behavior of the ServiceMgr module.
The following table shows tasks that apply to users in the previous list.
Table 3-1. Task Roadmaps for Various Users
* A few SYS/BIOS configuration settings need to be modified and applications need to be rebuilt in order to use System Analyzer. Users who are not familiar with SYS/BIOS, should ask a SYS/BIOS application developer to make the configuration changes described in Section 5.1.
User Type
Load Analysis
Execution Analysis
Benchmarking Analysis
SYS/BIOS & UIA Configuration
SYS/BIOS& UIA API Coding
Multicore IPC, NDK, or SysLink setup
1 Yes No No No * No No
2 Yes Yes No No * No Maybe
3 Yes Yes No Yes No No
4 Yes Yes Yes Yes Yes Maybe
5 Yes Yes Yes Yes Yes Yes
SPRUH43D—February 2013 Tasks and Roadmaps for System Analyzer 21Submit Documentation Feedback
Analyzing System Loading with System Analyzer www.ti.com
To learn about the tasks that apply to your needs, see the following sections:
• Load Analysis. This includes using the CPU Load and Task Load analysis features. See Section 3.2 for a roadmap.
• Execution Analysis. This includes using the Execution Graph, Concurrency, and Task Profiler analysis features. See Section 3.3 for a roadmap.
• Benchmarking Analysis. This includes using the Context Aware Profile, Duration, Count Analysis, and Printf Logs features. The target code needs to be modified in order to perform this type of analysis. See Section 3.5 for a roadmap.
• SYS/BIOS and UIA Configuration. This involves editing the *.cfg configuration file for the target application either with a text editor or with XGCONF in CCS. See Section 5.1 for the simple setup and Section 5.3 for custom configuration.
• SYS/BIOS and UIA API Coding. You can add C code to your target application to provide data to the Context Aware Profile and Duration analysis features. You can also add code for custom instrumentation. See Section 5.4 for details.
• Multicore IPC, NDK, or SysLink setup. See Section 5.3.3, Configuring ti.uia.runtime.ServiceMgr, Section 5.3.7, Configuring ti.uia.runtime.LogSync, Section 5.3.8, Configuring IPC, and documentation for IPC, NDK, SysLink, etc.
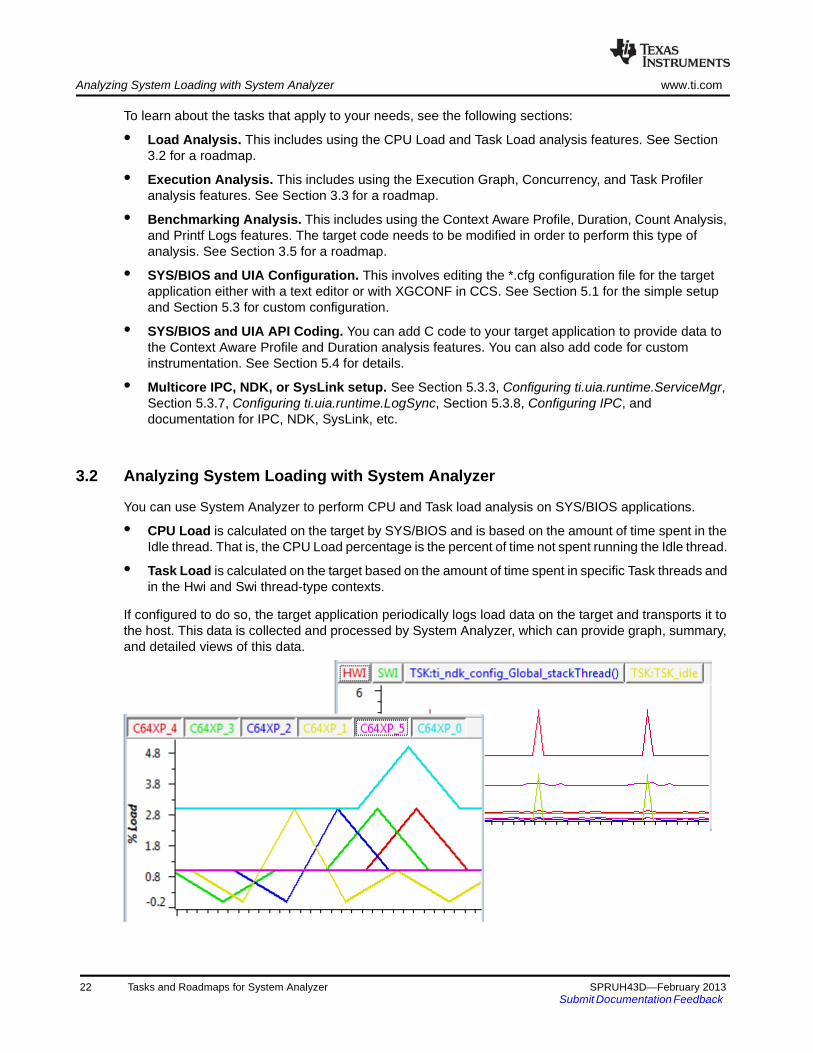
3.2 Analyzing System Loading with System Analyzer
You can use System Analyzer to perform CPU and Task load analysis on SYS/BIOS applications.
• CPU Load is calculated on the target by SYS/BIOS and is based on the amount of time spent in the Idle thread. That is, the CPU Load percentage is the percent of time not spent running the Idle thread.
• Task Load is calculated on the target based on the amount of time spent in specific Task threads and in the Hwi and Swi thread-type contexts.
If configured to do so, the target application periodically logs load data on the target and transports it to the host. This data is collected and processed by System Analyzer, which can provide graph, summary, and detailed views of this data.
22 Tasks and Roadmaps for System Analyzer SPRUH43D—February 2013Submit Documentation Feedback

www.ti.com Analyzing System Loading with System Analyzer
Performing Load Analysis
Follow these steps to perform load analysis for your application. Follow the links below to see detailed instructions for a particular step.
Step 1: Update your CCS installation to include System Analyzer and UIA if you have not already done so.
— See Section 2.2, Installing System Analyzer as Part of a Larger Product or
Step 2: Configure your target application so that UIA logging is enabled. Causing your application to use UIA’s LoggingSetup and Rta modules as described in the first link below automatically enables logging of events related to the CPU and Task load. You can skip the links to more detailed information that follow if you just want to use the default configuration.
— First, see Section 5.1, Quickly Enabling UIA Instrumentation.
— For more details, see Section 5.2.1, Enabling and Disabling Load Logging.
— For even more details, see Section 5.3, Customizing the Configuration of UIA Modules.
Note: If you are analyzing a deployed system or are integrating a system that includes SYS/BIOS applications, the step above may have already been performed by the application developer. If so, you can skip this step.
Step 3: If the application is not already loaded and running, build, load, and run your application.
Step 4: Start a CCS Debugging session with a target configuration to match your setup.
Step 5: Capture instrumentation data using System Analyzer. Note that when you start a session, you can choose to also send the data to a file for later analysis.
— See Section 4.2, Starting a Live System Analyzer Session.
Step 6: Analyze data using the CPU Load and/or Task Load Analyzer.
— See Section 4.10, Using the CPU Load View.
— See Section 4.12, Using the Task Load View.
See Also
• Section 4.10.3, How CPU Load Works
• Section 4.12.3, How Task Load Works
• Section 3.8, Special Features of System Analyzer Data Views
• To troubleshoot data loss: Section 3.6.3, If System Analyzer Events are Being Dropped
SPRUH43D—February 2013 Tasks and Roadmaps for System Analyzer 23Submit Documentation Feedback
Analyzing the Execution Sequence with System Analyzer www.ti.com
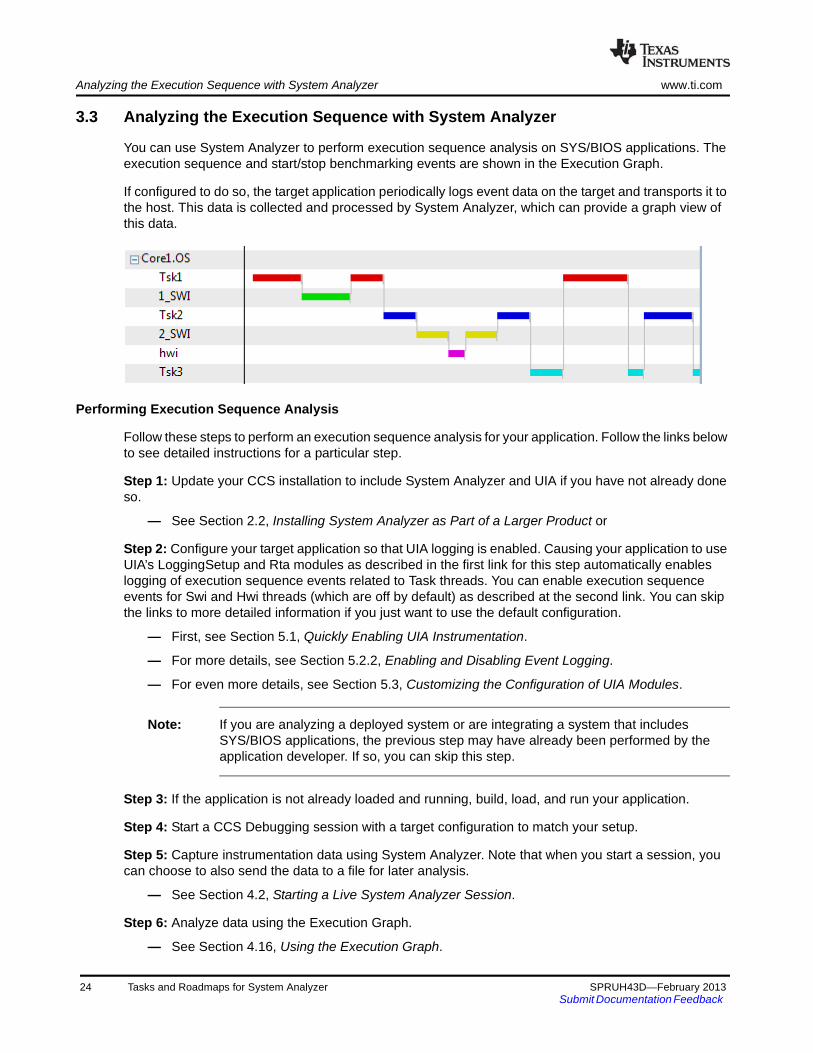
3.3 Analyzing the Execution Sequence with System Analyzer
You can use System Analyzer to perform execution sequence analysis on SYS/BIOS applications. The execution sequence and start/stop benchmarking events are shown in the Execution Graph.
If configured to do so, the target application periodically logs event data on the target and transports it to the host. This data is collected and processed by System Analyzer, which can provide a graph view of this data.
Performing Execution Sequence Analysis
Follow these steps to perform an execution sequence analysis for your application. Follow the links below to see detailed instructions for a particular step.
Step 1: Update your CCS installation to include System Analyzer and UIA if you have not already done so.
— See Section 2.2, Installing System Analyzer as Part of a Larger Product or
Step 2: Configure your target application so that UIA logging is enabled. Causing your application to use UIA’s LoggingSetup and Rta modules as described in the first link for this step automatically enables logging of execution sequence events related to Task threads. You can enable execution sequence events for Swi and Hwi threads (which are off by default) as described at the second link. You can skip the links to more detailed information if you just want to use the default configuration.
— First, see Section 5.1, Quickly Enabling UIA Instrumentation.
— For more details, see Section 5.2.2, Enabling and Disabling Event Logging.
— For even more details, see Section 5.3, Customizing the Configuration of UIA Modules.
Note: If you are analyzing a deployed system or are integrating a system that includes SYS/BIOS applications, the previous step may have already been performed by the application developer. If so, you can skip this step.
Step 3: If the application is not already loaded and running, build, load, and run your application.
Step 4: Start a CCS Debugging session with a target configuration to match your setup.
Step 5: Capture instrumentation data using System Analyzer. Note that when you start a session, you can choose to also send the data to a file for later analysis.
— See Section 4.2, Starting a Live System Analyzer Session.
Step 6: Analyze data using the Execution Graph.
— See Section 4.16, Using the Execution Graph.
24 Tasks and Roadmaps for System Analyzer SPRUH43D—February 2013Submit Documentation Feedback

www.ti.com Performing Count Analysis with System Analyzer
— If you have a multi-core application, you may find the Concurrency view useful for analyzing when the multiple cores are used efficiently. See Section 4.8, Using the Concurrency Feature.
— If you have multiple Task threads, you may find the Task Profiler useful for determining how much time each Task spends in various execution states. See Section 4.15, Using the Task Profiler.
— You may also find the Count columns in the CPU Load and Task Load summary views useful for analyzing the execution sequence. See Section 4.10.1, Summary View for CPU Load and Section 4.12.1, Summary View for Task Load.
See Also
• Section 4.16.1, How the Execution Graph Works
• Section 3.8, Special Features of System Analyzer Data Views
• To troubleshoot data loss: Section 3.6.3, If System Analyzer Events are Being Dropped
3.4 Performing Count Analysis with System Analyzer
You can use System Analyzer to perform count analysis on SYS/BIOS applications. For example, you might want to use Count Analysis to analyze how a data value from a peripheral changes over time. Or, you might want to find the maximum and minimum values reached by some variable or the number of times a variable is changed. The results are shown in the Count Analysis feature.
In order to use this feature, you will need to add code to your target to log data values for one or more sources. If you do this the target application transports the data to the host. This data is collected and processed by System Analyzer, which can provide graph, summary, and detailed views of this data.
SPRUH43D—February 2013 Tasks and Roadmaps for System Analyzer 25Submit Documentation Feedback
Performing Count Analysis with System Analyzer www.ti.com
Performing Count Analysis
Follow these steps to perform a count analysis for your application. Follow the links below to see detailed instructions for a particular step.
Step 1: Update your CCS installation to include System Analyzer and UIA if you have not already done so.
— See Section 2.2, Installing System Analyzer as Part of a Larger Product or
Step 2: Configure your target application so that UIA logging is enabled. Causing your application to use UIA’s LoggingSetup and Rta modules as described in the first link for this step automatically enables logging of execution sequence events related to Task threads. You can enable execution sequence events for Swi and Hwi threads (which are off by default) as described at the second link. You can skip the links to more detailed information if you just want to use the default configuration.
— First, see Section 5.1, Quickly Enabling UIA Instrumentation.
— For more details, see Section 5.2.2, Enabling and Disabling Event Logging.
— For even more details, see Section 5.3, Customizing the Configuration of UIA Modules.
Note: If you are analyzing a deployed system or are integrating a system that includes SYS/BIOS applications, the previous step may have already been performed by the application developer. If so, you can skip this step.
Step 3: Add code to your target application that logs the UIAEvt_intWithKey event.
— See Section 4.9.3, How Count Analysis Works.
Step 4: Build, load, and run your application.
Step 5: Start a CCS Debugging session with a target configuration to match your setup.
Step 6: Capture instrumentation data using System Analyzer. Note that when you start a session, you can choose to also send the data to a file for later analysis.
— Section 4.2, Starting a Live System Analyzer Session.
Step 7: Analyze data using the Count Analysis feature.
— Section 4.9, Using the Count Analysis.
— If you want to perform statistical analysis on the primary and auxiliary data values, export records from the Count Analysis Detail view to a CSV file that can be opened with a spreadsheet. To do this, right-click on the view and choose Data > Export All.
See Also
• Section 3.8, Special Features of System Analyzer Data Views
• To troubleshoot data loss: Section 3.6.3, If System Analyzer Events are Being Dropped
26 Tasks and Roadmaps for System Analyzer SPRUH43D—February 2013Submit Documentation Feedback
www.ti.com Benchmarking with System Analyzer
3.5 Benchmarking with System Analyzer
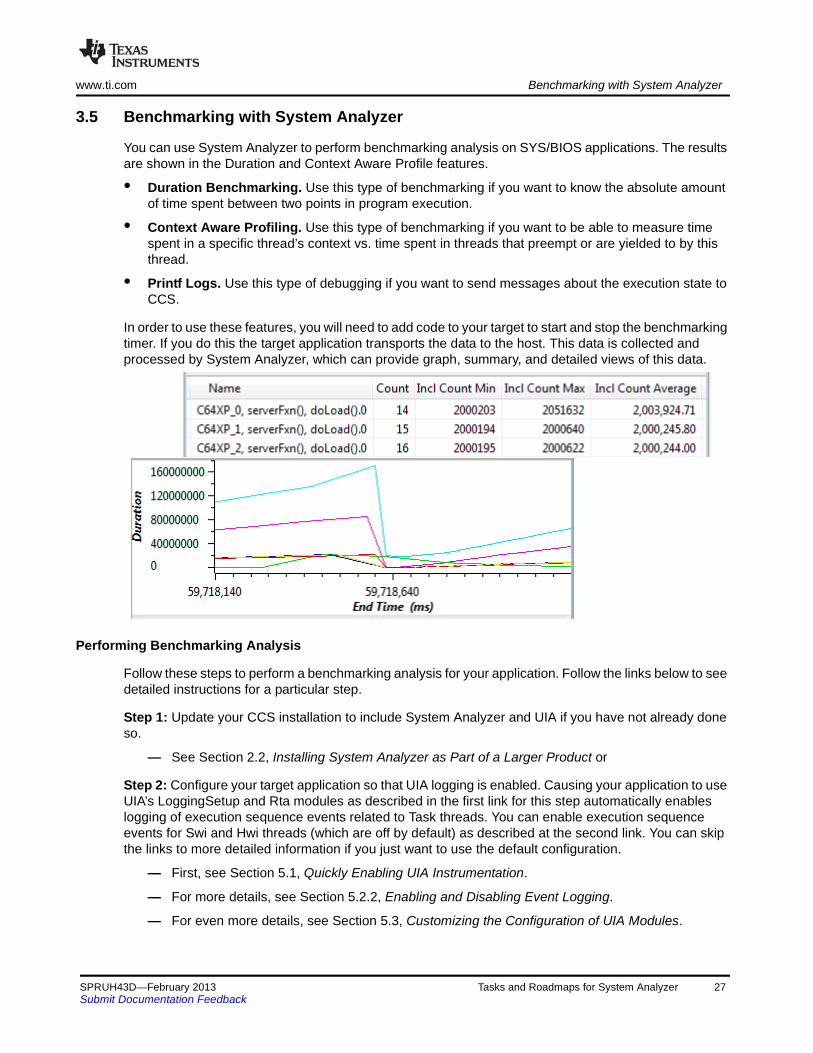
You can use System Analyzer to perform benchmarking analysis on SYS/BIOS applications. The results are shown in the Duration and Context Aware Profile features.
• Duration Benchmarking. Use this type of benchmarking if you want to know the absolute amount of time spent between two points in program execution.
• Context Aware Profiling. Use this type of benchmarking if you want to be able to measure time spent in a specific thread’s context vs. time spent in threads that preempt or are yielded to by this thread.
• Printf Logs. Use this type of debugging if you want to send messages about the execution state to CCS.
In order to use these features, you will need to add code to your target to start and stop the benchmarking timer. If you do this the target application transports the data to the host. This data is collected and processed by System Analyzer, which can provide graph, summary, and detailed views of this data.
Performing Benchmarking Analysis
Follow these steps to perform a benchmarking analysis for your application. Follow the links below to see detailed instructions for a particular step.
Step 1: Update your CCS installation to include System Analyzer and UIA if you have not already done so.
— See Section 2.2, Installing System Analyzer as Part of a Larger Product or
Step 2: Configure your target application so that UIA logging is enabled. Causing your application to use UIA’s LoggingSetup and Rta modules as described in the first link for this step automatically enables logging of execution sequence events related to Task threads. You can enable execution sequence events for Swi and Hwi threads (which are off by default) as described at the second link. You can skip the links to more detailed information if you just want to use the default configuration.
— First, see Section 5.1, Quickly Enabling UIA Instrumentation.
— For more details, see Section 5.2.2, Enabling and Disabling Event Logging.
— For even more details, see Section 5.3, Customizing the Configuration of UIA Modules.
SPRUH43D—February 2013 Tasks and Roadmaps for System Analyzer 27Submit Documentation Feedback
Troubleshooting System Analyzer Connections www.ti.com
Note: If you are analyzing a deployed system or are integrating a system that includes SYS/BIOS applications, the previous step may have already been performed by the application developer. If so, you can skip this step.
Step 3: Add benchmarking code to your target application.
— For duration benchmarking, see Section 4.14.3, How Duration Analysis Works.
— For context aware profiling, see Section 4.13.3, How Context Aware Profiling Works.
— For printf logs, see Section 4.11, Using the Printf Logs.
Step 4: Build, load, and run your application.
Step 5: Start a CCS Debugging session with a target configuration to match your setup.
Step 6: Capture instrumentation data using System Analyzer. Note that when you start a session, you can choose to also send the data to a file for later analysis.
— Section 4.2, Starting a Live System Analyzer Session.
Step 7: Analyze data using the appropriate features.
— Section 4.14, Using the Duration Feature.
— Section 4.13, Using Context Aware Profile
— Section 4.11, Using the Printf Logs
See Also
• Section 3.8, Special Features of System Analyzer Data Views
• To troubleshoot data loss: Section 3.6.3, If System Analyzer Events are Being Dropped
3.6 Troubleshooting System Analyzer Connections
The following sections describe issues that might occur as you use System Analyzer and UIA.
3.6.1 If You Cannot Connect to the Target with System Analyzer
If you cannot connect to the target, check the following items:
• Verify that the UIA configuration specifies the correct transports.
• Verify that the configuration code for the target application includes the ti.uia.services.Rta module. You can use the Tools > RTOS Object View (ROV) menu command in a CCS debugging session to confirm this.
• Verify that the correct transport functions were selected. You can do this by looking at the ti.uia.sysbios.Adaptor (or IpcMP) transport functions.
28 Tasks and Roadmaps for System Analyzer SPRUH43D—February 2013Submit Documentation Feedback

www.ti.com Troubleshooting System Analyzer Connections
3.6.2 If No Events are Shown in System Analyzer Features
If you can connect to the target, but no events are shown in the Log view, check the following items:
• Confirm that the endpoints are configured properly in the System Analyzer Session Manager (Tools > System Analyzer > UIA Config). Be sure that the .out and .xml filenames are correct.
• Confirm that the target application uses the appropriate eventUploadMode and Logger.
• Confirm that events are being logged. You can check this by using the RTOS Object View (ROV) tool to look at the Logger module used by your application. The "serial" field should be non-zero and increasing.
• Confirm that the UIA task is not being starved. You can check this by using the ROV tool to look at the ti.uia.runtime.ServiceMgr module. The "runCount" in the Proxy tab should be incrementing.
• Confirm that you’ve enabled logging by setting the common$.Diags mask accordingly in your configuration file. See Section 5.2.2.
3.6.3 If System Analyzer Events are Being Dropped
If you can connect to the target and events are shown in the Log view, events may still be dropped. The status bars in System Analyzer views tell how many records are shown and how many gaps occurred.
If events are being dropped, first confirm that events are being logged by the logger. You can check this by using the RTOS Object View (ROV) tool to look at the Logger module used by your application. If the "numDropped" field is incrementing, then events are being dropped. If the "numDropped" field is not incrementing, then UIA packets are being dropped, and you should see Section 3.6.4.
To prevent events from being dropped, try one or more of the following:
• Increase the logger buffer size.
• Increase the frequency of Rta by lowering its period. The minimum is 100ms.
• Reduce the number of logged events.
• If this is a multicore application, increase the number of event packets on the non-master processors. This allows UIA to move the records off in a faster manner. For example:
ServiceMgr.numEventPacketBufs = 4;
3.6.4 If System Analyzer Packets are Being Dropped
If UIA packets are being dropped, examine your configuration of IPC, NDK, or other communications software.
3.6.5 If Events Stop Being Show Near the Beginning
For a multicore system, check the status message at the bottom of Log View. If the message says "Waiting UIA SyncPoint data", it is possible that the critical SyncPoint events were dropped in transport. Try using the Stop and Run commands.
SPRUH43D—February 2013 Tasks and Roadmaps for System Analyzer 29Submit Documentation Feedback

Troubleshooting System Analyzer Connections www.ti.com
3.6.6 If System Analyzer Events Do Not Make Sense
If the events listed in the System Analyzer features do not make sense, confirm that the endpoints are configured properly in the System Analyzer Session Manager (Tools > System Analyzer > UIA Config). Be sure that the .out and .xml filenames are correct.
3.6.7 If Data is Not Correlated for Multicore System
The following situations can cause correlation (out-of-sequence) errors:
• The clock setting is not correct. Each core/endpoint has clock settings (local and global) that are used to convert from local to global time. If any setting is incorrect, the global time conversion will be off and will affect the system-level correlation. Check the clock settings on the target side and UIA endpoint configuration.
• SyncPoint is not logged properly. For a multicore platform, there must be a common global timer that each core can reference. If there is no global timer available or it is not configured properly, the converted global time in each core may not be correct. Also, since most global timers have a lower clock frequency, time precision may be lost with respect to the core’s local timer. Check the SyncPoint events reported at the beginning of the log.
• Transport delay. Under certain conditions, some logs may be transported to the host computer with a huge delay. In this case, some old data may be received after newer data has been reported. Check the transport, especially when using UDP. If the transport is not reliable for a live data stream, specify a binary file to contain the live data. After the data has been captured, open the binary file to analyze the results.
3.6.8 If the Time Value is Too Large
If the Time value shown in the logs is much larger than you expect, you should power-cycle the target board or perform a system reset before testing the application.
30 Tasks and Roadmaps for System Analyzer SPRUH43D—February 2013Submit Documentation Feedback

www.ti.com Creating Sample System Analyzer Projects
3.7 Creating Sample System Analyzer Projects
A number of project templates for use in CCS with System Analyzer and UIA are provided.
To use a project templates, begin creating a new CCS project by choosing File > New > CCS Project from the menus. In the Project templates area of the New Project wizard, expand the System Analyzer (UIA) item to see the list of available templates.
When you select a project template, a description of the project is shown to the right. Finish creating the project and examine the *.c code files and *.cfg configuration file. All required products and repositories are pre-configured.
Multicore project templates are available for the EVM6472 and the EVMTI816x. Single-core project templates that use the "stairstep" example from SYS/BIOS are available for a number of supported transports described on page 5–99. Additional tutorial examples are provided; these are described on the Texas Instruments Embedded Processors Wiki.
See the sections that follow for any specific notes about settings or changes you need to make to the project files before building, loading, and running it.
SPRUH43D—February 2013 Tasks and Roadmaps for System Analyzer 31Submit Documentation Feedback

Creating Sample System Analyzer Projects www.ti.com
3.7.1 Notes for EVM6472 MessageQ Project Templates
On the Project Templates page of the New CCS project wizard, select the "evm6472: MessageQ" template. This example shows how to use IPC's MessageQ module with UIA. The same image must be loaded on all cores.
The RTSC Configuration Settings page of the wizard automatically has the correct RTSC Target, Platform, and Build-Profile set.
After creating the project, examine the message.c and message.cfg files.
In the message.c file, notice the two calls to Log_write2() in tsk0_func(), which runs only on CORE0. The calls to Log_write2() pass event types of UIABenchmark_start and UIABenchmark_stop. These are used to bracket the code that uses MessageQ to send and receive a message from a remote processor.
In the message.cfg file, notice that the LoggingSetup module is configured to use the UploadMode_NONJTAGTRANSPORT mode. This mode uses Ethernet as the default transport to move Log records to CCS via the UIA ServiceMgr framework. This example configures the ServiceMgr module to use a multicore topology. All the cores route their data to the ServiceMgr module running on Linux. The configuration also contains a section that configures the NDK, which is used by the Ethernet transport.
UIA ships pre-built EVM6472 Ethernet drivers. The libraries are in the <uia_install>\packages\ti\uia\examples\evm6472\ndkdrivers directory. These libraries were copied out of the PDK_1_00_00_05 package. This was done to make building the examples easier.
Within the configuration file of EVM6472 example, the following line gets the pre-built Ethernet libraries and includes them in the build. If you have an updated PDK, simply remove this statement and add the libraries into the project (or follow the instructions with the PDK).
var ndkdrivers = xdc.loadPackage('ti.uia.examples.evm6472.ndkdrivers');
Note that the NDK currently supports only the COFF format.
You can use the following System Analyzer analysis features when running this example: CPU Load, Task Load, Execution Graph, Duration, and Context Aware Profile.
32 Tasks and Roadmaps for System Analyzer SPRUH43D—February 2013Submit Documentation Feedback

www.ti.com Creating Sample System Analyzer Projects
3.7.2 Notes for EVMTI816x SimpleTask Project Templates
On the Project Settings page of the New CCS project wizard, be sure to select the correct Device Variant (e.g. C674X or Cortex-M3).
On the Project Templates page of the New CCS project wizard, select one of the "evmti816x: SimpleTask" templates. These examples use LoggerCircBuf or LoggerSM (shared memory) to log benchmark events. Different projects are provided for the DSP, video M3, and vpss M3.
On the RTSC Configuration Settings page of the wizard, make sure to check the box for SysLink package in the Products and Repositories list. Use the Add button to add the repository if it is not shown.
The RTSC Configuration Settings page of the wizard automatically has the correct RTSC Target, Platform, and Build-Profile set. For example:
After creating the project, examine the simpleTask.c and *.cfg files.
In the simpleTask.c file, notice the two calls to Log_write1() in the taskLoad() function. The calls to Log_write1() pass event types of UIABenchmark_start and UIABenchmark_stop. These are used to bracket the code that reverses the bits in a buffer.
The configuration filename is dependent on the core and the logger implementation. For example, for the LoggerCircBuf version of the DSP application, the configuration file is called dspLoggerCircBuf.cfg. All versions of the configuration files for these examples include the simpleTask.cfg.xs configuration file. This shared file configures Clock, Semaphore, and Task objects. It also configures IPC and the shared memory region.
The non-shared configuration files cause the LoggingSetup module to use the UploadMode_NONJTAGTRANSPORT mode. This mode uses Ethernet as the default transport to move Log records to CCS via the UIA ServiceMgr framework. This example configures the ServiceMgr module to use a multicore topology.
You can use the following System Analyzer analysis features with these examples: CPU Load, Task Load, Execution Graph, Duration, and Context Aware Profile.
See the <uia_install>\packages\ti\uia\examples\evmti816x directory for a readme.txt file with details on how to run the example. The source code and a Makefile to build the Linux application are also included in the <uia_install>packages\ti\uia\examples\evmti816x directory.
SPRUH43D—February 2013 Tasks and Roadmaps for System Analyzer 33Submit Documentation Feedback

Creating Sample System Analyzer Projects www.ti.com
3.7.3 Notes for Single-Core Stairstep Project Templates
On the Project Templates page of the New CCS project wizard, expand the System Analyzer > Single-core Examples list and choose a "Stairstep" template. These examples use Hwi, Swi, and Task threads run to add to the CPU load of the system. This example periodically generates log events.
Each of the examples uses a different transport mode. These modes are configured by setting the LoggingSetup.eventUploadMode parameter.
The following list provides notes that apply to specific versions of this example:
• Stairstep Ethernet. This template is configured for use on the EVM6472 with NDK. Within the configuration file, the following line gets the pre-built Ethernet libraries and includes them in the build. If you have an updated PDK or are using a different device, simply remove this statement and add the libraries into the project (or follow the instructions with the PDK). See Section 3.7.1 for more about using the NDK with an application for the EVM6472.
var ndkdrivers = xdc.loadPackage('ti.uia.examples.evm6472.ndkdrivers');
• Stairstep JTAG RunMode. This mode is only supported on CPUs that support real-time JTAG access. This support is provided on the C64x+ and C66x CPUs. When the UploadMode_JTAGRUNMODE is used, the UIA ServiceMgr framework and NDK are not used.
• All other Stairstep templates. The JTAG StopMode, ProbePoint, and Simulator templates are not-platform specific. These templates do not use the UIA ServiceMgr framework or the NDK.
In the Stairstep example, the cpuLoadInit() function gets the CPU frequency and fills arrays with load values corresponding to 0, 25, 50, 75, and 95 percent CPU loads. The timerFunc() function is a Hwi thread that runs every 100ms to launch a Hwi, Swi, and Task thread. Each thread then performs a doLoad() function before relinquishing the CPU. After staying at each load setting for 5 seconds, timerFunc() calls the step() function to advance to the next set of Hwi, Swi, and Task load values. The cycle repeats after reaching the 95 percent load.
You can use the following System Analyzer analysis features when running these examples: CPU Load, Task Load, and Execution Graph.
3.7.4 Notes for System Analyzer Tutorial Project Templates
You can create projects using the System Analyzer and UIA tutorials. See http://processors.wiki.ti.com/index.php/Multicore_System_Analyzer_Tutorials.
• Tutorial 1: This template is intended for use on a C64x+ or C66x simulator. This tutorial shows how to log errors, warnings, and informational events, benchmark code, and control which events are logged.
• Tutorial 2: This template is intended for use on a C64x+ or C66x emulator. This tutorial shows how to log data that can be graphed and analyzed for minimum, maximum, and average statistics.
34 Tasks and Roadmaps for System Analyzer SPRUH43D—February 2013Submit Documentation Feedback
www.ti.com Special Features of System Analyzer Data Views
3.8 Special Features of System Analyzer Data Views
System Analyzer provides three types of data views for working with collected data. Each type of data view has some power features you can use to navigate, analyze, and find points of interest. The sections that follow provide help on using the special features of these data views.
• Table Views are used to display data in a table. Table views are used for Summary and Detail views in System Analyzer.
• Line Graphs are used for x/y plotting, mainly for viewing changes of a variable against time. System Analyzer uses line graphs for all graphs except the Execution Graph.
• DVT Graphs depict state transitions and events against time. Groups of related states form a timeline for a core or thread. Different types of data are assigned different colors. System Analyzer uses this graph type for the Execution Graph.
Special features provided for these view types are as follows:
• Views drop-down lets you open additional views of this data. For example, you can open the Summary or Detail view from a Graph view.
• Groups and Synchronous Scrolling causes several views to scroll so that data from the same time is shown. See Section 3.8.4.
• Measurement Markers (graphs only) measure distances in a graph. See Section 3.8.2.
• Bookmarks highlight certain rows and provide ways to quickly jump to marked rows. See Section 3.8.3.
• Zoom (graphs only) adjusts the scaling of the graph. See Section 3.8.1.
• Auto Fit (tables only) adjusts table column widths to display complete values.
• Find lets you search this view using a field value or expression. See Section 3.8.5.
• Filter lets you display only data that matches a pattern you specify using the Set Filter Expression dialog. See Section 3.8.6.
• Scroll Lock controls scrolling due to updates. See Section 3.8.8.
• Column Settings lets you control which columns are displayed and how they are shown. See Section 3.8.9.
• Tree Mode toggles between flat and tree mode on y-axis labels in the Execution Graph. See Section 4.16.
• Data > Export (in the right-click menu) sends selected data to a CSV file. See Section 3.8.7.
Also see page 4–52 and page 4–63 for additional descriptions of toolbar icons, including those shown only in the Log view.
SPRUH43D—February 2013 Tasks and Roadmaps for System Analyzer 35Submit Documentation Feedback

Special Features of System Analyzer Data Views www.ti.com
3.8.1 Zoom (Graphs Only)
Zooming is only available in graph views. You can zoom in or out on both the x- and y-axis in line graphs. For DVT graphs (like the Execution Graph), you can only zoom on the x-axis.
You can zoom using any of these methods:
Using the Mouse
• Hold down the Alt key and drag the mouse to select an area on the graph to expand.
• Drag the mouse to the left or below the graph where the axis units are shown (without holding the Alt key) to select a range to expand.
• Click on the x-axis legend area below the graph and use your mouse scroll wheel to zoom in or out.
Using the Keyboard
• Press Ctrl + to zoom in.
• Press Ctrl - to zoom out.
Using the Toolbar
• The Zoom In toolbar icon increases the graph resolution to provide more detail. It uses the zoom direction and zoom factor set in the drop-down.
• The Zoom Out toolbar icon decreases the graph resolution to provide more detail. It uses the zoom direction and zoom factor set in the drop-down.
• The Reset Zoom toolbar icons resets the zoom level of the graph to the original zoom factor.
• The Select Zoom Options drop-down next to the Reset Zoom icon lets you select the zoom factor and directions of the zoom for a line graph. By default, zooming affects both the x- and y-axis and zooms by a factor of 2. You can choose options in this drop-down to apply zooming to only one axis or to zoom by factors of 4, 5, or 10.
Note: When you use the keyboard, scroll-wheel, or toolbar icons for zooming, the cursor position is used as the center for zooming. If there is no current cursor position, the center of the graph is used. To set a cursor position, click on the point of interest on the graph area. This places a red line or cross-hair on the graph, which is used for zooming.
3.8.2 Measurement Markers (Graphs Only)
Use the Measurement Marker Mode toolbar icon to add a measurement marker line to a view. A measurement marker line identifies the data value at a location and allows you to measure the distance between multiple locations on a graph.
Click the icon to switch to Measurement mode. Then, you see marker lines as you move the mouse around the graph. You can click on the graph to add a marker at that position. You stay in the "add marker" mode until you add a marker or click the Measurement Marker icon again.
The legend area above the graph shows the X and Y values of markers. Right-click inside the graph to enable or disable the Legend from the shortcut menu.
36 Tasks and Roadmaps for System Analyzer SPRUH43D—February 2013Submit Documentation Feedback
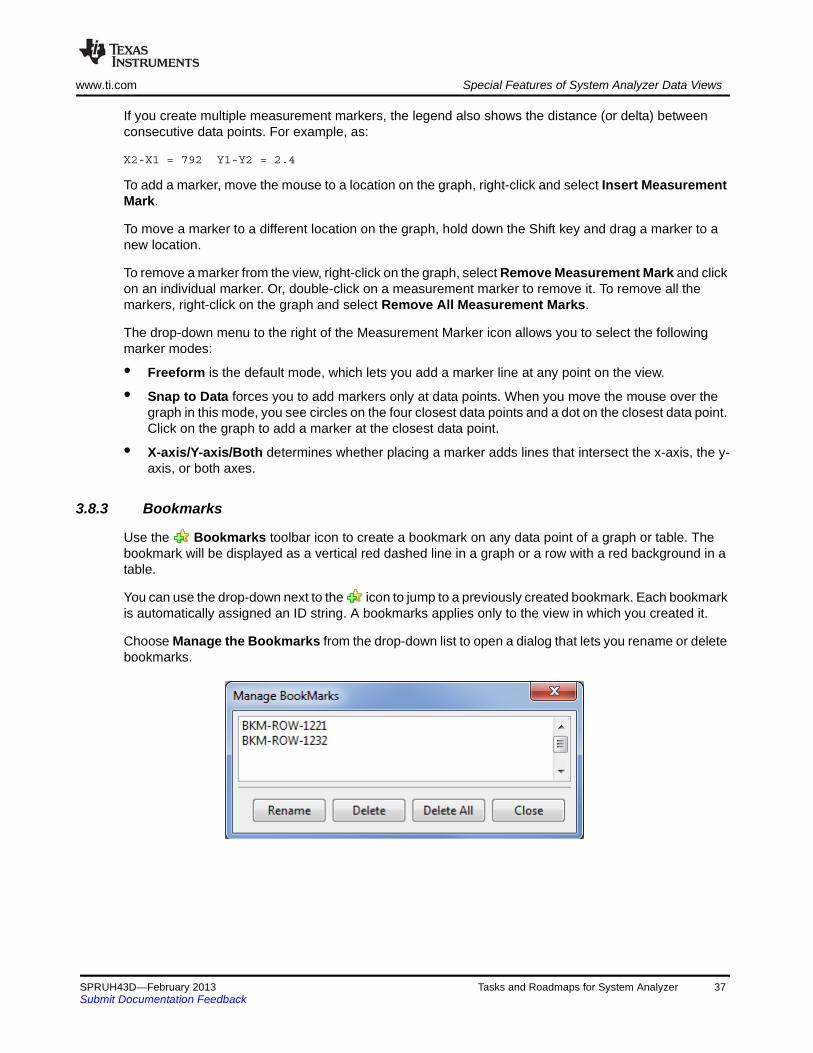
www.ti.com Special Features of System Analyzer Data Views
If you create multiple measurement markers, the legend also shows the distance (or delta) between consecutive data points. For example, as:
X2-X1 = 792 Y1-Y2 = 2.4
To add a marker, move the mouse to a location on the graph, right-click and select Insert Measurement Mark.
To move a marker to a different location on the graph, hold down the Shift key and drag a marker to a new location.
To remove a marker from the view, right-click on the graph, select Remove Measurement Mark and click on an individual marker. Or, double-click on a measurement marker to remove it. To remove all the markers, right-click on the graph and select Remove All Measurement Marks.
The drop-down menu to the right of the Measurement Marker icon allows you to select the following marker modes:
• Freeform is the default mode, which lets you add a marker line at any point on the view.
• Snap to Data forces you to add markers only at data points. When you move the mouse over the graph in this mode, you see circles on the four closest data points and a dot on the closest data point. Click on the graph to add a marker at the closest data point.
• X-axis/Y-axis/Both determines whether placing a marker adds lines that intersect the x-axis, the y-axis, or both axes.
3.8.3 Bookmarks
Use the Bookmarks toolbar icon to create a bookmark on any data point of a graph or table. The bookmark will be displayed as a vertical red dashed line in a graph or a row with a red background in a table.
You can use the drop-down next to the icon to jump to a previously created bookmark. Each bookmark is automatically assigned an ID string. A bookmarks applies only to the view in which you created it.
Choose Manage the Bookmarks from the drop-down list to open a dialog that lets you rename or delete bookmarks.
SPRUH43D—February 2013 Tasks and Roadmaps for System Analyzer 37Submit Documentation Feedback

Special Features of System Analyzer Data Views www.ti.com
3.8.4 Groups and Synchronous Scrolling
You can group data views together based on common data such as time values. Grouped views are scrolled synchronously to let you easily navigate to interesting points. For example, if you group the CPU load graph with the Log view, then if you click on the CPU Load graph, the Log view displays the closest record to where you clicked in the graph.
To enable grouping, toggle on the View with Group icon on the toolbar. Then, simply move the cursor in a grouped table or on a graph as you normally would.
For graphs, the x-axis is used for the common reference value. For tables you can define the reference column. Also, you can use the drop-down to define multiple view groups.
In graphs you can use the Align Horizontal Center and Align Horizontal Range icons to determine whether this view should be grouped according to the center value currently displayed on the x-axis or the full range of values displayed on the x-axis.
3.8.5 Find
Click to open a dialog that lets you locate a record containing a particular string in one of the fields or a record whose fields satisfy a particular expression. Clicking Find repeatedly moves you through the data to each instance of the desired value or string.
The Use Field tab is best for simple searches that compare a field value using common operators such as ==, <, != etc. Follow these steps in the Use Field tab:
1. Click the Find icon in the toolbar.
2. Select the Use Field tab.
3. Select a field name from the left drop-down list. This list shows all the data columns used in the detail view for this analysis feature.
4. Select an operation from the middle drop-down list. The operators depend on the datatype for the field you selected.
5. Type a field value for the comparison in the text box.
6. [Optional] Check the Use Bits Mask (hex) box and specify a hexadecimal bit mask in the adjacent field if you want to exclude a portion of a value from consideration.
38 Tasks and Roadmaps for System Analyzer SPRUH43D—February 2013Submit Documentation Feedback

www.ti.com Special Features of System Analyzer Data Views
7. [Optional] Check the Case Sensitive box if you want a case-sensitive search.
8. [Optional] Check the Wrap Search box if you want to continue searching from the top of the table once the end is reached.
9. [Optional] Select a Direction option for the search.
10. Click Find to start the search.
The Use Expression tab lets you enter a regular expression for pattern matching and lets you combine expressions with Boolean operators. Follow these steps in the Use Expression tab:
1. Click the Find icon in the toolbar.
2. Select the Use Expression tab.
3. Create a regular expression within the Expression text box. Visit the link for info on creating expressions used to find data. You can type a regular expression directly or use the Expression Helper to assemble the expression. To use the Expression Helper, follow these sub-steps:
— Select a field name from the left drop-down list. This list shows all data columns used in the detail view for this analysis feature.
— Select an operation from the middle drop-down list. The operators depend on the datatype for the field you selected.
— Type a field value for the comparison in the text box.
— [Optional] Check the Use Bits Mask (hex) box and specify a hexadecimal bit mask in the adjacent field if you want to exclude a portion of a value from consideration.
— [Optional] Check the Case Sensitive box if you want a case-sensitive search.
— Click And or Or to create the regular expression and add it to the existing statement in the Expression text box.
SPRUH43D—February 2013 Tasks and Roadmaps for System Analyzer 39Submit Documentation Feedback
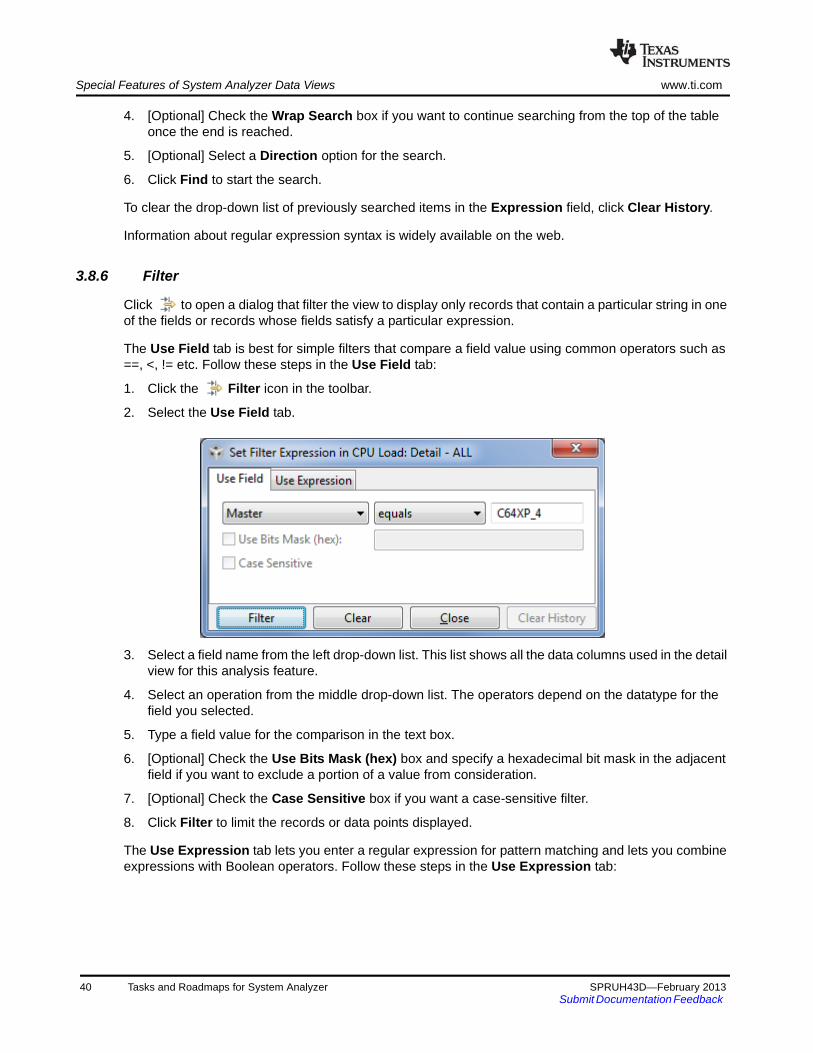
Special Features of System Analyzer Data Views www.ti.com
4. [Optional] Check the Wrap Search box if you want to continue searching from the top of the table once the end is reached.
5. [Optional] Select a Direction option for the search.
6. Click Find to start the search.
To clear the drop-down list of previously searched items in the Expression field, click Clear History.
Information about regular expression syntax is widely available on the web.
3.8.6 Filter
Click to open a dialog that filter the view to display only records that contain a particular string in one of the fields or records whose fields satisfy a particular expression.
The Use Field tab is best for simple filters that compare a field value using common operators such as ==, <, != etc. Follow these steps in the Use Field tab:
1. Click the Filter icon in the toolbar.
2. Select the Use Field tab.
3. Select a field name from the left drop-down list. This list shows all the data columns used in the detail view for this analysis feature.
4. Select an operation from the middle drop-down list. The operators depend on the datatype for the field you selected.
5. Type a field value for the comparison in the text box.
6. [Optional] Check the Use Bits Mask (hex) box and specify a hexadecimal bit mask in the adjacent field if you want to exclude a portion of a value from consideration.
7. [Optional] Check the Case Sensitive box if you want a case-sensitive filter.
8. Click Filter to limit the records or data points displayed.
The Use Expression tab lets you enter a regular expression for pattern matching and lets you combine expressions with Boolean operators. Follow these steps in the Use Expression tab:
40 Tasks and Roadmaps for System Analyzer SPRUH43D—February 2013Submit Documentation Feedback
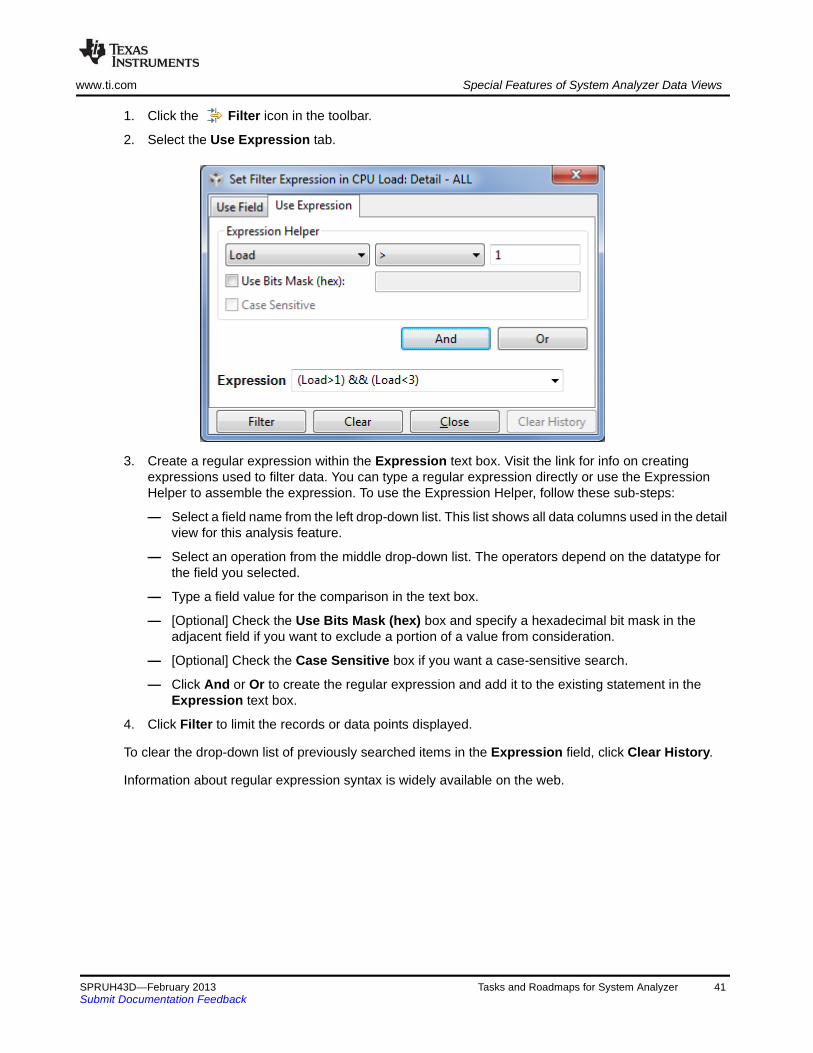
www.ti.com Special Features of System Analyzer Data Views
1. Click the Filter icon in the toolbar.
2. Select the Use Expression tab.
3. Create a regular expression within the Expression text box. Visit the link for info on creating expressions used to filter data. You can type a regular expression directly or use the Expression Helper to assemble the expression. To use the Expression Helper, follow these sub-steps:
— Select a field name from the left drop-down list. This list shows all data columns used in the detail view for this analysis feature.
— Select an operation from the middle drop-down list. The operators depend on the datatype for the field you selected.
— Type a field value for the comparison in the text box.
— [Optional] Check the Use Bits Mask (hex) box and specify a hexadecimal bit mask in the adjacent field if you want to exclude a portion of a value from consideration.
— [Optional] Check the Case Sensitive box if you want a case-sensitive search.
— Click And or Or to create the regular expression and add it to the existing statement in the Expression text box.
4. Click Filter to limit the records or data points displayed.
To clear the drop-down list of previously searched items in the Expression field, click Clear History.
Information about regular expression syntax is widely available on the web.
SPRUH43D—February 2013 Tasks and Roadmaps for System Analyzer 41Submit Documentation Feedback

Special Features of System Analyzer Data Views www.ti.com
3.8.7 Export
You can save data in a table or graph view to an external file by using the Data > Export commands. All columns contained in the table (not just the displayed columns) and the displayed graph numbers are placed into a comma-separated value file format (*.csv filename extension).
Numeric values are stored in the CSV format using a general format. You can use spreadsheet software such as Microsoft Excel to perform additional computations or create annotated charts from the exported information.
To export data to an external CSV file:
1. Select a table or a graph view.
2. If you want to export only some rows from a table view, hold down the Shift key and select a range of rows or hold down the Ctrl key while selecting multiple rows.
3. Right-click on the table or graph and select Data > Export All or Data > Export Selected from the right-click menu.
4. In the Save As dialog, browse for the location where you want to save the file and type a filename. Click Save.
5. Open the file you created using a spreadsheet or other software program. Alternately, you can later reopen the CSV file in a System Analyzer session as described in Section 4.6.1.
3.8.8 Cursor and Scroll Lock
Data views scroll to the end whenever new data is received. If you click on a point in a graph or table while data is updating, automatic scrolling is stopped, even though data is still being added at to the end.
To continue scrolling to the end automatically, toggle off the Scroll Lock button on the toolbar.
Note that if you have enabled grouping (the icon is toggled on), the scroll lock icon does not lock the scrolling of grouped views.
Use the Freeze Update command in the right-click menu to freeze the data updates and automatic refreshing completely.
3.8.9 Column Settings and Display Properties
Right-click on a System Analyzer table view and choose Column Settings. You can choose which columns to make visible in the table by checking boxes for those fields. For most views, you can choose how each column should be formatted (for example, as binary, decimal, hex, or time), how to justify (align) the column, the font for the column, and whether to display a vertical bar corresponding to the size of the value.
Right-click on a System Analyzer graph view and choose Display Properties. You can choose which channels (rows or data sets) to make visible in the table by checking boxes for those fields. For most views, you can choose whether each channel is visible and expanded. You can also change other aspects of how the graph is displayed.
42 Tasks and Roadmaps for System Analyzer SPRUH43D—February 2013Submit Documentation Feedback

Chapter 4
Using System Analyzer in Code Composer Studio
This chapter describes the host-side analysis features provided in Code Composer Studio for examining instrumentation data sent to the host.
4.1 Overview of System Analyzer Features . . . . . . . . . . . . . . . . . . . . . . . 44
4.2 Starting a Live System Analyzer Session . . . . . . . . . . . . . . . . . . . . . . 45
4.3 System Analyzer Features and Views . . . . . . . . . . . . . . . . . . . . . . . . . 48
4.4 Managing a System Analyzer Session . . . . . . . . . . . . . . . . . . . . . . . . 52
4.5 Configuring System Analyzer Transports and Endpoints. . . . . . . . . 54
4.6 Opening CSV and Binary Files Containing System Analyzer Data . 57
4.7 Using the Log View . . . . . . . . . . . . . . . . . . . . . . . . . . . . . . . . . . . . . . . . 61
4.8 Using the Concurrency Feature . . . . . . . . . . . . . . . . . . . . . . . . . . . . . . 65
4.9 Using the Count Analysis . . . . . . . . . . . . . . . . . . . . . . . . . . . . . . . . . . . 67
4.10 Using the CPU Load View. . . . . . . . . . . . . . . . . . . . . . . . . . . . . . . . . . . 70
4.11 Using the Printf Logs . . . . . . . . . . . . . . . . . . . . . . . . . . . . . . . . . . . . . . 73
4.12 Using the Task Load View . . . . . . . . . . . . . . . . . . . . . . . . . . . . . . . . . . 74
4.13 Using Context Aware Profile . . . . . . . . . . . . . . . . . . . . . . . . . . . . . . . . 77
4.14 Using the Duration Feature . . . . . . . . . . . . . . . . . . . . . . . . . . . . . . . . . 82
4.15 Using the Task Profiler . . . . . . . . . . . . . . . . . . . . . . . . . . . . . . . . . . . . . 86
4.16 Using the Execution Graph . . . . . . . . . . . . . . . . . . . . . . . . . . . . . . . . . 88
4.17 Using System Analyzer with Non-UIA Applications. . . . . . . . . . . . . . 90
Topic Page
43 Using System Analyzer in Code Composer Studio SPRUH43D—February 2013Submit Documentation Feedback

Overview of System Analyzer Features www.ti.com
4.1 Overview of System Analyzer Features
System Analyzer provides a number of analysis features you can use when debugging your UIA-enabled application. You can view CPU and thread loads, the execution sequence, thread durations, context profiling, and more. The features include graphs, detailed logs, and summary logs.
You can use these features at run-time and can also record the run-time data for later analysis.
• Run-time analysis. Real-time data analysis can be performed without the need to halt the target program. This ensures that actual program behavior can be observed, since halting multiple cores can result in threading that differs from real-time behavior.
• Recording and playback of data. You can record real-time data and later reload the data to further analyze the activity. System Analyzer lets you record and playback using both CSV and binary files.
This chapter describes how to start data collection and analysis. It also describes how to use specific System Analyzer features.
To gather System Analyzer data, you need an instrumented application running on the target(s). If you have not done so already, enable UIA logging by configuring the application as described in Section 5.1, Quickly Enabling UIA Instrumentation. Once you have enabled UIA logging, SYS/BIOS applications provide UIA data to the System Analyzer features in CCS.
44 Using System Analyzer in Code Composer Studio SPRUH43D—February 2013Submit Documentation Feedback
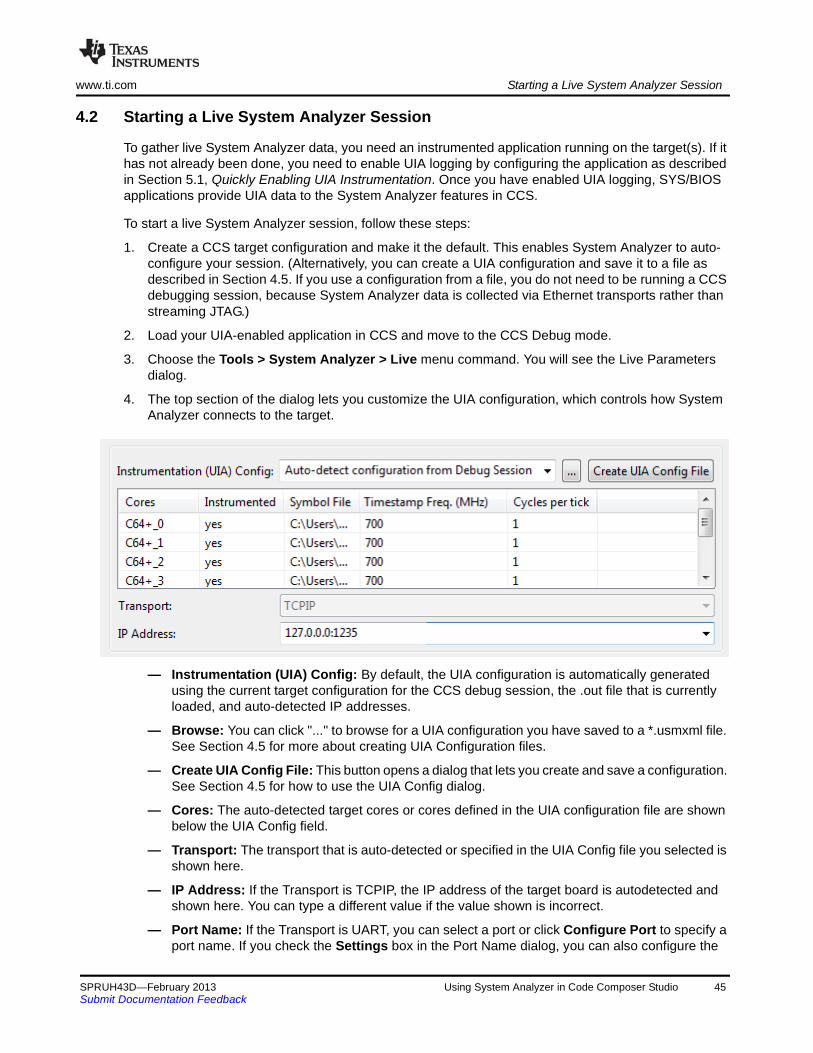
www.ti.com Starting a Live System Analyzer Session
4.2 Starting a Live System Analyzer Session
To gather live System Analyzer data, you need an instrumented application running on the target(s). If it has not already been done, you need to enable UIA logging by configuring the application as described in Section 5.1, Quickly Enabling UIA Instrumentation. Once you have enabled UIA logging, SYS/BIOS applications provide UIA data to the System Analyzer features in CCS.
To start a live System Analyzer session, follow these steps:
1. Create a CCS target configuration and make it the default. This enables System Analyzer to auto-configure your session. (Alternatively, you can create a UIA configuration and save it to a file as described in Section 4.5. If you use a configuration from a file, you do not need to be running a CCS debugging session, because System Analyzer data is collected via Ethernet transports rather than streaming JTAG.)
2. Load your UIA-enabled application in CCS and move to the CCS Debug mode.
3. Choose the Tools > System Analyzer > Live menu command. You will see the Live Parameters dialog.
4. The top section of the dialog lets you customize the UIA configuration, which controls how System Analyzer connects to the target.
— Instrumentation (UIA) Config: By default, the UIA configuration is automatically generated using the current target configuration for the CCS debug session, the .out file that is currently loaded, and auto-detected IP addresses.
— Browse: You can click "..." to browse for a UIA configuration you have saved to a *.usmxml file. See Section 4.5 for more about creating UIA Configuration files.
— Create UIA Config File: This button opens a dialog that lets you create and save a configuration. See Section 4.5 for how to use the UIA Config dialog.
— Cores: The auto-detected target cores or cores defined in the UIA configuration file are shown below the UIA Config field.
— Transport: The transport that is auto-detected or specified in the UIA Config file you selected is shown here.
— IP Address: If the Transport is TCPIP, the IP address of the target board is autodetected and shown here. You can type a different value if the value shown is incorrect.
— Port Name: If the Transport is UART, you can select a port or click Configure Port to specify a port name. If you check the Settings box in the Port Name dialog, you can also configure the
SPRUH43D—February 2013 Using System Analyzer in Code Composer Studio 45Submit Documentation Feedback

Starting a Live System Analyzer Session www.ti.com
speed, data bits, parity, and stop bits. The value placed in the Port Name field after you configure the port contains speed, bit, and parity information. For example: COM10:115200/8N1 is the resulting Port Name from the following settings.
5. The next section of the dialog lets you select how to view the data that will be collected.
— Analysis Feature: Choose features you want to open. See Section 4.3 for a list of features and links to details. (You can open additional analysis features after starting the session.)
— Which Cores: Choose whether to display events from ALL cores or a single core. The drop-down list shows the core names for endpoints in your current UIA configuration along with core names for any active CCS target configuration for a debugging session. For the Context Aware Profile and Task Load features, a specific core name is required (not ALL), and you can select or type the name.
— Which Views to Open: Choose the view types you want to open automatically. You can later open more views, but these checkboxes provide an easy way to open a number of them.
46 Using System Analyzer in Code Composer Studio SPRUH43D—February 2013Submit Documentation Feedback
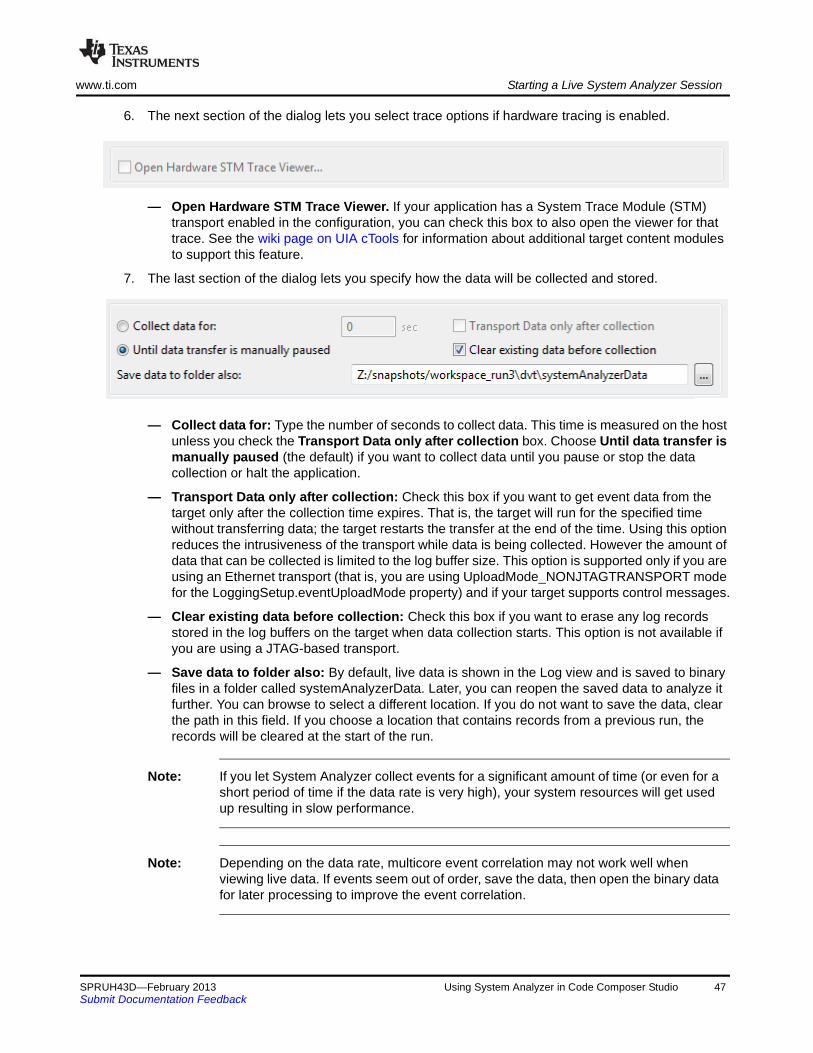
www.ti.com Starting a Live System Analyzer Session
6. The next section of the dialog lets you select trace options if hardware tracing is enabled.
— Open Hardware STM Trace Viewer. If your application has a System Trace Module (STM) transport enabled in the configuration, you can check this box to also open the viewer for that trace. See the wiki page on UIA cTools for information about additional target content modules to support this feature.
7. The last section of the dialog lets you specify how the data will be collected and stored.
— Collect data for: Type the number of seconds to collect data. This time is measured on the host unless you check the Transport Data only after collection box. Choose Until data transfer is manually paused (the default) if you want to collect data until you pause or stop the data collection or halt the application.
— Transport Data only after collection: Check this box if you want to get event data from the target only after the collection time expires. That is, the target will run for the specified time without transferring data; the target restarts the transfer at the end of the time. Using this option reduces the intrusiveness of the transport while data is being collected. However the amount of data that can be collected is limited to the log buffer size. This option is supported only if you are using an Ethernet transport (that is, you are using UploadMode_NONJTAGTRANSPORT mode for the LoggingSetup.eventUploadMode property) and if your target supports control messages.
— Clear existing data before collection: Check this box if you want to erase any log records stored in the log buffers on the target when data collection starts. This option is not available if you are using a JTAG-based transport.
— Save data to folder also: By default, live data is shown in the Log view and is saved to binary files in a folder called systemAnalyzerData. Later, you can reopen the saved data to analyze it further. You can browse to select a different location. If you do not want to save the data, clear the path in this field. If you choose a location that contains records from a previous run, the records will be cleared at the start of the run.
Note: If you let System Analyzer collect events for a significant amount of time (or even for a short period of time if the data rate is very high), your system resources will get used up resulting in slow performance.
Note: Depending on the data rate, multicore event correlation may not work well when viewing live data. If events seem out of order, save the data, then open the binary data for later processing to improve the event correlation.
SPRUH43D—February 2013 Using System Analyzer in Code Composer Studio 47Submit Documentation Feedback

System Analyzer Features and Views www.ti.com
Note: Multicore event correlation for events uploaded via JTAG transports is unsupported.
8. Click Start to connect to the target and show live data collection in the Log view. See Section 4.7 for information about using the Log view.
If you start a new live session when a live session is already running, the current session is closed so the new session can be opened. You can run only one live session or binary file session at a time. (You can have multiple CSV files open along with a single live session or binary file.)
If you want to save instrumentation data to a CSV file (instead of a binary file), right-click on the Log view and choose Data > Export All. For information about using binary and CSV files that store instrumentation data, see Section 4.6, Opening CSV and Binary Files Containing System Analyzer Data.
For other ways to open analysis features, see Section 4.3.1 through Section 4.3.2.
4.3 System Analyzer Features and Views
You can use the following analysis features:
• Concurrency. Shows how many cores are active at once and when. See Section 4.8.
• Count Analysis. Tracks values on the target. See Section 4.9.
• CPU Load. Shows the SYS/BIOS load data collected for all cores in the system. See Section 4.10.
• Printf Logs. Shows messages sent via Log_printf() calls. See Section 4.11.
• Task Load. Shows the CPU load data measured within a SYS/BIOS Task thread. See Section 4.12.
• Context Aware Profile. Calculates duration with awareness of interruptions by other threads and functions. See Section 4.13.
• Duration. Calculates the total duration between pairs of execution points. See Section 4.14.
• Task Profiler. Shows percent of time tasks spend in each execution state. See Section 4.15.
• Execution Graph. Shows threads on the target(s). See Section 4.16.
• Raw Logs. Shows a listing of logged messages and events. See Section 4.7.
The CPU Load, Task Load, and Execution Graph features display information automatically provided by SYS/BIOS. The Count Analysis, Duration, and Context Aware Profile features display data only if you modify your target code to instrument the required events.
The Statistics Data item are use only by applications that are not UIA-enabled and therefore use the old RTA Tools. See Section 4.17.
There are several ways to view most analysis features. For example: a summary table, detail table, and a graph. The following table shows the types of views available for each feature:
48 Using System Analyzer in Code Composer Studio SPRUH43D—February 2013Submit Documentation Feedback
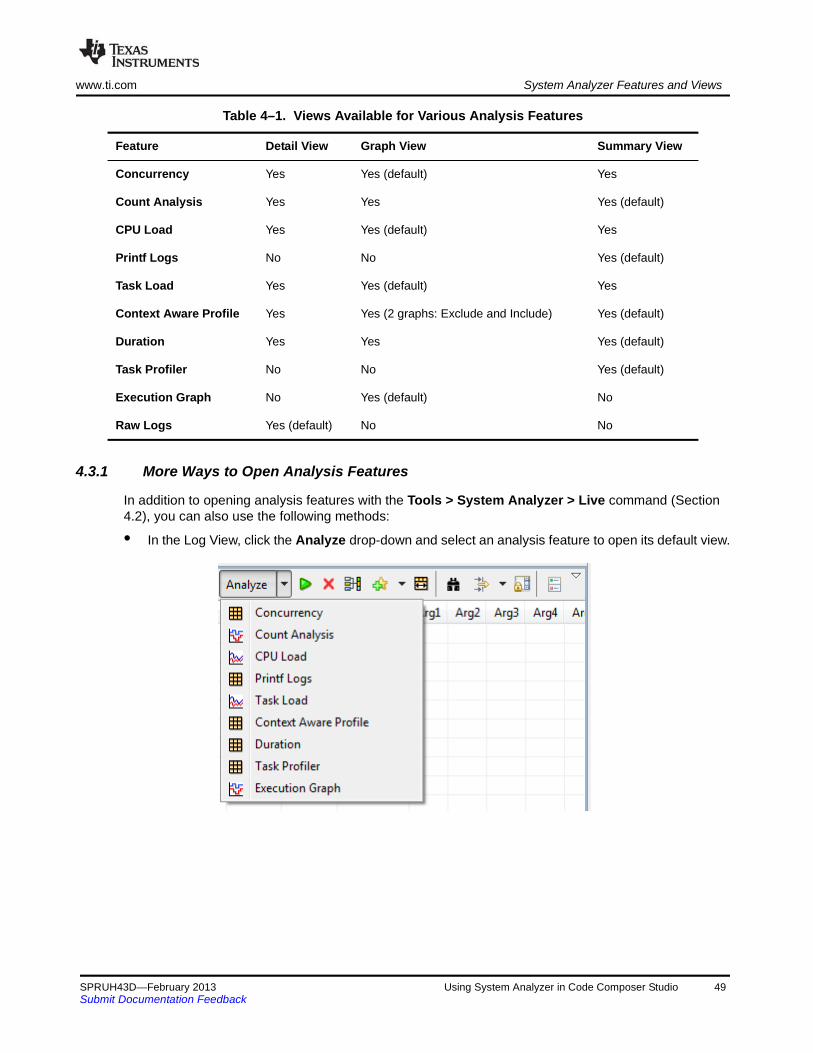
www.ti.com System Analyzer Features and Views
Table 4–1. Views Available for Various Analysis Features
4.3.1 More Ways to Open Analysis Features
In addition to opening analysis features with the Tools > System Analyzer > Live command (Section 4.2), you can also use the following methods:
• In the Log View, click the Analyze drop-down and select an analysis feature to open its default view.
Feature Detail View Graph View Summary View
Concurrency Yes Yes (default) Yes
Count Analysis Yes Yes Yes (default)
CPU Load Yes Yes (default) Yes
Printf Logs No No Yes (default)
Task Load Yes Yes (default) Yes
Context Aware Profile Yes Yes (2 graphs: Exclude and Include) Yes (default)
Duration Yes Yes Yes (default)
Task Profiler No No Yes (default)
Execution Graph No Yes (default) No
Raw Logs Yes (default) No No
SPRUH43D—February 2013 Using System Analyzer in Code Composer Studio 49Submit Documentation Feedback

System Analyzer Features and Views www.ti.com
• Right-click on the Log view. From the context menu, choose Analyze and then an analysis feature.
• An alternate way to open System Analyzer views is from the Tools > RTOS Analyzer menu. System Analyzer detects the target configuration and transport from your debug session. It uses default values for data collection—existing data is cleared before data collection begins, data is transferred until you pause it manually, and data is also written to a CSV file in your CCS workspace. See the SYS/BIOS documentation for more information.
You are prompted for any settings that System Analyzer can’t determine from the loaded applicationand target configuration. For example, if you are using USB or UART to transfer logs, you will beprompted for the port number. The dialog can get the ports faster if you leave the application runningwhen starting an analysis feature. If the application is halted at a breakpoint or paused, it may takeabout 30 seconds to get the list of ports.
The Count Analysis, Context Aware Profile, and Duration analysis features are not listed in the RTOSAnalyzer menu. Use the Tools > System Analyzer > Live menu command to start a live sessionthat includes these analysis features, which require modifications to your application code to performadditional logging. All the analysis features listed in the RTOS Analyzer menu use data that isautomatically logged by SYS/BIOS.
50 Using System Analyzer in Code Composer Studio SPRUH43D—February 2013Submit Documentation Feedback

www.ti.com System Analyzer Features and Views
If you open an analysis feature for a multicore target, you are prompted to choose whether to display events from ALL cores or a single core. You can type the name of a core in this field. The drop-down list shows the core names for endpoints in your currently selected UIA configuration file along with core names for any active CCS target configuration for a debugging session.
You are not prompted to specify the core if only one of the cores is instrumented.
When you choose to open the Count Analysis feature, you are also asked whether you want to plot the graph vs. the time or sample sequence number.
4.3.2 More Ways to Open Views
To open views other that the default view for an analysis feature that you have already started, do any of the following:
• In any System Analyzer view, click the <Analysis_Feature> views drop-down list and select any view for that analysis feature.
• Right-click on an analysis view and choose another view for that analysis feature. For example, in the CPU Load graph, you can right-click and choose CPU Load views > Summary.
You can synchronize the scrolling and cursor placement in views for the same session by clicking View with Group icon in the toolbars of the views you want to synchronize.
SPRUH43D—February 2013 Using System Analyzer in Code Composer Studio 51Submit Documentation Feedback

Managing a System Analyzer Session www.ti.com
4.4 Managing a System Analyzer Session
You can manage System Analyzer sessions—including live sessions and binary files—with commands in the Log view toolbar and the Log view right-click menu. The commands in the following lists apply to the current state of the session.
For descriptions of System Analyzer toolbar icons that control the view display rather than the session behavior, see page 3–35 and page 4–63.
Icons for the following commands are provided in the toolbar of the Log view:
• Run connects to the target(s) using the UIA configuration during a live session. Stop disconnects from the target. If you are using a binary file, the Run command reruns the file. Data is cleared from the System Analyzer views when you use the Run command. (Live and binary sessions only.)
• Close Session ends this System Analyzer session or closes the file and all the associated analysis features and views. If you close the Log view, you are asked if you want to close this session.
• Scroll Lock lets you examine records as data is being collected without having the display jump to the end whenever new records are added to the view. See Section 3.8.8.
The right-click menu for the Log view for a live session or binary file has the following commands:
• Run/Stop connects to or disconnects from the target(s) using the UIA configuration during a live session. If you are using a binary file, the Run command reruns the file. Data is cleared from the System Analyzer views when you use the Run command.
• Pause/Resume Data Decoding halts and resumes processing of records received from the target. Available only for live sessions.
• Clear Log View erases all records from the Log view. Available only for live sessions.
52 Using System Analyzer in Code Composer Studio SPRUH43D—February 2013Submit Documentation Feedback

www.ti.com Managing a System Analyzer Session
• Pause/Resume Transfer halts and resumes the transfer of records from the target(s) to the host. This command is supported only if you are using an Ethernet transport (that is, you have set LoggingSetup.eventUploadMode to LoggingSetup.UploadMode_NONJTAGTRANSPORT) and if your target supports control messages. Available only for live sessions.
• Skip sync points for correlation causes System Analyzer to not wait to receive sync-point events that are used for multicore event correlation. You should set this option if your application does not log sync-point events or if you are not concerned about event correlation across cores. For example, you might use this command if the status line at the bottom of a System Analyzer view says "Waiting for UIA SyncPoint." Note that this command applies only to the current session.
• Freeze/Resume Data Update halts and resumes updates to the current view. If you pause data updates with this icon, data decoding continues in the background.
Data is processed in the following sequence: data transfer, then data decoding, then data updates. So, for example, if you use Pause Transfer, data that has already been transferred to the host will be decoded and updated in the display; once all transferred data has been processed, the data decoding and updates will need to wait for more data. Similarly, if you Pause Data Decoding, data updates will need to wait once all the decoded records have been displayed.
The following commands are available only for CSV files. Right-click in the Log view and use the CSV Viewer sub-menu.
• Stop halts processing of the current file.
• Clear Data clears all data in all open System Analyzer feature views.
• Open File lets you select a CSV or binary file to open and process.
If you reload your program or load a different program in CCS, the System Analyzer views you have open are reconfigured to handle data from the new program.
4.4.1 Closing a System Analyzer Session
System Analyzer sessions—including live sessions, binary files, and CSV files—remain open even if you close all the views of the session except the Log view. You may want to close a session, for example, in order to open a different live session or a binary file, since only one of these can be open at a time.
To completely close a session, click the Close Session icon in the "Live Session: Logs" view or choose Tools > System Analyzer > Live Session > Close Session from the main CCS menu bar.
SPRUH43D—February 2013 Using System Analyzer in Code Composer Studio 53Submit Documentation Feedback

Configuring System Analyzer Transports and Endpoints www.ti.com
4.5 Configuring System Analyzer Transports and Endpoints
If you want more control over the target configuration that System Analyzer uses or want to save the configuration to a file, you can use the Tools > System Analyzer > UIA Config dialog described in this section.
A UIA configuration specifies the transports used to send logs and commands between the target and host. It also specifies the cores that will be sending data to System Analyzer. You can save a configuration after you create it for later use.
Notice in the figure above that a UIA configuration contains an Event Transport, a Control and Status Transport, and endpoints for each core in the application.
To create a UIA configuration, follow these steps:
1. In CCS, choose the Tools > System Analyzer > UIA Config menu command.
2. Click the Event Transport icon in the UIA Config dialog. This lets you specify the transport used for moving logs from the target to the host.
3. In the Add an Event Connection dialog, provide details about the transport you want to use. Different target connections require different transports.
— The Transport Type options are UDP, TCPIP, JTAG, STM, FILE, and UART. The default is UDP.
54 Using System Analyzer in Code Composer Studio SPRUH43D—February 2013Submit Documentation Feedback
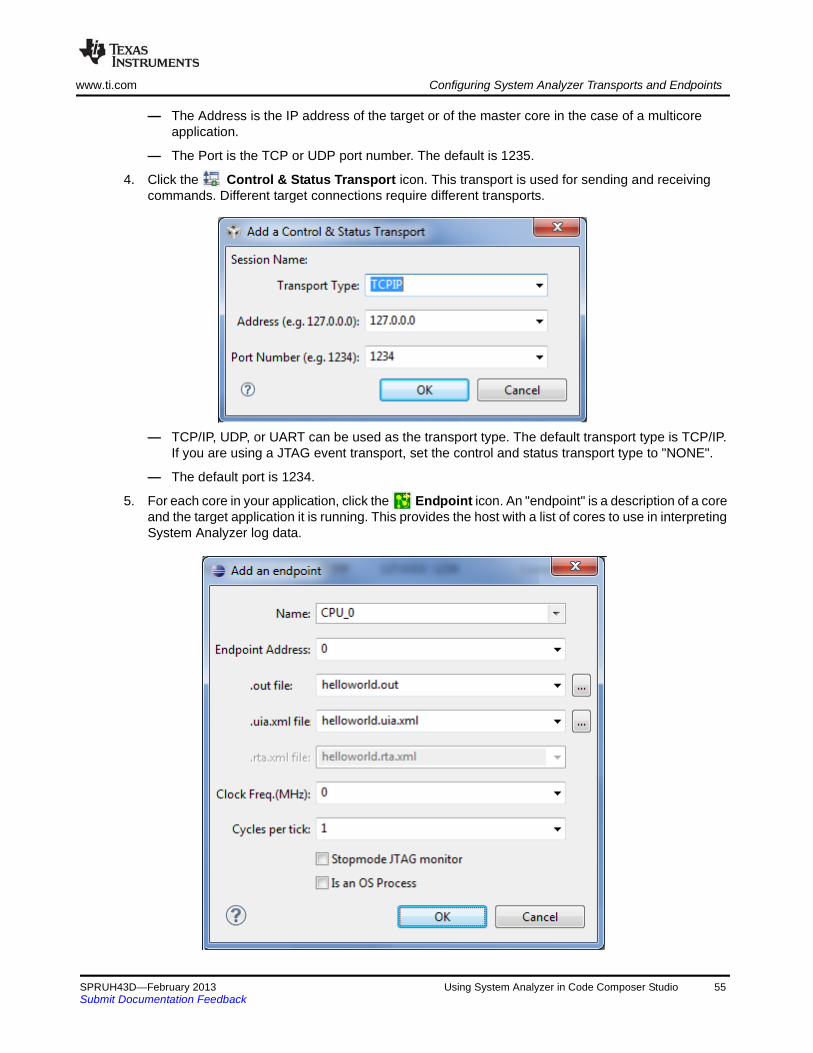
www.ti.com Configuring System Analyzer Transports and Endpoints
— The Address is the IP address of the target or of the master core in the case of a multicore application.
— The Port is the TCP or UDP port number. The default is 1235.
4. Click the Control & Status Transport icon. This transport is used for sending and receiving commands. Different target connections require different transports.
— TCP/IP, UDP, or UART can be used as the transport type. The default transport type is TCP/IP. If you are using a JTAG event transport, set the control and status transport type to "NONE".
— The default port is 1234.
5. For each core in your application, click the Endpoint icon. An "endpoint" is a description of a core and the target application it is running. This provides the host with a list of cores to use in interpreting System Analyzer log data.
SPRUH43D—February 2013 Using System Analyzer in Code Composer Studio 55Submit Documentation Feedback

Configuring System Analyzer Transports and Endpoints www.ti.com
— Name. Type the name of the target. If a CCS debug session is running and the target configuration matches that of your target application, you can select a name from the drop-down list. The actual name chosen here is not important, but it is best to use the same names here and the CCS Target Configuration.
— EndPoint Address. This is the number of the core starting from 0. For example, use 0 for CPU 0, 1 for CPU1, and so on. These numbers must correspond to the ServiceMgr module’s Core ID, which usually defaults to the index number of the ti.sdo.utils.MultiProc ID from IPC.
— .out file. The filename of the compiled and linked target application. Click the ... button and browse to find the file. The file extension may by .out or may contain the platform, for example, .x64P. When you click OK, the dialog checks to make sure this file exists.
— .uia.xml file. Name of the generated System Analyzer metadata file. This is an XML file that is created if your target application includes any UIA modules. It is typically auto-discovered when you select a .out file and click OK. If the file cannot be found automatically, click ... and browse to find the file. For example, the file may be stored in the Default\configPkg\package\cfg subdirectory of the project when you build the project.
— .rta.xml file. Name of the generated RTA metadata file. This file is created if your target application includes the RTA module. It is typically auto-discovered when you select a .out file and click OK. If the file cannot be found automatically, click ... and browse to find the file. This file is likely to be stored in the same directory as the .uia.xml file.
— Clock freq (MHz). Type the clock speed for this CPU in MHz. If you do not provide the correct value here, the durations reported by System Analyzer will not be converted to nanoseconds correctly.
— Cycles per tick. Type the number of cycles per clock tick for this CPU here. If you do not provide the correct value here, the durations reported by System Analyzer will not be converted to nanoseconds correctly.
— Stopmode JTAG monitor. Check this box if you want records to be transferred via JTAG when the target is halted. That is, check this box if the target application on this endpoint is configured to use any of the following settings for the eventUploadMode parameter of the LoggingSetup module: UploadMode_SIMULATOR, UploadMode_PROBEPOINT, or UploadMode_JTAGSTOPMODE.
— Is an OS Process. Check this box if this is a cUIA application running on a multi-process operating system such as Linux. See the wiki page on cUIA for information about UIA for Linux.
6. Once you have created both transports and the endpoints for each core, save the configuration by clicking the Save button. Browse for a directory to contain the file and type a filename. The Save As dialog shows that the configuration is saved in a file with an extension of .usmxml. The .usmxml file is used if you want to specify a saved configuration to use in a live session (page 4–45) or when opening a binary file (page 4–58). Behind the scenes, a file with the same name but a .xml extension is also saved, but you can ignore the .xml file.
If you want to edit an item in the configuration, you can double-click on it or right-click and select Edit the selected item to open the dialog used to create that item. To delete an item, right-click and select Delete the selected item.
To load a UIA configuration, click the Open icon in the toolbar. Browse for and open a configuration file you have saved (with a file extension of .usmxml).
56 Using System Analyzer in Code Composer Studio SPRUH43D—February 2013Submit Documentation Feedback

www.ti.com Opening CSV and Binary Files Containing System Analyzer Data
4.6 Opening CSV and Binary Files Containing System Analyzer Data
The System Analyzer features can save analysis data in two different file types:
• CSV files include UIA configuration information, so you do not need a UIA configuration in order to use a CSV file. See Section 4.6.1 for information about opening System Analyzer data saved to a CSV file.
• Binary files do not include UIA configuration information, so you do need a UIA configuration in order to see analysis data saved to a binary file. See Section 4.6.2 for information about opening System Analyzer data saved to a binary file.
A sample CSV data file is provided with System Analyzer so that you can try the System Analyzer features immediately.
See Section 4.2 for information about creating binary files and Section for information about creating CSV files.
4.6.1 Opening a CSV File
You can experiment with the host-side System Analyzer features using the CSV (comma-separated values) data files that are provided with the DVT installation. You do not need to load an application (in fact, you do not even need a target device) in order to view the data in a CSV file with System Analyzer.
System Analyzer provides the following example CSV files:
• saSampleData.csv is a recording of instrumentation data collected in a run-time session using a 6-core EVM6472 application. It is located in <ccs_install_dir>\ccsv5\ccs_base\dvt_3.#.#.# \AnalysisLibrary\DataProviders\CsvViewer.
• The <ccs_install_dir>\ccsv5\ccs_base\dvt_3.#.#.#\AnalysisLibrary\AnalysisFeatures directory contains a number of CSV files in subdirectories named for the analysis feature they are designed to demonstrate.
To load a CSV file, follow these steps:
1. In Code Composer Studio 5.x, move to CCS Debug mode. You do not need to build or load a project.
2. Choose the Tools > System Analyzer > Open CSV File menu command.
3. In the CSV File Parameters dialog, click the "…" button to the right of the File Name field.
4. Browse to one of the locations in the previous list of example CSV files.
5. Select the CSV file and click Open.
6. In the Analysis Feature column, choose features you want to use. These features will process events that apply to them when you open the CSV file. (You can start additional analysis features after you open the file.)
7. In the Which Cores column, choose whether to display events from ALL cores or a single core. The drop-down list shows the core names for endpoints for any active CCS target configuration for a debugging session. For the Context Aware Profile and Task Load features, a specific core name is required (not ALL), and you can select or type the name.
SPRUH43D—February 2013 Using System Analyzer in Code Composer Studio 57Submit Documentation Feedback

Opening CSV and Binary Files Containing System Analyzer Data www.ti.com
8. In the Which Views to Open column, choose the view types you want to open automatically. You can later open more views, but these checkboxes provide an easy way to open a number of them. For this example, check the following boxes:
9. Click Start. You will see the CSV File Log view, which displays the events stored in the CSV file. See Section 4.7 for information about how to use the Log view.
10. You will also see the views you selected in the dialog.
After learning to use System Analyzer features, you can analyze data from your own applications and record your own sessions as CSV files. See page 4–63 for information about creating your own CSV files.
4.6.2 Opening a Binary File
Opening a binary file that you saved during a run-time session lets you do later analysis of the results. See Section 4.2 for information about creating binary files.
You can load a binary file that contains System Analyzer data if you have a UIA configuration that matches the configuration with which the analysis data was saved or if you have a Debugger session open that matches the target configuration for the target used to create the binary file. (In contrast, opening a CSV file containing System Analyzer data does not require a UIA configuration or a loaded application because the data is already decoded.)
58 Using System Analyzer in Code Composer Studio SPRUH43D—February 2013Submit Documentation Feedback

www.ti.com Opening CSV and Binary Files Containing System Analyzer Data
To load a binary file containing System Analyzer event logs, follow these steps:
1. Start Code Composer Studio 5.x.
2. Create a CCS target configuration and start a debugging session, This enables System Analyzer to auto-configure your session. (Alternatively, you can create a UIA configuration and save it to a file as described in Section 4.5.)
3. Choose the Tools > System Analyzer > Open Binary File menu command.
4. In the first section of the Binary File Parameters dialog, browse for the directory that contains the data you want to open. The default folder name is dvt\systemAnalyzerData in your workspace directory.
5. The next section of the dialog lets you customize the UIA configuration, which controls how System Analyzer interprets the cores referenced in the binary data.
— Instrumentation (UIA) Config: By default, the UIA configuration is automatically generated using the current target configuration for the CCS debug session, the .out file that is currently loaded, and auto-detected IP addresses.
— Browse: You can click "..." to browse for a UIA configuration you have saved to a *.usmxml file. The endpoint definitions in the file are used to interpret the binary data and must match the endpoints used when the binary data was saved. (The transport definitions are ignored since the data has already been transported.) See Section 4.5 for more about creating UIA Configuration files.
— Create UIA Config File: This button opens a dialog that lets you create and save a configuration.
— Cores: The list of cores is shown below the UIA Config field.
SPRUH43D—February 2013 Using System Analyzer in Code Composer Studio 59Submit Documentation Feedback
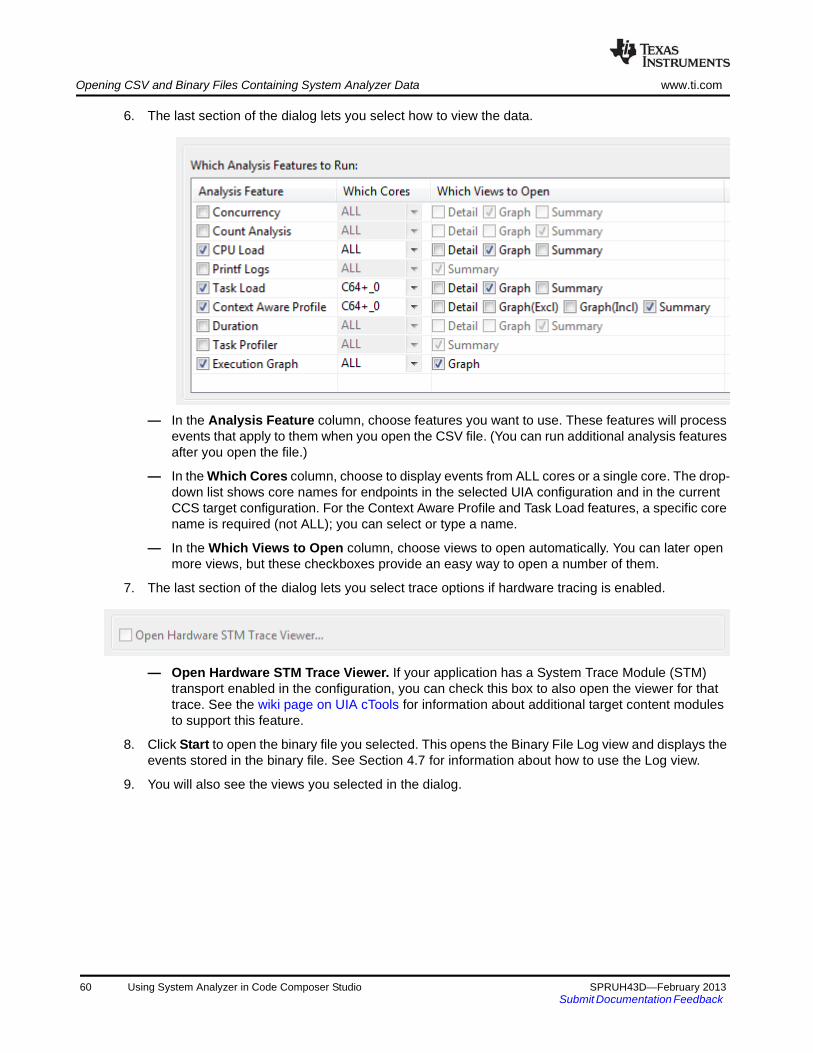
Opening CSV and Binary Files Containing System Analyzer Data www.ti.com
6. The last section of the dialog lets you select how to view the data.
— In the Analysis Feature column, choose features you want to use. These features will process events that apply to them when you open the CSV file. (You can run additional analysis features after you open the file.)
— In the Which Cores column, choose to display events from ALL cores or a single core. The drop-down list shows core names for endpoints in the selected UIA configuration and in the current CCS target configuration. For the Context Aware Profile and Task Load features, a specific core name is required (not ALL); you can select or type a name.
— In the Which Views to Open column, choose views to open automatically. You can later open more views, but these checkboxes provide an easy way to open a number of them.
7. The last section of the dialog lets you select trace options if hardware tracing is enabled.
— Open Hardware STM Trace Viewer. If your application has a System Trace Module (STM) transport enabled in the configuration, you can check this box to also open the viewer for that trace. See the wiki page on UIA cTools for information about additional target content modules to support this feature.
8. Click Start to open the binary file you selected. This opens the Binary File Log view and displays the events stored in the binary file. See Section 4.7 for information about how to use the Log view.
9. You will also see the views you selected in the dialog.
60 Using System Analyzer in Code Composer Studio SPRUH43D—February 2013Submit Documentation Feedback
www.ti.com Using the Log View
4.7 Using the Log View
The Log view opens automatically when you start a live data collection session or open a binary or CSV file containing System Analyzer data.
Log View Column Descriptions
The System Analyzer Log view shows the details of all records. The log contains the following columns:
• Row Number. This column indicates only the row number in the current log display. If you filter the records displayed, all the row numbers change.
• Type. Displays the event type. For live sessions and binary files, an icon is shown. For CSV files, a numeric value is shown. This field lets you quickly locate or filter certain types of events. A message can have multiple types, such as Error and Analysis; the type with the lower value is shown. For filtering, the type has a value from 0 to 11.
Table 4–2. Event Types
• Time. The time the event was logged in nanoseconds. The time in this column has been adjusted and correlated on the host to provide the global time based on a common timeline. The time is converted to nanoseconds using the clock and cycle information provided in the endpoint for each CPU in the UIA configuration.
• Error. A 1 in this column indicates that a a data loss error occurred. A 2 indicates that an out-of-sequence error occurred. A 3 indicates that both types of error occurred. Data loss errors are detected if SeqNo values are missing on a per logger basis. Out-of-sequence errors are determined by comparing Global Time values. Such errors can indicate that either records from a single core or between cores are out-of-sequence. Individual views display a message in the bottom status line if a data loss is detected.
Icon Value Type Comments
0 Unknown
1 Error
2 Warning
3 Information
4 Details
5 Life Cycle
6 Analysis
7 Module 1 Module-specific type
8 Module 2 Module-specific type
9 Module 3 Module-specific type
10 Emergency
11 Critical
SPRUH43D—February 2013 Using System Analyzer in Code Composer Studio 61Submit Documentation Feedback
Using the Log View www.ti.com
• Master. The core on which the event was logged. For example, C64XP_0 and C64XP_1.
• Message. A printf-style message that describes the logged event. Values from the Arg0 through Arg8 arguments are plugged into the message as appropriate. In general, messages beginning with "LM" are brief messages, "LD" indicates a message providing details, "LS" messages contain statistics, and "LW" indicates a warning message.
• Event. The type of event that occurred. Supported events include the following:
— Synchronization events (at startup)
— CtxChg (for context change)
— Pend, post, and block events from various modules
— Load, ready, start, and stop events from various modules
— Set priority and sleep events from the Task module
• EventClass. The class of the event that occurred. Supported event classes include:
— CPU (for Load events, for example from the ti.sysbios.utils.Load module)
— TSK (for task threads)
— HWI (for hardware interrupt threads)
— SWI (for software interrupt threads)
— FUNC (for some Start and Stop events, for example from the ti.uia.events.UIABenchmark module)
• Data1. The main information returned with an event. For many events, Data1 returns the name of the task or the thread type in which the event occurred.
• Data2. Further information returned with an event. For load events, for example, Data2 returns the load percentage.
• SeqNo. The sequence number with respect to the source logger on the source core. Each logger has its own sequence numbering. This number is used when detecting data loss.
• Logger. The name of the logger to which the event was sent. UIA creates several default loggers, and your target code can configure additional loggers.
• Module. The module that defines the type of event that occurred. This may be a UIA module, SYS/BIOS module, XDCtools module, or a RTSC module from some other software component. CCS adds an underscore before the module name for certain types of events for internal processing for other views.
• Domain. The module that logged the event.
• Local Time. The local timestamp on the core where the event was logged. This timestamp typically has a higher resolution than the global timestamp. Local timestamps are not correlated and adjusted to show timing interactions with events on other cores.
• Arg1 to Arg 8. Raw arguments passed with the event. Although the number of arguments associated with an event is not limited, typically events are logged with 0, 1, 2, 4, or 8 arguments. If more than 8 arguments are logged, only the first 8 are shown here.
62 Using System Analyzer in Code Composer Studio SPRUH43D—February 2013Submit Documentation Feedback

www.ti.com Using the Log View
Log View Toolbar Icons and Right-Click Menu Commands
The Log view contains a number of toolbar icons that let you control the view’s behavior. The toolbar is slightly different depending on whether you are viewing the log for a live session, binary file, or CSV file.
• Analyze lets you start any of the Analysis Features—such as the CPU Load or Count Analysis. The default view for the feature you select is opened.
• Run and Stop (live and binary only) connect to or disconnect from the target(s) using the UIA configuration during a live session. If you are using a binary file, the Run command reruns the file. Data is cleared from the System Analyzer views when you use the Run command.
• Close Session ends this System Analyzer session or closes the file and all the associated analysis features and views. If you close the Log view, you are asked if you want to close this session.
• Toggle Enable Grouping on and off (Shift+G). A "group" synchronizes views of instrumentation data so that scrolling in one view causes similar movement to happen automatically in another. For example, if you group the CPU load graph with the Log view, then click on the CPU Load graph, the Log view displays the closest record to where you clicked in the graph. See Section 3.8.4.
• Click to turn on Bookmark Mode. The next record you click in the log will be highlighted in red. Jump to a bookmarked event by using the drop-down list next to the Bookmark Mode icon. Choose Manage the Bookmarks from the drop-down list to open a dialog that lets you rename or delete bookmarks. See Section 3.8.3.
• Auto Fit Columns sets the column widths in the Log to fit their current contents.
• Open the Find In dialog to search this log. See Section 3.8.5.
• Filter the log records to match a pattern by using the Set Filter Expression dialog. See Section 3.8.6.
• Scroll Lock lets you examine records as data is being collected without having the display jump to the end whenever new records are added to the view. See Section 3.8.8.
• Column Settings lets you control which columns are displayed and how they are shown. You can use the dialog to change the alignment, font, and display format of a column (for example, decimal, binary, or hex). See Section 3.8.9.
• Select Row Count from this drop-down to toggle the column that shows row numbers in the log on and off.
Additional icons described in Section 4.4 differ depending on whether you are running a live session or a stored file session and let you control data transfer activity.
CSV File
Live Session
Binary File
or
SPRUH43D—February 2013 Using System Analyzer in Code Composer Studio 63Submit Documentation Feedback

Using the Log View www.ti.com
You can right-click on the Log view to choose from a menu of options. In addition to toolbar commands, you can use the following additional commands from the right-click menu:
• Copy. Copies the selected row or rows to the clipboard.
• Freeze/Resume Data Update halts and resumes updates to the current view. See Section 4.4.
• Data > Export Selected. Lets you save the selected rows to a CSV (comma-separated value) file. See Section 3.8.7.
• Data > Export All. Lets you save all the rows to a CSV file. For example, you might do this so that you can perform statistical analysis on the data values.
• Insert a Bookmark adds a highlight to the selected certain rows and provide ways to quickly jump to marked rows. See Section 3.8.3.
• Enable Grouping. Lets you define and delete groups that contain various types of log messages. See Section 3.8.4.
• Analyze. Start one of the analysis features. See Section 4.10.
• System Analyzer File or Session. Lets you pause, resume, and reset a live or binary file session. Lets you stop or reset a CSV file session. See Section 4.4, Managing a System Analyzer Session.
64 Using System Analyzer in Code Composer Studio SPRUH43D—February 2013Submit Documentation Feedback

www.ti.com Using the Concurrency Feature
4.8 Using the Concurrency Feature
The Concurrency view shows when each core is active (not running the Idle thread) and the level of concurrency in the system. The concurrency level shown is the number of cores active at that time.
To open this feature, choose Analyze > Concurrency from the drop-down list in the Log view.
Graph View for Concurrency
The Graph view opens by default. The rows for each core show when that core was active in green. You can expand a core row to separate activity and any data gaps.
Expand the Concurrency row to see how many cores were active as the application ran. For example, 0 means that no cores were running, 1 means a single core was running, and so on.
To open other views for the Concurrency feature, use the Views drop-down list in the toolbar of any Concurrency view.
• The Summary view presents the percent of time at each concurrency level. See Section 4.8.1.
See Also
• Section 3.3, Analyzing the Execution Sequence with System Analyzer
SPRUH43D—February 2013 Using System Analyzer in Code Composer Studio 65Submit Documentation Feedback

Using the Concurrency Feature www.ti.com
4.8.1 Summary View for Concurrency
To open the Summary view for the Concurrency feature, use the Views drop-down list in the toolbar of any Concurrency view.
The Summary view for the Concurrency feature shows the percent of time spent at each concurrency level. That is, what percent of the time were 0, 1, or more cores active. The total of the percents shown is 100%.
• Concurrency. Number of cores active at once.
• Percent. Percent of time spent at this concurrency level.
4.8.2 How Concurrency Works
The Concurrency feature uses the same events as the Execution Graph, Duration feature, and the Context Aware Profile. It displays data about Task, Swi, and Hwi threads provided automatically by internal SYS/BIOS calls. SYS/BIOS threads are pre-instrumented to provide such data via a background thread.
If a data loss is detected, it is shown in the appropriate rows and at the bottom of the graph. Data loss errors are detected if SeqNo values in the logged events are missing.
If data is returned to the host out of sequence, this graph may have unpredictable behavior for state transitions beyond the visible range of the graph.
66 Using System Analyzer in Code Composer Studio SPRUH43D—February 2013Submit Documentation Feedback

www.ti.com Using the Count Analysis
4.9 Using the Count Analysis
The Count Analysis feature provides statistics and visualization regarding a data value (32-bit signed) logged using a specific target-side UIA event (UIAEvt_intWithKey). For example, you might use Count Analysis to analyze how a data value from a peripheral changes over time. Or, you might want to find the maximum and minimum values reached by some variable or the number of times a variable is changed. The analysis is done on groups of log records with matching formatted strings that specify the source.
The Count Analysis feature displays data only if you modify your target code to include UIAEvt_intWithKey events as described in Section 4.9.3.
To open this feature, choose Analyze > Count Analysis from the drop-down list in the Log view.
When you choose to open the Count Analysis feature, in addition to selecting the core to analyze, you are also asked whether you want to plot the graph vs. the time or sample sequence numbers.
Summary View for Count Analysis
The Summary view is shown when you open the Count Analysis feature. This view shows the count, minimum, maximum, average, and total of the data values reported for each particular source.
This view provides only one record for each unique source. The columns shown are as follows:
• Source. Statistics are performed on groups determined by combining the core name with a formatted string passed to the Log_writeX() call that created this record.
• Count. The number of instances of this source.
• Min. The minimum data value for this source.
• Max. The maximum data value for this source.
• Average. The average data value for this source.
• Total. The total data value for this source.
See page 4–63 for information about using the toolbar icons and right-click menu in the Summary view.
To open other views for the Count Analysis feature, use the Views drop-down list in the toolbar of any Count Analysis view.
• The Detail view presents all log records for the UIAEvt_intWithKey event. See Section 4.9.1.
• The Graph view shows the change in the data value over time. See Section 4.9.2.
See Also
• Section 3.4, Performing Count Analysis with System Analyzer
SPRUH43D—February 2013 Using System Analyzer in Code Composer Studio 67Submit Documentation Feedback

Using the Count Analysis www.ti.com
4.9.1 Detail View for Count Analysis
To open the Detail view for this feature, use the Views drop-down list in the toolbar of any Count Analysis view.
Each record in the Detail view corresponds to a specific UIAEvt_intWithKey event logged on the target.
You can export the records from the Count Analysis Detail view to a CSV file that can be used by a spreadsheet. To do this, right-click on the view and choose Data > Export All. You might do this in order to perform statistical analysis on the primary and auxiliary data values.
• Time. This column shows the correlated time at which this event occurred.
• Source. This column identifies the group for this event, which was determined by combining the core name with the resulting formatted string from the Log_writeX() call that created this record.
• DataValue. The value used for the analysis.
• AuxData1. These fields are used to pass auxiliary data that may need to be observed. This is the Arg2 field of the input to the AF.
• AuxData2. This is the Arg3 field of the input to the AF.
See page 4–63 for information about using the toolbar icons and right-click menu in the Detail view.
See Also
• Section 3.4, Performing Count Analysis with System Analyzer
68 Using System Analyzer in Code Composer Studio SPRUH43D—February 2013Submit Documentation Feedback
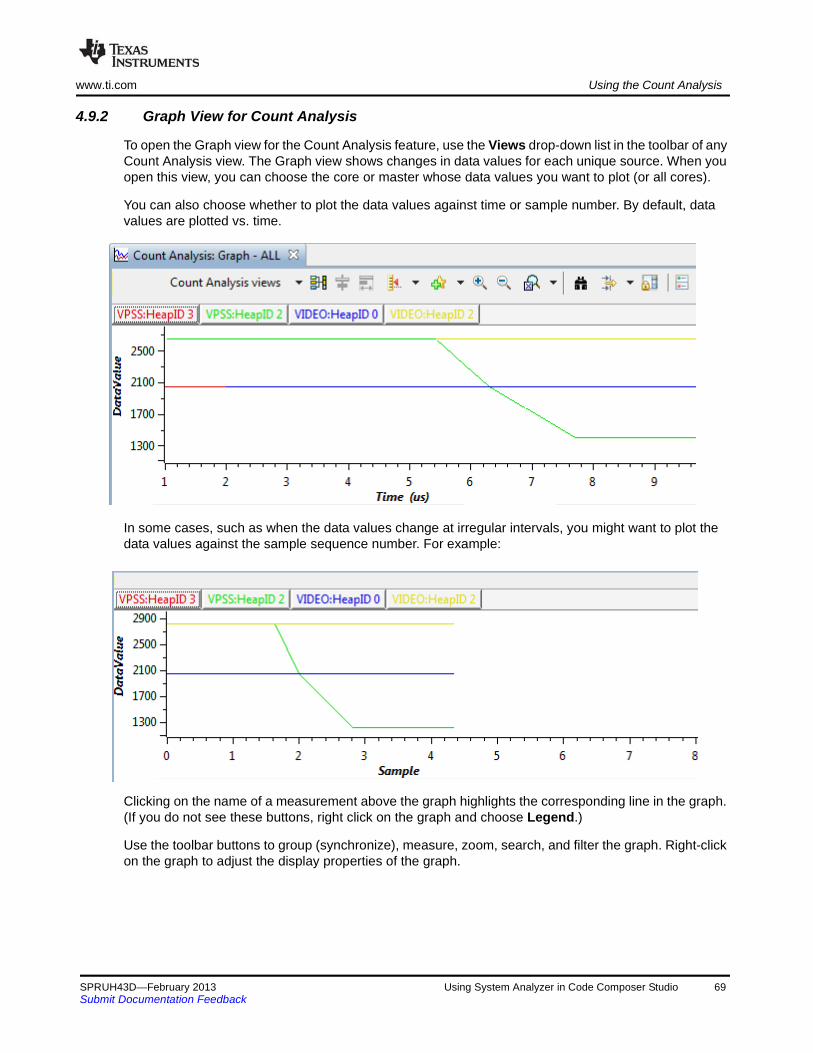
www.ti.com Using the Count Analysis
4.9.2 Graph View for Count Analysis
To open the Graph view for the Count Analysis feature, use the Views drop-down list in the toolbar of any Count Analysis view. The Graph view shows changes in data values for each unique source. When you open this view, you can choose the core or master whose data values you want to plot (or all cores).
You can also choose whether to plot the data values against time or sample number. By default, data values are plotted vs. time.
In some cases, such as when the data values change at irregular intervals, you might want to plot the data values against the sample sequence number. For example:
Clicking on the name of a measurement above the graph highlights the corresponding line in the graph. (If you do not see these buttons, right click on the graph and choose Legend.)
Use the toolbar buttons to group (synchronize), measure, zoom, search, and filter the graph. Right-click on the graph to adjust the display properties of the graph.
SPRUH43D—February 2013 Using System Analyzer in Code Composer Studio 69Submit Documentation Feedback
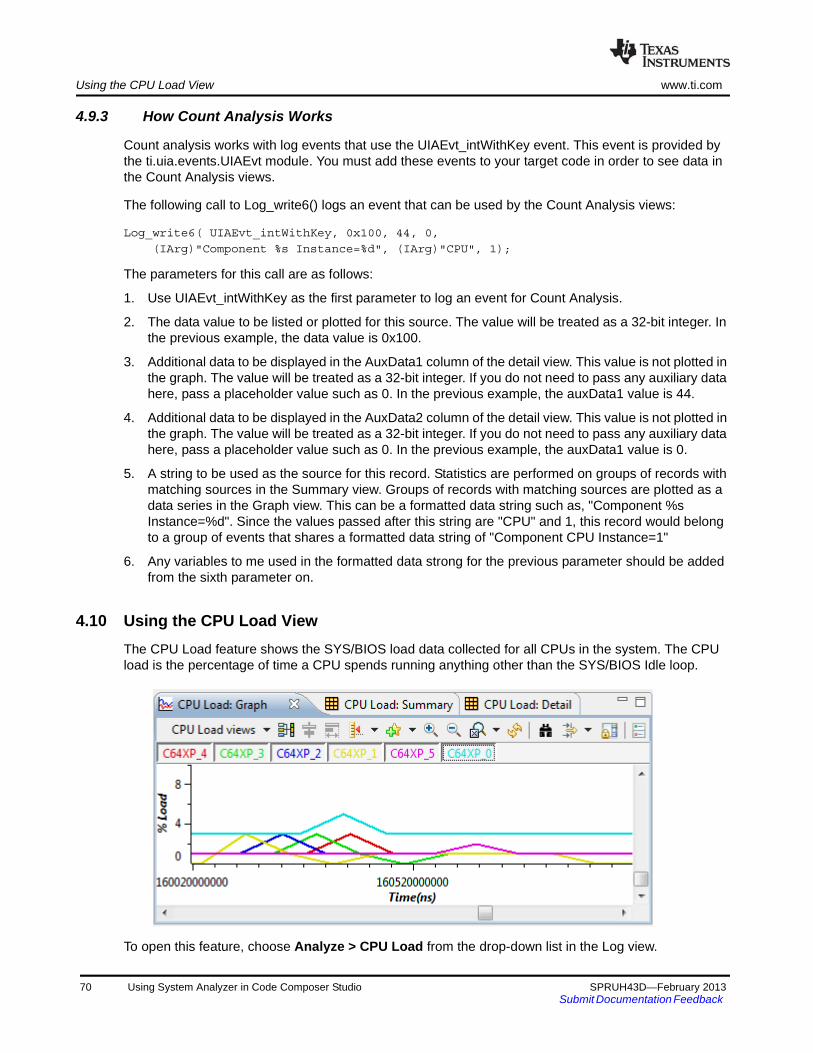
Using the CPU Load View www.ti.com
4.9.3 How Count Analysis Works
Count analysis works with log events that use the UIAEvt_intWithKey event. This event is provided by the ti.uia.events.UIAEvt module. You must add these events to your target code in order to see data in the Count Analysis views.
The following call to Log_write6() logs an event that can be used by the Count Analysis views:
Log_write6( UIAEvt_intWithKey, 0x100, 44, 0,
(IArg)"Component %s Instance=%d", (IArg)"CPU", 1);
The parameters for this call are as follows:
1. Use UIAEvt_intWithKey as the first parameter to log an event for Count Analysis.
2. The data value to be listed or plotted for this source. The value will be treated as a 32-bit integer. In the previous example, the data value is 0x100.
3. Additional data to be displayed in the AuxData1 column of the detail view. This value is not plotted in the graph. The value will be treated as a 32-bit integer. If you do not need to pass any auxiliary data here, pass a placeholder value such as 0. In the previous example, the auxData1 value is 44.
4. Additional data to be displayed in the AuxData2 column of the detail view. This value is not plotted in the graph. The value will be treated as a 32-bit integer. If you do not need to pass any auxiliary data here, pass a placeholder value such as 0. In the previous example, the auxData1 value is 0.
5. A string to be used as the source for this record. Statistics are performed on groups of records with matching sources in the Summary view. Groups of records with matching sources are plotted as a data series in the Graph view. This can be a formatted data string such as, "Component %s Instance=%d". Since the values passed after this string are "CPU" and 1, this record would belong to a group of events that shares a formatted data string of "Component CPU Instance=1"
6. Any variables to me used in the formatted data strong for the previous parameter should be added from the sixth parameter on.
4.10 Using the CPU Load View
The CPU Load feature shows the SYS/BIOS load data collected for all CPUs in the system. The CPU load is the percentage of time a CPU spends running anything other than the SYS/BIOS Idle loop.
To open this feature, choose Analyze > CPU Load from the drop-down list in the Log view.
70 Using System Analyzer in Code Composer Studio SPRUH43D—February 2013Submit Documentation Feedback

www.ti.com Using the CPU Load View
Graph View for CPU Load
The Graph view opens by default. It shows the change in CPU load (as a percentage) with time for each CPU. Clicking on the name of a CPU above the graph highlights the corresponding line in the graph. (If you do not see these buttons, right click on the graph and choose Legend.)
Use the toolbar buttons to group (synchronize), measure, zoom, search, and filter the graph. Right-click on the graph to adjust the display properties of the graph.
To open Summary or Detail views for this feature, use the Views drop-down list in the toolbar.
• The Summary view presents the minimum, maximum, and average CPU load. See Section 4.10.1.
• The Detail view presents the raw CPU load data. See Section 4.10.2.
See Also
• Section 3.2, Analyzing System Loading with System Analyzer
4.10.1 Summary View for CPU Load
To open the Summary view for the CPU Load feature, right-click on a CPU Load view and choose CPU Load views > Summary.
The Summary view for the CPU Load feature shows the count, minimum, maximum, and average of the reported CPU load measurements for each CPU.
• Master. The name of the CPU.
• Count. The number of CPU load measurements for this CPU.
• Min. The minimum CPU load percentage reported for this CPU.
• Max. The maximum CPU load percentage reported for this CPU.
• Average. The average CPU load percentage for this CPU.
SPRUH43D—February 2013 Using System Analyzer in Code Composer Studio 71Submit Documentation Feedback

Using the CPU Load View www.ti.com
4.10.2 Detail View for CPU Load
To open the Detail view for the CPU Load feature, use the Views drop-down list in the toolbar of another CPU Load view.
The Detail view of the CPU Load feature shows records that report the CPU load. The status bar tells how many records are shown and how many gaps occurred.
• Time. The time (correlated with other cores) of this load event.
• Master. The name of the core on which the load was logged.
• Load. The CPU load percentage reported.
• Source. The source of the load percentage event.
The columns in this view are also displayed in the Log view (but in a different order). See page 4–61 for column descriptions.
4.10.3 How CPU Load Works
The CPU load is the percentage of time a CPU spends running anything other than the SYS/BIOS Idle loop, which is run by the TSK_idle low-priority Task thread.
The CPU Load feature displays data provided automatically by internal SYS/BIOS calls to functions from the ti.sysbios.utils.Load module. SYS/BIOS threads are pre-instrumented to provide load data using a background thread.
See Section 5.2.1, Enabling and Disabling Load Logging for information about how to disable CPU load logging.
72 Using System Analyzer in Code Composer Studio SPRUH43D—February 2013Submit Documentation Feedback

www.ti.com Using the Printf Logs
4.11 Using the Printf Logs
The Printf Logs analysis feature shows messages output by the program through calls to the XDCtools Log_printf#() APIs.
To open the Task Profiler feature, choose Analyze > Printf Logs from the drop-down list in the Log view. The Summary view is the only view available.
By default, this view shows the Time, Master, Message, and Logger. You can right-click and choose Column Settings to enable additional columns.
• Time. The time (correlated with other cores) of this event.
• Master. The name of the core on which the message was logged.
• Message. A printf-style message that describes the logged event.
• Logger. The name of the logger to which the event was sent. UIA creates several default loggers, and your target code can configure additional loggers.
See page 4–63 for information about using the toolbar icons and right-click menu in the Summary view.
See Also
• Section 4.7, Using the Log View
SPRUH43D—February 2013 Using System Analyzer in Code Composer Studio 73Submit Documentation Feedback

Using the Task Load View www.ti.com
4.12 Using the Task Load View
The Task Load view shows CPU load data collected on a per-Task and per-thread type basis for the specified CPU. Note that the Task Load feature does not allow you to select all cores; you must select a single core.
To open this feature, choose Analyze > Task Load from the drop-down list in the Log view.
Graph View for Task Load
The Graph view opens by default; it shows the change in load over time on a per-Task basis as a line graph.
Click on the names of Tasks above the graph to highlight those lines in the graph. If you don’t see the Task names, right-click on the graph and choose Legend from the context menu. If you make the Graph view area wider, more Task names will be shown.
To open other views for the Task Load feature, use the Views drop-down list in the toolbar of any Task Load view.
• The Summary view presents the minimum, maximum, and average load on a per-Task basis. See Section 4.12.1.
• The Detail view presents the raw Task load data. See Section 4.12.2.
Clicking on the name of a thread above the graph highlights the corresponding line in the graph. (If you do not see these buttons, right click on the graph and choose Legend.)
Use the toolbar buttons to group (synchronize), measure, zoom, search, and filter the graph. Right-click on the graph to adjust the display properties of the graph.
See Also
• Section 3.2, Analyzing System Loading with System Analyzer
74 Using System Analyzer in Code Composer Studio SPRUH43D—February 2013Submit Documentation Feedback

www.ti.com Using the Task Load View
4.12.1 Summary View for Task Load
To open the Summary view for the Task Load feature, use the Views drop-down list in the toolbar of any Task Load view.
The Summary view for the Task Load feature shows the count, minimum, maximum, and average of the reported Task load measurements for each Task.
The CPU load is the percentage of time the CPU spent running anything other than the SYS/BIOS Idle loop. The averages for all the sources listed except for the CPU typically add up to approximately 100%. However, that total may be somewhat different if events were dropped, particularly when the load was high.
• Source. The name of the task or the thread type.
• Count. The number of CPU load measurements reported for this task or thread type.
• Min. The minimum CPU load reported for this task or thread type.
• Max. The maximum CPU load reported for this task or thread type.
• Average. The average CPU load for this task or thread type.
• Overall. The average CPU load for this task or thread type. The Overall average is different from the Average in cases where there are multiple instances of the same task running in parallel or when the application dynamically creates tasks and exits from them. In such cases, the Overall values will add up to a total load of 100%, but the Average values will not.
SPRUH43D—February 2013 Using System Analyzer in Code Composer Studio 75Submit Documentation Feedback
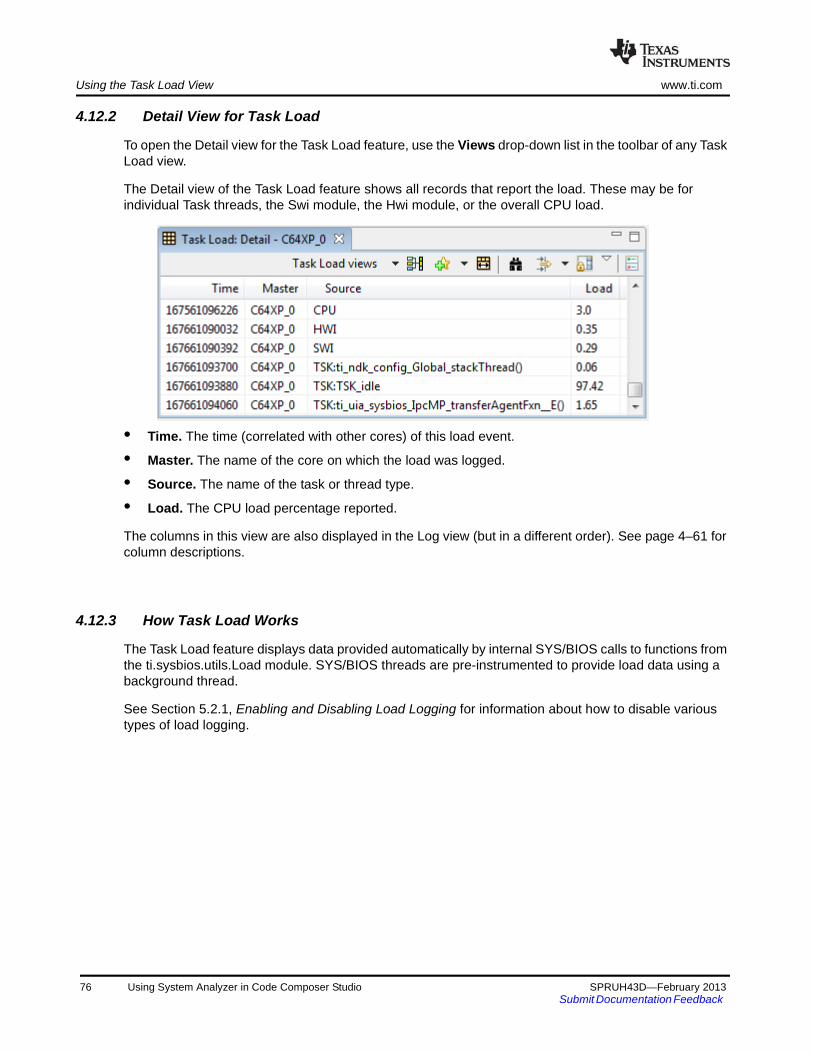
Using the Task Load View www.ti.com
4.12.2 Detail View for Task Load
To open the Detail view for the Task Load feature, use the Views drop-down list in the toolbar of any Task Load view.
The Detail view of the Task Load feature shows all records that report the load. These may be for individual Task threads, the Swi module, the Hwi module, or the overall CPU load.
• Time. The time (correlated with other cores) of this load event.
• Master. The name of the core on which the load was logged.
• Source. The name of the task or thread type.
• Load. The CPU load percentage reported.
The columns in this view are also displayed in the Log view (but in a different order). See page 4–61 for column descriptions.
4.12.3 How Task Load Works
The Task Load feature displays data provided automatically by internal SYS/BIOS calls to functions from the ti.sysbios.utils.Load module. SYS/BIOS threads are pre-instrumented to provide load data using a background thread.
See Section 5.2.1, Enabling and Disabling Load Logging for information about how to disable various types of load logging.
76 Using System Analyzer in Code Composer Studio SPRUH43D—February 2013Submit Documentation Feedback

www.ti.com Using Context Aware Profile
4.13 Using Context Aware Profile
The Context Aware Profile feature calculates duration while considering context switches, interruptions, and execution of other functions.
The Context Aware Profile displays data only if you modify your target code to include UIABenchmark events as described in Section 4.13.3. Your code needs to explicitly instrument all function entries and exits in order for context aware profiling to provide valid data. No emulation logic is used to do this automatically.
You can use this feature to see information about "inclusive time" vs. "exclusive time".
• Inclusive time is the entire time between a given pair of start times and stop times.
• Exclusive time is the inclusive time minus any time spent running any other thread context. Time spent in called functions and time spent running threads that preempt are yielded to by the thread being measured are not counted in exclusive time.
See Section 4.13.3 for details about how inclusive and exclusive time are calculated.
To open the Context Aware Profile, choose Analyze > Context Aware Profile from the drop-down list in the Log view.
Summary View for Context Aware Profile
By default, the Summary view opens, which shows the minimum, maximum, average, and total number of nanoseconds within each thread for the selected core. These statistics are reported both for inclusive and exclusive time.
The summary view shows statistics about each duration context that was measured. The statistics summarize multiple measurements made for each context. The columns in this view are as follows:
• Name. The name of the item for this row of statistics. The name has the following format:
<master>,<task name>,<function name>.<function id logged>
If the Task context or the function running cannot be determined, those portions of the name are listedas “Unknown” in the generated Name.
• Count. The number of start/stop pairs that measured this item’s duration.
• Incl Count Min. The minimum inclusive time measured.
• Incl Count Max. The maximum inclusive time measured.
• Incl Count Average. The average inclusive time measured.
• Incl Count Total. The total inclusive time measured.
SPRUH43D—February 2013 Using System Analyzer in Code Composer Studio 77Submit Documentation Feedback

Using Context Aware Profile www.ti.com
• Incl Count Percent. The percent of all the inclusive times reported due to this item.
• Excl Count Min. The minimum exclusive time measured.
• Excl Count Max. The maximum exclusive time that was measured.
• Excl Count Average. The average exclusive time measured.
• Excl Count Total. The total exclusive time measured.
• Excl Count Percent. The percent of all the exclusive times reported due to this item.
To open Detail or Graph views, use the Views drop-down list in the toolbar of any Context Aware Profile view.
• The Detail view presents the raw start and stop times for each start/stop pair measured. See Section 4.13.1.
• The Graph view shows the change in duration over time. See Section 4.13.2.
See Also
• Section 3.5, Benchmarking with System Analyzer
4.13.1 Detail View for Context Aware Profile
To open the Detail view for the Context Aware Profile feature, use the Views drop-down list in the toolbar of any Context Aware Profile view.
The detail view shows a record for each start/stop pair of durations recorded.
The columns in this view are as follows:
• Name. The name of the CPU combined with the function or thread that was measured.
• Depth. The number of levels deep for this function context. The top-level function has a depth of 0; functions called by the top-level have a depth of 1, and so on.
• Incl Count. The inclusive time for this measurement.
• Excl Count. The exclusive time for this measurement.
• Start Time. The time in nanoseconds when this measurement was started.
• End Time. The time in nanoseconds when this measurement was stopped.
78 Using System Analyzer in Code Composer Studio SPRUH43D—February 2013Submit Documentation Feedback

www.ti.com Using Context Aware Profile
4.13.2 Graph Views for Context Aware Profile
To open a Graph view for this feature, use the Views drop-down list in the toolbar of any Context Aware Profile view.
The Inclusive and Exclusive graph views for the Context Aware Profile show the change in duration for each context measured as a function of time. For example, you might use this to see if a thread takes longer to perform when the application has been running longer.
Clicking on the name of a measurement above the graph highlights the corresponding line in the graph. (If you do not see these buttons, right click on the graph and choose Legend.)
Use the toolbar buttons to group (synchronize), measure, zoom, search, and filter the graph. Right-click on the graph to adjust the display properties of the graph.
SPRUH43D—February 2013 Using System Analyzer in Code Composer Studio 79Submit Documentation Feedback

Using Context Aware Profile www.ti.com
4.13.3 How Context Aware Profiling Works
The Context Aware Profile feature matches pairs of start and stop events from the ti.uia.events.UIABenchmark module. These events occur only if you add code to your target application that calls Log_write3() and passes the UIABenchmark_startInstanceWithAdrs and UIABenchmark_stopInstanceWithAdrs events as parameters.
For example, the following code would produce a start/stop pair that would be used by the Context Aware Profile for the myFunc() function:
#include <xdc/runtime/Log.h>
#include <ti/uia/events/UIABenchmark.h>
void myFunc(){
Log_write3( UIABenchmark_startInstanceWithAdrs,
(IArg)"Func: id=%x, Fxn=%x", 0, (UArg)&myFunc);
...
Log_write3( UIABenchmark_stopInstanceWithAdrs,
(IArg)"Func: id=%x, Fxn=%x", 0, (UArg)&myFunc);
return;
};
To profile the entire time spent in the function, your code would use the UIABenchmark_startInstanceWithAdrs event at the beginning of the function and the UIABenchmark_stopInstanceWithAdrs event just prior to any line the could cause the function to return.
In the Log view the EventClass for these events is shown as "FUNC" because a function reference is passed with the event to identify the function that is being profiled.
The Log_write3() function comes from the XDCtools xdc.runtime.Log module. It is possible to use any of the Log_writeX() functions from Log_write3() to Log_write8(). If you use a Log_writeX() function with additional arguments, all other arguments are ignored by the Context Aware Profile feature. The parameters passed to Log_write3() are as follows:
• evt. An event (UIABenchmark_startInstanceWithAdrs or UIABenchmark_stopInstanceWithAdrs) of type Log_Event.
• arg0. A message string that must have the following format:"Func: id=%x, Fxn=%x"
• arg1. Could be used in the future to specify the instance of the function, but the Context Aware Profile currently expects a value of 0.
• arg2. A function reference to identify what this start/stop pair is profiling.
See Section 5.4.2, Enabling Event Output with the Diagnostics Mask for information about how to enable and disable logging of UIABenchmark events. See Section 5.4.3, Events Provided by UIA for more about UIABenchmark events.
The Context Aware Profile also uses context switching information about Task, Swi, and Hwi threads to calculate the inclusive and exclusive time between a start/stop pair. The following table shows whether various types of contexts are included in inclusive and exclusive time. Since the Duration views (page 4–82) are not context-aware, time spent in any context is included in those views.
80 Using System Analyzer in Code Composer Studio SPRUH43D—February 2013Submit Documentation Feedback

www.ti.com Using Context Aware Profile
Table 4–3. Inclusive vs. Exclusive Time
The Context Aware Profile feature handles missing Start or Stop events by ignoring events as needed.
• If a Start event is followed by another Start event for the same source, the second Start event is ignored and the first Start event is used.
• If a Stop event is followed by another Stop event for the same source, the second Stop event is ignored.
• If a Stop event occurs without a matching Start event for the same source, the Stop event is ignored.
Check the Error column in the Log view for a value that indicates a data loss occurred. See page 4–61 for details.
4.13.4 Profiling Functions Using Enter and Exit Hook Functions
In order to do inclusive and exclusive profiling of functions (using Context Aware Profiling), a UIA log event needs to occur at the entry and exit point of functions. You can add entry and exit hook functions to every function in the source by doing the following:
1. Use the following compiler options when compiling the source:
--entry_hook=functionEntryHook
--entry_parm=address
--exit_hook=functionExitHook
--exit_parm=address
2. To use the required UIA APIs, add this #include statement to your code:
#include <ti/uia/events/UIABenchmark.h>
Context or Function Type
Counted for Inclusive Time
Counted for Exclusive Time
Counted for Duration
Time spent in the specified function’s context. Yes Yes Yes
Time spent in functions called from the specified context. For example, you might want to benchmark function A(), which calls functions B() and C().
Yes No Yes
Time spent in other Task functions as a result of preemption, yielding, and pend/post actions.
Yes No Yes
Time spent in Hwi or Swi thread contexts. No No Yes
SPRUH43D—February 2013 Using System Analyzer in Code Composer Studio 81Submit Documentation Feedback

Using the Duration Feature www.ti.com
3. Add entry and exit hook functions such as the following to your source code.
void functionEntryHook( void (*addr)() ){
Log_write3(UIABenchmark_startInstanceWithAdrs,
(IArg)"context=0x%x, fnAdrs=0x%x:", (IArg)0, (IArg)addr);
}
void functionExitHook( void (*addr)() ){
Log_write3(UIABenchmark_stopInstanceWithAdrs,
(IArg)"context=0x%x, fnAdrs=0x%x:", (IArg)0, (IArg)addr);
}
The parameter after the message string is a context parameter that can be used to specify anadditional level of qualification. For this example, we can just set it to 0.
If Task Aware Profiling is needed, the Task context has to be logged. SYS/BIOS automatically logs events for task switches and Swi and Hwi Start and Stop events. See Section 5.2.2, Enabling and Disabling Event Logging. Context changes can also be explicitly logged by the application. For more on profiling using System Analyzer, see Section 3.5, Benchmarking with System Analyzer.
Note that hook functions are not called from functions in libraries that are linked with your application. As a result, the Exclusive counts of functions that make calls to functions in the library will include the duration of library functions.
4.14 Using the Duration Feature
The Duration analysis feature provides information about the time between two points of execution on the target. These points must be instrumented by adding code that passes the UIABenchmark_start and UIABenchmark_stop events to calls to the Log_write1() function.
The Duration feature displays data only if you modify your target code to include UIABenchmark events as described in Section 4.14.3.
The Duration feature matches start and stop pairs for each "source". A source is identified by combining the core name and the arg1 argument passed to the Log_write1() function when the event argument is UIABenchmark_start or UIABenchmark_stop. For example, if the target program on CPU_5 makes the following calls, the source identifier will be "CPU_5, running".
Log_write1(UIABenchmark_start, (xdc_IArg)"running");
...
Log_write1(UIABenchmark_stop, (xdc_IArg)"running");
To open the Duration feature, choose Analyze > Duration from the drop-down list in the Log view.
82 Using System Analyzer in Code Composer Studio SPRUH43D—February 2013Submit Documentation Feedback

www.ti.com Using the Duration Feature
Summary View for Duration Analysis
By default, the Summary view is shown when you open the Duration feature. This view shows the count, minimum, maximum, average, and total time measured between the start and stop times.
This view provides only one record for each unique source. The columns shown are as follows:
• Source. This column shows the identifier that the Duration feature uses to match up Start/Stop pairs.
• Count. The number of start/stop pairs that occurred for this source.
• Min. The minimum time in nanoseconds between start and stop for this source.
• Max. The maximum time in nanoseconds between start and stop for this source.
• Average. The average time in nanoseconds between start and stop for this source.
• Total. The total time in nanoseconds between all start/stop pairs for this source.
• Percent. The percent of the total time for all sources measured that was spent in this source.
See page 4–63 for information about using the toolbar icons and right-click menu in the Summary view.
To open Detail or Graph views for the Duration feature, use the Views drop-down list in the toolbar of any Duration view.
• The Detail view presents the raw start and stop times for each start/stop pair that has occurred. See Section 4.14.1.
• The Graph view shows the change in duration over time. See Section 4.14.2.
See Also
• Section 3.5, Benchmarking with System Analyzer
SPRUH43D—February 2013 Using System Analyzer in Code Composer Studio 83Submit Documentation Feedback

Using the Duration Feature www.ti.com
4.14.1 Detail View for Duration Analysis
To open the Detail view for the Duration feature, use the Views drop-down list in the toolbar of any Duration view.
Each record in the Detail view corresponds to a pair of UIABenchmark_start or UIABenchmark_stop events passed to the Log_write1() function.
There are likely to be multiple records in this view for the same source if the start/stop pairs are in threads that execute multiple times.
• Source. This column shows the identifier that the Duration feature uses to match up Start/Stop pairs. See Section 4.14 for details.
• Start. A timestamp for when the UIABenchmark_start event occurred.
• Stop. A timestamp for when the UIABenchmark_stop event occurred.
• Duration. The Stop - Start time.
See page 4–63 for information about using the toolbar icons and right-click menu in the Detail view.
84 Using System Analyzer in Code Composer Studio SPRUH43D—February 2013Submit Documentation Feedback
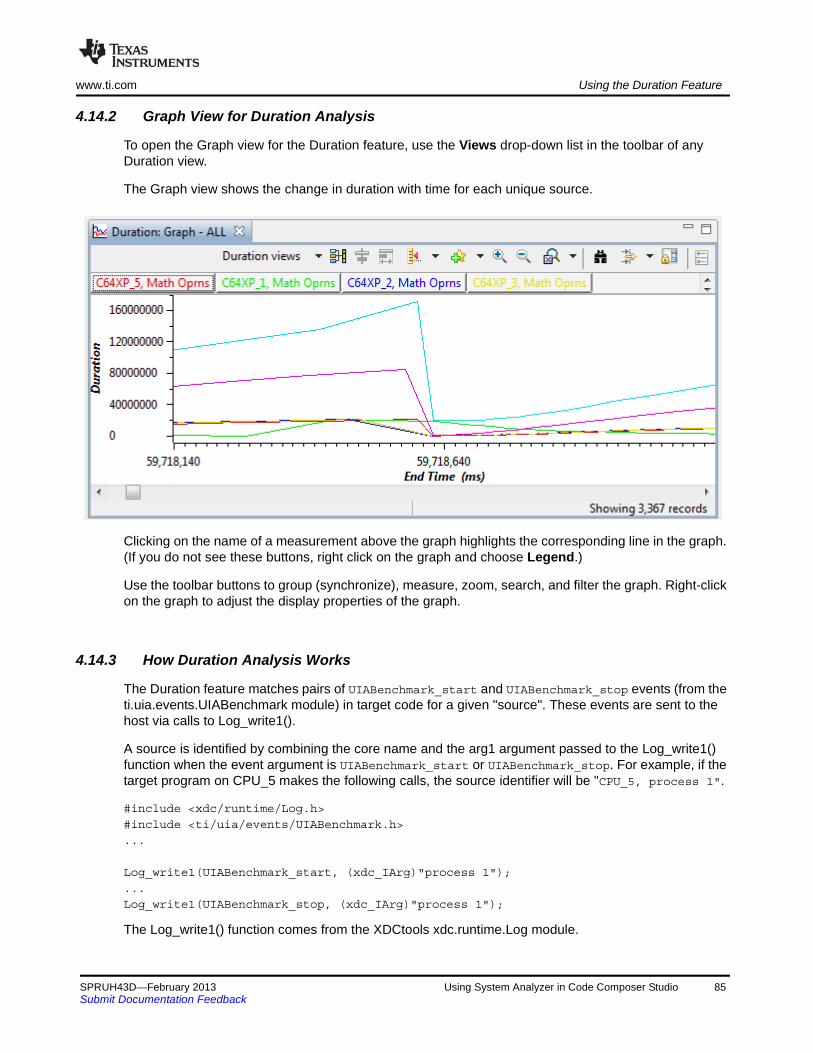
www.ti.com Using the Duration Feature
4.14.2 Graph View for Duration Analysis
To open the Graph view for the Duration feature, use the Views drop-down list in the toolbar of any Duration view.
The Graph view shows the change in duration with time for each unique source.
Clicking on the name of a measurement above the graph highlights the corresponding line in the graph. (If you do not see these buttons, right click on the graph and choose Legend.)
Use the toolbar buttons to group (synchronize), measure, zoom, search, and filter the graph. Right-click on the graph to adjust the display properties of the graph.
4.14.3 How Duration Analysis Works
The Duration feature matches pairs of UIABenchmark_start and UIABenchmark_stop events (from the ti.uia.events.UIABenchmark module) in target code for a given "source". These events are sent to the host via calls to Log_write1().
A source is identified by combining the core name and the arg1 argument passed to the Log_write1() function when the event argument is UIABenchmark_start or UIABenchmark_stop. For example, if the target program on CPU_5 makes the following calls, the source identifier will be "CPU_5, process 1".
#include <xdc/runtime/Log.h>
#include <ti/uia/events/UIABenchmark.h>
...
Log_write1(UIABenchmark_start, (xdc_IArg)"process 1");
...
Log_write1(UIABenchmark_stop, (xdc_IArg)"process 1");
The Log_write1() function comes from the XDCtools xdc.runtime.Log module.
SPRUH43D—February 2013 Using System Analyzer in Code Composer Studio 85Submit Documentation Feedback
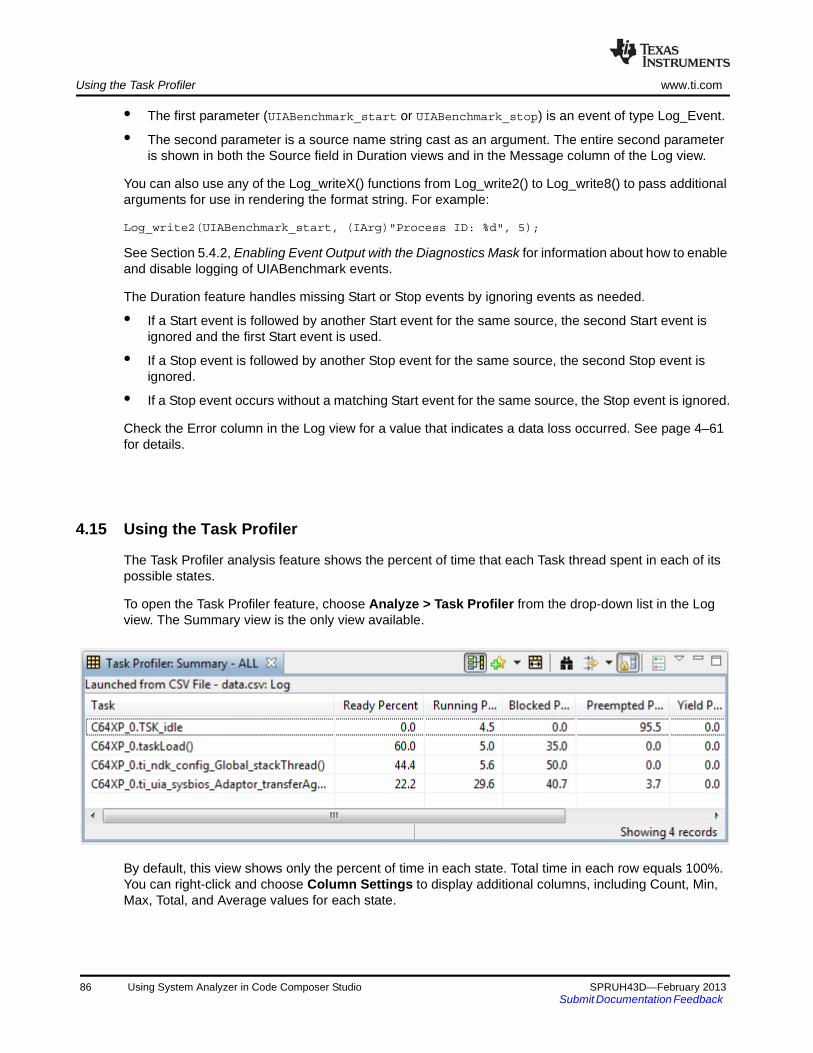
Using the Task Profiler www.ti.com
• The first parameter (UIABenchmark_start or UIABenchmark_stop) is an event of type Log_Event.
• The second parameter is a source name string cast as an argument. The entire second parameter is shown in both the Source field in Duration views and in the Message column of the Log view.
You can also use any of the Log_writeX() functions from Log_write2() to Log_write8() to pass additional arguments for use in rendering the format string. For example:
Log_write2(UIABenchmark_start, (IArg)"Process ID: %d", 5);
See Section 5.4.2, Enabling Event Output with the Diagnostics Mask for information about how to enable and disable logging of UIABenchmark events.
The Duration feature handles missing Start or Stop events by ignoring events as needed.
• If a Start event is followed by another Start event for the same source, the second Start event is ignored and the first Start event is used.
• If a Stop event is followed by another Stop event for the same source, the second Stop event is ignored.
• If a Stop event occurs without a matching Start event for the same source, the Stop event is ignored.
Check the Error column in the Log view for a value that indicates a data loss occurred. See page 4–61 for details.
4.15 Using the Task Profiler
The Task Profiler analysis feature shows the percent of time that each Task thread spent in each of its possible states.
To open the Task Profiler feature, choose Analyze > Task Profiler from the drop-down list in the Log view. The Summary view is the only view available.
By default, this view shows only the percent of time in each state. Total time in each row equals 100%. You can right-click and choose Column Settings to display additional columns, including Count, Min, Max, Total, and Average values for each state.
86 Using System Analyzer in Code Composer Studio SPRUH43D—February 2013Submit Documentation Feedback
www.ti.com Using the Task Profiler
The Task states are as follows:
• Ready. The Task was scheduled for execution subject to processor availability during this time.
• Running. The Task was the one running on the processor during this time.
• Blocked. The Task could not execute during this time because it was waiting for a resource to become available (by posting a Semaphore, for example).
• Preempted. The Task could not execute during this time because it was preempted by a higher-priority thread.
• Yield. The Task was not running during this time because it called Task_yield() to allow other Tasks of the same priority to run. The time spent in this state is typically small because once a Task calls Task_yield() it is placed in the Ready state. The Yield Count column may be more useful to you than the Yield Percent.
• Sleep. The Task was not running during this time because it called Task_sleep() to allow lower-priority Tasks to run. The time spent in this state is typically small because once a Task calls Task_sleep() it is placed in the Blocked state. The Sleep Count column may be more useful to you than the Sleep Percent.
• Unknown. The Task was not running during this time. The specific reason is not known. For example, this may be the Task state at program startup or after data loss occurred.
See page 4–63 for information about using the toolbar icons and right-click menu in the Summary view.
See Also
• Section 3.3, Analyzing the Execution Sequence with System Analyzer
SPRUH43D—February 2013 Using System Analyzer in Code Composer Studio 87Submit Documentation Feedback

Using the Execution Graph www.ti.com
4.16 Using the Execution Graph
The Execution Graph shows which thread is running at a given time. To open this feature, choose Analyze > Execution Graph from the drop-down list in the Log view.
Thread categories are listed in the left column. Click on a category to show more details. The details depend on the type of thread.
• Semaphores and Events. Pend and post events are identified by flag icons. If any data loss events were detected, the icon shows that event.
• Hwi threads. For hardware interrupt threads, brackets [ ] show when the Hwi started and stopped running. If any data loss events were detected, the icon shows that event.
• Swi threads. The icon shows when a Swi was posted. Brackets [ ] show when a Swi started and stopped running. For any data loss events, a separate row in the details shows that event.
• OS. When you expand an OS row, you see a list of threads on that core. A colored line for each item shows when that context was in control. Activity by Hwi, Swi, and Task threads is shown, along with activity by the SYS/BIOS scheduler, unknown activity, and data loss events.
88 Using System Analyzer in Code Composer Studio SPRUH43D—February 2013Submit Documentation Feedback
www.ti.com Using the Execution Graph
• Other threads. Other functions are listed after the OS item.
Data loss is shown as a dashed line in the expanded OS graph. The Hwi, Swi, Semaphore, and Event rows show only the time when the data loss was detected, not the extent of the data loss until further data was received.
Click the Tree Mode icon to display categories in a tree that lets you hide or display each core. The # and * signs in the category names are used to control the sort order of the categories.
Use the toolbar buttons to group (synchronize), measure, zoom, search, and filter the graph. You will likely need to zoom in a significant amount to see the execution transitions that interest you.
Right-click on the graph and choose Display Properties to customize the graph. For example, you can hide categories.
See Also
• Section 3.3, Analyzing the Execution Sequence with System Analyzer
4.16.1 How the Execution Graph Works
The Execution Graph uses the same events as the Duration feature and the Context Aware Profile. The Execution Graph displays data about Task, Swi, and Hwi threads provided automatically by internal SYS/BIOS calls. SYS/BIOS threads are pre-instrumented to provide such data via a background thread.
Hwi and Swi can be expanded to list their threads separately only if you enable logging of events for the Hwi and Swi modules. Such logging is turned off by default for performance reasons. See Section 5.2.2, Enabling and Disabling Event Logging for how to turn on and off Hwi and Swi event logging.
If a data loss is detected, it is shown in the appropriate thread categories and at the bottom of the graph. Data loss errors are detected if SeqNo values in the logged events are missing.
If data is returned to the host out of sequence, this graph may have unpredictable behavior for state transitions beyond the visible range of the graph.
See Also
To learn how to log additional events for display in the Execution Graph, see these sections:
• Section 4.14.3, How Duration Analysis Works
• Section 4.13.3, How Context Aware Profiling Works
• Section 4.13.4, Profiling Functions Using Enter and Exit Hook Functions
SPRUH43D—February 2013 Using System Analyzer in Code Composer Studio 89Submit Documentation Feedback

Using System Analyzer with Non-UIA Applications www.ti.com
4.17 Using System Analyzer with Non-UIA Applications
If your application does not have UIA enabled, but does use SYS/BIOS 6.x or DSP/BIOS 5.x, you can use the Tools > RTOS Analyzer > RTA (Legacy) menu to launch the Real-Time Analysis (RTA) tools. The tools supported by your version SYS/BIOS or DSP/BIOS can be selected from this submenu. For example, these are the tools supported for SYS/BIOS 6.x:
The RTA tools are described in the "Instrumentation" chapter of the SYS/BIOS User’s Guide (SPRUEX3) and the DSP/BIOS User’s Guide (SPRU423).
90 Using System Analyzer in Code Composer Studio SPRUH43D—February 2013Submit Documentation Feedback

Chapter 5
UIA Configuration and Coding on the Target
This chapter describes how to configure and code target applications using UIA modules.
5.1 Quickly Enabling UIA Instrumentation . . . . . . . . . . . . . . . . . . . . . . . . 92
5.2 Configuring SYS/BIOS Logging. . . . . . . . . . . . . . . . . . . . . . . . . . . . . . 95
5.3 Customizing the Configuration of UIA Modules. . . . . . . . . . . . . . . . . 98
5.4 Target-Side Coding with UIA APIs . . . . . . . . . . . . . . . . . . . . . . . . . . . 118
Topic Page
SPRUH43D—February 2013 UIA Configuration and Coding on the Target 91Submit Documentation Feedback

Quickly Enabling UIA Instrumentation www.ti.com
5.1 Quickly Enabling UIA Instrumentation
You can begin analyzing data provided by UIA by enabling data collection from pre-instrumented SYS/BIOS threads. Later, you can add target-side code to collect additional data specific to your application.
Once you perform the necessary configuration, you will be able to view UIA data in the Log view, CPU Load, Task Load, and Execution Graph features. Only the Context Aware Profile and Duration features display no data unless you modify your target code by adding benchmarking calls as described in Section 4.14.3, How Duration Analysis Works and Section 4.13.3, How Context Aware Profiling Works.
In order to enable data collection from pre-instrumented SYS/BIOS threads and have that data transferred from the target(s) to the host PC running CCS, you must do the following:
Configuration Steps to Perform on All Targets
1. Remove Legacy Modules. Remove any statements in your application’s configuration file (*.cfg) that include and configure the following modules:
— ti.sysbios.rta.Agent
— xdc.runtime.LoggerBuf
— ti.rtdx.RtdxModule
— ti.rtdx.driver.RtdxDvr
If you have logger instances for the xdc.runtime.LoggerBuf, delete those instances.
2. Use the LoggingSetup Module. Add the following statement to include UIA’s LoggingSetup module in your application’s configuration. For example:
var LoggingSetup =
xdc.useModule('ti.uia.sysbios.LoggingSetup');
Including the LoggingSetup module creates logger instances needed by UIA and assigns thoseloggers to the modules that need them in order to provide UIA data.
3. If you intend to use some method other than JTAG stop-mode to upload events to the host, set the LoggingSetup.eventUploadMode parameter as described in Configuring the Event Upload Mode, page 5-99. For example, you can use a non-JTAG transport such as Ethernet or File, or a JTAG-dependent transport such as simulator or JTAG run-mode. For example:
LoggingSetup.eventUploadMode = LoggingSetup.UploadMode_NONJTAGTRANSPORT;
4. Configure Physical Communication (such as NDK). You must also configure physical communication between the cores. The application is responsible for configuring and starting the physical communication. For example, this communication may use the NDK. See the target-specific examples provided with UIA (and NDK) for sample code.
Configuration Steps to Perform on Multicore Targets Only
1. Configure the Topology. If your multicore application routes data through a single master core, edit your application’s configuration file to include UIA’s ServiceMgr module and configure MULTICORE as the topology, and identify the master core using the ServiceMgr.masterProcId parameter. For example:
var ServiceMgr =
xdc.useModule('ti.uia.runtime.ServiceMgr');
ServiceMgr.topology = ServiceMgr.Topology_MULTICORE;
ServiceMgr.masterProcId = 3;
92 UIA Configuration and Coding on the Target SPRUH43D—February 2013Submit Documentation Feedback

www.ti.com Quickly Enabling UIA Instrumentation
The EVMTI816x routes to the ARM, which runs Linux. The EVM6472 routes to the master core. Ingeneral, if only one core can access the peripherals, use the MULTICORE topology.
If each core in your multicore application sends data directly to CCS on the host, configure thetopology as Topology_SINGLECORE (which is the default).
See Section 5.3.3 for more information about configuring the topology.
2. Configure IPC. You must also configure and initialize IPC and any other components needed to enable communication between the cores. For example, you might also need to set up the NDK. See the target-specific examples provided with UIA (and IPC) for sample code. UIA may not be the only user of these resources, so it is left to the application to configure and initialize them.
3. Configure GlobalTimestampProxy and CpuTimestampProxy. You must configure the GlobalTimestampProxy parameter in the LogSync module as described in Section 5.3.7. If the frequency of your local CPU will change at run-time, you must also configure the CpuTimestampProxy parameter.
5.1.1 Using XGCONF to Enable UIA Instrumentation
Instead of editing configuration scripts directly, you can use the XGCONF tool within CCS to visually edit an application’s configuration. XGCONF shows the RTSC modules—including XDCtools, SYS/BIOS, IPC, and UIA—that are available for configuration.
XGCONF lets you add the use of modules to your application, create instances, and set parameter values. It performs error checking as you work, and so can save you time by preventing you from making configuration errors that would otherwise not be detected until you built the application.
For example, to add UIA instrumentation to a SYS/BIOS application that uses the legacy ti.sysbios.rta.Agent and xdc.runtime.LoggerBuf modules, follow these steps:
1. In CCS, right-click on the project and choose Show Build Settings.
2. In the Properties dialog, choose the CCS Build category, then the RTSC tab.
3. In the Products and Repositories area, check the box next to UIA and select the most recent version. This causes you application to link with the necessary parts of UIA and makes the UIA modules available within XGCONF.
4. Click OK.
5. Open the project’s configuration file (*.cfg) with XGCONF in CCS. Notice that UIA is now listed in the Available Packages list under Other Repositories. You can expand the UIA package to look at the modules that are available.
SPRUH43D—February 2013 UIA Configuration and Coding on the Target 93Submit Documentation Feedback
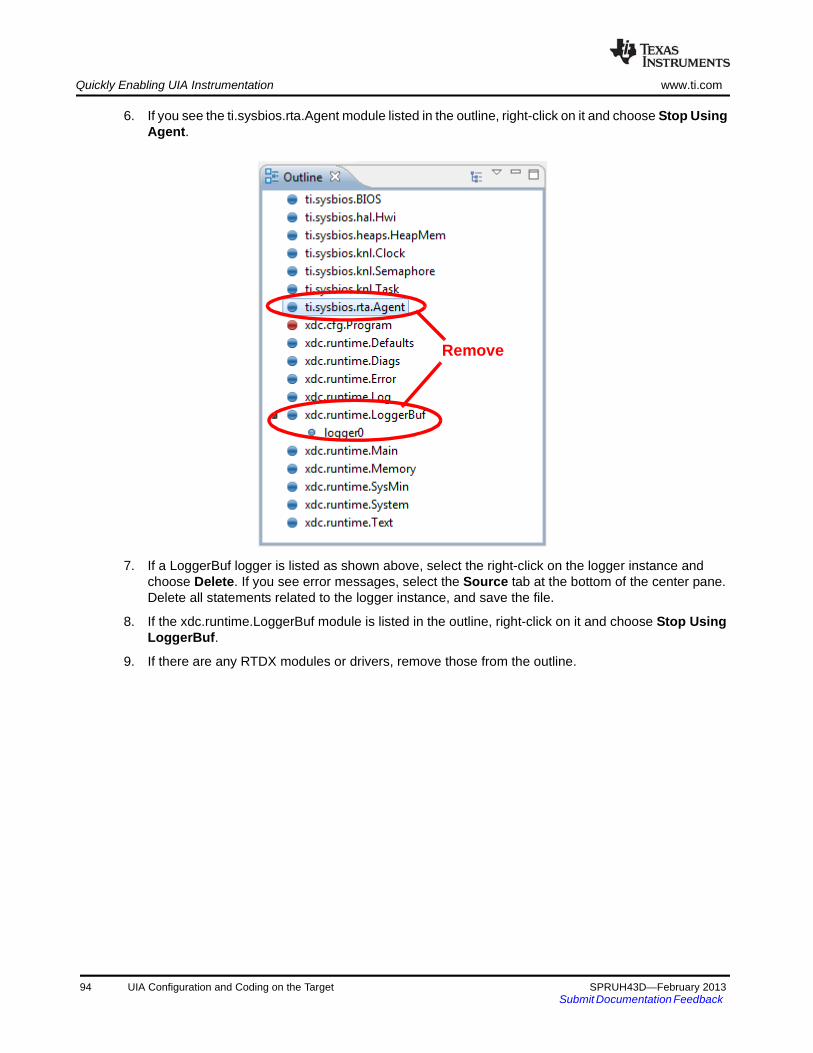
Quickly Enabling UIA Instrumentation www.ti.com
6. If you see the ti.sysbios.rta.Agent module listed in the outline, right-click on it and choose Stop Using Agent.
7. If a LoggerBuf logger is listed as shown above, select the right-click on the logger instance and choose Delete. If you see error messages, select the Source tab at the bottom of the center pane. Delete all statements related to the logger instance, and save the file.
8. If the xdc.runtime.LoggerBuf module is listed in the outline, right-click on it and choose Stop Using LoggerBuf.
9. If there are any RTDX modules or drivers, remove those from the outline.
Remove
94 UIA Configuration and Coding on the Target SPRUH43D—February 2013Submit Documentation Feedback

www.ti.com Configuring SYS/BIOS Logging
10. Expand the UIA package to find the ti.uia.sysbios.LoggingSetup module and drag it to the Outline.
11. Select the LoggingSetup module in the Outline. Notice that the properties for this module are shown in the center pane. If you see the configuration script instead, click the Properties tab at the bottom of this area.
12. Set a property. For example, you can enable event logging for individual Swi threads by setting sysbiosSwiLogging to false.
13. Set other properties and add other modules as needed.
14. Press Ctrl+S to save your configuration file.
5.2 Configuring SYS/BIOS Logging
You can configure the types of SYS/BIOS events that are logged and sent to System Analyzer.
• Load logging is enabled by default for CPU, Task, Swi, and Hwi threads. As a result, information about loads for those items is available in the CPU Load and Task Load features.
• Event logging used to display the Execution Graph is enabled by default only for Task threads. You can enable it for Swi and Hwi threads by configuring the LoggingSetup module.
See Section 5.4.2 for information about configuring other types of logging messages.
5.2.1 Enabling and Disabling Load Logging
By default, all types of SYS/BIOS load logging are enabled as a result of adding the LoggingSetup module to the configuration.
If you want to disable CPU Load logging, you would include the following statement in your target application’s configuration file. However, note that disabling CPU load logging also disables all other load logging.
LoggingSetup.loadLogging = false;
To disable Task, Swi, or Hwi load logging, you can use the corresponding statement from the following list:
var Load = xdc.useModule('ti.sysbios.utils.Load');
Load.taskEnabled = false;
Load.swiEnabled = false;
Load.hwiEnabled = false;
Another way to disable load logging is to modify the setting of the Load.common$.diags_USER4 mask, which controls whether load logging is output. For example, the following statements disable all load logging:
var Load = xdc.useModule('ti.sysbios.utils.Load');
var Diags = xdc.useModule('xdc.runtime.Diags');
Load.common$.diags_USER4 = Diags.ALWAYS_OFF;
The Load.common$.diags_USER4 mask is set to Diags.RUNTIME_ON by the LoggingSetup module unless you have explicitly set it to some other value.
SPRUH43D—February 2013 UIA Configuration and Coding on the Target 95Submit Documentation Feedback
Configuring SYS/BIOS Logging www.ti.com
5.2.2 Enabling and Disabling Event Logging
By default, the event logging used to display the Execution Graph is enabled by default only for SYS/BIOS Task threads. As a result, the Execution Graph can be expanded to show individual Task threads, but shows all Swi thread execution as one row, and all Hwi thread execution in another row without showing Swi and Hwi thread names.
Enabling Logging
You can enable event logging for SYS/BIOS Swi and Hwi threads by configuring the LoggingSetup module as follows:
LoggingSetup.sysbiosSwiLogging = true;
LoggingSetup.sysbiosHwiLogging = true;
Enabling event logging for Swi and Hwi allows you to see the execution status of individual Swi and Hwi threads. Application performance may be impacted if you enable such logging for applications with Swi or Hwi functions that run frequently. In addition, logging many frequent events increases the chance of dropped events.
For Task threads, the events logged are ready, block, switch, yield, sleep, set priority, and exit events. For Swi threads, the events logged are post, begin, and end events. For Hwi threads, the events logged are begin and end events.
The following configuration statements enable logging of all function entry and exit events by your application. This is because your main() function and other user-defined functions (that is, for example, all non-XDCtools, non-SYS/BIOS, non-IPC, and non-UIA modules) inherit their default Diags configuration from the Main module’s Diags configuration.
Main.common$.diags_ENTRY = Diags.ALWAYS_ON;
Main.common$.diags_EXIT = Diags.ALWAYS_ON;
Disabling Logging
To disable Task, Swi, Hwi, or Main event logging, you can use the appropriate statement from the following list:
LoggingSetup.sysbiosTaskLogging = false;
LoggingSetup.sysbiosSwiLogging = false;
LoggingSetup.sysbiosHwiLogging = false;
LoggingSetup.mainLogging = false;
96 UIA Configuration and Coding on the Target SPRUH43D—February 2013Submit Documentation Feedback

www.ti.com Configuring SYS/BIOS Logging
Another way to disable event logging is to modify the setting of the common$.diags_USER1 and common$.diags_USER2 masks for the appropriate module. This controls whether event logging is output. For example, the following statements disable all event logging:
var Task = xdc.useModule('ti.sysbios.knl.Task');
Task.common$.diags_USER1 = Diags.ALWAYS_OFF;
Task.common$.diags_USER2 = Diags.ALWAYS_OFF;
var Swi = xdc.useModule('ti.sysbios.knl.Swi');
Swi.common$.diags_USER1 = Diags.ALWAYS_OFF;
Swi.common$.diags_USER2 = Diags.ALWAYS_OFF;
var Hwi = xdc.useModule('ti.sysbios.hal.Hwi');
Hwi.common$.diags_USER1 = Diags.ALWAYS_OFF;
Hwi.common$.diags_USER2 = Diags.ALWAYS_OFF;
Main.common$.diags_USER1 = Diags.ALWAYS_OFF;
Main.common$.diags_USER2 = Diags.ALWAYS_OFF;
5.2.3 More About Diags Masks
Since logging is not always desired because of the potential impact on the system performance, you can use the xdc.runtime.Diags module to enable/disable logging both statically and dynamically on a global or per module basis.
By default the ti.uia.sysbios.LoggingSetup module sets the following diagnostics masks to Diags.RUNTIME_ON:
• diags_USER1 and diags_USER2: Main, Task, Semaphore, and Event modules. These masks control event logging.
• diags_USER4: Main and Load modules. This mask controls load logging.
• diags_USER3, diags_USER5, and diags_USER6: Main module.
• diags_STATUS: Main module. This mask controls the output of some events provided in the ti.uia.events package.
• diags_ANALYSIS: Main module. This mask controls the output of some events provided in the ti.uia.events package.
• diags_INFO: Main module. This mask controls the output of some events provided in the ti.uia.events package.
For Swi and Hwi event logging, the diags_USER1 and diags_USER2 masks are set to Diags.RUNTIME_ON only if you have set LoggingSetup.sysbiosSwiLogging or LoggingSetup.sysbiosHwiLogging to true. By default, these are off.
This leaves other masks that are rarely or never used by UIA—diags_ENTRY, diags_EXIT, diags_LIFECYCLE, diags_INTERNAL, diags_ASSERT, diags_USER7, and diags_USER8—at their default values.
The XDCscript portion of the CDOC online reference contains details about which diagnostics masks must be enabled for particular events to be logged.
Note: You should be careful about setting any Defaults.common$ parameters. Such parameter settings are inherited by all modules for which the parameter is not explicitly set. This includes all XDCtools, SYS/BIOS, IPC, and UIA modules.
SPRUH43D—February 2013 UIA Configuration and Coding on the Target 97Submit Documentation Feedback
Customizing the Configuration of UIA Modules www.ti.com
5.2.4 Setting Diags Masks at Run-time
Run-time checking is performed when a diagnostics mask is set to RUNTIME_ON. To improve performance by removing run-time checking, you may want to change the configuration to use Diags.ALWAYS_ON or Diags.ALWAYS_OFF.
If you configure a diagnostics mask to be set to Diags.RUNTIME_ON or Diags.RUNTIME_OFF, your C code can change the setting at run-time by calling the Diags_setMask() function. For example:
// turn on USER1 & USER2 events in the Swi module
Diags_setMask("ti.sysbios.knl.Swi+1");
Diags_setMask("ti.sysbios.knl.Swi+2");
...
// turn off USER4 (load) events in the Swi module
Diags_setMask("ti.sysbios.knl.Swi-4");
For information about the tradeoffs between Diags.ALWAYS_ON and Diags.RUNTIME_ON, see Section 7.5.2 and its subsections in the SYS/BIOS User’s Guide (SPRUEX3). Ignore any mention of the ti.sysbios.rta.Agent module and RTDX; these are replaced by the modules provided with UIA.
See Section 5.4.2 for more about run-time diagnostics configuration.
5.3 Customizing the Configuration of UIA Modules
You can further customize the behavior of UIA modules as described in the subsections that follow:
• Section 5.3.1, Configuring ti.uia.sysbios.LoggingSetup
• Section 5.3.2, Configuring ti.uia.services.Rta
• Section 5.3.3, Configuring ti.uia.runtime.ServiceMgr
• Section 5.3.4, Configuring ti.uia.runtime.LoggerCircBuf
• Section 5.3.5, Configuring ti.uia.runtime.LoggerSM
• Section 5.3.6, Configuring ti.uia.sysbios.LoggerIdle
• Section 5.3.7, Configuring ti.uia.runtime.LogSync
You can further control UIA behavior through the following:
• Section 5.3.8, Configuring IPC
5.3.1 Configuring ti.uia.sysbios.LoggingSetup
In order to enable UIA instrumentation, your application’s configuration file should include the ti.uia.sysbios.LoggingSetup module as follows:
var LoggingSetup =
xdc.useModule('ti.uia.sysbios.LoggingSetup');
See Section 5.2 for how to configure the types of events that are logged and sent to System Analyzer.
Besides using the LoggingSetup module to configure event logging, you can also configure the loggers that are created as a result of including this module.
98 UIA Configuration and Coding on the Target SPRUH43D—February 2013Submit Documentation Feedback

www.ti.com Customizing the Configuration of UIA Modules
Configuring the Event Upload Mode
By default, events are uploaded using the JTAG connection in stop-mode. Events are uploaded over JTAG when the target halts. This mode requires that JTAG connections are supported by the target.
If you want to use Ethernet, probe points, a simulator, or some other method for uploading events, you can specify one of those upload methods by configuring the LoggingSetup.eventUploadMode parameter. For example, you could use the following if you were running a simulator:
var LoggingSetup =
xdc.useModule('ti.uia.sysbios.LoggingSetup');
LoggingSetup.eventUploadMode = LoggingSetup.UploadMode_SIMULATOR;
The available upload modes are as follows:
Table 5–1. LoggingSetup.eventUploadMode Values
The various event upload modes have different pros and cons. The following table compares the various modes. Comments below the table explain the columns in more detail.
Value Description
UploadMode_SIMULATOR Events are written to LoggerProbePoint loggers and are uploaded from a simulator at the time the event is logged. This mode is not supported on CPUs running multi-process operating systems such as Linux.
UploadMode_PROBEPOINT Events are written to LoggerProbePoint loggers and are uploaded at the time an event is logged. The target is briefly halted when an event is uploaded. This mode is not supported on CPUs running multi-process operating systems such as Linux.
UploadMode_JTAGSTOPMODE Events are uploaded over JTAG when the target halts. This mode is not supported on CPUs running multi-process operating systems such as Linux. (This is the default mode.)
UploadMode_JTAGRUNMODE Events are uploaded directly from the circular buffers via JTAG while the target is running. Note that while events can be uploaded via JTAG, commands cannot be sent to the target via JTAG. This mode is currently supported only on C6x devices.
UploadMode_NONJTAGTRANSPORT Events are uploaded over the non-JTAG transport specified by the ServiceMgr.transportType parameter. For example, by Ethernet or File. See Section 5.3.3.
UploadMode_IDLE Events are uploaded during the Idle loop by a user-implemented transport function.
SPRUH43D—February 2013 UIA Configuration and Coding on the Target 99Submit Documentation Feedback

Customizing the Configuration of UIA Modules www.ti.com
Table 5–2. Comparison of Upload Event Modes
The only modes that do not require a JTAG connection are UploadMode_NONJTAGTRANSPORT and UploadMode_IDLE. So, for targets that do not support JTAG connections, these are the only event upload modes supported.
If you select UploadMode_NONJTAGTRANSPORT, you should also select a topology (single-core or multicore) and a transport type (Ethernet, File, or user-defined). See Section 5.3.3.1, Configuring the topology and Section 5.3.3.2, Configuring the transportType for details.
The memory footprint is smaller for modes that do not use the ServiceMgr framework.
The non-JTAG modes have a small performance impact on the application because Log records are retrieved from a low-priority Task thread by the ServiceMgr framework or during Idle processing for LoggerIdle.
The modes listed as being easy to use are easy because there are very few decisions to be made. The non-JTAG modes allow you to customize the behavior of the ServiceMgr framework, so there are more choices available to you. LoggerIdle is less complicated than ServiceMgr, but it still requires the user to set up and implement the transport that will be used.
Only JTAG Run-Mode, Non-JTAG mode, and Idle mode should be used for applications with real-time constraints running on real (non-simulator) hardware. The other modes do not handle these cases well because halting the target when a record is written might interfere with real-time interactions between cores and the real-time behavior of the application.
For JTAG Stop-Mode, records may be overwritten if the Logger buffer is too small. For JTAG Run-Mode, records may be dropped if the CCS IDE cannot keep up with the number of event logs received. For Non-JTAG mode, records may be dropped if the Rta module cannot keep up with the number of events; see
Mode
Target and Connection Requirements
Memory Footprint
Performance Impact of Log Records
Ease-of-Use
Good for Real Hardware or Multicore
Can Records Be Dropped?
Simulator JTAG required smaller none easy No No
Probe Point JTAG required smaller none easy No No
JTAG Stop-Mode (default)
JTAG required smaller none easy No Can be overwritten.
JTAG Run-Mode JTAG required(available on C64x+, C66x and C28x targets only)
smaller slight easy Yes Yes, if CCS cannot keep up
Non-JTAG Transport
no JTAG required; various transports supported
larger some more complex
Yes Yes, if Rta cannot keep up. Also records not seen when target halts
Idle no JTAG required; various transports supported
smaller some moderate Yes Yes, if there is not enough Idle time or the transport cannot keep up
100 UIA Configuration and Coding on the Target SPRUH43D—February 2013Submit Documentation Feedback

www.ti.com Customizing the Configuration of UIA Modules
Section 3.6.3, If System Analyzer Events are Being Dropped to troubleshoot this problem. For Idle mode, records may be dropped if there is not enough Idle time or the transport cannot keep up with the rate of Log events. For Non-JTAG and Idle modes, if you halt the target, Log events are not sent to the host; they remain on the target waiting for the application to resume running.
See the ti.uia.sysbios.LoggingSetup topic in the online help API Reference (CDOC) for more information about this module.
Default Logger Instances
The LoggingSetup module creates logger instances for the following purposes:
• SYSBIOS System Logger. Receives events related to SYS/BIOS context-switching. For example, pend and post events for the Semaphore and Event modules go to this log. The default size of this logger is 32768 MADUs.
• Load Logger. Receives load information for the CPU, thread types (Hwi and Swi), and Task functions. The default size of this logger is 1024 MADUs.
• Main Logger. Receives benchmarking information from pre-instrumented objects and any events you add to the target code. The default size of this logger is 32768 MADUs.
Loggers are responsible for handling events sent via APIs in the xdc.runtime.Log module and the Log extension modules provided by UIA (for example, LogSnapshot and LogSync).
Event Upload Mode and Loggers
If you want more control over the way a logger is configured—for example, to specify which section of memory contains the logger’s event buffer—you can create your own instance of a logger, configure its parameters, and assign this logger to the LoggingSetup module via the loadLogger, sysbiosLogger, and mainLogger configuration parameters.
You must create loggers using the correct module for the eventUploadMode you selected, as shown in the following list. Note that, if the LoggingSetup.eventUploadMode configuration option is not set, then by default the LoggingSetup module uses UploadMode_JTAGSTOPMODE.
Configuring Loggers
If you want to configure a Logger module, add the module that corresponds to your eventUploadMode from the list in “Event Upload Mode and Loggers” on page 101. You can add a module in XGCONF or by adding a statement similar to the following to your *.cfg file:
var LoggerCircBuf = xdc.useModule('ti.uia.runtime.LoggerCircBuf');
eventUploadMode Setting Corresponding Logger Module
UploadMode_SIMULATOR LoggerProbePoint
UploadMode_PROBEPOINT LoggerProbePoint
UploadMode_JTAGSTOPMODE (default) LoggerStopMode
UploadMode_JTAGRUNMODE LoggerCircBuf (see Section 5.3.4)
UploadMode_NONJTAGTRANSPORT LoggerCircBuf (see Section 5.3.4)
UploadMode_IDLE LoggerIdle (see Section 5.3.6)
SPRUH43D—February 2013 UIA Configuration and Coding on the Target 101Submit Documentation Feedback

Customizing the Configuration of UIA Modules www.ti.com
If you configure the wrong Logger module for the eventUploadMode you are using, events may not be available in the log or may not be uploadable. The LoggingSetup module does not warn you if you add a Logger module to your configuration that is not compatible with your eventUploadMode setting.
Configuring Logger Buffer Sizes: Logger implementations drop events if the buffer fills up before the events are collected by the Rta module. For this reason, it is a good idea to make sure that the logger is large enough to hold the events that it will receive during each period. Events generally range in size from 8 bytes to 48 bytes. By default, Rta polls loggers every 100 milliseconds. Depending on the period and number of events being logged, you may want to change the size of the loggers. You can change the default sizes of the three loggers created by LoggingSetup as follows:
LoggingSetup.loadLoggerSize = 2048;
LoggingSetup.mainLoggerSize = 16384;
LoggingSetup.sysbiosLoggerSize = 16384;
See Section 5.3.4, Configuring ti.uia.runtime.LoggerCircBuf, for an example that configures a logger by customizing the logger size and memory section use. (Although this example is focused on LoggerCircBuf, the same configuration parameters used in the example can be used with LoggerStopMode and LoggerProbePoint.)
Note: Use of xdc.runtime.LoggerBuf is not supported by UIA. This module is provided for use by legacy applications that were written prior to the introduction of UIA and does not use data structures that are supported by System Analyzer.
5.3.2 Configuring ti.uia.services.Rta
For non-JTAG event upload modes, UIA uses the ti.uia.services.Rta module to provide a real-time analysis service. The Rta module enables a service that collects events from logger instances and sends them to the host.
Your application’s configuration file does not need to include the ti.uia.services.Rta module, because it is automatically included when you set the LoggingSetup.eventUploadMode parameter to UploadMode_NONJTAGTRANSPORT.
Note: You should not include the ti.uia.services.Rta module in your configuration file or set any of its parameters if you are using an eventUploadMode other than UploadMode_NONJTAGTRANSPORT.
By default, the Rta module collects events every 100 milliseconds. You can configure a different interval as in the following example:
Rta.periodInMs = 500;
You should shorten the period if you are using a simulator. For example:
Rta.periodInMs = 5;
Setting the periodInMs parameter does not guarantee that the collection will run at this rate. Even if the period has expired, the collection will not occur until the current running Task has yielded and there are no other higher priority Tasks ready.
Setting the period to 0 disables all collection of events.
102 UIA Configuration and Coding on the Target SPRUH43D—February 2013Submit Documentation Feedback

www.ti.com Customizing the Configuration of UIA Modules
When you include the Rta module, Rta automatically includes the ti.uia.runtime.ServiceMgr module—the module that actually communicates with the instrumentation host. The ServiceMgr module is described in Section 5.3.3.
A periodInMs parameter is also provided by the ServiceMgr module. When setting the Rta.periodInMs parameter, you should consider the interactions between the settings you use for the SYS/BIOS clock interval (in the ti.sysbios.knl.Clock module), the ServiceMgr.periodInMs parameter, and the Rta.periodInMs parameter.
• The SYS/BIOS clock interval should be the shortest interval of the three. By default it is 1 millisecond.
• The ServiceMgr.periodInMs parameter should be larger than the SYS/BIOS clock interval, and it should be a whole-number multiple of the SYS/BIOS clock interval. By default it is 100 milliseconds.
• The Rta.periodInMs parameter should be equal to or greater than the ServiceMgr.periodInMs parameter, and it should also be a whole-number multiple of ServiceMgr.periodInMs. By default it is 100 milliseconds.
In summary:
SYS/BIOS clock interval < ServiceMgr.periodInMs <= Rta.periodInMs
If periodInMs for ServiceMgr and Rta are too small, your system performance may suffer because of all the context switches. If periodInMs is too large, logger buffers may fill up before the period elapses and you may lose data.
See the ti.uia.services.Rta topic in the online help API Reference (CDOC) for more information.
5.3.3 Configuring ti.uia.runtime.ServiceMgr
The ti.uia.runtime.ServiceMgr module is responsible for sending and receiving packets between the services on the target and the instrumentation host.
When the LoggingSetup module includes the Rta module (because the LoggingSetup.eventUploadMode is UploadMode_NONJTAGTRANSPORT), Rta automatically includes the ti.uia.runtime.ServiceMgr module. If you have a single-core application, you can use the default configuration of the ServiceMgr module.
The ServiceMgr module provides three key configuration parameters in setting up UIA for your device based on your architecture:
• topology. Specifies whether you are using a single-core or multicore target. See Section 5.3.3.1.
• transportType. Specifies transport to use. See Section 5.3.3.2.
• masterProcId. If this is a multicore application, specifies which core is routing events to the instrumentation host. See Section 5.3.3.3.
SPRUH43D—February 2013 UIA Configuration and Coding on the Target 103Submit Documentation Feedback
Customizing the Configuration of UIA Modules www.ti.com
5.3.3.1 Configuring the topology
The default for the ServiceMgr.topology configuration parameter is Topology_SINGLECORE, which means that each core on the device communicates directly with the host.
If you have a multicore application and the routing of events to CCS is done via a single master core (which then sends the data to CCS), you must include the ServiceMgr module explicitly and configure MULTICORE as the topology. For example:
var ServiceMgr =
xdc.useModule('ti.uia.runtime.ServiceMgr');
ServiceMgr.topology = ServiceMgr.Topology_MULTICORE;
The EVMTI816x routes to the ARM, which runs Linux. The EVM6472 routes to the master core. In general, if only one core can access the peripherals, use the MULTICORE topology.
Communication with other cores is routed via the master core, which is specified by the ServiceMgr.masterProcId parameter.
Routing between cores is done via Ipc's MessageQ module. ServiceMgr uses IPC to discover the core configuration and to communicate between the cores. The cores use MessageQ to talk to each other. The masterProcId communicates to CCS. For ’C6472, the master core uses NDK to send and receive TCP/UDP packets to and from CCS.
Note: ServiceMgr expects the application to configure and initialize IPC.
If each core in your multicore application sends data directly to CCS on the host, configure the topology as Topology_SINGLECORE and do not specify a value for the masterProcId parameter.
5.3.3.2 Configuring the transportType
The ServiceMgr.transportType configuration parameter is used to specify in the type of physical connection to use. For example:
ServiceMgr.transportType = ServiceMgr.TransportType_FILE;
The following transport options are available:
• TransportType_ETHERNET. Events and control messages are sent between the host and targets via Ethernet. By default, the NDK is used. The application is responsible for configuring and starting networking stack.
• TransportType_FILE. Events are sent between the host and targets via File over JTAG. (Note that control messages cannot be sent via this transport.)
• TransportType_USER. You plan write your own transport functions or use transport functions from some other source and specify them using the ServiceMgr.transportFxns parameter. See Section 5.4.8, Custom Transport Functions for Use with ServiceMgr if you plan to use this option.
Not all transport options are supported on all devices.
If you do not specify a transportType, UIA picks an appropriate transport implementation to use based on your device. The defaults are found using the ti.uia.family.Settings module. If the device is unknown to ServiceMgr, TransportType_ETHERNET is used.
104 UIA Configuration and Coding on the Target SPRUH43D—February 2013Submit Documentation Feedback
www.ti.com Customizing the Configuration of UIA Modules
Note: The transport type is ignored if you configure events to be uploaded from a simulator, probe points, or JTAG (run-mode or stop-mode) using the LoggingSetup.eventUploadMode parameter (see Section 5.3.1). By default, the eventUploadMode is JTAG stop-mode, and the transportType is ignored.
5.3.3.3 Configuring the masterProcId
If this is a multicore application, you need to set the ServiceMgr.masterProcId parameter to indicate which core you want to act as the master core for UIA. All packets will be routed through the master core to the instrumentation host.
The core ID numbers correspond the IPC’s MultiProc ID values. The ServiceMgr module uses IPC to discover the core configuration and to communicate between cores.
Note: The core chosen as the master must be started first.
For example to have core 3 be the masterProcId on a multicore device:
var ServiceMgr =
xdc.useModule('ti.uia.runtime.ServiceMgr');
ServiceMgr.topology = ServiceMgr.Topology_MULTICORE;
ServiceMgr.masterProcId = 3;
5.3.3.4 Configuring Other ServiceMgr Parameters
You can configure how often the ServiceMgr gathers events from logs and transfers them to the host. For example:
ServiceMgr.periodInMs = 200;
See Section 5.3.2, Configuring ti.uia.services.Rta for details on the interactions between the ServiceMgr.periodInMs parameter, the Rta.periodInMs parameter, and the SYS/BIOS clock interval.
UIA makes a distinction between event and message (control) packets.
• Event packets are large in order to hold several event records. For example, if you are using an Ethernet transport, the maximum event packet size is 1472 bytes, which includes the packet header. UIA chooses the size and number of event packets based on the transport and device. In a multicore architecture, you may want to increase the value of the numEventPacketBufs parameter beyond the default of 2 if a lot of logging is done on the non-master cores. This will help reduce the number of events lost.
• Message (control) packets are small and hold only a control message sent from the instrumentation host. The default message packet size is 128 bytes. Note that control messages are only supported via the Ethernet transport. The ServiceMgr.supportControl parameter specifies whether control messages are enabled; it is set automatically as a result of the transport that is used. Control packets occur much less frequently than event packets, so it is rarely necessary to increase the number of control packet buffers. For those rare cases, you can use the numIncomingCtrlPacketBufs and numOutgoingCtrlPacketBufs parameters to configure the number of message packets.
The ServiceMgr module uses one or two Task threads depending on whether control message handling is enabled. By default, these Tasks have a priority of 1, the lowest level. The receive Task receives control messages from the instrumentation host and forwards them to the transfer agent Task. The transfer agent
SPRUH43D—February 2013 UIA Configuration and Coding on the Target 105Submit Documentation Feedback

Customizing the Configuration of UIA Modules www.ti.com
Task handles all other activities, including period management, event collection, communicating with remote cores, and sending UIA packets to the instrumentation host. The ServiceMgr module provides the following parameters for configuring the priority, stack sizes, and placement of these tasks: rxTaskPriority, rxTaskStackSize, rxTaskStackSection, transferAgentPriority, transferAgentStackSize, and transferAgentStackSection.
See the ti.uia.runtime.ServiceMgr topic in the online help API Reference (CDOC) for more information about this module.
5.3.4 Configuring ti.uia.runtime.LoggerCircBuf
As described in Section 5.3.1, Configuring ti.uia.sysbios.LoggingSetup, UIA creates and uses several loggers to contain events.
Loggers are implementations of an interface, ILogger, which is defined by XDCtools. By default, the loggers created by LoggingSetup use the ti.uia.runtime.LoggerCircBuf implementation provided with UIA.
Note: You can only use loggers that inherit from ti.uia.runtime.IUIATransfer with UIA. Currently only the ti.uia.runtime.LoggerCircBuf and ti.uia.runtime.LoggerSM implementations are supported. You cannot use xdc.runtime.LoggerBuf with UIA.
LoggerCircBuf maintains variable-length logger instances that store events in a compressed, non-decoded format in memory. The ti.uia.services.Rta module is responsible for copying the events out of LoggerCircBuf and sending them to CCS on the instrumentation host.
Each core must have its own logger instances. Instances cannot be shared among multiple cores due to the overhead that would be required for multicore synchronization.
You can use the LoggerCircBuf module to configure your own loggers for UIA (instead of using ti.uia.sysbios.LoggingSetup’s defaults). This allows you to configure parameters for the loggers, such as the section that contains the buffer.
For example, the following statements configure a Load logger to be used by LoggingSetup. The size is larger than the default and the logger is stored in a non-default memory section:
var loggerCircBufParams = new LoggerCircBuf.Params();
loggerCircBufParams.transferBufSize = 2048;
/* must also place memory section via Program.sectMap */
loggerCircBufParams.bufSection = ’.myLoggerSection’;
var logger = LoggerCircBuf.create(loggerCircBufParams);
logger.instance.name = "Load Logger";
var LoggingSetup =
xdc.useModule('ti.uia.sysbios.LoggingSetup');
LoggingSetup.loadLogger = logger;
106 UIA Configuration and Coding on the Target SPRUH43D—February 2013Submit Documentation Feedback
www.ti.com Customizing the Configuration of UIA Modules
You can also create extra LoggerCircBuf instances to handle events from certain modules. Since LoggerCircBuf (and logger implementations in general) can drop events, it is advantageous to put critical events in a dedicated logger instance. For example, the following code creates a logger just for the Swi module.
var LoggerCircBuf =
xdc.useModule('ti.uia.runtime.LoggerCircBuf');
var Swi = xdc.useModule('ti.sysbios.knl.Swi');
/* Give the Swi module its own logger. */
var loggerCircBufParams = new LoggerCircBuf.Params();
loggerCircBufParams.transferBufSize = 65536;
var swiLog = LoggerCircBuf.create(loggerCircBufParams);
swiLog.instance.name = "Swi Logger";
Swi.common$.logger = swiLog;
/* Enable the Swi module to log events */
Swi.common$.diags_USER1 = Diags.RUNTIME_ON;
Swi.common$.diags_USER2 = Diags.RUNTIME_ON;
Events generally range in size from 8 bytes (Log_write0 with no timestamp) to 48 bytes (Log_write8 with timestamp). Note that snapshot and memory dump events can be even larger.
See the ti.uia.runtime.LoggerCircBuf topic in the online help API Reference (CDOC) for more information about this module.
5.3.4.1 Configuring a Shared LoggerCircBuf when Multiple Cores Run the Same Image
If you have a single target image that is loaded onto multiple cores, and the LoggerCircBuf loggers are stored in shared memory (for example, external memory), you should set the LoggerCircBufParams.numCores parameter to specify the number of cores running the same image.
The numCores parameter provides a solution to the problem that occurs if the logger's buffer is in shared memory (for example, DDR). Since the image is the same for all the cores, each core attempts to write to the same buffer in the shared memory.
The following example shows how to set the numCores parameter for a logger that is stored in shared memory.
var loggerCircBufParams = new LoggerCircBuf.Params();
loggerCircBufParams.transferBufSize = 1024;
loggerCircBufParams.numCores = 4;
/* must also place memory section via Program.sectMap */
loggerCircBufParams.bufSection = ’.sharedMemSection’;
var logger = LoggerCircBuf.create(loggerCircBufParams);
logger.instance.name = "Load Logger";
var LoggingSetup =
xdc.useModule('ti.uia.sysbios.LoggingSetup');
LoggingSetup.loadLogger = logger;
SPRUH43D—February 2013 UIA Configuration and Coding on the Target 107Submit Documentation Feedback
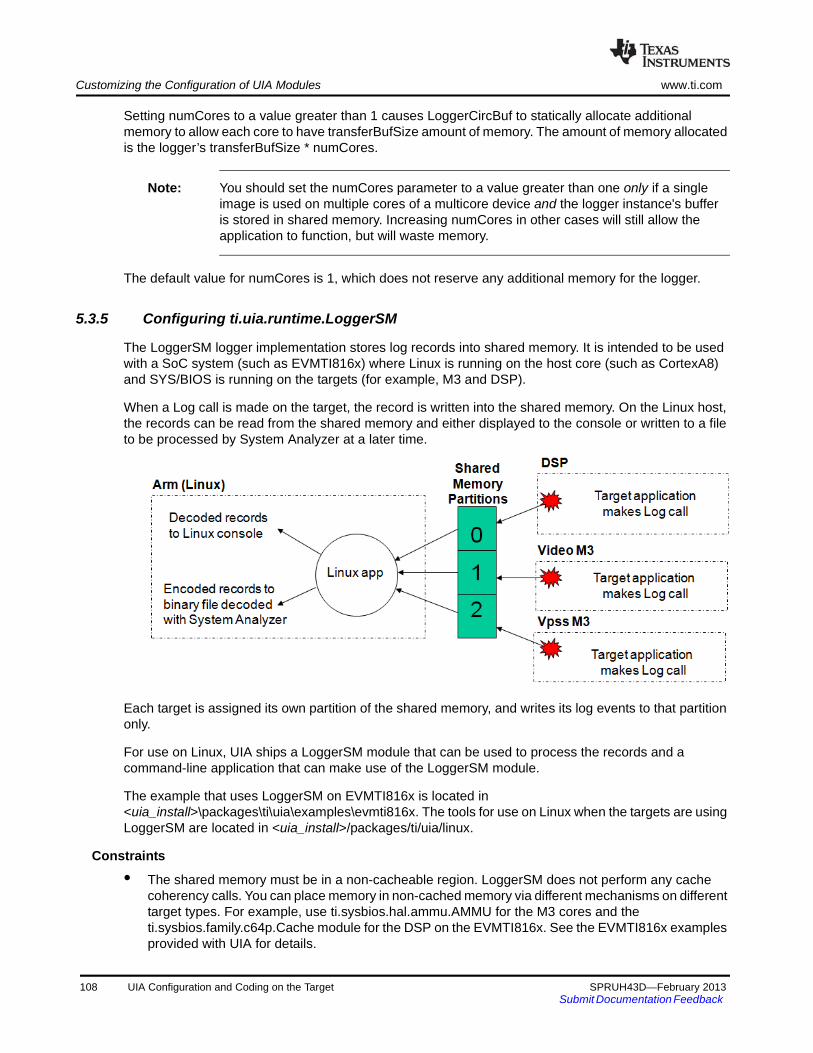
Customizing the Configuration of UIA Modules www.ti.com
Setting numCores to a value greater than 1 causes LoggerCircBuf to statically allocate additional memory to allow each core to have transferBufSize amount of memory. The amount of memory allocated is the logger’s transferBufSize * numCores.
Note: You should set the numCores parameter to a value greater than one only if a single image is used on multiple cores of a multicore device and the logger instance's buffer is stored in shared memory. Increasing numCores in other cases will still allow the application to function, but will waste memory.
The default value for numCores is 1, which does not reserve any additional memory for the logger.
5.3.5 Configuring ti.uia.runtime.LoggerSM
The LoggerSM logger implementation stores log records into shared memory. It is intended to be used with a SoC system (such as EVMTI816x) where Linux is running on the host core (such as CortexA8) and SYS/BIOS is running on the targets (for example, M3 and DSP).
When a Log call is made on the target, the record is written into the shared memory. On the Linux host, the records can be read from the shared memory and either displayed to the console or written to a file to be processed by System Analyzer at a later time.
Each target is assigned its own partition of the shared memory, and writes its log events to that partition only.
For use on Linux, UIA ships a LoggerSM module that can be used to process the records and a command-line application that can make use of the LoggerSM module.
The example that uses LoggerSM on EVMTI816x is located in <uia_install>\packages\ti\uia\examples\evmti816x. The tools for use on Linux when the targets are using LoggerSM are located in <uia_install>/packages/ti/uia/linux.
Constraints
• The shared memory must be in a non-cacheable region. LoggerSM does not perform any cache coherency calls. You can place memory in non-cached memory via different mechanisms on different target types. For example, use ti.sysbios.hal.ammu.AMMU for the M3 cores and the ti.sysbios.family.c64p.Cache module for the DSP on the EVMTI816x. See the EVMTI816x examples provided with UIA for details.
108 UIA Configuration and Coding on the Target SPRUH43D—February 2013Submit Documentation Feedback

www.ti.com Customizing the Configuration of UIA Modules
• The shared memory must be aligned on a 4096 boundary.
• The shared memory must be in a NOLOAD section if multiple cores are using the memory.
• All cores, including the targets and Linux ARM core, must have the same size memory units, also called Minimum Addressable Data Unit (MADU).
• Currently the targets and host must all have the same endianness. Removing this restriction is a future enhancement. For example, the EVMTI816x's CortexA8, DSP, and M3 all are little endian.
Configuring the Targets
The following example configuration script causes a target to use the LoggerSM module to place UIA events in shared memory:
var LoggerSM = xdc.useModule('ti.uia.runtime.LoggerSM');
var LoggingSetup =
xdc.useModule('ti.uia.sysbios.LoggingSetup');
var MultiProc = xdc.useModule('ti.sdo.utils.MultiProc');
LoggerSM.sharedMemorySize = 0x20000;
LoggerSM.numPartitions = 3;
LoggerSM.partitionId = MultiProc.id;
LoggerSM.bufSection = ".loggerSM";
var logger = LoggerSM.create();
LoggingSetup.loadLogger = logger;
LoggingSetup.mainLogger = logger;
LoggingSetup.sysbiosLogger = logger;
Alternately, since only one LoggerSM instance is used for all logging, you can create the logger instance and use it in all cases where logging occurs as follows:
Defaults.common$.logger = LoggerSM.create();
The parameters you can set include:
• sharedMemorySize specifies the total size of the shared memory for all targets. You must set this parameter to the same value on all targets. The default size is 0x20000 MADUs. For example, on the EVMTI816x, if the sharedMemorySize is 0x3000, each target—DSP, videoM3 and vpssM3—would get 0x1000 MADUs of shared memory for log records.
• numPartitions specifies the number of cores that can use the shared memory. The memory will be divided into this number of equal partitions. You must set this parameter to the same value on all targets. The default is 3 partitions. If the sharedMemorySize is not evenly divisible by 3, the extra memory is unused at the end of the shared memory.
• partitionID determines which partition this target uses. This value must be different on all targets. For example, in the EVMTI816x examples, the DSP gets partition 0, videoM3 gets 1, and vpssM3 gets 2. This corresponds with the IPC Multicore IDs. You can set this parameter at run-time using the LoggerSM_setPartitionId() API, which must be called before module startup occurs. For example, you could call this function using the xdc.runtime.Startup.firstFxns array.
• decode specifies whether the target decodes the record before writing it to shared memory. The default is true, which means the target decodes the record into an ASCII string and writes the string into the shared memory. The Linux tool extracts the string and prints it to the Linux console. This approach is expensive from a performance standpoint. The benefit is that it is easy to manage and view on the host.
SPRUH43D—February 2013 UIA Configuration and Coding on the Target 109Submit Documentation Feedback
Customizing the Configuration of UIA Modules www.ti.com
If you set decode to false, encoded records are written to the shared memory. The Linux tool writesthe encoded records to a single binary file (see page 5–111) that can be decoded by SystemAnalyzer. This approach makes Log module calls much faster on the target. Note that different corescan have different decode values.
• overwrite determines what happens if the shared memory partition fills up. By default, any new records are discarded. This mode allows you to read the records while the target is running. If you set this parameter to true, old records are overwritten by new records. In this mode, records can only be read on Linux when the targets are halted (or crashed), because both the target and host must update a read pointer.
• bufSection specifies the section in which to place the logger’s buffer. See the next section for details.
Placing the Shared Memory
The bufSection parameter tells LoggerSM where to place the buffer it creates. Each core’s bufSection must be placed at the same address. For example, the EVMTI816x examples all place the ".loggerSM" section at 0x8f000000 with the following configuration statements:
LoggerSM.bufSection = ".loggerSM";
...
Program.sectMap[".loggerSM"] = new Program.SectionSpec();
Program.sectMap[".loggerSM"].loadAddress = 0x8f000000;
// or loadSegment = "LOGGERSM";
Program.sectMap[".loggerSM"].type = "NOLOAD";
Note that the "NOLOAD" configuration is required. Without this, as each core is loaded, it would wipe out the previous core’s initialization of its partition of the shared memory.
The LoggerSM module requires that all targets sharing the memory have the same base address. To confirm all targets have the same address, look at the address of the ti_uia_runtime_LoggerSM_sharedBuffer__A symbol in all the targets’ mapfiles. The address must be the same on all targets. This physical address must also be used in the Linux LoggerSM and loggerSMDump tools.
There are several ways to place the shared memory for the .loggerSM section. Here are two ways.
• The EVMTI816x LoggerSM examples use a custom platform file (in ti/uia/examples/platforms) where an explicit memory segment is created as follows:
["DDR_SR0", {name: "DDR_SR0", base: 0x8E000000,
len: 0x01000000, space: "code/data",access: "RWX"}],
["DDR_VPSS", {name: "DDR_VPSS", base: 0x8F800000,
len: 0x00800000, space: "code/data",access: "RWX"}],
["LOGGERSM", {name: "LOGGERSM", base: 0x8F000000,
len: 0x00020000, space: "data",access: "RWX"}],
• You can create a custom memory map in the config.bld file as follows:
/* For UIA logging to linux terminal */
memory[24] = ["LOGGERSM", {name: "LOGGERSM",
base: 0x8F000000, len: 0x00020000, space: "data"}];
110 UIA Configuration and Coding on the Target SPRUH43D—February 2013Submit Documentation Feedback

www.ti.com Customizing the Configuration of UIA Modules
Using the Linux LoggerSM Module
The non-XDC LoggerSM module knows how to read the shared memory contents and process them. If the records are decoded, it displays them to the Linux console. If the records are encoded, they are written (along with the UIA events headers) into a binary file. This module is provided in <uia_install>/packages/ti/uia/linux.
The two main APIs in this module are LoggerSM_run() and LoggerSM_setName().
• LoggerSM_run() processes logs in all the partitions. The syntax is as follows:
int LoggerSM_run( unsigned int physBaseAddr,
size_t sharedMemorySize,
unsigned int numPartitions,
unsigned int partitionMask,
char *filename)
— physBaseAddr specifies the physical address of the shared memory. The address used here must match the address configured on all the targets.
— sharedMemorySize specifies the total size of the shared memory. This size must match the targets’ sharedMemorySize parameter.
— numPartitions specifies the number of partitions in the shared memory. This must match the targets’ numPartitions parameter.
— partitionMask is a bitmask to determine which partitions to process. For example, if numPartitions is 3, but you only want to process partitions 1 and 2, set the partitionMask to 0x6 (110b).
— filename specifies a filename to use if encoded records are found. If this is NULL, the default name is loggerSM.bin. Encoded records from all targets that send encoded records are placed in the same file. Since a UIA Packet header is also included, System Analyzer can determine which records go with which core.
This function returns LoggerSM_ERROR if any parameters are invalid; otherwise, this function neverreturns.
• LoggerSM_setName() associates a name to a partition ID. Calling this function for each target before you call LoggerSM_run() allows the decoded output to include the name instead of just the partition ID. The syntax is as follow:
int LoggerSM_setName( unsigned int partitionId,
char *name);
This function returns LoggerSM_SUCCESS if it is successful or LoggerSM_ERROR if anyparameters are invalid.
See the source code in LoggerSM.c and LoggerSM.h for more APIs.
Using the Linux loggerSMDump Tool
UIA also provides the loggerSMDump.c file, which shows how to use the Linux LoggerSM module with the EVMTI816x board to send decoded records to the console and encoded records to a binary file. This example is provided in the <uia_install>/packages/ti/uia/examples/evmti816x directory. The directory also includes a makefile to build the tool. the loggerSMDump.c file calls both LoggerSM_setName() and LoggerSM_run().
SPRUH43D—February 2013 UIA Configuration and Coding on the Target 111Submit Documentation Feedback

Customizing the Configuration of UIA Modules www.ti.com
The command-line syntax is:
loggerSMDump.out <addr> <core_name> [<filename>]
To terminate the tool, press Ctrl+C.
• addr. The physical address of the shared memory in Hex. The shared memory physical address must be 4 KB aligned.
• core_name. The name of the cores that are processed. Valid names are: "dsp", "video", "vpss", "m3" or "all". "m3" processes both video and vpss. "all" processes all three targets.
• filename. If target sends encoded records, specify the name of the file to store the encoded records. They can be decoded by System Analyzer. This parameter is optional. If no filename is specified and encoded events are found, the default file name is loggerSM.bin.
Here are some command-line examples:
./loggerSMDump.out 0x8f000000 video myBinaryFile
./loggerSMDump.out 0x8f000000 m3 myBinaryFile
./loggerSMDump.out 0x8f000000 all
This example shows output from loggerSMDump. In this case, the video M3’s records were encoded, so they went into the binary file instead.
N:VPSS P:2 #:00113 T:00000000|21f447cd S:Start:
N:VPSS P:2 #:00114 T:00000000|21f637d3 S:Stop:
N:VPSS P:2 #:00115 T:00000000|21f69b15 S:count = 35
N:DSP P:0 #:00249 T:00000000|3ce48c2f S:Stop:
N:DSP P:0 #:00250 T:00000000|3ce5f28d S:count = 80
N:DSP P:0 #:00251 T:00000000|3d8689eb S:Start:
N:DSP P:0 #:00252 T:00000000|3da59483 S:Stop:
N:DSP P:0 #:00253 T:00000000|3da6facf S:count = 81
N:VPSS P:2 #:00116 T:00000000|22d92a23 S:Start:
N:VPSS P:2 #:00117 T:00000000|22db1689 S:Stop:
N:VPSS P:2 #:00118 T:00000000|22db7797 S:count = 36
Use the following legend to parse the output:
• N: name of the partition owner
• P: partition Id
• T: timestamp [high 32 bits | low 32 bits]
• S: decoded string
112 UIA Configuration and Coding on the Target SPRUH43D—February 2013Submit Documentation Feedback

www.ti.com Customizing the Configuration of UIA Modules
5.3.6 Configuring ti.uia.sysbios.LoggerIdle
When using UploadMode_IDLE as described in Section 5.3.1, Configuring ti.uia.sysbios.LoggingSetup, UIA will use the LoggerIdle module for all logging.
LoggerIdle is a single-instance logger. This means that there is only one buffer and one data stream for all log events. CCS currently supports upload via UART, USB, and Ethernet.
Selecting UploadMode_IDLE in the LoggingSetup configuration adds LoggerIdle to your project.
However, selecting this mode does not configure logger-specific settings for you. Buffer sizes in the LoggingSetup configuration are not used by LoggerIdle. Instead, you need to configure LoggerIdle to set its buffer size. To configure LoggerIdle, click the link below the Event Upload Mode field in the LoggingSetup configuration page.
SPRUH43D—February 2013 UIA Configuration and Coding on the Target 113Submit Documentation Feedback
Customizing the Configuration of UIA Modules www.ti.com
The size of the buffer used by LoggerIdle is measured in 32-bit words (MAUs). LoggerIdle only has a single buffer instance, and this buffer should be sized appropriately. A general rule is to use the sum of the buffer sizes you would use for the SYS/BIOS, Load, and Application Logging buffers in LoggingSetup.
LoggerIdle also requires you to implement and set a transport function and type. The transport function use the following prototype:
Int transportFxn(UChar *ptr, Int length)
The ptr is a pointer to a buffer of unsigned characters with a size sufficient to hold the length to be written. The function should return the number of unsigned characters sent by the transport. The transport must send a multiple of four unsigned characters to avoid dropping any data. Host processing of Log events may or may not handle dropping partial Log events. The implementation of LoggerIdle will never send partial Log events as long as the transport sends a multiple of four unsigned characters.
Set the Transport Type field to tell the host how to handle the implemented transport function. Currently TransportType_UART, TransportType_USB, and TransportType_ETHERNET are supported by CCS. If you are using some other transport, you can use TransportType_CUSTOM and provide the transport name in the Custom Transport field.
LoggerIdle provides an option to log a timestamp with every Log event by setting the Optimization parameter to true. Timestamps are 8 bytes long and should be considered when calculating the buffer size and transfer rate.
The following statements configure LoggingSetup and LoggerIdle in the .cfg source file.
var LoggingSetup = xdc.useModule('ti.uia.sysbios.LoggingSetup');
LoggingSetup.eventUploadMode = LoggingSetup.UploadMode_IDLE;
var LoggerIdle = xdc.useModule('ti.uia.sysbios.LoggerIdle');
LoggerIdle.bufferSize = 1024;
LoggerIdle.transportFxn = "&transportFxn";
LoggerIdle.transportType = LoggerIdle.TransportType_USB;
LoggerIdle.isTimestampEnabled = true;
5.3.7 Configuring ti.uia.runtime.LogSync
Events that are logged by different CPUs are typically timestamped using a timer that is local to that CPU in order to avoid the overhead of going off-chip to read a shared timer.
In order to correlate one CPU’s events with those logged by another CPU, it is necessary to log "sync point events" that have, as parameters, both the local CPU’s timestamp value and a "global timestamp" that was read from a global shared timer. Any CPUs that log sync point events with global timestamps read from the same global shared timer can be correlated with each other and displayed against a common timeline for analysis and comparison.
The ti.uia.runtime.LogSync module is provided in order to support this type of event correlation. It provides sync events that are used to correlate timestamp values. The Rta module handles all of the sync point event logging that is required in order to support the event correlation.
In general, you will need to configure the LogSync module, but will not need to call the module’s APIs from your application. For information about LogSync module APIs, see Section 5.4.5.
Note: Multicore event correlation of events uploaded via JTAG transports is not fully supported.
114 UIA Configuration and Coding on the Target SPRUH43D—February 2013Submit Documentation Feedback

www.ti.com Customizing the Configuration of UIA Modules
Setting the Global Timestamp Module Proxy
If you have a multicore application, your application must configure the GlobalTimestampProxy parameter on a target-specific basis to provide a timestamp server.
This parameter defaults correctly for the C6472 and TCI6616 platforms. However, for EVMTI816x, it defaults to null, which prevents any multicore event correlation from being performed. In general, you can use a timestamp module that implements the IUIATimestampProvider interface for your target. You should configure the GlobalTimestampProxy as follows:
var LogSync = xdc.useModule('ti.uia.runtime.LogSync');
var GlobalTimestampTimer =
xdc.useModule('ti.uia.family.c64p.TimestampC6472Timer');
LogSync.GlobalTimestampProxy = GlobalTimestampTimer;
• C6472. Use the ti.uia.family.c64p.TimestampC6472Timer module as the proxy. When you use this proxy, the default value for the maxCpuClockFreq is 700 MHz.
• TCI6616 (simulator). The ti.uia.family.c66.TimestampC66XGlobal module should be the proxy.
• EVMTI816x. The ti.uia.family.dm.TimestampDM816XTimer module should be the proxy. This setting is not auto-configured.
• Other. If no module that implements the IUIATimestampProvider interface for your target is available, you can use, for example, a timer provided by SYS/BIOS as the global timer source for event correlation "sync point" timestamps. The following statements configure such as proxy:
var LogSync = xdc.useModule('ti.uia.runtime.LogSync');
var BiosTimer =
xdc.useModule('ti.sysbios.family.c64p.TimestampProvider');
LogSync.GlobalTimestampProxy = BiosTimer;
If you are using a global timer that does not implement the IUIATimestampProvider interface, youmust also configure the maxGlobalClockFreq parameter. If the maxGlobalClockFreq parameter isnot configured, you see a warning message at build time that says UIA Event correlation is disabled.You must configure both the maxGlobalClockFreq.lo and maxGlobalClockFreq.hi parameters, whichset the lower and upper 32 bits of the frequency, respectively.
LogSync.maxGlobalClockFreq.lo = 700000000; //low 32b
LogSync.maxGlobalClockFreq.hi = 0; //upper 32b
If the CPU timestamp clock frequency is not 700 MHz, you must also configure the lo and hiparameters. For example:
LogSync.maxCpuClockFreq.lo = 1000000000; //low 32b
LogSync.maxCpuClockFreq.hi = 0; //upper 32b
Setting the Local Timestamp Module Proxy
If the frequency of the local CPU may change at run-time, you also need to configure the CpuTimestampProxy parameter of the LogSync module. The timestamp proxies provided for this purpose are:
• ti.uia.family.c64p.TimestampC64XLocal
• ti.uia.family.c66.TimestampC66XLocal
SPRUH43D—February 2013 UIA Configuration and Coding on the Target 115Submit Documentation Feedback

Customizing the Configuration of UIA Modules www.ti.com
Configuring the CpuTimestampProxy with a local timestamp module allows applications that change the CPU frequency to report this information to System Analyzer so that event timestamps can be adjusted to accommodate the change in frequency.
The following configuration script shows how to configure the C66x Local Timestamp module for use as the CpuTimestampProxy:
var TimestampC66Local =
xdc.useModule('ti.uia.family.c66.TimestampC66Local');
TimestampC66Local.maxTimerClockFreq = {lo:1200000000,hi:0};
var LogSync = xdc.useModule('ti.uia.runtime.LogSync');
LogSync.CpuTimestampProxy = TimestampC66Local;
Injecting Sync Points into Hardware Trace Streams
Correlation with hardware trace (for example, the C64x+ CPU Trace) can be enabled by injecting references to the sync point events into the hardware trace stream. The LogSync.injectIntoTraceFxn parameter allows you to inject sync point information into hardware trace streams. You can specify a pointer to a function that handles the ISA-specific details of injecting information into the trace stream.
For C64x+ Full-GEM (Generalized Embedded Megamodule) devices, which support CPU trace and Advance Event Triggering (AET), use the address of the GemTraceSync_injectIntoTrace() function provided by the ti.uia.family.c64p.GemTraceSync module. For information about GEM, see the TMS320C64x+ DSP Megamodule Reference Guide (SPRU871).
116 UIA Configuration and Coding on the Target SPRUH43D—February 2013Submit Documentation Feedback

www.ti.com Customizing the Configuration of UIA Modules
This example for the TMS320C6472 platform shows configuration statements with multicore event correlation for the CPUs enabled. More examples are provided in the CDOC for the LogSync module.
// Including Rta causes Log records to be collected and sent
// to the instrumentation host. The Rta module logs sync
// point events when it receives the start or stop
// command, and prior to sending up a new event packet if
// LogSync_isSyncPointEventRequired() returns true.
var Rta = xdc.useModule('ti.uia.services.Rta');
// By default, sync point events are logged to a dedicated
// LoggerCircBuf buffer named 'SyncLog' assigned to the
// LogSync module. A dedicated event logger buffer helps
// ensure that sufficient timing information is captured to
// enable accurate multicore event correlation. Configure
// LogSync.defaultSyncLoggerSize to set a buffer size.
var LogSync = xdc.useModule('ti.uia.runtime.LogSync');
// For C64x+ and C66x devices that provide CPU trace hardware
// capabilities, the following line enables injection of
// correlation information into the GEM CPU trace, enabling
// correlation of software events with the CPU trace events.
var GemTraceSync =
xdc.useModule('ti.uia.family.c64p.GemTraceSync');
// Configure a shared timer to act as a global time reference
// to enable multicore correlation. The TimestampC6472Timer
// module implements the IUIATimestampProvider interface, so
// assigning this timer to LogSync.GlobalTimestampProxy
// configures LogSync's global clock params automatically.
var TimestampC6472Timer =
xdc.useModule('ti.uia.family.c64p.TimestampC6472Timer');
LogSync.GlobalTimestampProxy = TimestampC6472Timer;
Setting CPU-Related Parameters
LogSync provides a number of CPU-related parameters—for example, CpuTimestampProxy, cpuTimestampCyclesPerTick, maxCpuClockFreq, and canCpuCyclesPerTickBeChanged. These parameters generally default to the correct values unless you are porting to a non-standard target. For example, the CpuTimestampProxy defaults to the same proxy used by the xdc.runtime.Timestamp module provided with XDCtools.
Setting the globalTimestampCpuCyclesPerTick parameter is optional. It is used to convert global timestamp tick counts into CPU cycle counts for devices where there is a fixed relationship between the global timer frequency and the CPU clock. For example:
LogSync.globalTimestampCpuCyclesPerTick = 6;
SPRUH43D—February 2013 UIA Configuration and Coding on the Target 117Submit Documentation Feedback
Target-Side Coding with UIA APIs www.ti.com
5.3.8 Configuring IPC
When ServiceMgr.topology is ServiceMgr.Topology_MULTICORE, the underlying UIA code uses IPC (or more specifically its MessageQ and SharedRegion modules) to move data between cores. See the IPC documentation for details on how to configure communication between cores for your multicore application.
The following IPC resources are used by UIA:
• Uses up to 4 message queues on each processor.
• Uses the SharedRegion heap when allocating messages during initialization. Which SharedRegion heap is determined by the IpcMP.sharedRegionId parameter. The default is SharedRegion 0.
• Determines the SharedRegion allocation size by the size and number of packets. This is calculated using ServiceMgr parameters as follows:
maxCtrlPacketSize *
(numIncomingCtrlPacketBufs + numOutgoingCtrlPacketBufs)
+ maxEventPacketSize * numEventPacketBufs
See Section 6.1, IPC and SysLink Usage for further information.
Note that, depending on the cache settings, these sizes might be rounded up to a cache boundary.
5.4 Target-Side Coding with UIA APIs
By default, SYS/BIOS provides instrumentation data to be sent to CCS on the host PC if you have configured UIA. It is not necessary to do any additional target-side coding once UIA is enabled.
If you want to add additional instrumentation, you can do by adding C code to your target application as described in the sections that follow.
In general, UIA provides a number of new events that can be using with the existing Log module provided as part of XDCtools. Section 5.4.1 describes how to log events, Section 5.4.2 describes how to enable event logging, and Section 5.4.3 provides an overview of the events provided by UIA.
Section 5.4.4 describes the LogSnapshot module APIs, which allow you to log memory values, register values, and stack contents.
Section 5.4.5 describes ways to configure and customize the synchronization between timestamps on multiple targets.
Section 5.4.6 describes the APIs provided by the LogCtxChg module, which allows you to log context change events.
Section 5.4.7 describes how to use the Rta module APIs to control the behavior of loggers at run-time.
Section 5.4.8 explains how to create and integrate a custom transport.
118 UIA Configuration and Coding on the Target SPRUH43D—February 2013Submit Documentation Feedback

www.ti.com Target-Side Coding with UIA APIs
5.4.1 Logging Events with Log_write() Functions
The Log_writeX() functions—Log_write0() through Log_write8()—provided by the xdc.runtime.Log module expect an event as the first argument. This argument is of type Log_Event.
The ti.uia.events package contains a number of modules that define additional events that can be passed to the Log_writeX() functions. For example, this code uses events defined by the UIABenchmark module to determine the time between two calls:
#include <ti/uia/events/UIABenchmark.h>
...
Log_write1(UIABenchmark_start, (xdc_IArg)"start A");
...
Log_write1(UIABenchmark_stop, (xdc_IArg)"stop A");
In order to use such events with Log_writeX() functions, you must enable the correct bit in the appropriate module’s diagnostics mask as shown in Section 5.4.2 and choose an event to use as described in Section 5.4.3.
5.4.2 Enabling Event Output with the Diagnostics Mask
For an overview of how to enable SYS/BIOS load and event logging, see Section 5.2. This section discusses how to enable logging of events provided by the ti.uia.events module.
Whether events are sent to the host or not is determined by the particular bit in the diagnostics mask of the module in whose context the Log_writeX() call executes. For example, UIABenchmark events are controlled by the ANALYSIS bit in the diagnostics mask.
For example, suppose you placed calls that pass UIABenchmark events to Log_write1() in a Swi function to surround some activity you want to benchmark.
Log_write1(UIABenchmark_start, (xdc_IArg)"start A");
...
Log_write1(UIABenchmark_stop, (xdc_IArg)"stop A");
If the ANALYSIS bit in the diagnostics mask were off for the Swi module, no messages would be generated by these Log_write1() calls.
By default, the LoggingSetup module sets the ANALYSIS bit to on only for the Main module, which affects logging calls that occur during your main() function and other functions that run outside the context of a SYS/BIOS thread. However, LoggingSetup does not set the ANALYSIS bit for the Swi module.
To cause these benchmark events to be output, your configuration file should contain statements like the following to turn the ANALYSIS bit for the Swi module on in all cases:
var Swi = xdc.useModule('ti.sysbios.knl.Swi');
var Diags = xdc.useModule('xdc.runtime.Diags');
var UIABenchmark =
xdc.useModule('ti.uia.events.UIABenchmark');
Swi.common$.diags_ANALYSIS = Diags.ALWAYS_ON;
SPRUH43D—February 2013 UIA Configuration and Coding on the Target 119Submit Documentation Feedback

Target-Side Coding with UIA APIs www.ti.com
Alternately, you could enable output of UIABenchmark events within the Swi context by setting the ANALYSIS bit to RUNTIME_OFF and then turning the bit on and off in your run-time code. For example, your configuration file might contain the following statements:
var Swi = xdc.useModule('ti.sysbios.knl.Swi');
var Diags = xdc.useModule('xdc.runtime.Diags');
var UIABenchmark =
xdc.useModule('ti.uia.events.UIABenchmark');
Swi.common$.diags_ANALYSIS = Diags.RUNTIME_OFF;
Then, your C code could contain the following to turn ANALYSIS logging on and off. (See the online documentation for the Diags_setMask()Diags_setMask() function for details about its control string argument.)
// turn on logging of ANALYSIS events in the Swi module
Diags_setMask("ti.sysbios.knl.Swi+Z");
...
// turn off logging of ANALYSIS events in the Swi module
Diags_setMask("ti.sysbios.knl.Swi-Z");
5.4.3 Events Provided by UIA
The ti.uia.events package contains a number of modules that define additional events that can be passed to the Log_writeX() functions. Section 5.4.2 uses the UIABenchmark_start and UIABenchmark_stop events from the ti.uia.events.UIABenchmark module as an example.
To use an event described in this section, you must do the following:
• Include the appropriate UIA module in your .cfg configuration file. For example:
var UIABenchmark =
xdc.useModule('ti.uia.events.UIARBenchmark');
• Include the appropriate header files in your C source file. For example:
#include <xdc/runtime/Log.h>
#include <ti/uia/events/UIABenchmark.h>
• Use the event in your C source file. For example:
Log_write2(UIABenchmark_start, (xdc_IArg)"Msg %d",
msgId);
The following UIA modules provide events you can use with the Log_writeX() functions:
Table 5–3. Log_Event Types Defined by UIA Modules
Module EventsDiagnostics Control Bit Comments
UIABenchmark Start and stop events. Versions of start and stop let you identify the instance of the function being bench-marked using a numeric ID, an address, or a string.
diags_ANALYSIS UIABenchmark supports context-awareness. That is, it reports time elapsed exclusive of time spent in other threads that preempt or otherwise take control from the thread being benchmarked.
120 UIA Configuration and Coding on the Target SPRUH43D—February 2013Submit Documentation Feedback
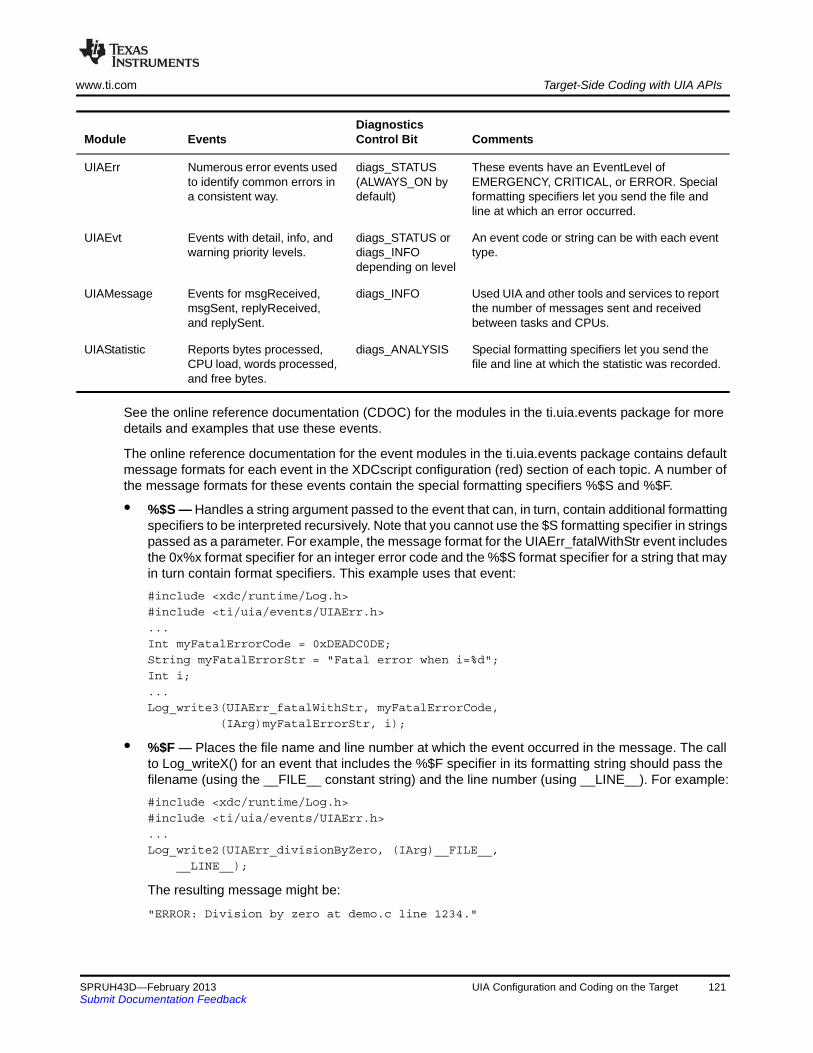
www.ti.com Target-Side Coding with UIA APIs
See the online reference documentation (CDOC) for the modules in the ti.uia.events package for more details and examples that use these events.
The online reference documentation for the event modules in the ti.uia.events package contains default message formats for each event in the XDCscript configuration (red) section of each topic. A number of the message formats for these events contain the special formatting specifiers %$S and %$F.
• %$S — Handles a string argument passed to the event that can, in turn, contain additional formatting specifiers to be interpreted recursively. Note that you cannot use the $S formatting specifier in strings passed as a parameter. For example, the message format for the UIAErr_fatalWithStr event includes the 0x%x format specifier for an integer error code and the %$S format specifier for a string that may in turn contain format specifiers. This example uses that event:
#include <xdc/runtime/Log.h>
#include <ti/uia/events/UIAErr.h>
...
Int myFatalErrorCode = 0xDEADC0DE;
String myFatalErrorStr = "Fatal error when i=%d";
Int i;
...
Log_write3(UIAErr_fatalWithStr, myFatalErrorCode,
(IArg)myFatalErrorStr, i);
• %$F — Places the file name and line number at which the event occurred in the message. The call to Log_writeX() for an event that includes the %$F specifier in its formatting string should pass the filename (using the __FILE__ constant string) and the line number (using __LINE__). For example:
#include <xdc/runtime/Log.h>
#include <ti/uia/events/UIAErr.h>
...
Log_write2(UIAErr_divisionByZero, (IArg)__FILE__,
__LINE__);
The resulting message might be:
"ERROR: Division by zero at demo.c line 1234."
UIAErr Numerous error events used to identify common errors in a consistent way.
diags_STATUS (ALWAYS_ON by default)
These events have an EventLevel of EMERGENCY, CRITICAL, or ERROR. Special formatting specifiers let you send the file and line at which an error occurred.
UIAEvt Events with detail, info, and warning priority levels.
diags_STATUS or diags_INFO depending on level
An event code or string can be with each event type.
UIAMessage Events for msgReceived, msgSent, replyReceived, and replySent.
diags_INFO Used UIA and other tools and services to report the number of messages sent and received between tasks and CPUs.
UIAStatistic Reports bytes processed, CPU load, words processed, and free bytes.
diags_ANALYSIS Special formatting specifiers let you send the file and line at which the statistic was recorded.
Module EventsDiagnostics Control Bit Comments
SPRUH43D—February 2013 UIA Configuration and Coding on the Target 121Submit Documentation Feedback
Target-Side Coding with UIA APIs www.ti.com
The ti.uia.services.Rta module defines Log_Events that are use internally when that module sends events to the host. You should not use these events in application code.
5.4.4 LogSnapshot APIs for Logging State Information
You can use snapshot events to log dynamic target state information. This lets you capture the execution context of the application at a particular moment in time.
You call functions from the ti.uia.runtime.LogSnapshot module in order to use a snapshot event. The diags_ANALYSIS bit in the module’s diagnostics mask must be on in order for snapshot events to be logged. (This bit is on by default.)
The LogSnapshot module provides the following functions:
• LogSnapshot_getSnapshotId() Returns a unique ID used to group a set of snapshot events together.
• LogSnapshot_writeMemoryBlock() Generates a LogSnapshot event for a block of memory. The output is the contents of the memory block along with information about the memory block. See Example 1 that follows.
• LogSnapshot_writeNameOfReference() This function lets you associate a string name with the handle for a dynamically-created instance. A common use would be to log a name for a dynamically-created Task thread. The host-side UIA features can then use this name when displaying data about the Task’s execution. You might want to call this API in the create hook function for SYS/BIOS Tasks. See Example 2 that follows.
• LogSnapshot_writeString() Generates a LogSnapshot event for a string on the heap. Normally, when you log a string using one of the Log APIs, what is actually logged is the address of a constant string that was generated at compile time. You can use this API to log a string that is created at run-time. This API logs the value of the memory location that contains the contents of the string, not just the address of the string. See Example 3 that follows.
Example 1: Logging a Snapshot to Display the Contents of Some Memory
For example, the following C code logs a snapshot event to capture a block of memory:
#include <ti/uia/runtime/LogSnapshot.h>
...
UInt32* pIntArray = (UInt32 *)malloc(sizeof(UInt32) * 200);
...
LogSnapshot_writeMemoryBlock(0, "pIntArray",
(UInt32)pIntArray, 200);
...
The following will be displayed for this event in the Message column of the Log view, where pIntArray is the full, unformatted contents of the array. Note that depending on the length of the memory block you specify, the output may be quite long.
Memory Snapshot at demo.c line 1234 [ID=0,adrs=0x80002000,len=200 MAUs] pIntArray
122 UIA Configuration and Coding on the Target SPRUH43D—February 2013Submit Documentation Feedback

www.ti.com Target-Side Coding with UIA APIs
Example 2: Logging a Name for a Dynamically-Created Task
The following C code logs a Task name:
#include <ti/uia/runtime/LogSnapshot.h>
#include <ti/sysbios/BIOS.h>
#include <ti/sysbios/knl/Task.h>
...
// Task create hook function that logs the task name.
// Note: Task name is not required when creating a BIOS task.
// However, providing a name makes using the host-side
// analysis features easier to use.
Void tskCreateHook(Task_Handle hTask, Error_Block *eb) {
String name;
name = Task_Handle_name(hTask);
LogSnapshot_writeNameOfReference(hTask,
"Task_create: name=%s", name, strlen(name)+1);
}
The following text would be displayed for this event in the Message column of the Log view if a handle to the "10msThread" were passed to this tskCreateHook function.
nameOfReference at demo.c line 1234 [refID=0x80002000]
Task_create: name=10msThread.
Example 3: Logging the Contents of a Dynamically-Created String
The following C code logs the contents of the string stored in name.
#include <ti/uia/runtime/LogSnapshot.h>
...
Void myFunc(String name){
...
LogSnapshot_writeString(0, name, (UInt32)name,
strlen(name));
}
The following text will be displayed for this event, where ValueOfParm is the value of the string rather than the address:
String Snapshot at demo.c line 1234 [snapshotID=0]
Processing name=ValueOfParm
5.4.5 LogSync APIs for Multicore Timestamps
You can use sync events from the LogSync module to correlate timestamp values in a multicore application. The host uses the difference between the timestamp on the target and the global timestamp to correlate the sequence of events across multiple targets.
The ti.uia.services.Rta module automatically uses the LogSync module to send sync point events if the target has been suspended or halted since the last time an event packet was sent to the host. It also sends sync point events when you start or reset the Log view on the host.
SPRUH43D—February 2013 UIA Configuration and Coding on the Target 123Submit Documentation Feedback

Target-Side Coding with UIA APIs www.ti.com
Since the Rta module handles synchronization automatically, in most cases you would only call functions from this module in your application if you are using your own NDK stack and/or are writing a custom service to take the place of the Rta module.
For information about configuring the LogSync module, see Section 5.3.7.
5.4.6 LogCtxChg APIs for Logging Context Switches
The ti.uia.runtime.LogCtxChg module provides a number of functions that log context-switching events. In most cases, you would only use the LogCtxChg APIs if you are instrumenting an OS other than SYS/BIOS.
SYS/BIOS automatically logs events for Task switches and Swi and Hwi start and stop events. You only need to make sure the correct diagnostics settings are enabled to see these events in the UIA analysis features.
In addition to functions that log Task, Swi, and Hwi events (which is done automatically by SYS/BIOS), the LogCtxChg module also provides functions to log changes in application, channel, frame, and user-defined contexts. You might use these APIs in a SYS/BIOS application if you need to keep track of contexts other than the normal threading contexts. For example, the following C code logs a context change event that identifies a newly loaded application ID:
#include <ti/uia/runtime/LogCtxChg.h>
...
Void loadApplication(Int newAppId){
...
LogCtxChg_app("New AppID=0x%x",newAppId);
}
This event prints the Log call site (%$F) and a format string (%$S) that is formatted with any additional arguments. The following text is an example of what could be displayed for the event:
"AppID Ctx Change at Line 123 in appLoader.c
[Prev. AppID = 0x1234] New AppID=0x1235"
5.4.7 Rta Module APIs for Controlling Loggers
The ti.uia.services.Rta module provides a number of APIs you can use to control loggers and the transmission of data by Rta. When you use these Rta APIs, you should be aware that the System Analyzer features on the instrumentation host may also be sending similar requests to the target in response to user activity within CCS.
Note: The Rta module is available only if you have set LoggingSetup.eventUploadMode to UploadMode_NONJTAGTRANSPORT.
Rta provides several run-time APIs that let you control whether loggers are enabled. These APIs are:
• Rta_disableAllLogs() disables all loggers serviced by Rta. All Log records are discarded by a logger when it is disabled.
• Rta_enableAllLogs() enables all loggers that are currently disabled.
• Rta_resetAllLogs() empties the contents of all loggers serviced by Rta. This function does not change the state of the loggers.
124 UIA Configuration and Coding on the Target SPRUH43D—February 2013Submit Documentation Feedback
www.ti.com Target-Side Coding with UIA APIs
Rta provides run-time APIs to control the transmission of data. These APIs are:
• Rta_startTx() tells Rta to begin reading the logs and sending the records to the host.
• Rta_stopTx() tells Rta to stop reading the logs and sending them to the host.
• Rta_snapshotAllLogs() allows the application to delay reading the logs for the specified waitPeriod. The reset parameter tells Rta whether it should reset all the logs.
Note some transports might require the host to send a "connect" request. For example the TransportNdk needs to obtain the IP address of the host before it can send events.
See the ti.uia.services.Rta topic in the online help for more information about these APIs.
5.4.8 Custom Transport Functions for Use with ServiceMgr
The ti.uia.runtime.Transport module defines function prototypes for the transport functions that can be plugged into the ServiceMgr. UIA ships several implementations of this interface in the <uia_install>\packages\ti\uia\sysbios directory.
The transport implementations do not have to be XDC modules. They are simply files containing a set of standard C functions. For an example, see <uia_install>\packages\ti\uia\sysbios\TransportNdk.c. Only one transport set can be used on a target. The functions need to be configured at build time via the ti.uia.runtime.ServiceMgr.transportFxns parameter. The ServiceMgr module plugs the transportFxns automatically if the ti.uia.runtime.ServiceMgr.transportType is set to TransportType_USER.
For example, if you or someone else creates a transport called RapidIO, that transport can be plugged in by setting the transportType parameter to ti.uia.runtime.ServiceMgr.TransportType_USER and then plugging the transportFxns manually. It must also set up the following parameters as directed by the developer of the new transport:
• ServiceMgr.supportControl. Set to true if the transport supports receiving messages from the host. For example TransportFile does not.
• ServiceMgr.maxEventPacketSize. Specify the maximum size of an outgoing event packet. For example TransportNdk uses 1472, which is the EMAC size minus the headers.
• ServiceMgr.maxCtrlPacketSize. Specify the maximum size of the control message packets. This can be zero if supportControl is false.
These three parameters are undefined by default, so they must be set if you are using TransportType_USER.
SPRUH43D—February 2013 UIA Configuration and Coding on the Target 125Submit Documentation Feedback

Target-Side Coding with UIA APIs www.ti.com
The following example shows a configuration script that plugs a transport called "TransportXYZ" into the ServiceMgr module:
var ServiceMgr =
xdc.useModule('ti.uia.runtime.ServiceMgr');
ServiceMgr.transportType = ServiceMgr.TransportType_USER;
var xyzTransport = {
initFxn: '&TransportXYZ_init',
startFxn: '&TransportXYZ_start',
recvFxn: '&TransportXYZ_recv',
sendFxn: '&TransportXYZ_send',
stopFxn: '&TransportXYZ_stop',
exitFxn: '&TransportXYZ_exit',
};
ServiceMgr.transportFxns = xyzTransport;
ServiceMgr.supportControl = true;
ServiceMgr.maxEventPacketSize = 1024
ServiceMgr.maxCtrlPacketSize = 1024;
The following list describes the transport functions. Note that all of these functions are called by the ServiceMgr module. An application should not call these functions directly. The function call syntax is shown in case you are writing your own transport functions.
• initFxn() is called during module startup, which occurs before main() runs. Minimal actions can take place at this point, since interrupts are not yet enabled and the state of the application is just starting up. Generally only internal initialization is performed by this function. This function must have the following call syntax:
Void (*initFxn)();
• startFxn() is called once or twice (depending on whether control messages are supported) after the SYS/BIOS Task threads have started to run.
— This function is called with the UIAPacket_HdrType_EventPkt argument before any events are sent. This allows the transport to initialize anything needed for event transmission. The function returns a handle to a transport-specific structure (or NULL if this is not needed). This handle is passed to the sendFxn() and stopFxn().
— If the transport supports control messages from a host, startFxn() is also called with the UIAPacket_HdrType_Msg argument. This allows the transport to initialize anything needed for message transmission (both sending and receiving). Again, the transport can return a transport-specific structure. This structure can be different from the one that was returned when the UIAPacket_HdrType_EventPkt argument was passed to startFxn().
This function must have the following call syntax:
Ptr (*startFxn)(UIAPacket_HdrType);
• recvFxn() is called to receive incoming messages from the host. The handle returned by the startFxn() is passed to the recvFxn(). Also passed in is a buffer and its size. The buffer is passed in as a double pointer. This allows the transport to double-buffer. For example, the recvFxn() can return a different buffer than the one it was passed. This potentially reduces extra copies of the data. The
126 UIA Configuration and Coding on the Target SPRUH43D—February 2013Submit Documentation Feedback

www.ti.com Target-Side Coding with UIA APIs
recvFxn() can be a blocking call. The recvFxn() returns the actual number of bytes that are placed into the buffer. If the transport does not support control messages, this function can simply return zero. This function must have the following call syntax:
SizeT (*recvFxn)(Ptr, UIAPacket_Hdr**, SizeT);
• sendFxn() is called to send either events or messages. If sendFxn() is called to transmit an event, the first parameter is the handle returned from the startFxn(UIAPacket_HdrType_EventPkt) call. Similarly, if a message is being sent, the first parameter is the handle returned from the startFxn(UIAPacket_HdrType_Msg) call. The size of the packet is maintained in the UIAPacket_Hdr. The sendFxn() can be a blocking call. This function returns true or false to indicate whether the send was successful or not. Again, a double pointer is used to allow the transport to return a different buffer to allow double-buffering. This function must have the following call syntax:
Bool (*sendFxn)(Ptr, UIAPacket_Hdr**);
• stopFxn() is the counterpart to the startFxn() function. The stopFxn() is called the same number of times as the startFxn(). The calls will pass the handles returned by the startFxn(). This function must have the following call syntax:
Void (*stopFxn)(Ptr);
• exitFxn() is the counterpart to the initFxn() function. This function must have the following call syntax:
Void (*exitFxn)(Void);
Transports are allowed to have additional functions that can be directly called by the application. For example in the provided TransportFile transport, there is a TransportFile_setFile() function. The downside to adding extended functions is that subsequent ports to a different transport will require changes to the application code.
SPRUH43D—February 2013 UIA Configuration and Coding on the Target 127Submit Documentation Feedback
Chapter 6
Advanced Topics for System Analyzer
This chapter provides additional information about using System Analyzer components.
6.1 IPC and SysLink Usage . . . . . . . . . . . . . . . . . . . . . . . . . . . . . . . . . . . 129
6.2 Linux Support for UIA Packet Routing . . . . . . . . . . . . . . . . . . . . . . . 130
6.3 Rebuilding Target-Side UIA Modules . . . . . . . . . . . . . . . . . . . . . . . . 131
6.4 Benchmarks. . . . . . . . . . . . . . . . . . . . . . . . . . . . . . . . . . . . . . . . . . . . . 133
Topic Page
128 Advanced Topics for System Analyzer SPRUH43D—February 2013Submit Documentation Feedback

www.ti.com IPC and SysLink Usage
6.1 IPC and SysLink Usage
This section lists the IPC and SysLink modules used on various types of cores by UIA. It describes how they are used.
DSP/Video/VPSS
On a DSP, Video, or VPSS core, the ti.uia.runtime.ServiceMgr module uses the following IPC modules.
• MessageQ. The ServiceMgr proxy creates four message queues. Two are used to maintaining "free" messages. These are using instead of allocating messages from a heap.
• SharedRegion. The ServiceMgr proxy allocates memory from the SharedRegion at startup time. It places these buffers onto the "free" message queues. Which SharedRegion to use is configurable.
• MultiProc. The ServiceMgr proxy uses this module to identify the cores.
• Ipc. The ServiceMgr proxy uses the userFxn hook to make sure Ipc is started before UIA tries to use it.
See Section 5.3.8, Configuring IPC for more information.
Note: The examples provided with UIA do not use IPC explicitly. They were designed this way to make porting easier.
Linux ServiceMgr Module
In a core running Linux, the Linux ServiceMgr module uses IPC modules as follows:
• MessageQ. ServiceMgr creates two message queues. One is used to maintain "free" messages. These message queues are used instead of allocating messages from a heap.
• SharedRegion. ServiceMgr allocates memory from SharedRegion at startup time. It places these buffers onto the "free" message queue. Which SharedRegion to use is configurable.
• MultiProc. ServiceMgr uses this module to identify the cores.
Linux Application
A Linux application running on a Linux master core uses the following SysLink modules:
• SysLink. Used for setup and destroy calls.
• ProcMgrApp. Used to load the other cores.
SPRUH43D—February 2013 Advanced Topics for System Analyzer 129Submit Documentation Feedback

Linux Support for UIA Packet Routing www.ti.com
6.2 Linux Support for UIA Packet Routing
UIA currently supports the routing of UIA packets on Linux. By default, events are sent out from the Linux core over Ethernet. They are not written to a file by default.
Support for logging on Linux is currently available if you are using the LoggerSM shared memory logger implementation on the EVMTI816x platform. See Section 5.3.5, Configuring ti.uia.runtime.LoggerSM.
To use this routing capability, the ti\uia\linux\bin\servicemgr.a library must be linked into your Linux application. The Linux application must call the ServiceMgr_start() API after Ipc has been initialized. If must also call the ServiceMgr_stop() API before Ipc is shutdown. For example code, see the <uia_install>packages\ti\uia\examples\evmti816x\uiaDemo.c file.
Since the ServiceMgr on Linux is not an XDC module, you configure it using the ServiceMgr_setConfig() API. There is also a corresponding ServiceMgr_getConfig() API. Both functions are passed the following configuration structure, which is specified in the ServiceMgr.h file:
typedef struct ServiceMgr_Config {
Int maxCtrlPacketSize;
Int numIncomingCtrlPacketBufs;
Int sharedRegionId;
Char fileName[128];
} ServiceMgr_Config;
Refer to the ServiceMgr.h file for details about the parameters.
If you do not call ServiceMgr_setconfig(), no usable defaults are supplied.
The uiaDemo.c Linux application example basically performs the following steps:
main()
{
SysLink_setup()
ProcMgrApp_startup() //on all cores specified on cmdline
ServiceMgr_start()
Osal_printf("\nOpen DVT and start getting events." \
"[Press Enter to shutdown the demo.]\n");
ch = getchar();
ServiceMgr_stop()
ProcMgrApp_shutdown() //on all cores specified on cmdline
SysLink_destroy()
}
130 Advanced Topics for System Analyzer SPRUH43D—February 2013Submit Documentation Feedback
www.ti.com Rebuilding Target-Side UIA Modules
6.3 Rebuilding Target-Side UIA Modules
Rebuilding UIA itself from the provided source files is straightforward, whether you are using the TI compiler toolchain or the GNU GCC toolchain. UIA ships with a uia.mak file in the top-level installation directory. This makefile enables you to easily (re)build UIA using your choice of compilers and desired "targets". A target incorporates a particular ISA and a runtime model; for example, cortex-M3 and the GCC compiler with specific options.
The instructions in this section can be used to build UIA applications on Windows or Linux. If you are using a Windows machine, you can use the regular DOS command shell provided with Windows. However, you may want to install a Unix-like shell, such as Cygwin.
For Windows users, the XDCtools top-level installation directory contains gmake.exe, which is used in the commands that follow to run the Makefile. The gmake utility is a Windows version of the standard GNU "make" utility provided with Linux.
If you are using Linux, change the "gmake" command to "make" in the commands that follow.
For these instructions, suppose you have the following directories:
• $BASE/uia_1_##_##_## — The location where you installed UIA.
• $BASE/copy-uia_1_##_##_## — The location of a copy of the UIA installation.
• $BASE/xdctools_3_##_##_## — The location where you installed XDCtools.
• $TOOLS/gcc/bin/arm-none-eabi-gcc — The location of a compiler. This is a GCC compiler for M3.
The following steps refer to the top-level directory of the XDCtools installation as <xdc_install_dir>. They refer to the top-level directory of the copy of the UIA installation as <uiacopy_install_dir>.
Follow these steps to rebuild UIA:
1. If you have not already done so, install XDCtools, SYS/BIOS, and UIA.
2. Make a copy of the UIA installation you will use when rebuilding. This leaves you with an unmodified installation as a backup. For example, use commands similar to the following on Windows:
Or, use the a command similar to the following on Linux:
3. Make sure you have access to compilers for any targets for which you want to be able be able to build applications using the rebuilt UIA. Note the path to the directory containing the executable for each compiler. These compilers can include Texas Instruments compilers, GCC compilers, and any other command-line compilers for any targets supported by UIA.
4. If you are using Windows and the gmake utility provided in the top-level directory of the XDCtools installation, you should add the <xdc_install_dir> to your PATH environment variable so that the gmake executable can be found.
5. You may remove the top-level doc directory located in <uiacopy_install_dir>/docs if you need to save disk space.
6. At this point, you may want to add the remaining files in the UIA installation tree to your Software Configuration Management (SCM) system.
mkdir c:\ti\copy-uia_1_##_#_##
copy c:\ti\uia_1_##_##_## c:\ti\copy-uia_1_##_##_##
cp -r $BASE/uia_1_##_##_##/* $BASE/copy-uia_1_##_##_##
SPRUH43D—February 2013 Advanced Topics for System Analyzer 131Submit Documentation Feedback

Rebuilding Target-Side UIA Modules www.ti.com
7. Open the <uiacopy_install_dir>/uia.mak file with a text editor, and make the following changes for any options you want to hardcode in the file. (You can also set these options on the command line if you want to override the settings in the uia.mak file.)
— Ignore the following lines near the beginning of the file. These definitions are used internally, but few users will have a need to change them.
— Specify the locations of XDCtools, SYS/BIOS, IPC, and the NDK. For example:
— Specify the location of the compiler executable for all targets you want to be able to build for with UIA. Use only the directory path; do not include the name of the executable file. Any targets for which you do not specify a compiler location will be skipped during the build. For example, on Linux you might specify the following:
Similarly, on Windows you might specify the following compiler locations:
— If you need to add any repositories to your XDCPATH (for example, to reference the packages directory of another component), you should edit the XDCPATH definition.
— You can uncomment the line that sets XDCOPTIONS to “v” if you want more information output during the build.
8. Clean the UIA installation with the following commands. (If you are running the build on Linux, change all "gmake" commands to "make".)
9. Run the uia.mak file to build UIA as follows. (Remember, if you are running the build on Linux, change all "gmake" commands to "make".)
10. If you want to specify options on the command line to override the settings in uia.mak, use a command similar to the following.
# Where to install/stage the packages
# Typically this would point to the devkit location
#
DESTDIR ?= <UNDEFINED>
packagesdir ?= /packages
libdir ?= /lib
includedir ?= /include
XDC_INSTALL_DIR ?= $(BASE)/xdctools_3_##_##_##
BIOS_INSTALL_DIR ?= $(BASE)/bios_6_##_##_##
IPC_INSTALL_DIR ?= $(BASE)/ipc_1_##_##_##
NDK_INSTALL_DIR ?= $(BASE)/ndk_2_##_##_##
ti.targets.C28_float ?= /opt/ti/ccsv5/tools/compiler/c2000
ti.targets.arm.elf.M3 ?= /opt/ti/ccsv5/tools/compiler/tms470
ti.targets.C28_float ?= c:/ti/ccsv5/tools/compiler/c2000
ti.targets.arm.elf.M3 ?= c:/ti/ccsv5/tools/compiler/tms470
cd <uiacopy_install_dir>
gmake -f uia.mak clean
gmake -f uia.mak
gmake -f uia.mak XDC_INSTALL_DIR=<xdc_install_dir> ti.targets.C28_float=<compiler_path>
132 Advanced Topics for System Analyzer SPRUH43D—February 2013Submit Documentation Feedback

www.ti.com Benchmarks
6.4 Benchmarks
Benchmark testing was performed for a SYS/BIOS application with UIA load and event logging on the EVMTI816x and the EVM6472.
6.4.1 UIA Benchmarks for EVM6472
The benchmark test loads each core to 50% with application code. The ti.sysbios.utils.Load module records both Task and CPU loads. All communication to the instrumentation host is done by core 0 via the NDK.
Each UDP holds about 60 Log event records. For the test, both L1D and L1P caches were enabled. Code was placed in SL2, and data in LL2. The program was built for whole_program_debug.
The application calls Log_print() twice every millisecond. The CPU and Task load information is collected every 500ms. Rta send events every 100ms.
Table 6–1. Benchmarking Results for EVM6472, Tests 1 and 2
6.4.2 UIA Benchmarks for EVMTI816x
The simpleTask.c EVMTI816x example, which is provided in the <uia_install>\packages\ti\uia\examples\evmti816x directory, has a Task thread on each core (DSP, Video, VPSS) that runs an algorithm to flip the bits on a large buffer every millisecond. The Task is released by a Clock function that posts a semaphore. The example logs a UIABenchmark_start/UIABenchmark_stop event before and after running the algorithm.
For the first test, load events were logged every 500 ms, and UIABenchmark events were performed around the algorithm. The number of UDP packets/second was 126, and the number of events/second was around 8000. The CPU loads obtained from these events and "top" on Linux are provided in the following table.
Only Core 0 sending events
All cores sending events (via core 0)
# UDP packets: 36/sec # UDP packets: 214/sec
Avg Packet Size: 1250 bytes Avg Packet Size : 1250 bytes
App load (core 0) : 50.1% App load (core 0): 50.0 %
Idle (core 0): 49.8% Idle (core 0): 49.2%
UIA (core 0): >.1% UIA (core 0): .5%
Hwi/Swi/Ndk/misc .1% Hwi/Swi/Ndk/misc .3%
Results for other cores:
Application load: 50.1%
Idle: 49.8%
UIA (core n): >.1%
Hwi/Swi/misc .1%
SPRUH43D—February 2013 Advanced Topics for System Analyzer 133Submit Documentation Feedback
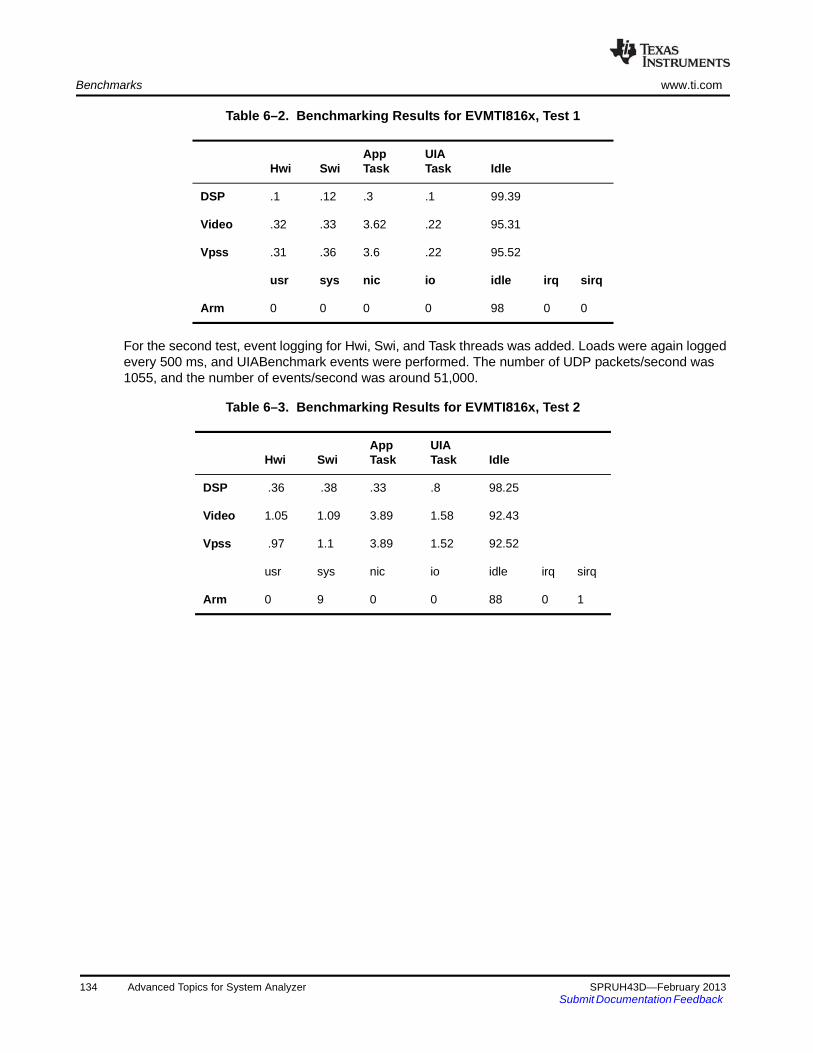
Benchmarks www.ti.com
Table 6–2. Benchmarking Results for EVMTI816x, Test 1
For the second test, event logging for Hwi, Swi, and Task threads was added. Loads were again logged every 500 ms, and UIABenchmark events were performed. The number of UDP packets/second was 1055, and the number of events/second was around 51,000.
Table 6–3. Benchmarking Results for EVMTI816x, Test 2
Hwi SwiApp Task
UIA Task Idle
DSP .1 .12 .3 .1 99.39
Video .32 .33 3.62 .22 95.31
Vpss .31 .36 3.6 .22 95.52
usr sys nic io idle irq sirq
Arm 0 0 0 0 98 0 0
Hwi SwiApp Task
UIA Task Idle
DSP .36 .38 .33 .8 98.25
Video 1.05 1.09 3.89 1.58 92.43
Vpss .97 1.1 3.89 1.52 92.52
usr sys nic io idle irq sirq
Arm 0 9 0 0 88 0 1
134 Advanced Topics for System Analyzer SPRUH43D—February 2013Submit Documentation Feedback

Index
%$F formatting specifier 121%$S formatting specifier 121
AAgent module
removing 92alignment, shared memory 109ALWAYS_ON/OFF diagnostics setting 119ANALYSIS bit in diagnostics mask 97, 119, 120Analysis Feature
definition 10opening 49types 48
Analyze menu 64ASSERT bit in diagnostics mask 97Auto Fit Columns command 63Auto Scroll command 64Auto-detect configuration field 45, 59AuxData column 68, 70
Bbenchmarking
events 120roadmap 27
benefitsnew Rta module 102System Analyzer 8UIA 9
Binary File Parameters dialog 59binary files 57
creating on Linux 111opening 58
Bookmark Mode command 37, 63bookmarks 37bufSection parameter 106, 110
Ccaching, and shared memory 108cannot connect to the target 28CCS
definition 10installation 18project templates 31version 5 required 18
CDOC help 16circular buffers 106Clear Log View command 52Clock freq (MHz) field 56clocks 103
CPU 117
frequency 115Close Session command 52, 53, 63Code Generation Tools 18Column Settings command 63communication diagram 13component diagram 13Concurrency 65
Graph view 65how it works 66Summary view 66
configurationlogging 95quick steps 92see also UIA configuration 54UIA modules 98using XGCONF 93
Connect command 52Context Aware Profile 77
Detail view 78how it works 80roadmap 27Summary view 77, 79
context change logging 124Control and Status Transport 54control packets 105Copy command 64core
definition 10selecting in analysis view 46, 51, 57, 60
correlation of event times 114Count Analysis 67
Detail view 68Graph view 69how it works 70roadmap 25Summary view 67
CPU Load 70Detail view 72Graph view 71how it works 72roadmap 22Summary view 71
CpuClockFreq parameters 115CpuTimestampProxy parameter 93, 115, 117critical events 107CSV File Parameters dialog 57CSV files 57
exporting 42, 64opening 57sample 57
Cycles per tick field 56
SPRUH43D—February 2013 Index 135Submit Documentation Feedback

www.ti.com
Ddata collection 47Data Export command 64data loss 29
Context Aware Profile 81Duration 86
Data1 column 62Data2 column 62DataValue column 68, 70decode parameter 109definitions 10deployed system 21Detail view
Context Aware Profile 78Count Analysis 68CPU Load 72Duration Analysis 84Task Load 76
Device Variant 33diagnostics mask 97, 119
diags_ENTRY 96diags_EXIT 96diags_USER1 97diags_USER2 97diags_USER4 95load logging 95run-time setting 98
Diags module 95Diags_setMask() function 120disabling
event logging 96load logging 95
Domain column 62downloading installers 16Doxygen 16dropped
events 29, 86packets 29
Duration Analysis 82Detail view 84Graph view 85how it works 85roadmap 27Summary view 83
DVTdefinition 10graph views 35
EEnable Grouping command 63, 64enabling event logging 96endianness, shared memory 109endpoint 54, 55EndPoint Address field 56ENTRY bit in diagnostics mask 97Error column 61errors
events 121Ethernet 104
libraries 32packet size 105
Event column 62event correlation 114event logging 96
disabling 96enabling 96
event packets 105Event Transport 54EventClass column 62EventLevel setting 121events 120
definition 10dropped 29logging 118not shown 29
eventUploadMode parameter 99EVM6472
benchmark results 133communication 14examples 31, 32GlobalTimestampProxy parameter 115routing 93
EVMTI816xbenchmark results 133communication 15examples 31, 33GlobalTimestampProxy parameter 115routing 93shared memory logger 108
examples 31CSV file 57
exclusive time 77, 78, 80Execution Graph 88
Graph view 88how it works 89roadmap 24
EXIT bit in diagnostics mask 97Export Data command 42, 64
Ffile
.uia.xml file 56creating binary on Linux 111executable .out file 56opening binary file 58opening CSV file 57
File over JTAG 104FILE transport 54Filter command 40, 63Find In command 38, 63folder
save data to 47frequency of clocks 115
GGEM (Generalized Embedded Megamodule) 116GemTraceSync module 116GlobalClockFreq parameters 115GlobalTimestampProxy parameter 93, 115glossary 10gmake utility 131
136 Index SPRUH43D—February 2013Submit Documentation Feedback

www.ti.com
Graph viewConcurrency 65Count Analysis 69CPU Load 71Duration Analysis 85Execution Graph 88Task Load 74
Groups command 38
Hhardware trace 116help 16host
communication 13definition 10
Hwi moduledisabling event logging 96disabling load logging 95enabling event logging 96
Iinclusive time 77, 78, 80INFO bit in diagnostics mask 97, 121injectIntoTraceFxn parameter 116instrumentation
background 8methods 11
INTERNAL bit in diagnostics mask 97IP address 55IPC
configuring 93, 118definition 10resources used by UIA 118, 129version 18
Ipc module 129
JJTAG 104
definition 11transport 54upload mode 12, 100
LLIFECYCLE bit in diagnostics mask 97line graph views 135Linux 108
LoggerSM module 108packet routing 130
Linux developer 21Live command, System Analyzer menu 45Live Parameters dialog 45live session 45Load logger 101load logging 95Load module 95loadLoggerSize parameter 102Local Time column 62Log module 119
Log view 61Log_writeX() functions 119LogCtxChg module 124Logger column 62logger instances 101LoggerBuf module, removing 92LoggerCircBuf module 101, 106LoggerIdle module 101LoggerProbePoint module 101loggers
LoggerCircBuf 106LoggerSM 108
loggerSM memory section 110LoggerSM module
for Linux 108, 111for non-Linux 108
LoggerSM_run() function 111LoggerSM_setName() function 111loggerSMDump tool 111LoggerStopMode module 101LoggingSetup module 92, 95, 98
diagnostics settings 119disabling load logging 95
LogSnapshot module 122LogSnapshot_getSnapshotId() function 122LogSnapshot_writeMemoryBlock() function 122LogSnapshot_writeNameOfReference() function 122, 123LogSnapshot_writeString() function 122, 123LogSync module 114, 123
Mmacros 11MADU
definition 11shared memory 109
Main logger 101mainLoggerSize parameter 102make utility 131Manage the Bookmarks command 63Master column 62master core 104masterProcId parameter 104, 105MCSDK installation 18measurement markers 36memory map 110memory section 110Message column 62message events 121message packets 105MessageQ module 15, 104, 118, 129messages, definition 10metadata files 56missing date 86Module column 62multicore applications 92MultiProc module 129
NNDK 18, 92, 104
definition 11
SPRUH43D—February 2013 Index 137Submit Documentation Feedback

www.ti.com
transport 14numCores parameter 107numEventPacketBufs parameter 105numIncomingCtrlPacketBufs parameter 105numOutgoingCtrlPacketBufs parameter 105numPartitions parameter 109
Oonline documentation 16overwrite parameter 110
Ppackets 105
dropped 29size for IPC 118
partitionID parameter 109Pause/Resume command 52PDK 18
Ethernet libraries 32Percent column 83periodInMs parameter 102physical communication 92platform file 110port name 45Port Number field 55print statements 8Printf Logs 73Probe Point mode 12, 100probe points 99ProcMgrApp module 129project templates 31
Rregular expression 39Reset command 53resetting logs 124Resume command 53roadmaps
benchmarking 27Context Aware Profile 27Count Analysis 25Duration 27Execution Graph 24system loading 22
routing of packets 104, 130Row Count command 63Rta module 102
APIs 124communication 13
Rta_disableAllLogs() function 124Rta_enableAllLogs() function 124Rta_resetAllLogs() function 124Rta_snapshotAllLogs() function 125Rta_startTx() function 125Rta_stopTx() function 125.rta.xml file 56RTDX
not supported 12removing 92
RtdxDvr module 92RtdxModule module, removing 92RTSC, definition 11RTSC-Pedia 16Run command 52RUNTIME_ON/OFF diagnostics setting 120
Ssample projects 31saSampleData.csv file 57scaling graph 36Scroll Lock command 52, 63scrolling 42
synchronously 38sections in memory 110SeqNo column 62service, definition 10ServiceMgr framework 12ServiceMgr module 103
communication 13Linux 129, 130transportType parameter 125
ServiceMgr_setConfig() function 130session
managing 52removing 53starting live 45
shared memory 108non-cacheable 108
sharedMemorySize parameter 109SharedRegion module 118, 129simulator 99
mode 12, 100snapshot logging 122spreadsheet, further analysis 26, 42, 68statistical analysis 26, 64, 68statistics logging 121STATUS bit in diagnostics mask 97, 121STM transport 54Stop command 52Stopmode JTAG monitor field 56Summary view
Concurrency 66Context Aware Profile 77, 79Count Analysis 67CPU Load 71Duration Analysis 83Task Load 75Task Profiler 73, 86
supportControl parameter 105, 125Swi module
disabling event logging 96disabling load logging 95enabling event logging 96
synchronizing views 38SYS/BIOS
clock 103definition 11version 18
SYSBIOS System logger 101sysbiosLoggerSize parameter 102SysLink 18
138 Index SPRUH43D—February 2013Submit Documentation Feedback
www.ti.com
communication 15definition 11including in project 33
SysLink module 129, 130System Analyzer
benefits 8definition 10features 44
System Analyzer configurationsaving 56
System Analyzer menuLive command 45
system requirements 18systemAnalyzerData folder 47
Ttable views 35target
communication 13definition 10supported 18
Task Load 74Detail view 76Graph view 74how it works 76roadmap 22Summary view 75
Task moduledisabling event logging 96disabling load logging 95enabling event logging 96priority 105
Task Profiler 86Summary view 73, 86
Task threads 105TCI6616
communication 15GlobalTimestampProxy parameter 115
TCP port 55TCPIP transport 54template projects 31terminology 10TI E2E Community 16TI Embedded Processors Wiki 16ticks 103time 103Time column 61, 68, 72timer
global proxy 115local proxy 115
TimestampC6472Timer module 115TimestampC64XLocal module 115TimestampC66XLocal module 115TimestampDM816XTimer module 115TimestampProvider module 115timestamps 114, 123toolbar icons 63topology parameter 92, 104transferBufSize parameter 106Transport module 125Transport Type 54transports
communication 13custom 125functions 126
transportType parameter 104troubleshooting 28Type column 61
UUART
definition 11transport 45, 54
UDP port 55UDP transport 54UIA 10
benefits 9further information about 16outside CCS 19
UIA Config command 54UIA configuration
loading 56using 45, 59
UIA packets, definition 10UIA Statistic module 121uia.mak file 131.uia.xml file 56UIABenchmark module 120UIABenchmark_start event 85, 119UIABenchmark_startInstanceWithAdrs event 80UIABenchmark_stop event 85, 119UIABenchmark_stopInstanceWithAdrs event 80uiaDemo.c example for Linux 130UIAErr module 121UIAEvt module 121UIAEvt_intWithKey event 70UIAMessage module 121upload mode 99use cases 21USER bits in diagnostics mask 97user types 21
Vviews, types 35
Wwiki links 16wrapper functions 11
XXDCtools
definition 11version 18
XGCONF tool 93
Zzooming 36
SPRUH43D—February 2013 Index 139Submit Documentation Feedback

IMPORTANT NOTICE
Texas Instruments Incorporated and its subsidiaries (TI) reserve the right to make corrections, modifications, enhancements, improvements, and other changes to its semiconductor products and services per JESD46C and to discontinue any product or service per JESD48B. Buyers should obtain the latest relevant information before placing orders and should verify that such information is current and complete. All semiconductor products are sold subject to TI's terms and conditions of sale supplied at the time of order acknowledgment.
TI warrants performance of its components to the specifications applicable at the time of sale, in accordance with the warranty in TI’s terms and conditions of sale of semiconductor products. Testing and other quality control techniques are used to the extent TI deems necessary to support this warranty. Except where mandated by applicable law, testing of all parameters of each component is not necessarily performed.
TI assumes no liability for applications assistance or the design of Buyers’ products. Buyers are responsible for their products and applications using TI components. To minimize the risks associated with Buyers’ products and applications, Buyers should provide adequate design and operating safeguards.
TI does not warrant or represent that any license, either express or implied, is granted under any patent right, copyright, mask work right, or other intellectual property right relating to any combination, machine, or process in which TI components or services are used. Information published by TI regarding third-party products or services does not constitute a license to use such products or services or a warranty or endorsement thereof. Use of such information may require a license from a third party under the patents or other intellectual property of the third party, or a license from TI under the patents or other intellectual property of TI.
Reproduction of significant portions of TI information in TI data books or data sheets is permissible only if reproduction is without alteration and is accompanied by all associated warranties, conditions, limitations, and notices. TI is not responsible or liable for such altered documentation. Information of third parties may be subject to additional restrictions.
Resale of TI components or services with statements different from or beyond the parameters stated by TI for that component or service voids all express and any implied warranties for the associated TI component or service and is an unfair and deceptive business practice. TI is not responsible or liable for any such statements.
Buyer acknowledges and agrees that it is solely responsible for compliance with all legal, regulatory and safety-related require-ments concerning its products, and any use of TI components in its applications, notwithstanding any applications-related infor-mation or support that may be provided by TI. Buyer represents and agrees that it has all the necessary expertise to create and implement safeguards which anticipate dangerous consequences of failures, monitor failures and their consequences, lessen the likelihood of failures that might cause harm and take appropriate remedial actions. Buyer will fully indemnify TI and its representatives against any damages arising out of the use of any TI components in safety-critical applications.
In some cases, TI components may be promoted specifically to facilitate safety-related applications. With such components, TI’s goal is to help enable customers to design and create their own end-product solutions that meet applicable functional safety standards and requirements. Nonetheless, such components are subject to these terms.
No TI components are authorized for use in FDA Class III (or similar life-critical medical equipment) unless authorized officers of the parties have executed a special agreement specifically governing such use.
Only those TI components which TI has specifically designated as military grade or “enhanced plastic” are designed and intended for use in military/aerospace applications or environments. Buyer acknowledges and agrees that any military or aerospace use of TI components which have not been so designated is solely at the Buyer's risk, and that Buyer is solely responsible for compliance with all legal and regulatory requirements in connection with such use.
TI has specifically designated certain components which meet ISO/TS16949 requirements, mainly for automotive use. Compo-nents which have not been so designated are neither designed nor intended for automotive use; and TI will not be responsible for any failure of such components to meet such requirements.
Mailing Address: Texas Instruments, Post Office Box 655303 Dallas, Texas 75265Copyright © 2013, Texas Instruments Incorporated
Products Applications
Audio www.ti.com/audio Automotive and Transportation www.ti.com/automotive
Amplifiers amplifier.ti.com Communications and Telecom www.ti.com/communications
Data Converters dataconverter.ti.com Computers and Peripherals www.ti.com/computers
DLP® Products www.dlp.com Consumer Electronics www.ti.com/consumer-apps
DSP dsp.ti.com Energy and Lighting www.ti.com/energy
Clocks and Timers www.ti.com/clocks Industrial www.ti.com/industrial
Interface interface.ti.com Medical www.ti.com/medical
Logic logic.ti.com Security www.ti.com/security
Power Mgmt power.ti.com Space, Avionics and Defense www.ti.com/space-avionics-defense
Microcontrollers microcontroller.ti.com Video & Imaging www.ti.com/video
RFID www.ti-rfid.com
OMAP Mobile Processors www.ti.com/omap TI E2E Community e2e.ti.com
Wireless Connectivity www.ti.com/wirelessconnectivity