synthetic tunable amplifying buffer circuit in e. coli
TRANSCRIPT

Subscriber access provided by UNIV NORTH CAROLINA GREENSBORO
ACS Synthetic Biology is published by the American Chemical Society. 1155 SixteenthStreet N.W., Washington, DC 20036Published by American Chemical Society. Copyright © American Chemical Society.However, no copyright claim is made to original U.S. Government works, or worksproduced by employees of any Commonwealth realm Crown government in the courseof their duties.
Article
A Synthetic Tunable Amplifying Buffer Circuit in E. coliKayzad Soli Nilgiriwala, José Jiménez, Phillip Michael Rivera, and Domitilla Del Vecchio
ACS Synth. Biol., Just Accepted Manuscript • DOI: 10.1021/sb5002533 • Publication Date (Web): 03 Oct 2014
Downloaded from http://pubs.acs.org on October 6, 2014
Just Accepted
“Just Accepted” manuscripts have been peer-reviewed and accepted for publication. They are postedonline prior to technical editing, formatting for publication and author proofing. The American ChemicalSociety provides “Just Accepted” as a free service to the research community to expedite thedissemination of scientific material as soon as possible after acceptance. “Just Accepted” manuscriptsappear in full in PDF format accompanied by an HTML abstract. “Just Accepted” manuscripts have beenfully peer reviewed, but should not be considered the official version of record. They are accessible to allreaders and citable by the Digital Object Identifier (DOI®). “Just Accepted” is an optional service offeredto authors. Therefore, the “Just Accepted” Web site may not include all articles that will be publishedin the journal. After a manuscript is technically edited and formatted, it will be removed from the “JustAccepted” Web site and published as an ASAP article. Note that technical editing may introduce minorchanges to the manuscript text and/or graphics which could affect content, and all legal disclaimersand ethical guidelines that apply to the journal pertain. ACS cannot be held responsible for errorsor consequences arising from the use of information contained in these “Just Accepted” manuscripts.
1
ARTICLE TITLE
A Synthetic Tunable Amplifying Buffer Circuit in E. coli
AUTHORS
Kayzad Soli Nilgiriwala1, José Jiménez1,2, Phillip Michael Rivera1, and Domitilla Del
Vecchio1,*
ADDRESSES
1Department of Mechanical Engineering,
Massachusetts Institute of Technology,
77 Massachusetts Avenue,
Cambridge, MA02139-4307, USA.
2Present address: Faculty of Health and Medical Sciences, University of Surrey,
Guildford, Surrey GU2 7XH, UK.
*CORRESPONDING AUTHOR
Prof. Domitilla Del Vecchio
Room 3-455B, Department of Mechanical Engineering,
Massachusetts Institute of Technology,
77 Massachusetts Avenue, Cambridge, MA 02139-4307, USA.
Phone: +1-617-452-2275.
E-mail: [email protected]
Page 1 of 24
ACS Paragon Plus Environment
ACS Synthetic Biology
123456789101112131415161718192021222324252627282930313233343536373839404142434445464748495051525354555657585960
2
Abstract
While predictable design of a genetic circuit’s output is a major goal of synthetic
biology, it remains a significant challenge because DNA binding sites in the cell affect
the concentration of available transcription factors (TF). To mitigate this problem,
we propose to use a TF that results from the (reversible) phosphorylation of protein
substrate as a circuit’s output. We demonstrate that by comparatively increasing the
amounts of substrate and phosphatase, the TF concentration becomes robust to the
presence of DNA binding sites and can be kept at a desired value. The circuit’s
input/output gain can in turn be tuned by changing the relative amounts of the
substrate and phosphatase, realizing an amplifying buffer circuit with tunable gain.
In our experiments in E. coli, we employ phospho-NRI as the output TF,
phosphorylated by the NRII kinase and dephosphorylated by the NRII phosphatase.
Amplifying buffer circuits such as ours could be used to insulate a circuit’s output
from the context, bringing synthetic biology one step closer to modular design.
Keywords
Escherichia coli; genetic circuit; transcription factor; NRI; NRII; insulation
Page 2 of 24
ACS Paragon Plus Environment
ACS Synthetic Biology
123456789101112131415161718192021222324252627282930313233343536373839404142434445464748495051525354555657585960
3
INTRODUCTION
A major goal of synthetic biology is to create a library of devices whose output is
essentially independent of the device’s connectivity and context.1-3 The output of a
device is usually a TF, which binds both, specifically to sites on the promoters that it
regulates and non-specifically to a large number of additional DNA sites in the cell.4
It has been demonstrated theoretically and experimentally that the concentration of
a TF is substantially affected by the DNA sites to which it binds.5-9 Experiments in E.
coli have shown that DNA binding sites can cause a substantial slowdown of the
temporal response of a device’s output to input stimuli.6 The steady state response
of a device’s output is especially affected by DNA binding sites, with resulting
phenomena such as ultrasensitivity and thresholding.7-9 In general, the dependence
of a gene’s input/output relation on the targets of the output has been termed
‘‘retroactivity’’ to generalize the concept of loading to non-electrical circuits.5, 10
Because of retroactivity, the output of a genetic device may vary significantly
depending on the context, which includes the connectivity to other devices and the
specific bacterial strain.11 This fact requires to re-optimize a circuit whenever it is
placed in a different context, leading to a lengthy design process.
Here, we demonstrate that the steady state concentration of a TF can be rendered
practically insensitive to the presence of DNA binding sites if such a TF results from
the kinase-mediated reversible phosphorylation of an otherwise inactive protein
substrate (Fig. 1A). Increased values of substrate lead to larger output values for the
same kinase concentration and, as a consequence, the DNA binding sites have less of
an effect on the concentration of the output TF. However, larger amounts of
substrate lead to increased values of the input/output “gain” of the dose response
curve from kinase concentration to TF concentration. The original gain can be
restored by increasing the concentration of phosphatase. In summary, by
comparatively increasing the amounts of substrate and phosphatase, we make a
prescribed input/output dose response curve robust to the presence of the output
TF DNA binding sites (Fig. 1B).
Hundreds of two-component signaling systems (TCSs) have been discovered in
bacteria and many of them have been studied in great depth over the past few
decades.12-18 These TCSs form an essential component of signaling systems and play
an indispensable role in the survival and proliferation of all prokaryotes beyond any
doubt. In a TCS, signal is received and transmitted by the sensor kinase (SK) protein,
which is usually a membrane bound homodimeric protein kinase that
autophosphorylates itself.19 Following the input signal and autophosphorylation of
the kinase, the phosphoryl group is transferred to the response regulator (RR),
which in turn activates the expression of the required genes. The amplifying buffer
circuit that we propose in this paper is based on one of the essential and most
studied TCS that forms the backbone of nitrogen regulation in Escherichia coli and
which is responsible for regulating around 2% of the chromosomal genes during a
nitrogen stress response,20 indicating that it may naturally encounter substantial
retroactivity. We chose this system as its behavior has been studied extensively and
Page 3 of 24
ACS Paragon Plus Environment
ACS Synthetic Biology
123456789101112131415161718192021222324252627282930313233343536373839404142434445464748495051525354555657585960

4
the underlying molecular mechanisms and biochemical parameters have been well
characterized.19, 21-23 We constructed a synthetic NtrB-NtrC (SK-RR)
phosphorylation cycle wherein the RR NRI can be expressed at four different levels
and the NRII phosphatase can be induced via IPTG. We then examined the dose
response curve by inducing the NRII kinase via aTc and measuring the
concentration of phospho-NRI through a GFP reporter, in the presence and absence
of phospho-NRI DNA binding sites, for high and low values of NRI and NRII
phosphatase concentrations.
Page 4 of 24
ACS Paragon Plus Environment
ACS Synthetic Biology
123456789101112131415161718192021222324252627282930313233343536373839404142434445464748495051525354555657585960
5
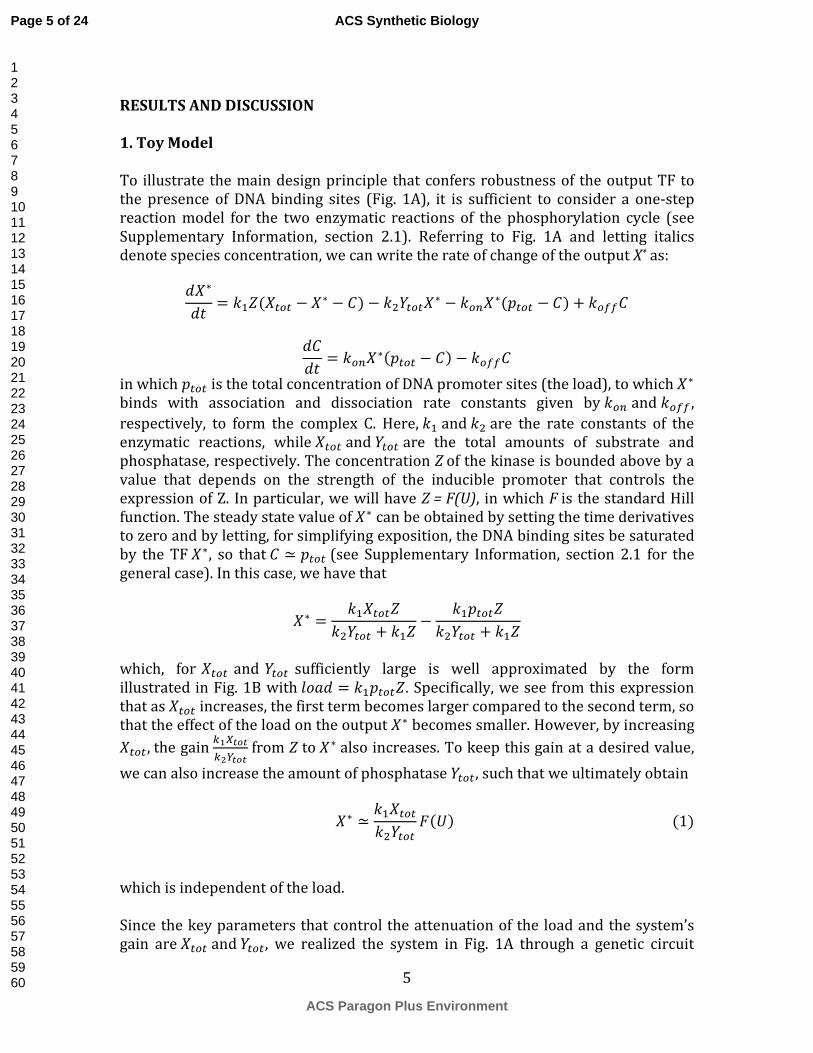
RESULTS AND DISCUSSION
1. Toy Model
To illustrate the main design principle that confers robustness of the output TF to
the presence of DNA binding sites (Fig. 1A), it is sufficient to consider a one-step
reaction model for the two enzymatic reactions of the phosphorylation cycle (see
Supplementary Information, section 2.1). Referring to Fig. 1A and letting italics
denote species concentration, we can write the rate of change of the output X* as:
��∗
��= ���(�� − �∗ − ) − �����
∗ − ����∗(�� − ) + ����
�
��= ����
∗(�� − ) − ����
in which �� is the total concentration of DNA promoter sites (the load), to which �∗
binds with association and dissociation rate constants given by ��� and ���� ,
respectively, to form the complex C. Here, �� and �� are the rate constants of the
enzymatic reactions, while �� and �� are the total amounts of substrate and
phosphatase, respectively. The concentration Z of the kinase is bounded above by a
value that depends on the strength of the inducible promoter that controls the
expression of Z. In particular, we will have Z = F(U), in which F is the standard Hill
function. The steady state value of �∗ can be obtained by setting the time derivatives
to zero and by letting, for simplifying exposition, the DNA binding sites be saturated
by the TF �∗, so that ≃ �� (see Supplementary Information, section 2.1 for the
general case). In this case, we have that
�∗ =�����
���� + ���−
�����
���� + ���
which, for �� and �� sufficiently large is well approximated by the form
illustrated in Fig. 1B with ���� = �����. Specifically, we see from this expression
that as �� increases, the first term becomes larger compared to the second term, so
that the effect of the load on the output �∗becomes smaller. However, by increasing
��,the gain ������
� !��� from Z to �∗ also increases. To keep this gain at a desired value,
we can also increase the amount of phosphatase ��, such that we ultimately obtain
�∗ ≃����
����"(#)(1)
which is independent of the load.
Since the key parameters that control the attenuation of the load and the system’s
gain are �� and ��, we realized the system in Fig. 1A through a genetic circuit
Page 5 of 24
ACS Paragon Plus Environment
ACS Synthetic Biology
123456789101112131415161718192021222324252627282930313233343536373839404142434445464748495051525354555657585960
6
where the amounts of the substrate X and phosphatase Y can be tuned. This is
explained in the next section.
2. The circuit
We constructed four individual gene circuits. Each circuit is composed of a
constitutively expressed ntrC gene leading to production of a constant amount of
NRI protein substrate. The kinase [ntrB, NRII(L16R)]24 and phosphatase [ntrB,
NRII(H139N)]25 genes are regulated by the repressors TetR and LacI, respectively,
and induced by anhydrotetracycline (aTc) and isopropyl β-D-1-
thiogalactopyranoside (IPTG), respectively. Phospho-NRI (NRI*) is detected using a
reporter gene (superfolder green fluorescent protein; sf-gfp), which has an
upstream PglnA2 enhancer-promoter DNA sequence (Fig. 2). All the circuit genes
are cloned in a medium copy number plasmid pACYC184 (20-30 copies per cell) at
various restriction enzyme sites (Supplementary information sections 1.1-1.3;
Supplementary Figs. S1 – S4). The DNA load (to the system output) used in this
study is composed of two identical, strong binding sites (enhancer site-2) of the
PglnA2 promoter/enhancer cloned in pUC19 plasmid. Four such circuit plasmids
were constructed, wherein the NRI was constitutively expressed at four different
relative concentrations: very low (VL), low (L), medium (M), and high (H). These
different concentrations were obtained by the following different combinations of
the promoter and the ribosome binding site (RBS): P(21)RBS(34) for VL NRI (very
low NRI), P(256)RBS(32) for L NRI (medium NRI), P(162)RBS(34) for M NRI
(medium NRI) and P(256)RBS(34) for H NRI (high NRI). The details of the relative
strengths of the RBSs used for the various circuit parts (Table S5) and their
construction are provided in the materials and methods.
Each circuit plasmid was co-transformed with either the DNA load plasmid to
test the effect of DNA load in the system or with an empty pUC19 plasmid as a
control circuit without any DNA load inserted. As a result, we obtained eight
different systems with increasing amounts of NRI, each with the DNA load or
without it, leading to increasing values of the input amplification. In the systems
with low, medium, and high NRI, the NRII phosphatase can be induced by the
addition of IPTG, providing a mechanism to increase the strength of the negative
feedback (Fig. 2).
3. Input/output dose response curve
The four individual circuits producing different amounts of NRI, without and with
DNA load, were induced with aTc to obtain increasing amounts of NRII kinase,
which leads to phosphorylation of the NRI substrate. The circuit was induced with
different aTc concentrations and for each of these, cells were allowed to reach a
steady state fluorescence to obtain the dose response curve of GFP to aTc
(indicating NRI* concentration). The dose response curves for low (L) and medium
(M) amounts of the NRI substrate, with and without DNA load, are shown in Fig.
3A,B (see Supplementary Information, section 1.4 and Supplementary Fig. S5). Since
the circuits with very low and low NRI both showed the effect of retroactivity, and
Page 6 of 24
ACS Paragon Plus Environment
ACS Synthetic Biology
123456789101112131415161718192021222324252627282930313233343536373839404142434445464748495051525354555657585960

7
the circuits with medium and high NRI showed attenuation of retroactivity, the
circuits with low and medium NRI were considered as representatives for
retroactive behavior and its attenuation. The fluorescence was measured by flow
cytometry in all the cases (see Supplementary Figs. S6-S9). For the low NRI amount,
the DNA load exerted a dramatic effect by reducing the GFP steady state levels at all
aTc, and hence kinase, levels (Fig. 3A). An increase in NRI increased the steady state
fluorescence and in turn reduced the effect of the DNA load as expected (Fig. 3B).
Hence, by increasing the substrate (NRI) amount, we achieved robustness of the
NRI* concentration (system output) to DNA load but this increased the NRII kinase-
to-NRI* gain (according to equation (1)), resulting in the observed dose response
curve with higher values of fluorescence for all aTc values. To recover the original
input/output steady state characteristic shown in Fig. 3A (black), we induced the
NRII phosphatase with 80 µM IPTG. As expected from the model, the input/output
steady state characteristic approached the original one, while the system preserved
its ability to attenuate the effect of the DNA load (Fig. 3C). Figure 3D and the insets
in Fig. 3AB show simulation results performed on an ODE model that includes all the
known molecular interactions present in the system with parameter values
obtained from the literature (Supplementary Information, sections 3.1 – 3.3). The
simulation results correlated well with the data.
This result indicates that the ability of this system of attenuating the effect of the
DNA load on the output is due to the synergy between the negative feedback and the
input amplification as explained in Section 1. This design hence enables to achieve
robustness of the output TF to DNA load while leaving the freedom of attaining a
desired input/output steady state response. While without negative feedback (no
IPTG induction of the NRI phosphatase), the only way to decrease the influence of
the DNA load on the output is to trivially increase the output itself (Fig. 3AB), the
presence of negative feedback does not require to increase the output level to attain
robustness to loading by DNA (Fig. 3C). It hence allows to decouple the specification
on the input/output gain from that of robustness to DNA load.
4. Tradeoffs with dynamic response
The molecular mechanism that allows the NRII kinase to phosphorylate the NRI
substrate (Fig. 2) involves binding of the kinase onto the substrate. Just like DNA
binding sites apply a load to the output transcription factor NRI*, the binding sites
on the NRI substrate apply a load to the NRII kinase. It is known that this substrate
load decreases the free availability of kinase and slows down the kinases’ temporal
dynamics5 (Supplementary Information, section 3.5.2). These facts have been
experimentally verified on a covalent modification cycle reconstituted in vitro.26
Since increased amounts of NRI substrate are required for the attenuation of the
load on the output protein NRI*, we performed time course experiments to assess
the speed of response to aTc induction when the NRI substrate was increased. Fig.
4AB show the temporal response of GFP following induction with 16 nM aTc for the
system with low NRI (L) and medium NRI (M) without load (Fig. 4A) and with load
(Fig. 4B). The temporal response was substantially slower with increased amounts
Page 7 of 24
ACS Paragon Plus Environment
ACS Synthetic Biology
123456789101112131415161718192021222324252627282930313233343536373839404142434445464748495051525354555657585960

8
of NRI substrate. Specifically, the system with medium NRI (M) without load
suffered a 52% increase in response time as compared to the system with low NRI
(L) without load. Similarly, the system with medium NRI (M) with load suffered a
27% increase in response time as compared to the system with low NRI (L) with
load. (see Supplementary Fig. S10). Simulation results shown in the insets of Fig. 4
correlated well with experimental data. These observations confirm that the
temporal response of an enzyme is slowed-down by its substrates in the cell just like
it was reported in vitro.26
Hence, while increased amounts of NRI substrate are required for attenuating the
steady state effects of DNA load on the output of the cycle, they lead to a slowdown
of the overall system’s temporal dynamics. This demonstrates a tradeoff between
performance (speed of response) and robustness (to environmental load), which
needs to be accounted for when designing these systems.
Interestingly, with high NRI (H), the system dynamics became marginally faster (Fig.
S10). To investigate this phenomenon, we studied a simplified model in
Supplementary Information, section 3.5.2. The model reveals that the total amount
of NRI has two opposite effects on the kinase dynamics. On the one hand, increased
amounts of total NRI tend to slow down the kinase dynamics as NRI acts as a load to
the kinase. On the other hand, the total amount of NRI provides an effective
feedback term in the kinase dynamics, that, becoming dominant at larger NRI
concentrations, leads to a marginal speed up in the kinase dynamics. Since the
dynamics of the GFP expression are dominated by the amount of NRI/DNA complex
phosphorylation by NRII (see Supplementary Information, section 3.5.2), it is the
speedup in the NRII dynamics that leads to the marginally faster dynamics of the
GFP concentration.
While the DNA load substantially affects the steady state response of the system for
very low and low values of NRI substrate, it did not show any major slow-down of
the temporal dynamics of the system (Supplementary figures S5C,D and S10E,F).
This is expected when the decay rate of the output TF (NRI*) is sufficiently large
compared to the rate of change of the kinase.5 The decay rate of NRI* results from
dilution, phosphatase-mediated dephosphorylation, and spontaneous
dephosphorylation. Since NRI* has a substantial autophosphatase activity, it has a
large spontaneous dephosphorylation rate that results in a very short half-life of
about 4 minutes.23 This half-life is much smaller than the characteristic time scales
of gene expression that control the temporal rate at which the kinase concentration
increases. Hence, no load-induced slowdown was expected on the NRI*
concentration.
5. Band-pass filtering of stimulus amplitude
There are various regulators that bind to their respective target DNA sites even
before phosphorylation, though in many cases their affinity for target DNA increases
after phosphorylation.18, 27-29 It is well known that the NRI substrate can bind to the
Page 8 of 24
ACS Paragon Plus Environment
ACS Synthetic Biology
123456789101112131415161718192021222324252627282930313233343536373839404142434445464748495051525354555657585960
9
GFP glnA promoter even in its unphosphorylated form with binding affinity similar
to that of NRI*.30 The cooperativity between neighboring NRI dimers is required for
transcriptional activation and it increases by about a factor of 20 after its
phosphorylation.22 Based on these evidences, we constructed a simple analytical
model in which the glnA promoter can be bound by both forms of NRI, but when NRI
is bound, the promoter ultimately allows transcription at a low basal rate while
when NRI* is bound, transcription occurs at a much higher rate (see Supplementary
Information, section 2.2). This model reveals that in the presence of a fixed amount
of NRII kinase, as the NRI substrate is increased, the glnA2 promoter becomes
predominantly bound by the unphosphorylated NRI. If the basal GFP activation
brought about by the unphosphorylated NRI is larger than that due to the kinase-
phosphorylated NRI, GFP expression increases monotonically with NRI’s
concentration. Conversely, if the basal transcription of GFP is smaller than that due
to the kinase-phosphorylated NRI, GFP expression decreases as NRI’s concentration
increases. That is, for low values of NRI the GFP expression increases with NRI until
a maximal expression is reached after which, further increase of NRI leads to a
reduction of GFP expression. That is, the response of GFP concentration to the total
amount of NRI substrate is biphasic when the concentration of kinase is sufficiently
high. When the concentration of kinase is low, the activation of GFP is
predominantly due to increasing values of NRI unphosphorylated, which
monotonically increases with the total amount of NRI substrate. In this case, the
response of GFP to the total amount of NRI substrate is monotonic.
Figure 5 shows experimental and simulation data of fluorescence as a function of
the amounts of NRI substrate. As expected, for low amount of kinase (2 nM aTc),
there was a monotonically increasing relationship between NRI substrate
concentration and GFP (Fig 5A). By contrast, at higher amounts of kinase, the system
behaved in a biphasic manner with increasing concentrations of NRI substrate (Fig.
5B,C and Supplementary Fig. S11). Simulation data correlates well with experiments
and is obtained from a detailed ODE model of the system (Supplementary
Information, section 3.3). The biphasic behavior is preserved in systems with DNA
load, indicating that it is a robust characteristic to interactions with environment’s
binding sites. Such biphasic behaviors have been explained before for various motifs
in regulatory networks such as feedforward loops or ligands acting both as
activators and repressors of a receptor depending on their oligomerization state.31,
32 In our system, the phenomenon is due to the kinase saturation by the substrate
combined with the binding of unphosphorylated substrate to the promoter. The
former limits the amounts of phosphorylated protein achievable for any kinase
concentration, while the latter leads to sequestration of the promoter from the
phosphorylated protein. Therefore, phosphorylation motifs where the
unphosphorylated substrate can bind to the DNA promoter without significant
activation can function as band-pass filters that select input stimuli only around a
desired amplitude level.
In this paper, we have designed and fabricated an amplifying buffer circuit in E. coli,
which enables to achieve desired input/output signal amplification while
Page 9 of 24
ACS Paragon Plus Environment
ACS Synthetic Biology
123456789101112131415161718192021222324252627282930313233343536373839404142434445464748495051525354555657585960

10
attenuating the effect of DNA load on the output. This type of design allows to
insulate the input/output response of a genetic device from the potentially large
number of (unknown) interactions between the output TF and binding sites in the
cellular environment, thus making the device function essentially independent of
the cellular context.
We have shown that the ability of insulating the system from retroactivity to the
output due to DNA load comes with an expense of a slower input/output dynamic
response, a tradeoff that needs to be taken into account in the design. This type of
tradeoff appears to be a fundamental limitation of single phosphorylation cycles,33
but can be overcome by having multiple stages of phosphorylation in a cascade.34 In
this case, the fast phosphorylation reaction of the stage before the last can
compensate for the slow down due to the load applied by the large amount of
substrate in the last stage. Hence, multiple stages of phosphorylation would allow
insulating the input/output response from DNA load while keeping a fast
input/output temporal dynamics.
While TCS motifs provide remarkable flexibility in tuning the input/output response
in a genetic device, the design and fabrication of synthetic genetic circuits that
incorporate TCS systems is still fairly limited. Previous work has demonstrated that
it is possible to control the specificity of TCS systems and that they can provide a
suitable platform for programming signal transduction in bacteria.35, 36 Our work
adds to these results demonstrating that TCS can be tuned with high flexibility and
employed in genetic circuits to realize a fundamental building block: the amplifying
buffer.
Interestingly, most natural TCSs have cognate SK and RR pair whose genes are often
positioned and expressed in tandem from the genome, and NtrB/NtrC is a typical
example.13 Their co-expression possibly leads to a better balance of the
enzyme/substrate (SK/RR) ratio in comparison to other enzymes and substrates
that are not co-expressed. Our experiments have demonstrated that increased
amounts of the RR lead to retroactivity on the SK, slowing down its temporal
dynamics. Hence, a system in which the amounts of SK are proportionally increased
with the amounts of RR should mitigate load-induced slow down, providing a
possible explanation to why SK and RR pairs are often expressed in tandem. Natural
RR are often responsible for activating many downstream genes13 by binding to
multiple promoter DNA sites after phosphorylation. Many such RR also possess
autophosphatase activity,37 which provides the required speedup in temporal
response to mitigate load-induced slow-down due to binding to DNA sites. These
facts suggest that prokaryotic cells may have already been using TCS systems as
natural amplifying buffers, allowing RR to robustly regulate large numbers of
downstream targets and guarantee some level of modularity, which may carry
evolutionary advantages.38
When creating future systems composed of multiple modules, a designer will have
to examine each interconnection through available modeling tools, as described by
Page 10 of 24
ACS Paragon Plus Environment
ACS Synthetic Biology
123456789101112131415161718192021222324252627282930313233343536373839404142434445464748495051525354555657585960

11
Gyorgy and Del Vecchio,39 in order to assess potential loading problems. When
loading is a problem, an insulation device, such as the amplifying buffer proposed
here, will be chosen from a library. This device should have processes orthogonal to
those of already inserted insulation devices. The potential ability of creating
multiple orthogonal insulation devices is given by the existence of hundreds of
orthogonal TCSs,40 and by the fact that these can be used at the same time with
minimal crosstalk.36 Similarly, many orthogonal promoter-regulator pairs have been
de novo synthesized and could be used to provide the required tuning of the gains.41
Scaling up the size of synthetic circuits will also require mitigating the effects of
depletion of key resources such as transcriptional and translational machinery,
enzymes, and ATP.42 Promising results have been obtained in this direction through
the use of orthogonal transcription and translation resources to mitigate the impact
of synthetic circuits on cell fitness.43, 44
Page 11 of 24
ACS Paragon Plus Environment
ACS Synthetic Biology
123456789101112131415161718192021222324252627282930313233343536373839404142434445464748495051525354555657585960
12
MATERIALS AND METHODS
Circuit construction
For constructing the complete circuits, each gene in the circuit was sub-cloned with
the appropriate promoter and ribosome binding site (RBS) upstream of it and with a
double terminator to its downstream. The sub-cloning of each gene was performed
using the BioBrick strategy (http://parts.igem.org/Main_Page) and each of the
composite genes was cloned in a BioBrick compatible vector with ampicillin
resistance marker gene for selection. All circuit parts with the exception of the
substrate protein (NRI) have an LVA degradation tag in order to have faster
dynamic response with increase in decay rate of the kinase and phosphatase. Since
NRI is constitutively produced at a fixed level in all the circuits, no degradation tag
was required for it. For more details on the design and construction of the circuits
see Supplementary Information Sections 1.1 and 1.2.
Bacterial strains, media and growth conditions
All the DNA constructs in this study (including the partial/intermediate DNA
constructs and complete biomolecular circuit plasmids) were transformed in NEB 5-
alpha competent E. coli (high efficiency) (New England BioLabs Inc., USA). The
circuit plasmids were transformed in the E. coli 3.300LGRKAPB mutant strain (see
Supplementary Information Section 1.3 for the details of the strains) without and
with DNA load plasmid. These cells were used for all the assays conducted in this
study.
Plasmids were isolated from the transformed strains using QIAprep spin
mini-prep kit (QIAGEN, USA) after growing individual colonies in Luria Bertani
medium at 37°C overnight. The complete circuits transformed in E. coli
3.300LGRKAPB strain were assayed after growing them in W-salts minimal medium
(K2HPO4, 10.5 g; KH2PO4, 4.5 g; MgSO4, 0.1 g; (NH4)2SO4, 2 g; casaminoacids, 2 g;
glucose, 4 g; glutamine, 2 g; glycine, 2 g; thiamine, 0.1 g in 1000 mL water). An
overnight pre-culture of the circuit containing strains was prepared by growing
individual colonies in 2 mL W-salts medium with appropriate antibiotics at 30°C
and at 200 rpm in an orbital shaker.
Steady state and dynamics experiments
For determining the steady states for the circuits with varying NRI concentrations
and with varying kinase, the individual colonies (3 representative colonies for 3
replicates) were grown as pre-culture. The main culture used in performing the
induction assays was prepared after diluting the pre-culture and allowing it to grow
for 10-12 h at 30°C and at 150 rpm (see Supplementary Information, section 1.5 for
more details). Then cells were mixed with appropriate concentrations of the kinase
inducer (aTc) in a total volume of 200 microliters and were added to a 96-well plate
and were grown at 30°C in a plate reader with high shaking.
Flowcytometry analyses
Page 12 of 24
ACS Paragon Plus Environment
ACS Synthetic Biology
123456789101112131415161718192021222324252627282930313233343536373839404142434445464748495051525354555657585960

13
Reporter analysis was conducted by measuring fluorescence of the super-folder GFP
protein using a flow-cytometer. See Supplementary Information Section 1.6 for
details.
Modeling and simulation
The modeling and simulation of the ODEs for the system was conducted using
MATLAB. The detailed ODE model that we have developed considered a two-step
reaction model for the kinase and phosphatase enzymatic reactions. The NRI
substrate and NRII phosphatase have fixed expressions of the protein by
constitutive promoters, while the NRII kinase was induced via aTc. The load and
reporter promoters are conserved in this study. The half-life of NRI* is very low (~4
min) 23 and hence, its autophosphatase reaction is also considered in the model. The
unphosphorylated dimers of NRI also bind to the target DNAs,22 which is true for
other RRs too, and hence we have incorporated this essential binding reaction for a
more realistic model structure. Although NRI binds to the target DNA (PglnA2
enhancer) with the same affinity as NRI*, transcriptional activation is brought about
only after it is phosphorylated to form NRI*. Phosphorylation increases the
cooperativity between the adjacent NRI dimers that leads to oligomerization and in
turn brings about transcriptional activation and initiation.22 The kinase and
phosphatase enzymatic reactions are modeled also for the free and DNA-bound
forms of NRI and NRI*, respectively. The details of all the ordinary differential
equations (ODEs) of the reactions for the model are given in the Supplementary
information sections 3.1 - 3.3.
ACKNOWLEDGEMENTS
The authors would like to acknowledge The Air Force Office of Scientific Research
(AFOSR grant # FA9550-10-1-0242) for supporting the research conducted in this
paper. We would also like to thank Prof. Alexander Ninfa (Department of Biological
Chemistry, University of Michigan Medical School, Ann Arbor, USA) for providing the
E. coli 3.300LG strain and for the mutant NRII genes (for kinase [NRII(L16R)] and
phosphatase [NRII(H139N)]).
AUTHOR CONTRIBUTIONS
KSN and DDV designed experiments; KSN and JJ performed experiments; KSN, PMR
and DDV made mathematical models and performed simulations; KSN, JJ, PMR and
DDV analyzed the data and wrote the manuscript.
CONFLICTS OF INTEREST
The authors declare no conflicts of interest.
SUPPLEMENTARY INFORMATION
The ODE for the model and the plasmid DNA sequences are given in the
Supplementary Information section. The supplementary information can be
downloaded from http://www.
Page 13 of 24
ACS Paragon Plus Environment
ACS Synthetic Biology
123456789101112131415161718192021222324252627282930313233343536373839404142434445464748495051525354555657585960

14
REFERENCES
1. Purnick, P. E., and Weiss, R. (2009) The second wave of synthetic biology:
from modules to systems, Nature reviews. Molecular cell biology 10, 410-422.
2. Lou, C., Stanton, B., Chen, Y. J., Munsky, B., and Voigt, C. A. (2012) Ribozyme-
based insulator parts buffer synthetic circuits from genetic context, Nature
biotechnology 30, 1137-1142.
3. Bashor, C. J., and Collins, J. J. (2012) Insulating gene circuits from context by
RNA processing, Nature biotechnology 30, 1061-1062.
4. Burger, A., Walczak, A. M., and Wolynes, P. G. (2010) Abduction and asylum in
the lives of transcription factors, Proc Natl Acad Sci U S A 107, 4016-4021.
5. Del Vecchio, D., Ninfa, A. J., and Sontag, E. D. (2008) Modular cell biology:
retroactivity and insulation, Molecular systems biology 4, 161.
6. Jayanthi, S., Nilgiriwala, K. S., and Del Vecchio, D. (2013) Retroactivity
controls the temporal dynamics of gene transcription, ACS Synth Biol 2, 431-
441.
7. Lee, T. H., and Maheshri, N. (2012) A regulatory role for repeated decoy
transcription factor binding sites in target gene expression, Molecular
systems biology 8, 576.
8. Buchler, N. E., and Louis, M. (2008) Molecular titration and ultrasensitivity in
regulatory networks, J Mol Biol 384, 1106-1119.
9. Brewster, R. C., Weinert, F. M., Garcia, H. G., Song, D., Rydenfelt, M., and
Phillips, R. (2014) The transcription factor titration effect dictates level of
gene expression, Cell 156, 1312-1323.
10. Saez-Rodriguez, J., Kremling, A., and Gilles, E. D. (2005) Dissecting the Puzzle
of Life: Modularization of Signal Transduction Networks, Computers &
Chemical Engineering 29, 619-629.
11. Cardinale, S., and Arkin, A. P. (2012) Contextualizing context for synthetic
biology – identifying causes of failure of synthetic biological systems,
Biotechnology Journal 7, 856-866.
12. Schaller, G. E., Shiu, S. H., and Armitage, J. P. (2011) Two-component systems
and their co-option for eukaryotic signal transduction, Current biology : CB
21, R320-330.
13. Yamamoto, K., Hirao, K., Oshima, T., Aiba, H., Utsumi, R., and Ishihama, A.
(2005) Functional characterization in vitro of all two-component signal
transduction systems from Escherichia coli, Journal of Biological Chemistry
280, 1448-1456.
14. Foussard, M., Cabantous, S., Pédelacq, J.-D., Guillet, V., Tranier, S., Mourey, L.,
Birck, C., and Samama, J.-P. (2001) The molecular puzzle of two-component
signaling cascades, Microbes and infection 3, 417-424.
15. Miller, S. I., Kukral, A. M., and Mekalanos, J. J. (1989) A two-component
regulatory system (phoP phoQ) controls Salmonella typhimurium virulence,
Proceedings of the National Academy of Sciences 86, 5054-5058.
16. Nixon, B. T., Ronson, C. W., and Ausubel, F. M. (1986) Two-component
regulatory systems responsive to environmental stimuli share strongly
Page 14 of 24
ACS Paragon Plus Environment
ACS Synthetic Biology
123456789101112131415161718192021222324252627282930313233343536373839404142434445464748495051525354555657585960

15
conserved domains with the nitrogen assimilation regulatory genes ntrB and
ntrC, Proceedings of the National Academy of Sciences 83, 7850-7854.
17. Bernardini, M., Fontaine, A., and Sansonetti, P. (1990) The two-component
regulatory system ompR-envZ controls the virulence of Shigella flexneri,
Journal of bacteriology 172, 6274-6281.
18. Leonhartsberger, S., Huber, A., Lottspeich, F., and Bock, A. (2001) The
hydH/G Genes from Escherichia coli code for a zinc and lead responsive two-
component regulatory system, J Mol Biol 307, 93-105.
19. Jiang, P., and Ninfa, A. J. (1999) Regulation of Autophosphorylation of
Escherichia coli Nitrogen Regulator II by the PII Signal Transduction Protein,
Journal of bacteriology 181, 1906-1911.
20. Zimmer, D. P., Soupene, E., Lee, H. L., Wendisch, V. F., Khodursky, A. B., Peter,
B. J., Bender, R. A., and Kustu, S. (2000) Nitrogen regulatory protein C-
controlled genes of Escherichia coli: scavenging as a defense against nitrogen
limitation, Proc Natl Acad Sci U S A 97, 14674-14679.
21. Ninfa, A., Atkinson, M., Forger, D., Atkins, S., Arps, D., Selinsky, S., Court, D.,
Perry, N., and Mayo, A. (2009) A Synthetic Biology Approach to
Understanding Biological Oscillations: Developing a Genetic Oscillator for
Escherichia coli, In Bacterial Circadian Programs (Ditty, J., Mackey, S., and
Johnson, C., Eds.), pp 301-329, Springer Berlin Heidelberg.
22. Weiss, V., Claverie-Martin, F., and Magasanik, B. (1992) Phosphorylation of
nitrogen regulator I of Escherichia coli induces strong cooperative binding to
DNA essential for activation of transcription, Proc Natl Acad Sci U S A 89,
5088-5092.
23. Weiss, V., and Magasanik, B. (1988) Phosphorylation of nitrogen regulator I
(NRI) of Escherichia coli, Proceedings of the National Academy of Sciences 85,
8919-8923.
24. Pioszak, A. A., and Ninfa, A. J. (2003) Genetic and biochemical analysis of
phosphatase activity of Escherichia coli NRII (NtrB) and its regulation by the
PII signal transduction protein, J Bacteriol 185, 1299-1315.
25. Atkinson, M. R., and Ninfa, A. J. (1993) Mutational analysis of the bacterial
signal-transducing protein kinase/phosphatase nitrogen regulator II (NRII or
NtrB), J Bacteriol 175, 7016-7023.
26. Jiang, P., Ventura, A. C., Sontag, E. D., Merajver, S. D., Ninfa, A. J., and Del
Vecchio, D. (2011) Load-induced modulation of signal transduction
networks, Science signaling 4, ra67.
27. Ellison, D. W., and McCleary, W. R. (2000) The unphosphorylated receiver
domain of PhoB silences the activity of its output domain, J Bacteriol 182,
6592-6597.
28. Gusa, A. A., and Scott, J. R. (2005) The CovR response regulator of group A
streptococcus (GAS) acts directly to repress its own promoter, Mol Microbiol
56, 1195-1207.
29. Matta, M. K., Lioliou, E. E., Panagiotidis, C. H., Kyriakidis, D. A., and
Panagiotidis, C. A. (2007) Interactions of the antizyme AtoC with regulatory
elements of the Escherichia coli atoDAEB operon, J Bacteriol 189, 6324-6332.
Page 15 of 24
ACS Paragon Plus Environment
ACS Synthetic Biology
123456789101112131415161718192021222324252627282930313233343536373839404142434445464748495051525354555657585960

16
30. Shiau, S. P., Schneider, B. L., Gu, W., and Reitzer, L. J. (1992) Role of nitrogen
regulator I (NtrC), the transcriptional activator of glnA in enteric bacteria, in
reducing expression of glnA during nitrogen-limited growth, J Bacteriol 174,
179-185.
31. Kim, D., Kwon, Y. K., and Cho, K. H. (2008) The biphasic behavior of
incoherent feed-forward loops in biomolecular regulatory networks,
BioEssays : news and reviews in molecular, cellular and developmental biology
30, 1204-1211.
32. Levchenko, A., Bruck, J., and Sternberg, P. (2004) Regulatory modules that
generate biphasic signal response in biological systems, Systems biology 1,
139-148.
33. Rivera, P. M., and Del Vecchio, D. (2013) Optimal design of phosphorylation-
based insulation devices, In American Control Conference (ACC), 2013, pp
3783-3789, IEEE.
34. Rivera, P. M., and Del Vecchio, D. (2014) Retroactivity Attenuation through
Signal Transduction Cascades, In American Control Conference (ACC), 2014 (to
appear), IEEE.
35. Capra, E. J., and Laub, M. T. (2012) Evolution of two-component signal
transduction systems, Annu Rev Microbiol 66, 325-347.
36. Whitaker, W. R., Davis, S. A., Arkin, A. P., and Dueber, J. E. (2012) Engineering
robust control of two-component system phosphotransfer using modular
scaffolds, Proceedings of the National Academy of Sciences 109, 18090-18095.
37. Gao, R., Mack, T. R., and Stock, A. M. (2007) Bacterial response regulators:
versatile regulatory strategies from common domains, Trends in biochemical
sciences 32, 225-234.
38. Kirschner, M. W., and Gerhart, J. C. (2006) The plausibility of life: Resolving
Darwin's dilemma, Yale University Press.
39. Gyorgy, A., and Del Vecchio, D. (2014) Modular composition of gene
transcription networks, PLoS computational biology 10, e1003486.
40. Laub, M. T., and Goulian, M. (2007) Specificity in two-component signal
transduction pathways, Annu. Rev. Genet. 41, 121-145.
41. Rao, C. V. (2012) Expanding the synthetic biology toolbox: engineering
orthogonal regulators of gene expression, Current opinion in biotechnology
23, 689-694.
42. An, W., and Chin, J. W. (2009) Synthesis of orthogonal transcription-
translation networks, Proceedings of the National Academy of Sciences 106,
8477-8482.
43. Rackham, O., and Chin, J. W. (2005) A network of orthogonal ribosome·
mRNA pairs, Nature chemical biology 1, 159-166.
44. Segall-Shapiro, T. H., Meyer, A. J., Ellington, A. D., Sontag, E. D., and Voigt, C. A.
(2014) A ‘resource allocator’for transcription based on a highly fragmented
T7 RNA polymerase, Molecular systems biology 10.
Page 16 of 24
ACS Paragon Plus Environment
ACS Synthetic Biology
123456789101112131415161718192021222324252627282930313233343536373839404142434445464748495051525354555657585960

17
FIGURE LEGENDS
Fig. 1 Amplifying buffer concept. (A) Schematic representation of the genetic
layout of the amplifying buffer circuit. The output transcription factor X* results
from the phosphorylation of a substrate X in total amount Xtot through the kinase Z,
which is controlled by an inducible promoter by an input molecule U. The output
transcription factor is dephosphorylated by a phosphatase Y in total amount Ytot.
The transcription factor can bind specifically or non-specifically to a large number of
DNA binding sites (depicted in red), which, as a consequence, apply a load to the
transcription factor. (B) Block diagram representation highlighting the physical
entities responsible for the input amplification and the negative feedback of the
amplifying buffer circuit. The total amount of substrate Xtot contributes to the
amplification of the signal transmitted by Z while the negative feedback gain
increases with the total amount of phosphatase Ytot. The load appears as a
disturbance that tends to decrease the output X*. Simple block diagram algebra
leads to the expression of the concentration of X* on the right-hand, where we have
assumed that Ytot is sufficiently large such that k2Ytot >>1. As Xtot and Ytot increase, the
gain from Z to X* can be kept to a desired value while decreasing the impact of the
load on the same output X*.
Fig. 2 Amplifying buffer genetic circuit layout. The amplifying buffer takes aTc
(U) as an input and produces phosphorylated NRI (NRI*) as output X*. A constant
amount of NRI substrate protein is constitutively expressed; whereas the kinase and
phosphatase are regulated by TetR and LacI repressors, respectively, and are
induced by aTc and IPTG, respectively. The phosphorylated NRI (NRI*) initiates
transcription from the PglnA2 promoter, which controls the expression of the
reporter protein (superfolder GFP protein) from the sf-gfp gene cloned downstream
of the promoter. All the circuit proteins have the degradation tag (LVA) except for
the NRI substrate. The promoter Pconst upstream of tetR and lacI genes indicate a
high strength constitutive promoter (BBa_J23114). The Pconst* upstream of the
gene ntrC represents variable constitutive promoters; for details refer to
Supplementary Information, Table S5.
Fig. 3 Dose response curves of the amplifying buffer circuit. (A) For low amounts
of NRI (L), the system with DNA load (red) showed a substantially lower steady
state than the system without load (black) at all kinase concentrations. The error
bars indicate standard deviation between the 3 replicates. (B) The circuit with
medium amount of NRI (M) was considered. In this case, the presence of DNA load
did not significantly affect the dose response curve, but the output is larger than in
the original circuit in (A) for each input value of kinase. (C) Solid lines indicate the
original system with low amounts of NRI (L) shown in (A), while dashed lines
indicate the system with medium amounts of NRI (M) induced with 80 µm IPTG. The
addition of IPTG lowers the steady state compared to the plots in (B) and brings the
dose response curve to essentially overlap with that of the original circuit in (A),
Page 17 of 24
ACS Paragon Plus Environment
ACS Synthetic Biology
123456789101112131415161718192021222324252627282930313233343536373839404142434445464748495051525354555657585960

18
which suffered due to the DNA load. Now, the system does not significantly suffer
from the presence of DNA load since the black (no load) and red (with load) dose
response curves overlap. Each point in the graphs is the mean fluorescence of the
cells from three replicates and the error bars indicate standard deviation. (D)
Simulated data. Simulation data obtained from the detailed ODE model
(Supplementary Information, section 3.3).
Fig. 4 Temporal dynamics. The (10-90)% rise time of GFP expression after
induction with a constant amount of aTc (16 nM aTc) was observed for different
amounts of NRI substrate (low and medium). The normalized temporal responses
are shown for the system without load in (A) and for the system with load in (B).
The insets in the graphs show the simulation data obtained by the detailed ODE
model (Supplementary Information, section 3.3). The response time increases for
circuits with higher NRI independent of the DNA load.
Fig. 5 Biphasic steady state response to NRI substrate. The plots show steady
state levels of GFP concentration for the circuits without (black)/with (red) DNA
load and as a function of the concentration of NRI for varying kinase concentrations:
(A) 2 nM aTc, (B) 4 nM aTc, and (C) 20 nM aTc. Each point in the graphs is the mean
fluorescence of the cells from three replicates and the error bars indicate standard
deviation. (C), (D), and (E) show simulation results obtained with the detailed ODE
model explained in Supplementary Information, section 3.3. For additional aTc
concentrations, refer to the Supplementary Information, section 1.4.
Page 18 of 24
ACS Paragon Plus Environment
ACS Synthetic Biology
123456789101112131415161718192021222324252627282930313233343536373839404142434445464748495051525354555657585960

X
Z
X*
Y
DNA
binding sites
(load)
Output TF k1
k2
+ +
load
-
-
Z k1Xtot
k2Ytot
X*
A
B
Figure 1
Input
U
Page 19 of 24
ACS Paragon Plus Environment
ACS Synthetic Biology
123456789101112131415161718192021222324252627282930313233343536373839404142434445464748495051525354555657585960

DNA
binding sites
(load)
aTc
Input
(U)
Output (X*) NRII kinase (Z)
ntrC
NRI NRI*
ntrB-H139N ntrB-L16R
NRII phosphatase (Y)
lacI
IPTG
sf-gfp PglnA2
enhancers PglnA2 Pconst* Plac Pconst Ptet Pconst tetR
Figure 2
Page 20 of 24
ACS Paragon Plus Environment
ACS Synthetic Biology
123456789101112131415161718192021222324252627282930313233343536373839404142434445464748495051525354555657585960

C D
A B
Figure 3
Page 21 of 24
ACS Paragon Plus Environment
ACS Synthetic Biology
123456789101112131415161718192021222324252627282930313233343536373839404142434445464748495051525354555657585960

A B
Figure 4
Page 22 of 24
ACS Paragon Plus Environment
ACS Synthetic Biology
123456789101112131415161718192021222324252627282930313233343536373839404142434445464748495051525354555657585960

A B C
Figure 5
Page 23 of 24
ACS Paragon Plus Environment
ACS Synthetic Biology
123456789101112131415161718192021222324252627282930313233343536373839404142434445464748495051525354555657585960

254x190mm (300 x 300 DPI)
Page 24 of 24
ACS Paragon Plus Environment
ACS Synthetic Biology
123456789101112131415161718192021222324252627282930313233343536373839404142434445464748495051525354555657585960