synthesis and characterizaton of inorganic materials … · 2016-09-14 · abstract synthesis and...
TRANSCRIPT
SYNTHESIS AND CHARACTERIZATON OF INORGANIC
MATERIALS FOR SODIUM-ION BATTERIES
By
Rengarajan Shanmugam
A DISSERTATION
Submitted to
Michigan State University
in partial fulfillment of the requirements
for the degree of
Chemical Engineering—Doctor of Philosophy
2015

ABSTRACT
SYNTHESIS AND CHARACTERIZATION OF INORGANIC MATERIALS FOR
SODIUM-ION BATTERIES
By
Rengarajan Shanmugam
Development of low-cost energy storage devices is critical for wide-scale implementation of
intermittent renewable energy technologies and improving the electricity grid. Commercial
devices remain prohibitively expensive or lack the performance specifications for a wider market
reach. Na-ion batteries would perfectly suited for these large-scale applications as the raw
materials (such as soda ash, salt, etc.) are plentiful, inexpensive and geographically unconstrained.
However, extensive materials research on insertion electrodes is required for better understanding
of the electrochemical and structural properties and engineering high performance Na-ion
batteries. This thesis research involves exploratory study on new insertion materials with various
crystallographic structure-types and extensive characterization of promising new inorganic
compositions.
Tunnel-type materials, sodium nickel phosphate-Na4Ni7(PO4)6, and sodium cobalt titanate-
Na0.8Co0.4Ti1.6O4, were investigated to capitalize on the intrinsic structural stability offered by
framework materials. Sol-gel and solid-state reaction synthetic techniques were employed for
inorganic powder synthesis. Galvanostatic and potentiostatic testing confirm reversible sodium
insertion/de-insertion reactions albeit with inadequate electrochemical characteristics (high
voltage hysteresis> 1V). Subsequent efforts involved investigating layer-structured materials
supporting fast ionic transport for better electrochemical performance.
P2-sodium nickel titanate, Na2/3[Ni1/3Ti2/3]O2 (P2NT), with prismatic sodium co-ordination,
was synthesized by solid-state technique. The ‘bifunctional’ oxide contains Ni2+/4+ and Ti4+/3+

redox couples with redox potentials of 3.6 V, 0.7 V vs. Na/Na+, respectively. This bifunctional
approach would simplify electrode processing and provide cost reduction opportunities in battery
manufacturing. The structural changes monitored using ex-situ XRD demonstrate a favorably
broad solid-solution domain. Manganese substitution, to form P2-Na2/3[Ni1/3Mn1/3Ti1/3]O2
(P2NMT), provides an enhanced high-current performance due to faster interfacial kinetics and
accelerated charge carrier transport as shown by impedance spectroscopy and DC testing.
Structural properties of P2NT material were studied using neutron diffraction and atomisitic
simulations. Rietveld refinement shows that Naf sites have lower site occupancy than Nae sites due
to unfavorable repulsive interactions from inline transition metal atoms. Buckingham and Morse-
type models accurately predicted the experimental lattice parameters. The energy landscape was
explored using energy minimization runs on disordered supercells. The simulated density maps
are in agreement with the experiment densities with evidence of stacking fault formation.
O3-sodium nickel titanate, Na0.9[Ni0.45Ti0.55]O2 (O3NT) with octahedral sodium co-ordination
was synthesized by solid-state reaction technique. The influence of titanium on the poor
cycleability of the O3-type electrodes was investigated. Ex-situ XRD shows two phase regions,
comprised of O3+P3 phases, and a solid solution region, comprised of P3 phase. O3NT provides
an excellent capacity retention of 99% for 115 cycles at C/2 rate. The good cycleability is attributed
to the relative invariance of net impedance during electrode cycling using impedance spectroscopy.

iv
ACKNOWLEDGEMENTS
I would like to recognize the valuable research guidance of my advisor Prof. Wei Lai towards my
doctorate degree. I am grateful for the opportunity to do my thesis research under his mentorship
and develop my professional skills. I would like to extend my thanks to Prof. Tim Hogan, Prof.
Lawrence Drzal, and Prof. Jeff Sakamoto for being a part of my research committee and providing
feedback on my research activities.
I would like to thank my lab mates Yuxing Wang, and Matt Klenk. I would like to acknowledge
Yuxing for providing insights on research projects from a materials science perspective and
support on lab equipment and facilities. It was a pleasure to share lab and office space with you
guys, and engage in impromptu discussions on various scientific and non-work related topics. I
acknowledge CHEMS department for providing multiple teaching assistantships and value the
lecturing opportunities under the mentoring of Prof. Scott Calabrese Barton, Prof. Carl Boehlert,
Maddalena Fanelli, Prof. Andre Lee and Prof. Timothy Hinds.
I appreciate the research staff at CMSC including Michael Rich and Per Askeland for providing
training and valuable feedback on electron microscopy, surface area analysis, and electrospinning
tools. I also thank the CAM center staff: Stanley Flegler, Carol Flegler, and Abigail Vanderberg
for 7500F SEM training, sample preparations and troubleshooting. I acknowledge Prof. Richard
Staples for providing training, access and inputs in XRD characterization at chemistry department,
MSU.
I would like to thank all my friends for the support and making my life in graduate school
exciting. Last but not the least, I am grateful for the encouragement, and emotional support of my
family.

1
TABLE OF CONTENTS
LIST OF TABLES ................................................................................................... 5
LIST OF FIGURES ................................................................................................. 6
1. INTRODUCTION ..............................................................................................14
1.1 Climate Change: A Major Challenge of the 21st Century ...................................................... 14 1.2 Sources of GreenHouse Gas Emissions .................................................................................. 15
1.3 Renewable Energy Technologies: Benefits and Issues ........................................................... 16
1.4 Energy Storage Technologies for Stationary Applications ..................................................... 19 1.4.1 Pumped Hydroelectric Storage ............................................................................................ 20 1.4.2 Compressed Air Energy Storage .......................................................................................... 20
1.4.3 Electrochemical Energy Storage .......................................................................................... 21 1.4.3.1 Na/S batteries .................................................................................................................... 21 1.4.3.2 Lead-acid batteries ............................................................................................................ 22
1.4.3.3 Li-ion batteries .................................................................................................................. 22 1.4.4 Flywheels ............................................................................................................................. 23
1.5 Market need for stationary sector ........................................................................................... 24 1.6 Need for Alternate Battery Chemistry .................................................................................... 25 1.7 Rationale for investigating Na-based batteries ....................................................................... 28
1.7.1 Na-ion vs Mg-ion batteries .................................................................................................. 28
1.7.2 Relative ease of scalability ................................................................................................... 29 1.8 Insertion-based Batteries: Working Principle ......................................................................... 30 1.9 Requisites for Intercalation-based Electrodes ......................................................................... 31
1.10 Research Problem ................................................................................................................. 33 1.11 Thesis organization ............................................................................................................... 34
BIBLIOGRAPHY ......................................................................................................................... 36
2. SYNTHESIS, AND ELECTROCHEMICAL CHARACTERIZATION OF
NOVEL TUNNEL-TYPE SODIUM INTERCALATION MATERIALS .......40
2.1 Introduction ............................................................................................................................. 40
2.2 Structural features ................................................................................................................... 41 2.2.1 Sodium nickel phosphate: Na4Ni7(PO4)6 ............................................................................. 41
2.2.2 Sodium cobalt titanate: Na0.8Co0.4Ti1.6O4 ............................................................................ 42 2.3 Inorganic Synthesis ................................................................................................................. 43 2.3.1 Sodium nickel phosphate synthesis ..................................................................................... 43 2.3.2 Sodium cobalt titanate synthesis .......................................................................................... 48 2.4 Film fabrication ....................................................................................................................... 50
2.4.1 Substrate selection ............................................................................................................... 50 2.4.2 Casting methods ................................................................................................................... 50

2
2.5 Electrochemical characterization ............................................................................................ 52
2.5.1 Cell setup and testing ........................................................................................................... 52 2.5.2 Evaluation of the electrolyte and current collectors ............................................................ 53 2.5.3 Validation of electrochemical methods using standard intercalation materials: Na0.7CoO2
and LiFePO4 ....................................................................................................................... 59 2.5.4 SNP Electrochemistry: Galvanostatic testing ...................................................................... 61 2.5.5 SNP Ex-situ XRD characterization ...................................................................................... 62 2.5.6 SCT Electrochemistry: Potentiostatic Intermittent Titration Testing (PITT) ...................... 64 2.6 Summary ................................................................................................................................. 66
BIBLIOGRAPHY ......................................................................................................................... 68
3. SYNTHESIS, AND ELECTROCHEMICAL CHARACTERIZATION OF
P-TYPE LAYER-STRUCTURED MATERIALS: Na2/3[Ni1/3MnxTi2/3-x]O2
(x=0, 1/3) ..................................................................................................................72
3.1 Introduction ............................................................................................................................. 72
3.1.1 Ionic conduction in layered materials .................................................................................. 72 3.1.2 Literature reports on layered host materials......................................................................... 73 3.1.3 Materials of interest ............................................................................................................. 74
3.2 Structural features ................................................................................................................... 75 3.2.1 Sodium nickel titanate: P2-Na2/3[Ni1/3Ti2/3]O2 ..................................................................... 75
3.2.2 Sodium nickel manganese titanate: P2-Na2/3[Ni1/3Mn1/3Ti1/3]O2 ......................................... 76 3.3 Inorganic synthesis and high-temperature processing ............................................................ 76 3.3.1 Sodium nickel titanate synthesis .......................................................................................... 76
3.3.2 Sodium nickel manganese titanate synthesis ....................................................................... 79
3.3.3 Powder sintering .................................................................................................................. 81
3.4 Film fabrication ....................................................................................................................... 82 3.5 Material Characterization........................................................................................................ 82
3.5.1 Voltage profile under galvanostatic testing ......................................................................... 82 3.5.1.1High-voltage cathode: Ni2+/4+ redox couple ....................................................................... 82 3.5.1.2 Low-voltage anode: Ti4+/3+ redox couple .......................................................................... 84
3.5.2 Quantifying charge carrier transport processes: DC & AC Testing .................................... 86 3.5.3 Evaluating ionic transport and interfacial processes: Electrochemical impedance
spectroscopy ....................................................................................................................... 90 3.5.4 Analyzing ionic transport processes: Potentiostatic intermittent titration technique ........... 97 3.5.5 Understanding reaction mechanisms: Ex-situ XRD Testing ............................................. 100
3.5.6 Evaluating capacity retention ............................................................................................. 102
3.5.6.1 Cycling Study.................................................................................................................. 102 3.5.6.2 Impedance change during cycling .................................................................................. 104 3.5.7 Rate performance testing ................................................................................................... 106
3.6 Improving cathodic stability: Calcium substitution .............................................................. 108 3.7 Improving anodic capacity: Potassium substitution ............................................................. 109 3.8 Summary and future work .................................................................................................... 111 BIBLIOGRAPHY ....................................................................................................................... 114

3
4. STRUCTURAL CHARACTERIZATION OF P2-SODIUM NICKEL
TITANATE USING EXPERIMENTAL AND COMPUTATIONAL
METHODS ...........................................................................................................118
4.1 Introduction ........................................................................................................................... 118 4.1.1 Computational methods ..................................................................................................... 118 4.1.2 Literature ............................................................................................................................ 119
4.1.3 Scope of current work ........................................................................................................ 119 4.2 Experimental ......................................................................................................................... 120 4.2.1 Neutron diffraction experiments ........................................................................................ 120 4.2.2 Energy calculations for many-body systems: Theory ........................................................ 120 4.2.3 Long-range and short-range interactions ........................................................................... 121
4.2.4 Handling partial occupancy: Mean field model and Supercells ........................................ 125
4.2.5 Energy minimization: Optimization schemes and strategy ............................................... 126
4.2.6 Space group transformations.............................................................................................. 127 4.2.7 Simulation data interpretation and Pair Distribution Function (PDF) calculation ............ 130 4.3 Results and Discussion ......................................................................................................... 131 4.3.1 Rietveld refinement: Neutron Diffraction .......................................................................... 131
4.3.2 Interatomic potential sets: Selection and validation .......................................................... 136 4.3.3 Energetics of disordered structures: Atomic distribution effects ....................................... 140
4.3.4 Energetics of ordered structures ......................................................................................... 144 4.3.5 Simulated average structure ............................................................................................... 145 4.3.6 Pair distribution function and probability density line-scans ............................................ 150
4.4 Summary and future work .................................................................................................... 152 BIBLIOGRAPHY ....................................................................................................................... 154
5. SYNTHESIS, STRUCTURAL AND ELECTROCHEMICAL
CHARACTERIZATION OF Na0.9[Ni0.45Ti0.55]O2, AN O-TYPE LAYER-
STRUCTURED MATERIAL .............................................................................159
5.1 Introduction ........................................................................................................................... 159
5.1.1 O3-type materials ............................................................................................................... 159 5.1.2 Literature ............................................................................................................................ 160
5.1.3 Research Strategy............................................................................................................... 161 5.2 Material synthesis & electrode fabrication ........................................................................... 162
5.3 Electrochemistry ................................................................................................................... 164 5.3.1 Voltage-composition curves: Galvanostatic Testing ......................................................... 164
5.3.2 Phase transitions: Ex-situ XRD ......................................................................................... 165 5.3.3 Equilibrium voltage profiles and solid-state diffusivity estimation: Potentiostatic
Intermittent Titration Technique (PITT) .......................................................................... 170 5.3.4 Cycling study ..................................................................................................................... 172 5.3.4.1 Capacity retention at different voltage cutoffs................................................................ 172
5.3.4.2 Impedance spectra evolution during cycling .................................................................. 175 5.3.4.3 Sodium metal deactivation: Prolonged cycling .............................................................. 178 5.3.5 Rate testing......................................................................................................................... 179 5.4 Summary and future work .................................................................................................... 180 BIBLIOGRAPHY ....................................................................................................................... 183

4
6. CONCLUSIONS ..............................................................................................186

5
LIST OF TABLES
Table 1.1 Short-term and Long-term DOE targets for EES technologies (stationary applications).25
....................................................................................................................................................... 25
Table 1.2 Comparison of resources and physical properties of lithium, sodium and magnesium30
....................................................................................................................................................... 27
Table 3.1 Theoretical capacity of P2-titanate materials based on vacancy concentration.......... 110
Table 4.1 Interatomic potential parameters: Buckingham Core-shell model; all atomic species are
taken at formal charges, Formal charge=Ycore+ Yshell ................................................................. 124
Table 4.2 Interatomic potential parameters: Morse+ LJ model .................................................. 124
Table 4.3 Structural information of P2-NT powders: Prepared at 900 oC and tested at 15K. .... 133
Table 4.4 Structural information of P2-NT powders: Prepared at 900 oC and tested at 300K ... 134
Table 4.5 Structural information of P2-NT powders: Prepared at 1000 oC and tested at 15K ... 134
Table 4.6 Structural information of P2-NT powders: Prepared at 1000 oC and tested at 300K . 134
Table 4.7 Transferability of Buckingham interatomic potential across binary oxides; |ε| is the
modulus percentage error in lattice parameters. ......................................................................... 139
Table 4.8 Transferability of Buckingham interatomic potential across ternary oxides. ............. 139
Table 4.9 Transferability of Morse interatomic potential across binary oxides. ........................ 139
Table 4.10 Transferability of Morse interatomic potential across ternary oxides. ..................... 139

6
LIST OF FIGURES
Figure 1.1 (a) Global carbon dioxide uptake over past decades, (b) Surface temperature anomalies;3
For interpretation of references to color in this and all other figures, the reader is referred to the
electronic version of this thesis. .................................................................................................... 15
Figure 1.2 (a) Global greenhouse gas emissions,12 and (b) Global energy consumption in past
decades.13 ...................................................................................................................................... 16
Figure 1.3 (a) Global energy generation by sources,17 (b) Renewable energy estimated output and
projections.17 ................................................................................................................................. 17
Figure 1.4 Variability in (a) solar power output and, (b) wind power output.18 ........................... 18
Figure 1.5 Schematic representation of (a) pumped hydroelectric system, (b) compressed air
energy storage system, (c) electrochemical energy storage system with Na/S battery chemistry,
and (d) flywheel system.22 ............................................................................................................ 21
Figure 1.6 (a) Cost and efficiency comparison of different energy storage technologies; hatched
bars refer to the efficiency values on the secondary y-scale, and (b) lifetime comparison of energy
storage technologies.21 .................................................................................................................. 22
Figure 1.7 Market segments for energy storage devices in the electricity grid. ........................... 24
Figure 1.8 Energy storage technologies employed for various stationary applications.21 ............ 24
Figure 1.9 Relative abundance chart depicting plentiful sodium element as compared to lithium.29
....................................................................................................................................................... 27
Figure 1.10 Manufacturing steps for advanced batteries such as Li-ion chemistry. ..................... 29
Figure 1.11 Working principle of an insertion/intercalation-based battery.34 .............................. 31
Figure 1.12 Growing number of research publications on anode materials for Na-ion battery.36 34

7
Figure 2.1 Crystal structure of Na4Ni7(PO4)6; Pink polyhedra represents nickel octahedra, green
polyhedra represents phosphate tetrahedra and yellow spheres indicate sodium atoms. Oxygen
atoms are not included for clarity.26 ............................................................................................. 42
Figure 2.2 Crystal structure of Na0.8Co0.4Ti1.6O4; blue polyhedra represents transition metal
octahedra (cobalt and titanium) and yellow spheres represent sodium atoms; oxygen atoms are
omitted for clarity.25 ...................................................................................................................... 43
Figure 2.3 Schematic of solid state reaction technique. ................................................................ 44
Figure 2.4 XRD characterization of sodium nickel phosphate prepared by solid state reaction. . 45
Figure 2.5 (a) Sodium nickel phosphate powder morphology prepared by solid state reaction, and
(b) Higher-magnification image of a particle showing dense morphology. ................................. 46
Figure 2.6 Schematic of sol-gel synthesis technique. ................................................................... 47
Figure 2.7 XRD characterization of sol-gel synthesized powders of sodium nickel phosphate. .. 47
Figure 2.8 (a) Sodium nickel phosphate powder morphology prepared by sol-gel reaction, and (b)
Higher-magnification image of a particle showing porous morphology. ..................................... 48
Figure 2.9 (a) XRD characterization of sodium cobalt titanate prepared by solid state reaction, and
(b) SEM morphology of as-synthesized sodium cobalt titanate powders. .................................... 49
Figure 2.10 Schematic of doctor-blade slurry casting method for fabricating battery electrodes. 51
Figure 2.11 Schematic of Swagelok 3-electrode cell setup for electrochemical testing. ............. 52
Figure 2.12 Impedance spectroscopy curves for sodium metal SEI formation in (a) 1M NaClO4 in
ethylene carbonate/dimethyl carbonate, and (b) 0.5M NaPF6 in ethylene carbonate/diethyl
carbonate; 1st cycle refers to test after 4 hours open-circuit and subsequent tests. ...................... 54
Figure 2.13 Cyclic voltammograms scanned between 1.5-4.2 V voltage window for (a) aluminum,
(b) andoized aluminum, (c) stainless steel 316, and (d) titanium. ................................................ 57

8
Figure 2.14 (a) Cyclic voltammogram of graphite scanned between 1.5-4.2 V voltage window, and
(b) oxidative voltammogram peak currents for 1st and 10th cycle. ............................................... 58
Figure 2.15 Voltage profile of anodized aluminum current collector tested under galvanostatic
condition with 4.5V cutoff using 3-electrode setup. ..................................................................... 59
Figure 2.16 Voltage profiles of (a) lithium iron phosphate under galvanostatic conditions at C/10
rate demonstrating two-phase reaction between FePO4 and LiFePO4, and (b) Na0.7CoO2 showing
complex voltage steps and plateaus due to multiple phase transitions. ........................................ 60
Figure 2.17 Sodium nickel phosphate tested under galvanostatic conditions with discharge cut-off
voltage of (a) 1.5 V in 1st cycle, and (b) 0.8 V............................................................................. 62
Figure 2.18 Ex-situ XRD characterization of SNP electrode film at different state-of-charge, Mylar
film and wax (used for sticking the electrode to the holder base). ............................................... 63
Figure 2.19 (a) Voltage curve of sodium cobalt titanate from PITT with C/50 current limit, 100
mV step potential tested at 70 oC using 0.5M NaPF6 in EC/DEC electrolyte, and (b) Discharge
capacity and faradaic efficiency with cycle number. .................................................................... 65
Figure 2.20 (a) Voltage profile of sodium cobalt titanate tested under at C/100 rate using 1M
NaClO4 in EC/DMC electrolyte at room temperature, and (b) Ex-situ XRD of SCT at pristine,
20% charged and discharged state. ............................................................................................... 66
Figure 3.1 Schematic of the transition metal slab in layered oxide depicting charge carrier
pathways in (a) P2-NT, and (b) P2-NMT through formation of percolating network; red, blue and
orange spheres denote nickel, titanium, and manganese atoms, respectively. ............................. 75
Figure 3.2 Crystal structure of Na2/3[Ni1/3Ti2/3]O2; blue spheres refer to transition metals (nickel
and titanium), yellow spheres refer to sodium atoms Oxygen atoms are not included for clarity.
....................................................................................................................................................... 76
Figure 3.3 XRD characterization of sodium nickel titanate prepared by solid state reaction from
micron-sized precursors fired for 12 hours duration; The dominant peaks of the impurity and target
phases are indexed. ....................................................................................................................... 77
Figure 3.4 XRD characterization of P2-NT material prepared by solid state reaction from wet-
milled nano-sized precursors fired at (a) 800 oC, and (b) 900 oC, SEM morphology of powders
prepared from (c) micron-sized precursors, and (d) nano-sized precursors. ................................ 79

9
Figure 3.5 (a) XRD comparisons of sodium nickel titanate and sodium nickel manganese titanate
powders prepared by solid state reaction, (b) and SEM powder morphology. ............................. 80
Figure 3.6 (a) Surface morphology of sintered pellets of (a) P2-Na2/3[Ni1/3Ti2/3]O2, and (b) P2-
Na2/3[Ni1/3Mn1/3Ti2/3]O2. ............................................................................................................... 81
Figure 3.7 Cathodic voltage profile under galvanostatic testing rate of C/50 rate for (a) P2-NT
material with cutoff of 4.2 V and, (b) P2-NT material with cutoff of 4.5 V, (c) P2-NMT material
with cutoff of 4.2 V and, (d) P2-NMT material with cutoff of 4.5 V. .......................................... 83
Figure 3.8 Anodic voltage profile of sodium nickel titanate under galvanostatic testing of C/5 rate
with 0.2 V cutoff voltage. ............................................................................................................. 85
Figure 3.9 (a) Electrical equivalent circuit model representing physical processes in a mixed
electronic-ionic conductors with blocking electrodes, (b) Limiting model for high-frequency AC
signal, and (c) Limiting model for DC signal.28 ........................................................................... 87
Figure 3.10 Electrical testing of P2-NMT sintered pellet: (a) High-frequency AC impedance
spectra in temperature range of 383-423 K with 10 K increments, and (b) Current decay response
upon applying a potential of 200 mV at a 383 K. ......................................................................... 88
Figure 3.11 Total effective conductivity (ionic and electronic) and electronic conductivity curves
as a function of temperature from AC impedance and DC testing. .............................................. 89
Figure 3.12 Electrical equivalent circuit model depicting sodium ion transport processes (within
liquid electrolyte, across surface films, across the interface, and bulk solid state diffusion) of the
composite electrode; where Re is the electrolyte resistance, Rsf is the surface film resistance, CPEsf
is the constant phase element due to surface films, CPEct is the constant phase element due to the
double layer, and Zw is the semi-infinite Warburg diffusional element. ...................................... 91
Figure 3.13 Nyquist plot of P2-NT (blue) and P2-NMT (yellow) electrodes scanned between
frequency range of 5 MHz to 10 mHz with inset showing high-frequency depressed semicircles at
voltage of (a) 3.4 V vs. Na/Na+, (b) 3.8 V vs. Na/Na+, and (c) 4.2 V vs. Na/Na+. ....................... 93
Figure 3.14 Potential dependence of (a) charge transfer resistance and double layer capacitance,
and (b) surface film resistance and surface film capacitances. ..................................................... 94
Figure 3.15 Linear fitting of Zreal vs. ω-0.5 curves using planar diffusion model to obtain Warburg
prefactor. ....................................................................................................................................... 96

10
Figure 3.16 Voltage profile under potentiostatic intermittent titration technique using C/100
current limitation for (a) cathodic P2-NT with 5 mV voltage step, and (b) cathodic P2-NMT with
5 mV voltage step, and (c) anodic P2-NT with 15 mV voltage step; inset in cathodic curves depict
electrode precycling at C/10 rate. ................................................................................................. 98
Figure 3.17 (a) Linear fitting of current transients from potentiostatic intermittent titration
technique at different electrode potentials with current limitation of C/100 for cathodic P2-NT
electrode, (b) linear fitting of P2-NMT electrode under identical conditions, and (c) variation of
apparent chemical diffusion co-efficient with electrode potential as calculated from potentiostatic
intermittent titration technique and impedance spectroscopy. ...................................................... 99
Figure 3.18 Ex-situ XRD of electrode films: (a) sodium nickel titanate cathode charged till 4.2 V
with inset showing the evolution of 16o reflection, (b) sodium nickel titanate cathode charged to
4.5 V, (c) sodium nickel manganese titanate cathode charged till 4.2 V, and (d) sodium nickel
titanate anode charged to 0.2 V with inset showing evolution of 16o reflection; all potentials are
measured with respect to Na/Na+. ............................................................................................... 101
Figure 3.19 Capacity retention study with 4.2 V upper voltage cutoff for (a) cathodic sodium nickel
titanate at C/10 rate, (b) cathodic sodium nickel manganese titanate electrodes tested at C/5 rate,
and (c) anodic sodium nickel titanate tested at C/5 rate. ............................................................ 104
Figure 3.20 (a) Nyquist impedance spectroscopy plot of sodium nickel manganese titanate
electrode scanned in frequency range of 5 MHz to 10 mHz after charging to 4.2 V, (b) variation of
impedance resistive parameters, and (c) capacitive parameters during cycling. ........................ 105
Figure 3.21 High-current rate testing of (a) cathodic sodium nickel titanate powders with micron-
and nano-sized powders, (b) cathodic sodium nickel titanate and sodium nickel manganese titanate
electrodes with 4.2 V cutoff, and (c) anodic sodium nickel titanate with cutoff voltage of 0.2 V.
..................................................................................................................................................... 107
Figure 3.22 (a) XRD characterization of 5% and 20% calcium substituted sodium nickel titanate
prepared by solid-state reaction at 900 oC, and (b) EDS mapping of 5% sodium nickel titanate
powders to check calcium distribution. ...................................................................................... 108
Figure 3.23 XRD characterization of powders to synthesize (a) sodium deficient compositions with
x=0.67, 0.55 and 0.50 at firing temperature of 1000 oC for 20 h duration, and (b) Na2/3-yKy
[Li1/3Ti2/3]O2 for y=0, 0.05, 0.10 and 0.15 prepared at firing temperature of 800oC for 20 h. ... 110
Figure 4.1 Variation of interaction energy for Buckingham and Morse interatomic potentials for
Na-O two-body interactions. ....................................................................................................... 125

11
Figure 4.2 Unit cell transformation from space group 194 to 63................................................ 128
Figure 4.3 Space group transformation to generate in-plane ordered structure. ......................... 129
Figure 4.4 Space group transformation to generate through-plane ordered structure. ............... 130
Figure 4.5 Rietveld refinement of P2-NT powders prepared at 900 oC and characterized at (a) 15K,
bank 1, (b) 15K, bank 4, (c) 300K, bank 1, and (d) 300K, bank 4; red point indicates experimental
data, green curve indicates simulated structure, and pink curve indicates difference curve; bank 1,
bank 2 includes diffraction data in the d-spacing range of 0-2.2 Å, and 1.1-8 Å, respectively. . 132
Figure 4.6 Rietveld refinement of P2-NT powders prepared at 1000 oC and characterized at (a)
15K, bank 1, (b) 15K, bank 4, (c) 300K, bank 1, and (d) 300K, bank 4. ................................... 133
Figure 4.7 3D nuclear density map using Rietveld refined 900 oC, 15K structure (a), {100} planar
density describing sodium (b), transition metal (c) and oxygen atoms (d) with minimum and
maximum saturation levels at 0 and 5 Å-3; atomic species legend is included on the right-side of
3D density map. .......................................................................................................................... 136
Figure 4.8 Crystal structure of (a) cubic sodium oxide (Na2O) , (b) cubic nickel oxide (NiO), (c)
tetragonal titanium oxide (TiO2), (d) rhombohedral nickel titanium oxide (NiTiO3), (e) monoclinic
sodium titanate-I (Na2Ti3O7), and (f) monoclinic sodium titanate-II (Na2Ti6O13); yellow, grey, red,
and blue spheres represent sodium, nickel, oxygen, and titanium, respectively. colored polyhedra
represent transition metals co-ordinated with oxygen atoms, sodium are left unbonded for
clarity.40-45 ................................................................................................................................... 138
Figure 4.9 (a) Buckingham potential energy distribution curve, (b) Morse potential energy
distribution curve, (c) probability distribution histogram of randomized structures with equal
atomic distribution between layers using Buckingham potential, and (d) probability distribution
histogram of randomized structures with equal atomic distribution between layers using Morse
potential....................................................................................................................................... 142
Figure 4.10 Probability distribution histogram for (a) unequal sodium distribution using
Buckingham potential, (b) unequal sodium distribution using Morse potential, (c) unequal
transition metal distribution using Buckingham potential, and (d) unequal transition metal
distribution using Morse potential. ............................................................................................. 143
Figure 4.11 Probability distribution histogram for completely randomized structures using (a)
Buckingham potential, and (b) Morse potential. ........................................................................ 144

12
Figure 4.12 Energy distribution curve for ordered and disordered structures using Morse potential.
..................................................................................................................................................... 145
Figure 4.13 Simulated sodium probability density maps in (a) 3D using Buckingham potential and
(b) 3D using Morse potential, (c) 2D along using Buckingham potential, and (d) 2D using Morse
potential; selected 2D cut-sections are parallel to {100} planes; minimum and maximum saturation
levels set at 0 and 5 Å-3. .............................................................................................................. 147
Figure 4.14 Simulated probability density maps for (a) sodium atoms in 3D using Buckingham
potential and (b) sodium atoms in 3D using Morse potential, (c) sodium atoms in 2D using
Buckingham potential, (d) sodium atoms in 2D using Morse potential; 2D cut-sections are parallel
to {100} planes; minimum and maximum saturation levels set at 0 and 5 Å-3. ......................... 148
Figure 4.15 2D oxygen density maps using (a) Buckingham potential, and (b) Morse potential; 2D
cut-sections are parallel to {100} planes; minimum and maximum saturation levels set at 0 and 5
Å-3. .............................................................................................................................................. 149
Figure 4.16 (a) Experimental pair distribution function using Buckingham potential, (b)
experimental pair distribution function using Morse potential, (c) normalized probability density
between Naf and Nae sites on the ‘ab’ plane comparing simulations with experiments, and (d)
normalized probability density between four different Naf-Nae locations using Buckingham
potential....................................................................................................................................... 151
Figure 5.1 (a) Rietveld refinement of O3NT powders prepared by solid-state reaction at 1000 oC
for 10 hours firing duration with inset figure showing powder morphology, (b) SEM morphology
of composite film electrode showing O3NT particles embedded in a carbon network formed by
conductive additive, and (c) EDS mapping of powders showing elemental distribution of carbon
and titanium; refinement was performed with lab powder diffraction dataset using TOPAS
software by Bruker Corporation.13–16 .......................................................................................... 163
Figure 5.2 Voltage-composition curve of O3-Na0.9[Ni0.45Ti0.55]O2 under galvanostatic conditions
of C/50 rate with (a) 4.2 V cutoff, and (b) 4.5 V cutoff; negative ‘x’ value during the 1st charging
cycle is due to side reactions. ...................................................................................................... 164
Figure 5.3 Crystal structure of (a) O3 phase with octahedral co-ordination of sodium, and (b) P3
phase with prismatic co-ordination of sodium demonstrating the different oxygen stacking
sequence. ..................................................................................................................................... 166
Figure 5.4 Ex-situ XRD characterization of O3NT phase at different sodium content; ‘un’ refers
to the unidentified phase formed due to moisture intercalation of the low-sodium content phases.
..................................................................................................................................................... 167

13
Figure 5.5 Rietveld refinement of O3NT electrode (Nax[Ni0,45Ti0.55]O2) prepared by
electrochemical sodium extraction with (a) ‘x’=0.52, and (b) ‘x’=0.39; refinement performed using
TOPAS software from Bruker Corporation, insert figures depict sodium co-ordination
environment and Na-O bond lengths. ......................................................................................... 169
Figure 5.6 (a) Voltage profile of O3-Na0.9[Ni0.45Ti0.55]O2 using Potentiostatic Intermittent Titration
Technique (PITT) with C/100 current and 4.2 V voltage limit, (b) Voltage profile using PITT with
C/100 current and 4.5 V voltage limit, (c) current transient linear fitting with 4.2 V limit, and (d)
current transient linear fitting with 4.5 V limit. .......................................................................... 171
Figure 5.7 Solid-state diffusion co-efficient of sodium ions in O3NT material using potentiostatic
intermittent titration testing......................................................................................................... 172
Figure 5.8 Capacity study of O3-Na0.9[Ni0.45Ti0.55]O2 material: (a) 4.0 V charging limit, (b) 4.2 V
charging limit, (c) 4.4 V charging limit, and (d) Variation of charging capacity with different cut-
off voltage limit........................................................................................................................... 174
Figure 5.9 (a) Nyquist plot of O3NT electrodes charged to 4.2 V during cycling, (b) Bode plots of
O3NT electrodes charged to 4.2 V during cycling, (c) Variation of electrolyte resistance (Re),
surface film resistances (Rsf1 and Rsf2), and charge transfer resistance (Rct) during cycling, and
(d) Variation of double layer capacitance (Cdl) and surface film capacitances (Csf1 and Csf2).
..................................................................................................................................................... 177
Figure 5.10 Variation of peak counter electrode potential with cycle number during galvanostatic
cycling measured against Na/Na+ reference electrode; ideally the measured voltage would be zero
at the counter electrode as it has the same chemical potential as the reference electrode. ......... 178
Figure 5.11 Rate performance testing of O3-Na0.9[Ni0.45Ti0.55]O2 material with 4.2 V cut-off
voltage (a) capacity retention, and (b) voltage profiles. ............................................................. 180

14
1. INTRODUCTION
1.1 Climate Change: A Major Challenge of the 21st Century
The amount of atmospheric carbon dioxide has substantially increased over the past two decades
and was estimated to be at 395 ppm in 2014 (Figure 1.1a).1,2
The increasing amount of carbon
dioxide along with other anthropogenically produced greenhouse gases (methane, nitrous oxide,
fluorinated gases, etc.) has led to the warming of the climate system. Global climate change is
anticipated to result in a number of deleterious effects such as higher surface temperatures-land
and oceanic (Figure 1.1b)3, elevation of mean sea level, acidification of the ocean and alteration,
natural weather patterns (including precipitation, drought, etc.).1,3-6
Even though these harmful
effects are widely recognized, there are significant hurdles to reduce gas emissions due to the
complex interplay between climate change, ecology, and economy.7-11
International agencies such as United Nations Framework Convention on Climate Change
(UNFCC) and Intergovernmental Panel on Climate Change (IPCC) have been striving to achieve
a global collective consensus on emission reductions. Climate change has become one of the prime
challenges of the 21st century and advancing and developing alternate green technology solutions
is of paramount importance.

15
(a) (b)
Figure 1.1 (a) Global carbon dioxide uptake over past decades, (b) Surface temperature
anomalies;3 For interpretation of references to color in this and all other figures, the reader is
referred to the electronic version of this thesis.
1.2 Sources of GreenHouse Gas Emissions
The combustion of fossil fuels (coal, natural gas and oil) for energy generation is the largest
contributor (26%) of global (Greenhouse gases) GHG emissions (Figure 1.2a) based on estimates
by U.S. Environmental Protection Agency (EPA).12
The global energy usage has grown
substantially as shown in Figure 1.2b and the currently at 530 Quadrillion Btu in 2012 based on
estimates by U.S. Energy Information Administration (EIA).13
In the light of ever-growing energy
needs in the modern society, developing improved low-carbon renewable sources (wind and solar)
and wide-scale integration of these technologies are vital for generating clean and sustainable
energy. The unavailability of cheap, high-performance energy storage devices is considered a
major setback for increasing the adoption of renewable energy sources.14-16
1980 1990 2000 2010 2020
340
360
380
400
Glo
bal C
O2 in
pp
m
Year

16
(a) (b)
Figure 1.2 (a) Global greenhouse gas emissions,12
and (b) Global energy consumption in past
decades.13
EPA reports transportation sector to be a significant emissions contributor at 13% (Figure
1.2).12
Emission reductions in this sector are addressed by government regulations stipulating
increased automobile fuel efficiencies spurring the advancement of hybrid and fully electric
drivetrains that incorporate energy storage devices (batteries).
1.3 Renewable Energy Technologies: Benefits and Issues
Renewable energy sources such as wind, solar, geothermal, etc. are extensively developed as
viable alternative sources of clean energy with minimal carbon footprint. Widespread deployment
of renewable energy technologies would provide the following benefits:
i. Achieve compliance with emission standards to combat global climate change
provides capacity addition to meet the ever-increasing energy demands of the society
Waste
3%
Building
8%
Industry
19%
Agriculture
14%
Forestry
17%
Transport
13%
Energy
26%
1980 1990 2000 20100
100
200
300
400
500
Glo
ba
l E
ne
rgy C
on
su
mptio
n
(x1
015B
tu)
Year

17
ii. Reduce dependence on depleting non-renewable fossil fuel reserves and provide
economic stability by locally producing energy and cut down on oil imports
iii. Provide a cleaner environment without air or water pollution by zero-emissions operation
iv. Decentralize electricity grids and potentially aid in creating self-sufficient/off-grid homes
and communities
Despite these advantages, renewables accounted for a paltry 19% of the global energy
production in 2012 (Figure 1.3a).17
Nevertheless, the electricity output from renewables has
shown a promising rising trajectory (Figure 1.3b), and is anticipated to increase further.17
(a) (b)
Figure 1.3 (a) Global energy generation by sources,17 (b) Renewable energy estimated output
and projections.17
Renewable technologies, such as solar and wind, are highly intermittent and this poses
challenges while catering to the complex electricity demands of the end-consumers. For instance,
solar energy has significant variations in the electricity output depending on factors like day/night
Nuclear
2.6%
Renewable
19%Fossil Fuel
78.4%
2000
2001
2002
2003
2004
2005
2006
2007
2008
2009
2010
2011
2012
2013
0
50
100
150
200
250
300
Ene
rgy G
en
era
tio
n (
GW
) Wind
Solar-PV

18
cycle, cloud cover, sun positioning, etc. as shown in Figure 1.4a.18
Temporally and geographically
uneven wind flow patterns can lead to unpredictable power output from wind energy technology
(Figure 1.4b).18
For instance, Germany, with large investments in renewable sources (as a
consequence of the ‘Energiewende’ plan) has had 200,000 blackouts in 2011 due to unreliable
power generation further substantiating the intermittency issue.19
(a)
(b)
Figure 1.4 Variability in (a) solar power output and, (b) wind power output.18

19
Energy storage devices can act as a buffer by storing excess energy during times of surplus
generation and provide the stored energy during times of lean generation (termed as ‘time-
shifting’). Development of low-cost, long-life energy storage devices would help reduce the
variability in renewable throughput and improve overall reliability. In addition to being vital cogs
for renewables technologies, large-scale energy storage devices can be beneficial to the
conventional electricity grid by
i. Providing load leveling for traditional power plants (coal, natural gas and nuclear) and
improve the overall efficiency by permitting optimal constant capacity operation (no ramp-
up or ramp-down cycles and eliminates the need for inefficient ‘peaker’ plants)
ii. Enhancing the power quality by voltage and frequency regulation
iii. Improving grid reliability by reducing power outages and acting as a backup system
1.4 Energy Storage Technologies for Stationary Applications
Different energy storage technologies have been developed and commercialized for stationary
applications and includes
i. Pumped Hydroelectric Storage (PHS)
ii. Compressed Air Energy Storage (CAES)
iii. Electrochemical Energy Storage (EES)
iv. Flywheels (FW)
While PHS, CAES and FW technologies harness mechanical conversion processes, EES
utilizes chemical conversion methods. A schematic of working mechanisms of these storage
technologies is illustrated in Figure 1.5.

20
1.4.1 Pumped Hydroelectric Storage
PHS operates by pumping water to an elevated reservoir (from ground level) and running it through
a turbine to extract the stored potential energy (Figure 1.5a). PHS is currently the largest energy
storage method and provides 99% of the net global capacity (127 GW). This is because PHS
provides a means for large capacity installations at low operational costs (Figure 1.6a).20
The
stored energy scales linearly with mass (or volume) of stored water and elevation difference
(EP=mgh, where ‘EP’ is the potential energy, ‘m’ is the mass, ‘g’ is the acceleration due to gravity,
‘h’ is the potential head). PHS supports long lifetime (13,000 cycles) as depicted in Figure 1.6b.21
However, constructing new PHS facilities requires specific geographical locations such as hilly
terrains and accessible large water bodies. Hence, hydroelectric technology is mostly constructed
near river canyons with proper topographical features and rock formations. Consequently, it is
becomes geographically constrained and suitable only for large-capacity installations.
1.4.2 Compressed Air Energy Storage
CAES operates by compressing gasses into enclosed spaces (caverns, special rock formations,
abandoned oil mines, etc.) as illustrated in Figure 1.5b. It has a net installed capacity of 440 MW,
three orders of magnitude lower than PHS. CAES provides comparable lifetime (13,000 cycles) to
PHS. However, like PHS this technology also requires specific geographic formations (to avoid
pressure losses to surroundings). Another approach has been make use of high-pressure tanks but
this limits the scale of the application due to technological limitations and increases installation
costs.20

21
(a) (b)
(c) (d)
Figure 1.5 Schematic representation of (a) pumped hydroelectric system, (b) compressed air
energy storage system, (c) electrochemical energy storage system with Na/S battery chemistry,
and (d) flywheel system.22
1.4.3 Electrochemical Energy Storage
1.4.3.1 Na/S batteries
Na/S batteries (EES) operate with molten sodium and sulfur as the active components using an
electrochemical setup as illustrated in Figure 1.5c. The modular design allows for easy installation
anywhere using scalable battery packs. However, these devices have a shorter lifetime (4500
cycles) and higher installation costs ($535/kWh) than PHS and CAES as shown in Figure 1.6a and
b.21
The high temperature operation using super reactive molten elements poses challenges in
22
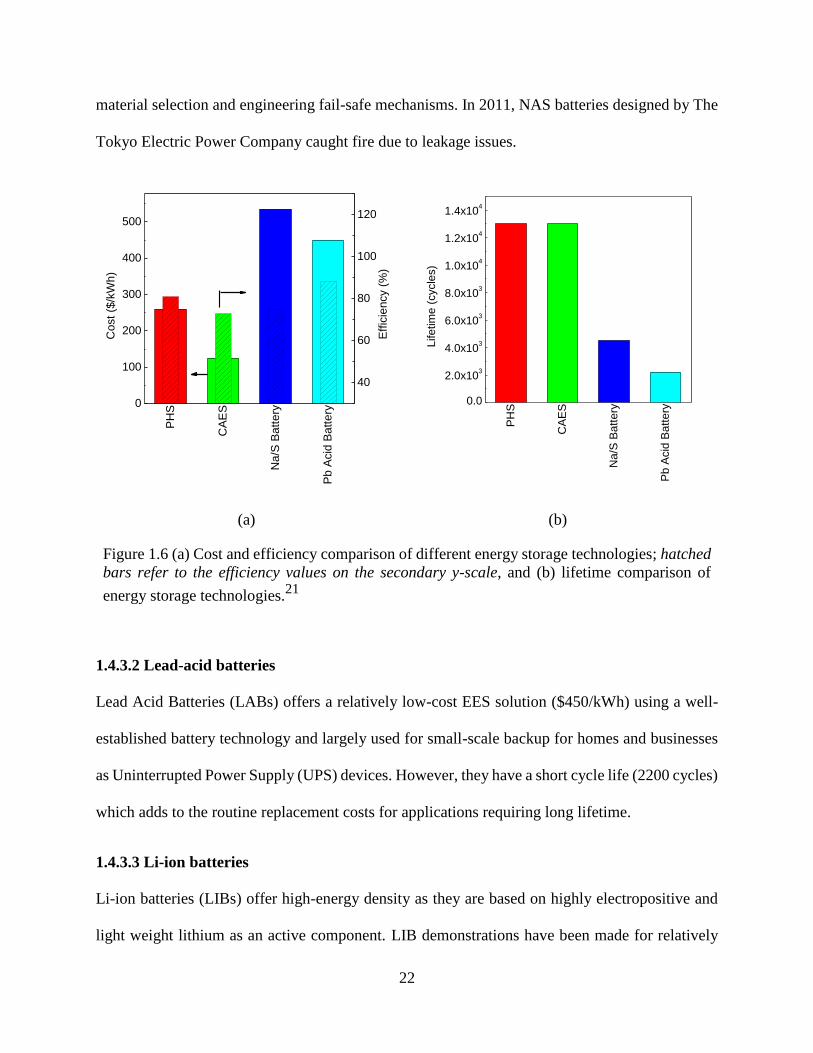
material selection and engineering fail-safe mechanisms. In 2011, NAS batteries designed by The
Tokyo Electric Power Company caught fire due to leakage issues.
(a) (b)
Figure 1.6 (a) Cost and efficiency comparison of different energy storage technologies; hatched
bars refer to the efficiency values on the secondary y-scale, and (b) lifetime comparison of
energy storage technologies.21
1.4.3.2 Lead-acid batteries
Lead Acid Batteries (LABs) offers a relatively low-cost EES solution ($450/kWh) using a well-
established battery technology and largely used for small-scale backup for homes and businesses
as Uninterrupted Power Supply (UPS) devices. However, they have a short cycle life (2200 cycles)
which adds to the routine replacement costs for applications requiring long lifetime.
1.4.3.3 Li-ion batteries
Li-ion batteries (LIBs) offer high-energy density as they are based on highly electropositive and
light weight lithium as an active component. LIB demonstrations have been made for relatively
40
60
80
100
120
PH
S
CA
ES
Na/S
Batt
ery
Pb A
cid
Batt
ery
0
100
200
300
400
500
Co
st
($/k
Wh
)
Eff
icie
ncy (
%)
PH
S
CA
ES
Na
/S B
att
ery
Pb
Acid
Ba
tte
ry
0.0
2.0x10³
4.0x10³
6.0x10³
8.0x10³
1.0x10⁴
1.2x10⁴
1.4x10⁴
Life
tim
e (
cycle
s)

23
small-scale frequency regulation and renewables applications so far with good efficiency (90%).
However, they remain fairly expensive for bulk energy storage. Safety issues due to lithium
dendritic plating, electrolyte decomposition due to overcharging, etc. can arise if used beyond the
recommended operating specifications and in-built circuits coupled with sensors actively monitor
individual cell voltages (within a pack). These circuits help avoid overcharging, and temperature
abnormalities that can potentially lead to battery failures.23
It is anticipated that high-volume
manufacturing of larger LIB packs for automotive drivetrains would lead to cost-reductions and
enable increased usage in stationary sectors.
1.4.4 Flywheels
Flywheels work by converting electrical energy into kinetic energy in the form of angular
momentum of a spinning rotor as illustrated in Figure 1.5d. At a smaller scale, they are extensively
employed in automobiles to transfer the energy from the power stroke to idle strokes of a
combustion cycle and help level-out the power output. Stationary applications require high
operational efficiency and this is typically attained by spinning the rotors inside low-pressure
chambers to minimize frictional losses.
Since kinetic energy scales non-linearly with angular velocity (Ek=1/2*I*v2, where ‘Ek’ is the
kinetic energy, ‘I’ is the moment of inertia and ‘v’ is the angular velocity), it is beneficial to run
these devices at high rotational speeds. However, faster spinning can lead to higher inertial stresses
and subsequent device failure.24
State-of-the-art flywheels have been engineered to operate for
around 100,000 cycles. However, high costs ($8300/kWh) restrict flywheels to frequency
regulation-related applications.

24
Figure 1.7 Market segments for energy storage devices in the electricity grid.
Figure 1.8 Energy storage technologies employed for various stationary applications.21
1.5 Market need for stationary sector
The grid sector can be partitioned into three segments: generation, transmission and distribution
and end-user (Figure 1.7) and EES can be implemented in various levels shown in Figure 1.8. A

25
single EES technology is incapable of addressing the performance specifications and cost demands
for all these segments in the grid sector. Hence, a multitude of technology solutions address the
varied needs and EES technologies primarily compete for mid-scale T&D and small-scale end-
user applications.
LIBs perform fairly well but are limited by high installation costs while the cheaper LABs do
not offer good cycle-life characteristics. Thus, there is a market demand for a cost-effective EES
technology in the stationary sector that can fill-in this gap between LIBs and LABs. The newly
researched alternate battery chemistries are anticipated to address this market need by having
comparable performance to LIBs while still being relatively inexpensive. The Department of
Energy (DOE) target specifications for EES devices are less than $150/kWh cost, at least 80%
faradaic efficiency and minimum cycle-life of 5000, as shown in Table 1.1. Current EES devices
do not meet these specifications and the newly researched alternate chemistries are anticipated to
enable development of low-cost, highly-efficient, long-life devices.
Table 1.1 Short-term and Long-term DOE targets for EES technologies (stationary
applications).25
Product Specification Short-term Target Long-term Target
Cost <$250/kWh <$150/kWh
Efficiency >75% >80%
Cycle life 4000 5000
1.6 Need for Alternate Battery Chemistry
Alternate battery chemistries, such as sodium and magnesium-based technologies, rely on earth-
abundant natural resources. Cost-reductions are targeted by relying on widely available,
inexpensive raw materials. It is expected that these low-cost devices would help overcome the
critical barrier for EES technologies into entering the various grid segments. Higher atomic weight

26
species like sodium and magnesium can be utilized for these applications since the grid sector does
not place a large premium on attaining high specific energy (Wh/kg).
By 2100, the global lithium consumption by the transportation sector run in entirety by electric
vehicles (with 90% recycling) is predicted to be 20 Mt. On the other hand, optimistic estimates for
available lithium resource is 39 Mt.26
In this best-case scenario, the demand for lithium mineral
would be barely sufficient to meet the needs of automotive sector while omitting other potential
applications like grid storage.27 The relative abundance of sodium is significantly higher than that
of lithium minerals as shown in Figure 1.9. It is estimated that the available sodium resources in
earth’s crust and oceans exceeds lithium resources by 3 and 5 orders of magnitude, respectively as
seen from Table 1.2. Commercially, sodium is extracted from brine solutions (NaCl) using Solvay
process, an important industrial method, to produce soda ash (Na2CO3). Due to significance of
soda ash to chemical industries (annual production of 11.6 MT), its monthly production rate is
utilized as one of the economic indicators by the Federal Reserve Board.28
Considering the
enormity of the grid sector applications that scarcely utilizes batteries at the present, it is prudent
to design a battery chemistry based on a cheap, mass-manufactured chemical commodity.

27
Figure 1.9 Relative abundance chart depicting plentiful sodium element as compared to
lithium.29
Table 1.2 Comparison of resources and physical properties of lithium, sodium and magnesium30
Property Lithium Sodium Magnesium
Crustal Abundance (ppm) 20 23,600 23,300
Oceanic Abundance (mg/L) 0.1 10,800 1,290
Resources (MT) 40 Unlimited Unlimited
Redox Potential (V) vs. SHE -3.04 -2.71 -2.37
Atomic Mass (amu) 6.941 22.999 24.305
Atomic Radii (pm) 76 102 72
Ionic Charge 1+ 1+ 2+
Additionally, the majority of the lithium resources are restricted to few countries and geopolitics
can potentially become an issue for ramping up production levels. However, sodium resources
have a more uniform global distribution (Table 1.2) and mineral costs would not be affected by
geopolitical issues as much. Due to cheap and wide-scale mineral availability, sodium-based
batteries offer the considerable potential for developing low-cost EES. This new EES technology

28
would help in product diversification of EES methods, potentially fill-in the market gap between
LIBs and LABs and enable greater deployment of EES in various segments of the grid sector.
1.7 Rationale for investigating Na-based batteries
1.7.1 Na-ion vs Mg-ion batteries
Sodium- and magnesium-based chemistries are highly researched as alternate battery chemistries
for grid storage sector.31-33
In terms of resource availability, both sodium and magnesium are
fairly abundant in earth’s crust as shown in Table 1.2. The standard reduction potential of sodium
is closer to lithium (300 mV) than magnesium (600 mV). The more electropositive character of
sodium than magnesium would permit building higher voltage cells with the former. Higher cell
voltage translates to fewer cells/pack to achieve the product specification stack-level voltage and
subsequently reduces failure modes owing to individual cell variability. Having fewer cells to
monitor can also reduce the complexity in control systems at the pack level.
Additionally, the divalent magnesium ions is known to suffer from extremely slow solid-state
diffusion due to strong interactions between magnesium ions and the host anions (larger coulombic
attractive forces).33
Hence, it is desirable to use monovalent intercalant species such as sodium to
reduce the polarizing interactions and obtain reasonable fast solid-state diffusivity, essential for
practical applications. The room temperature and intercalation-based operation of sodium-ion
chemistries would eliminate the potential safety issues that are usually associated with high-
temperature Na/S batteries.

29
1.7.2 Relative ease of scalability
The high-volume manufacturing practices of building large lithium battery packs (~50 kWh) are
currently being optimized and this scaling effect is expected to produce marked cost-savings for
transportation sector. A conventional battery manufacturing process is shown in Figure 1.10.
Figure 1.10 Manufacturing steps for advanced batteries such as Li-ion chemistry.
Existing LIB plants can be modified to manufacture sodium-based batteries without the need
for new equipment or facility upgrades. The dryroom conditions currently used for LIBs would be
suitable for sodium battery manufacturing. This transition can be performed by incorporating few
key changes to the existing process modules as follows:
i. Replace lithium-based active powders with sodium-based active powders in the ‘mixer’
module to fabricate sodium intercalation electrodes
ii. Optimize electrolyte slurry viscosity and film thickness to specification levels in the
‘coating’ module to prepare electrode films of desired quality
iii. Replace lithium-based salt with sodium-based salt in the ‘filling’ module to allow for
relatively fast sodium ionic conduction in the non-aqueous electrolytes

30
iv. Change organic solvent (linear and cyclic carbonate) type and ratios in the ‘filling’ module
to suit the requirements for sodium batteries
By this relatively straightforward approach, the key cost saving measures of LIBs can be readily
transferred to sodium-chemistries. This would also advance technology development from lab-
scale research to building device prototypes to mass manufacturing in a fairly rapid fashion.
1.8 Insertion-based Batteries: Working Principle
Insertion/Intercalation-based batteries function on the fundamental principle of a galvanic cell;
electric current generated by two spontaneous, spatially separated redox reactions is utilized for
doing external work. The redox reactions in insertion batteries are facilitated by transition metal
species that occupy specific crystallographic sites in an inorganic material. So, when the oxidation
state of the transition metal changes, the concentration of the intercalant species gets modified by
electrochemical ion exchange process to maintain overall charge neutrality.
Thus, when using intercalation electrodes are utilized as anode and cathode, the intercalant
species gets shuttled between them through the electrolyte media that allows for only ion transport.
This ‘rocking-chair’ mechanism is illustrated in Figure 1.11 using lithium/sodium as the intercalant
species, and LiCoO2/NaCoO2 as electrode materials.
Insertion/removal of intercalant species in the host electrode framework can lead to changes in
physicochemical and structural properties and even phase transformations. For attaining long
cycle-life, the intercalant species needs to be shuttled between the two electrodes for at least a few
1000 cycles while accommodating concomitant lattice stresses. Intercalation-based batteries that
use solid-solution mechanisms do have electrodes undergo phase changes and typically offer
excellent cycle life compared to other battery mechanisms (such as alloying). This is because the

31
host electrode materials retain their original structure fairly well and hence their intercalation
capacity remains reasonably stable. Cycle life is a key performance specification for stationary
applications and this research is focused only on intercalation-based materials.
Figure 1.11 Working principle of an insertion/intercalation-based battery.34
1.9 Requisites for Intercalation-based Electrodes
Designing high-performance, intercalation-type battery materials requires selecting electrodes
with the following essential properties:
i. High electronic conductivity: Intercalation reactions involve exchange of intercalant species
and a concomitant redox reaction. Materials with high electronic conductivity would facilitate
faster electron/hole hopping to the electrode-electrolyte interface where electrochemical
reactions occur.

32
ii. High ionic conductivity: Intercalant species needs to diffuse fairly rapidly within the host
material so that they can reach the electrode-electrolyte interface. This requires materials with
inter-connected channels/tunnels where the intercalant species can reside.
iii. Fast interfacial kinetics: The interfacial reaction that occurs at the electrode/electrolyte
interface allows needs to have fast heterogeneous reaction kinetics.
iv. High redox potential: The redox potential of the electrode is directly proportional to the free
energy of the formation between product (de-intercalated state for anode) and reactant
(intercalated state for anode) as given by the Nernst equation (under electrochemical
equilibrium): ∆𝐺 = 𝐺𝑃𝑑𝑡 − 𝐺𝑅𝑐𝑡 = −𝑛𝐹𝐸, where ‘ΔG’ refers to the Gibb’s free energy for the
reaction, ‘GPdt’ and ‘GRct’ are the free energy of the product and reactant, respectively, ‘n’ is
the number of electrons transferred during the redox reaction, ‘F’ is Faraday’s constant and
‘E’ is the standard reduction potential
v. Structural stability: Preserving the structure of the host materials during intercalation/de-
intercalation is essential to retain the intercalant crystallographic sites. Significant changes in
structure (phase transitions) can lead to loss of available intercalation sites and consequently
poor charge storage capability. For instance, a material transforming from crystalline to
amorphous would completely lose charge-storage capability due to intercalation mechanisms.
vi. Stable Solid Electrolyte Interface (SEI): Insertion-electrodes typically operate in highly
oxidizing and reducing conditions. Current Li-ion battery electrolytes rely on kinetic barriers
to limit the thermodynamically favored reduction reactions at the anode (graphite). Formation
of a stable, compact, electrically insulating and ionically conducting SEI as a passivation layer
is essential to limit the side-reactions and attain stable capacity retention.35
Finding suitable

33
electrolyte chemistries that can support different electrode materials by forming a stable SEI
is one of the key challenges for realizing practical Na-ion chemistry devices.
1.10 Research Problem
Driven by the potential for stationary applications, Na-ion batteries has become a highly
researched area in the recent years as highlighted by the rapidly growing number of research
publications as shown in Figure 1.12. 31,32,36-38
Identification and characterization of new, high-performance functional materials that can
support reversible sodium intercalation/de-intercalation reactions remains one of the key
challenges in Na-ion battery field. Exploratory research of new inorganic host materials forms the
cornerstone for advanced batteries and can possibly open up new avenues for different application
areas. This thesis research embarks on an exploratory research to identify potentially new
inorganic host electrodes and characterize promising electrode candidates. The research goals
include shortlisting promising compositions and increasing the understanding of material and
electrochemical properties that would eventually lead to device prototyping and product
commercialization.

34
Figure 1.12 Growing number of research publications on anode materials for Na-ion battery.36
1.11 Thesis organization
The second chapter of this dissertation begins with evaluating sodium metal SEI in different
electrolytes and passivation study of current collectors. Thereafter, it discusses about the
exploratory study of novel tunnel-type electrode materials: sodium nickel phosphate
(Na4Ni7[PO4]6) and sodium cobalt titanate (Na0.8Co0.4Ti1.6O4). The synthetic strategies and
electrochemical characterization of these materials are elaborated.
The third chapter elaborates the characterization of sodium nickel titanate (P2-
Na2/3[Ni1/3Ti2/3]O2) with prismatic co-ordination of sodium atoms. We evaluate the
electrochemistry of this novel layer-structured material by selectively activating nickel and
titanium redox couples. The bottleneck physicochemical processes are evaluated using impedance
spectroscopy and the role of manganese substitution (P2-Na2/3[Ni1/3Mn1/3Ti1/3]O2) on the
electrical, ionic and electrochemical properties of these compositions are studied.

35
The fourth chapter discusses the structural characterization of sodium nickel titanate (P2) using
experimental (neutron diffraction) and computational methods (atomistic simulations). Rietveld
refinement provides average structural information while force field models simulate average and
local structural details. Computational methods were utilized to develop atomic density maps and
the simulated structural patterns were found to be consistent with the experimental results.
The fifth chapter covers synthesis, structural and electrochemical characterization of sodium
nickel titanate material (O3-Na0.9[Ni0.45Ti0.55]O2) with octahedral co-ordination of sodium atoms.
We investigate the stabilizing influence of titanium atoms to mitigate poor capacity retention of
O3-type electrode materials and perform cycling-coupled-impedance studies, step-potential
electroanalytical testing, and ex-situ XRD characterization.

36
BIBLIOGRAPHY

37
BIBLIOGRAPHY
1. Alley, R. et al. Summary for policymakers. Climate Change 2007 : The Physical Science
Basis. Cambridge Univ. Press
2. Tans, P. & Keeling, R. http://www.esrl.noaa.gov/gmd/ccgg/trends/. (2014).
3. Hansen, J., Ruedy, R., Sato, M. & Lo, K. Global Surface Temperature Change. Rev.
Geophys. 48, 1–29 (2010).
4. Tett, S. F. B., Stott, P. A., Allen, M. R., Ingram, W. J. & Mitchell, J. F. B. Causes of
twentieth-century temperature change near the Earth’s surface. Nature 399, 569–572
(1999).
5. Liverman, D. From Uncertain to Unequivocal. Environ. Sci. Policy Sustain. Dev. 49, 28–
32 (2007).
6. Dessler, A. & Parson, E. The science and politics of global climate change. (Cambridge
University Press, 2010).
7. Thomas, C. D. et al. Extinction risk from climate change. Nature 427, 145–8 (2004).
8. Araújo, M. B. & Rahbek, C. Ecology. How does climate change affect biodiversity?
Science (80-. ). 313, 1396–7 (2006).
9. Thuiller, W. Climate change and the ecologist. Nature 448, 1–3 (2007).
10. Stern, N. What is the Economics of Climate Change ? World Econ. 7, 1–10 (2006).
11. Tol, R. S. J. The Economic Effects of Climate Change. J. Econ. Perspect. 23, 29–51
(2009).
12. Inventory of U.S. Greenhouse Gas Emissions and Sinks: 1990-2013, Executive Summary.
Annu. Rep. 1–27 (2013).
13. International Energy Statistics.
http://www.eia.gov/cfapps/ipdbproject/iedindex3.cfm?tid=44&pid=44&aid=2&cid=ww,
&syid=1980&eyid=2012&unit=QBTU (2015).
14. Beaudin, M., Zareipour, H., Schellenberglabe, A. & Rosehart, W. Energy storage for
mitigating the variability of renewable electricity sources: An updated review. Energy
Sustain. Dev. 14, 302–314 (2010).
15. Denholm, P., Ela, E., Kirby, B. & Milligan, M. The Role of energy storage with renewable
electricity generation. (2010).

38
16. Barnhart, C. J. & Benson, S. M. On the importance of reducing the energetic and material
demands of electrical energy storage. Energy Environ. Sci. 6, 1083 (2013).
17. REN21, Global Status Report 2014 (Renewable Energy Policy Network for the 21st
Century); available at www.ren21.net/Portals/0/documents/e-paper/GSR2014/index.html.
18. Teleke, S., Baran, M. E., Bhattacharya, S. & Huang, A. Q. Rule-Based Control of Battery
Energy Storage for Dispatching Intermittent Renewable Sources. IEEE Trans. Sustain.
Energy 1, 117–124 (2010).
19. Schiermeier, Q. Germany’s Energy Gamble. Nature 496, 156–158 (2013).
20. Hadjipaschalis, I., Poullikkas, A. & Efthimiou, V. Overview of current and future energy
storage technologies for electric power applications. Renew. Sustain. Energy Rev. 13,
1513–1522 (2009).
21. Electricity Energy Storage Technology Options; EPRI White Paper. (2010).
22. http://energystorage.org/energy-storage/technologies/flywheels.
23. Smart, M. C. & Ratnakumar, B. V. Effects of Electrolyte Composition on Lithium Plating
in Lithium-Ion Cells. J. Electrochem. Soc. 158, A379–A389 (2011).
24. Tzeng, J., Emerson, R. & Moy, P. Composite flywheels for energy storage. Compos. Sci.
Technol. 66, 2520–2527 (2006).
25. Grid Energy Storage: Executive summary; U.S. DOE. (2013).
26. Gruber, P. W. et al. Global Lithium Availability. J. Ind. Ecol. 15, 760–775 (2011).
27. Tarascon, J.-M. Is lithium the new gold? Nat. Chem. 2, 510 (2010).
28. http://minerals.usgs.gov/minerals/pubs/commodity/soda_ash/.
29. Rare Earth Elements- Critical Resources for High Technology; USGS Fact Sheet 087-02.
(2002).
30. CRC Handbook of Physics and Chemistry, 77th Edition.
31. Slater, M. D., Kim, D., Lee, E. & Johnson, C. S. Sodium-Ion Batteries. Adv. Funct. Mater.
23, 947–958 (2013).
32. Palomares, V. et al. Na-ion batteries, recent advances and present challenges to become
low cost energy storage systems. Energy Environ. Sci. 5, 5884–5901 (2012).

39
33. Levi, E., Gofer, Y. & Aurbach, D. On the Way to Rechargeable Mg Batteries: The
Challenge of New Cathode Materials. Chem. Mater. 22, 860–868 (2010).
34. http://neutronsources.org/news/scientific-highlights/towards-sodium-ion-batteries-
understanding-sodium-dynamics-on-a-microscopic-level.html.
35. Peled, E., Golodnitsky, D. & Penciner, J. Handbook of Battery Materials. (2011).
36. Dahbi, M., Yabuuchi, N., Kubota, K., Tokiwa, K. & Komaba, S. Negative electrodes for
Na-ion batteries. Phys. Chem. Chem. Phys. 16, 15007 (2014).
37. Pan, H., Hu, Y.-S. & Chen, L. Room-Temperature Stationary Sodium-Ion Batteries for
Large-Scale Electric Energy Storage. Energy Environ. Sci. 6, (2013).
38. Ellis, B. L. & Nazar, L. F. Sodium and sodium-ion energy storage batteries. Curr. Opin.
Solid State Mater. Sci. 16, 168–177 (2012).

40
2. SYNTHESIS, AND ELECTROCHEMICAL CHARACTERIZATION OF
NOVEL TUNNEL-TYPE SODIUM INTERCALATION MATERIALS
2.1 Introduction
Tunnel-type inorganic battery materials can be classified into two structural categories: polyanion-
and spinel-based. Polyanion-based electrode materials have tetrahedrally co-ordinated polyanionic
functional groups (XO4)n-, where ‘X’ can be P, Si, W, Mo or As, as a distinct structural feature.
Some of the well-studied polyanionic materials include LiMPO4(M-Fe, Mn, Ni, Co), Li2MSiO4
(M- Fe, Mn), LiMSO4F (M- Co, Ni), etc.1-6 These materials possess covalently bonded oxygen
atoms that provide excellent charging stability (especially at high potentials) and improved thermal
stability.1,7
Hence, these polyanionic materials are intrinsically safer, an important feature for
large-scale grid storage applications.
Additionally, suitable selection of polyanion functional groups allows for selective tuning of
the redox potential of the transition metal species. For instance, the transition metal in NASICON-
structured materials have shown a wide range of redox potential values solely based on the type of
polyanion framework.8-10
The bonding nature of the polyanion groups affect the ionicity of the
transition metal-oxygen bonds and hence alters the redox potential.
For Na-ion batteries, polyanionic materials such as Na2MPO4F (M- Fe, Mn), Na2MP2O7 (M-
Fe, Co, Mn, Cu), NaFePO4, Na3M2(PO4)3 (M- V, Ti), Na3M2(PO4)2F3 (M- Ti, Fe, V) have shown
promise.11-19
In this section, Sodium nickel phosphate (SNP), with stoichiometry Na4Ni7(PO4)6,
is investigated as a potential tunnel-type electrode to take advantage of the structural stability of
these classes of materials.

41
Spinels, with general stoichiometry AB2O4, have been shown to possess attractive
intercalation/de-intercalation properties using compositions such as LiMn2O4 and Li1[Li0.33Ti1.67]
O4.20-24 This piqued our interest in exploring similar prototypical structures with sodium as
intercalant species with spinel-related host framework. However, spinel structures are not
favorable for sodium-based quaternary oxides due to the large-size of the sodium atoms for the
tetrahedral ‘8a’ sites. Instead, they form calcium ferrite-based prototypical structures with single
or double tunnels depending that allows for a longer Na-O bond.25 Sodium cobalt titanate (SCT),
with stoichiometry Na0.8Co0.4Ti1.6O4, has calcium ferrite-type structure and is investigated as an
alternative tunnel-type electrode candidate.
This chapter discusses about synthesis and electrochemistry of two tunnel-type materials with
compositions Na4Ni7(PO4)6 (polyanionic-based) and Na0.8Co0.4Ti1.6O4 (calcium ferrite-based).
Both these tunnel-type materials contain electrochemically-inert units, in the form of phosphate
tetrahedra and titanium octahedra, which interconnect to form a relatively stable host-framework
with possibly improved structural stability. Sodium ion conduction would occur in the in 3-D
interconnected tunnels that lie within the host framework.
2.2 Structural features
2.2.1 Sodium nickel phosphate: Na4Ni7(PO4)6
Previously, the crystal structure of Na4Ni7(PO4)6 was refined using X-ray diffraction with single-
crystals grown by flux method.26
Space group ‘Cm’ was found to provide the best fit for the
experimental diffraction dataset and nickel and phosphorus were assigned octahedral and
tetrahedral co-ordination, respectively. The structure is comprised of a ‘Ni layer’ containing
interconnected nickel octahedra and phosphorus tetrahedra lying parallel to the ‘ab’ plane. These

42
‘Ni-layers’ are in-turn linked by corner-shared phosphorus polyhedra resulting in parallel
tunnels/cavities that hosts sodium atoms (Figure 2.1). The presence of continuous tunnels and
unoccupied sodium sites in this phosphate material provides the feasibility for reasonably facile
solid-state sodium ion transport. We anticipate that the phosphate units between the ‘Ni-layers’
would act as ‘linking pillars’ rendering structural stability by keeping the layers together during
electrochemical de-sodiation.
Figure 2.1 Crystal structure of Na4Ni7(PO4)6; Pink polyhedra represents nickel octahedra, green
polyhedra represents phosphate tetrahedra and yellow spheres indicate sodium atoms. Oxygen
atoms are not included for clarity.26
2.2.2 Sodium cobalt titanate: Na0.8Co0.4Ti1.6O4
Na0.8M0.4Ti1.6O4 was reported to crystallize with space group Pnma.25
The studied composition,
Na0.8Co0.4Ti1.6O2, has edge-shared groups of four transition metal octahedra (blue polyhedra)
forming ‘Z-shaped’ chains that run parallel to the b-axis infinitely as shown in Figure 2.2. It is
likely that these quaternary oxides support facile sodium ion transport due to their low activation
energy (1.1 eV) for sodium hopping and unusually high sodium thermal vibrational parameter
(U22).25,27

43
Figure 2.2 Crystal structure of Na0.8Co0.4Ti1.6O4; blue polyhedra represents transition metal
octahedra (cobalt and titanium) and yellow spheres represent sodium atoms; oxygen atoms are
omitted for clarity.25
2.3 Inorganic Synthesis
The synthetic conditions for the quaternary oxide phases were optimized to yield powders of
desirable morphology for fabrication of composite, porous electrode films. Battery electrodes
typically consists of powders with relatively small-sized particles (preferably in the length-scale
of 100s of micrometer to nanometers) to avoid potential transport limitations. High-temperature
powder processing can lead to particle sintering and this should be avoided.
2.3.1 Sodium nickel phosphate synthesis
Previous report of SNP synthesis was carried out by slow cooling of high temperature melts
(1150oC) to obtain single crystals for diffraction studies.26
We developed a solid state synthetic
method to produce phase-pure powders at a much lower temperature.
The precursors Na2CO3 (S4132, Sigma-Aldrich, 99.5%), NiO (399523, Sigma-Aldrich, 99%)
and NH4H2(PO4)2 (204005, Sigma-Aldrich, 99.999%) were dry milled in the target stoichiometry

44
using a high-energy SPEX mill (8000M Mixer/Mill, SPEXSamplePrep) with steel balls inside a
hardened steel vial. The homogenized powders were fired with an alumina crucible (CoorsTM high-
alumina crucible, Sigma-Aldrich) inside a box furnace (CWF-1300, Carbolite and Lindberg blue
M, Thermo-scientific models) to provide sufficient thermal energy for activating the reaction and
enabling faster diffusion, as typical in solid-state reaction technique. The overall synthesis
schematic is illustrated in Figure 2.3.
Figure 2.3 Schematic of solid state reaction technique.
Powder X-ray diffraction experiments were performed using Bruker Da-vinci D8
Diffractometer with copper X-ray source at the Center for Materials Characterization, Department
of Chemistry, Michigan State University. Crystalline, phase-pure powders were obtained by
heating the powders to 900oC for 10 h duration as revealed by the X-Ray Diffraction (XRD)
patterns that show sharp, intense peaks and a good match with the database standard (ICSD
reference code: 84-0845) as seen in Figure 2.4.
Reactants
• NiO
• NaHCO3
• NH4H2PO4
Milling
• SPEX dry milling
• 60 min
Firing
• Box furnace
• 900C, 10 h
• Air atm

45
Figure 2.4 XRD characterization of sodium nickel phosphate prepared by solid state reaction.
The powder morphology was analyzed using JEOL-7500F ultra-high resolution SEM
equipment at the Center for Advanced Microscopy (CAM), MSU. Conductive-adhesive backed
carbon tape (Ted Pella, Inc.) is placed on top of an aluminum stub and inorganic powders are
sprinkled on top. The powders are gently tapped-off to dislodge excess powder accumulation.
Typically, the powders are coated with a thin, sputtered gold film (~10-20 nm) to mitigate charging
issues that can occur due to the interaction between electron gun and sample powders. The 7500F
SEM is operated under ultra-high vacuum mode at sample chamber pressure of 96 µPa. The SEM
images showed that the as-synthesized powders consisted of large (>100 µm), dense particles that
are not ideal for electrochemical characterization. The individual particles did not have any visible
pores and appears sintered (Figure 2.5a and b). Attempts were made to prepare smaller-sized
powders by wet-chemistry methods.
10 20 30 40 50 60
Re
lative Inte
nsity
2 (degrees)
Solid State Reaction

46
(a) (b)
Figure 2.5 (a) Sodium nickel phosphate powder morphology prepared by solid state reaction,
and (b) Higher-magnification image of a particle showing dense morphology.
Sol-gel synthesis facilitates atomic-level mixing by incorporating all the metallic species in a
gel network.28-30 Having chemical homogeneity at an atomic-scale typically enables reduction of
phase formation temperature and consequently helps to avoid undesired particle agglomeration
and sintering. Water soluble precursors such as CH3COONa (S8750, Sigma-Aldrich, 99%),
Ni(CH3COO)2.4H2O (72225, Sigma-Aldrich, 99%) and NH4H2(PO4)2 (204005, Sigma-Aldrich,
99.999%) were utilized while citric acid (36664, Alfa-Aesar, 99.5%) functioned as the chelating
agent and nitric acid (438073, Sigma-Aldrich, 70%) served to maintain acidic pH. Evaporation of
water resulted in the formation of transparent green gels as shown in Figure 2.6. The green gel was
firing at 800oC to burn the organic components (mostly from citric acid) and promote phase
formation and this leads to the formation of yellow powders.

47
Figure 2.6 Schematic of sol-gel synthesis technique.
Figure 2.7 XRD characterization of sol-gel synthesized powders of sodium nickel phosphate.
XRD patterns confirm the formation of the target phase when firing duration is at least 4 hours
(ICSD reference code: 84-0845). It was found that reducing the synthesis duration to 2 hours
results in an impurity phase formation (NaNiPO4, ICSD reference code: 34-1446), as shown in
Figure 2.7. The sol-gel powders had a smaller particle size (~15 µm) than the powders prepared
Dissolution
• Add precursors
• Incorporate chelant
Gelation
• Evaporate solvent
• Green gel forms
Firing
• Box furnace
• Exposed to air
• Burn the gel @ 800C, 4 h
10 20 30 40 50 60
2h Duration
Re
lative Inte
nsity
2 (degrees)
Sol Gel Reaction at 800oC
4h Duration

48
by solid-state reaction due to the lower firing temperature enabled by chemical homogeneity at
atomic-scale. The SEM images, in Figure 2.8, show relatively large primary particles comprising
of partially sintered secondary particles. The latter were found to be ~ 1 µm in diameter and are
interconnected to form an extensive pore network through which the liquid electrolyte can possibly
permeate and facilitate faster ion diffusion.
(a) (b)
Figure 2.8 (a) Sodium nickel phosphate powder morphology prepared by sol-gel reaction, and
(b) Higher-magnification image of a particle showing porous morphology.
2.3.2 Sodium cobalt titanate synthesis
SCT was synthesized by solid-state reaction method using NaNO3 (S5506, Sigma-Aldrich, 99%),
Co(CH3COO)2 (208396, Sigma-Aldrich, 99.5%), and TiO2 (248576, Sigma-Aldrich, 99%,
Anatase phase) as starting precursors. The precursors were wet milled using high-energy SPEX
mill with steel balls as grinding media and 2-propanol as solvent. The well-mixed slurry was dried
using an IR lamp in a glass petri dish and the dried powders were fired in a box furnace at 900oC
for 10 hours. Na-Co-Ti-O composition with calcium-ferrite prototype structure is not reported in
the ICSD database. XRD patterns, in Figure 2.9a, of the synthesized powders shows excellent

49
match with Na0.79[Fe0.8Ti1.6]O4 (ICSD reference code: 87-1550), that is isostructural with calcium-
ferrite double tunnel structure. Since replacing cobalt in place of iron did not change the space
group Pnma, we propose that the prepared powders retain the tunnel structure.
The as-synthesized powders were found to be ~3 µm sized rods as primary particles that
appeared non-porous. The particles do not show any evidence of sintering (Figure 2.9b) while
maintaining good crystallinity suggesting that the synthetic conditions are fairly close to optimal
conditions. Hence, no attempts were made to prepare the powders by sol-gel method since the
research objective was to have a fairly straightforward synthetic protocol (to enable scalability and
cost effectiveness).
(a) (b)
Figure 2.9 (a) XRD characterization of sodium cobalt titanate prepared by solid state reaction,
and (b) SEM morphology of as-synthesized sodium cobalt titanate powders.
10 20 30 40 50 60
Rela
tive Inte
nsity
2 (degree)
900oC, 10h Firing

50
2.4 Film fabrication
2.4.1 Substrate selection
Highly-conductive metal substrates (or current collectors), typically aluminum (MTI Corp., EQ-
bcaf-15u-280) and copper (MTI Corp., EQ-bccf-25u), are utilized for backing the active
components of the electrode films. In commercial devices, these substrates carry the current from
individual electrodes to the cell terminals. The prerequisite properties for substrates include good
electrochemical stability (oxidizing environment for cathodes and reducing conditions for anodes),
suitable chemical stability with active components (oxide materials, lithium metal, sodium metal,
etc.), excellent electrical conductivity (to avoid ohmic losses), good thermal conductivity (for heat
dissipation) and sufficient mechanical properties (to withstand thermal vibrations, mechanical
impacts typical during battery operation).
Aluminum substrate is utilized for casting the cathode films as it provides excellent electrical
conductivity and remains stable in highly oxidizing cathodic conditions (due to passivation films).
However, phase diagrams suggest that aluminum forms binary alloys such as AlLi, Al2Li3,
Al4Li931
with lithium metal and hence is not a suitable substrate for lithium battery anodes.
Aluminum substrates can be used for Na-ion batteries as it does not alloy with sodium metal. The
low-cost and light-weight aluminum substrates are expected to provide energy density gains and
cost reduction opportunities at pack-level battery configurations.
2.4.2 Casting methods
The as-synthesized powders are cast into a porous, composite electrode for electrochemical
characterization. The film electrode is comprised of the active powders (quaternary oxides),
conductive carbon (Super C65, Timcal, USA), and polyvinylidene fluoride (44080, Alfa-Aesar) in

51
80:10:10 weight ratio. The active powders and conductive carbon are dispersed thoroughly in a
viscous solution made from dissolving polyvinylidene fluoride in N-Methyl-2-pyrrolidone
(L03595, Alfa-Aesar) solvent using high-energy ball milling. The wet slurry is casted onto the
aluminum substrate using an adjustable film applicator (doctor-blade, EQ-Se-KTQ-100, MTI
Corp.) and film coater (MSK-AFA-III, MTI Corp.) after selecting the desired film thickness and
setting the traverse speed at 10 mm/s. Suction is created by an oil-free vacuum pump (Model no.
9901K64, standard pump with maximum vacuum of 26” Hg, McMaster-Carr) to the aluminum
vacuum chuck and this secures the aluminum foil/substrate in place. A schematic of film
fabrication is illustrated in Figure 2.10. The film is dried using an IR lamp overnight to ensure that
the solvent gets removed completely. The prepared electrodes are punched into 0.5” diameter discs
using a hollow-punch (Mayhew tools, 66000) and transferred to MBraun labmaster-SP glovebox
(with <1 ppm O2 and <1 ppm H2O) to minimize exposure to moisture and carbon dioxide.
Figure 2.10 Schematic of doctor-blade slurry casting method for fabricating battery electrodes.

52
2.5 Electrochemical characterization
2.5.1 Cell setup and testing
Electrochemical testing is performed in 3-electrode configuration which includes working
electrode, counter electrode and a reference electrode. Working electrode consists of an electrode
disk (0.5” diameter) that is backed by aluminum rod serving as current terminals (equivalent to
plate terminals in commercial packs). The counter and reference electrodes are prepared by cutting
soft sodium ingots into thin slices with a knife, punching the slices into a circular disks and pressing
the disks against a copper rod with Teflon tape and manual press. The three electrodes are inserted
into the three legs of a Swagelok tube fitting (PFA-grade, Swagelok Inc.,) while inserting a
polyethylene separator between the rods to avoid cell shorting. Figure 2.11 depicts electrode
arrangement in cell assembly. The cell assembly is performed inside glovebox and Swagelok
assembly ensures hermetic sealing of cell components. Cell testing is carried out using Biologic
Potentiostat VSP300 and SP200 models outside the glovebox. The accuracy of the potentiostats
was periodically tested using standard dummy cells from Biologic.
Figure 2.11 Schematic of Swagelok 3-electrode cell setup for electrochemical testing.

53
2.5.2 Evaluation of the electrolyte and current collectors
Sodium metal is frequently used in lab-scale half-cell tests due to the unavailability of commercial
high-performance sodium-based anodes as counter electrodes. We tested the electrochemistry of
Na2Ti3O7, a reported low-voltage anode (Eo=0.3 V vs. Na/Na+ for Ti4+/3+) for Na-ion batteries.32
However, the performance of the electrodes fabricated using the commercial powders (401307,
Sigma-Aldrich) were found to be unsatisfactory with reversible capacity of only ~10% of
theoretical. XRD testing revealed the commercial powders to contain a significant amount of
Na2Ti6O13 impurity phase in addition to the target Na2Ti3O7 phase. Hence, further attempts were
focused on finding a suitable electrolyte combination that can potentially work with the reactive
sodium metal for the scope of preliminary electrochemical testing. The stability of sodium metal
(282065, Sigma-Aldrich) in two electrolytes 1M NaClO4 in EC/DMC (50/50 vol%) and 0.5M
NaPF6 in EC/DEC (50/50 vol%) were evaluated using impedance spectroscopy. The dry sodium
metal sticks packed in nitrogen atmosphere is opened and stored inside the glovebox atmosphere.
During cell assembly the outer regions of the stick are removed to discard the white coating
(possibly oxide) and cut into ~3-5 mm slices using a steel knife. The thin slides are placed between
two separator pieces and manually pressed (with Dayton ½ ton Arbor press). The pressed-slices
are punched into disks with a hollow punch manually.
Symmetric cells were assembled using two sodium metals that were affixed to copper metal
rods in 2-electrode configuration. Impedance tests were carried out by applying a sinusoidal
voltage perturbation of 10 mV amplitude over the open-circuit potential in a frequency range of 1
MHz to 1 mHz. The spacing between the sodium metal pieces was maintained at 4.6 cm (1.8”)
and the space between the rods was filled-in with surplus electrolyte solution. The 1st impedance

54
test (black curve) was performed after 4 hours of open-circuit condition and subsequent tests every
2 hours.
Impedance spectrum reflects the evolution of the Solid Electrolyte Interface (SEI) on sodium
metal surface over time without any significant polarization from open circuit conditions. Similar
analysis has been reported for lithium metal SEI formation.33
Perchlorate-based electrolyte
exhibits a single semi-arc in the initial cycles that can be attributed to passivation films formed
due to the degradation of organic solvents as shown in Figure 2.12a.
(a) (b)
Figure 2.12 Impedance spectroscopy curves for sodium metal SEI formation in (a) 1M NaClO4
in ethylene carbonate/dimethyl carbonate, and (b) 0.5M NaPF6 in ethylene carbonate/diethyl
carbonate; 1st cycle refers to test after 4 hours open-circuit and subsequent tests.
Prolonged exposure results in the formation of a 2nd arc related to the formation of a secondary
passivation film. The increasing film resistance is due to continuous incorporation of the
electrolyte degradation components and subsequent increase in film thickness. Fluorine-based
0 3000 6000 9000 12000
0
3000
6000
9000
12000 14 h
16 h
18 h
20 h
22 h
24 h
4 h
6 h
8 h
10 h
12 h
-Zim
(O
hm
)
Zreal (Ohm)
0 1500 3000 4500 60000
1500
3000
4500
6000 4 h
6 h
8 h
10 h
12 h
14 h
16 h
18 h
20 h
22 h
24 h
-Zim
(O
hm
)
Zreal (Ohm)

55
electrolyte shows a smaller single-arc over the tested time-duration and the film resistance increase
is more gradual as seen in Figure 2.12b. We attribute this effect to the formation of a more stable
passivation film involving fluorine-related species such as sodium fluoride as previously reported
with a fluorinated solvent.34
The electrolyte resistance did not change significantly under these
test conditions as the cell-configuration was flooded and the byproducts did not accumulate to a
significant extent.
These impedance spectra were obtained under steady-state open circuit conditions to investigate
the reactivity of sodium metal under open circuit conditions. The nature of the passivation films
would change during actual cell operation that includes current perturbation. Also, during
galvanostatic testing, sodium metal plating is visually observed to be in the form of dendritic
powders. These dendrites lose eventually contact with sodium metal due to poor adhesion and
results in loss of partial deactivation (at the counter electrode). During long-time cycling tests,
these dendrites also potentially pose concerns of cell shorting through the separator. Significant
electrolyte optimizations are further required to address these issues and further technology
commercialization.
Current collectors and solvent species can typically get oxidized during the electrochemical
testing of the inorganic materials and this can result in contamination of the electrolyte. Electrolyte
contamination can lead to additional redox contributions, complex interactions with studied active
components and should be avoided.
Electroanalytical techniques such as cyclic voltammetry are routinely employed to define the
operable voltage window. This technique involves scanning over the desired voltage window at a
predefined scan-rate (mV/s) and measuring the current response. A distinct current increase would

56
be noticeable corresponding to the electrochemical reactions of solvent species and current
collectors. Using multiple scans, we can investigate the suppression capability (corrosion
resistance) of the surface passivation films that typically form in the first cycle for various
materials. Different substrates such as aluminum, anodized aluminum, stainless steel (grade 316),
titanium and graphite were evaluated for their electroanalytical response as shown in Figure 2.13
and Figure 2.14. The substrates were 0.5” in diameter to fit the Swagelok assembly and typically
around 3-4 inches long. The anodized aluminum (hard anodized 6061 Al rod, McMaster-Carr) has
a black insulating oxide coating on the rod circumference while the end cut-sections have exposed
aluminum metal (to provide electrical contact to electrode films). The oxide coating has excellent
corrosion resistance and is left intact to minimize the electrolyte contact with bare aluminum
surface. The rods were polished with 600 grit sanding sheets (polished finish grade, McMaster-
Carr) to obtain a fresh metal surface with smooth finish while removing surface impurities.
Subsequently, they were subjected to ultrasonication (using Branson, 3510 sonicator) in 2-
propanol solution for ~15 minutes to dislodge any residual metal powders from prior sanding step
and air-dried before cell-assembly.
The 1st cycle cyclic voltammogram of aluminum exhibits a peak current of 54 µA during the
oxidative scan and this gets reduced substantially (10th cycle peak current ~ 6 µA) in the subsequent
cycles due to surface passivation that limits further reactions. Anodized aluminum rod shows much
lower peak current (9.9 µA) in the 1st cycle due to lower exposed metal surface contacting the
electrolyte. It also has a strong passivation effect during subsequent cycles (10th cycle peak current-
0.7 µA).

57
(a) (b)
(c) (d)
Figure 2.13 Cyclic voltammograms scanned between 1.5-4.2 V voltage window for (a)
aluminum, (b) andoized aluminum, (c) stainless steel 316, and (d) titanium.
1.5 2.0 2.5 3.0 3.5 4.0 4.5
0.00
0.01
0.02
0.03
0.04
0.05
0.06
Cu
rre
nt (m
A)
Voltage (V) vs. Na/Na+
Cycles: 1-10
1.5 2.0 2.5 3.0 3.5 4.0 4.5
0.0
2.5
5.0
7.5
10.0
Cu
rre
nt (µ
A)
Voltage (V) vs. Na/Na+
Cycles: 1-10
1.5 2.0 2.5 3.0 3.5 4.0 4.5-40
-20
0
20
40
60
80
100
120
140
160
Cu
rre
nt (µ
A)
Voltage (V) vs. Na/Na+
Cycles: 1-10
1.5 2.0 2.5 3.0 3.5 4.0 4.5
-20
-10
0
10
20
30
40
50
60
70
Curr
ent (µ
A)
Voltage (V) vs. Na/Na+
Cycles: 1-10

58
(a) (b)
Figure 2.14 (a) Cyclic voltammogram of graphite scanned between 1.5-4.2 V voltage window,
and (b) oxidative voltammogram peak currents for 1st and 10th cycle.
Stainless steel (grade 316), titanium and graphite have 1st cycle peak current values of 140 µA,
64 µA, and 106 µA respectively. Like aluminum, these materials also show a tendency towards
passivation as evidenced by peak current reduction as shown in Figure 2.14b. For further testing,
only anodized aluminum is utilized as current collector as it exhibited superior oxidative stability
compared to the remaining materials.
We also tested the anodized aluminum rod under galvanostatic conditions that are typically
used in battery electrode testing. The galvanostatic results are in accord with cyclic voltammetric
studies. At 23.6 µA/cm2 current density, the upper voltage limit of 4.5 V is reached in 6 min during
which aluminum passivation occurs. Subsequently, voltage profiles are steeper as further oxidation
reactions are not supported readily and the rods can be considered to be fairly inert under the test
conditions (Figure 2.15).
1.5 2.0 2.5 3.0 3.5 4.0 4.5
-150
-100
-50
0
50
100
Cu
rre
nt (µ
A)
Voltage (V) vs. Na/Na+
Cycles: 1-10
Anodiz
ed A
l
Alu
min
um
Titaniu
m
Gra
phite
Ste
el
0
50
100
150
Peak C
urr
ent (µ
A)
1st Cycle
10th Cycle

59
Figure 2.15 Voltage profile of anodized aluminum current collector tested under galvanostatic
condition with 4.5V cutoff using 3-electrode setup.
2.5.3 Validation of electrochemical methods using standard intercalation materials:
Na0.7CoO2 and LiFePO4
In order to validate the experimental methods for film fabrication and cell assembly, well-studied
materials such as LiFePO4 and Na0.7CoO2 were tested. The goal was to ensure that the experimental
results are consistent with the literature reports.
LiFePO4 powders were synthesized by dry milling Li2CO3, NH4H2PO4 and Fe(C2O4).2H2O
(from Sigma-Aldrich) with 10 wt% carbon mixture (equal proportions of sucrose and Ketjen
Black, AkzoNobel) and firing the precursors in a tube furnace with argon atmosphere at 600oC for
6 hours duration. This modified procedure was adopted from literature results suggesting that the
incorporation of carbon additives improves electrochemical performance.35
The as-synthesized
powders were comprised of <100 nm sized particles that are interconnected by a carbon network.
Na0.7CoO2 was synthesized by straightforward solid-state reaction method in a box furnace.
Materials were subject to electrochemical testing using 3-electrode cell assembly.
0 100 200 300 4001.0
1.5
2.0
2.5
3.0
3.5
4.0
4.5
5.0
Vo
lta
ge
(V
) vs. N
a/N
a+
Time (s)
23.6 µA/cm2
1st-5th

60
Figure 2.16a shows the charge/discharge curves for LiFePO4 electrodes using lithium metal as
counter and reference electrodes and LiPF6-based commercial electrolyte from MTI Corp. (EQ-
LBC3051C). A flat-voltage profile at 3.4 V vs. Li/Li+ is observed demonstrating the activity of
Fe2+/3+ redox couple accompanied by a two phase reaction (involving LiFePO4 and FePO4 phases)
matching the literature reports.2,35,36 The discharge capacity values are 74% of the theoretical
capacity (170 mAh/g) at C/10 rate.
Na0.7CoO2 electrodes were tested with sodium metal as counter and reference electrodes and
0.5 M NaPF6 in EC/DMC electrolyte (50/50 vol%). The complex voltage steps and plateau, in
Figure 2.16b are attributable to single/bi-phasic domains and vacancy ordering as previously
reported.37
These results provide a good confidence on our experimental design as they replicate
the literature reports fairly accurately.
(a) (b)
Figure 2.16 Voltage profiles of (a) lithium iron phosphate under galvanostatic conditions at C/10
rate demonstrating two-phase reaction between FePO4 and LiFePO4, and (b) Na0.7CoO2
showing complex voltage steps and plateaus due to multiple phase transitions.
0 50 100 150
2.5
3.0
3.5
4.0
Discharging
Vo
lta
ge
(V
) vs. L
i/L
i+
Capacity (mAh/g)
C/10 Rate
Charging
0 20 40 60 80 100
2.0
2.5
3.0
3.5
Discharging
Vo
lta
ge
(V
) vs. N
a/N
a+
Capacity (mAh/g)
C/20 Rate
Charging

61
2.5.4 SNP Electrochemistry: Galvanostatic testing
SNP has a theoretical capacity of 106 mAh/g for complete sodium de-intercalation (x=4) from the
structure [Na4Ni7(PO4)6 to Ni7(PO4)6]. The sodium de-intercalation/intercalation reactions
supported by Ni2+/4+ redox couple can be represented in Equation 2.1.
𝑁𝑎4𝑁𝑖7𝐼𝐼[𝑃𝑂4]6 ↔ 𝑁𝑎4−𝑥𝑁𝑖7−𝑥/2
𝐼𝐼 𝑁𝑖𝑥/2𝐼𝑉 [𝑃𝑂4]6 + 𝑥𝑁𝑎+ + 𝑥𝑒− 2.1
Galvanostatic charge/discharge studies are executed to get an improved understanding of the
reversibility of the redox reactions. Studied electrolytes include 1M NaClO4 in Ethylene
Carbonate/Dimethyl Carbonate (EC/DMC) and 0.5 M NaPF6 in Ethylene Carbonate/Diethyl
Carbonate (EC/DEC) solutions in voltage window between 3.2 and 4.2 V.
During charging, there is an initial rapid voltage rise to 2.8 V vs. Na/Na+ after which the voltage
curve shows a gradual sloping profile, as depicted in Figure 2.17a. Prolonged charging results in
continued extraction of sodium ions resulting in concomitant generation of additional Ni4+ states.
Complete sodium de-intercalation could be achieved after which the voltage starts to rise due to
electrolyte oxidation reactions to support the current. The current direction was reversed to induce
reduction of Ni4+ species but this resulted in a significant voltage polarization with very little
sodium intercalation with voltage cutoff limited to 1.5 V. Lowering the voltage cutoff to 0.8 V
leads to a long voltage plateau which cannot be accounted for by just considering sodium
intercalation reactions. It is likely that in addition to sodium intercalation, there is considerable
amount of electrolyte reduction reactions, possibly catalyzed by SNP particles. Nevertheless, the
subsequent charging cycle provides ~50% theoretical capacity at a lower electrode potential (~2.0
V vs. Na/Na+) in Figure 2.17b. The voltage profile remains in the same regime for further cycles
and the difference between the first and second cycle can possibly be accounted for by local re-

62
organization effects (not captured by XRD discussed in the next section). Future studies to increase
the understanding of voltage hysteresis effect (1 V) and electrocatalytic reduction of organic
solvents are required to improve the energy density and arrest capacity fade.
(a) (b)
Figure 2.17 Sodium nickel phosphate tested under galvanostatic conditions with discharge cut-
off voltage of (a) 1.5 V in 1st cycle, and (b) 0.8 V.
2.5.5 SNP Ex-situ XRD characterization
Ex-situ XRD testing is utilized to characterize the film electrodes at various sodium contents. This
helps in detecting electrochemically-driven phase transitions and analyzing the crystallinity of the
studied battery materials. The film electrodes are subjected allowed to reach different
charge/discharge voltages under galvanostatic conditions to achieve various sodium intercalation
contents inside the electrochemical setup. After passing charge and allowing for equilibration
(typically 2 hours), the cell is disassembled to obtain the electrodes and the film is washed with
DMC solvent to remove any residual salt components inside the glovebox. The washed film is
dried under ambient conditions and transferred to a vial for XRD characterization. The film is
mounted on Bruker sample holder and secured using wax. Mylar tape is placed over the sample
0 20 40 60 80 100
1.6
2.0
2.4
2.8
3.2
Discharge
Volta
ge
(V
) vs.
Na
/Na+
Capacity (mAh/g)
Charge
0 20 40 60 80 1000.5
1.0
1.5
2.0
2.5
3.0
3.5
Vo
lta
ge
(V
) vs. N
a/N
a+
Capacity (mAh/g)
C/20 Rate
1-10 cycles
1st discharge

63
holder and a seal mechanism limits air exposure during the characterization. Inclusion of wax and
Mylar does lead to unwanted bumps and peaks in the XRD patterns (Figure 2.18) and there were
found not to overlap with the main peaks of the target SNP phase.
Figure 2.18 Ex-situ XRD characterization of SNP electrode film at different state-of-charge,
Mylar film and wax (used for sticking the electrode to the holder base).
We found that the 3.2 V charged electrode peaks are identical to those of pristine powders
demonstrating that the SNP material retains the same crystal structure even after complete sodium
de-intercalation, as shown in Figure 2.18. We attribute this structural stability to the ‘pillaring’
effect of phosphate functional groups, typical of polyanionic materials. The electrodes subjected
to deep discharge of 1.2 and 1.0 V also have comparable patterns indicating that the redox reactions
occurring at those potential regions are not due to the formation of metallic nickel species
(conversion-type mechanisms). We demonstrate that the reaction mechanism that provides charge
storage capability is due to the desired intercalation-type mechanisms. Since SNP has a relatively
10 20 30 40 50 60
Mylar film+wax
1.0 V Discharged
1.2 V Discharged
3.2 V Charged
Re
lative Inte
nsity
2 (degrees)
Pristine

64
low redox potential (~2 V) and only a modest reversible capacity (~ 50 mAh/g), we focused our
attempts to investigate different structural types for our exploratory research.
2.5.6 SCT Electrochemistry: Potentiostatic Intermittent Titration Testing (PITT)
PITT involves scanning the electrode potential over the working range (upper and lower cutoff
voltages) with voltage steps and allowing for current relaxation (C/50) during each step. The
relaxation step allows the material to approach close-to equilibrium conditions. For complete
sodium de-intercalation (x=0.8), the theoretical capacity is calculated to be 117 mAh/g. Sodium
intercalation/de-intercalation reactions due to Co2+/4+ redox couple can be represented in Equation
2.2.
𝑁𝑎0.8[𝐶𝑜0.4𝐼𝐼 𝑇𝑖1.6
𝐼𝑉 ]𝑂2 ↔ 𝑁𝑎0.8−𝑥[𝐶𝑜0.4−𝑥/2𝐼𝐼 𝐶𝑜𝑥/2
𝐼𝑉 𝑇𝑖1.6𝐼𝑉 ]𝑂2 + 𝑥𝑁𝑎+ + 𝑥𝑒− 2.2
SCT was tested using 0.5 M NaPF6 in 50/50 vol% EC/DEC electrolyte in a 3-electrode cell
assembly. The 1st charging voltage profile slopes gradually between 3.6 and 4.2 V and remains
fairly identical for next two cycles as shown in Figure 2.19a. The discharge profile also follows a
sloping profile with a large initial voltage polarization. The symmetric nature of the charging and
discharging curves suggests reversible sodium intercalation/de-intercalation reactions. The
capacity retention was also found to be fairly stable in the tested 3 cycles and the faradaic
efficiency improves to 86% in the 3rd cycle (Figure 2.19b). However, there is a large voltage
hysteresis of 1.4 V between charge and discharge curves even while testing the cell at 70oC.

65
(a) (b)
Figure 2.19 (a) Voltage curve of sodium cobalt titanate from PITT with C/50 current limit, 100
mV step potential tested at 70 oC using 0.5M NaPF6 in EC/DEC electrolyte, and (b) Discharge
capacity and faradaic efficiency with cycle number.
SCT was also evaluated with 1M NaClO4 in EC/DMC electrolyte using slow-rate galvanostatic
testing of C/100 at room temperature. The voltage hysteresis increases to 1.6 V for room-
temperature testing suggesting a thermally activated limiting process (Figure 2.20a). We also show
that the hysteresis is not related to the nature of solvent and is inherent to the studied material. In
Figure 2.20b, Ex-situ XRD results confirm that the SCT pristine peak positions are fairly
comparable to those of partial charged (20%) and discharged films. The absence of additional
peaks indicates that there is not a tendency towards phase transformations. The partially de-
intercalated electrode has slightly different peak intensities and suggesting the possibility of
sodium redistribution amongst the remaining vacant sites.
0 20 40 60 80 100
2.0
2.5
3.0
3.5
4.0
4.5
1
2
3
Vo
lta
ge
(V
) vs. N
a/N
a+
Capacity (mAh/g)
Cycle
1 2 340
50
60
70
80
90
100
76
78
80
82
84
86
88
Effic
ien
cy (
%)
Ca
pa
city (
mA
h/g
)
Cycles Number

66
(a) (b)
Figure 2.20 (a) Voltage profile of sodium cobalt titanate tested under at C/100 rate using 1M
NaClO4 in EC/DMC electrolyte at room temperature, and (b) Ex-situ XRD of SCT at pristine,
20% charged and discharged state.
We hypothesize that the hysteresis phenomenon is related to relatively slow diffusion of sodium
ions in the tunnels and further improvements can be realized by grain-size reduction (nano-scale)
by chimie douce synthetic methods. The scope of this exploratory research was to identify potential
inorganic materials that can possibly sustain relatively facile sodium intercalation/de-intercalation
reactions using micron length-scale particles. The reported tunnel-type materials does show
promise in terms of structural stability (after sodium de-intercalation) but their electrochemistry is
fairly constrained by diffusional limitations. We initiated the study of novel layer-structured, bi-
metallic transition metal oxides, with the general composition NaxMyM’1-yO2 as suitable sodium
intercalation electrodes in the subsequent chapters.
2.6 Summary
In this chapter, two tunnel-type materials Na4Ni7(PO4)6 and Na0.8Co0.4Ti1.6O2 were explored as
potential sodium intercalation electrode materials. These framework materials were anticipated to
0 5 10 151.0
1.5
2.0
2.5
3.0
Discharge
Vo
lta
ge
(V
) vs. N
a/N
a+
Capacity (mAh/g)
Charge
20 30 40 50 60
After discharge
20% SOC
Re
lative Inte
nsity
2 (degree)
Pristine film

67
possess good stability based on structural connectivity and reasonable sodium transport through
the 3-D tunnels. Phase-pure, crystalline powders of these two compositions were successfully
synthesized by solid-state reaction and sol-gel techniques as demonstrated by the characteristic
XRD peak sets. SNP shows a sloping charging voltage profile at 2 V and discharge profile at 1.25
V with a noticeable voltage hysteresis. These reactions were confirmed to be due to topotactic
exchange of sodium intercalant without any phase change. SCT was also found to be
electrochemically active with charging and discharging voltage profile at 3.7 and 2.5 V,
respectively when tested at 70oC. The large voltage hysteresis is predicted to be due to slow-
diffusion of sodium. These materials show promise in terms of structural stability as no phase
change was evident upon sodium removal. However, to mitigate voltage hysteresis, future research
needs to focus on developing improved chimie douce methods for nano-sizing the particles without
particle sintering.

68
BIBLIOGRAPHY

69
BIBLIOGRAPHY
1. Gong, Z. & Yang, Y. Recent advances in the research of polyanion-type cathode materials
for Li-ion batteries. Energy Environ. Sci. 4, 3223 (2011).
2. Padhi, A. K., Nanjundaswamy, K. S. & Goodenough, J. B. Phospho-olivines as Positive-
Electrode Materials for Rechargeable Lithium Batteries. J.Electrochem. Soc 144, 1188–
1194 (1997).
3. Nytén, A., Abouimrane, A., Armand, M., Gustafsson, T. & Thomas, J. O. Electrochemical
performance of Li2FeSiO4 as a new Li-battery cathode material. Electrochem. commun.
7, 156–160 (2005).
4. Guo, H. et al. Optimum synthesis of Li2Fe1−xMnxSiO4/C cathode for lithium ion
batteries. Electrochim. Acta 55, 8036–8042 (2010).
5. Choi, D. et al. LiMnPO4 nanoplate grown via solid-state reaction in molten hydrocarbon
for Li-ion battery cathode. Nano Lett. 10, 2799–805 (2010).
6. Weker, J. N., Li, Y., Shanmugam, R., Lai, W. & Chueh, W. C. Tracking Non-Uniform
Mesoscale Transport in LiFePO 4 Agglomerates During Electrochemical Cycling.
ChemElectroChem (2015). doi:10.1002/celc.201500119
7. Xu, B., Qian, D., Wang, Z. & Meng, Y. S. Recent progress in cathode materials research
for advanced lithium ion batteries. Mater. Sci. Eng. R 73, 51–65 (2012).
8. Nanjundaswamy, K. S. et al. Synthesis , redox potential evaluation and electrochemical
characteristics of NASICON-related-3D framework compounds. Solid State Ionics 92, 1–
10 (1996).
9. Padhi, A. K., Nanjundaswamy, K. S., Masquelier, C. & Goodenough, J. B. Mapping of
Transition Metal Reclox Energies in Phosphates with NASICON Structure by Lithium
Intercalation. J. Electrochem. Soc. 144, 2581–2586 (1997).
10. Masquelier, C., Padhi, A. K., Nanjundaswamy, K. S. & Goodenough, J. B. New Cathode
Materials for Rechargeable Lithium Batteries: The 3-D Framework Structures Li
3Fe2(XO4)3(X=P, As ). J. Solid State Chem. 228–234 (1998).
11. Gopalakrishnan, J. & Rangan, K. K. V2(PO4)3: A Novel NASICON-Type Vanadium
Phosphate Synthesized by Oxidative Deintercalation of Sodium from Na3V2(O4)3. Chem.
Mater. 4, 745–747 (1992).
12. Gover, R., Bryan, A., Burns, P. & Barker, J. The electrochemical insertion properties of
sodium vanadium fluorophosphate, Na3V2(PO4)2F3. Solid State Ionics 177, 1495–1500
(2006).

70
13. Palomares, V., Casas-Cabanas, M., Castillo-Martínez, E., Han, M. H. & Rojo, T. Update
on Na-based battery materials. A growing research path. Energy Environ. Sci. 6, 2312
(2013).
14. Lim, S. Y., Kim, H., Shakoor, R. A., Jung, Y. & Choi, J. W. Electrochemical and Thermal
Properties of NASICON Structured Na3V2(PO4)3 as a Sodium Rechargeable Battery
Cathode: A Combined Experimental and Theoretical Study. J. Electrochem. Soc. 159,
A1393–A1397 (2012).
15. Chihara, K., Kitajou, A., Gocheva, I. D., Okada, S. & Yamaki, J. Cathode properties of
Na3M2(PO4)2F3 [M = Ti, Fe, V] for sodium-ion batteries. J. Power Sources 227, 80–85
(2013).
16. Barpanda, P. et al. Sodium iron pyrophosphate: A novel 3.0V iron-based cathode for
sodium-ion batteries. Electrochem. commun. 24, 116–119 (2012).
17. Palomares, V. et al. Na-ion batteries, recent advances and present challenges to become
low cost energy storage systems. Energy Environ. Sci. 5, 5884 (2012).
18. Slater, M. D., Kim, D., Lee, E. & Johnson, C. S. Sodium-Ion Batteries. Adv. Funct. Mater.
23, 947–958 (2013).
19. Huili, P., And, H. Y.-S. & Liquan, C. Room-Temperature Stationary Sdoium-Ion Batteries
for Large-Scale Electric Energy Storage. Energy Environ. Sci. (2013).
doi:10.1039/C3EE40847G
20. Thackeray, M. M. Spinel Electrodes for Lithium Batteries. J. Am. Ceram. Soc 82, 3347–
3354 (1999).
21. Shenouda, A. Y. & Murali, K. R. Electrochemical properties of doped lithium titanate
compounds and their performance in lithium rechargeable batteries. J. Power Sources 176,
332–339 (2008).
22. Nakahara, K., Nakajima, R., Matsushima, T. & Majima, H. Preparation of particulate
Li4Ti5O12 having excellent characteristics as an electrode active material for power
storage cells. J. Power Sources 117, 131–136 (2003).
23. Yao, X. L. et al. Comparisons of graphite and spinel Li1.33Ti1.67O4 as anode materials
for rechargeable lithium-ion batteries. Electrochim. Acta 50, 4076–4081 (2005).
24. Xiao, X., Lu, J. & Li, Y. LiMn2O4 microspheres: Synthesis, characterization and use as a
cathode in lithium ion batteries. Nano Res. 3, 733–737 (2010).
25. Mumme, W. G. & Reid, A. F. Non-stoichiometric Sodium Iron Titanate,
NaxFexTi2−xO4, 0.90> x >0.75. Acta Crystallogr. B 24, 625–631 (1968).
71
26. Moring, J. & Kostiner, E. The Crystal Structure of Na4Ni7(PO4)6. J. Solid State Chem.
62, 105–111 (1986).
27. Kuhn, A. et al. Study of the Conductivity of Nax-del FexTi2-xO4 (x=0 . 875 ,del<0.40 ).
J. Solid State Chem. 173, 168–173 (1998).
28. Kakihana, M. “Sol-gel” Preparation of High Temperature Superconducting Oxides. J. Sol-
Gel Sci. Technol. 6, 7–55 (1996).
29. Liu, H., Wu, Y. P., Rahm, E., Holze, R. & Wu, H. Q. Cathode materials for lithium ion
batteries prepared by sol-gel methods. J. Solid State Electrochem. 8, 450–466 (2004).
30. Fu, L. J. et al. Electrode materials for lithium secondary batteries prepared by sol–gel
methods. Prog. Mater. Sci. 50, 881–928 (2005).
31. Hamon, Y. et al. Aluminum negative electrode in lithium ion batteries. J. Power Sources
97-98, 185–187 (2001).
32. Senguttuvan, P., Rousse, G., Seznec, V., Tarascon, J.-M. & Palacín, M. R. Na2Ti3O7 :
Lowest Voltage Ever Reported Oxide Insertion Electrode for Sodium Ion Batteries. Chem.
Mater. 23, 4109–4111 (2011).
33. Thevenin, J. Passivation films on lithium electrodes: An approach by means of impedance
spectroscopy. J. Power Sources 14, 45–52 (1985).
34. Komaba, S. et al. Fluorinated Ethylene Carbonate as Electrolyte Additive for
Rechargeable Na Batteries. ACS Appl. Mater. Interfaces 3, 4165–4168 (2011).
35. Croce, F. et al. A Novel Concept for the Synthesis of an Improved LiFePO4 Lithium
Battery Cathode. Electrochem. Solid-State Lett. 5, A47–A50 (2002).
36. Huang, H., Yin, S.-C. & Nazar, L. F. Approaching Theoretical Capacity of LiFePO4 at
Room Temperature at High Rates. Electrochem. Solid-State Lett. 4, A170–A172 (2001).
37. Berthelot, R., Carlier, D. & Delmas, C. Electrochemical investigation of the P2–NaxCoO2
phase diagram. Nat. Mater. 10, 74–80 (2011).

72
3. SYNTHESIS, AND ELECTROCHEMICAL CHARACTERIZATION OF
P-TYPE LAYER-STRUCTURED MATERIALS: Na2/3[Ni1/3MnxTi2/3-x]O2
(x=0, 1/3)
3.1 Introduction
3.1.1 Ionic conduction in layered materials
Layer-structured oxide materials have a general formula of AxMO2 (0 ≤ 𝑥 ≤ 2), where ‘A’ is the
alkali intercalant species and ‘M’ is the transition metal species. These material classes are
classified as ‘O3’, ‘T1’, ‘P2’, ‘P3’ structures based on the oxygen stacking sequence as given by
Delmas notation where the ‘O’, ‘T’ and ‘P’ refers to octahedra, tetrahedra and prismatic co-
ordination of the alkali atoms, and the numeric character denotes the number of alkali layers per
unit cell.1-3
The alkali atoms that sandwich the transition metal layers provide a shielding effect for the
close-packed oxygen layers. Hence, structures with lower ‘x’ have larger alkali layer spacing due
to higher repulsive interactions and these structures have larger A-O bond length (prismatic co-
ordination). The relatively large sodium atoms adopt P-type or O-type configuration while the
smaller lithium atoms prefer O-type or T-type configuration environments.
As the number of vacant sites increases in the order of ‘P’>‘O’>‘T’, sodium-layered oxides
generally have higher vacancy concentration (more non-stoichiometric) than lithium-layered
oxides. Non-stoichiometric (‘x’<1) sodium-layered oxide containing high vacancy concentration,
support fast-ion mobility by means of the conventional ‘vacancy hopping’ mechanism. This
conduction mechanism is operative in lithium-layered oxides, as well.4 The fast-ion mobility is
these material classes is of particular interest for Na-intercalation electrodes as they overcome the

73
large-size effects. Hence, P-type sodium-layered materials are considerable attractive candidates
as host electrodes for Na-ion batteries.
3.1.2 Literature reports on layered host materials
LiCoO2 (LCO), with O3-layered structure (α-NaFeO2 prototype), has been instrumental in the
commercialization of Li-ion Batteries (LIBs) for electronics applications. However, LCO is
limited by high cost and moderate capacity (~140 mAh/g). Strategies for next-generation layered
materials include elemental substitution to form Li[Ni1-xCox]O2, Li[Ni1/3Mn1/3Co1/3]O2 and similar
oxides and structural stabilization to form xLi2MnO3.(1-x)LiMO2 to improve the electrochemical
properties.5-8
The electrochemistry of NaCoO2 has been extensively studied and reversible sodium
intercalation/de-intercalation has been demonstrated.9 However, the complex interplay between
Na+/vacancy ordering at the sodium sites and charge ordering in the transition metal sites results
in a complex voltage profile that includes a number of steps and plateau. Formation of various
single-phase and biphasic domains is undesirable for practical applications as these often lead to
poor electrochemical performance. By introducing two or more transition metal species with
different valence states, it is anticipated that the complex ordering processes would get disrupted
possibly resulting in solid-solution type behavior. Some of the studied quaternary oxides
containing aliovalent transition metals include NaxNi1/3Mn2/3O2, NaxFe1/2Mn1/2O2,
Na0.45Ni0.22Co0.11Mn0.66O2, Na0.85(Li0.17Ni0.21Mn0.64)O2.10-15

74
3.1.3 Materials of interest
This study explores the potential of titanium-based aliovalent quaternary oxide with the
composition Na2/3[Ni1/3Ti2/3]O2. The beneficial role of the inert titanium matrix in enhancing the
structural stability of lithium quaternary oxides for cathode applications is largely known.16-18
This work unravels Ti-induced stability mechanisms for sodium intercalation cathodes. Like other
P2 compositions, the excellent ionic conductivity of sodium nickel titanate (P2-NT) has been
documented previously.19
The presence of two different transition metals (nickel and titanium) with significantly different
redox potentials offers the possibility of achieving ‘bi-functionality’. Nickel and titanium redox
couples can be selectively activated making this composition suitable as cathode and anode. Using
a ‘bi-functional’ material, the existing ‘dual-line’ manufacturing processes (separate for anodes
and cathodes) can be substituted with a ‘single-line’ manufacturing to provide significantly lower
capital and operating costs. Using a single material would also eliminate any cross-contamination
issues between anode and cathode in manufacturing.
Electronic conduction in d-block transition metal oxides occurs by polaron hopping
mechanisms involving charge carrier movement between localized potential wells.20-23
The
relative ease of ionization and the distribution of the transition metal species determines the charge
carrier concentration and the polaron hopping length, respectively. The ionization energies of
Ni2+/3+, Mn4+/5+, and Ti4+/5+ are 17, 21, and 56 eV, respectively.24
For P2-NT material, charge-
carrier motion is anticipated to occur mostly between the nickel states since titanium has high
ionization energy. However, since the nickel concentration is relatively low, this hopping process

75
might not be readily favored as seen in Figure 3.1a. Inclusion of manganese in the transition metal
layer to form sodium nickel manganese titanate (P2-NMT) material would increase the intrinsic
charge carrier concentration and provide additional transport pathways by forming a percolating
network as shown in Figure 3.1b. This chapter delves into evaluating the electrical and
electrochemical properties of these novel electrode compositions.
(a) (b)
Figure 3.1 Schematic of the transition metal slab in layered oxide depicting charge carrier
pathways in (a) P2-NT, and (b) P2-NMT through formation of percolating network; red, blue
and orange spheres denote nickel, titanium, and manganese atoms, respectively.
3.2 Structural features
3.2.1 Sodium nickel titanate: P2-Na2/3[Ni1/3Ti2/3]O2
P2-NT phase was reported to crystallize in a disordered layered structure with space group
P63/mmc (space group 194).3,19
The studied material has the same prototype structure as the well-
reported Na0.7CoO2 material.25
The oxygen stacking has been found to be in ‘ABBA’ sequence
with sodium atoms occupying two different crystallographic sites: ‘2b’ (Naf site) and ‘2d’ (Nae
site). It was reported that Naf and Nae are not energetically equivalent and the former has lower
site occupancy by virtue of its larger repulsive interactions with the transition metals. Figure 3.2
shows the location of two sodium layers per unit cell and hence this structure can be represented

76
by Delmas notation as ‘P2’. The complete accounting of the XRD reflections by the 194 space
group led to the suggestion that the transition metal atoms are randomly distributed at the ‘2a’
site.19
Figure 3.2 Crystal structure of Na2/3[Ni1/3Ti2/3]O2; blue spheres refer to transition metals (nickel
and titanium), yellow spheres refer to sodium atoms Oxygen atoms are not included for clarity.
3.2.2 Sodium nickel manganese titanate: P2-Na2/3[Ni1/3Mn1/3Ti1/3]O2
The substitution of manganese to partially replace titanium atoms at the ‘2a’ sites forms a solid
solution composition with the parent phase, P2-NT. Hence, P2-NMT has the same crystal structure
as P2-NT phase, shown previously in Figure 3.2 with random distribution of manganese. This
allows for retaining the excellent sodium conduction pathways of the P2 phase while potentially
improving the electrical transport properties in the transition metal layer.
3.3 Inorganic synthesis and high-temperature processing
3.3.1 Sodium nickel titanate synthesis
The precursors were Na2CO3 (≥99.5%), NiO (micron powder, 99%; <50 nm powder, 99.8%), and

77
TiO2 (micron powder, 99%; 21 nm powder, ≥99.5%). For a typical synthesis of 10 g of powder,
4.6 g of Na2CO3, 2.5 g of NiO, and 5.4 g of TiO2 were used. Na2CO3 of 10 wt% excess were added
to compensate the sodium oxide evaporation during high-temperature processing. Both micron-
and nano-sized NiO and TiO2 were employed to compare the effect of particle size on the ease of
synthesis and the electrochemical properties. Micron-sized precursors were subjected to dry-
milling using SPEX SamplePrep 8000M mixer/mill. Nano-sized precursors were mixed in a jar
mill with 2-propanol as solvent. After uniform mixing and solvent removal at 120oC, the powders
were fired at 900 oC in a box furnace exposed to air.
Figure 3.3 XRD characterization of sodium nickel titanate prepared by solid state reaction from
micron-sized precursors fired for 12 hours duration; The dominant peaks of the impurity and
target phases are indexed.
The XRD patterns of the micron-sized precursor powders fired for 12 hours duration at different
temperatures are shown in Figure 3.3. Powders fired at 600 oC had considerable amount of
10 20 30 40 50 60 70
-Target
-Na4Ti5O12
-TiO2
900oC
800oC
700oC
Re
lative
Inte
nsity
2 (degree)
600oC

78
unreacted TiO0.9 phase (ICSD reference code: 78-0720) and Na4Ti5O12 (ICSD reference code: 52-
1814) impurity phase along with the target Na2/3[Ni1/3Ti23]O2 phase (ICSD reference code: 48-
0164). As the calcination temperature is increased to 700 and 800 oC, a reduction in the amount of
unreacted TiO2 and impurity phase is observed. It was found that heating to 900 oC is essential to
obtain phase-pure powders with these precursor powders and processing conditions.
When using nano-precursors, the fired powders were matched with the target phase without
unreacted components as shown in Figure 3.4a. even when calcined at a lower temperature of 800
oC. However, a small impurity peak was detected at 41o and this could not be reasonably matched
with any binary or ternary Na-Ni-Ti-O oxide components in ICSD database. Attempts to eliminate
this impurity by prolonging the synthesis duration to 20 and 36 hours were not successful.
Completely pure target phase could only be formed at a slightly higher temperature of 900 oC when
heated for at least 2 hours and further electrochemical testing was performed using these powders,
as depicted in Figure 3.4b.
The SEM images of the as-prepared P2-NT powders are shown in Figure 3.4c and d. Synthesis
from micron-sized precursors results in fairly spherical particles that are roughly 5-10 µm in
diameter. Nano-sized precursors yielded finer powders with particles less than 5 µm due to reduced
heating duration. Nano-precursors provide pure phase powders, with smaller particle size, in
shorter synthesis due to shorter diffusional length and facile reaction kinetics.

79
(a) (b)
(c) (d)
Figure 3.4 XRD characterization of P2-NT material prepared by solid state reaction from wet-
milled nano-sized precursors fired at (a) 800 oC, and (b) 900 oC, SEM morphology of powders
prepared from (c) micron-sized precursors, and (d) nano-sized precursors.
3.3.2 Sodium nickel manganese titanate synthesis
The precursors consisting of stoichiometric amounts of Na2CO3 (≥99.5%), NiO (micron powder,
99%), TiO2 (micron powder, 99%) and MnO2 (≥99%) were dry-milled using high-energy SPEX
mill and subsequently fired at 900 oC for 12 hours duration. XRD of P2-NT and P2-NMT phases
10 20 30 40 50 60
36 h
20 h
-Target
-Impurity
log
(In
tensity)
2 (degree)
12 h
800oC
10 20 30 40 50 60
8 h
5 h
2 h
1 h
30 min
10 min
-Target
-Impurity
log
(In
tensity)
2 (degree)
900oC

80
have identical patterns as both structures have the same space group (194) suggesting solid solution
formation with manganese occupying the octahedral ‘2a’ sites (Figure 3.5a).
The prepared P2-NMT powders were found to be agglomerates of micron-sized particles as
shown in Figure 3.5b. For the purposes of this study, the valency of nickel, manganese and titanium
are taken as 2+, 4+, and 4+, respectively, based on the synthetic conditions and literature reports
for isostructural materials.3,10,19
(a) (b)
Figure 3.5 (a) XRD comparisons of sodium nickel titanate and sodium nickel manganese titanate
powders prepared by solid state reaction, (b) and SEM powder morphology.
The surface area of the as-synthesized powders were measured using the Brunauer-Emmett-
Teller (BET) method with Micromeritics ASAP 2020 instrument employing krypton as the
adsorbate gas. The powders were subjected to a degassing step where the powders were preheated
in a sample holder under low-pressure conditions to eliminate any physisorbed water and volatile
adsorbed components. The BET surface area of the P2-NT (micron-sized precursors), P2-NT
10 20 30 40 50 60
Na2/3
[Ni1/3
Mn1/3
Ti1/3
]O2
Na2/3
[Ni1/3
Ti2/3
]O2
Re
lative Inte
nsity
2 (degree)
*
* NiO Impurity

81
(micron-sized precursor) and P2-NMT (micron-sized precursor) powders were estimated to be
0.58, 1.30 and 0.78 m2/g, respectively. This translates to an average particle size of 1.33 µm and
0.97 µm for P2-NT and P2-NMT, respectively, which is used subsequently for diffusion co-
efficient calculations.
3.3.3 Powder sintering
The as-prepared oxide powders were cold-pressed at a pressure of 2 MPa and sintered at a
temperature of 1000 oC for 10h to obtain a dense pellet. The surface morphology of the P2-NT and
P2-NMT pellets are depicted in Figure 3.6. Both pellets appear to have sintered without any visible
surface pores. Quantitative estimates of the pellet densities were obtained using the Archimedes
method with 2-Propanol as solvent. The P2-NT and P2-NMT pellets were measured to have
relatively high density values of 93 and 89%, respectively, substantiating the SEM-morphology
observations. The sintered pellets were pasted with gold contacts on both sides for further electrical
measurements (DC and impedance spectroscopy testing). The sintered pellets were 2.3 mm thick
and 12.6 mm in diameter.
(a) (b)
Figure 3.6 (a) Surface morphology of sintered pellets of (a) P2-Na2/3[Ni1/3Ti2/3]O2, and (b) P2-
Na2/3[Ni1/3Mn1/3Ti2/3]O2.

82
3.4 Film fabrication
The previously established protocols (chapter 2) were followed for fabricating the porous,
composite electrode films with P2-NT and P2-NMT as active components. The film contains
80:10:10 weight ratio of active component, polymeric binder and conductive carbon. The punched
film electrodes were transferred to a glovebox to reduce exposure to atmospheric water vapor and
carbon dioxide.
3.5 Material Characterization
3.5.1 Voltage profile under galvanostatic testing
3.5.1.1High-voltage cathode: Ni2+/4+ redox couple
Sodium de-intercalation/intercalation in P2-NT would initiate the Ni2+/4+ redox couple and the
theoretical capacity is estimated to be 181 mAh/g for complete sodium content range (0 ≤ 𝑥 ≥
2/3, 𝑁𝑎2/3[𝑁𝑖1/3𝑇𝑖2/3]𝑂2 ↔ 𝑁𝑎0[𝑁𝑖1/3𝑇𝑖2/3]𝑂2). The redox reactions can be represented as
𝑁𝑎23⁄ [𝑁𝑖1
3⁄𝐼𝐼 𝑇𝑖2
3⁄ ]𝑂2 ↔ 𝑁𝑎23⁄ −𝑥[𝑁𝑖1
3⁄ −𝑥2⁄
𝐼𝐼 𝑁𝑖𝑥2⁄
𝐼𝑉 𝑇𝑖23⁄ ]𝑂2 + 𝑥𝑁𝑎+ + 𝑥𝑒− 3.1
P2-NMT would have identical reaction as Equation 3.1 in the cathodic regime activating only
the nickel redox couple with manganese remaining inert at valency of 4+ in the studied voltage
range. The theoretical capacity of this phase is calculated to be 176.6 mAh/g assuming complete
sodium exchange.

83
(a) (b)
(c) (d)
Figure 3.7 Cathodic voltage profile under galvanostatic testing rate of C/50 rate for (a) P2-NT
material with cutoff of 4.2 V and, (b) P2-NT material with cutoff of 4.5 V, (c) P2-NMT material
with cutoff of 4.2 V and, (d) P2-NMT material with cutoff of 4.5 V.
Figure 3.7 illustrates the voltage profile of P2-NT and P2-NMT phases under galvanostatic
conditions of C/50 rate. In P2-NT, the first charge/discharge curve has a large irreversible capacity
0.0 0.2 0.4 0.61.5
2.0
2.5
3.0
3.5
4.0
4.5
1
2
3
4
5
Vo
lta
ge
(V
) vs. N
a/N
a+
Sodium content ('x')
C/50 Rate
0.0 0.2 0.4 0.6
2.0
2.5
3.0
3.5
4.0
4.5
1
2
3
Vo
lta
ge
(V
) vs. N
a/N
a+
Sodium content ('x')
C/50 Rate
0.0 0.2 0.4 0.6 0.8
2.0
2.5
3.0
3.5
4.0
4.5
1
2
3
Vo
lta
ge
(V
) vs. N
a/N
a+
Sodium content ('x')
C/50 Rate
0.0 0.2 0.4 0.6 0.8
2.0
2.5
3.0
3.5
4.0
4.5
1
2
3
V
olta
ge
(V
) vs. N
a/N
a+
Sodium content ('x')
C/50 Rate

84
and substantial voltage hysteresis due to electrolyte side reactions.26 During the subsequent cycles,
the voltage gap gets significantly diminished and the material exhibits good reversibility. The
voltage profile appears sloping and does not involve multiple steps and plateau indicative of solid
solution reaction mechanism when cycled till 4.2 V. However, a significant voltage hysteresis is
noticeable upon increasing the charging voltage to 4.5 V. Additionally, a voltage plateau is
observed at around 4.2 V corresponding to possibly a two phase reaction. Operating in the
multiphasic domains contributes to poor reversibility as seen from Figure 3.7b.
P2-NMT exhibits excellent reversible sodium intercalation/de-intercalation reactions as
illustrated in Figure 3.7c.27
The voltage curves are sloping with very small voltage gap and good
faradaic efficiency. Unlike P2-NT, the first charge/discharge cycle does not have a significant
irreversible capacity showing that P2-NMT does not favor electrolyte oxidation as much as P2-
NT. With high charging cutoff voltage of 4.5 V, a voltage plateau appears at around 4.2 V and this
contributes to large voltage hysteresis and poor reversibility Figure 3.7d). The high redox potential
(Eo~3.7 V vs. Na/Na+) of these materials makes them attractive as high-voltage sodium
intercalation cathodes.
3.5.1.2 Low-voltage anode: Ti4+/3+ redox couple
Titanium redox couple in P2-NT is activated by filling-in the vacant sodium sites in the pristine
composition. This is made feasible by the presence of unusually high number of of vacant sites in
this non-stoichiometric oxide. The sodium intercalation reaction can be represented by Equation
3.2.
𝑁𝑎23⁄ [𝑁𝑖1
3⁄ 𝑇𝑖23⁄
𝐼𝑉 ]𝑂2 + 𝑥𝑁𝑎+ + 𝑥𝑒− ↔ 𝑁𝑎23⁄ +𝑥[𝑁𝑖1
3⁄ 𝑇𝑖23⁄ −𝑥
𝐼𝑉 𝑇𝑖𝑥𝐼𝐼𝐼]𝑂2 3.2
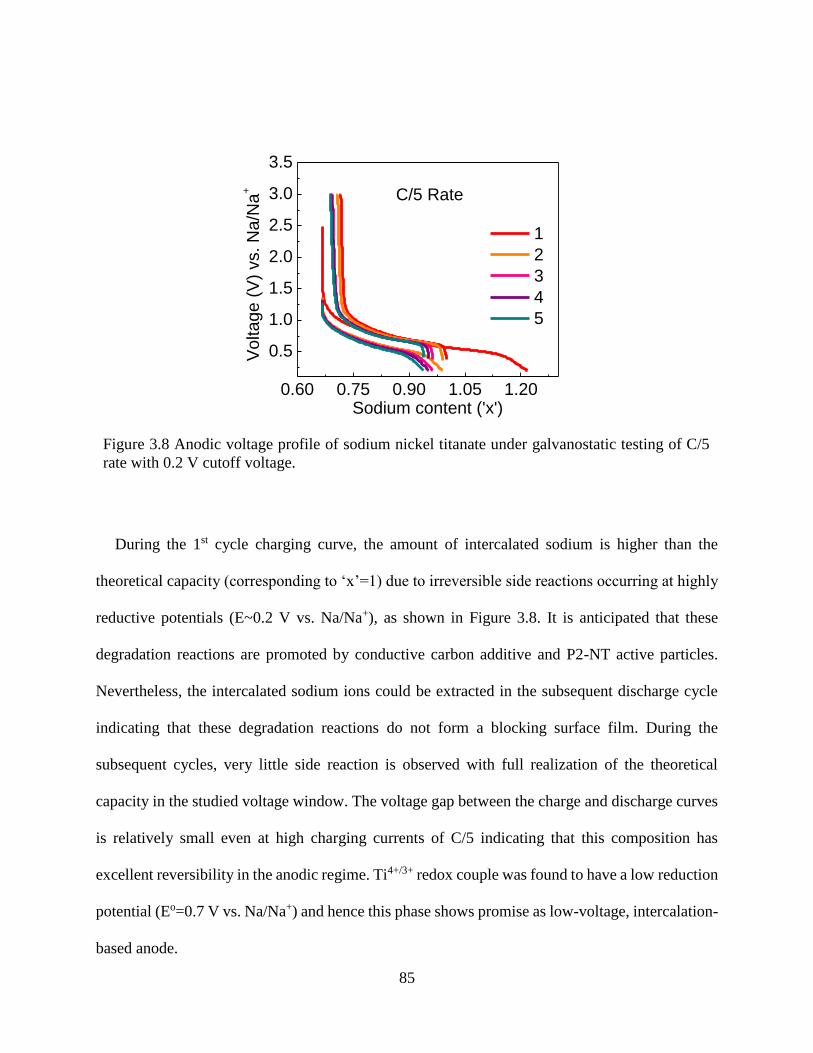
85
Figure 3.8 Anodic voltage profile of sodium nickel titanate under galvanostatic testing of C/5
rate with 0.2 V cutoff voltage.
During the 1st cycle charging curve, the amount of intercalated sodium is higher than the
theoretical capacity (corresponding to ‘x’=1) due to irreversible side reactions occurring at highly
reductive potentials (E~0.2 V vs. Na/Na+), as shown in Figure 3.8. It is anticipated that these
degradation reactions are promoted by conductive carbon additive and P2-NT active particles.
Nevertheless, the intercalated sodium ions could be extracted in the subsequent discharge cycle
indicating that these degradation reactions do not form a blocking surface film. During the
subsequent cycles, very little side reaction is observed with full realization of the theoretical
capacity in the studied voltage window. The voltage gap between the charge and discharge curves
is relatively small even at high charging currents of C/5 indicating that this composition has
excellent reversibility in the anodic regime. Ti4+/3+ redox couple was found to have a low reduction
potential (Eo=0.7 V vs. Na/Na+) and hence this phase shows promise as low-voltage, intercalation-
based anode.
0.60 0.75 0.90 1.05 1.20
0.5
1.0
1.5
2.0
2.5
3.0
3.5
1
2
3
4
5
Vo
lta
ge
(V
) vs. N
a/N
a+
Sodium content ('x')
C/5 Rate

86
P2-NT has been shown to demonstrate reversible sodium intercalation/de-intercalation
reactions using Ni2+/4+ and Ti4+/3+ redox couples with Eo values of 3.7, and 0.7 V, respectively.
This composition can be utilized as a ‘bi-functional’ electrode due to the large separation in redox
potentials of transition metal species in the same composition. The ‘bi-functionality’ feature allows
for the design of 3 V battery devices using the same material as anode and cathode and is
anticipated to provide substantial cost-reduction in capital and operating costs by switching over
to ‘single-line’ manufacturing without cross-contamination issues.
3.5.2 Quantifying charge carrier transport processes: DC & AC Testing
The electrical response of mixed conducting pellets with ion-blocking metal electrodes (gold) can
be represented using a circuit model that accounts for the two charge carrier transport mechanisms,
i.e. electronic and ionic, as illustrated in Figure 3.9a. The ionic conduction rail has circuit elements
to account for the resistance to ion hopping within individual grains (Rion), resistance to ion
hopping across grains with different orientations (Rgb), capacitive contribution at the grain
boundary (Cgb) and intercalation capacitance (Cint). The electronic conduction rail is simplified to
a single resistive element with ohmic response (Reon). A capacitive element accounting for the
pellet geometric capacitance effects (Cgeom) by passes the electronic and ionic conduction rails.28
Given that the tested pellets are reasonably thick (2.3 mm), the geometric capacitance rail is
ignored as it correlates inversely with the separation distance as given by the expression: 𝐶 =
𝜀𝑜𝜀𝑟𝐴 𝑑⁄ ; where ‘C’ is the capacitance, ‘εr’ is the relative permittivity of the pellet, ‘εo’ is the
permittivity of vacuum, ‘A’ is the pellet cross-sectional area, and ‘d’ is the pellet thickness.
At the high-frequency limit, the interfacial capacitance and grain boundary capacitance become
shorted as the impedance of capacitive elements correlate inversely with AC signal frequency as

87
given by the expression: 𝑍𝐶 = 1 𝑗𝜔𝐶⁄ , where ‘Zc’ refers to the capacitive impedance, and ‘ω’
refers to the angular frequency. Hence, the equivalent circuit gets reduced to Figure 3.9b. At the
DC limit (ω=0), all capacitance elements offer very high impedance and the equivalent circuit is
reduced to just the electronic conduction rail as shown in Figure 3.9c.
(a) (b) (c)
Figure 3.9 (a) Electrical equivalent circuit model representing physical processes in a mixed
electronic-ionic conductors with blocking electrodes, (b) Limiting model for high-frequency AC
signal, and (c) Limiting model for DC signal.28
The total conductivity due to all charge carriers (ions and electrons) is estimated from the high
frequency intercept of the impedance curves. For the impedance measurement, the impedance
curves gets smaller (total conductivity increases) with rising temperature due to an overall
enhancement of charge carrier transport processes as shown in Figure 3.10a.
For DC testing, Figure 3.10b. shows the measured current response after applying a step
potential of 200 mV. There is an initial capacitive decay and steady state current is attained at
longer durations that is related to the steady-state supply of charge carriers. The data is fitted with
an exponential curve to extrapolate the steady state current and subsequently obtain electronic
conductivity values at different temperatures.

88
(a) (b)
Figure 3.10 Electrical testing of P2-NMT sintered pellet: (a) High-frequency AC impedance
spectra in temperature range of 383-423 K with 10 K increments, and (b) Current decay response
upon applying a potential of 200 mV at a 383 K.
The total conductivity curves and the electronic conductivity curves obey Arrhenius
temperature relation (Figure 3.11). The total conductivity is around 4 orders magnitude higher than
the electronic conductivity for both phases. This shows that sodium ions are the dominant charge
carriers for these layered materials.
The electronic conductivity of P2-NMT (1.21×10⁻⁷ S/cm at 110 oC) is higher than P2-NT
(3.96×10⁻⁸ S/cm at 110 oC) with Ea values of 0.574 eV and 0.862 eV, respectively. The charge
carrier transport is demonstrated to show a significant improvement by manganese incorporation
by providing a percolation network in the transition metal layer. It is also found that P2-NMT has
total conductivity of 8.28×10⁻³ S/cm (at 110 oC) with activation energy (Ea) of 0.279 eV while P2-
0 10 20 30 40
0
10
20
30
40
150oC
-Zim
(
)
Zreal ()
110oC
0.000 0.002 0.018 0.135 1.000 7.3890.0
0.5
1.0
1.5
2.0
2.5
Fitting
Time (h)
Curr
ent
(A
)
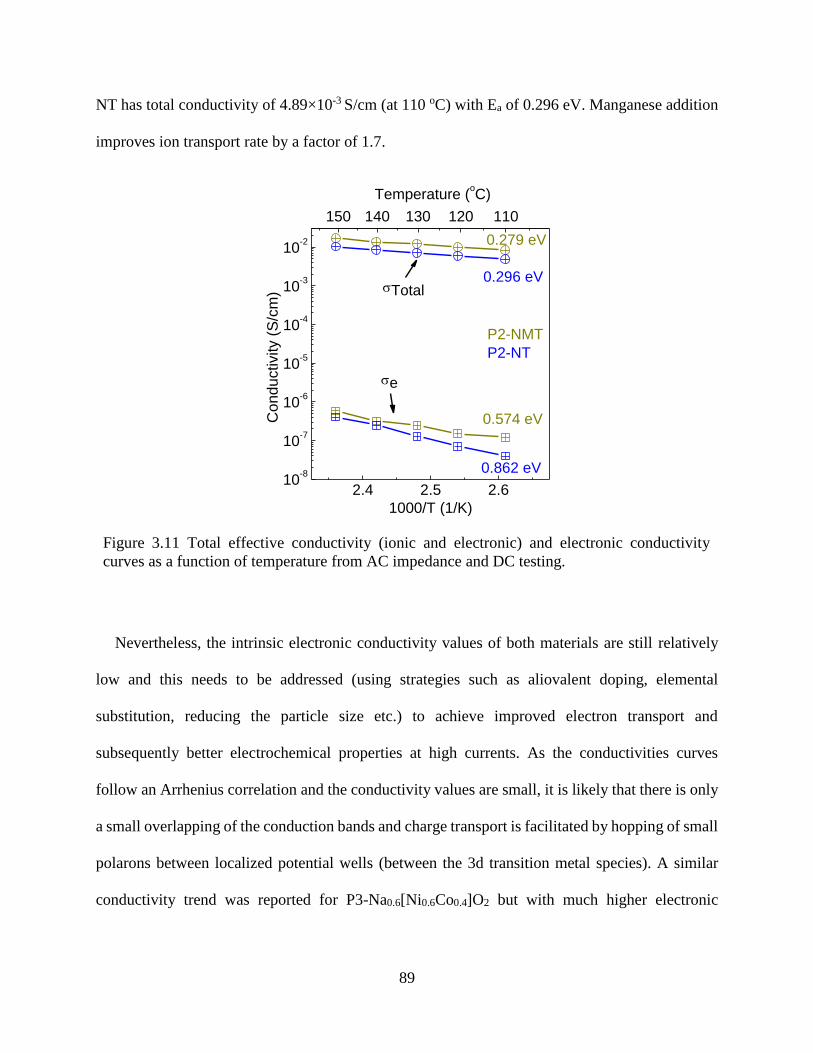
89
NT has total conductivity of 4.89×10⁻³ S/cm (at 110 oC) with Ea of 0.296 eV. Manganese addition
improves ion transport rate by a factor of 1.7.
Figure 3.11 Total effective conductivity (ionic and electronic) and electronic conductivity
curves as a function of temperature from AC impedance and DC testing.
Nevertheless, the intrinsic electronic conductivity values of both materials are still relatively
low and this needs to be addressed (using strategies such as aliovalent doping, elemental
substitution, reducing the particle size etc.) to achieve improved electron transport and
subsequently better electrochemical properties at high currents. As the conductivities curves
follow an Arrhenius correlation and the conductivity values are small, it is likely that there is only
a small overlapping of the conduction bands and charge transport is facilitated by hopping of small
polarons between localized potential wells (between the 3d transition metal species). A similar
conductivity trend was reported for P3-Na0.6[Ni0.6Co0.4]O2 but with much higher electronic
2.4 2.5 2.610
-8
10-7
10-6
10-5
10-4
10-3
10-2
150 140 130 120 110
P2-NMT
P2-NT
e
Co
nd
uctivity (
S/c
m)
1000/T (1/K)
Total
0.862 eV
0.296 eV
Temperature (oC)
0.574 eV
0.279 eV

90
conductivity values (σe>10-2 S/cm at 270 K) facilitated by the faster electron hopping via cobalt
and nickel atoms.29
3.5.3 Evaluating ionic transport and interfacial processes: Electrochemical impedance
spectroscopy
Electrochemical impedance spectroscopy (EIS) is utilized as a quantitative tool to isolate various
sodium-ion transport processes in the composite electrode that have widely separated time
constants. It has been demonstrated that the basic electrical circuit elements such as resistors,
capacitors and their modified combinations have similar mathematical formulation as physical,
chemical and electrochemical processes. For instance, the ion transport in electrolytes can be
represented by Equation 3.3 which takes the same mathematical form as an ohmic resistor
𝑖𝑖 = 𝑍𝑖𝑒𝐶𝑖𝑢𝑖𝐸 = 𝜎𝑖𝐸 = 𝐸/𝑅𝑖 3.3
where ‘ii’ is the ionic current due to species i, ‘Zi’ is the charge of species i, ‘e’ is the charge of
an electron, ‘Ci’ is the concentration of species i, ‘ui’ is the mobility of species i, ‘E’ is the electric
field, ‘σi’ is the partial conductivity due to species i, and ‘Ri’ is the ohmic resistance.
Interfacial charge transfer reactions can be represented by a resistive circuit element (referred
as charge transfer resistance, ‘Rct’) and are inversely correlated to the equilibrium exchange
current density, ‘io’ as described by Equation 3.4.
𝑅𝑐𝑡 = 𝑅𝑇 𝑛𝐹𝑖𝑜⁄ 3.4
where ‘R’ is the molar gas constant, ‘T’ is the temperature, ‘n’ is the number of electrons
transferred, and ‘F’ is the Faraday’s constant.

91
These circuit elements are applied for emulating the multi-time scale physicochemical
processes and interpreting impedance spectra data. Assigning different parameters to various
physicochemical processes permits identification of the bottleneck processes. However, several
circuit models can provide a good match to the experimental spectra and the selected model needs
to have reasonable physical meaning for accurate interpretation. This requires a priori knowledge
of the basic processes for a given system and state-of-the-art models for similar materials.
Figure 3.12 Electrical equivalent circuit model depicting sodium ion transport processes (within
liquid electrolyte, across surface films, across the interface, and bulk solid state diffusion) of the
composite electrode; where Re is the electrolyte resistance, Rsf is the surface film resistance,
CPEsf is the constant phase element due to surface films, CPEct is the constant phase element
due to the double layer, and Zw is the semi-infinite Warburg diffusional element.
The impedance curves of Na-intercalation electrodes are analyzed using an analogous circuit
model developed previously to interpret lithium intercalation phenomenon in graphite and lithium
transition metal oxides30-32
as depicted in Figure 3.12. Nyquist plots of P2-NT and P2-NMT
electrodes display the following features: two over-lapping semi-circles in the high frequency
domain, one semi-circle in the medium frequency domain and a small diffusion tail at the low
frequency domain (depending on the electrode potential) as seen in Figure 3.13. The semi-circles
at the high and medium frequency region are attributed to the relatively fast transport of sodium

92
ions through the surface films at the film/electrolyte interface (at active material and sodium
metal), coupled with film capacitance. These surface films can be formed on the pristine material
due to interaction with atmospheric CO2 or decomposition of electrolyte constituents during
sodium intercalation/de-intercalation and have been reported for intercalation materials.30
The
capacitance has been modeled using a constant phase element (CPE) to account for the depressed
semi-circles formed possibly due to surface heterogeneities. The effective capacitance (C) is
calculated using the relation, C=Q1/α R
(1/α-1);33,34
where ‘Q’ and ‘α’ are the CPE fitting parameters
and ‘R’ is the resistance fitting parameter.
The low frequency semi-circle is assigned to the interfacial charge transfer of sodium ions (Rct),
coupled with capacitance (Cct) at the electrode/surface film interface. The analysis of the
impedance spectra was performed using Zview impedance analysis software (Scribner Associates
Inc., Southern Pines, NC). Non-linear Least Square fitting (NLLS) provides a good fitting of the
experimental data as seen in Figure 3.13. The linear tail region in the low frequency region is
attributed to diffusion phenomenon discussed subsequently.
The Cct is measured to be in the order of few mF, much higher than the film capacitance (10-4-
10-6 F) as seen in Figure 3.14a. The true surface areas of the porous electrode particles are much
higher than the geometric area and hence we get these high capacitance values. The film
capacitance values are in the range of µF as they correspond to surface film/electrolyte interface
as seen in Figure 3.14b.

93
(a) (b)
(c)
Figure 3.13 Nyquist plot of P2-NT (blue) and P2-NMT (yellow) electrodes scanned between
frequency range of 5 MHz to 10 mHz with inset showing high-frequency depressed semicircles
at voltage of (a) 3.4 V vs. Na/Na+, (b) 3.8 V vs. Na/Na+, and (c) 4.2 V vs. Na/Na+.
0 1000 2000 3000 40000
1000
2000
3000
4000 NMT
NT
Fitted
-Z
im (
)
Zreal ()
3.4 V
0 250 500 750 10000
250
500
750
1000 NMT
NT
Fitted
-Zim
Zreal
3.8 V
0 100 200 300 400 500 600
0
100
200
300
400
500
600 NT
NMT
Fitted
-Zim
(
)
Zreal ()
4.2 V

94
(a) (b)
Figure 3.14 Potential dependence of (a) charge transfer resistance and double layer capacitance,
and (b) surface film resistance and surface film capacitances.
Figure 3.14a shows that the interfacial charge transfer resistance (Rct), for both P2-NT and P2-
NMT, has a strong dependence on electrode potential and decreases by several orders of magnitude
as the electrode potential increases from 3.0 to 4.2 V. At highly oxidative potentials, the increased
amount of Ni4+/Ni2+ states allows for enhanced mobility of the charge carriers (between these
multivalent states) resulting in faster interfacial kinetics. Similar strong correlation of interfacial
kinetics with electrode potential has been previously observed for Li1-xCoO2 electrodes.31
Also, it
is found that the Rct of P2-NMT is considerably smaller than P2-NT over the complete range of
measured electrode potentials indicating that the former material supports faster interfacial transfer
than the latter. This trend aligns with the polaron attributed electronic conductivity boasting
mechanism discussed previously. The associated double-layer capacitance values (Cct) remains
fairly independent of the electrode potentials and is comparable for both materials. This is
3.0 3.3 3.6 3.9 4.210
0
101
102
103
104
0
3
6
9
12
15R
ct (
)
Electrode Potential (V) vs. Na/Na+
Cct (m
F)
NT
NMT
3.0 3.2 3.4 3.6 3.8 4.0 4.210
-7
10-4
Rsf1
Re
Rsf1
Rsf2
Csf1
Capacitance (
F)
Electrode Potential (V) vs. Na/Na+
Csf2
1
10
100
NMT
NT
Resis
tance (
)

95
anticipated as the electrode surface area does not change significantly during sodium de-
intercalation. The electrolyte resistance is invariant with electrode potential as the concentration
of sodium ions is constant. The surface film resistances (Rsl1 and Rsf2) and surface film capacitances
(Csf1 and Csf2 ) are largely invariant with electrode potential suggesting that these films are fairly
stable and do not change significantly in their chemical make-up/composition (that can affect the
dielectric constant) and film thickness in the high voltage region.
The solid state diffusion of sodium ions within the active particles contributes to the Warburg
response in the low frequency domain as seen by the characteristic linear response in the Nyquist
plots (45o tails) depicted in Figure 3.13b and c (seen distinctly for P2-NMT). We make use of the
conventional planar diffusion model, typically used to simulate intercalation electrodes, to
interpret the experimental data.31,35
The imaginary and real components of the impedance can be
expressed as Equation 3.5 and Equation 3.6:
−𝑍𝑗 =𝑉𝑚𝑑𝐸𝑑𝑥
𝐴𝐹√2�̃�𝜔−1/2 = 𝐴𝑊 𝜔−1/2
3.5
𝑍𝑟𝑒𝑎𝑙 =𝑉𝑚𝑑𝐸𝑑𝑥
𝐴𝐹√2�̃�𝜔−1/2 = 𝐴𝑊 𝜔−1/2
3.6
where ‘Zj’ is the imaginary impedance, ‘Zreal’ is the real impedance, ‘Vm’ is the molar volume,
‘𝑑𝐸𝑑𝑥’ is the slope of the voltage-composition curve, ‘A’ is the surface area of the electrode, ‘F’
is the Faraday constant, ‘�̃�’ is the chemical diffusion co-efficient, ‘𝜔’ is the angular frequency,
and ‘Aw’ is the Warburg pre-factor.

96
The Warburg pre-factor (AW) is estimated from linear fitting of the experimental data as shown
in Figure 3.15 The average of Aw from the real and imaginary part of impedance was used to obtain
the apparent chemical diffusion coefficient of sodium ions in the host materials.
The impedance curves of P2-NT (all measured voltages) and P2-NMT at 3.0 V do not show a
distinctive diffusion tail (within the measured frequency domain) and hence are not considered for
further analysis. This is because the slow interfacial kinetics overshadows the diffusion process.
The measured ‘D’ values for P2-NMT, from EIS, are reasonably high (Mean D=9.1×10⁻¹³ cm2/s),
as typical of intercalation electrodes. Further discussion of the diffusion co-efficients is provided
in the subsequent electroanalytical section.
Figure 3.15 Linear fitting of Zreal vs. ω-0.5 curves using planar diffusion model to obtain
Warburg prefactor.
200
300
400
4.2 V
A4.2=15.824
3.8 V
A3.8=13.717
3.4 V
A3.4=18.143
4.2 V
A4.2=11.640
3.8 V
A3.8=10.599
ZR
ea
l (
)
3.4 V
A3.4=17.549
0 1 2 3 4 50
20
40
60
80
100
-ZIm
()
-0.5(rad s-1)-0.5

97
3.5.4 Analyzing ionic transport processes: Potentiostatic intermittent titration technique
Potentiostatic Intermittent Titration technique (PITT) provides a complimentary method to
evaluate the diffusional properties of the studied materials. Low limitation currents of C/100 were
imposed to approach close-to-equilibrium conditions. The electrodes were subjected to initial
precycling at C/10 rate before the PITT experiments (as depicted in inset of Figure 3.16a and b).
The voltage profiles of P2-NT and P2-NMT materials are fairly comparable to galvanostatic
testing. P2-NT has a solid solution behavior evidenced by the sloping voltage trend when cycled
with voltage limit of 4.2 V. It has a low faradaic efficiency as the low limiting current values feed
the irreversible side reactions. P2-NMT has sloping voltage profile till 4.1 V after which a plateau
is noticed.
The PITT voltage profile of P2-NT material in the anodic regime (Figure 3.16c) has
significantly large irreversible capacity loss compared to the galvanostatic testing. The increase in
side reactions at slower charging rate suggests that these side reactions are catalyzed chemically
at these reductive potentials rather than electrochemical mechanisms. Long-time approximation
method is used to extract diffusional information from PITT measurements. Kinetic limitations,
that are noticeable in the impedance analysis, are overcome by using a relatively long relaxation
time (current drops to C/100) between the incremental steps. The expression for current transient
upon impressing a constant potential is given by Equation 3.7.
𝐼(𝑡) =2𝑄′�̃�
𝐿2𝑒𝑥𝑝 (
−𝜋2�̃�𝑡
4𝐿2)
3.7
where I(t) is the measured current transient, Q’ is the charge passed during the incremental
potential step, �̃� is the chemical diffusion co-efficient, L is the diffusion length scale, and t is the
time taken for relaxation.

98
(a) (b)
(c)
Figure 3.16 Voltage profile under potentiostatic intermittent titration technique using C/100
current limitation for (a) cathodic P2-NT with 5 mV voltage step, and (b) cathodic P2-NMT
with 5 mV voltage step, and (c) anodic P2-NT with 15 mV voltage step; inset in cathodic curves
depict electrode precycling at C/10 rate.
0 25 50 75 1002
3
4
5
0 30 60 90 120 150 180
2.0
2.5
3.0
3.5
4.0
4.5
4th3
rd
2nd
1st - 4
th
Capacity (mAh/g)
Voltage (
V)
vs. N
a/N
a+ 1
stNT: Ni
2+/4+
1st
- 5th
Initial 5 Cycles
Galvanostatic
0 20 40 60 80 100 120
2.0
2.5
3.0
3.5
4.0
4.5
0 25 50 75 1002
3
4
5
Vo
lta
ge
(V
) vs. N
a/N
a+
Capacity (mAh/g)
NMT: Ni2+/4+
1st - 4th
1st
- 4th
Initial 5 Cycles
Galvanostatic
0 30 60 90 120 150 180
0.0
0.5
1.0
1.5
2.0
2nd
1st
3rd
Vo
lta
ge
(V
) vs. N
a/N
a+
Capacity (mAh/g)
NT: Ti4+/3+

99
(a) (b)
(c)
Figure 3.17 (a) Linear fitting of current transients from potentiostatic intermittent titration
technique at different electrode potentials with current limitation of C/100 for cathodic P2-NT
electrode, (b) linear fitting of P2-NMT electrode under identical conditions, and (c) variation of
apparent chemical diffusion co-efficient with electrode potential as calculated from
potentiostatic intermittent titration technique and impedance spectroscopy.
250 500 750 1000 1250 1500-11.45
-11.40
-11.35
-11.30
-11.25
NT
4.2 V
4.1 V
4.0 V
3.9 V
3.8 V
3.7 V3.6 V
3.5 V
ln I
Time (s)
3.4 V
C/100
150 300 450 600 750
-11.70
-11.64
-11.58
-11.52
-11.46
-11.40
-11.34
C/100
4.1 V
3.9 V
4.0 V
3.6 V
ln I
Time (s)
3.4 V
3.5 V
3.7 V
3.8 V
NMT
3.3 3.6 3.9 4.210
-14
10-13
10-12
10-11
NMT, EIS
NMT, PITT
NT, PITT
Diffu
sio
n C
o-e
ffic
ient (c
m2/s
)
Voltage (V) vs. Na/Na+

100
Figure 3.17a and b displays the linearity of the experimental data for both NT and NMT
materials validating the use of this PITT model and the slope is used to estimate the diffusion co-
efficients. The estimated ‘D’ values are reasonably high (10-12-10-13 cm2/s) and comparable to EIS
estimates. The diffusivity of P2-NMT increases with voltage and falls off at 4.2 V as evident from
the PITT and EIS estimations in Figure 3.17c. P2-NT also follows a similar rising trend with
voltage. This can be rationalized by the fact that sodium diffusivity increases due to the creation
of additional sodium vacancies. However, it is likely that the low concentration of sodium ions
charge carriers leads to diffusivity drop at high voltages. The diffusivity dip of P2-NMT also gets
convoluted by the presence of additional phases that form at high charging voltage leading to
breakdown of current-transient model assumptions.
3.5.5 Understanding reaction mechanisms: Ex-situ XRD Testing
Ex-situ XRD testing on the P2-NT film electrodes at different stages of charging shows that the
material retains its P2-layered structure during sodium removal as shown in Figure 3.18a. The
dominant peak at 2θ of 16o starts to shift towards lower angles indicating that the structure starts
to expand along the c-direction (inset in Figure 3.19a). As sodium content decreases in these P2
materials, the oxygen atoms in the adjacent layers start experiencing increased repulsive
interactions contributing to the expansion along the c-axis. A solid-solution reaction mechanism
till charging voltage of 4.2 V without any phase change is confirmed by the XRD results. However,
when the charging voltage is increased to 4.5 V, an unidentified phase possibly related to O-type
structure forms (Figure 3.18b) and this phase change responsible for poor reversibility in the high
voltage region.

101
(a) (b)
(c) (d)
Figure 3.18 Ex-situ XRD of electrode films: (a) sodium nickel titanate cathode charged till 4.2
V with inset showing the evolution of 16o reflection, (b) sodium nickel titanate cathode charged
to 4.5 V, (c) sodium nickel manganese titanate cathode charged till 4.2 V, and (d) sodium nickel
titanate anode charged to 0.2 V with inset showing evolution of 16o reflection; all potentials are
measured with respect to Na/Na+.
10 20 30 40 50 60
15.0 15.5 16.0 16.5
4.2 V charged
3.6 V charged
Rela
tive Inte
nsity
2 (degrees)
Pristine
10 20 30 40 50 60
Rela
tive Inte
nsity
2 (degrees)
10 20 30 40 50 60
4.2 V Charged
4.1 V Charged
4.0 V Charged
3.9 V Charged
Rela
tive Inte
nsity
2 (degrees)
3.8 V Charged
10 20 30 40 50 60
15.5 16.0
25 Cycles
0.2 V Charged
Rela
tive Inte
nsity
2 (degrees)
Pristine

102
P2-NMT also demonstrates a solid-solution mechanism till charging voltage of 4.0 V where the
pristine phase peaks are retained as seen from Figure 3.18c. Removing further sodium leads to
formation of a low-angle peak at 12.5o. During subsequent sodium intercalation, this peak vanishes
and the film returns to its initial state suggesting good reversibility. This is possibly due to sodium
ordering processes along the c-direction.
P2-NT electrode in the anodic regime appears fairly stable without the formation of any metallic
components (such as nickel, titanium) confirming that the low-voltage reactions are due to
intercalation mechanism as shown in Figure 3.18d. Very little change in peak positions (16o)
suggests that the lattice parameters of the fully intercalated phase is fairly comparable to that of
the pristine phase. The XRD pattern of the cycled electrode also remains identical to the pristine
phase suggesting that the material does not degrade significantly during the electrochemical
cycling.
3.5.6 Evaluating capacity retention
3.5.6.1 Cycling Study
Capacity retention during repeated charge/discharge cycles is essential to designing long-life
battery devices. However, it is found that the repeated intercalation/de-intercalation processes
contributes causes mechanical strain effects as a result of host-intercalant interactions leading to
capacity fade. Other fade mechanisms include electrolyte degradation, dissolution of active
materials, defect formations, etc.36
The cycling study in this research work is limited to half-cell
testing that poses inherent limitations due to sodium dendritic formation.
In the cathodic regime, the faradaic efficiency of the P2-NT phase is poor in the initial few
cycles and it improves subsequent cycling. The discharge capacity is found to be fairly stable

103
during the tested 30 cycles as shown in Figure 3.19a P2-NMT phase has an initial stabilization
period of 10 cycles after which it shows excellent charge retention with no loss in discharge
capacity between 11th and 50th cycle. Figure 3.19b illustrates that the faradaic efficiency of NMT
phase is fairly close to 100%. The initial stabilization phase is attributed to electrolyte side
reactions. The excellent capacity retention of the P2 materials in cathodic regime, even in half-cell
testing, is due to the very small volume expansion as reported for similar structures.37
Since the
material does not undergo significant strain during sodium exchange processes, the active particles
remain fairly intact and contribute to good cycling performance. These compositions show promise
for designing long-life, intercalation host electrodes.
In the anodic regime, P2-NT phase shows a continuous capacity fade as observed in Figure
3.19c. Considering that the XRD patterns of the cycled electrode remained identical to the pristine
phase, this capacity fade is not associated with bulk structural changes that would lead to loss of
crystallinity. We predict that this is due to electrolyte degradation at the low potentials that gets
catalyzed by nickel atoms in this P2 composition. Recently a lithiated P2 phase with identical
prototypical structure has been shown to have excellent capacity retention.37
Future work would
need to focus on identifying electrolyte degradation components using spectroscopic
characterization techniques. This would isolate the solvent component that is responsible for the
fade mechanism and enable development of better electrolyte combinations.

104
(a) (b)
(c)
Figure 3.19 Capacity retention study with 4.2 V upper voltage cutoff for (a) cathodic sodium
nickel titanate at C/10 rate, (b) cathodic sodium nickel manganese titanate electrodes tested at
C/5 rate, and (c) anodic sodium nickel titanate tested at C/5 rate.
3.5.6.2 Impedance change during cycling
Impedance spectra of P2-NMT phase was analyzed during the cycling test after the charging the
electrodes to 4.2 V as shown in Figure 3.20a. The curves remain fairly consistent suggesting that
the underlying physicochemical processes are identical for the pristine and cycled electrode.
0 10 20 300
30
60
90
120
20
40
60
80
100
Charge
Discharge Effic
iency (
%)
Ca
pa
city (
mA
h/g
)
Cycle Number
Efficiency
0 10 20 30 40 500
20
40
60
80
100
120
0
20
40
60
80
100
120
Charge
Discharge Effic
iency (
%)
Ca
pa
city (
mA
h/g
)
Cycle Number
Efficiency
0 5 10 15 20 250
30
60
90
120
150
180
210
40
50
60
70
80
90
100
Charge
Discharge
Effic
ien
cy (
%)
Ca
pa
city (
mA
h/g
)
Cycle Number
Efficiency

105
(a)
(b) (c)
Figure 3.20 (a) Nyquist impedance spectroscopy plot of sodium nickel manganese titanate
electrode scanned in frequency range of 5 MHz to 10 mHz after charging to 4.2 V, (b) variation
of impedance resistive parameters, and (c) capacitive parameters during cycling.
0 100 200 3000
100
200
300
1st cycle
10th cycle
20th cycle
30th cycle
40th cycle
50th
cycle
-Zim
(
)
Zreal ()
0 10 20 30 40 500
50
100
150
200
Re
Rsf2
Rsf1
Re
sis
tan
ce
(
)
Cycle Number
Rct
0 10 20 30 40 5010
-7
10-6
10-5
10-4
10-3
10-2
Csf2
Csf1
Ca
pacita
nce
(F
)
Cycle Number
Cct

106
The electrolyte resistance, from the high-frequency intercept, was found to be invariant during
the electrode cycling as shown in Figure 3.20b. Even though the electrolyte composition is not
optimized and sodium metal still reacts with the solvent, those effects did not affect the ionic
conductivity considerably. The interfacial charge transfer resistance, after the initial stabilization
period, remains invariant. The surface film resistances show only minor fluctuations during the
testing. The invariant double-layer capacitance can be correlated to the stable surface area of the
active particles, while the invariant surface film capacitance correlates to insignificant change to
the dielectric properties of the surface films (Figure 3.20c). These suggests that the side reactions
get arrested after the initial cycles and a relatively stable passivation film (SEI) gets formed at the
electrode/electrolyte interface.
3.5.7 Rate performance testing
Cathodic P2-NT material prepared from nano-sized precursors provides capacity values of 81
mAh/g, 77 mAh/g, 68 mAh/g, 34 mAh/g, and 9 mAh/g at C/20, C/10, C/5, 1C, and 2C rates,
respectively, as shown in Figure 3.21a. Cathodic P2-NT material prepared from micron-sized
precursors yielded capacity values of 60 mAh/g, 53 mAh/g, 45 mAh/g, 17 mAh/g and 3 mAh/g at
C/20, C/10, C/5, 1C and 2C, respectively. The cathodic P2-NT powders with smaller particle size
delivers higher capacity values due to shorter charge-carrier transport length scales.
It was also found that P2-NMT material (micron-sized precursors) provides capacity values of
90 mAh/g, 80 mAh/g, 65 mAh/g, 54 mAh/g and 40 mAh/g at C/20, C/10, C/5, 1C and 2C,
respectively (Figure 3.21b). Under identical processing and calcination conditions, P2-NMT phase
clearly has improved capacity retention and is more suitable for high power applications. As
discussed in the previous sections, this capacity boast with manganese substitution is attributed to
accelerated interfacial kinetics of sodium ion transfer at the electrode/electrolyte interface,

107
relatively unhindered electron hopping facilitated between manganese and nickel sites, and higher
diffusivity of sodium ions as demonstrated from EIS, DC measurements and PITT analysis.
(a) (b)
(c)
Figure 3.21 High-current rate testing of (a) cathodic sodium nickel titanate powders with
micron- and nano-sized powders, (b) cathodic sodium nickel titanate and sodium nickel
manganese titanate electrodes with 4.2 V cutoff, and (c) anodic sodium nickel titanate with
cutoff voltage of 0.2 V.
.
Anodic P2-NT furnishes capacity values of 75 mAh/g, 73 mAh/g, 70 mAh/g, 53 mAh/g, 43
mAh/g, and 30 mAh/g at charging rates of C/20, C/10, C/5, 1C, 2C, and 4C respectively (Figure
0 5 10 15 20 25
0
30
60
90
Nano-sized
Micron-sized
C/20 C/10 C/5 1C 2C
Ca
pa
city (
mA
h/g
)
Cycle Number
NT
0 5 10 15 20 25 300
30
60
90
120
150
NT
C/20 C/10 C/5 C/2 1C 2C
Ca
pa
city (
mA
h/g
)
Cycle Number
NMT
0 5 10 15 20 25 30 350
30
60
90
120
150
Charge
Discharge
C/20 C/10 C/5 1C 2C 4C
Ca
pa
city (
mA
h/g
)
Cycle Number

108
3.21c). These values are significantly better than those in the cathodic region for the same
composition. The improved rate performance in the anodic region is due to the presence of large
number of titanium atoms, i.e. 2/3 of Ti compared to 1/3 of Ni, forming a percolating network
leading to enhanced electron conduction (due to Ti4+/3+) in the transition metal layer.
3.6 Improving cathodic stability: Calcium substitution
During charging, the sodium content becomes reduced in the layered host materials and this leads
to excessive unfavorable repulsive interactions and phase change. This limits the electrochemical
window and also leads to loss of reversible capacity. The scope of this preliminary study was to
potentially stabilize the layered oxides using calcium substitution. Calcium is anticipated to occupy
the sodium layer and provide structural stability at high charging voltages.
(a) (b)
Figure 3.22 (a) XRD characterization of 5% and 20% calcium substituted sodium nickel titanate
prepared by solid-state reaction at 900 oC, and (b) EDS mapping of 5% sodium nickel titanate
powders to check calcium distribution.
10 20 30 40 50 60
Ca-5%
Ca-20%
-Target
-CaTiO3
Rela
tive Inte
nsity
2 (degree)

109
Sodium was partially replaced with calcium to prepare target compositions of
[Na0.53Ca0.07][Ni0.33Ti0.67]O2 (20% calcium substituted) and [Na0.63Ca0.02][Ni0.33Ti0.67]O2 (5%
calcium substituted). The stoichiometric precursors consisting of Na2CO3, nano-NiO, nano-TiO2
and CaO (99.9%) were wet milled as discussed before and fired at 900 oC.
The XRD patterns of 20% Ca-substituted material indicated that the calcium did not get
incorporated in the layered structure and formed a perovskite secondary phase with composition
CaTiO3 (ICSD reference code: 88-0790) as seen in Figure 3.22a. The powders prepared with a
lower 5% calcium content also displayed the characteristic perovskite peaks. EDS mapping was
performed on the 5% calcium-powders to check the overall distribution of calcium as seen purple
spots in Figure 3.22b. Nickel distribution is overlayed as an internal standard.
The calcium distribution is found to be fairly uniform without significant enrichment due to
perovskite particles. This suggests the possibility of low-level calcium substitution or perovskite
phase forming a thin coating on all the particles. Since we did not have a solid evidence for calcium
forming a solid solution, these powders were not electrochemically characterized. Nevertheless, a
recent research study supports the concept of calcium-attributed stabilization in isostructural
Na0.7CoO2 with significantly improved capacity retention.38
3.7 Improving anodic capacity: Potassium substitution
The anodic capacity of the P2-NT phase is limited by the number of available vacant sites in the
structure; 1 mole of Na2/3[Ni1/3Ti2/3]O2 has 1/3 unoccupied ‘2b’ and ‘2d’ sites limiting the
theoretical capacity to 90 mAh/g. Recently, a lithiated P2 phase, Na2/3[Li1/3Ti2/3]O2, was found to
have excellent electrochemical properties in the anodic regime.37
For these P2 non-stoichiometric

110
materials, even a modest increase in vacancy concentration would provide a significant boast to
the sodium intercalation capacities as seen from Table 3.1.
Table 3.1 Theoretical capacity of P2-titanate materials based on vacancy concentration.
Composition Vacancy (1-x) Theoretical capacity (mAh/g) Molar mass (g/mol)
Na0.67[Li0.33Ti0.67]O2 0.33 105.9 86.0
Na0.55[Li0.18Ti0.82]O2 0.45 141.9 85.0
Na0.5[Li0.17Ti0.83]O2 0.50 158.5 84.5
(a) (b)
Figure 3.23 XRD characterization of powders to synthesize (a) sodium deficient compositions
with x=0.67, 0.55 and 0.50 at firing temperature of 1000 oC for 20 h duration, and (b) Na2/3-yKy
[Li1/3Ti2/3]O2 for y=0, 0.05, 0.10 and 0.15 prepared at firing temperature of 800oC for 20 h.
Solid-state synthetic technique was utilized to prepare the aforementioned low sodium content
phases with theoretical capacity of ~158 mAh/g, i.e. 75% higher than the pristine phase. The
pristine lithiated phase (x=0.67) was successfully prepared with solid-state synthesis technique by
firing the precursor powders at 1000 oC for net duration for 20 hours; the calcined powders were
10 20 30 40 50 60
x=0.50
x=0.55
- Na2/3
[Li1/3
Ti2/3
]O2
-[NaLi]Ti3O
7
Inte
nsity
2 (degree)
x=0.67
10 20 30 40 50 60
-K0.8
[Li0.13
Ti0.87
]O4
-[NaLi]Ti3O
7
y=0.15
y=0.10
y=0.05
- Na2/3
[Li1/3
Ti2/3
]O2
Inte
nsity
2 (degree)
y=0

111
ground after heating for 10 hours to promote powder homogeneity and fired for additional 10
hours. Figure 3.23a confirms that the prepared powders of the pristine phase were phase-pure.
Sodium deficient phases (x=0.55 and x=0.50) were prepared by identical methods but resulted
in the formation of [NaLi]Ti3O7 impurity phase (ICSD reference: 52-0690). This is due to
structural destabilization due to increased alkali layer spacing. Samples were prepared with
potassium contents of 0, 0.05, 0.1, and 0.15 by firing at 1000oC.
Potassium is studied as a potential stabilizer due to large A-O bond length and its preference
for prismatic co-ordination. Solid-state synthetic method was utilized to prepare potassium
substituted compositions, [Na0.5-xKx][Li0.17Ti0.83]O2 (x=0.05, 0.10, and 0.15). However, it was
found that potassium does not show solubility in the studied material and tunnel-type impurity
phase, with K0.8[Li0.13Ti0.87]O4 prototype structure, (ICSD reference: 89-5420) formed under the
synthetic conditions as shown in Figure 3.23b.
Attempts to quench the powders rapidly from 1000oC to room temperature to possibly freeze
the meta-stable low-sodium content phases yielded identical impurity phases. It is likely that the
formation of the sodium deficient structures with large interlayer spacing is unfavorable, especially
with solid-state reaction conditions involving high thermal energy.
3.8 Summary and future work
In this chapter, titanate-based layer-structured quaternary oxide, sodium nickel titanate, is
investigated as a novel sodium intercalation electrode. The solid-state synthetic methods were
optimized using micron-sized and nano-sized precursors to prepare phase-pure powders with
different particle morphologies. We studied the electrochemical properties of P2-NT phase and
demonstrated its potential as a ‘bi-functional’ electrode material. We anticipate that this ‘bi-
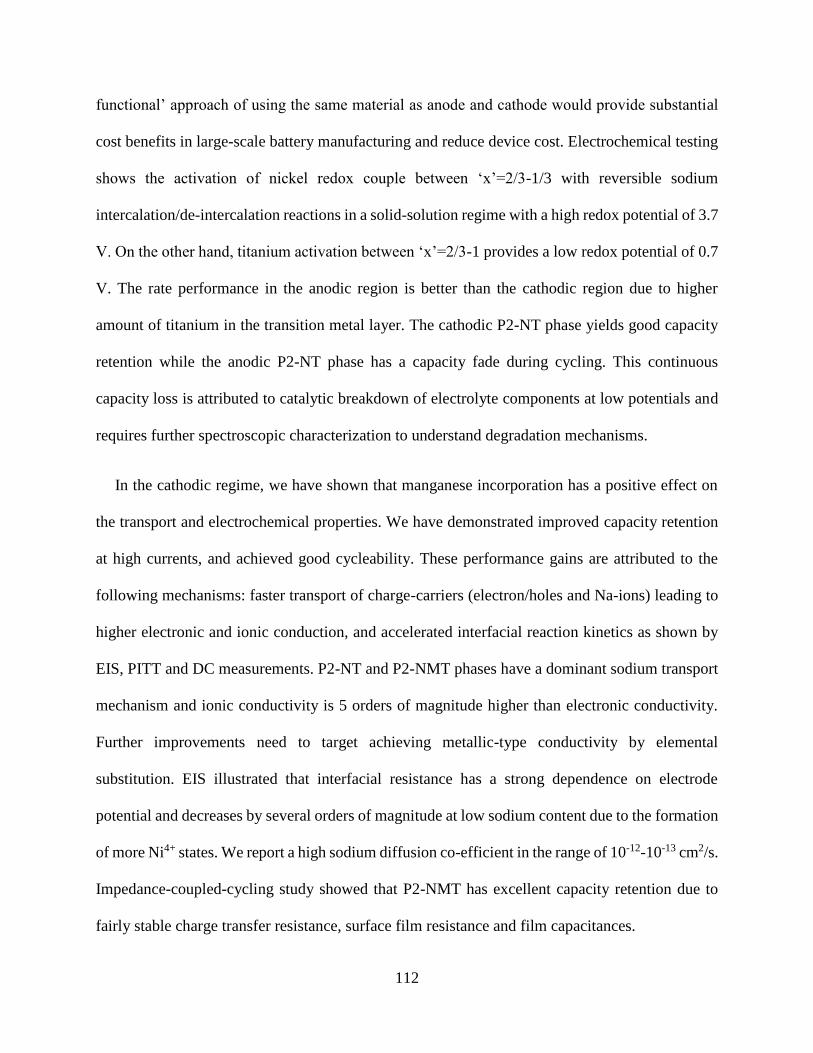
112
functional’ approach of using the same material as anode and cathode would provide substantial
cost benefits in large-scale battery manufacturing and reduce device cost. Electrochemical testing
shows the activation of nickel redox couple between ‘x’=2/3-1/3 with reversible sodium
intercalation/de-intercalation reactions in a solid-solution regime with a high redox potential of 3.7
V. On the other hand, titanium activation between ‘x’=2/3-1 provides a low redox potential of 0.7
V. The rate performance in the anodic region is better than the cathodic region due to higher
amount of titanium in the transition metal layer. The cathodic P2-NT phase yields good capacity
retention while the anodic P2-NT phase has a capacity fade during cycling. This continuous
capacity loss is attributed to catalytic breakdown of electrolyte components at low potentials and
requires further spectroscopic characterization to understand degradation mechanisms.
In the cathodic regime, we have shown that manganese incorporation has a positive effect on
the transport and electrochemical properties. We have demonstrated improved capacity retention
at high currents, and achieved good cycleability. These performance gains are attributed to the
following mechanisms: faster transport of charge-carriers (electron/holes and Na-ions) leading to
higher electronic and ionic conduction, and accelerated interfacial reaction kinetics as shown by
EIS, PITT and DC measurements. P2-NT and P2-NMT phases have a dominant sodium transport
mechanism and ionic conductivity is 5 orders of magnitude higher than electronic conductivity.
Further improvements need to target achieving metallic-type conductivity by elemental
substitution. EIS illustrated that interfacial resistance has a strong dependence on electrode
potential and decreases by several orders of magnitude at low sodium content due to the formation
of more Ni4+ states. We report a high sodium diffusion co-efficient in the range of 10-12-10-13 cm2/s.
Impedance-coupled-cycling study showed that P2-NMT has excellent capacity retention due to
fairly stable charge transfer resistance, surface film resistance and film capacitances.

113
Attempts to improve the stability of P2-NT phases using calcium substitution (20%) were
unsuccessful due to the formation of stable perovskite-structured calcium impurity phases during
material synthesis. We did not observe solid evidence of solid solution formation with calcium
even at lower substitutional level of 5%. It was identified that the anodic capacity can be improved
substantially by utilizing sodium deficient compositions (Nax[Ni1/3Ti2/3]O2 where x<2/3). These
highly non-stoichiometric phases were found to be unstable and could not be synthesized under
traditional solid-state routes. Efforts to stabilize these phases that contain high vacancy
concentration by incorporating larger potassium metal in the alkali layer results in phase separation
with tunnel-type impurity oxides. Soft chemistry routes are often utilized to prepare metastable
phases and it is likely that these potassium substituted phases can be synthesized under milder
conditions.39

114
BIBLIOGRAPHY

115
BIBLIOGRAPHY
1. Delmas, C., Fouassier, C. & Hagenmuller, P. Structural classification and properties of the
layered oxides. Physica 99B, 81–85 (1980).
2. Johnson, C. S. et al. Structural Characterization of Layered LixNi0.5Mn0.5O2(0<x< 2)
Oxide Electrodes for Li Batteries. Chem. Mater. 2313–2322 (2003).
3. Shin, Y. & Yi, M. Preparation and structural properties of layer-type oxides NaxNix/2Ti1-
x/2O2. Solid State Ionics 132, 131–141 (2000).
4. Bouwman, P., Boukamp, B. A., Bouwmeester, H. J. M. & Notten, P. H. L. Structure-related
intercalation behaviour of LiCoO2 films. Solid State Ionics 152-153, 181–188 (2002).
5. Rougier, A., Nazri, G. A. & C., J. Vibrational Spectroscopy and Electrochemical Properties
of LiNi0.7Co03O2 Cathode Material for Rechargeable Lithium Batteries. Ionics (Kiel). 3,
170–176 (1997).
6. Kim, H.-S., Kim, K., Moon, S.-I., Kim, I.-J. & Gu, H.-B. A study on carbon-coated
LiNi1/3Mn1/3Co1/3O2 cathode material for lithium secondary batteries. J. Solid State
Electrochem. 12, 867–872 (2008).
7. Choi, J. & Manthiram, A. Role of Chemical and Structural Stabilities on the
Electrochemical Properties of Layered LiNi1∕3Mn1∕3Co1∕3O2 Cathodes. J. Electrochem.
Soc. 152, A1714–A1718 (2005).
8. Thackeray, M. M. et al. Li2MnO3-stabilized LiMO2 (M = Mn, Ni, Co) electrodes for
lithium-ion batteries. J. Mater. Chem. 17, 3112 (2007).
9. Berthelot, R., Carlier, D. & Delmas, C. Electrochemical investigation of the P2–NaxCoO2
phase diagram. Nat. Mater. 10, 74–80 (2011).
10. Lee, D. H., Xu, J. & Meng, Y. S. An advanced cathode for Na-ion batteries with high rate
and excellent structural stability. Phys. Chem. Chem. Phys. 15, 3304–12 (2013).
11. Lu, Z. & Dahn, J. R. In Situ X-Ray Diffraction Study of P2-Na2/3Ni1/3Mn2/3O2. J.
Electrochem. Soc. 148, A1225–A1229 (2001).
12. Komaba, S. et al. Study on the Reversible Electrode Reaction of Na1-xNi0.5Mn0.5O2 for
a Rechargeable Sodium-Ion Battery. Inorg. Chem. 51, 6211–6220 (2012).
13. Yabuuchi, N. et al. P2-type Na(x)[Fe(1/2)Mn(1/2)]O2 made from earth-abundant elements
for rechargeable Na batteries. Nat. Mater. 11, 512–7 (2012).

116
14. Buchholz, D., Chagas, L. G., Winter, M. & Passerini, S. P2-type layered
Na0.45Ni0.22Co0.11Mn0.66O2 as Intercalation Host Material for Lithium and Sodium
Batteries. Electrochim. Acta (2013). doi:10.1016/j.electacta.2013.02.109
15. Kim, D. et al. Enabling Sodium Batteries Using Lithium-Substituted Sodium Layered
Transition Metal Oxide Cathodes. Adv. Energy Mater. 1, 333–336 (2011).
16. Fujimoto, K., Ikezawa, K. & Ito, S. Charge–discharge properties of a layered-type
Li(Ni,Co,Ti)O 2 powder library. Sci. Technol. Adv. Mater. 12, 054203 (2011).
17. Kam, K. C., Mehta, a., Heron, J. T. & Doeff, M. M. Electrochemical and Physical Properties
of Ti-Substituted Layered Nickel Manganese Cobalt Oxide (NMC) Cathode Materials. J.
Electrochem. Soc. 159, A1383–A1392 (2012).
18. Tang, H., Zhao, F., Chang, Z., Yuan, X.-Z. & Wang, H. Synthesis and Electrochemical
Properties of High Density LiNi0.8Co0.2−xTixO2 for Lithium-Ion Batteries. J.
Electrochem. Soc. 156, A478–A482 (2009).
19. Shin, Y.-J., Park, M.-H., Kwak, J.-H., Namgoong, H. & Han, O. H. Ionic conduction
properties of layer-type oxides. Solid State Ionics 150, 363–372 (2002).
20. Kabi, S. & Ghosh, A. Polaron conduction in Lix[Ni1/3Mn1/3Co1/3]O[2−δ] (x=1, 0.9 and
δ=0, 0.05) cathodes. J. Appl. Phys. 107, 103715 (2010).
21. Rao, M. C., Begum, S. M., Reddy, E. S. & Hussain, O. M. Electrical conduction behavior
of LiNixCo1-xO2 thin films. AIP Conf. Proc. 613, 613–614 (2012).
22. Zhuang, Q. et al. An Electrochemical Impedance Spectroscopic Study of the Electronic and
Ionic Transport Properties of Spinel LiMn 2 O 4. J. Phys. Chem. C. 114, 8614–8621 (2010).
23. Singh, R. S., Ansari, T. H., Singh, R. A. & Wanklyn, B. M. Electrical conduction in NiTiO3
single crystals. Mater. Chem. Phys. 40, 173–177 (1995).
24. CRC Handbook of Physics and Chemistry. CRC Handb. Phys. Chem. 10–197 (CRC Press,
2013).
25. Zandbergen, H. W., Foo, M., Xu, Q., Kumar, V. & Cava, R. J. Sodium ion ordering in
NaxCoO2 : Electron diffraction study. Phys. Rev. B 70, 024101 (2004).
26. Shanmugam, R. & Lai, W. Na2/3Ni1/3Ti2/3O2: “Bi-Functional” Electrode Materials for
Na-Ion Batteries. ECS Electrochem. Lett. 3, A23–A25 (2014).
27. Shanmugam, R. & Lai, W. Study of Transport Properties and Interfacial Kinetics of
Na2/3[Ni1/3MnxTi2/3-x]O2 (x = 0,1/3) as Electrodes for Na-Ion Batteries. J. Electrochem.
Soc. 162, A8–A14 (2014).

117
28. Huggins, R. A. Simple Method to Determine Electronic and Ionic Components of the
Conductivity in Mixed Conductors: A Review. Ionics (Kiel). 8, 300–313 (2002).
29. Saadoune, I., Maazaz, A., Menetrier, M. and & Delmas, C. On the NaxNi0.6Co0.4O2
System : Physical and Electrochemical Studies. J. Solid State Chem. 117, 111–117 (1996).
30. Aurbach, D. et al. Common Electroanalytical Behavior of Li Intercalation Processes into
Graphite and Transition Metal Oxides [ Q / It "]’. J.Electrochem. Soc 145, 3024–3034
(1998).
31. Levi, M. D. et al. Solid-State Electrochemical Kinetics of Li-Ion Intercalation into Li 1-x
CoO 2 : Simultaneous Application of Electroanalytical Techniques SSCV, PITT and EIS.
J. Electrochem. Soc. 146, 1279–1289 (1999).
32. Levi, M. D., Lu, Z. & Aurbach, D. Application of finite-diffusion models for the
interpretation of chronoamperometric and electrochemical impedance responses of thin
lithium insertion V 2 O 5 electrodes. Solid State Ionics 143, 309–318 (2001).
33. Hirschorn, B. et al. Determination of effective capacitance and film thickness from
constant-phase-element parameters. Electrochim. Acta 55, 6218–6227 (2010).
34. Lai, W. & Haile, S. M. Impedance Spectroscopy as a Tool for Chemical and
Electrochemical Analysis of Mixed Conductors: A Case Study of Ceria. J. Am. Ceram. Soc.
88, 2979–2997 (2005).
35. Lai, W. & Ciucci, F. Small-Signal Apparent Diffusion Impedance of Intercalation Battery
Electrodes. J. Electrochem. Soc. 158, A115–A121 (2011).
36. Zhang, D. et al. Studies on capacity fade of lithium-ion batteries. J. Power Sources 91, 122–
129 (2000).
37. Wang, Y. et al. A zero-strain layered metal oxide as the negative electrode for long-life
sodium-ion batteries. Nat. Commun. 4, 1–7 (2013).
38. Han, S. C. et al. Ca-doped NaxCoO2 for improved cyclability in sodium ion batteries. J.
Power Sources 277, 9–16 (2015).
39. Gopalakrishnan, J. Chimie Douce Approaches to the Synthesis of Metastable. Chemistry
(Easton). (1995).

118
4. STRUCTURAL CHARACTERIZATION OF P2-SODIUM NICKEL
TITANATE USING EXPERIMENTAL AND COMPUTATIONAL
METHODS
4.1 Introduction
4.1.1 Computational methods
Computer simulations based on static lattice, molecular dynamics and ab-initio calculations
provide compelling insights on material characteristics such as defect energetics, order/disorder
phenomenon, ionic conduction pathways, migration activation energies, etc.1–7
These methods
often provide information that are not readily accessible by conventional experiments and hence
have become a vital part of battery materials research. Other modeling methods based on
constitutive equations (transport modeling) operate at a much larger length-scale and are very
useful for predicting macroscopic physicochemical properties required for optimizing cell design
and configurations in commercial devices.8–11
This chapter deals with utilizing static calculations
for structural studies of inorganic materials as our research goal was to understand material
properties at an atomic length-scale.
Classical static lattice calculations, also referred as atomistic simulations, employed in this
study are excellent for studying a large ensemble of atoms as they are computationally inexpensive.
This feature facilitates the exploration of a broad energy landscape for non-stoichiometric,
disordered materials that possess a wide gamut of possible configurations due to the typically high
vacancy concentration. Parallel optimization of multitudes of structural configurations can be
readily performed with high-throughput atomistic simulations which would otherwise be
impractical with first-principles calculations and molecular dynamics study. With this
methodology, the most energetically favorable structural configurations in a given energy

119
landscape can be shortlisted for further investigation with molecular dynamics or ab-initio studies
that demand more computational resources. We extend the applicability of these classical
simulation approaches to titanate-based material chemistries for Na-ion batteries.
4.1.2 Literature
The energetics of sodium/vacancy ordering at different sodium contents (x) in P2-NaxNbS2
have been studied using Density Functional Theory (DFT) calculations and atomistic
simulations.12
The formation of transition metal ordered superlattice has been suggested for
NaxNix/2Mn1-x/2O2.13
Atomistic simulations predicted a low activation energy of 0.32 eV for
sodium hopping in NaFePO4 along [010] direction.5 A 1-D curved trajectory between sodium sites
was proposed to facilitate fast sodium ion conduction in this polyanionic material. At low sodium
contents, first principles calculations predicted the O2 phase to be energetically more favorable
than P2 phase (25 meV lower) in P2-Nax[Ni1/3Mn2/3]O2 and validated experimentally.14
It was also
shown that the P2 phase has lower activation energy for sodium transport than the O2 phase and
hence promotes faster sodium ion diffusion.
4.1.3 Scope of current work
Titanium based layered quaternary oxides (Nax[M1-yTiy]O2) have been demonstrated to have
attractive sodium intercalation/de-intercalation with good capacity retention, high cathodic redox
potential (E=3.7 V vs. Na/Na+ for Ni2+4+ species) and low anodic redox potential (E=0.7 V vs.
Na/Na+ for Ti4+/3+ species).15–20
In this study, the average and local structural properties and the
energetics of atomic distribution in P2-Na2/3[Ni1/3Ti2/3]O2 (P2-NT) are investigated using
interatomic potential based atomistic simulations and neutron diffraction experiments.

120
4.2 Experimental
4.2.1 Neutron diffraction experiments
For the neutron diffraction study, P2-NT phase powders were prepared solid state reaction by firing
SPEX-milled Na2CO3, NiO and TiO2 precursor powders at 900 oC and 1000 oC, as described in
chapter 3. Sodium volatility losses at the high temperature firing conditions were compensated by
adding 10% excess sodium. After synthesis, the titanate powders were immediately transferred to
glove box kept at inert argon atmosphere to limit potential air exposure effects. The powders were
sealed in vanadium cans to minimize air exposure during storage and shipping to neutron
diffraction facility. The neutron diffraction experiments were performed in beamline 11A of
POWGEN diffractometer facility at Spallation Neutron Source (SNS) of Oak Ridge National Lab
(ORNL). Rietveld refinement was performed using EXPGUI-GSAS software.21,22
4.2.2 Energy calculations for many-body systems: Theory
The internal energy of a many-body ensemble contains contribution from multiple nuclei and
electrons. Static lattice calculations simplify this system by assuming that the electronic
contributions can be effectively included within individual atoms by suitable force-field models.
Hence, these calculations are more approachable at the expense of inaccuracies for systems with
strongly correlated electronic interactions. For ‘N’ atoms, the total energy can be partitioned into
a series expansion as Equation 4.1.
𝑈𝑛𝑒𝑡 = ∑ 𝑈𝑖 +1
2∑ ∑ 𝑈𝑖𝑗
𝑛
𝑗
+1
6∑ ∑ ∑ 𝑈𝑖𝑗𝑘 + ⋯
𝑛
𝑘
𝑛
𝑗
𝑛
𝑖
𝑛
𝑖
𝑛
𝑖
4.1
where the first term represents the one-body interactions due to externally imposed fields, the
second term represents two-body interactions depending on governing equations (short-range and

121
long-range) that typically includes species charge and separation distance, and the third term
includes three-body interactions. The higher order terms are typically truncated as they become
negligible.
In this work, this series is truncated to include only up to the 2nd order interactions as typical
for transition metal oxides. Also, this study does not invoke electric field effects as we are
interested in equilibrium material properties and hence the first self-interaction term is also
neglected. However, it should be noted that in real devices, these materials do operate under
dynamic conditions with electric field gradients.
4.2.3 Long-range and short-range interactions
The two-body interactions are classified into long-range and short-range. The long-range
interactions were expressed by Coulombic law to define forces between the point charges as given
by Equation 4.2.
𝑈𝑖𝑗𝐶𝑜𝑢𝑙𝑜𝑚𝑏𝑖𝑐 = 𝑞𝑖𝑞𝑗 4𝜋𝜖𝑟𝑖𝑗⁄ 4.2
where ‘Uij’ is the interaction energy, ‘q’ is the ionic charge, ‘rij’ is the separation of the ions and
‘ε’ is the permittivity of the medium. Ewald summation method is used as the de-facto standard
for calculating the Coulombic energy of the periodic crystal by splitting the energy component
into short-range zone for evaluation in real-space and long-range zone for evaluation in Fourier
space.23
Such calculations based on Madelung potential have been in use in the field
computational chemistry for several decades. The net atomic charges were taken as formal charges
since they were found to provide satisfactory results.

122
Some of the commonly reported short-range, two-body interaction models include the
Harmonic potential, Born potential, Buckingham potential, Lennard-Jones potential, Morse
potential, etc. The parameters for these potential models are generally derived empirically by
fitting the model with lattice parameters, elastic properties, dielectric properties, phonon
dispersion curves and quantum mechanically derived energy hypersurface.24
After a thorough
literature survey of different interatomic potential models and potential parameters for various
oxide materials (with different structural classes including layered, olivine, spinel, perovskite,
etc.), two force-field models based on Buckingham- and Morse-type potentials were found to work
fairly well for the P2-NT phase. These are mathematically expressed in the form of Equation 4.3
and 4.4.
𝑈𝑖𝑗𝐵𝑢𝑐𝑘𝑖𝑛𝑔ℎ𝑎𝑚
= 𝐴𝑒−𝑟𝑖𝑗/𝜌 − 𝐶/𝑟𝑖𝑗6 4.3
𝑈𝑖𝑗𝑀𝑜𝑟𝑠𝑒 = 𝐷𝑒[(1 − 𝑒−𝑎(𝑟−𝑟𝑜))2 − 1] 4.4
where ‘A’ refers to Buckingham pre-exponent repulsive parameter, ‘ρ’ refers to Buckingham
well depth parameter, ‘C’ refers to Buckingham attractive parameter, ‘De’ is Morse bond
dissociation parameter, ‘a’ is Morse force-constant parameter and ‘ro’ is Morse equilibrium bond
length parameter. The Buckingham model includes an attractive term to describe bonding effects
that hold atoms together in a molecule and repulsive term to describe electron cloud repulsion
effect that occur when the separation distances reach subatomic values. Morse model is an
anharmonic extension of the symmetric harmonic bond model and is frequently used for covalently
bonded materials with high vibrational energies accounted for by the exponential term. The
interatomic potential parameters for the two models are listed in Table 4.1and Table 4.2.

123
For the Buckingham potential, the model parameters for Ti-O interactions were based on a
defect study of anatase phase.3 Dipole polarizations are incorporated using the standard Dick-
Overhauser approach employing a core-shell model to represent the coupling between valence
electrons and core shell electrons. Typically, the core is positively charged and shell is negatively
charged and they are linked by a harmonic spring with predefined stiffness (spring constant- kcs).25
The core and shell start out at the same positions for all the atoms and they are allowed to re-
organize to different co-ordinates (within an allowable limit) to account for polarizability effects.
This core-shell concept also takes care of covalent contributions as the valence electrons become
more shared in covalent bonds. Titanium-oxygen bonds have a non-negligible covalent character
(~30%) and hence both these atomic species are treated with a core-shell approach.26
The
remaining atoms, nickel and sodium, are considered as non-polarizable (highly ionic).
The Morse potential parameters were obtained from a previous study that works for a wide
range of oxide and silicate material.27
Lennard-Jones (LJ) repulsive interaction is also included in
the Morse potential to avoid prevent atoms from reaching unreasonably short atomic separations.
Additional shells are not utilized for Morse potential as they already account for covalent bond
character. These short-range interaction potentials were defined to apply within a spherical zone
with a cut-off radius of 12 Å for any given atomic pair while the long-range forces act for the
whole studied zone. The variation of the interaction energy as a function of atomic separation is
shown in Figure 4.1. It is apparent that these short range interatomic potentials provide an energy
penalty at extremely short interatomic distances.

124
Table 4.1 Interatomic potential parameters: Buckingham Core-shell model; all atomic species are
taken at formal charges, Formal charge=Ycore+ Yshell
Interactions A (eV) ρ (Å) C (eV Å6)
Na-O 1663.28 0.2900 0
Ni-O 932.61 0.3170 0
Ti-O 5111.70 0.2625 0
O-O 12420.50 0.2215 29.07
Core-Shell parameters
Species k (eV Å -2) Y (e)
Ti 314 -0.1
O 31 -2.8
Table 4.2 Interatomic potential parameters: Morse+ LJ model
Morse Potential
Interactions Dij (eV) aij (Å -2) ro (Å)
Na-O 0.0234 1.76 3.01
Ni-O 0.0294 2.68 2.50
Ti-O 0.0242 2.25 2.71
O-O 0.0424 1.38 3.62
Lennard-Jones Potential (12-6)
Interactions A B C
Na-O 5 0 0
Ni-O 22 0 0
Ti-O 1 0 0
O-O 3 0 0

125
Figure 4.1 Variation of interaction energy for Buckingham and Morse interatomic potentials for
Na-O two-body interactions.
4.2.4 Handling partial occupancy: Mean field model and Supercells
The studied oxide material has structural disorder in the transition metal and sodium sites; nickel
and titanium occupy identical ‘2a’ Wyckoff site position while sodium atoms partially occupy ‘2b’
and ‘2c’ Wyckoff site position. Mean field model is invoked to apply partial occupancy for any
given crystallographic site to accommodate this structural disorder. The relative atomic
interactions (short-range and long-range) are scaled based on the partial occupancy values for all
atomic species. Traditionally, this approximation works fairly well for predicting macroscopic
properties as the averaged crystallographic structure tends to be a reasonable representative. We
utilize this methodology to predict the structural properties of the oxide material, at the scale of a
unit cell, to validate the interatomic potential models. However, local structural effects cannot be
0.0 0.3 0.6 0.9
0
500
1000
1500
Short-range Interaction
Inte
raction E
nerg
y
Atomic Separation
Buckingham
Morse
Na-O two body
interaction shown

126
predicted due to the averaging effect and this can become an influential factor in fast ionic
conductors.
3x2x1 supercell structures containing stoichiometric number of atoms were investigated for the
local structural study. These studies are not limited by mean field approximation as the supercell
structures do not contain partial occupancies and thereby allows for extracting potential local
structural details that would otherwise be inaccessible by conventional simulation methods.
However, a proper statistically relevant study requires investigating a large number of possible
structural configurations. A total of 2000 randomized structures were sampled to yield statistically
relevant results. Parallel structural optimization runs were performed using General Utility Lattice
Program (GULP) code with random structures (.gin format) generated by a MATLAB script.28,29
Specific details of atomic distribution in the random structural assignment and their results will be
discussed further.
4.2.5 Energy minimization: Optimization schemes and strategy
GULP code is employed to find the energy minimum of the complex energy hypersurface in
disordered materials. Taylor series expansion is applied to the internal energy and the first and
second derivatives, also referred to as gradient vector (g) and Hessian matrix (H), respectively, are
computed. Non-linear multivariate optimization is performed using Broyden-Fletcher-Goldfarb-
Shanno (BFGS) scheme which includes the conjugate gradient method for faster descent to the
energy minimum. The BFGS scheme is essentially a modified Newton-Raphson method that is
suitable for solving large systems. During each optimization step, atoms are subject to a small
displacement from their initial positions and energy values are computed. Subsequent direction of

127
descent and step size are decided to reach the energy minimum. Successive iterations ensures that
the final optimized structure reaches the stationary point in the energy hypersurface.
However, certain initial structures might be too far from the energy minimum or get stuck in
local potential wells. These factors can likely prevent proper convergence using the BFGS
optimization schemes. To mitigate this effect, a large number of configurations are sampled so that
at least a modest number of initial structures start out at favorable locations to reach energy
minimum.
During the energy minimization, all atomic cores and their corresponding shells are relaxed
simultaneously to reach the energy minimum in a 1-step method. A 2-step method with only shell
relaxation in the 1st step followed by relaxation of all cores and shells in the 2nd step was also
performed. The premise was that this permits pre-allotment of the polarization effects before the
energy minimization step. However, the results from the 2-step method were found to be
comparable to the 1-step method at the cost of additional computational time and were not
considered further.
4.2.6 Space group transformations
For the disordered simulation study, the unit cell is transformed from 194 space group (P63/mmc)
to 63 subgroup (Cmcm) using PowderCell2.4 software.30
The transformed structure is referred to
as ‘pseudocubic’ and is depicted in Figure 4.2.

128
Figure 4.2 Unit cell transformation from space group 194 to 63.
This transformation allows for independent definition of the lattice parameters and consequently
easier scaling of the supercells helps reduce computational time. Energy minimization were done
on 3x2x1 pseudocubic supercells. (a’=8.9 Å, b’=10.3 Å, and c=11.1 Å)
In-plane ordered structures were generated by transformation from 194 space group to 193
subgroup. Due to the splitting of the transition metal sites, the transformed structure has a distinct
in-plane ordering pattern as shown in Figure 4.3. The ordered hexagonal structure is further
converted to a pseudocubic structure (space group 63) as before. The single crystallographic site
(‘2a’) for transition metal atoms in 194 space group gets split into two distinct Wyckoff positions:
‘4a’ and ‘8e’ in the pseudocubic unit cell. No randomization is required for the transition metal
atoms as they have determined site positions. Disorder in introduced in the two sodium metal sites:
‘4c’, and ‘8g’ by randomizing sodium distribution. Simulation study involves 1x3x1 ordered
supercells (lattice parameters: a’=8.9 Å, b’=15.4 Å, and c=11.1 Å).

129
Figure 4.3 Space group transformation to generate in-plane ordered structure.
Through-plane ordering of the transition metal atoms was performed by the transforming the
unit cell axis as [(𝑎 𝑏 𝑐) → (𝑎 𝑏 3𝑐)] without changing the space group (194) as shown in Figure
4.4. This results in a periodic ordering pattern with two layers of titanium alternating between two
layers of nickel atoms. This ordered structure is further transformed to pseudocubic structure, as
well. Energy optimization runs were carried out with 3x2x1 ordered supercells (a’=8.9 Å, b’=10.3
Å, and c’=33.4 Å).

130
Figure 4.4 Space group transformation to generate through-plane ordered structure.
4.2.7 Simulation data interpretation and Pair Distribution Function (PDF) calculation
Data analysis includes generating nuclear probability density maps (.grd format) using the
optimized structures using a MATLAB script. The nuclear probability density maps and isosurface
levels were visualized using VESTA 3.1.831
and Crystalmaker software.32
The pixel resolution
was set at 0.1 Å for experimental and simulated density maps.
Experimental Pair Distribution Function (PDF) was obtained for the refined structure using
PDFGUI software.22,33–35
Simulated PDF patterns were calculated in GULP while incorporating
phonon contributions that are not explicitly stated in the static calculations. The maximum cutoff
radius was set at 20 Å, bin size at 1000 and ‘shrink’ value at 3.

131
4.3 Results and Discussion
4.3.1 Rietveld refinement: Neutron Diffraction
Rietveld refinement is performed with the high resolution Neutron Diffraction (ND) datasets to
obtain the average structural information. Isotropic model (displacement parameters) was utilized
for nickel and titanium atoms while the remaining atoms were left anisotropic during the
refinement routine. A complete anisotropic model did not yield physically realistic displacement
parameters for the transition metals. By setting the space group to 194, the structural model was
able to simulate the experimental Bragg peak positions fairly accurately as seen in the difference
plots in Figure 4.5 and Figure 4.6. The accuracy of the structure model and refined structural
parameters is confirmed by relatively low goodness-of-fit parameter values (Rwp and RF) as shown
in Table 4.3 through Table 4.6. However, there are few extra features (bump at d-spacing of 4.2)
that could not be predicted by the current structural model. These bumps could not be indexed by
any impurity phase reflection with Na-Ni-Ti-O stoichiometry. We suspect that these small bumps
might be due to weak local ordering of the sodium and/or transition metal atoms.
The estimated lattice parameters are consistent with the previous X-ray diffraction studies.36
Irrespective of powder synthesis temperature (900 oC and 1000 oC), the sodium site occupancy
increases for the ‘2b’ sites (Naf) at 300K compared to 15 K. The ‘2b’ sites at the atomic co-
ordinates (0, 0, 1/4) are positioned directly in-line with the transition metal ‘2a’ sites at the location
(0, 0, 0). This in-line arrangement contributes to a repulsive interaction and hence sodium prefers
‘2c’ positions than ‘2b’ positions. Higher thermal contribution at ambient conditions (300 K)
offsets the energy penalty to some extent and consequently increasing the ‘2b’ site occupancy. At
low temperatures (15K), these energetically unfavorable ‘2b’ sites remain relatively inaccessible.

132
(a) (b)
(c) (d)
Figure 4.5 Rietveld refinement of P2-NT powders prepared at 900 oC and characterized at (a)
15K, bank 1, (b) 15K, bank 4, (c) 300K, bank 1, and (d) 300K, bank 4; red point indicates
experimental data, green curve indicates simulated structure, and pink curve indicates difference
curve; bank 1, bank 2 includes diffraction data in the d-spacing range of 0-2.2 Å, and 1.1-8 Å,
respectively.

133
(a) (b)
(c) (d)
Figure 4.6 Rietveld refinement of P2-NT powders prepared at 1000 oC and characterized at (a)
15K, bank 1, (b) 15K, bank 4, (c) 300K, bank 1, and (d) 300K, bank 4.
Table 4.3 Structural information of P2-NT powders: Prepared at 900 oC and tested at 15K.
Element
(Site) x y z Occupancy U11 U22 U33 U12
Naf (2b) 0.0 0.0 0.25 0.1699 0.0094 0.0094 0.0022 0.0047
Nae (2c) 0.3333 0.6667 0.25 0.4968 0.0161 0.0161 0.0063 0.0081
Ni (2a) 0.0 0.0 0.0 0.3333 0.0043 0.0043 0.0043 -
Ti (2a) 0.0 0.0 0.0 0.6667 0.0128 0.0128 0.0128 -
O (4f) 0.6667 0.3333 0.0957 1.0 0.0067 0.0067 0.0058 0.0034
Lattice parameters: a=b=2.9615 Å, c=11.1089 Å, wRp=0.089, R(F2)=0.1650, χ𝑟𝑒𝑑2 = 50.07

134
Table 4.4 Structural information of P2-NT powders: Prepared at 900 oC and tested at 300K
Element
(Site) x y z Occupancy U11 U22 U33 U12
Naf (2b) 0.0 0.0 0.25 0.1751 0.0286 0.0286 0.0022 0.0143
Nae (2c) 0.3333 0.6667 0.25 0.4916 0.0333 0.0333 0.0110 0.0166
Ni (2a) 0.0 0.0 0.0 0.3333 0.0081 0.0081 0.0081 -
Ti (2a) 0.0 0.0 0.0 0.6667 0.0168 0.0168 0.0168 -
O (4f) 0.6667 0.3333 0.0952 1.0 0.0089 0.0089 0.0085 0.0044
Lattice parameters: a= b=2.9667 Å, c=11.1592 Å, wRp=0.090, R(F2)=0.1580, χ𝑟𝑒𝑑2 = 49.41
Table 4.5 Structural information of P2-NT powders: Prepared at 1000 oC and tested at 15K
Element
(Site) x y z Occupancy U11 U22 U33 U12
Naf (2b) 0.0 0.0 0.25 0.1623 0.0153 0.0153 0.0014 0.0076
Nae (2c) 0.3333 0.6667 0.25 0.5044 0.0177 0.0177 0.0061 0.0089
Ni (2a) 0.0 0.0 0.0 0.3333 0.0029 0.0029 0.0029 -
Ti (2a) 0.0 0.0 0.0 0.6667 0.0078 0.0078 0.0078 -
O (4f) 0.6667 0.3333 0.0959 1.0 0.0074 0.0074 0.0046 0.0037
Lattice parameters: a= b=2.9604 Å, c=11.0951 Å, wRp=0.1056, R(F2)=0.1630, χ𝑟𝑒𝑑2 = 70.54
Table 4.6 Structural information of P2-NT powders: Prepared at 1000 oC and tested at 300K
Element
(Site) x y z Occupancy U11 U22 U33 U12
Naf (2b) 0.0 0.0 0.25 0.1761 0.0374 0.0374 0.0034 0.0187
Nae (2c) 0.3333 0.6667 0.25 0.4906 0.0328 0.0328 0.0094 0.0164
Ni (2a) 0.0 0.0 0.0 0.3333 0.0040 0.0040 0.0040 -
Ti (2a) 0.0 0.0 0.0 0.6667 0.0069 0.0069 0.0069 -
O (4f) 0.6667 0.3333 0.0953 1.0 0.0097 0.0097 0.0080 0.0049
Lattice parameters: a= b=2.9654 Å, c=11.1470 Å, wRp=0.1096, R(F2)=0.1663, χ𝑟𝑒𝑑2 = 77.38

135
The calculated thermal expansion coefficients are: βa=1.83×10⁻⁵Å/K, βc=17.65×10⁻⁵Å/K for
powders prepared at 900oC and βa=1.75×10⁻⁵Å/K, βc=18.21×10⁻⁵Å/K for powders prepared at
1000oC. These coefficients are fairly positive and a large anisotropy is noticeable, typical of
isostructural layered oxides such as P2-NaxMnO2.37
This anisotropy is attributable to strong in-
plane bonding and relatively weak through-plane bonding in these layer-structured materials.
Figure 4.7 depicts the nuclear density map of the refined structure at 15K calculated using
JANA2006 crystallographic software.38
The Nae density spots appear larger than Naf due to the
higher fractional occupancy as discussed before. Sodium thermal ellipsoids appear considerably
oblate with the minor axis along the ‘ab’ plane in Figure 4.7a. and b. The transition metal density
spots appear as perfect spheres due to the isotropic assumption (Figure 4.7c). In contrast, the
oxygen density spots appear relatively more spherical (Figure 4.7d).
The degree of oblateness is quantified using displacement ratio parameter (𝑟 = √𝑈33 𝑈11⁄ −
1) which quantitatively relates ‘in-plane’ deviation to the ‘out-of-plane’ deviation; ‘plane’ refers
to region parallel to the ‘ab’ axis. At 15 K, Nae and Naf atoms have negative ‘r’ values of -0.37
and -0.52, respectively. These negative ‘r’ values are consistent with the oblate sodium ellipsoids.
O3-NaCrO2 has a more positive ‘r’ value of -0.18 and hence exhibits reduced oblateness.39
The
degree of oblateness correlates inversely to ionic conductivity; atoms with highly spherical
displacement are likely to remain immobile in their lattice sites. The P2 compositions displays
more pronounced ‘in-plane’ deviations and oblateness and hence support faster ion transport than
O3 compositions. The oxygen atoms have a more positive ‘r’ value of -0.07 and are expected to
remain fairly stationary.

136
(a) (b)
(c) (d)
Figure 4.7 3D nuclear density map using Rietveld refined 900 oC, 15K structure (a), {100}
planar density describing sodium (b), transition metal (c) and oxygen atoms (d) with minimum
and maximum saturation levels at 0 and 5 Å-3; atomic species legend is included on the right-
side of 3D density map.
4.3.2 Interatomic potential sets: Selection and validation
The suitability and transferability of interatomic potentials to various binary and ternary oxides
containing Na-Ni-Ti-O is evaluated in this section. The considered materials include structures
with various space groups such as cubic, tetragonal, rhombohedral and monoclinic as shown in

137
Figure 4.8. The validity of the potential sets is evaluated by their ability to accurately replicate the
experimental structural properties (lattice parameters). It should be noted that the bond character
varies significantly from highly ionic in Na2O to more covalent in TiO2 and hence capturing the
properties of these diverse materials with a single potential set is a challenging task. Nevertheless,
various models have been proposed in the literature and several models were reviewed for their
applicability.
Buckingham and Morse potential sets predicted the lattice parameters of binary and ternary
oxides (containing Na-Ni-Ti) such as Na2O (cubic), NiO (cubic), TiO2 (tetragonal), NiTiO3
(rhombohedral), Na2Ti3O7 (monoclinic) and Na8Ti16O32 (monoclinic) with reasonably good
accuracy (εbuck<2.6% and εmors<5.6%, respectively, where ε is the mean error in lattice parameter),
demonstrating the general validity of the studied pairwise atomic interactions and transferability
across various structure polytypes. The experimental and simulated lattice parameters are listed in
Table 4.7-Table 4.10. All structures, except Na2Ti3O7, yielded even lower error values (ε< 3.9%
and ε<4.7%, respectively). Highly ionic structures such as Na2O are well represented by
Buckingham potential (ε=0.56%) than Morse potential (ε=3.27%) as the former predicts strong
ionic interactions better. On the contrary, covalent structures such as rutile are modeled better by
Morse potential (ε=1.0%) than Buckingham potential (ε=3.67%).

138
(a) (b) (c)
(d) (e) (f)
Figure 4.8 Crystal structure of (a) cubic sodium oxide (Na2O) , (b) cubic nickel oxide (NiO), (c)
tetragonal titanium oxide (TiO2), (d) rhombohedral nickel titanium oxide (NiTiO3), (e)
monoclinic sodium titanate-I (Na2Ti3O7), and (f) monoclinic sodium titanate-II (Na2Ti6O13);
yellow, grey, red, and blue spheres represent sodium, nickel, oxygen, and titanium, respectively.
colored polyhedra represent transition metals co-ordinated with oxygen atoms, sodium are left
unbonded for clarity.40-45
Good reproducibility of the lattice parameters were obtained for the studied oxide,
Na2/3[Ni1/3Ti2/3]O2. Morse potential (ε=1.7%) provided better lattice parameter prediction than
Buckingham potential (ε=3.6%) possibly due the large amount of titanium in this quaternary oxide.

139
Table 4.7 Transferability of Buckingham interatomic potential across binary oxides; |ε| is the
modulus percentage error in lattice parameters.
Lattice Na2O NiO TiO2
Cubic Cubic Tetragonal
Exp.
(Å)
Calc.
(Å)
|ε|
(%)
Exp.
(Å)
Calc.
(Å)
|ε|
(%)
Exp.
(Å)
Calc.
(Å)
|ε|
(%)
a 5.500 5.469 0.56 4.178 4.210 0.77 4.594 4.428 3.61
b - - - - - - - - -
c - - - - - - 2.959 3.069 3.72
Table 4.8 Transferability of Buckingham interatomic potential across ternary oxides.
Lattice NiTiO3 Na2Ti3O7 Na2Ti6O13
Rhombohedral Monoclinic Monoclinic
Exp.
(Å)
Calc.
(Å)
|ε|
(%)
Exp.
(Å)
Calc.
(Å)
|ε|
(%)
Exp.
(Å)
Calc.
(Å)
|ε|
(%)
a 5.032 5.011 0.42 9.133 9.073 0.66 15.131 15.566 2.87
b - - - 3.806 3.768 1.00 3.745 3.732 0.35
c 13.792 13.921 0.94 8.566 9.096 6.19 9.159 9.048 1.21
Table 4.9 Transferability of Morse interatomic potential across binary oxides.
Lattice Na2O NiO TiO2
Cubic Cubic Tetragonal
Exp.
(Å)
Calc.
(Å)
|ε|
(%)
Exp.
(Å)
Calc.
(Å)
|ε|
(%)
Exp.
(Å)
Calc.
(Å)
|ε|
(%)
a 5.500 5.320 3.27 4.178 4.188 0.24 4.594 4.572 0.48
b - - - - - - - - -
c - - - - - - 2.959 3.004 1.52
Table 4.10 Transferability of Morse interatomic potential across ternary oxides.
Lattice NiTiO3 Na2Ti3O7 Na2Ti6O13
Rhombohedral Monoclinic Monoclinic
Exp.
(Å)
Calc.
(Å)
|ε|
(%)
Exp.
(Å)
Calc.
(Å)
|ε|
(%)
Exp.
(Å)
Calc.
(Å)
|ε|
(%)
a 5.032 5.074 0.83 9.133 9.616 5.29 15.131 15.551 2.78
b - - - 3.806 3.605 5.28 3.745 3.577 4.49
c 13.792 13.978 1.35 8.566 8.871 3.56 9.159 9.626 5.10

140
4.3.3 Energetics of disordered structures: Atomic distribution effects
The effect of sodium allocation between the alkali layers on the overall energetics were
investigated. Sodium atoms were distributed equally and disproportionately to the individual
sodium layers, while still maintaining the overall composition using a randomization code. The
plentiful vacant sites in the sodium layer offers large number of distribution possibilities. Disorder
is maintained in the transition metal layer as well by a similar approach with equal and
disproportionate allocation between the layers while keeping the net Ti: Ni ratio at 2:1.
By solving these randomized structures, we investigate the energy landscape for equal and
unequal distribution using atomistic simulations with Buckingham and Morse potential models.
Though Morse clearly predicted better than Buckingham potential, we make use of both models
to understand scaling effects (unit cell to supercell) on model robustness. It was found that the
structures with completely random distribution had the highest energy values while those with
equal distribution had the least energy values. Structures with disproportionate distribution of one
atomic species (sodium or transition metal) occupied intermediate energy values. This trend is
consistent with Buckingham and Morse potential sets as shown in Figure 4.9a and b. It is also
observed that fewer structures successfully optimized for completely randomized configurations
as some of the initial structures were too far away from the global/local minimum. The normalized
energy values of all the optimized structures are plotted in the energy distribution curve for
analysis.
The plateaus in the energy distribution curve corresponds to structures with fairly identical
energy levels and similar local structural environment. This provides a method of grouping
structures with comparable energy values. It was found that equal allocation of atoms to all layers

141
results in a curve with single plateau for Buckingham and Morse potentials as shown in Figure 4.9
a and b. These structures exhibit a Gaussian distribution with energy values fairly close to the
mean energy (EBuck=-106.1 eV, EMorse=-40.3 eV) as shown in Figure 4.9c and d. The absence of
multiple plateaus in the energy distribution curve and multiple peaks in the histogram point
demonstrates that the optimized structures possess similar local environment.
Likewise, structures with equal distribution of transition metal atoms have a single plateau in
the energy distribution curve and a single Gaussian peak in probability distribution histogram
(Figure 4.10a and b). On the contrary, the simulation with unequal distribution of transition metals
and random allocation of atoms yielded two plateaus in the energy distribution curve and two
distinct peaks in the histograms (Figure 4.10c and d, and Figure 4.11) due to the splitting of energy
levels in the optimized structures.
It was found that the high energy peak (EBuck=-105.6 eV/mol, EMorse=-40.06 eV/mol)
corresponds to structures with large deviation in the transition metal content per layer from their
true stoichiometry; diffBuck= 2.07, diffMorse=2.02 for Ni species, where ‘diff’= (n-mean)/total, ‘n’
is the atom count per layer, ‘mean’ is the average atom count per layer for equally distributed
structures and ‘total’ equals the total number of optimized structures.

142
(a) (b)
(c). (d)
Figure 4.9 (a) Buckingham potential energy distribution curve, (b) Morse potential energy
distribution curve, (c) probability distribution histogram of randomized structures with equal
atomic distribution between layers using Buckingham potential, and (d) probability distribution
histogram of randomized structures with equal atomic distribution between layers using Morse
potential.
0 500 1000 1500 2000
-106.25
-106.00
-105.75
-105.50
-105.25
-105.00
-104.75
Buckingham
Equal Distribution
'Na' Unequal Distribution
'Ni/Ti' Unequal Distribution
Randomized Distribution
Energ
y (
eV
/mol)
Structure Number
0 500 1000 1500 2000
-40.40
-40.20
-40.00
-39.80
-39.60 Morse
Equal Distribution
'Na' Unequal Distribution
'Ni/Ti' Unequal Distribution
Randomized Distribution
Energ
y (
eV
/mol)
Structure Number
-106.2 -106.0 -105.80.0
0.1
0.2
0.3
0.4
0.5
Buckingham
Ene
rgy D
istr
ibu
tio
n (
eV
-1)
Energy (eV)
-40.4 -40.3 -40.2 -40.10.0
0.1
0.2
0.3
0.4
0.5
0.6
0.7
Morse
Ene
rgy D
istr
ibu
tio
n (
eV
-1)
Energy (eV)

143
(a) (b)
(c) (d)
Figure 4.10 Probability distribution histogram for (a) unequal sodium distribution using
Buckingham potential, (b) unequal sodium distribution using Morse potential, (c) unequal
transition metal distribution using Buckingham potential, and (d) unequal transition metal
distribution using Morse potential.
-106.2 -105.9 -105.60.0
0.1
0.2
0.3
0.4
Buckingham
Ene
rgy D
istr
ibu
tio
n (
eV
-1)
Energy (eV)
-40.4 -40.2 -40.00.0
0.1
0.2
0.3
0.4
0.5
0.6
Morse
Ene
rgy D
istr
ibu
tio
n (
eV
-1)
Energy (eV)
-106.4 -106.0 -105.6 -105.2 -104.80.00
0.05
0.10
0.15
0.20
Buckingham
Ene
rgy D
istr
ibu
tio
n (
eV
-1)
Energy (eV)
-40.4 -40.2 -40.0 -39.80.0
0.1
0.2
0.3
0.4
Morse
Ene
rgy D
istr
ibu
tio
n (
eV
-1)
Energy (eV)

144
(a) (b)
Figure 4.11 Probability distribution histogram for completely randomized structures using (a)
Buckingham potential, and (b) Morse potential.
The structures that contribute towards the low energy peak (EBuck=-105.95 eV/mol, EMorse=-
40.24 eV/mol) have transition metal content close to the stoichiometric value; diffBuck= 0.84,
diffMorse=0.82 for Ni species. The peak splitting is clearly a consequence of unequal allocation of
the transition metals between the layers and deviations from stoichiometry were found to be
energetically unfavorable. On the other hand, sodium distribution study showed that the optimized
structures contained fairly similar energy levels.
4.3.4 Energetics of ordered structures
The in-plane and thorough-plane ordered supercell structures were optimized to understand the
energetics of these ordering schemes and disordered structures. The ordered structures failed to
optimize with Buckingham potential due to unrealistically large core-shell separation distance.
Highly unfavorable initial structures are likely to not optimize as the transition metal do not move
significantly from their lattice positions during the structure optimization. This issue becomes
-106.2 -105.9 -105.6 -105.3 -105.00.0
0.1
0.2
0.3
Buckingham
Ene
rgy D
istr
ibu
tio
n (
eV
-1)
Energy (eV)
-40.4 -40.2 -40.0 -39.80.0
0.1
0.2
0.3
0.4
Morse
Ene
rgy D
istr
ibu
tio
n (
eV
-1)
Energy (eV)

145
exacerbated in the presence of shells as titanium gets placed in the adjacent sites of the ordered
structures. Morse potential yielded optimized structures for in-plane ordering and the energetics
curve shows that the ordered structures consistently have higher energy values than disordered
structures (ΔE=0.21 eV) demonstrating that long range ordering phenomenon is unfavorable for
this composition (Figure 4.12).
Figure 4.12 Energy distribution curve for ordered and disordered structures using Morse
potential.
4.3.5 Simulated average structure
The supercell was sectioned into individual voxels and the probability of atomic distribution in
each voxel was computed from all optimized configurations to generate the simulated nuclear
density maps using MATLAB code. The density maps provide a graphical representation of the
simulated average structures and are compared with the experimental density maps from Rietveld
refinement. Figure 4.13a and b illustrates the 3D simulated nuclear density maps generated using
0 10 20 30 40 50-40.75
-40.50
-40.25
-40.00
-39.75
Ordered
Disordered
Morse
Ene
rgy (
eV
/mo
l)
Structure Number

146
Buckingham and Morse potential sets. These maps show that the sodium density spots get
compressed into oblate spheroidal form factor (minor axis in the ‘ab’ plane). Overall, the sodium
density patterns are consistent with experimental nuclear density maps and the measured negative
sodium displacement ratio. The spheroidal elongation aligns with the relative ease of in-plane
sodium diffusion. 2D Isosurface sections are sliced along the {100} family of planes (Figure 4.13c
and d) for distinguishing the sodium density spots in the two sites. The Naf ellipsoids appear as
low density spots (greenish), compared to Nae ellipsoids (reddish) for both potential sets. This is
consistent with the experimental site occupancy trend from Rietveld analysis and structural
predictions.
The transition metal densities remain fairly spherical (Figure 4.14a and b) for both potential
models, and confirms the validity of the isotropic model used in Rietveld refinement. Isosurface
sections (Figure 4.14c and d) show that Morse potential yields more structures with offset
transition metal atoms than Buckingham potential. Figure 4.15a and b confirms that oxygen
density spots are also spherical. After energy minimization, the oxygen atoms still retain the
AB|BA close-pack stacking sequence (typical of P2 structures), where | refers to sodium sheet, and
do not deviate significantly from their equilibrium atomic positions for the majority of optimized
structures. However, few structures did exhibit an overall displacement of all oxygen atoms while
maintaining the P2 stacking sequence. This oxygen displacement also corresponded with shifts in
transition metal and sodium atomic positions while maintaining the same crystal symmetry
(identical space group). The offset oxygen density spots are evident in the isosurface cut-sections
and occurs fairly readily for structures optimized with Morse potential. Since these offset
structures retain the same overall symmetry and space group, this phenomenon cannot be attributed
to any sort of phase transformations.

147
(a) (b)
(c) (d)
Figure 4.13 Simulated sodium probability density maps in (a) 3D using Buckingham potential
and (b) 3D using Morse potential, (c) 2D along using Buckingham potential, and (d) 2D using
Morse potential; selected 2D cut-sections are parallel to {100} planes; minimum and maximum
saturation levels set at 0 and 5 Å-3.

148
(a) (b)
(c) (d)
Figure 4.14 Simulated probability density maps for (a) sodium atoms in 3D using Buckingham
potential and (b) sodium atoms in 3D using Morse potential, (c) sodium atoms in 2D using
Buckingham potential, (d) sodium atoms in 2D using Morse potential; 2D cut-sections are
parallel to {100} planes; minimum and maximum saturation levels set at 0 and 5 Å-3.
Evaluation of the energy distribution of these offset structures reveals that they have the same
Gaussian distribution peak position as the non-offset structures showing that they have the same
local environment. This also shows that the offset structures do not have a lower energy than non-
offset structures to drive this structural re-organization. However, this phenomenon requiring a
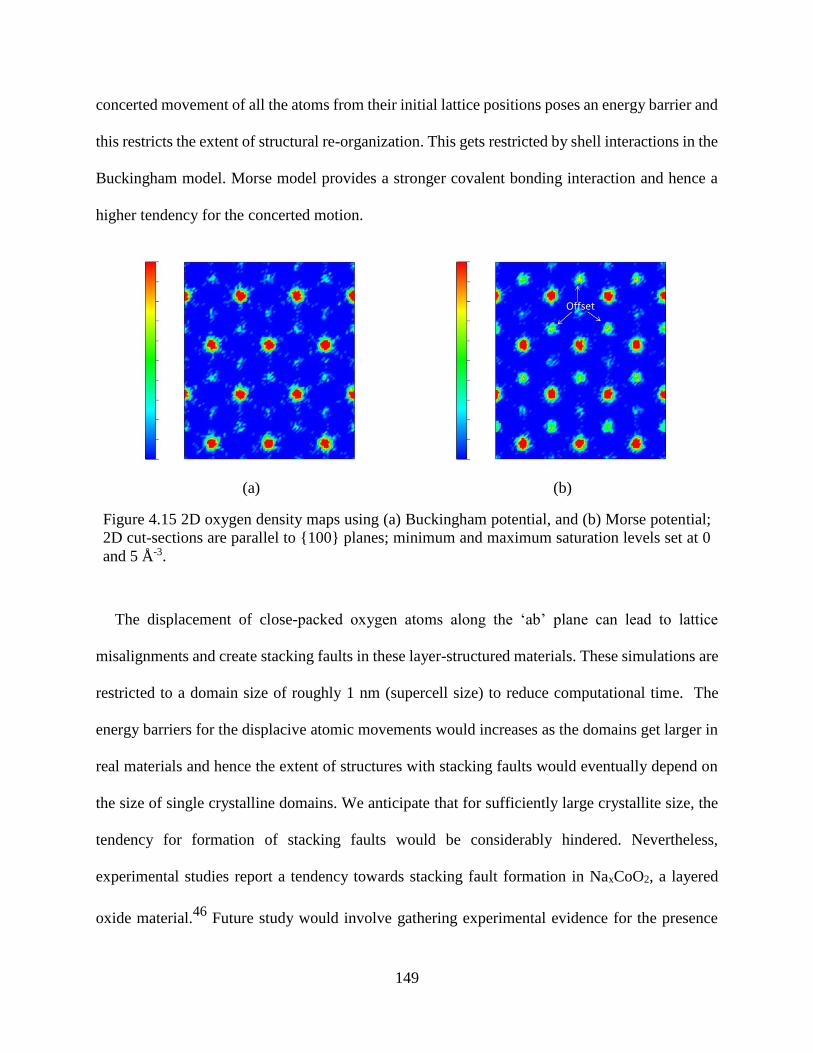
149
concerted movement of all the atoms from their initial lattice positions poses an energy barrier and
this restricts the extent of structural re-organization. This gets restricted by shell interactions in the
Buckingham model. Morse model provides a stronger covalent bonding interaction and hence a
higher tendency for the concerted motion.
(a) (b)
Figure 4.15 2D oxygen density maps using (a) Buckingham potential, and (b) Morse potential;
2D cut-sections are parallel to {100} planes; minimum and maximum saturation levels set at 0
and 5 Å-3.
The displacement of close-packed oxygen atoms along the ‘ab’ plane can lead to lattice
misalignments and create stacking faults in these layer-structured materials. These simulations are
restricted to a domain size of roughly 1 nm (supercell size) to reduce computational time. The
energy barriers for the displacive atomic movements would increases as the domains get larger in
real materials and hence the extent of structures with stacking faults would eventually depend on
the size of single crystalline domains. We anticipate that for sufficiently large crystallite size, the
tendency for formation of stacking faults would be considerably hindered. Nevertheless,
experimental studies report a tendency towards stacking fault formation in NaxCoO2, a layered
oxide material.46
Future study would involve gathering experimental evidence for the presence

150
and extent of stacking fault in the investigated composition and their relevance to charge transport
properties. The domain size can also be altered to match the percentage of stacking faults from the
experiments to further increase the accuracy of the simulations.
4.3.6 Pair distribution function and probability density line-scans
Pair Distribution Function (PDF) analysis is a useful tool in the studying of local structure of
disordered materials. PDF patterns would provide information on the presence and position of
individual atoms in a predefined spherical radius. Given the lack of experimental PDF for the
studied composition, we utilize PDFGUI to generate a pseudo-experimental PDF curve. It should
be noted that the mean field approximation in the Rietveld refinement masks the local details and
hence is referred to as ‘pseudo-experimental’ PDF curve. Nevertheless, it provides a decent
baseline curve for comparison with simulation results.
PDF pattern of a typical mean energy structure (calculated in GULP) is compared with the
Rietveld PDF pattern at 15K (Figure 4.16a and b). The peak positions of calculated patterns using
Buckingham and Morse potentials are fairly comparable to those of the pseudo-experimental PDF
pattern. This shows that the average structural features of the simulated structures are fairly
consistent with the experimental data. The discrepancies in the PDF peak intensities are due to
local structural details that are retained in the simulation experiments. The negative PDF peaks in
the simulations are attributable to the titanium atoms with negative neutron scattering factor.
Future work would involve collecting experimental PDF pattern without the mean field
approximation for further analysis of the models.
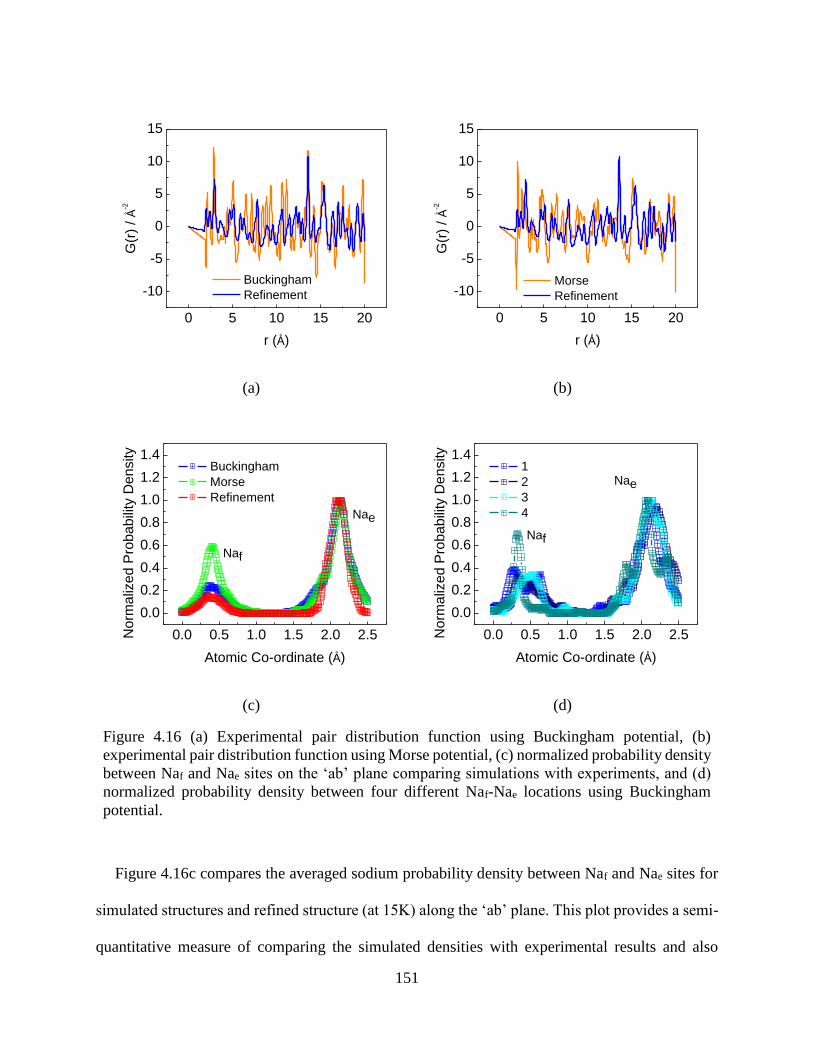
151
(a) (b)
(c) (d)
Figure 4.16 (a) Experimental pair distribution function using Buckingham potential, (b)
experimental pair distribution function using Morse potential, (c) normalized probability density
between Naf and Nae sites on the ‘ab’ plane comparing simulations with experiments, and (d)
normalized probability density between four different Naf-Nae locations using Buckingham
potential.
Figure 4.16c compares the averaged sodium probability density between Naf and Nae sites for
simulated structures and refined structure (at 15K) along the ‘ab’ plane. This plot provides a semi-
quantitative measure of comparing the simulated densities with experimental results and also
0 5 10 15 20
-10
-5
0
5
10
15
Buckingham
Refinement
G(r
) / Å-2
r (Å)
0 5 10 15 20
-10
-5
0
5
10
15
Morse
Refinement
G(r
) / Å-2
r (Å)
0.0 0.5 1.0 1.5 2.0 2.5
0.0
0.2
0.4
0.6
0.8
1.0
1.2
1.4
Nae
Buckingham
Morse
Refinement
Norm
aliz
ed P
robabili
ty D
ensity
Atomic Co-ordinate (Å)
Naf
0.0 0.5 1.0 1.5 2.0 2.5
0.0
0.2
0.4
0.6
0.8
1.0
1.2
1.4
Nae
1
2
3
4
N
orm
aliz
ed
Pro
bab
ility
De
nsity
Atomic Co-ordinate (Å)
Naf

152
relates to the site occupancy ratio. The low temperature experimental data is compared as the
thermal contributions are not explicitly captured in these static simulations. Overall, the Naf peaks
appear smaller than Nae peaks due to their lower site occupancy. The Buckingham potential peak
pattern is fairly consistent with the experiments while the Morse potential overestimates the Naf
site occupancy. We conclude that Buckingham potential provides a better description of the
studied structure. Figure 4.16d. shows that the individual sodium probabilities do change
considerably between different site pairs and is consistent with the fact that sodium atoms hop
fairly readily between these sites.
4.4 Summary and future work
The average structural information of Na2/3[Ni1/3Ti2/3]O2 has been obtained using Rietveld
refinement of neutron diffraction experiments at 15K and 300K. 194 space group (P63/mmc)
structural model was found to adequate describe the Bragg reflections. Anisotropic thermal
expansion co-efficients were calculated (β𝑎900𝐶=1.83×10⁻⁵Å/K, β𝑐
900𝐶=17.65×10⁻⁵Å/K). While the
Naf site occupancy remained low (occ.=0.1699) at 15K due to repulsive transition metal
interactions, they became more favorable (occ.=0.1751) at 300K due to higher thermal energy.
The P2 ternary oxide displays considerable oblateness in sodium nuclear densities along the ab-
plane as confirmed by the negative r-values (rNae=-0.37,rNaf=-0.52), while oxygen nuclear densities
remain fairly spherical (rO=-0.07). Buckingham and Morse interatomic potentials were found to
accurately predict the lattice parameters for the studied composition and model transferability was
demonstrated for Na-Ni-Ti-O based oxide materials.
Equal distributed structures were found to be favored energetically while unequal distributed
structures had considerably higher energy values. Equally distributed structures displayed a

153
Gaussian probability distribution showing that the most probable structures have mean energy
values. The in-plane and thru-plane ordered structures were also found to be energetically
unfavorable. Since the energy levels of the simulated structures were fairly identical, we predict
that the local environment does not play a prominent role in the overall energetics.
We showed that the simulated density maps mirrored the experimental density maps fairly
accurately for Buckingham and Morse potential models. However, few extra density spots were
observed due to atomic displacement effects. Analysis of the offset structures confirm that they
have the same crystallographic symmetry and hence identical space group as the non-offset
structures. The offset structures were also found to have comparable mean energy value and
Gaussian distribution as the non-offset structures. We anticipate that these structural re-
organizations correlate with the simulation domain size and would result in stacking faults in real
materials due to misalignment of lattice planes. Further experimental work is required to confirm
the presence and extent of stacking fault in P2-NT phase. PDF curves revealed that Buckingham
potential provides a better representation of sodium site occupancy than Morse potential. Future
work would also require acquiring experimental PDF patterns for comparison with model results.
The learnings from the interatomic potentials, probability density maps and energy
minimization technique from the atomistic simulations study can be further applied for more
detailed investigations using Molecular Dynamics (MD) and Ab-initio calculations. This would
also enable incorporation of electronic contributions that could not be explicitly accounted in these
static simulations.

154
BIBLIOGRAPHY

155
BIBLIOGRAPHY
1. Islam, M. S. Ionic transport in ABO3 perovskite oxides: a computer modelling tour. J.
Mater. Chem. 10, 1027–1038 (2000).
2. Islam, M. S., Driscoll, D. J., Fisher, C. A. J. & Slater, P. R. Atomic-Scale Investigation of
Defects, Dopants, and Lithium Transport in the LiFePO4 Olivine-Type Battery Material.
Chem. Mater. 17, 5085–5092 (2005).
3. Olson, C. L. & Nelson, J. Defect Chemistry, Surface Structures, and Lithium Insertion in
Anatase TiO 2. J. Phys. Chem. B 110, 9995–10001 (2006).
4. Lee, S. & Park, S. S. Atomistic Simulation Study of Mixed-Metal Oxide (
LiNi1/3Co1/3Mn1/3O2) Cathode Material for Lithium Ion Battery. J. Phys. Chem. 116,
6484–6489 (2012).
5. Tripathi, R., Wood, S. M., Islam, M. S. & Nazar, L. F. Na-ion mobility in layered
Na2FePO4F and olivine Na[Fe,Mn]PO4. Energy Environ. Sci. 6, 2257–2264 (2013).
6. Islam, M. S. & Fisher, C. A. J. Lithium and sodium battery cathode materials: computational
insights into voltage, diffusion and nanostructural properties. Chem. Soc. Rev. 43, 185–204
(2014).
7. Wang, Y., Huq, A. & Lai, W. Insight into lithium distribution in lithium-stuffed garnet
oxides through neutron diffraction and atomistic simulation: Li7-xLa3Zr2-xTaxO12 (x=0–
2) series. Solid State Ionics 255, 39–49 (2014).
8. Pals, C. R. & Newman, J. Thermal Modeling of the Lithium/Polymer Battery. J.
Electrochem. Soc. 142, 3274–3281 (1995).
9. Doyle, M. & Newman, J. The use of mathematical modeling in the design of
lithium/polymer battery systems. Electrochem. Acta 40, 2191–2196 (1995).
10. Newman, J., Thomas, K. E., Hafezi, H. & Wheeler, D. R. Modeling of lithium-ion batteries.
J. Power Sources 119-121, 838–843 (2003).
11. Gomadam, P. M., Weidner, J. W., Dougal, R. a. & White, R. E. Mathematical modeling of
lithium-ion and nickel battery systems. J. Power Sources 110, 267–284 (2002).
12. Liao, Y. et al. Sodium Intercalation Behavior of Layered Nax NbS2 (0≤x≤1). Chem. Mater.
25, 1699–1705 (2013).
13. Cabana, J. et al. Study of the transition metal ordering in layered NaxNix/2Mn1-x/2O2 (2/3
≤ x ≤ 1) and consequences of Na/Li exchange. Inorg. Chem. 52, 8540–8550 (2013).

156
14. Lee, D. H., Xu, J. & Meng, Y. S. An advanced cathode for Na-ion batteries with high rate
and excellent structural stability. Phys. Chem. Chem. Phys. 15, 3304–12 (2013).
15. Fielden, R. & Obrovac, M. N. Low Voltage Sodium Intercalation in NaxNix/2Ti1-x/2O2
(0.5 <= x <= 1.0). J. Electrochem. Soc. 161, A1158–A1163 (2014).
16. Shanmugam, R. & Wei, L. Na2/3Ni1/3Ti2/3O2: “Bi-Functional” Electrode Materials for
Na-Ion Batteries. ECS Electrochem. Lett. 3, A23–A25 (2014).
17. Shanmugam, R. & Lai, W. Study of Transport Properties and Interfacial Kinetics of
Na2/3[Ni1/3MnxTi2/3-x]O2 (x = 0,1/3) as Electrodes for Na-Ion Batteries. J. Electrochem.
Soc. 162, A8–A14 (2014).
18. Yoshida, H. et al. P2-type Na(2/3)Ni(1/3)Mn(2/3-x)Ti(x)O2 as a new positive electrode for
higher energy Na-ion batteries. Chem. Commun. 50, 3677–3680 (2014).
19. Guo, S. et al. High-performance symmetric sodium-ion batteries using a new, bipolar O3-
type material, Na0.8Ni0.4Ti0.6O2. Energy Environ. Sci. 1–8 (2015).
doi:10.1039/C4EE03361B
20. Guo, H. et al. Na-deficient O3-type cathode material Na0.8[Ni0.3Co0.2Ti0.5]O2 for room-
temperature sodium-ion batteries. Electrochim. Acta 158, 258–263 (2015).
21. Larson, A. C. & Dreele, Von., R. General Structure Analysis System (GSAS), Los Alamos
National Laboratory LAUR 86-748. (2004).
22. Toby, B. H. EXPGUI, A Graphical user interface for GSAS. J. Appl. Crystallogr. 34, 210–
213 (2001).
23. Ewald, P. P. Die berechnung optischer und elektrostatisher gitterpotentiale. Ann. Phys. 64,
253–287 (1921).
24. Catlow, C. R. A. et al. Interatomic potentials for oxides. Philos. Mag. A 58, 123–141 (1988).
25. Dick, B. G. & Overhauser, A. W. Theory of the Dielectric Constants of Alkali Halide
Crystals. Phys. Rev. 122, 90–103 (1958).
26. Rønnau, A. A Closer Look at the TiO 2 (110 ) Surface with STM PhD thesis. 2, 17 (2003).
27. Pedone, A. et al. A New Self-Consistent Empirical Interatomic Potential Model for Oxides,
Silicates, and Silica-Based Glasses. J. Phys. Chem. B 110, 11780–11795 (2006).
28. Gale, J. D. & Rohl, A. L. The General Utility Lattice Program (GULP). Mol. Simul. 29,
291–341 (2003).

157
29. MATLAB and Statistics Toolbox Release 2012b, The MathWorks, Inc., Natick,
Massachusetts, United States.
30. Kraus, S, W. & Nolze, G. a program for the representation and manipulation of crystal
structures and calculation of the resulting X-ray powder patterns. J. Appl. Cryst. 29, 301–
303 (1996).
31. Momma, K. & Izumi, F. VESTA 3 for three-dimensional visualization of crystal, volumetric
and morphology data. J. Appl. Crystallogr. 44, 1272–1276 (2011).
32. CrystalMaker. CrystalMaker. CrystalMaker Softw. Ltd (2013).
33. Proffen, T. & Billinge, S. J. L. PDFFIT, a program for full profile structural refinement of
the atomic pair distribution function. J. Appl. Crystallogr. 32, 572–575 (1999).
34. Cope, E. R. & Dove, M. T. Pair distribution functions calculated from interatomic potential
models using the General Utility Lattice Program. J. Appl. Crystallogr. 40, 589–594 (2007).
35. Juhás, P., Davis, T., Farrow, C. L. & Billinge, S. J. L. PDFgetX3: A rapid and highly
automatable program for processing powder diffraction data into total scattering pair
distribution functions. J. Appl. Crystallogr. 46, 560–566 (2013).
36. Shin, Y. & Yi, M. Preparation and structural properties of layer-type oxides NaxNix/2Ti1-
x/2O2. Solid State Ionics 132, 131–141 (2000).
37. Shimono, T., Tanabe, D., Kobayashi, W. & Moritomo, Y. Structural Response of P2-Type
NaxMnO 2 against Na+Intercalation. J. Phys. Soc. Jpn. 82, 083601 (2013).
38. Petricek, V., Dusek, M. & Palatinus, L. Crystallographic Computing System Jana2006:
General Features. Z. Krist. 229, 345–352 (2014).
39. Tanabe, D., Shimono, T., Kobayashi, W. & Moritomo, Y. Temperature dependence of
anisotropic displacement parameters in O3-type NaMO2 (M = Cr and Fe): Comparison with
isostructural LiCoO 2. Phys. status Solidi RRL 8, 287–290 (2014).
40. Zintl, B. & Baumbauch, H, H, V. Über Natriumoxyd. Zeitschrift für Anorg. und Allg.
Chemie 198, (1931).
41. Sasaki, S., Fujino, K. & Takeuchi, Y. X-ray Determination of Electron-density Distributions
in Oxides: MgO, MnO, CoO, and NiO, and Atomic Scattering Factors of their Constituent
Atoms. Proc. Japan Acad. Ser. B 21, (1979).
42. Burdett, J, K., Timothy, H., Miller, G, J., Richardson Jr, J, W. & Smith, J, V. Structural-
Electronic Relationships in Inorganic Solids : Powder Neutron Diffraction Studies of the
Rutile and Anatase Polymorphs of Titanium Dioxide at 15 and 295 K. J. Am Chem. Soc.
109, 3639–3646 (1987).

158
43. Liferovich, R. P. & Mitchell, R. H. Rhombohedral ilmenite group nickel titanates with Zn,
Mg, and Mn: synthesis and crystal structures. Phys. Chem. Miner. 32, 442–449 (2005).
44. Yakubovich, O, V. & Kireev, V, V. Refinement of the Crystal Structure of Na2Ti3O7.
Crystallogr. Reports 48, 24–28 (2003).
45. England, W. A., Goodenough, J. B. & Wiseman, P. J. Ion-Exchange Reactions of Mixed
Oxides. J. Solid State Chem. 49, 29–299 (1983).
46. Li, Q., Zhang, Y. & Xu, M. Unconventional Magnetic Transition in NaxCoO2 (x>0.7)
Single Crystals. J. Supercond. Nov. Magn. 27, 1235–1238 (2014).

159
5. SYNTHESIS, STRUCTURAL AND ELECTROCHEMICAL
CHARACTERIZATION OF Na0.9[Ni0.45Ti0.55]O2, AN O-TYPE LAYER-
STRUCTURED MATERIAL
5.1 Introduction
5.1.1 O3-type materials
The electrochemical and structural properties of P2-type titanate materials were investigated in the
previous chapters. This chapter delves into characterizing the sodium intercalation/de-intercalation
properties of O3-type titanate composition, Na0.9[Ni0.45Ti0.55]O2. Like P2-type materials, O3-type
materials also possess layered structure with alternating stacking of sodium and transition metal
sheets. O3-type materials have the prototypical α-NaFeO2 structure, identical to the well-studied
and commercialized LiCoO2 chemistry.1 Quaternary O3-type oxides are attractive sodium
intercalation electrode candidates due to High theoretical capacity due to higher sodium content
i. High concentration of divalent transition metals (compared to P2 composition) enhancing
the electron hopping and consequently electrical conductivity
ii. Good ion transport properties facilitated by the 2D sodium slabs
However, the ion conductivity of O3-type are lower than the P2-type materials due to the
sodium octahedral co-ordination and lower vacancy concentration. This has been established using
computational and experimental studies.2 But, solid-state ion transport is often not the rate limiting
step for titanate-based layered materials. The higher divalent transition metal concentration in the
O3 materials promotes the formation of a percolating network and possibly ease limitations due to
charge carrier transport processes.

160
5.1.2 Literature
O3-type materials are known to undergo multiple phase transitions, sodium/vacancy ordering
during various stages of sodium deintercalation and these processes often lead to poor reversibility,
and capacity retention. α-NaFeO2 has an initial reversible capacity of 80 mAh/g but the capacity
drops by 25% in 30 cycles with a relatively low charging voltage of 3.4 V.1 Extending the charging
voltage to 4.0 V worsens the capacity fade to 80% at the end of 10 cycles. This large irreversible
capacity loss has been attributed to the migration of iron to the sodium layers and subsequently
blocking sodium transport. It is interesting to note that this migration issue is energetically
favorable for O3 materials and unfavorable for P2 materials as the former structures retain
octahedral co-ordination for both transition metal and sodium sites.
O3-NaCoO2 and O3-Na[Fe0.5Co0.5]O2 shows a capacity decay of 7% in 30 cycles, and 16% in
50 cycles, respectively.3 O3-Na[Ni1/3Co1/3Fe1/3]O2 has 5% capacity drop in 20 cycles when cycled
till 4.2 V with good electrochemical reversibility. The presence of large amount of cobalt promotes
charge carrier mobility and hence this composition offers excellent high power performance.
Further long-time cycling is required for this composition4 In 50 cycles, the capacity fade in O3-
Na[Ni0.5Mn0.5]O2 was reported to be 60% and it was further improved to 34% by electrolyte
optimization by the addition of Fluorinated Ethylene Carbonate (FEC) additive.5,6
FEC additive
effectively suppresses fade mechanisms by arresting side reactions as indicated by improved
coulombic efficiency. Nevertheless, even with FEC additive, the intrinsic fade mechanism is still
quite substantial. O3-Na[Ni1/3Mn1/3Co1/3]O2 cathodes (NMC) provide excellent capacity retention
with no noticeable fade when cycled between 2-3.75 V for 50 cycles at C/5 rate.7

161
From these literature reports, it becomes apparent that capacity fade is a common issue for many
O3-type cathode materials and addressing this is crucial for further advancement of high-voltage,
high-capacity cathode materials for Na-ion batteries. In addition to the aforementioned materials,
several quaternary compositions were reported in light of growing interest in Na-ion battery
chemistry.8–11
5.1.3 Research Strategy
The focus of this research work is to investigate the influence of titanium on the electrochemical
properties and phase transitions in Na0.9[Ni0.45Ti0.55]O2 composition using electroanalytical
techniques such as impedance testing and step-potential technique, and ex-situ XRD testing. We
anticipate that the presence of tetravalent titanium atoms provides a stabilizing influence in the
transition metal layer due to the increased covalent bonding character (in Ti-O bonds) resulting in
better cycleability than other O3-type transition metal oxides.
Recently, a titanate-based O3 material, Na[Ni0.5Ti0.5]O2, was reported to have excellent capacity
retention (only 6.8% drop in 100 cycles with 4.0 V charging voltage), high coulombic efficiency
(96%), and good high-rate performance (90.5 mAh/g at 1C). However, this study lacks structural
characterization to identify the presence and onset of phase transitions that are directly correlated
with the reversibility of the sodium intercalation reactions and cycle-life performance. Also, the
powders prepared in this study contained NiO impurity phase (electrochemically inert) that could
be eliminated by optimized synthetic methods to achieve improved reversible capacitites.12

162
5.2 Material synthesis & electrode fabrication
The O3NT oxide powders were prepared by firing the SPEX dry milled precursors at 1000 oC in
a box furnace for 10 hours duration. The XRD pattern confirms that the synthesized powders are
phase-pure (matches with the PDF reference code: 01-070-6690) without any impurity oxide
phases as illustrated in Figure 5.1a. The reproduction of experimental XRD pattern by the
predicted Bragg reflections confirms that this material crystallizes with space group R-3m. The
calculated lattice parameters are: a=2.9983 Å, and c=16.1831 Å. The refined sodium occupancy
value of 0.86 is fairly close to the target composition of 0.9.
The powders were comprised of agglomerates of micron-sized particles as shown by the SEM
inset micrographs. The individual particles appear fairly dense and are micron-sized. The film
electrodes consisted of the oxide particles embedded in a highly conductive network formed by
carbon particles as depicted in the SEM and EDS mapped images (Figure 5.1b and c). The titanium
is uniformly distributed in the individual particles demonstrating the absence of secondary
titanium-rich phase/-depleted phases.
Composite electrode films were fabricated consisting of 80/10/10 weight ratio of active
material, conductive carbon (Timcal C65) and Polyvinylidene fluoride binder. N-Methyl-2-
pyrrolidone (NMP) was used as solvent for casting the film electrodes using the conventional
doctor-blade technique. Aluminum was utilized as the substrate for casting the electrode films.
After casting, the electrode films were dried using IR lamp overnight to remove the NMP with the
same protocol as discussed in previous chapters. After overnight drying, the film electrodes were
punched into 0.5” discs and transferred to glove box (<0.1 ppm H2O and O2) for storage before
subsequent electrochemical testing.
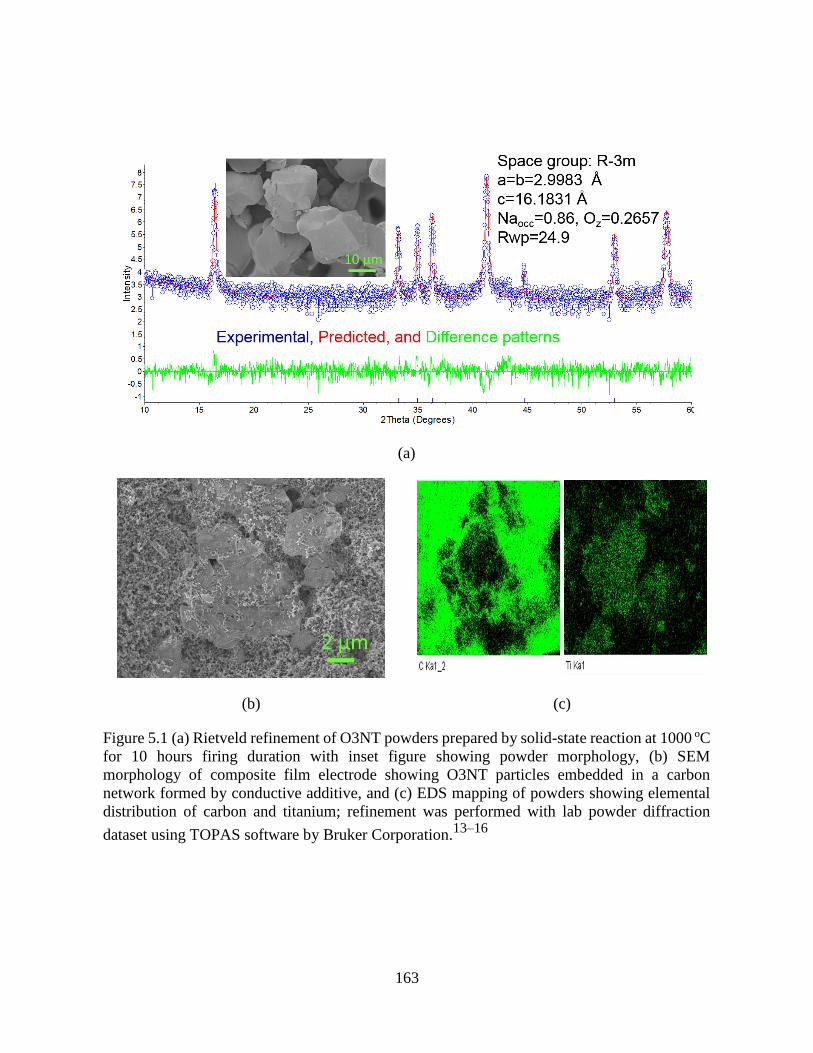
163
(a)
(b) (c)
Figure 5.1 (a) Rietveld refinement of O3NT powders prepared by solid-state reaction at 1000 oC
for 10 hours firing duration with inset figure showing powder morphology, (b) SEM
morphology of composite film electrode showing O3NT particles embedded in a carbon
network formed by conductive additive, and (c) EDS mapping of powders showing elemental
distribution of carbon and titanium; refinement was performed with lab powder diffraction
dataset using TOPAS software by Bruker Corporation.13–16

164
5.3 Electrochemistry
5.3.1 Voltage-composition curves: Galvanostatic Testing
O3NT has a high theoretical capacity of 229 mAh/g for complete removal of 0.9 moles of sodium
per mole of the active material. Ideally, the sodium de-intercalation/intercalation reactions would
follow a solid solution mechanism over a broad range of sodium content (0 ≤ 𝑥 ≤ 0.9) with the
activation of Ni2+/4+ redox couple as depicted in Equation 5.1.
𝑁𝑎0.9[𝑁𝑖0.45𝐼𝐼 𝑇𝑖0.55]𝑂2 ↔ 𝑁𝑎0.9−𝑥[𝑁𝑖0.90−𝑥
2⁄𝐼𝐼 𝑁𝑖𝑥
2⁄𝐼𝑉 𝑇𝑖0.55]𝑂2 + 𝑥𝑁𝑎+ + 𝑥𝑒− 5.1
(a) (b)
Figure 5.2 Voltage-composition curve of O3-Na0.9[Ni0.45Ti0.55]O2 under galvanostatic
conditions of C/50 rate with (a) 4.2 V cutoff, and (b) 4.5 V cutoff; negative ‘x’ value during the
1st charging cycle is due to side reactions.
The charge/discharge curves of O3NT material tested under galvanostatic conditions of C/50 is
shown in Figure 5.2 using the voltage-composition curves. The electrolyte utilized for this testing
consisted of 0.5 M NaPF6 salt dissolved in Ethylene Carbonate (EC)/Diethyl Carbonate (DEC)
0.0 0.2 0.4 0.6 0.8 1.0
2.0
2.5
3.0
3.5
4.0
4.5
C/50 Rate
Discharge
Charge
1
2
3
4
5
Vo
lta
ge
(V
) vs. N
a/N
a+
Sodium Content ('x')-0.2 0.0 0.2 0.4 0.6 0.8 1.0
2.0
2.5
3.0
3.5
4.0
4.5
1
2
3
4
5
Discharge
Vo
lta
ge
(V
) vs. N
a/N
a+
Sodium Content ('x')
C/50 RateCharge

165
(50/50 vol%). Anodized aluminum and copper rods function as current collectors for working
electrode and metallic sodium, respectively. When the charging voltage is limited to 4.2 V, the 1st
charge and discharge capacities are 222.7 mAh/g, and 99.7 mAh/g, respectively. The poor faradaic
efficiency in the 1st cycle (44.8%) is due to electrolyte side reactions possibly facilitated by the
active material. The 5th cycle charge and discharge capacities are 127.5 mAh/g, and 108. 4 mAh/g,
respectively, with improved faradaic efficiency of 85%. The voltage profiles suggest that sodium
intercalation/de-intercalation reactions can be sustained reversibly in the evaluated voltage
window. Increasing the charging cutoff voltage to 4.5 V yields 1st charge and discharge capacities
of 264 mAh/g, and 112.6 mAh/g, respectively. The first charging capacity is clearly higher than
the theoretical capacity due to additional side reaction contributions. The discharge capacity
improves slightly when the charging voltage is increased to 4.5 V due to the formation of more
vacant sites in the charging step. However, the faradaic efficiency becomes slightly worse (1st
cycle: 42.7%) in the highly oxidative potential regime. The voltage curves have small plateaus at
3.1 and 4.2 V, respectively, and a sloping profile in the remaining regions. The voltage plateaus
and sloping regions are associated with two-phase and solid solution reactions, respectively, and
are discussed further in the ex-situ XRD section.
5.3.2 Phase transitions: Ex-situ XRD
Experimental methods for ex-situ XRD characterization discussed in Chapter 3 were utilized for
O3NT electrodes as well. The film electrodes were tested while exposed to ambient conditions for
the preliminary trials. O3-type materials undergo phase transitions when sodium is extracted from
the pristine composition and the crystal structure of the octahedral starting phase (O3) and
prismatic low-sodium content phase (P3) are depicted in Figure 5.3. Due to the difference in the

166
oxygen stacking sequence, the O3 and P3 phases have different sodium co-ordination
environments.
(a) (b)
Figure 5.3 Crystal structure of (a) O3 phase with octahedral co-ordination of sodium, and (b) P3
phase with prismatic co-ordination of sodium demonstrating the different oxygen stacking
sequence.
The initial O3NT phase with space group R-3m are depicted by ‘x’=0.9 curve in Figure 5.4.
Removal of small amounts of sodium (10%) causes the 16.5o peak intensity, characteristic of
O3NT pristine phase, to drop considerably while a new peak forms at 15.8o. This peak splitting is
associated with phase transformation from the initial O3 phase to P3 phase. This contrasts with
other O3 compositions that have the phase transition sequence of O3 (hexagonal)-O3’
(monoclinic)-P3 (hexagonal).17
At the measured compositions, there is no evidence of the
formation of the low-symmetry O3’ phase. The measured XRD reflections can be matched well
with a two-phase mixture of O3+P3 as shown in Figure 5.5a. It is likely that the O3-O3’ transition
occurs in much smaller composition region of 0.9 > 𝑥 > 0.81. Continued sodium extraction
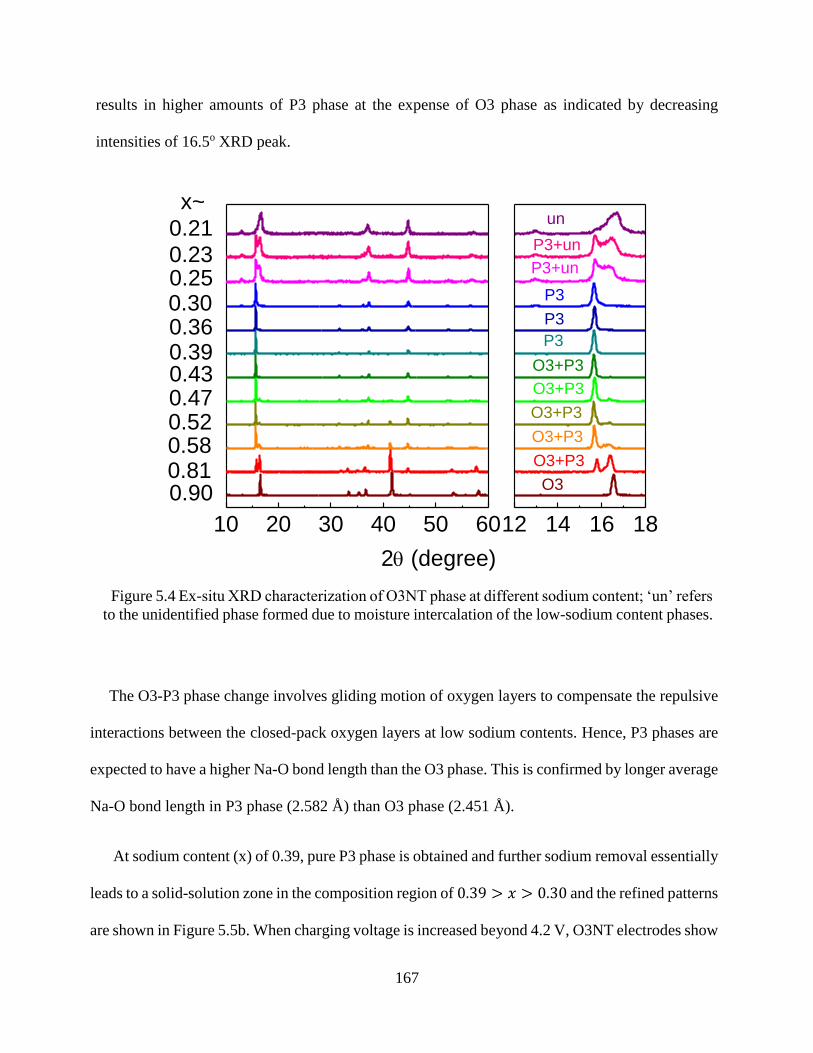
167
results in higher amounts of P3 phase at the expense of O3 phase as indicated by decreasing
intensities of 16.5o XRD peak.
Figure 5.4 Ex-situ XRD characterization of O3NT phase at different sodium content; ‘un’ refers
to the unidentified phase formed due to moisture intercalation of the low-sodium content phases.
The O3-P3 phase change involves gliding motion of oxygen layers to compensate the repulsive
interactions between the closed-pack oxygen layers at low sodium contents. Hence, P3 phases are
expected to have a higher Na-O bond length than the O3 phase. This is confirmed by longer average
Na-O bond length in P3 phase (2.582 Å) than O3 phase (2.451 Å).
At sodium content (x) of 0.39, pure P3 phase is obtained and further sodium removal essentially
leads to a solid-solution zone in the composition region of 0.39 > 𝑥 > 0.30 and the refined patterns
are shown in Figure 5.5b. When charging voltage is increased beyond 4.2 V, O3NT electrodes show
10 20 30 40 50 60
2 (degree)
12 14 16 18
un
P3+un
P3+un
P3
P3
P3
O3+P3
O3+P3
O3+P3
O3+P3
O3+P3
x~
0.23
0.21
0.250.300.360.390.430.470.520.580.81
0.90O3
168
a splitting of the 15.6o peak and the resulting new peak has significant broadening. This peak
splitting is not consistent with any P-related phases that were reported for other O3-materials. We
suspect that this broadening is due to atmospheric interaction of the low sodium content P-phases
(in composition zone of 0.30 > 𝑥 > 0.21) that form at highly oxidative potentials. These phases
can potentially accommodate water in the structure due to the large available spacing in the alkali
slabs. Such water intercalation processes can result in loss of crystallinity due to exfoliation and
this is consistent with the broadening of the XRD patterns. Efforts to mitigate moisture interaction
by transferring the powders in inert atmosphere and limiting the atmospheric exposure to only a
short time window (~10 minutes) with fast-scans were unsuccessful due to the extremely high
moisture sensitivity of these phases. Future work to obtain structural information on the low-sodium
content phases would require designing a hermetic in-situ electrochemical setup with XRD testing
capability.

169
(a)
(b)
Figure 5.5 Rietveld refinement of O3NT electrode (Nax[Ni0,45Ti0.55]O2) prepared by
electrochemical sodium extraction with (a) ‘x’=0.52, and (b) ‘x’=0.39; refinement performed
using TOPAS software from Bruker Corporation, insert figures depict sodium co-ordination
environment and Na-O bond lengths.

170
5.3.3 Equilibrium voltage profiles and solid-state diffusivity estimation: Potentiostatic
Intermittent Titration Technique (PITT)
The PITT curves of O3NT material are depicted in Figure 5.6a and b. Overall, the voltage profile
trends are consistent with the galvanostatic testing and show a smaller overpotential due to the low
limiting current value (C/100). After the 1st cycle, the 4.2 V charge cutoff experiment has a very
low voltage hysteresis between charge and discharge curves. However, the 4.5 charge cutoff
experiment exhibits marked voltage hysteresis due to the insufficient reversibility of the low
sodium content phases. The fairly good overlapping of the voltage profiles for both experiments,
after the initial cycle, suggest that the O3NT material does not undergo deleterious structural
changes due to repeated charge/discharge. The electrochemical stability for longer durations is
further evaluated at faster charging rates in the cycling study.
The measured current transients while imposing the step potential in the PITT study are utilized
for evaluating the solid-state diffusion co-efficient of sodium ions. Typically, an intercalation
material undergoing phase transformation has two distinct current profiles and the rate of
movement of the phase boundary essentially limits the diffusion process.18
However, the
experimental current decays, shown in Figure 5.6c and d, do not match a phase separation material
and is more consistent with an intercalation-type material. This is likely due to rapid movement of
the phase boundary separating the O3 and P3 phases. We calculate the apparent chemical diffusion
co-efficient using the theory discussed in chapter 3 for O3NT phase at various sodium contents.
The fairly linear current regions further validate the applicability of this model.

171
(a) (b)
(c) (d)
Figure 5.6 (a) Voltage profile of O3-Na0.9[Ni0.45Ti0.55]O2 using Potentiostatic Intermittent
Titration Technique (PITT) with C/100 current and 4.2 V voltage limit, (b) Voltage profile using
PITT with C/100 current and 4.5 V voltage limit, (c) current transient linear fitting with 4.2 V
limit, and (d) current transient linear fitting with 4.5 V limit.
0.0 0.2 0.4 0.6 0.8 1.0
2.0
2.5
3.0
3.5
4.0
4.5
1
2
3
4
5
Vo
lta
ge
(V
) vs. N
a/N
a+
Sodium content ('x')
Cycle
Discharge
Charge
0.0 0.2 0.4 0.6 0.8 1.0
2.0
2.5
3.0
3.5
4.0
4.5
Discharge 1
2
3
4
5
Vo
lta
ge
(V
) vs. N
a/N
a+
Sodium content ('x')
Cycle
Charge
0 300 600 900 1200-11.6
-11.4
-11.23.80 V3.75 V
-ln
I
Time (s)
3.70 V
3.95 V3.90 V3.85 V3.80 V3.75 V3.70 V
4.05 V4.00 V
C/100
0 300 600 900 1200 1500-11.6
-11.4
-11.2
4.20 V4.15 V
-ln
I
Time (s)
C/100
4.10 V

172
Figure 5.7 Solid-state diffusion co-efficient of sodium ions in O3NT material using
potentiostatic intermittent titration testing.
The calculated sodium diffusion co-efficients are in the order of 5x10-11 cm2/s, considered
reasonably fast for solid-state transport in intercalation materials as shown in Figure 5.7. The
increase in diffusivity with voltage is consistent with the mechanism of faster ion hopping due to
the creation of extra sodium vacant sites. The solid-solution model does not apply at high voltages
as evidenced by non-linearity in current transient in Figure 5.6d.
5.3.4 Cycling study
5.3.4.1 Capacity retention at different voltage cutoffs
O3NT material was cycled between 2.0-4.0 V at C/10 rate for initial 10 cycles and C/2 rate
subsequently as shown in Figure 5.8a. It is apparent that even with a relatively low voltage cutoff
of 4.0 V, there is some irreversible side reactions in the initial cycles but the faradaic efficiency
improves to 99% in the subsequent cycles at C/2 rate demonstrating excellent reversibility. The
3.6 3.8 4.0 4.22x10
-11
4x10-11
6x10-11
8x10-11
Diffu
sio
n C
o-e
ffic
ient (c
m2/s
)
Voltage (V) vs. Na/Na+

173
discharge capacity values were measured to be 58.7 mAh/g, and 55.2 mAh/g at 25th and 115th
cycle, respectively, corresponding to capacity decay of 6%. For the electrode cycled to 4.2 V, the
faradaic efficiency remains at 54% in the 1st cycle showing that side reactions did not increase
between 4.0 and 4.2 V experiments (Figure 5.8b). This results in a higher reversible capacity of
75.1 mAh/g, and 74.2 mAh/g at 25th and 115th cycle, respectively, with capacity retention of 99%.
Typically, the capacity fade is directly correlated with the amount of extracted sodium ions due to
strain induced failure mechanisms. However, the cycling trends do not match this theory and this
discrepancy is likely due unaccounted random errors. Nevertheless, we show that the titanate-
based O3NT material has excellent capacity retention. At charging voltages beyond 4.2 V, capacity
values are still stable, contrary to other O3-materials, as shown in Figure 5.8c. But the practical
discharge capacities are fairly restricted at these high operating voltages due to resistive
contributions possibly from passivation films. This improved capacity retention is attributed to the
stabilizing influence of titanium in the transition metal layer for this O3NT composition.

174
(a) (b)
(c) (d)
Figure 5.8 Capacity study of O3-Na0.9[Ni0.45Ti0.55]O2 material: (a) 4.0 V charging limit, (b) 4.2
V charging limit, (c) 4.4 V charging limit, and (d) Variation of charging capacity with different
cut-off voltage limit.
The charging capacities are plotted as a function of cut-off voltage in Figure 5.8d. The 1st cycle
charging capacities increase with charging cutoffs, as expected, with the maximum at 4.5 V
charging voltage. However, 10th, 25th and 55th cycle charging capacity curves have a maximum at
4.2 V and the electrodes charged beyond 4.2 V have lower capacity. This suggests that the resistive
0 20 40 60 80 100 1200
30
60
90
120
50
60
70
80
90
100
110
120C/2
Charge
Discharge
Effic
iency (
%)
Ca
pa
city (
mA
h/g
)
Cycle Number
4.0 V Cutoff
C/10
Efficiency
0 20 40 60 80 100 1200
30
60
90
120
150
0
20
40
60
80
100
120
4.2 V Cutoff
C/10 C/2
Charge
Discharge
Effic
ien
cy (
%)
Ca
pa
city (
mA
h/g
)
Cycle Number
Efficiency
0 20 40 60 80 1000
30
60
90
120
150
40
60
80
100
4.4 V Cutoff
C/10 C/2
Charge
Discharge
Effic
iency (
%)
Ca
pa
city (
mA
h/g
)
Cycle Number
Efficiency
4.0 4.2 4.4 4.60
50
100
150
200 1
10
25
55
Ca
pa
city (
mA
h/g
)
Cut-off Voltage (V) vs. Na/Na+
Cycle Number

175
contributions possibly due to passivation films limit the capacity values at the high charging
voltages (>4.2 V). Regardless of the passivation film effects, the presence of titanium in the O3NT
material arrests the capacity fade significantly.
5.3.4.2 Impedance spectra evolution during cycling
The impedance spectra of the O3NT material collected after charging the films to 4.2 V during the
cycling study are depicted in Figure 5.9a. The Nyquist plots have the following features: two over-
lapping arcs in the high frequency region, one arc in the medium frequency region and diffusional
tail in the low frequency region. The Bode plot in Figure 5.9b provides the total impedance over
the complete frequency domain and the arcs correspond to plateaus. The two high-frequency arcs
are attributed to primary and secondary surface film resistance coupled with film capacitance in
parallel RC circuit arrangement. The medium frequency arc is related to interfacial charge transfer
reactions coupled with double layer capacitance. This equivalent circuit fitting approach is similar
to P2NT phase impedance analysis discussed in Chapter 3. The circuit model, depicted in the inset
Figure 5.9c, describes the physicochemical processes. Though Warburg component would
adequately describe the linear tail at the low frequencies, it is not considered for diffusional
analysis as the tail gets overshadowed during electrode cycling.
Repeated electrode cycling does not affect the interfacial kinetics and primary surface film
resistances as shown in Figure 5.9c. This is consistent with the invariant high frequency arc and
high frequency plateau in the Nyquist and Bode plots. However, the secondary surface film
resistance increases gradually during cycling and this trend matches with the growing medium
frequency arc that eventually overshadows the diffusional tail for a cycled electrode (n>80). The
double layer capacitance (Cct), and secondary surface film capacitances (Csf2) are measured in
mF range and the primary surface film capacitance (Csf1) fluctuates in mF-µF range (Figure 5.9d).

176
The latter fluctuation might be related to film instability. The demonstrated excellent capacity
retention of O3NT phase is attributed to relatively minor changes in the physicochemical
parameters that govern the sodium intercalation processes from impedance spectroscopy. The
impedance parameters also show that interfacial charge transfer process is the slow rate-limiting
processes for O3NT phase as it provides the largest resistive contribution. Quaternary
compositions with cobalt, manganese substitutions can further promote the rate of charge carrier
transport and further reduce the interfacial charge transfer resistance.

177
(a) (b)
(c) (d)
Figure 5.9 (a) Nyquist plot of O3NT electrodes charged to 4.2 V during cycling, (b) Bode plots of
O3NT electrodes charged to 4.2 V during cycling, (c) Variation of electrolyte resistance (Re), surface
film resistances (Rsf1 and Rsf2), and charge transfer resistance (Rct) during cycling, and (d) Variation
of double layer capacitance (Cdl) and surface film capacitances (Csf1 and Csf2).
0 100 200 3000
100
200
300
0
20
40
60
80100120
Cycle
num
ber
-Zim
(
)
Zreal ()
10-2
100
102
104
1060
100
200
300
400
500
0
20
4060
80100
Cycle
num
ber
|Z| (
)
Frequency (Hz)
0 20 40 60 80 100 120
0
50
100
150
200
250
300
350
400
Re
Rsf2
CPEsf2
Zw
Rsf1
CPEsf1
Rct
CPEct
Re
sis
tance
(
)
Cycle Number
Re
Rsf1
Rsf2
Rct
0 20 40 60 80 100 1201E-9
1E-8
1E-7
1E-6
1E-5
1E-4
1E-3
0.01
0.1
1
Ca
pa
citan
ce
(F
)
Cycle Number
Csf1
Csf2
Cct

178
5.3.4.3 Sodium metal deactivation: Prolonged cycling
Figure 5.10 represents the variation of the maximum counter electrode potential during each cycle
with cycle number during the cycling study of O3NT electrode with 4.2 V cutoff. The counter
electrode potential is measured with respect to the sodium reference electrode. Under open circuit
conditions, the counter electrode potential would be the same as the reference electrode and the
measured ΔV would read zero. At galvanostatic conditions, the voltage profile shows a small
overpotential caused by kinetic or mass transport limitations at the counter electrode/electrolyte
interface.
Figure 5.10 Variation of peak counter electrode potential with cycle number during galvanostatic
cycling measured against Na/Na+ reference electrode; ideally the measured voltage would be
zero at the counter electrode as it has the same chemical potential as the reference electrode.
Upon repeated cycling, it is evident that the counter electrode peak voltage shifts drastically
from zero towards 3 V. They measured voltage values are fairly close to the standard reduction
potential of copper that is used as the current collector rod. During a discharge run, oxidation
reaction needs to be supported at the counter electrode and this is typically through oxidation of
0 50 100 150 200
0
1
2
3
4
Oxidation
Reduction
Eo=0 V
Na++e-Na
Peak E
CE(V
) vs. N
a/N
a+
Cycle Number
Cu2++2e-Cu
Eo=3.05 V Cu
Na

179
metallic sodium to sodium ions. When the sodium ions gets plated (reduction) during the
subsequent charging run, the deposited sodium tends to be fairly powdery and has poor adhesion
resulting in loss of active sodium metal. Repeated cycling leads to continual depletion of the active
sodium metal surface due to this de-activation process. Further cycling leads to copper rods getting
etched and large overpotential (typically beyond cycle number~120). This effect manifests as a
capacity fade during the cycling studies when in actuality the issue is only due the counter
electrode. The continual deactivation of the counter electrode has limited the cycling runs to ~100
cycles. One proposed method to avoid this is to directly use an intercalation-based anode and avoid
sodium plating completely. However, this requires careful selection of a suitable anode
intercalation material with good electrochemical stability and little irreversible capacity losses.
5.3.5 Rate testing
O3NT material provides discharge capacity values of 74.9 mAh/g, 71.2 mAh/g, 60 mAh/g, 47.8
mAh/g, and 30.4 mAh/g at C/10, C/5, C2, 1C, and 2C, respectively as shown in Figure 5.11a. The
reduced capacities at high currents is linked to increasingly steeper sloping voltage curves (Figure
5.11b) at relatively long charge/discharge timescales. This is consistent with the impedance
measurements that demonstrate interfacial charge transfer limitations at medium and low
frequency regions. Nevertheless, O3NT phase has improved capacity values at higher currents
than P2-NT phase due to the higher Ni/Ti ratio in the latter. The charge carrier transport
(electron/holes) is facilitated primarily through the nickel atoms (Ni2+/3+ states) in the transition
metal layer. Hence, a higher concentration of the nickel atoms results in the formation of a
percolating network promoting facile movement of the charge carrier species.

180
(a) (b)
Figure 5.11 Rate performance testing of O3-Na0.9[Ni0.45Ti0.55]O2 material with 4.2 V cut-off
voltage (a) capacity retention, and (b) voltage profiles.
5.4 Summary and future work
In this chapter, we study the electrochemistry of layered structured materials with octahedral co-
ordination (O3) of sodium as they possess high theoretical capacity. These O3 materials suffer
from capacity fade due to electrochemically driven phase separation and we characterize titanium
based composition (O3NT) to impart structural stability by utilizing the covalent bonding character
of titanium.
Phase-pure O3NT powders were prepared by solid-state reaction and characterized by XRD
and SEM. Galvanostatic testing confirms that this composition supports reversible sodium
intercalation/de-intercalation by activating the Ni2+/4+ redox couple while titanium remains
invariant at 4+ valence state in the transition metal layer. PITT shows that a small voltage
hysteresis between charge/discharge curves when the material is cycled with 4.2 V cutoff
validating the electrochemical reversibility. The hysteresis becomes larger for films charged to 4.5
V due to irreversibility associated with newly formed phases. Ex-situ XRD shows that the O3
0 5 10 15 20 250
30
60
90
120
150
20
40
60
80
100
120
Capacity (
mA
h/g
)
Cycle Number
Charge
Discharge Efficiency
Effic
iency (
%)
2C 1CC/2C/5C/10
0 20 40 60 80
2.0
2.4
2.8
3.2
3.6
4.0
4.4
2C 1C C/2 C/5
Volta
ge (
V)
vs.
Na
/Na+
Capacity (mAh/g)
C/10

181
phase converts to P3 phase for small sodium removal resulting in the formation of a two-phase
region and this region occurs for 0.81 > 𝑥 > 0.39. This phase transformation involves gliding
motion of the closed-pack oxygen layers due counteract the increasing repulsive interactions
between oxygen layers. Pure P3 phase forms at ‘x’=0.39 and a solid-solution domain is reported
for 0.39 > 𝑥 > 0.30. The quality of XRD pattern on powders with even lower sodium content
were insufficient for structural analysis due to moisture interaction effects.
Cycling studies support that operating in the O3-P3 domain provides excellent capacity
retention of 99% at the end of 115 charge/discharge cycles at C/2 rate. This confirms that titanium
does provide a strong stabilizing influence by suppressing the capacity fade. The presence of P3
solid-solution regime over a broad voltage window allows for structural stability without
significant capacity losses. Electrodes charged to high voltage of 4.5 V also have stable albeit
lower capacity values. Impedance spectroscopy confirms that the rate of change of the
physicochemical parameters that govern the sodium intercalation processes is relatively small
supporting the excellent capacity retention characteristics. Rate study confirms that O3NT phase
has improved performance compared to the P2NT phase due to the presence of higher nickel
content in the transition metal layer aiding the charge carrier transport processes.
Structural characterization of the low-sodium content phases is essential to identify the phases
and this requires further in-situ electrochemical-XRD testing. Given that the titanate-based
composition provides stable capacity retention at high voltages (4.5 V) despite the phase
transitions, future work can attempt at coating the oxide particles with an ion-conducting/inert
passivation layer that can inhibit side reactions by limiting the electrolyte contact area. Potential
coating materials include sodium zirconium silicophosphate, sodium yttrium silicate, β-alumina,

182
aluminum oxide, etc.19–23
Alternatively, electrolyte additives such as FEC can also be employed
to reduce the high-voltage side reactions. These approaches can potentially provide higher
reversible capacities by allowing high voltage operation while utilizing the inherent stability effect
provided by the titanate composition.

183
BIBLIOGRAPHY

184
BIBLIOGRAPHY
1. Yabuuchi, N., Yoshida, H. & Komaba, S. Crystal structures and electrode performance of
alpha-NaFeO2 for rechargeable sodium batteries. Electrochemistry 80, 716–719 (2012).
2. Lee, D. H., Xu, J. & Meng, Y. S. An advanced cathode for Na-ion batteries with high rate
and excellent structural stability. Phys. Chem. Chem. Phys. 15, 3304–12 (2013).
3. Yoshida, H., Yabuuchi, N. & Komaba, S. NaFe0.5Co0.5O2 as high energy and power
positive electrode for Na-ion batteries. Electrochem. commun. 34, 60–63 (2013).
4. Vassilaras, P., Toumar, A. J. & Ceder, G. Electrochemical properties of
NaNi1/3Co1/3Fe1/3O2 as a cathode material for Na-ion batteries. Electrochem. commun.
38, 79–81 (2014).
5. Komaba, S. et al. Study on the Reversible Electrode Reaction of Na1-xNi0.5Mn0.5O2 for
a Rechargeable Sodium-Ion Battery. Inorg. Chem. 51, 6211–20 (2012).
6. Komaba, S. et al. Fluorinated Ethylene Carbonate as Electrolyte Additive for Rechargeable
Na Batteries. ACS Appl. Mater. Interfaces 3, 4165–4168 (2011).
7. Sathiya, M., Hemalatha, K., Ramesha, K., Tarascon, J.-M. & Prakash, A. S. Synthesis,
structure, and electrochemical properties of the layered sodium insertion cathode:
NaNi1/3Mn1/3Co1/3O2. Chem. Mater. 24, 1846–1853 (2012).
8. Huili, P., And, H. Y.-S. & Liquan, C. Room-Temperature Stationary Sodium-Ion Batteries
for Large-Scale Electric Energy Storage. Energy Environ. Sci. (2013).
doi:10.1039/C3EE40847G
9. Slater, M. D., Kim, D., Lee, E. & Johnson, C. S. Sodium-Ion Batteries. Adv. Funct. Mater.
23, 947–958 (2013).
10. Palomares, V. et al. Na-ion batteries, recent advances and present challenges to become low
cost energy storage systems. Energy Environ. Sci. 5, 5884 (2012).
11. Ellis, B. L. & Nazar, L. F. Sodium and sodium-ion energy storage batteries. Curr. Opin.
Solid State Mater. Sci. 16, 168–177 (2012).
12. Yu, H., Guo, S., Zhu, Y., Ishida, M. & Zhou, H. Novel titanium-based O3-type
NaTi(0.5)Ni(0.5)O2 as a cathode material for sodium ion batteries. Chem. Commun. 50,
457–459 (2014).
13. TOPAS V4: General Profile and structure analysis software for powder diffraction data.-
User’s Manual, Bruker AXS, Karlsruhe, Germany. (2008).
185
14. Cheary, R. W. & Coelho, A. A. A fundamental parameters approach to X-ray line-profile
fitting. J. Appl. Cryst. 25, 109–121 (1992).
15. Cheary, R. W., Coelho, A. A. & Cline, J. P. Fundamental parameters line profile fitting in
laboratory diffractometers. J. Res. Natl. Inst. Stand. Technol. 109, 1–25 (2004).
16. Kern, A., Coelho, A. A. & Cheary, R. W. Convolution based profile fitting- Diffraction
analysis of the microstructure of materials. 17–50 (2004).
17. Saadoune, I., Maazaz, A., Menetrier, M. & Delmas, C. On the NaxNi0.6Co0.4O2 System :
Physical and Electrochemical Studies. J. Solid State Chem. 117, 111–117 (1996).
18. Lai, W. & Ciucci, F. Thermodynamics and kinetics of phase transformation in intercalation
battery electrodes -phenomenological modeling. Electrochim. Acta 531–542 (2010).
doi:10.1016/j.electacta.2010.09.015
19. Clearfield, A., Jerus, P. & Cotman, R. N. Hydrothermal and solid state synthesis of sodium
zirconium silicophosphate. Solid State Ionics 5, 301–304 (1981).
20. Shannon, R. D., Taylor, B. E., Gier, T. E., Chen, H.-Y. & Berzins,, T. Ionic Conductivity
in Na5YSi4012-Type Silicates. Inorg. Chem. 17, 958–964 (1978).
21. Whittingham, M. S. & Huggins, R. A. Measurement of Sodium Ion Transport in Beta
Alumina Using Reversible Solid Electrodes. J. Chem. Phys. 54, 414 (1971).
22. Cho, J., Kim, Y. J. & Park, B. Novel LiCoO2 Cathode Material with Al2O3 Coating for a
Li Ion Cell. Chem. Mater. 3788–3791 (2000).
23. Scott, I. D. et al. Ultrathin Coatings on Nano-LiCoO2 for Li-Ion Vehicular Applications.
Nano Lett. 11, 414–418 (2011).

186
6. CONCLUSIONS
Designing low-cost, long cycle life battery devices remains a prime challenge for stationary and
grid-sector applications. Na-ion batteries are actively researched to address the gaps in these
market areas and is anticipated to provide a low-cost, sustainable solution as they are based on
inexpensive, plentiful and geographically widespread sodium resources. Characterization of novel
functional intercalation-type materials remains a research challenge for device development.
Availability of multiple electrode material choices would diversify the product performance
specifications and address a larger market segment with different performance metrics. In this
research work, inorganic materials with various structure types such as tunnel- and layer-related
phases were investigated as novel sodium intercalation electrodes.
Using impedance spectroscopy, we show that perchlorate based electrolyte (1M NaClO4 in
EC/DMC) had a continual growth of surface films contributing to increasing film resistance at
open circuit conditions. Fluorine based electrolyte (0.5M NaPF6 in EC/DEC), on the other hand,
had a lower film resistance with a gradual growth rate of the surface films demonstrating better
passivation stability. Cyclic voltammetric testing showed that anodized aluminum (with exposed
aluminum cross-section to contact film) provided excellent corrosion resistance as indicated by
lower oxidative peak currents than nickel, stainless steel, graphite, titanium, and plain aluminum.
Electrochemical methods were validated using well-studied Na0.7CoO2 and LiFePO4 electrode
materials using in-lab synthesized materials. The electrochemistry of novel, tunnel-type materials:
sodium nickel phosphate (SNP) and sodium cobalt titanate (SCT) were evaluated. Reversible
sodium de-intercalation/intercalation reactions were shown in SNP using Ni2+/4+ redox couple with
average voltage of 2.0 V vs. Na/Na+ with 50% of theoretical capacity (~50 mAh/g). A large voltage

187
hysteresis of 1V was obtained between charge/discharge curves. Ex-situ XRD testing confirmed
that the material retained the starting structure due to the inherent structural stability of polyanionic
material classes. PITT testing of SCT shows sloping, symmetric charge/discharge curves between
3.6-4.2 V indicative of intercalation-type reactions with good faradaic efficiency of 86%. The
voltage hysteresis is 1.4 V in fluorine based electrolyte when tested at 70 oC and increases to 1.6
V in perchlorate based electrolyte when tested at room temperature. The voltage hysteresis is
reported to be inherent to the material chemistry and a thermally activated process. We conclude
that the slow solid state diffusion of sodium ions in SNP and SCT causes the large voltage
polarization and further improvements would require significant particle size reduction to reduce
the diffusional length scale.
Layer-structured titanate materials with prismatic (P2) and octahedral co-ordination (O3) of
sodium atoms were investigated as potential sodium intercalation electrodes. P2-NT and P2-NMT
materials were prepared by optimal solid state reaction techniques to obtain reasonably phase pure
powders. High cathodic redox potential of 3.7 V vs. Na/Na+ for Ni2+/4+ and low redox potential of
0.7 V vs. Na/Na+ for Ti4+/3+ is reported for P2-NT phase demonstrating its bifunctional nature.
Using P2-NT as cathode and anode (‘bifunctional’) would provide significant cost benefits in
large-scale manufacturing. The sloping voltage profile between 2-4.2 V, and ex-situ XRD testing
confirms that the P2-NT phase retains the initial structure without any phase change. Good
reversibility is demonstrated in P2-NMT phase as well with few additional peaks at E>4.0 V
possibly due to sodium ordering processes. AC and DC testing on sintered pellets show a wide
separation between the electronic and ionic conductivity curves with the former being ~4 orders
faster. Impedance spectroscopy of film electrodes show a decreasing interfacial resistance with
charging voltage from equivalent circuit modeling. P2-NMT electrodes were shown to possess

188
faster interfacial reaction kinetics than P2-NT electrodes over the complete voltage range. PITT
and EIS data supports relatively fast solid state diffusion of sodium ions (10-12-10-13 cm2/s), as
expected for the prismatically co-ordinated layered oxides. P2-NMT electrodes were found to
provide significantly improved capacity retention than P2-NT electrodes at higher currents due to
the faster interfacial kinetics and enhanced charge-carrier transport processes. These materials are
shown to possess good capacity retention in the cathodic regime. However, P2-NT phase has a
pronounced capacity fade in the anodic regime and this is likely associated with electrocatalytic
reduction induced by nickel species. This can potentially be avoided by forming a protective
surface film to limit electrolyte exposure. Attempts to incorporate calcium and potassium in the
P2 structure by traditional solid-state synthetic routes to stabilize the structure for improved
performance were unsuccessful due to the formation of perovskite- and framework-related
impurity phases.
The structural properties of P2-NT material was evaluated using experimental neutron
diffraction and computational studies. Rietveld refinement provided average structural information
while computational methods based on atomistic simulations provided both average and local
structural details. The Bragg reflections of space group P63/mmc (# 194) reproduced the
experimental patterns fairly accurately and utilized as a good structural model. The measured
anisotropy in thermal expansion co-efficient values: β𝑎900𝐶=1.83×10⁻⁵Å/K, β𝑐
900𝐶=17.65×10⁻⁵Å/K
was reported to be due to the layered configuration with weaker through-plane bonding. Naf sites
were found to contain lower occupancy than Nae sites due to higher repulsive interaction with the
in-line transition metal atoms. The Naf site occupancy was found to gradually increase
(0.1699→0.1751) as the testing temperature is raised from 15→300K. The higher thermal
contribution at ambient conditions was found to make the unfavorable sodium sites slightly more

189
accessible. The experimental sodium nuclear densities displayed considerable oblateness along the
ab-plane while oxygen nuclear densities remained fairly spherical. Buckingham and Morse-type
interatomic potential models provided fairly accurate structural representation of various binary
and ternary oxides, and the target phase. Energetics study confirmed that equally distributed
structures had the lowest energy for both potential models. The simulated nuclear densities
matched the experimental patterns fairly well. The simulated patterns were also found to contain
additional density spots due to displacive movements and this effect is attributed to the formation
of stacking faults. The simulated and pseudo-experimental PDF patterns showed some differences
due to the averaging effect in Rietveld refinement and further analysis would require experimental
PDF measurements. These potential models would act as a good framework for further model
improvement using Ab-initio energy hypersurface fitting approaches and MD studies to investigate
the dynamics of sodium transport.
The electrochemical and structural properties of O3NT material was characterized with the
potential of realizing higher reversible capacities than P2 materials. The stabilizing influence of
titanium to reduce the capacity fade was evaluated. Galvanostatic testing and PITT confirm the
excellent electrochemical reversibility with small voltage hysteresis with charging voltage of 4.2
V. However, higher voltages were found to lead to affect the reaction reversibility. Ex-situ XRD
testing show that the O3 phase transforms to P3 phase in composition range of 0.81 > 𝑥 > 0.39.
We predicted that the intermediate O3’ phase occurs in a smaller domain of 0.90 > 𝑥 > 0.81.
Further extraction of sodium results in the formation of an unknown phase possibly with high
moisture sensitivity. We show that cycling the electrode in the O3-P3 domain provides for an
excellent capacity retention of 99% in 115 cycles at C/2 rate. Impedance spectroscopy confirms
that the physicochemical parameters such as surface film resistance and interfacial charge transfer

190
remains fairly invariant during cycling contributing to the excellent capacity retention. We also
report that O3NT phase has good capacity retention when cycled in higher charging voltages (>4.2
V) and these enhanced capacity retention is attributed to stronger bonding character of titanium.
However, the capacity values become reduced in these high voltage cutoff studies possibly due to
the formation of resistive surface films by electrolyte breakdown at highly oxidative potentials.
Future work involving masking the surface of the active particles can potentially inhibit these side
reactions and provide improved capacity retention. Rate studies confirm that O3NT electrodes
provide improved capacity retention than P2NT electrodes due to the presence of higher nickel
providing a percolating network for fast transport of charge carrier species.