synthesis and characterization of vegetable oil-based
TRANSCRIPT

Graduate Theses and Dissertations Iowa State University Capstones, Theses andDissertations
2013
Synthesis and characterization of vegetable oil-based polyurethane dispersionsThomas Frederick GarrisonIowa State University
Follow this and additional works at: https://lib.dr.iastate.edu/etd
Part of the Polymer Chemistry Commons
This Dissertation is brought to you for free and open access by the Iowa State University Capstones, Theses and Dissertations at Iowa State UniversityDigital Repository. It has been accepted for inclusion in Graduate Theses and Dissertations by an authorized administrator of Iowa State UniversityDigital Repository. For more information, please contact [email protected].
Recommended CitationGarrison, Thomas Frederick, "Synthesis and characterization of vegetable oil-based polyurethane dispersions" (2013). Graduate Thesesand Dissertations. 13470.https://lib.dr.iastate.edu/etd/13470

Synthesis and characterization of vegetable oil-based polyurethane dispersions
by
Thomas F. Garrison
A dissertation submitted to the graduate faculty
in partial fulfillment of the requirements for the degree of
DOCTOR OF PHILOSOPHY
Major: Chemistry
Program of Study Committee: Richard C. Larock, Co-major Professor Michael R. Kessler, Co-major Professor
Malika Jeffries-EL Arthur Winter
Keith Woo
Iowa State University Ames, Iowa
2013 Copyright © Thomas F. Garrison, 2013. All rights reserved.
ii
DEDICATION
To Andrea for all your sacrifices and support

iii
TABLE OF CONTENTS
DEDICATION .......................................................................................................................... ii
LIST OF ABBREVIATIONS ....................................................................................................v
CHAPTER 1. GENERAL INTRODUCTION .........................................................................1 Overview ............................................................................................................1 Background ........................................................................................................2 References ..........................................................................................................7
CHAPTER 2. EFFECT OF UNSATURATION ON VEGETABLE OIL-BASED POLYURETHANE COATINGS ..................................................................................9
Abstract ..............................................................................................................9 Introduction ......................................................................................................10 Experimental ....................................................................................................17 Results and Discussion ....................................................................................21 Conclusions ......................................................................................................30 Acknowledgements ..........................................................................................31 References ........................................................................................................31
CHAPTER 3. MECHANICAL AND ANTIBACTERIAL PROPERTIES OF SOYBEAN-OIL-BASED CATIONIC POLYURETHANE COATINGS: EFFECTS OF AMINE RATIO AND DEGREE OF CROSSLINKING ............................................................34
Abstract ............................................................................................................34 Introduction ......................................................................................................35 Experimental ....................................................................................................37 Results and Discussion ....................................................................................44 Conclusions ......................................................................................................55 Acknowledgments............................................................................................56 References ........................................................................................................56
CHAPTER 4. EFFECTS OF COUNTERIONS ON THE PHYSICAL AND ANTIMICROBIAL PROPERTIES OF CASTOR OIL-BASED CATIONIC POLYURETHANE COATINGS ................................................................................58
Introduction ......................................................................................................58 Experimental ....................................................................................................61 Results and Discussion ....................................................................................63

iv
Conclusions ......................................................................................................71 Acknowledgements ..........................................................................................72 References ........................................................................................................72
CHAPTER 5. GRAFTED HYBRID LATEXES FROM CASTOR OIL-BASED WATERBORNE POLYURETHANES.......................................................................74
Abstract ............................................................................................................74 Introduction ......................................................................................................74 Experimental ....................................................................................................78 Results and Discussion ....................................................................................82 Conclusions ......................................................................................................90 Acknowledgements ..........................................................................................90 References ........................................................................................................91 CHAPTER 6. GENERAL CONCLUSIONS ..........................................................................93 ACKNOWLEDGEMENTS .....................................................................................................96

v
LIST OF ABBREVIATIONS
AcO acetoxy group
AcOH acetic acid
BA butyl acrylate
BuOH butanol
C1 and C2 experimentally determined paramenters
DBTDL dibutyltin dilaurate
DHB 2,5-dihydroxybenzoic acid
DMA dynamic mechanical analysis
DSC differential scanning calorimetry
E Young’s modulus
E’ storage modulus
ESO epoxidized soybean oil
GHL grafted hybrid latex
HDI hexamethylene diisocyanate
HEA 2-hydroxyethyl acrylate
IPDI isophorone diisocyanate
KOH potassium hydroxide
KPS potassium persulfate
MALDI-TOF Matrix-assisted laser desorption/ionization time-of-
flight mass spectrometry
MDEA N-methyl diethanolamine
MEK methyl ethyl ketone
MeOH methanol
Mc molecular weight between crosslinks
Mn number average molecular weight
Mw mass average molecular weight
MRSA methicillin-resistant Staphylococcus aureus
NCO group isocyanate group
vi
NMR nuclear magnetic resonance
OH hydroxyl
OH # hydroxyl number
OM outer membrane
Pa Pascal
PDI polydispersity index
PU polyurethane
PUD polyurethane dispersion
R gas constant
SEC size exclusion chromatography
ST styrene
T absolute temperature
Tg glass transition temperature
T5 temperature at 5% weight loss
T50 temperature at 50% weight loss
Tmax temperature at maximum degradation
tan δ tan delta
TEA triethylamine
TEM transmission electron microscope
TGA thermogravimetric analysis
TG-MS thermogravimetric analysis – mass spectrometry
TSB tryptic soy broth
VOC volatile organic compound
wt% weight percent
ZOI zone of inhibition
ε elongation
εb elongation at break
σ tensile strength
σb tensile strength at break
λ stretch ratio
ρ density

1
CHAPTER 1. GENERAL INTRODUCTION
Overview
In this thesis, we explore the thermal, mechanical, and antimicrobial properties of
bio-based waterborne polyurethane coatings and grafted hybrid latexes made from
polyurethane dispersions. Chapter 1 describes the effect of residual unsaturation in
epoxidized vegetable oils on the physical and thermal properties of films prepared from
anionic polyurethane dispersions. We were able to isolate the effect of residual unsaturation
by controlling the extent of epoxidation of the vegetable oils. Matrix-assisted laser
desorption/ionization time-of-flight mass spectrometry (MALDI-TOF) was used to
accurately determine the molecular weight and mass distribution of the vegetable oil polyols.
We also examined the effect of different side groups introduced by ring opening of
epoxidized soybean oil. This work will be submitted to Macromolecular Bioscience.
Chapters 3 and 4 examine the physical, thermal, and antimicrobial properties of
cationic waterborne polyurethane dispersions. This work was conducted in collaboration
with microbiologists at Iowa State University. Our collaborators, Dr. Byron Brehm-Stecher
and his research group, investigated the modes of action for antimicrobial activity. Previous
work by our groups examined the effect of different amine polyols on the thermal,
mechanical, and antimicrobial properties of polyurethane films.1 In Chapter 3, we have
examined the effects of adjusting the molar ratio of the N-methyl diethanolamine on the
physical and antimicrobial properties of the polyurethane films. This work has been
submitted to Biomacromolecules. Chapter 4 explores the effect of the different
counteranions on the physical and antimicrobial properties of the polyurethane films.
Evolved gas analysis was used to quantify the residual amounts of acid trapped in the film.

2
Preliminary antimicrobial testing has been conducted. This work will be submitted for
publication after completion of more detailed antimicrobial studies.
Chapter 5 examines the use of 2-hydroxyethyl acrylate (HEA) for introducing graft
sites when making grafted hybrid latexes from castor oil-based waterborne dispersions.
Previous efforts by our group explored using residual unsaturation in soy polyols and
acrylated epoxidized soybean oil as graft sites.2,3 In this work, we have estimated the
molecular weight between crosslinks using Mooney-Rivlin plots. This work will be
submitted to Macromolecular Materials and Communications.
Background
As a precursor to discussion about the advantages and challenges of synthesizing
waterborne coatings, it is important to first note some of the characteristics of the
conventional organic solvent-based coatings that they replace. Organic solvents are useful
because they are effective at dissolving binders and homogenizing coating blends, controlling
viscosity, increasing shelf life, and wetting the substrate surface.4,5 However, organic
solvents pose significant risks due to environmental, industrial, and fire safety concerns.5
With greater public and regulatory emphasis on using environmentally-friendly processes,
waterborne coatings offer inherent advantages to both consumers and manufacturers.6
Processing and manufacturing of coatings account for the second leading source of human
caused atmospheric pollutants, behind vehicular traffic.4
A key benefit of all waterborne coatings is the reduction in hazardous emissions from
volatile organic compounds (VOCs) generated by non-aqueous solvents. Other coating
strategies have also been designed to reduce VOCs, including high solids coatings, powder
3
coatings, and radiation curable coatings.7 These other coating systems have their own unique
advantages and disadvantages, but are outside the scope of this dissertation.
Polyurethanes. In recent years, considerable research has focused on the replacement of
petroleum-based starting materials for polyurethanes with biorenewable-based materials.8-10
While the vast majority of research in bio-based polyurethanes has focused on using
vegetable oil-based polyols, the development of aliphatic vegetable oil-based isocyanates has
also been investigated.11
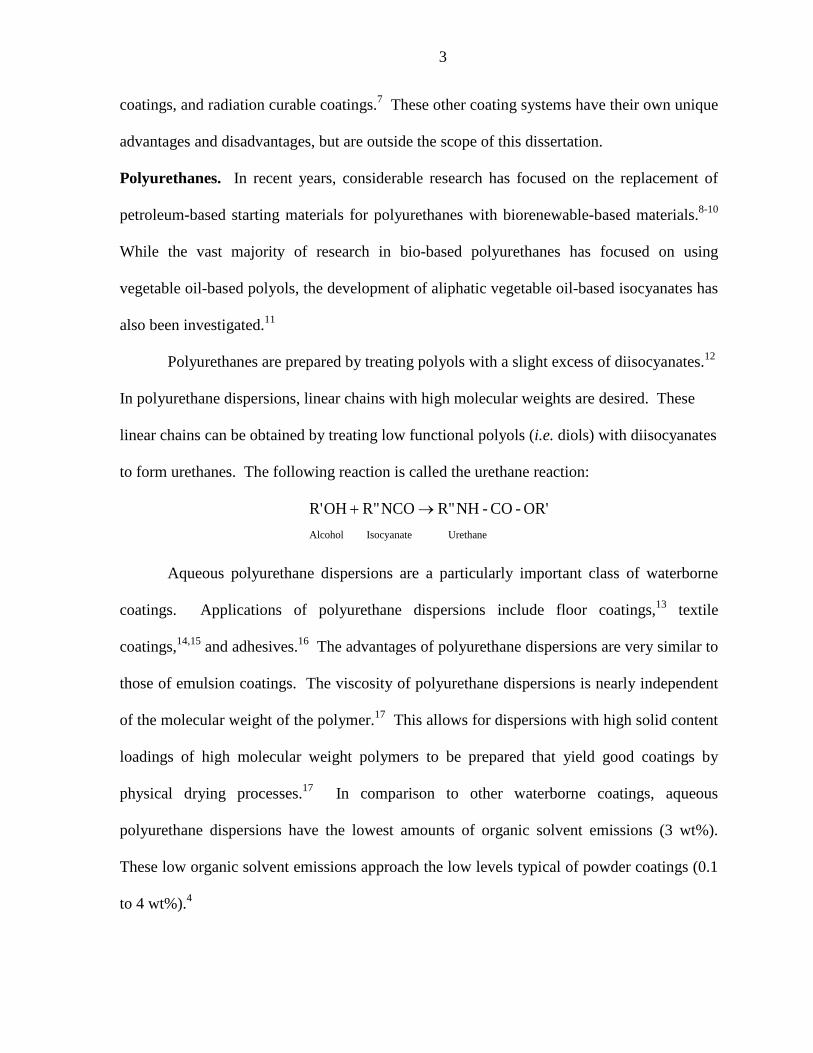
Polyurethanes are prepared by treating polyols with a slight excess of diisocyanates.12
In polyurethane dispersions, linear chains with high molecular weights are desired. These
linear chains can be obtained by treating low functional polyols (i.e. diols) with diisocyanates
to form urethanes. The following reaction is called the urethane reaction:
Aqueous polyurethane dispersions are a particularly important class of waterborne
coatings. Applications of polyurethane dispersions include floor coatings,13 textile
coatings,14,15 and adhesives.16 The advantages of polyurethane dispersions are very similar to
those of emulsion coatings. The viscosity of polyurethane dispersions is nearly independent
of the molecular weight of the polymer.17 This allows for dispersions with high solid content
loadings of high molecular weight polymers to be prepared that yield good coatings by
physical drying processes.17 In comparison to other waterborne coatings, aqueous
polyurethane dispersions have the lowest amounts of organic solvent emissions (3 wt%).
These low organic solvent emissions approach the low levels typical of powder coatings (0.1
to 4 wt%).4
ne Uretha Isocyanate Alcohol
OR'-CO-NHR"NCOR"OHR' →+

4
Directly synthesizing polyurethane dispersions in water is not possible because of the
reactivity of diisocyanates with water.18 Several methods for making aqueous polyurethane
dispersions have been developed, including the acetone process, the prepolymer mixing
process, the melt dispersion process, and the ketimine/ketazine process.19 The acetone
process is one of the most widely used in industry.19 In the first step, polyurethane chains are
extended with hydrophilic groups incorporated into the polymer backbone.12 The solvent,
acetone, reduces the viscosity during the polyurethane synthesis. Water is then added to the
mixture to form the dispersion. After dispersion, the acetone can be removed using
distillation.20 The acetone process is often modified to use other solvents, such as methyl
ethyl ketone, in place of acetone.14,21
Emulsion Coatings. As a precursor to the discussion of hybrid grafted latexes in chapter 4,
an introduction to emulsion polymerization and latex coatings is useful. Emulsion
polymerization produces latex particles, which are dispersions of fine polymer particles in
water.7,22,23 Frequently, the terms emulsion coating and latex paint are used interchangeably.
Applications of emulsion coatings include paints, coatings, adhesives, and paper coatings.23
Emulsion coatings have a number of desirable physical properties. Styrene-butadiene
latex paints for interior walls were first sold commercially in the United States in the late
1940s.24,25 These paints appealed to consumers because of their easy application, low odor,
and easy clean-up.24,25 Acrylic latexes are known for high molecular weights with good
corrosion resistance and are generally more economical than polyurethane coatings.5,22,26
However, acrylic latexes have poor film forming properties, abrasion resistance and
toughness compared to polyurethane dispersions.13,27

5
A typical formulation for emulsion polymerization consists of a slightly water-soluble
monomer, co-monomers, a water-soluble initiator, surfactants, and any other additives, which
are combined in an aqueous solution.5 In emulsion polymerization, monomers are
polymerized through a free-radical process. The monomer molecules migrate from the
monomer droplets to inside surfactant micelles, where the polymerization actually
occurs.4,5,22 Polymerization begins when a water-soluble initiator molecule enters a micelle
and reacts with the monomer. These micelles form when the surfactant concentration is
above a minimum concentration, called the critical micelle concentration.22 As
polymerization progresses, the monomer droplet size decreases and the size of the polymer-
containing micelles increase.5,22 The resulting aqueous suspension of polymers is called a
latex.22 Figure 1 illustrates the emulsion polymerization process.
Figure 1. Schematic drawing of emulsion polymerization
Monomer Droplet
SwollenPolymerMicelle
MicelleContainingMonomer
Monomer
SurfactantMolecule

6
Terminology. Frequently, the terminology associated with waterborne coatings is
ambiguous and often misused. Products of emulsion polymerization are latexes, a dispersion
of polymerized polymer particles. Emulsions are dispersions of liquid droplets in another
liquid, such as water.7 However, coatings prepared from emulsion polymerization are still
commonly referred to as emulsion coatings, which highlight the ambiguity of coating
terminology. Given below are definitions of coating terminology:
• Colloid or colloidal dispersion – a substance or material consisting of ultra-
microscopic particles (solid, liquid, or gas) that has negligible settling when
dispersed in a different medium (solid, liquid, or gas).24,25,28
• Dispersion – a generic term for a heterogeneous system where a solid, gas, or
liquid is dispersed in a different medium.24,25,29
• Emulsion – a generic term for a liquid system consisting of fine (but larger than
colloidal size) globules of liquid dispersed within a different, immiscible liquid
(usually water). Emulsions can be dispersed with or without the use of
emulsifiers.24,25,29
• Latex – a dispersion or suspension of fine polymer particles in water that resists
settling.22
Particle size is a common way to classify different types of waterborne coatings.4,24,25
Table 1 below lists typical particle sizes of different waterborne coatings. Another approach
for classifying coating systems is based on how coating resins are polymerized. Primary
dispersions are directly polymerized in water by emulsion polymerization.4,25 Secondary

7
dispersions are polymers dispersed in water after completion of a bulk polymerization
process.4,25 In the case of colloids, the binders typically have neutralizable groups (usually
acidic groups) which are converted to salts. Hydrophilic groups, such as polyglycols, can
also be incorporated into the polymer molecule to improve water solubility.4
Table 1. Particle size of different waterborne coating systems
Term Particle size
Solution below 0.001 μm
Colloid 0.001 to 0.1 μm
Dispersion above 0.1 μm
References
1. Y. Xia, Z. Zhang, M. R. Kessler, B. Brehm-Stecher and R. C. Larock, ChemSusChem, 2012, 5, 2221.
2. Y. Lu and R. C. Larock, Biomacromolecules, 2007, 8, 3108. 3. Y. Lu and R. C. Larock, J. Appl. Polym. Sci., 2011, 119, 3305. 4. K. Dören, W. Freitag and D. Stoye, Water-Borne Coatings: The Environmentally-
friendly Alternative, Hanser Publishers, Munich, 1994. 5. A. Marrion, ed., The Chemistry and Physics of Coatings, Royal Society of Chemistry,
Cambridge, UK, 1994. 6. K.-L. Noble, Prog. Org. Coat., 1997, 32, 131. 7. K. D. Weiss, Prog. Polym. Sci., 1997, 22, 203. 8. M. A. R. Meier, J. O. Metzger and U. S. Schubert, Chem. Soc. Rev., 2007, 36, 1788. 9. Z. S. Petrovic, Polym. Rev., 2008, 48, 109. 10. Y. Xia and R. C. Larock, Green Chem., 2010, 12, 1893. 11. D. P. Pfister, Y. Xia and R. C. Larock, ChemSusChem, 2011, 4, 703. 12. G. N. Manvi and R. N. Jagtap, J. Disper. Sci. Technol., 2010, 31, 1376. 13. G. A. Howarth, Surf. Coat. Int. Pt. B-Coat. Trans., 2003, 86, 111. 14. H. Pan and D. Chen, Text. Res. J., 2009, 79, 687. 15. Q. B. Meng, S.-I. Lee, C. Nah and Y.-S. Lee, Prog. Org. Coat., 2009, 66, 382. 16. E. Orgilés-Calpena, F. Arán-Aís, A. M. Torró-Palau, C. Orgilés-Barceló and J. M.
Martín-Martínez, Int. J. Adhes. Adhes., 2009, 29, 774. 17. B. K. Kim, Colloid Polym. Sci., 1996, 274, 599.

8
18. O. Jaudouin, J. J. Robin, J. M. Lopez-Cuesta, D. Perrin and C. Imbert, Polym. Int., 2012, 61, 495.
19. V. D. Athawale and R. V. Nimbalkar, J. Am. Oil Chem. Soc., 2011, 88, 159. 20. H. Sardon, L. Irusta, M. J. Fernandez-Berridi, J. Luna, M. Lansalot and E. Bourgeat-
Lami, J. Appl. Polym. Sci., 2011, 120, 2054. 21. Y. Lu and R. C. Larock, Biomacromolecules, 2008, 9, 3332. 22. J. R. Fried, Polymer Science & Technology, Prentice Hall Professional Technical
Reference, Upper Saddle River, NJ, 2003. 23. A. M. van Herk, in Hybrid Latex Particles, eds. A. M. VanHerk and K. Landfester,
Springer-Verlag Berlin, Berlin, 2010, vol. 233, pp. 1-18. 24. C. R. Martens, Emulsion and Water-Soluble Paints and Coatings, Reinhold
Publishing Corp., New York, 1964. 25. C. R. Martens, Waterborne Coatings: Emulsion and Water-Soluble Paints, Van
Nostrand Reinhold Co., New York, 1981. 26. A. C. Aznar, O. R. Pardini and J. I. Amalvy, Prog. Org. Coat., 2006, 55, 43. 27. M. Li, E. S. Daniels, V. Dimonie, E. D. Sudol and M. S. El-Aasser, Macromolecules,
2005, 38, 4183. 28. K. W. Whitten, R. E. Davis and M. L. Peck, General Chemistry, Saunders College
Publishing, Orlando, Fl, 1996. 29. F. C. Mish, ed., Merriam-Webster's Collegiate Dictionary, Merriam-Webster Inc.,
Springfield, MA, 1993.
9
CHAPTER 2. EFFECT OF UNSATURATION ON VEGETABLE OIL-BASED POLYURETHANE COATINGS
A paper to be submitted to Macromolecular Bioscience
Thomas F. Garrison,a Michael R. Kessler,*b-d and Richard C. Larock*a
a Department of Chemistry, Iowa State University, Ames, Iowa b Department of Materials Science and Engineering, Iowa State University, Ames, Iowa c Ames Laboratory, US Dept. of Energy, Ames, Iowa. d School of Mechanical and Materials Engineering, Washington State University, Pullman, Washington.
Abstract
A variety of vegetable oil-based, waterborne polyurethane dispersions have been
successfully synthesized from different vegetable oil polyols exhibiting almost constant
hydroxyl functionalities of 2.7 OH groups per molecule. The vegetable oil polyols, which
have been prepared from vegetable oils with different fatty acid compositions (peanut, corn,
soybean, and linseed oil), range in residual degree of unsaturation from 0.4 to 3.5 carbon-
carbon double bonds per triglyceride molecule. The effects of residual unsaturation on the
thermal and mechanical properties of the resulting polyurethane films have been investigated
by dynamic mechanical analysis, differential scanning calorimetry, and thermal gravimetric
analysis. Matrix-assisted laser desorption/ionization time-of-flight mass spectrometry
(MALDI-TOF) has been used to accurately determine the molecular weight and mass
distribution of the vegetable oil polyols. Higher residual unsaturation results in polyurethane
films with increased break strength, Young’s modulus, and toughness. This work has
isolated the effect of unsaturation on vegetable oil-based polyurethane films, which has been
neglected in previous studies. The effect of different oxirane ring opening methods

10
(methanol, butanol, acetic acid, and hydrochloric acid) on the properties of the coatings has
also been examined.
Introduction
Polyurethanes are versatile materials with applications ranging from production of
rigid plastics to soft foams, films, elastomers, and others.1 Protective and decorative coatings
are particularly important applications. In 2012, the total revenue from paints and coatings
manufactured in the United States was $24 billion.2 While this amount includes all types of
coating materials, polyurethanes account for a substantial portion of this market, particularly
in high-end applications.3
Currently, solvent-borne polyurethane raw materials account for 18% of the total
value of global consumption of coating materials.3 The Clean Air Act of 1970, as well as
more recent legislation in European countries, greatly affected the entire paints and coatings
industry by mandating the reduction and monitoring of the release of volatile organic
compounds (VOCs) into the atmosphere.4 In response to these regulations, manufacturers
have sought ways to eliminate organic solvents from paints and coatings. In particular, the
focus turned to waterborne polyurethane coatings as an effective means for the reduction of
VOC emissions.5 By switching to waterborne coatings, manufacturers are realizing
additional benefits by reducing material costs associated with organic solvents and reducing
fire and health risks.6 As a result, waterborne coatings are gaining market share, especially in
the European sector.7
Currently, coating materials are primarily prepared from petroleum-based materials,
linking the supply chain and cost of raw materials to crude oil prices.2 Serious, long-term
supply issues and environmental risks are major concerns as dwindling conventional

11
petroleum reserves lead to the increased exploitation of more expensive and environmentally
damaging, unconventional oil resources, such as oil sands or oil shale.8,9 Economic, political,
geological, and environmental concerns may also limit the development of untapped
petroleum reserves, especially those located in the Arctic regions.10,11 Despite the increase in
gas and oil production in the United States, the connection of domestic gas and oil prices to
global markets is expected to intensify, creating greater exposure to global price
fluctuations.10 Consequently, manufacturers will be inclined to develop biobased plastics to
hedge against the uncertainty of crude oil price fluctuations and other factors limiting future
supplies, such as growing oil consumption in Asian and other emerging markets.12
Polyurethanes are prepared from two types of reagents: polyols and diisocyanates.
More recently, polyurethane coatings made in part from biorenewable sources have been
investigated as replacements for petroleum-based feedstocks.13-15 Currently, only polyols can
be effectively made from biorenewable materials, such as vegetable oils that can be
chemically modified to form polyols and replace petroleum-derived polyether and polyester
polyols.15 In addition to vegetable oils, other biorenewable triglycerides, such as fish oil,
have also been used to make polyurethane coatings.16
The purpose of the present research was to examine the effects of carbon-carbon
double bonds in the polyol segment on the physical properties of vegetable oil-based
polyurethane dispersions. Our investigation focused on whether residual unsaturation is an
important variable in the experimental design of such coatings. Previous research has
examined the effect of different hydroxyl numbers using soybean oil-based polyols.
However, the hydroxyl value and residual carbon-carbon double bond content changed

12
simultaneously.17 Other studies have used different vegetable oils and that has been treated
such that few or no residual carbon-carbon double bonds remain in the resulting materials.18
In order to isolate the effects of the extent of unsaturation, several different vegetable
oils (peanut oil, corn oil, soybean oil, and linseed oil) were partially epoxidized and
subsequently ring-opened to yield vegetable oil polyols with a constant hydroxyl
functionality. Vegetable oils from different plant sources vary in triglyceride compositions
and unsaturation as summarized in Table 1. The unsaturation of unmodified vegetable oils
ranges from 3.37 carbon-carbon double bonds per triglyceride molecule for peanut oil to 6.2
carbon-carbon double bonds for linseed oil. Vegetable oil compositions vary significantly
depending on a wide range of factors, including environmental conditions and processing
techniques.19 Additionally, unsaturation measurements based on 1H NMR spectral analysis
can differ slightly from values reported based on other analytical techniques.20
Table 1. Triglyceride composition and unsaturation of selected vegetable oils
Fatty Acid Composition (%) Palmitic Stearic Oleic Linoleic Linolenic Ricinoleic
Vegetable Oil Double bondsa C16:0 C18:0 C18:1 C18:2 C18:3 C18:1
Peanutb 3.37 11.1 2.4 46.7 32 – – Cornb 4.45 10.9 2 25.4 59.6 1.2 –
Soybeanb 4.61 10.6 4 23.3 53.7 7.6 – Castorc 3.04 1 1 3 4.2 – 89
Linseedb 6.24 5.4 3.5 19 24 47 –
a Average number of double bonds per triglyceride. b Taken from Ref [19]. c Taken from Ref [20].
All vegetable oil polyols for this study were prepared with a hydroxyl functionality of
approximately 2.7 OH groups per molecule, because this value affords a good range of

13
residual unsaturation in the resulting polyols (0.4 to 3.5 carbon-carbon double bonds per
molecule). In addition, this specific hydroxyl functionality enables a direct comparison with
castor oil, which has a natural hydroxyl functionality of 2.7. Castor oil is comprised
primarily of ricinoleic acid (> 89%), which contains a hydroxyl group at the C-12 position
and a carbon-carbon double bond between C-9 and C-10.21 The structure of ricinolein, the
major triglyceride of castor oil, is shown in Figure 1.
Figure 1. Ricinolein, major component of castor oil
Hydroxyl functionality, which is the number of hydroxyl groups per molecule, can be
calculated by dividing the molecular weight of the polyol by its equivalent weight as shown
in the following equation:
Functionality = Molecular Weight Equivalent Weight
Equivalent weight is related to the hydroxyl number as shown in the equation below:
Equivalent Weight = 56,100
OH Number
The hydroxyl numbers of polyols are values experimentally determined by
acetylating the hydroxyl groups and titrating with potassium hydroxide.22 Hydroxyl numbers
are defined by the mass of KOH in milligrams that is equivalent to the hydroxyl content of
one gram of polyol.22 Substituting the expression for equivalent weight into the first
O
OO
O O
O
OHOH
44
3 OH
14
equation yields the following relationship for functionality in terms of molecular weight and
hydroxyl number:
Functionality =Molecular Weight ∗ OH Number
56,100
There are two major reasons why the effect of unsaturation has not been isolated in
previous studies. First, controlling the partial epoxidation and subsequent ring opening of the
oils to achieve the desired hydroxyl functionality with residual unsaturation is difficult. In
practice, completely epoxidizing the vegetable oil and partially ring opening the oxirane
groups is much easier. This limitation can be overcome by controlling the extent of partial
epoxidation by adjusting the molar ratio of hydrogen peroxide to carbon-carbon double
bonds.17 Second, it is difficult to accurately determine molecular weights. Typically,
molecular weights are determined using size exclusion chromatography (SEC), light
scattering, osmometry, or viscometry. However, each technique comes with significant
drawbacks. Although SEC is the most common technique for determining the molecular
weight of polymers, it is not an absolute method and is often inaccurate without a well
characterized calibration standard.23 There may also be problems with sample aggregation
and adsorption onto column materials.24 Although light scattering is a direct method for
determining mass average molecular weight, it is a difficult, expensive, time-consuming
procedure and does not provide information about polydispersity.25 Likewise, osmometry is
a direct, but time-consuming method for determining number average molecular weights that
does not provide information about polydispersity.25
In the present study, matrix-assisted laser desorption/ionization time-of-flight mass
spectrometry (MALDI-TOF) has been used to accurately determine the molecular weight and
mass distribution of the vegetable oil polyols. MALDI-TOF is generally used to characterize

15
large biomolecules and synthetic polymers.26,27 MALDI-TOF overcomes two significant
challenges encountered with other mass spectrometry techniques used to measure the
molecular weight of large molecules: low volatility that makes it difficult to evaporate large
molecules and thermal stresses causing large molecules to break apart. MALDI is a soft
ionization method and the mass spectra produced have minimal fragment-ion content.28
With this technique, the sample is first dissolved in a solvent and then mixed with a solution
containing small organic molecules that readily absorb UV laser light, called the matrix.
This solution is subsequently dried to yield an analyte-doped matrix. Under laser irradiation,
the top layer of the matrix undergoes desorption, carrying the analyte with it. The sample is
then ionized and subsequently measured with a time-of-flight mass analyzer.29 A previous
study determined that dihydroxybenzoic acid (DHB) in acetone is the best matrix for
vegetable oils.30 For most biomolecules, the DHB matrix can serve as both a desorption and
an ionization vehicle with the best overall performance at the intrinsic pH of the matrix.
Thus, for the analysis of biomolecules with a DHB matrix, metal cationization agents are not
always needed.23,31
Although, MALDI provides accurate, direct molecular weight and weight distribution
measurements, it does so only for polymer samples with a polydispersity index (PDI) below
1.1.32,33 If the PDI is higher (> 1.1), molecular weight measurements produce serious
errors, because the assumption of constancy of intensity scale calibration is no longer valid.34
To overcome this problem, polydisperse polymer samples have been grouped into
monodisperse fractions using SEC, allowing the utilization of MALDI-TOF to calibrate the
SEC curves.35

16
Increasing the carbon-carbon double bond content may produce stiffer and stronger
polymers and the present work indicates that residual unsaturation can significantly impact
the physical and mechanical properties of the resulting polyurethane dispersions. Residual
unsaturation is a variable that has not been considered in previous research when introducing
different functionalities (i.e., different OH number) into polyols from a single vegetable oil
source. A second purpose of this research was to isolate the effect of different ring opening
methods, while keeping the functionality and residual unsaturation constant. A previous
study examined the effect of oxirane ring opening using different methods and reagents
(hydrogen, methanol, hydrochloric acid, and hydrobromic acid); however, the OH
functionality was not held constant, but ranged from 3.5 to 4.1 with minimal residual
unsaturation.36 In the present study, the range of OH functionality is much smaller (2.6 to
2.7). In addition, different chemicals (methanol, butanol, acetic acid, and hydrochloric acid)
have been used for the oxirane ring opening.
This is the first systematic attempt to isolate the effects of residual unsaturation in
vegetable oil polyols on the properties of the resulting polyurethane coatings. While residual
unsaturation is often considered undesirable, because it may lead to yellowing of the films,
unsaturation from various sources (aromatic diisocyanates, alkyd resins, or castor oil) is
fairly common in polyurethane coatings and some yellowing is tolerated in many
applications. Residual unsaturation can also act as a site for further chemical modifications.
In one previous study, grafted hybrid latexes were prepared by graft copolymerization of
acrylic monomers onto polyurethanes made with partially epoxidized and ring-opened
soybean oil. The residual carbon-carbon double bonds in the fatty acid chains were used as

17
graft sites.37 Electron beam irradiation was used to crosslink residual carbon-carbon double
bonds in vegetable oil-based polymers.38
Experimental
Materials. Soybean oil, peanut oil, and corn oil were purchased at the local supermarket and
used as received. Linseed oil was provided by Archer Daniels Midland Company (Decatur,
IL, USA). Castor oil, dimethylol propionic acid (DMPA),isophorone diisocyanate (IPDI),
and dibutyltin dilaurate (DBTDL) were purchased from Sigma-Aldrich (Milwaukee, WI,
USA). Acetone, formic acid, glacial acetic acid, hydrogen peroxide, and methyl ethyl ketone
(MEK) were purchased from Fisher Scientific Company (Fair Lawn, NJ, USA). All
materials were used as received.
Synthesis of Vegetable Oil-Based Polyols. Various vegetable oils (peanut, corn, soybean,
and linseed) were partially epoxidized using hydrogen peroxide and formic acid and
subsequently ring opened to form polyols as illustrated in Scheme 1.
Scheme 1. Synthesis of vegetable oil-based polyols with residual unsaturation

18
The procedure used for epoxidation of the vegetable oils followed previously reported
protocols.17 The relative amount of epoxidation was controlled by slightly adjusting the
molar ratios of hydrogen peroxide. For more unsaturated oils, such as linseed oil, less
hydrogen peroxide was needed. Generally, 250 g of vegetable oil, 85 to 100 g of hydrogen
peroxide (30%) and 38 g of formic acid (88% in water) were added to a round bottom flask
with a mechanical stirrer. The mixture was stirred in a water bath at 25 °C for 21 h. For the
work-up, the epoxidized vegetable oil was washed with ethyl acetate and aqueous sodium
chloride solution. The epoxidized vegetable oil was neutralized to a neutral pH with sodium
bicarbonate and dried over anhydrous magnesium sulfate. The epoxidized vegetable oil was
vacuum filtered, submitted to rotary evaporation at 38 °C for 1 h and dried in a 70 °C drying
oven overnight. The oxirane content of the epoxidized vegetable oils was approximately 2.7
oxirane units per triglyceride, as determined by 1H NMR spectroscopy.
The epoxidized oils were ring opened to prepare polyols with an approximate
hydroxyl functionality of 2.7. Two different series of vegetable oil polyols were prepared.
In the first series, different methoxylated vegetable oil polyols were synthesized from
epoxidized oils. For ring opening with methanol, 246 g of epoxidized vegetable oil, 246 g of
methanol, 246 g of isopropanol, and 10 g of fluoroboric acid were added to a 2 L round
bottom flask. The mixture was stirred with a mechanical stirrer in a 45 °C mineral oil bath
for 2 h. The reaction was quenched with aqueous ammonium hydroxide. For work-up, the
sample was washed with ethyl acetate and aqueous sodium chloride solution. The
methoxylated polyol was neutralized to a neutral pH with sodium bicarbonate and dried over
anhydrous magnesium sulfate. The methoxylated polyol was vacuum filtered, submitted to
rotary evaporation at 38 °C for 1 h and dried in a 70 °C drying oven overnight.
19
In the second series, several chemicals (methanol, butanol, hydrochloric acid, and
acetic acid) were used to ring open epoxidized soybean oil (ESO) following previously
described procedures.36,39 For ring opening with butanol, 60 g of ESO, 120 g of 1-butanol,
and 2.5 g of fluoroboric acid were added to a round bottom flask. The mixture was stirred
with a mechanical stirrer in a 45 °C mineral oil bath for 4 h. The reaction was quenched with
aqueous ammonium hydroxide and the work-up followed the same procedures used for
methoxylated polyols. For ring opening with hydrochloric acid, 247 g of ESO, 86 g of
hydrochloric acid, and 300 mL of acetone were added to a round bottom flask. The mixture
was stirred with a mechanical stirrer in a mineral oil bath at 40 °C for 2 h. The work-up
followed the same procedures used for methoxylated polyols. Ring opening with acetic acid
was achieved using a large excess of acetic acid relative to the ESO. Here, 40 g of ESO and
120 g of acetic acid were added to a two-neck flask with a reflux condenser and mechanical
stirrer. The mixture was stirred in an 80 °C mineral oil bath for 8 h. Work-up followed the
same procedures used for methoxylated polyols.
Synthesis of Vegetable Oil-Based Dispersions. The vegetable oil polyol, IPDI, DMPA, and
one drop of DBTDL were added to a two-neck flask equipped with a mechanical stirrer. The
molar ratios of OH groups from the vegetable oil polyol, NCO groups from the IPDI, and OH
groups from the DMPA were kept at 1.0 : 1.7 : 0.69. As is customary in the preparation of
polyurethane dispersions, an excess of diisocyanate was used, which can also react with the
water. The diol, DMPA, acted as both a chain extender, increasing the molecular weight, and
as an ionomer to promote dispersion. Steric hindrance prevented the carboxylic acid group
in the DMPA from reacting with the isocyanate.5

20
Characterization. MALDI-TOF spectra were obtained using an Applied Biosystems
Voyager DE Pro. The samples were diluted in acetone and a 10 mg/mL solution of 2,5-
dihydroxybenzoic acid (DHB) in acetone was used as the matrix. The molecular weights
were calculated based on procedures described in ASTM D7134, the standard for
determining the molecular weight of atactic polystyrene using MALDI-TOF.34 Minor
modifications to the protocol were necessary to adapt the standard for use with vegetable oil
polyols. Instead of all-trans retinoic acid, DHB was used for the matrix, which eliminated
the use of silver salts. Acetone replaced tetrahydrofuran or toluene as the solvent.
The oxirane content and degree of unsaturation (carbon-carbon double bonds) were
determined using 1H NMR spectroscopy with a Varian Unity spectrometer at 300 MHz, as
described previously in the literature.20 The hydroxyl number was determined by following
ASTM D1957.40 The tensile properties were measured using an Instron universal testing
machine (Model-4502). The crosshead speed was set at 100 mm/min. The average stress-
strain data from five rectangular specimens (50 mm × 10 mm) were used. A dynamic
mechanical analyzer (TA Instruments DMA Q800, New Castle, DE) in tensile mode at 1 Hz
was used to determine the storage and loss moduli. The samples were heated from −80 to
100 °C at a rate of 5 °C/min. Differential scanning calorimetry (DSC) was performed using a
differential scanning calorimeter (TA Instruments DSC Q20, USA). The samples were
heated from 25 to 100 °C at a rate of 20 °C/min to erase their thermal history, cooled to
−70 °C, and heated again to 150 °C at a heating rate of 20 °C/min. The sample masses were
approximately 5 mg. A thermogravimetric analyzer (TA Instruments TGA Q50, USA) was
used to measure the weight loss of the polyurethane films in an air atmosphere. The samples
21
were heated from 30 to 650 °C at a heating rate of 20 °C/min. The mass of the samples used
for TGA analysis was approximately 8 mg.
Results and Discussion
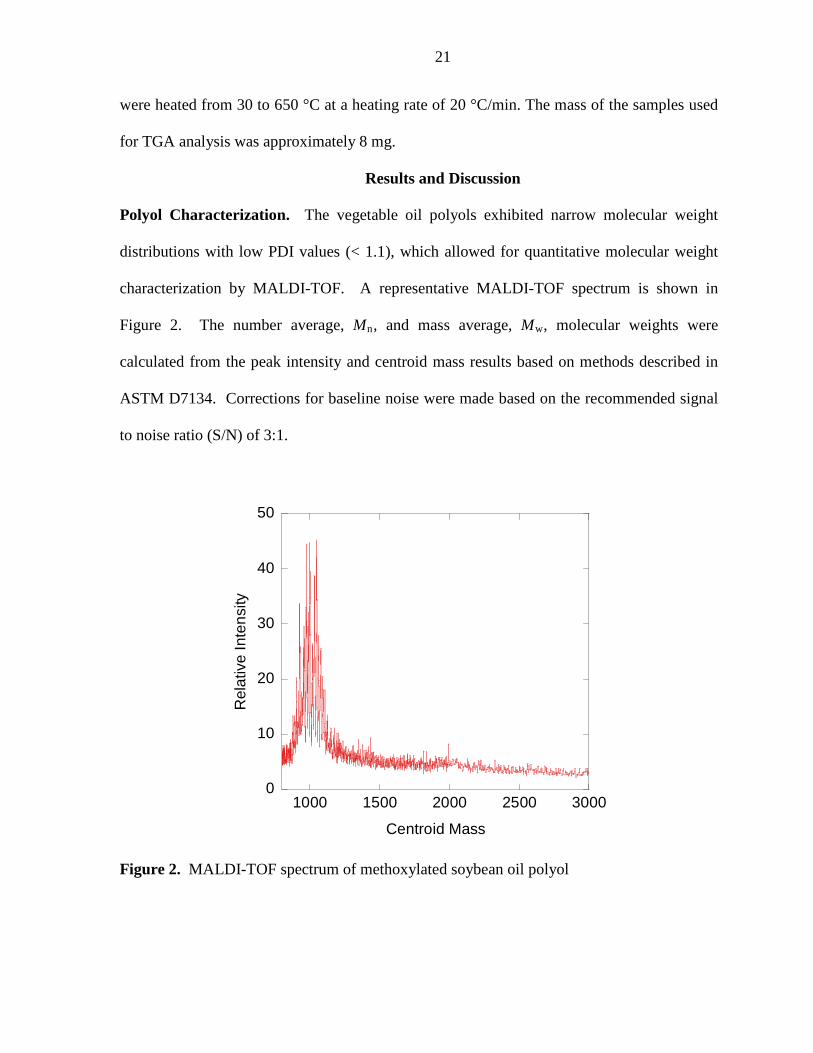
Polyol Characterization. The vegetable oil polyols exhibited narrow molecular weight
distributions with low PDI values (< 1.1), which allowed for quantitative molecular weight
characterization by MALDI-TOF. A representative MALDI-TOF spectrum is shown in
Figure 2. The number average, Mn, and mass average, Mw, molecular weights were
calculated from the peak intensity and centroid mass results based on methods described in
ASTM D7134. Corrections for baseline noise were made based on the recommended signal
to noise ratio (S/N) of 3:1.
0
10
20
30
40
50
1000 1500 2000 2500 3000
Rel
ativ
e In
tens
ity
Centroid Mass
Figure 2. MALDI-TOF spectrum of methoxylated soybean oil polyol

22
The molecular weights for the modified vegetable oil polyols ranged from 1030 to
1226 g/mol. Castor oil, a natural polyol, had a molecular weight of 933 g/mol, which
corresponds to the structure of ricinolein, the triglyceride of ricinoleic acid. It should be
noted that the higher average molecular weight and slightly higher PDI of the soybean polyol
ring opened by acetic acid was likely caused by dimerization of two triglycerides. This may
occur when a hydroxyl group formed during a previous ring opening step is involved in the
ring opening of an oxirane group on a second triglyceride molecule. However, the extent of
dimerization was minimized by using an excessive amount of acetic acid, as evidenced by
the resulting PDI below 1.1.
The results for the residual degree of unsaturation, molecular weight, and OH
functionality are listed in Table 2. Based on the 1H NMR spectroscopic results, the residual
unsaturation per molecule ranged from 0.4 for the peanut oil-based polyol to 3.5 for the
linseed oil-based polyol. The corn oil-based polyol and soybean oil-based polyol exhibited
similar amounts of residual unsaturation (1.3 and 1.6, respectively). All polyols under
investigation had an approximate hydroxyl functionality of 2.7 OH groups per molecule.
Table 2. Properties of vegetable oil-based polyols
Polyol OH Functionality Deg. of Unsat. OH Number Mn PDI
Peanut - MeOH 2.7 0.4 139 1072 1.03 Corn - MeOH 2.6 1.3 143 1030 1.01 Soybean - MeOH 2.7 1.6 142 1067 1.02 Castor 2.7 3.1 163 933 1.01 Linseed - MeOH 2.8 3.5 147 1076 1.02
Polyol Functionality Deg. Of Unsat. OH Number Mn PDI
Soybean - MeOH 2.7 1.6 142 1067 1.02 Soybean – AcOH 2.7 1.6 123 1226 1.06 Soybean-HCl 2.6 1.3 136 1054 1.01 Soybean - BuOH 2.7 1.8 139 1092 1.01

23
Tensile Properties. The stress-strain curves for polyurethane films prepared with different
vegetable oils are shown in Figure 3. The modulus and toughness increase with higher
unsaturation, while the % strain decreases. It should also be noted that castor oil behaves
differently than the other vegetable oils, which is attributed to the different triglyceride
composition found in castor oil. Because castor oil primarily consists of ricinolein, the
hydroxyl groups are uniformly positioned at the 12th carbon in the chain. Therefore, castor
oil has a very homogenous distribution of hydroxyl functional groups compared to polyols
prepared from various other epoxidized vegetable oils.
0
2
4
6
8
10
12
0 50 100 150 200 250 300 350 400
Stre
ss (M
Pa)
Strain (%)
Linseed-MeOH
Castor
Corn-MeOH
Soy-MeOH
Peanut-MeOH
Figure 3. Stress-strain curves for polyurethane films from different vegetable oil polyols
The stress-strain curves for polyurethane films prepared from epoxidized soybean oils by
different ring opening methods are shown in Figure 4. The ring opening with hydrochloric
acid and acetic acid produced stronger films with a higher Young’s modulus, break strength,

24
and % strain compared to films produced by ring opening with methanol. Ring opening with
1-butanol made the films softer by significantly lowering their toughness compared to films
produced by ring opening with methanol. The tensile properties for films prepared from both
different vegetable oils and with different ring opening methods are summarized in Table 3.
0
0.5
1
1.5
2
2.5
3
0 50 100 150 200 250 300 350 400
Stre
ss (M
Pa)
Strain (%)
Soy-BuOH
Soy-AcOH
Soy-MeOH
Soy-HCl
Figure 4. Stress-strain curves for polyurethane films from soybean polyols created by different ring opening methods

25
Table 3. Summary of engineering stress data
Polyol Break Strength (MPa) Young's Modulus (MPa) Toughness (MPa) % Strain Peanut-MeOH 2.27 ± 0.03 4.64 ± 1.09 4.25 ± 0.12 343 ± 10 Corn-MeOH 3.40 ± 0.23 12.77 ± 0.83 6.02 ± 0.40 322 ± 12 Soybean-MeOH 2.14 ± 0.06 5.20 ± 0.16 4.11 ± 0.18 312 ± 5 Castor 10.61 ± 1.91 6.29 ± 0.54 15.26 ± 3.54 363 ± 39 Linseed-MeOH 7.55 ± 0.54 16.15 ± 2.13 12.72 ± 1.06 280 ± 14
Polyol Break Strength (MPa) Young's Modulus (MPa) Toughness (MPa) % Strain Soybean-MeOH 2.14 ± 0.06 5.20 ± 0.16 4.11 ± 0.18 312 ± 5 Soybean-AcOH 2.19 ± 0.33 4.81 ± 0.16 3.80 ± 0.49 392 ± 26 Soybean-HCl 2.76 ± 0.28 15.23 ± 2.19 5.60 ± 0.59 338 ± 17 Soybean-BuOH 1.13 ± 0.08 3.54 ± 0.45 2.24 ± 0.13 312 ± 11
Dynamic Mechanical Analysis (Kinetic Transition). Figure 5 shows the storage modulus
as a function of temperature for films prepared from different vegetable oils. The drop in
storage modulus generally shifted to higher temperatures with higher amounts of residual
carbon-carbon double bonds. A sharper drop in storage modulus for the film based on castor
oil compared to the other films can be attributed to the more homogeneous distribution of the
hydroxyl groups in castor oil compared to the other vegetable oils.

26
1
10
100
1000
104
-40 -20 0 20 40
Linseed - MeOHCastorCorn - MeOHSoy - MeOHPeanut - MeOH
Temperature (°C)
Sto
rage
Mod
ulus
(M P
a)
Figure 5: Storage modulus as a function of temperature for polyurethane films from different vegetable oil polyols
Figure 6 shows the storage modulus as a function of temperature for soybean polyol
films with different side groups. Both the storage modulus and the temperature at which the
storage modulus dropped increased in the following order of the side groups: 1-butanol <
acetic acid, methanol < hydrochloric acid.

27
1
10
100
1000
104
-40 -20 0 20 40
Soy - HClSoy - MeOHSoy - AcOHSoy - BuOH
Temperature (°C)
Sto
rage
Mod
ulus
(M P
a)
Figure 6: Storage modulus as a function of temperature for polyurethane films from soybean polyols created by different ring opening methods
Differential Scanning Calorimetry (Glass Transition Temperature). The glass transition
temperatures (Tg) of the polyurethane films were determined by DSC and are listed in Table
4. For films prepared from different vegetable oil polyols, the Tg increased with increasing
carbon-carbon double bond content. However, the slight variation between the films
prepared with methoxylated soybean oil polyol (Tg = –7.9 °C) and with methoxylated corn
oil polyol (Tg = –6.6 °C) are attributed to possible differences in triglyceride composition.
Based on the overall trend of increasing Tg with increasing unsaturation, the films prepared
from soybean oil polyol should have had a slightly higher Tg than those prepared from the
corn oil polyol.

28
The side chains formed by different ring opening methods have a significant effect
on the Tg. Substituting a longer butoxy side chain for the methoxy group lowered the Tg
from –7.9 °C to –26.6 °C. Changing the methoxy group to an acetoxy group raised the Tg
from –7.9 °C to 3.4 °C, and changing to a chloro group raised the Tg to 2.9 °C.
Table 4. Glass transition temperatures of polyurethane films based on DSC thermograms
Polyol Deg. of Unsat.
per Polyol Tg (°C)
Peanut - MeOH 0.4 -9.2 Corn - MeOH 1.3 -6.6 Soybean - MeOH 1.6 -7.9 Castor 3.1 6.8 Linseed - MeOH 3.5 13.5
Polyol Deg. of Unsat.
per Polyol Tg (°C)
Soybean - BuOH 1.8 -26.6 Soybean - MeOH 1.6 -7.9 Soybean - HCl 1.3 2.9 Soybean - AcOH 1.6 3.4
Thermogravimetric Analysis. The thermograms for films prepared from different
vegetable oil polyols are shown in Figure 7. They show that the higher number of residual
carbon-carbon double bonds in the linseed polyol decreased the thermal stability at lower
temperatures; however, this effect was reversed at higher temperatures.

29
0
20
40
60
80
100
0 100 200 300 400 500 600
Linseed-MeOHCastorCorn-MeOHSoy-MeOHPeanut-MeOH
Wei
ght %
Temperature (°C)
0
0.2
0.4
0.6
0.8
1
0 100 200 300 400 500 600
Linseed-MeOHCastorCorn-MeOHSoy-MeOHPeanut-MeOH
Der
iv. W
eigh
t (%
/ o C
)
Temperature (°C)
Figure 7. TGA curves for polyurethane films from different vegetable oil polyols
The thermograms for films prepared from soybean polyols by different ring opening
methods are shown in Figure 8. The films made from soybean polyols by acid ring opening
(acetic and hydrochloric acids) exhibited lower thermal stabilities at temperatures below
350 °C. However, at higher temperatures the film prepared from soybean polyol by
hydrochloric acid ring opening was more thermally stable than the other polyols.
0
20
40
60
80
100
0 100 200 300 400 500 600
Soy-HClSoy-MeOHSoy-AcOHSoy-BuOH
Wei
ght %
Temperature (°C)
0
0.1
0.2
0.3
0.4
0.5
0.6
0.7
0.8
0 100 200 300 400 500 600 700
Soy-HClSoy-MeOHSoy-AcOHSoy-BuOH
Temperature (°C)
Der
iv. W
eigh
t (%
/ o C
)
Figure 8: TGA curves for polyurethane films from soybean polyols created by different ring opening methods

30
Conclusions
Residual unsaturation has a strong influence on the mechanical and thermal properties
of specific bio-based polyurethane films. Higher amounts of residual unsaturation led to
increases in mechanical properties, such as modulus, which increased from 4.64 to 16.15
MPa; the toughness increased from 4.25 to 12.72 MPa; and the break strength increased from
2.27 to 7.55 MPa, when changing from a peanut oil-based polyol to a linseed oil-based
polyol. Correspondingly, decreases in the % strain at break from 343% to 280% were
observed. The glass transition temperatures observed by DSC increased from –9.2 to
13.5 °C.
This investigation indicates that the fatty acid composition also plays an important
role. Saturated fatty acid chains and fatty acid chains whose carbon-carbon double bonds are
not converted into ring opened oxiranes become dangling chains in the polyurethane films
and act as plasticizers. Castor oil-based polyurethane films exhibit different physical
properties. In comparison to linseed oil, the castor oil-based films exhibit higher break
strength (10.61 MPa) and toughness (15.26 MPa). Conversely, the castor oil-based
polyurethane films exhibit higher % strain at break (363%) than polyurethane films made
with peanut oil-based polyol. The differences in physical properties of castor oil-based
polyurethane films and other films based on vegetable oil polyols can be attributed to the
more homogenous distribution of hydroxyl groups in castor oil caused by its composition (>
89% ricinoleic acid).
The inconsistent results seen for similar unsaturated oils (corn and soybean) may in
part be explained by the minor differences in the compositions of the two oils. Corn oil has
more oleic acid (one carbon-carbon double bond) and less linolenic acid (three carbon-carbon
31
double bonds) than soybean oil, which render corn oil-based polyols less likely to have two
ring opened oxiranes on a single fatty acid chain and more likely to have fatty acid chains
without a single hydroxyl group compared to soybean oil-based polyols.
Our study of soybean polyols prepared by different oxirane ring opening methods
(methanol, butanol, acetic acid, and hydrochloric acid) indicates that the method of ring
opening impacts the resulting properties of the polyurethane films. In particular, increasing
the alcohol chain length (methanol vs. butanol) decreases the break strength from 2.14 to
1.13 MPa, the toughness from 4.11 to 2.24 MPa, and the Tg from –7.9 to –26.6 °C. Ring
opening with hydrochloric acid results in polyurethane films with higher Young’s modulus
than polyurethane films created by other ring opening methods, whereas ring opening with
acetic acid affords a film with a higher Tg.
Acknowledgements
We gratefully acknowledge financial support from the Consortium for Plant
Biotechnology Research (CPBR) and the Archer Daniels Midland (ADM) Company. We
also thank Mr. Joel Nott and Ms. Margie Carter of the Protein Facility at Iowa State
University for their assistance with the MALDI-TOF measurements.
References
1. R. B. Seymour and G. B. Kauffman, J. Chem. Educ., 1992, 69, 909. 2. R. Amari, Paint Manufacturing in the US, IBISWorld Inc., 2012. 3. U. Meier-Westhues, Polyurethanes - Coatings, Adhesives and Sealants, Vincentz
Network, Hannover, Germany, 2007. 4. K. D. Weiss, Prog. Polym. Sci., 1997, 22, 203. 5. Z. W. Wicks, Jr., F. N. Jones, S. P. Pappas and D. A. Wicks, Organic Coatings:
Science and Technology, John Wiley & Sons, Inc., Hoboken, NJ, 2007. 6. B. K. Kim, Colloid Polym. Sci., 1996, 274, 599. 7. J. Bourne, Surf. Coat. Int., 2009, 92, 244. 8. D. L. Greene, J. L. Hopson and J. Li, Energ. Policy, 2006, 34, 515.

32
9. D. Fantazzini, M. Höök and A. Angelantoni, Energ. Policy, 2011, 39, 7865. 10. International Energy Agency, World Energy Outlook 2012, Paris, France, 2012. 11. Ø. Harsem, A. Eide and K. Heen, Energ. Policy, 2011, 39, 8037. 12. U.S. Department of Energy, Annual Energy Outlook 2012 with Projections to 2035,
Washington, DC, 2012. 13. Y. Lu and R. C. Larock, in Green Polymer Chemistry: Biocatalysis and Biomaterials,
American Chemical Society, 2010, vol. 1043, pp. 87-102. 14. Y. Xia and R. C. Larock, Green Chem., 2010, 12, 1893. 15. Z. S. Petrovic, Polym. Rev., 2008, 48, 109. 16. V. D. Athawale and R. V. Nimbalkar, J. Disper. Sci. Technol., 2011, 32, 1014. 17. Y. Lu and R. C. Larock, Biomacromolecules, 2008, 9, 3332. 18. A. Zlatanić, C. Lava, W. Zhang and Z. S. Petrović, J. Polym. Sci. Pol. Phys., 2004,
42, 809. 19. M. A. R. Meier, J. O. Metzger and U. S. Schubert, Chem. Soc. Rev., 2007, 36, 1788. 20. D. D. Andjelkovic, M. Valverde, P. Henna, F. Li and R. C. Larock, Polymer, 2005,
46, 9674. 21. D. S. Ogunniyi, Bioresour. Technol., 2006, 97, 1086. 22. E. Marengo, M. Bobba, E. Robotti and M. Lenti, Anal. Chim. Acta, 2004, 511, 313. 23. H. Pasch and W. Schrepp, MALDI-TOF Mass Spectrometry of Synthetic Polymers,
Springer, Berlin, 2003. 24. G. Klärner, C. Former, K. Martin, J. Räder and K. Müllen, Macromolecules, 1998,
31, 3571. 25. J. R. Fried, Polymer Science & Technology, Prentice Hall Professional Technical
Reference, Upper Saddle River, NJ, 2003. 26. H. Räder and W. Schrepp, Acta Polym., 1998, 49, 272. 27. A. Marie, F. Fournier and J. C. Tabet, Anal. Chem., 2000, 72, 5106. 28. C. A. Jackson and W. J. Simonsick Jr, Curr. Opin. Solid St. M., 1997, 2, 661. 29. E. d. Hoffmann and V. Stroobant, Mass Spectrometry: Principles and Applications.,
John Wiley & Sons Ltd, West Sussex, England, 2007. 30. G. R. Asbury, K. Al-Saad, W. F. Siems, R. M. Hannan and H. H. Hill, Jr., J. Am. Soc.
Mass Spectr., 1999, 10, 983. 31. D. Dogruel, R. W. Nelson and P. Williams, Rapid Commun. Mass Sp., 1996, 10, 801. 32. M. W. F. Nielen and S. Malucha, Rapid Commun. Mass Sp., 1997, 11, 1194. 33. G. Montaudo, M. S. Montaudo, C. Puglisi and F. Samperi, Rapid Commun. Mass Sp.,
1995, 9, 453. 34. ASTM International, Standard Test Method for Molecular Mass Averages and
Molecular Mass Distribution of Atactic Polystyrene by Matrix Assisted Laser Desorption/Ionization (MALDI)-Time of Flight (TOF) Mass Spectrometry (MS), West Conshohocken, PA, 2005.
35. G. Montaudo, D. Garozzo, M. S. Montaudo, C. Puglisi and F. Samperi, Macromolecules, 1995, 28, 7983.
36. A. Guo, Y. Cho and Z. S. Petrović, J. Polym. Sci. Pol. Chem., 2000, 38, 3900. 37. Y. Lu and R. C. Larock, Biomacromolecules, 2007, 8, 3108. 38. M. Thunga, Y. Xia, U. Gohs, G. Heinrich, R. C. Larock and M. R. Kessler,
Macromol. Mater. Eng., 2012, 297, 799.

33
39. F. A. Zaher, M. H. El-Mallah and M. M. El-Hefnawy, J. Am. Oil Chem. Soc., 1989, 66, 698.
40. ASTM International, Standard Test Method for Hydroxyl Value of Fatty Oils and Acids, West Conshohocken, PA, 2001.

34
CHAPTER 3. MECHANICAL AND ANTIBACTERIAL PROPERTIES OF SOYBEAN-OIL-BASED CATIONIC POLYURETHANE COATINGS: EFFECTS OF
AMINE RATIO AND DEGREE OF CROSSLINKING
A paper submitted to Biomacromolecules
Authors: Thomas F. Garrison1, Zongyu Zhang2, Hyun-Joong Kim2, Debjani Mitra2, Ying Xia1, Daniel P. Pfister1, Byron F. Brehm-Stecher2, Richard C. Larock*1 and Michael R. Kessler*3
1 Department of Chemistry, Iowa State University, Ames, Iowa 2 Department of Food Science and Human Nutrition , Iowa State University, Ames, Iowa 3 Department of Materials Science and Engineering, Iowa State University, Ames, Iowa
Abstract
Soybean oil-based cationic polyurethane coatings with antibacterial properties have
been prepared with different molar ratios of an amine diol and with soy polyols with different
hydroxyl numbers. All of the cationic PU dispersions and films exhibit inhibitory activity
against three foodborne pathogens: Salmonella Typhimurium, Listeria monocytogenes, and
Staphylococcus aureus. It is generally observed that increases in the ratio of ammonium
cations improve the antibacterial performance. Reduction of the crosslink density by
decreasing the hydroxyl number of the soy polyol also results in slightly improved
antibacterial properties. Higher glass transition temperatures and improved mechanical
properties are observed with corresponding increases in the molar ratios of the amine diol
and the diisocyanate. These results show that the mechanical properties of these coatings can
be tuned, while maintaining good antibacterial activity.

35
Introduction
In the past few years, there has been an increased interest in the use of various
agricultural commodities as biorenewable alternatives to petroleum for the synthesis of
plastic materials.1,2 Long-term concerns about the cost and availability of petroleum supplies
have been driving factors behind this push for sustainability.3 In particular, plant-based oils
are commonly used as renewable raw materials as these are readily available, generally
inexpensive, are biodegradable and have low toxicities, among other advantages.4,5
Polyurethanes are especially amenable to use of biorenewable plant-based oils as raw
materials.6 Polyurethanes comprise an important class of polymers and are used widely
throughout industry in foams, coatings, adhesives and cast elastomers.7 In particular,
waterborne polyurethane dispersions (PUDs) have garnered substantial interest as
environmentally-friendly coatings.8-10 Waterborne PUDs have significant advantages over
PUDs manufactured using traditional organic solvents. Specifically, aqueous systems are
more cost effective than organic-based approaches and the use of water as a solvent reduces
or even eliminates the emission of harmful volatile organic compounds.11,12 More recently,
the development of waterborne PUDs made with biorenewable oils has become the focus of
research into environmentally-friendly protective and/or decorative coatings.13-15
To date, anionic waterborne PUDs are more prevalent, both in industry and in the
literature, than cationic PUDs.11 Typically, anionic PUDs are prepared by incorporating a
diol or polyol that also contains a carboxylic acid group, such as dimethylolpropionic acid
(DMPA), into the polymer backbone. The PU is then neutralized with a tertiary amine such
as triethylamine (TEA) and dispersed in water. Anionic polyurethane dispersions have been

36
successfully prepared using 50-60 wt% vegetable oil polyols.14 However, a key disadvantage
of anionic PUDs is their lack of antimicrobial activity.
In contrast, cationic PUDs, which are prepared by incorporating a tertiary amine diol
or polyol followed by treatment with an acid, are seldom used commercially. One potential
advantage of cationic PUDs is that they have been found to exhibit excellent adhesion
properties.11,16-18 However, the antimicrobial properties of cationic PUDs are of much greater
interest.18 Cationic compounds are able to bind to bacteria and other microbes and disrupt
cell structure, resulting in permeabilization and death. For example, other polymer coatings
that contain amine groups, certain cationic peptides, and chitosan, which is a positively-
charged carbohydrate polymer derived from crustacean shells, are all known to be
antimicrobial.19 Recently, an aqueous coating using chitosan was reported; however,
drawbacks of this technique include its complexity, the need for electrografting, and the
limited solubility of chitosan.20
Our group has previously reported novel cationic polyurethane dispersions from
vegetable oil-based polyols.16 A further study from our group examined the effects of the
hydroxyl functionality of the soybean oil-based polyols on the thermal and mechanical
properties of cationic polyurethanes.17 We recently reported the first study on the effect of
different polyols on the antibacterial properties of cationic plant-oil based PUDs and PU
coatings.21 In the current work, environmentally-friendly, plant oil-based, cationic PUDs
with excellent coating properties have been successfully synthesized from soybean oil-based
polyols. We examined the effects of the molar ratio of the tertiary amine diol N-methyl
diethanolamine (MDEA) used and the effects of crosslink density on the thermo-mechanical
properties and antibacterial properties of PUDs and PU films. The antibacterial properties of

37
these materials have been evaluated using the disk diffusion assay against Listeria
monocytogenes and Salmonella enterica serovar Typhimurium, the two most common
causative agents of bacterial foodborne illnesses.22,23 We have also performed disk diffusion
tests using methicillin-resistant Staphylococcus aureus (MRSA), which is resistant to
antibiotics commonly used to treat staphylococcal infections. MRSA infection may occur
after invasive surgical procedures, such as the implantation of a medical device (hospital-
acquired MRSA) or as a topical infection through person-to-person transmission among
those in close physical contact, such as wrestlers or care providers (community-acquired
MRSA). A food-related route for transmission of MRSA has also been reported - a
community-acquired outbreak of acute gastroenteritis that was traced to contamination of
foods by an asymptomatic food worker.24 Further, MRSA has been detected in raw meat
samples (beef, pork, chicken, turkey) at levels ranging from 0.7% - 35.5%.25 Together, these
data indicate that food workers or the food supply could represent additional reservoirs for
the transmission of MRSA.
The antibacterial properties of the cationic plant oil based PUDs and PU films examined
here suggest their potential value as coatings for surfaces in food processing or healthcare
environments or as elements in food packaging for pathogen control. Our results also indicate
that the thermal and mechanical properties of these novel cationic PU films can be tuned,
while maintaining their antibacterial properties.
Experimental
Materials. Soybean oil was purchased at the local supermarket and used directly.
Methoxylated soybean polyols (MSOL) with hydroxyl numbers of 140, 155, and 174 mg
KOH/g were synthesized as previously reported.14 Dimethylolpropionic acid (DMPA), N-

38
methyl diethanolamine (MDEA), isophorone diisocyanate (IPDI), and dibutyltin dilaurate
(DBTDL) were purchased from Aldrich Chemical Company (Milwaukee, WI, USA).
Glacial acetic acid and methyl ethyl ketone (MEK) were purchased from Fisher Scientific
Company (Fair Lawn, NJ, USA). All materials were used as received.
Synthesis of the Soybean Oil-based Cationic PUDs. The IPDI, MSOL, and MDEA were
added to a three-necked flask equipped with a mechanical stirrer, condenser, and
thermometer. The molar ratio of NCO groups from IPDI was varied from 2.0 to 2.75. The
molar ratio of OH groups from MSOL was kept constant at 1.0, while the molar ratio of OH
groups from MDEA varied from 0.95 to 1.7 (corresponding to the NCO molar ratio of IPDI).
One drop of DBTDL was added to the reaction mixture. The reaction was first carried out at
80 °C for 10 minutes and then MEK (50 wt% based on the reactant) was added to reduce the
viscosity. After 2 h reaction, the reactants were then cooled to room temperature and
neutralized by the addition of 1.5 equivalents of acetic acid, followed by dispersion at high
speed with distilled water to produce the cationic PUD with a solid content of about 12.5
wt% after removal of the MEK under vacuum. The corresponding PU films were obtained
by drying the resulting dispersions at room temperature in polystyrene petri dishes. As a
control to confirm the role of cationic charge in the PUD antibacterial activity, a plant oil-
based anionic dispersion was prepared using DMPA as previously reported.14 The molar
ratios for the anionic PUD control were 2.0 NCO from IPDI, 1.0 OH from MSOL, and 0.95
OH from DMPA. The chemical structure of the starting materials and a representative
polymer structure are shown in Scheme 1. The nomenclature used for the various PUD
samples and their composition is listed in Table 1, where the letter (A, B, or C) corresponds

39
to the MSOL hydroxyl number and the number (1, 2, or 3) corresponds to different molar
ratios of IPDI and MDEA.
Scheme 1. Polymer structure of the cationic plant-oil based polyurethane
Water
80 oC, DBTDL,MEK
IPDI
NCO
O
OO
O O
O
4
34
O
H3COMSOL
OCH3HOOCH3HO
NCONHO OH
MDEA
O
OO
O O
O
4
34
O
H3CO O
OCH3OOCH3O
ONH
NH
ONHO O N
H
HN
O
NH
O
Polymer chain
Acetic Acid
CH3COO
NH
CH3COO
Soy oil-based cationic aqueous polyurethane dispersions
CH3COO

40
Table 1. Sample nomenclature and composition.
Molar Ratios of Functional Groups
Sample Name Polyol OH Number
(mg KOH / g) OH Groups
Polyol OH Groups
MDEA NCO Groups
(IPDI)
A1-ANa 140 1.00 0.95b 2.00
A1 140 1.00 0.95 2.00 B1 155 1.00 0.95 2.00 B2 155 1.00 1.45 2.47 B3 155 1.00 1.70 2.75 C1 174 1.00 0.95 2.00
a A1-AN: an anionic version of PUD A1, used as a control for the cationic nature of the PU antibacterial activity. b DMPA was used instead of MDEA
Thermal and Mechanical Analysis. The dynamic mechanical behavior of the PUDs was
characterized using a dynamic mechanical analyzer (TA Instruments DMA Q800, New
Castle, DE) in tensile mode at 1 Hz. The samples were heated from −70 to 100 °C at a rate
of 5 °C/min. For this study, the glass transition temperatures (Tg) were determined from the
onset temperatures of the decrease in storage modulus. Differential scanning calorimetry
(DSC) was performed using a differential scanning calorimeter (TA Instruments DSC Q20,
USA). The samples were heated from 25 to 80 °C at a rate of 20 °C/min to erase their
thermal history, cooled to −70 °C, and heated again to 100 °C at a heating rate of 20 °C/min.
The sample mass was approximately 4 mg. A thermogravimetric analyzer (TA Instruments
TGA Q50, USA) was used to measure the weight loss of the PUDs in an air atmosphere. The
samples were heated from 30 to 650 °C at a heating rate of 20 °C/min. The mass of the
samples used for TGA analysis was approximately 8 mg.
41
Bacterial Strains and Growth Conditions. The test cultures, Salmonella enterica serovar
Typhimurium ATCC 13311 and Staphylococcus aureus ATCC BAA-44 (methicillin-
resistant) were acquired from the American Type Culture Collection (ATCC, Manassas, VA,
USA). Listeria monocytogenes NADC 2045 was from the USDA National Animal Disease
Center (NADC, Ames, IA). Cultures were maintained as frozen stocks at −80 °C in Tryptic
Soy Broth (TSB, BD Diagnostics Systems, Sparks, MD) containing 20% (v/v) glycerol.
Working cultures of these bacteria were maintained on Tryptic Soy Agar (TSA) plates.
Strains were grown in TSB for 18 h at 35 °C and the optical densities of the resulting
bacterial cultures were measured spectrophotometrically (model DU720, Beckman Coulter).
The relationship between absorbance at 600 nm (A600) and plate counts was determined for
cultures adjusted to A600 values of 0.1 (108 CFU mL-1) or 1.0 (109 CFU mL-1) using fresh
TSB. This relationship was used in subsequent experiments to prepare working bacterial
suspensions in TSB or 0.85% saline containing 106 CFU mL-1 (for disk diffusion tests) or
105 CFU mL-1 (for Bioscreen and PU film leaching tests).
Antibacterial Testing. Disk diffusion tests. The antibacterial properties of both PU
dispersions and dried films cast onto sterile paper disks (polymer-fiber composites) were
examined against all three test organisms, as described previously, using Clinical and
Laboratory Standards Institute (CLSI) methods.21
Additional testing with S. Typhimurium. To obtain more detailed information on the relative
efficacy and mechanism of action for select PU films, further testing was performed beyond
the initial disk diffusion work using S. Typhimurium, an organism we found in previous
work to have higher intrinsic resistance to PUDs and PU films.21 Specifically, the two most
active PU films from the disk diffusion work, along with the negative control polymer A1-

42
anionic (abbreviated hereafter as “A1-AN”), were examined for their potential to leach
antibacterial components into liquid media. We also sought to examine the impact of PU
films on the physical integrity and viability of S. Typhimurium suspensions. These
experiments are described in greater detail below.
Leaching of antibacterial components from dried films. To determine whether or not
substantial leaching of antibacterial material from cast films could occur, the following
experiment was performed. Two hundred microliters of each test PUD (A1-AN, B2 and B3)
were added to separate 8 mL sterile screwcap tubes and allowed to air dry in a sterile
biological safety cabinet for 2 days, yielding tubes containing dried films at the bottom. The
abilities of these films to affect the growth of S. Typhimurium in media added to these tubes
was examined visually using a resazurin-based test. Briefly, 3 mL of TSB inoculated with S.
Typhimurium (105 CFU mL-1) was added to tubes containing each film type. As a positive
control, the same amount of cell culture was also added to an unmodified sterile tube (no
PUD film). An uninoculated tube of sterile TSB served as a negative control. After
incubation at 35 °C for 20 hours, the oxidation-reduction indicator resazurin (alamarBlue®,
Trek Diagnostic Systems, Cleveland, OH) was added into each tube to visually test the
inhibitory effects of leaching components from PU films.26 Briefly, when live, metabolically
active cells were present, the dye underwent a color change from blue to pink. In media to
which no cells were added or where cell viability was reduced or eliminated, the dye
remained blue.
As another means for examining the degree of leaching of active PU film components
into liquids, we exposed sterile bacterial growth media to the three types of PU films, then
examined the subsequent ability of each medium to support growth of S. Typhimurium.

43
Briefly, 3 mL of sterile TSB was added to tubes containing each type of film, prepared as
described above. As a control, the same volume of TSB was added to an unmodified sterile
tube (no PUD film). All tubes were incubated for 3 days at 35 °C, allowing any diffusible
components of the film to partition into the TSB medium. PUD-exposed and control media
were collected and dispensed into individual wells of a Bioscreen C Microbiological Reader
plate (Growth Curves, USA, Piscawatay, NJ). Wells were inoculated with S. Typhimurium
(105 CFU mL-1) and the plates were incubated for 24 h at 35 °C in the Bioscreen, with
absorbance readings taken every 15 min at 600 nm. To examine the potential impact of heat
exposure on the nutrient content of TSB during the 3 day leaching period, fresh TSB was
also tested in parallel with the other treatments.
Assay for intracellular leakage from PUD-exposed Salmonella. The impact of PUD
exposure on the physical integrity of S. Typhimurium was examined using a
spectrophotometric assay for leakage of intracellular components. Briefly, an overnight
culture of S. Typhimurium was harvested and cells were suspended in 0.85% saline at a
concentration of 109 CFU mL-1. One milliliter aliquots of this suspension were added to
screwcap tubes coated with A1-AN, B2 or B3 PUD films or, as a control for the effects of
saline alone, to an unmodified sterile tube (no PUD film). These were incubated for up to 24
h at 35 °C. After 1, 3, 5, 7 or 24 hours exposure, 100 µL portions were removed for analysis.
These were diluted in 200 µL 0.85% saline and centrifuged for 6 min at 16,600 x g to ensure
that the supernatant contained only macromolecular material released during PU film
exposure. Two hundred microliters of this clarified supernatant were removed to a new
centrifuge tube and the absorbance read at 260 nm using a BioMate 3 spectrophotometer
(Thermo Fisher Scientific, Waltham, MA).27 Appropriate blanks were used to control for

44
any potential contribution of PUD material to UV absorbance. Viability testing was also
carried out in parallel at each timepoint. Briefly, PUD-containing tubes were vortexed to
suspend cells and aliquots were taken, serially diluted into 0.85% saline and viable cells
quantified using the track dilution method.28 The relationship between the rate of leakage of
UV-absorbing intracellular material and the death rate for S. Typhimurium was plotted using
the combined spectrophotometric and plate count data from the 3 h, 5 h and 7 h timepoints,
during which OD increased in a linear fashion. Briefly, the slope for each OD curve over this
initial 4 h period was calculated for the three PU films, and these data were plotted against
the death rate (log10 reduction hr-1).29 This plot provides another means for ordering the PU
films in terms of their efficacy against S. Typhimurium.
Results and Discussion
Thermal and Mechanical Properties. Dynamic mechanical analysis (DMA) was used to
elucidate the thermal and mechanical properties of the PU films. The results are summarized
in Tables 2 and 3. As the relative molar ratio of MDEA increases, the Tg increases from 14.3
to 20.0 °C (see Table 2). Likewise, the storage modulus at room temperature (25 °C)
increased from 126.1 to 406.8 MPa. The PU films with higher amounts of MDEA, a chain
extender, have improved mechanical properties because the increases also correspond to
increases in overall hard segment content supplied by the IPDI.14 Likewise, increasing the
hydroxyl numbers of the soy polyol while keeping the overall molar ratios between NCO and
OH constant, raises the crosslink density of the PU films.14 This is demonstrated by the
increase in the Tg from 3.0 to 17.8 °C as the hydroxyl number changes from 140 to 174 mg
KOH/g (see Table 3). The storage modulus at 25 °C increased from 21.0 to 211.6 MPa. The
trends from increasing MSOL hydroxyl number and from increasing MDEA and IPDI molar

45
ratios are illustrated together for the storage modulus in Figure 1 and for the glass transition
temperature in Figure 2. Additionally, as a reference, one anionic PU film with DMPA
instead of MDEA was evaluated. The anionic PU had a much higher Tg (20.6 vs 3.0 °C) and
storage modulus at 25 °C (305.3 vs 21.0 MPa) compared to the cationic PU sample with the
same IPDI molar ratios due to the physical differences between DMPA and MDEA.
Differential scanning calorimetery (DSC) was also used to examine the thermal properties of
the PU films (data not shown). The thermograms for the films showed single, but broad
glass transition temperatures that are consistent with amorphous (non-crystalline) polymers.
Table 2. Comparison of DMA and TGA data of PU films with different ratios of MDEA.
TGA Data Sample OH Ratio
from MDEA wt%
MDEA Tg
(°C)a E’ at 25 °C
(MPa) T5
(°C) T50
(°C) Tmax
(°C) B1 0.95 8.83 14.3 126.1 248.2 360.4 350.1 B2 1.45 11.95 16.7 219.5 195.5 348.9 346.3 B3 1.70 13.18 20.0 406.8 192.9 347.8 349.0
a Tg based on onset of storage modulus
Table 3. Comparison of DMA and TGA data of PU films with different hydroxyl numbers.
TGA DATA Sample OH Number wt%
MDEA Tg (°C)a
E’ at 25 °C (MPa)
T5
(°C) T50
(°C) Tmax
(°C) A1-ANb 140 -- 20.6 305.3 170.4 351.7 384.5 A1 140 8.32 3.0 21.0 246.3 355.3 342.2 B1 155 8.83 14.3 126.1 248.2 360.4 350.1 C1 174 9.41 17.8 211.6 215.6 306.3 284.6
a Tg based on onset of storage modulus b A1-AN. This PUD has the same structural backbone as PUD A1, but is anionic. A1-AN serves here as a negative control, confirming that a cationic charge is required for antibacterial activity.

46
Figure 1. Storage modulus at 25 °C for PU films with different compositions.
Figure 2. Glass transition temperatures for PU films with different compositions
0.95 (1)1.45 (2)
1.70 (3)
0
50
100
150
200
250
300
350
400
450
MSOL Hydroxyl Number
0.95 (1)1.45 (2)
1.70 (3)
0
5
10
15
20
MSOL Hydroxyl Number
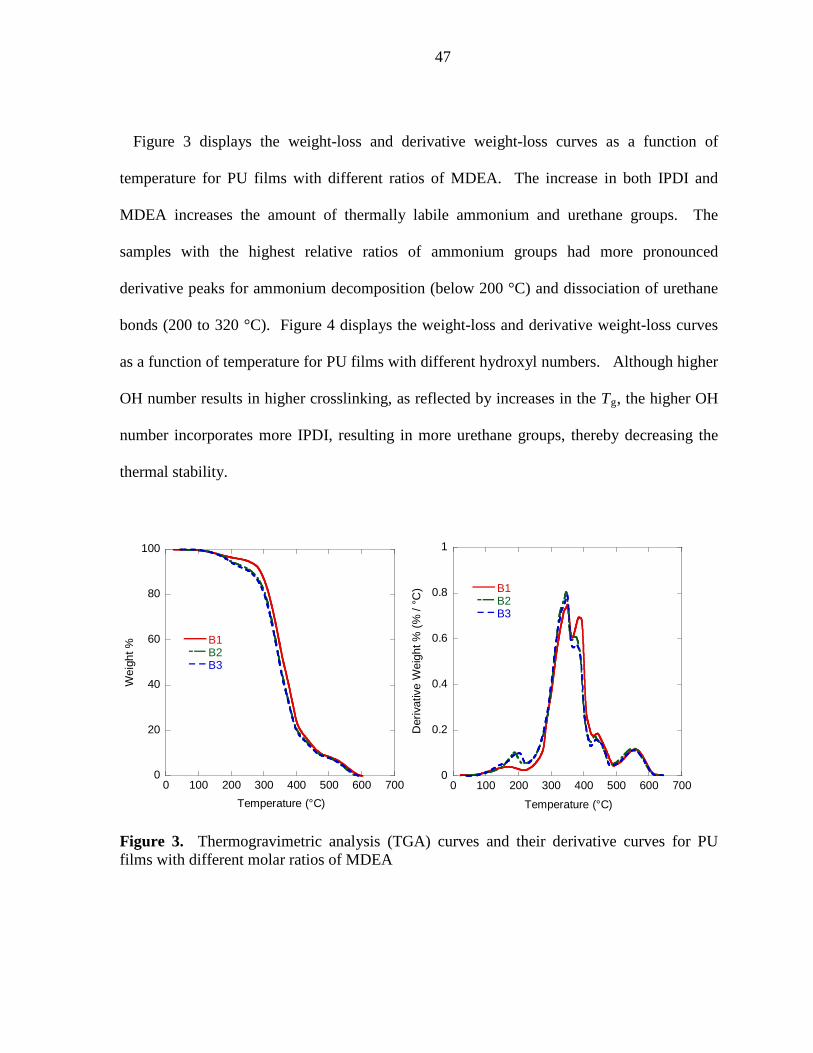
47
Figure 3 displays the weight-loss and derivative weight-loss curves as a function of
temperature for PU films with different ratios of MDEA. The increase in both IPDI and
MDEA increases the amount of thermally labile ammonium and urethane groups. The
samples with the highest relative ratios of ammonium groups had more pronounced
derivative peaks for ammonium decomposition (below 200 °C) and dissociation of urethane
bonds (200 to 320 °C). Figure 4 displays the weight-loss and derivative weight-loss curves
as a function of temperature for PU films with different hydroxyl numbers. Although higher
OH number results in higher crosslinking, as reflected by increases in the Tg, the higher OH
number incorporates more IPDI, resulting in more urethane groups, thereby decreasing the
thermal stability.
Figure 3. Thermogravimetric analysis (TGA) curves and their derivative curves for PU films with different molar ratios of MDEA
0
20
40
60
80
100
0 100 200 300 400 500 600 700
B1B2B3
Wei
ght %
Temperature (°C)
0
0.2
0.4
0.6
0.8
1
0 100 200 300 400 500 600 700
B1B2B3
Der
ivat
ive
Wei
ght %
(% /
°C)
Temperature (°C)

48
Figure 4. Thermogravimeteric analysis (TGA) curves and their derivative curves for PU films with different hydroxyl numbers.
Antibacterial Properties. Based on the results of disk diffusion tests for PU dispersions and
films, as the MDEA OH molar ratio increased from 0.95 to 1.45 (samples B1 to B2), zones
of inhibition also increased significantly (see Table 4). These results indicate that
antibacterial properties increase as the relative concentration of quaternary ammonium
groups in the polymer backbone increases (from 8.8 wt% to 12.0 wt% MDEA for B2 and B3,
respectively). However, there was no significant difference between B2 (MDEA OH molar
ratio of 1.45) and B3 (MDEA molar ratio of 1.7) in this assay. This can be attributed to the
smaller change in the concentration of quaternary ammonium groups from B2 to B3 (12 wt%
MDEA to 13.2 wt% MDEA).
0
20
40
60
80
100
0 100 200 300 400 500 600 700
A1-ANA1B1C1
Wei
ght P
erce
nt (%
)
Temperature (°C)
0
0.2
0.4
0.6
0.8
1
0 100 200 300 400 500 600 700
A1-ANA1B1C1
Der
ivat
ive
Wei
ght %
(% /
°C)
Temperature (°C)

49
Table 4. Summary of disk diffusion testing
L. monocytogenes NADC 2045
S. Typhimurium ATCC 13311 S. aureus ATCC BAA-44
ZOIa (diameter in mm) ZOIa (diameter in mm) ZOIa (diameter in mm)
Dispersion Film Dispersion Film Dispersion Film
A1-ANb None None None None None None
A1 11.65 ± 0.22 11.12 ± 0.12 9.75 ± 0.16 9.04 ± 0.21 9.74 ± 0.16 9.28 ± 0.16
B1 10.79 ± 0.17 10.48 ± 0.27 9.15 ± 0.17 8.18 ± 0.23 9.18 ± 0.12 8.35 ± 0.13
B2 11.94 ± 0.15 11.43 ± 0.13 10.48 ± 0.22 9.57 ± 0.21 10.68 ± 0.16 10.23 ± 0.28
B3 11.92 ± 0.32 11.33 ± 0.17 10.29 ± 0.12 9.56 ± 0.29 10.74 ± 0.18 10.00 ± 0.06
C1 10.93 ± 0.27 10.23 ± 0.19 9.11 ± 0.11 8.02 ± 0.16 9.63 ± 0.13 8.56 ± 0.11
a ZOI: Zone of Inhibition b A1-AN. This PUD has the same structural backbone as PUD A1, but is anionic. A1-AN serves here as a negative control, confirming that a cationic charge is required for antibacterial activity.
The polyurethanes made with polyols with larger hydroxyl values have an increased
crosslink density as a result of the higher hydroxyl functionality. By changing the hydroxyl
functionality while keeping the molar ratios of MDEA constant, samples prepared from
polyols with larger hydroxyl values have slightly higher quaternary ammonium
concentrations. However, PU sample A1, which had the lowest hydroxyl number (140 mg
KOH/g) and the lowest quaternary ammonium concentration (8.3 wt% MDEA), showed
better antibacterial properties than the corresponding samples B1 and C1 with higher
hydroxyl numbers and higher quaternary ammonium concentrations. This trend indicates
that the polymers with lower crosslink densities have better antimicrobial properties. The
higher molecular mobility of these less crosslinked polymers likely enhances effective
physical interaction with target bacteria, resulting in a net increase in antibacterial activity.
The same relative trend of antibacterial activity was observed for all three strains
tested in our disk diffusion assay. L. monocytogenes was most susceptible to the PUDs and

50
PU films tested, and S. Typhimurium was the least susceptible (p<0.05). The greater
resistance of Salmonella to PUD activity can be explained by the outer membrane (OM) of
this Gram-negative bacterium, which serves as an additional permeability barrier to
exogenous compounds. The absence of an OM in Gram-positive bacteria such as L.
monocytogenes and S. aureus allows more ready uptake of antimicrobials by these bacteria
and is consistent with earlier findings by Xia et al.21
By their very nature, the disk diffusion tests indicated that dried films were capable of
releasing diffusible antibacterial material into the agar medium. In practical use, the mobility
of material from films could be problematic for food-related applications, where chemical
residues are not desirable. Therefore, we sought to examine the potential importance of
leaching from cast films in more detail. In these tests, the most active PUs (B2 and B3) were
examined further against S. Typhimurium in liquid systems using both qualitative and
quantitative assays. Figure 5 shows that PU film B3 could effectively inhibit the growth of
this pathogen inoculated at 105 CFU ml-1 into TSB. Although PU B2 did not prevent growth
of S. Typhimurium under these conditions, it did possess good antibacterial activity, as
determined by the disk diffusion and cell leakage assays. This underlines the importance of
using multiple types of analyses when evaluating and ranking antimicrobial activity. The
negatively-charged A1-AN did not show antibacterial activity, as expected given the known
relationship between cationic charge and antimicrobial efficacy. While the results of this
assay suggest that diffusible polymer elements could be responsible for the growth inhibition
seen, it is also possible that inactivation of cells could have resulted through direct contact
with the film at the bottom of the tubes. The test for leaching (Figure 6) shows that
antibacterial components were able to diffuse from films into TSB held for 3 days at 35°C

51
and exert their activities in solution. This assay also provides clear corroboration that A1-AN
is not inhibitory, and that both B2 and B3 are antibacterial, with B3 being the most active.
The greater activity of B3 indicates that the molar ratio of MDEA had an impact on
antibacterial activity.
Figure 5. Visual demonstration of bacterial inhibition in tubes containing PU films. The following treatments were examined: 1. negative control (uninoculated TSB, no PU coatings), 2. Positive control (no PU coatings), 3. A1-AN coating (negative control), 4. B2 coating, 5. B3 coating. Treatments 2-5 were inoculated with S. Typhimurium ATCC 13311 at 105 CFU mL-1.

52
Figure 6. Results of antibacterial leaching assay. Effects of the following treatments on growth of S. Typhimurium ATCC 13311 in TSB were examined in a Bioscreen C automated turbidimeter: fresh, untreated TSB; TSB pre-incubated for 3 days at 35°C; and TSB incubated for 3 days at 35°C in the presence of the films A1-AN, B2 and B3, respectively. Absorbance was measured at 600 nm. Decreased absorbance indicates suppression of bacterial growth.
Based on the known action of other cationic antimicrobials, we expected that the
PUDs and their films might exert their antibacterial activities by causing gross physiological
damage to bacterial cells. We tested this hypothesis by assaying for leakage of UV-absorbent
materials (i.e. DNA, proteins, other macromolecules) from bacterial cells and into the
surrounding medium. Our results from the intracellular leakage assay agreed with those of
the film leaching assay, with A1-AN yielding little more damage to cells than did exposure to
saline alone, and polymers B2 and B3 causing a steady increase in loss of intracellular
contents to the medium (Figure 7a). These results confirm that antibacterial components
capable of permeabilizing this Gram-negative bacterial pathogen are able to leach into liquids
0
0.2
0.4
0.6
0.8
1
1.2
1.4
0 4 8 12 16 20 24
Fresh TSBTSB, 35°C, no PUA1-AN, 35°C B2, 35°CB3, 35°C
OD
600
Time (h)

53
from these PU films. Figure 7b shows that over the 24 h period, exposure to B2 and B3 films
resulted in a ~4-log reduction in viable cells. Conversely, exposure to the A1-AN film, as
with saline alone, did not cause cell death. These results mirror those of the UV leakage
assay, demonstrating that increasing exposure of S. Typhimurium cells to diffusible elements
from the cationic PU films results in increased permeability, loss of cellular contents and cell
death. The relationship between the rate of leakage of UV-absorbent material and the cell
death rate over the period extending from 3 h to 7 h exposure is plotted in Figure 7c. This
plot demonstrates that B3 was the most effective antibacterial film, followed by B2, and
finally by A1-AN, which was not antibacterial.

54
Figure 7. PU film-mediated leakage of intracellular components from S. Typhimurium ATCC 13311. Cells were suspended in 0.85% saline at 109 CFU mL-1 and exposed to tubes coated with films A1-AN, B2 or B3 as described in Materials and Methods. Leakage of UV-absorbing intracellular components was followed over a 24 h period at 260 nm. Increases in UV-absorbance indicated physical permeabilization of cells and leakage of cellular macromolecules.
a. Absorbance vs. time for cell suspensions exposed to saline alone (control) or tubes containing PU films A1-AN, B2 or B3.
b. Viability vs. time for cell suspensions analyzed in Fig 7a. PU film-exposed cell suspensions were plated in parallel with absorbance readings.
c. Relationship between rate of leakage at 260 nm and death rate for S. Typhimurium ATCC 13311 exposed to PU films A1-AN, B2 or B3. Data were plotted from the initial period of linear OD increase extending from hours 3 to 7.
0
0.2
0.4
0.6
0.8
1
1.2
1.4
0 5 10 15 20 25
ControlA1-ANB2B3
OD
260
Time (h)
2
3
4
5
6
7
8
9
10
0 5 10 15 20 25
ControlA1-ANB2B3
Log
CFU
mL-1
Time (h)
0
0.1
0.2
0.3
0.4
0.5
0.6
0.7
0 0.02 0.04 0.06 0.08 0.1 0.12 0.14
Dea
th R
ate
(Log
10 R
educ
tion
/ h)
Initial change of OD260
/ h
A1-AN
B2
B3
R2 = 0.9955

55
Conclusions
Soybean-oil based cationic PUDs have been prepared with three different relative
compositions of ammonium cations. Additionally, cationic PUDs were prepared using soy
polyols with three different hydroxyl numbers. The glass transition temperatures and room-
temperature storage moduli both increased with the increase in MDEA and IPDI molar ratios,
as well as with increases in the hydroxyl number of the soy polyol. All of the cationic PUDs
were found to have inhibitory activity against three foodborne pathogens, Salmonella
Typhimurium, Listeria monocytogenes, and methicillin-resistant Staphylococcus aureus.
Increasing the relative ratio of ammonium cations improved the antibacterial properties,
however the results show that this effect may level out around 12 wt% MDEA. This
observed trend was consistent across the different bacterial strains. This investigation shows
promising results in that the mechanical properties of environmentally-friendly, soy-based
cationic PUDs can be tuned while maintaining their antibacterial activity. Antibacterial
components were able to diffuse from these films into liquid media, exerting their activities
in solution. These components caused death of S. Typhimurium through disruption of the
barrier structures responsible for keeping cellular macromolecules inside and exogenous
molecules outside (the outer membrane and cell membrane, for example). These PUDs and
PU films were active against L. monocytogenes and S. Typhimurium, the two leading
bacterial causes of foodborne disease outbreaks, and against methicillin-resistant S. aureus,
an important clinical pathogen with emerging relevance to food safety. Together, our results
indicate that these PUDs and PU films are effective antibacterial materials with mechanical
and physical properties that can be tailored to meet the needs of specific applications.
Because we demonstrated diffusive loss of antibacterial material from PU films, additional
56
work is required to determine the suitability of these materials for applications involving
direct contact with foods. However, additional non-contact uses are possible, such as coating
of shipping pallets used in food storage or shipping operations, which have been implicated
as points of harborage for human pathogens.
Acknowledgments
We gratefully acknowledge financial support from the Consortium for Plant
Biotechnology Research (CPBR) and the Archer Daniels Midland (ADM) Company.
References
1. M. Desroches, M. Escouvois, R. Auvergne, S. Caillol and B. Boutevin, Polym. Rev., 2012, 52, 38.
2. M. A. R. Meier, J. O. Metzger and U. S. Schubert, Chem. Soc. Rev., 2007, 36, 1788. 3. A. Gandini, Macromolecules, 2008, 41, 9491. 4. Y. Xia and R. C. Larock, Green Chem., 2010, 12, 1893. 5. R. P. Wool and S. N. Khot, ASM International, 2001, 184. 6. Z. S. Petrovic, Polym. Rev., 2008, 48, 109. 7. J. K. Fink, Reactive Polymer Fundamentals and Applications: A Concise Guide to
Industrial Polymers, William Andrew Publishing, Norwich, NY, 2005. 8. H. Fu, H. Huang, Q. Wang, H. Zhang and H. C. HQ, J. Disper. Sci. Technol., 2009,
30, 634. 9. V. García-Pacios, V. Costa, M. Colera and J. M. Martín-Martínez, Prog. Org. Coat.,
2011, 71, 136. 10. V. García-Pacios, V. Costa, M. Colera and J. Miguel Martín-Martínez, Int. J. Adhes.
Adhes., 2010, 30, 456. 11. B. K. Kim, Colloid Polym. Sci., 1996, 274, 599. 12. B. K. Kim and J. C. Lee, J. Polym. Sci. Pol. Chem., 1996, 34, 1095. 13. A. Patel, C. Patel, M. G. Patel, M. Patel and A. Dighe, Prog. Org. Coat., 2010, 67,
255. 14. Y. Lu and R. C. Larock, Biomacromolecules, 2008, 9, 3332. 15. V. D. Athawale and R. V. Nimbalkar, J. Disper. Sci. Technol., 2011, 32, 1014. 16. Y. Lu and R. C. Larock, ChemSusChem, 2010, 3, 329. 17. Y. Lu and R. C. Larock, Prog. Org. Coat., 2010, 69, 31. 18. S. Sundar, N. Vijayalakshmi, S. Gupta, R. Rajaram and G. Radhakrishnan, Prog.
Org. Coat., 2006, 56, 178. 19. C. Campos, L. N. Gerschenson and S. Flores, Food Bioprocess Tech., 2011, 4, 849. 20. M. Cécius and C. Jérôme, Prog. Org. Coat., 2011, 70, 220. 21. Y. Xia, Z. Zhang, M. R. Kessler, B. Brehm-Stecher and R. C. Larock,
ChemSusChem, 2012, 5, 2221.

57
22. E. Scallan, R. M. Hoekstra, F. J. Angulo, R. V. Tauxe, M. A. Widdowson, S. L. Roy, J. L. Jones and P. M. Griffin, Emerg. Infect. Dis, 2011, 17, 7.
23. W. Zhang, J.-X. Zheng and G.-Y. Xu, J. Food Sci., 2011, 76, R76. 24. T. F. Jones, M. E. Kellum, S. S. Porter, M. Bell and W. Schaffner, Emerg. Infect. Dis,
2002, 8, 82. 25. A. M. O'Brien, B. M. Hanson, S. A. Farina, J. Y. Wu, J. E. Simmering, S. E. Wardyn,
B. M. Forshey, M. E. Kulick, D. B. Wallinga and T. C. Smith, PLoS One, 2012, 7. 26. R. K. Pettit, C. A. Weber, M. J. Kean, H. Hoffmann, G. R. Pettit, R. Tan, K. S. Franks
and M. L. Horton, Antimicrob. Agents Chemother., 2005, 49, 2612. 27. R. Virto, P. Manas, I. Alvarez, S. Condon and J. Raso, Appl. Environ. Microbiol.,
2005, 71, 5022. 28. B. D. Jett, K. L. Hatter, M. M. Huycke and M. S. Gilmore, Biotechniques, 1997, 23,
648. 29. A. F. Mendonca, T. L. Amoroso and S. J. Knabel, Appl. Environ. Microbiol., 1994,
60, 4009.
58
CHAPTER 4. EFFECTS OF COUNTERIONS ON THE PHYSICAL AND ANTIMICROBIAL PROPERTIES OF CASTOR OIL-BASED CATIONIC
POLYURETHANE COATINGS
Introduction
Aqueous polyurethane dispersions (PUDs) are highly useful coating materials that
have found widespread applications in coatings, adhesives, paper sizings, and textiles.1,2 The
resulting polyurethane films are known for their toughness, tensile strength, abrasion
resistance, and excellent film forming properties.3,4 Furthermore, waterborne coatings,
including polyurethane dispersions, have significant advantages over conventional solvent-
borne coatings as a result of regulations restricting the emissions of volatile organic
compounds from organic solvents.3,5,6
Conventional polyurethanes are hydrophobic and require either the use of external
emulsifiers or large shear forces to disperse in water.3,7 However, polyurethanes can be
readily dispersed or dissolved in water by incorporating hydrophilic copolymers, called
ionomers, into the polyurethane chains. Ionomers contain functional groups, such as acids
or tertiary nitrogen groups, that can be neutralized or quaternized, respectively, to form salts.8
The extent of neutralization or quaternation, which can range from partial to complete
neutralization, has been shown to impact the stability and particle size of the PUDs.9,10 A
higher degree of neutralization has been found to increase the tensile strength, modulus and
glass transition temperature due to increased interchain interactions and hydrogen bonding.11
Ionomers can be classified by the charges incorporated in the main polymer chain:
anioniomers (negatively charged), cationomers (positively charged), and zwitterionomers
(both positive and negatively charged).3,7,12 The majority of commercial PUDs use anionic

59
ionomers.7,13 In particular, dimethylolpropanoic acid (DMPA) has been one of the most
widely used anionomers for PUDs.10,13
Anionic PUDs have been extensively studied, including a number of investigations
focused on the role of the counterion.14 The studies have shown that the counterion does
influence the thermal and mechanical properties of the polyurethane films, particularly the
thermal stabilities.14 A variety of bases have been used as countercations in anionic PUDs,
including amines and metal hydroxides.15,16 Increased ionization of the carboxylic acid
groups has been shown to decrease the onset temperature of decomposition in anionic
PUDs.16 Neutralization of anionomers with metal hydroxides has yielded films with
increased initial thermal stabilities due to the involatility of the metal carboxylate
products.14,16,17 Degradation of thermally labile ionomers, such as phosphate groups, has
been shown to be dependent on the neutralizing base.14,17 Increases in the ionic potential of
countercations has corresponded to increased tensile strength, decreased elongation at break,
and decreased particle size when anionic PUDs were neutralized with different metal
hydroxides and amines.15 The glass transition temperature has also been shown to be
impacted by counterions.12,18
More recently, cationic PUDs are gaining attention because of the antimicrobial
activity of quaternary amines.19-21 In particular, antimicrobial cationic polyurethane coatings
are well suited for paper coating applications since cationic polymers strongly adhere to fiber
surfaces.22 Cationic PUDs are typically synthesized by reacting diisocyanates with nitrogen-
containing alkyl diols, such as N-methyldiethanolamine (MDEA).14,23,24 The nitrogen atoms
are subsequently quaternized, either by protonation with acids or by an SN2 reaction with
alkyl halides, to produce the ionic groups.19,24,25 Previously, our group has examined the

60
effect of different amino polyols on the thermal, mechanical, and antimicrobial properties of
vegetable oil-based cationic PUDs.20 Our group has also investigated the effects of MDEA
molar ratios and different hydroxyl numbers of soybean oil-based polyols on vegetable oil-
based cationic PUDs.26
In the current study, the effect of the counteranion on the thermal, mechanical, and
antimicrobial properties of cationic castor oil-based PUDs and their films has been evaluated
for the first time. Previous studies on the effect of counterions have been largely limited to
countercations of anionic ionomers. The cationic castor oil-based PUDs have been prepared
from seven different carboxylic acids: formic acid, acetic acid, propanoic acid, butanoic acid,
isobutyric acid, acrylic acid, and lactic acid. In this study, the effect of carboxylic acid chain
length has been examined as the carboxylic acids range in size from one to four carbons
(formic acid < acetic acid < propanoic acid < butanoic acid). Furthermore, the effect of
substitutents (hydrogen, hydroxyl, or methyl group) and unsaturation has been examined as
shown in Figure 1. The biorenewable castor oil-based coatings reported in this study appear
promising for applications requiring antimicrobial functionalized surfaces.
Figure 1. Structure of various carboxylic acids used to neutralize the amino groups
O
OH
X
O
OH
X = H (propanoic acid), OH (lactic acid),or CH3 (isobutanoic acid)
acrylic acid
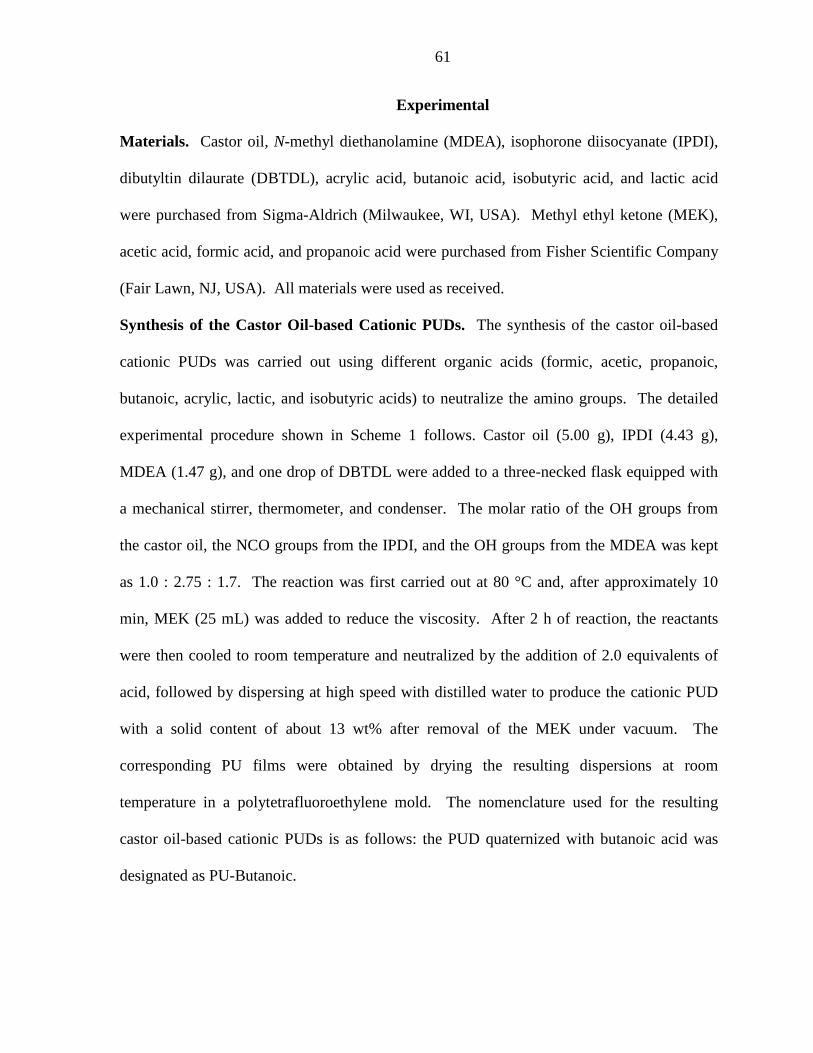
61
Experimental
Materials. Castor oil, N-methyl diethanolamine (MDEA), isophorone diisocyanate (IPDI),
dibutyltin dilaurate (DBTDL), acrylic acid, butanoic acid, isobutyric acid, and lactic acid
were purchased from Sigma-Aldrich (Milwaukee, WI, USA). Methyl ethyl ketone (MEK),
acetic acid, formic acid, and propanoic acid were purchased from Fisher Scientific Company
(Fair Lawn, NJ, USA). All materials were used as received.
Synthesis of the Castor Oil-based Cationic PUDs. The synthesis of the castor oil-based
cationic PUDs was carried out using different organic acids (formic, acetic, propanoic,
butanoic, acrylic, lactic, and isobutyric acids) to neutralize the amino groups. The detailed
experimental procedure shown in Scheme 1 follows. Castor oil (5.00 g), IPDI (4.43 g),
MDEA (1.47 g), and one drop of DBTDL were added to a three-necked flask equipped with
a mechanical stirrer, thermometer, and condenser. The molar ratio of the OH groups from
the castor oil, the NCO groups from the IPDI, and the OH groups from the MDEA was kept
as 1.0 : 2.75 : 1.7. The reaction was first carried out at 80 °C and, after approximately 10
min, MEK (25 mL) was added to reduce the viscosity. After 2 h of reaction, the reactants
were then cooled to room temperature and neutralized by the addition of 2.0 equivalents of
acid, followed by dispersing at high speed with distilled water to produce the cationic PUD
with a solid content of about 13 wt% after removal of the MEK under vacuum. The
corresponding PU films were obtained by drying the resulting dispersions at room
temperature in a polytetrafluoroethylene mold. The nomenclature used for the resulting
castor oil-based cationic PUDs is as follows: the PUD quaternized with butanoic acid was
designated as PU-Butanoic.
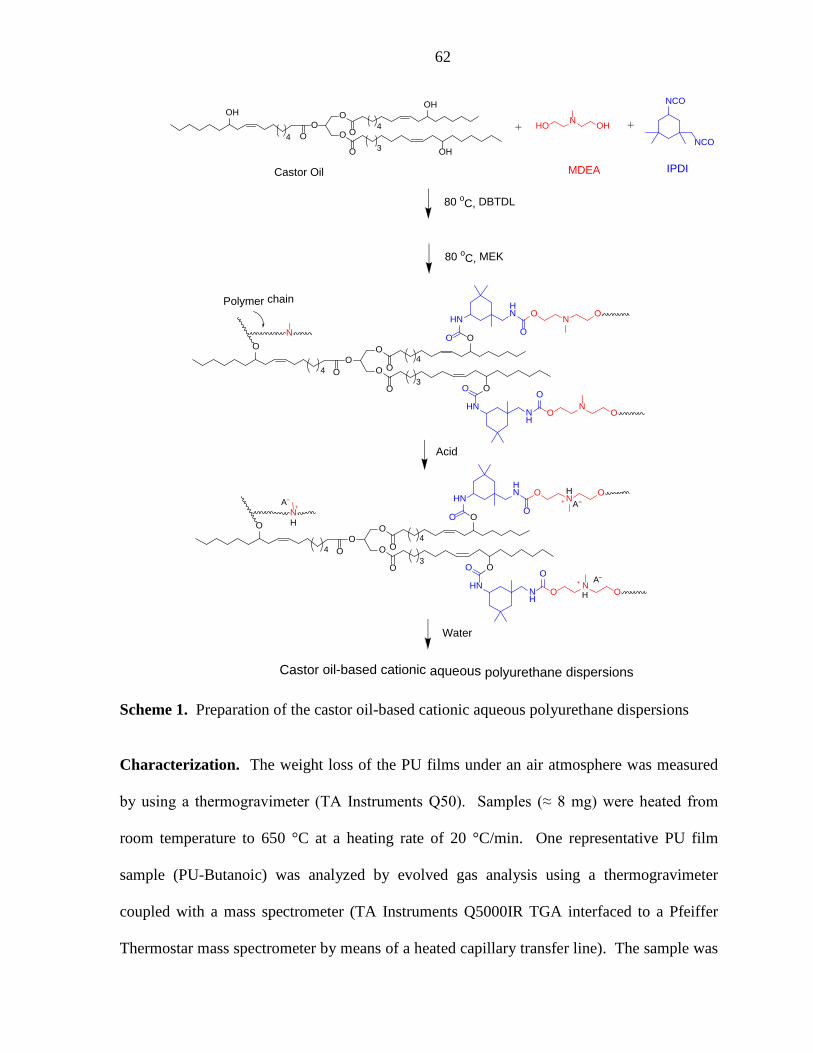
62
Scheme 1. Preparation of the castor oil-based cationic aqueous polyurethane dispersions
Characterization. The weight loss of the PU films under an air atmosphere was measured
by using a thermogravimeter (TA Instruments Q50). Samples (≈ 8 mg) were heated from
room temperature to 650 °C at a heating rate of 20 °C/min. One representative PU film
sample (PU-Butanoic) was analyzed by evolved gas analysis using a thermogravimeter
coupled with a mass spectrometer (TA Instruments Q5000IR TGA interfaced to a Pfeiffer
Thermostar mass spectrometer by means of a heated capillary transfer line). The sample was
Water
80 oC, MEK
NHO OH
MDEA
Polymer chain
Castor oil-based cationic aqueous polyurethane dispersions
Castor Oil
O
OO
O O
O
OHOH
44
3 OH
O
OO
O O
O3
OO
HN O
ON O
44
N
Acid
NCO
NCO
HN
O
O
NH
O
ON
OHN
O
O
OO
O O
O3
OO
HN O
O
HN O
44
NH
HN
O
O
NH
O
ON
OHN
O
A
H
A
A
IPDI
80 oC, DBTDL

63
kept isothermal at room temperature for 30 minutes and then heated from room temperature
to 1000 °C at 20 °C/min. The capillary transfer line was heated to 195 °C. The Thermostar
unit is based on a quadrapole design and the masses scanned ranged from 1-200 amu. The
sample gas from the TGA was ionized at 70 eV. The purge gas was 25 mL/min nitrogen
through the furnace and 10 mL/min nitrogen through the balance. The dynamic mechanical
properties of the PU films were characterized by means of a dynamic mechanical analyzer
(TA Instruments DMA Q800, New Castle, DE) using a film tension mode of 1 Hz in the
temperature range from - 60 to 100 °C with a heating rate of 5 °C / min. Rectangular samples
with dimensions of 10 mm × 8 mm × 0.5 mm were used for the analysis. DSC analysis of
the PU films was performed by means of a thermal analyzer (TA Instruments Q2000). PU
samples (≈ 5 mg) were cut from the film and heated from room temperature to 100 °C to
erase the thermal history. The samples were then equilibrated at -70 °C and heated to 150 °C
at a heating rate of 20 °C/min. The Tg of PU films was determined from the midpoint in the
heat-capacity change in the second DSC scan.
Results and Discussion
Themogravimetric Analysis. The thermal degradation of polyurethanes is a complex
process and thermal stability measurements are strongly dependent on the characterization
methods.27 Polyurethanes with different structures are known to exhibit different thermal
stabilities.17 Previous research has reported three decomposition stages for vegetable oil-
based cationic polyurethane dispersions: initial decomplexation of the ammonium groups,
followed by decomposition of thermally labile urethane bonds, and then the decomposition
of the fatty acids.20 The initial decomposition of the ammonium groups primarily occurs
below 200 °C, which was confirmed by thermogravimetric analysis combined with mass
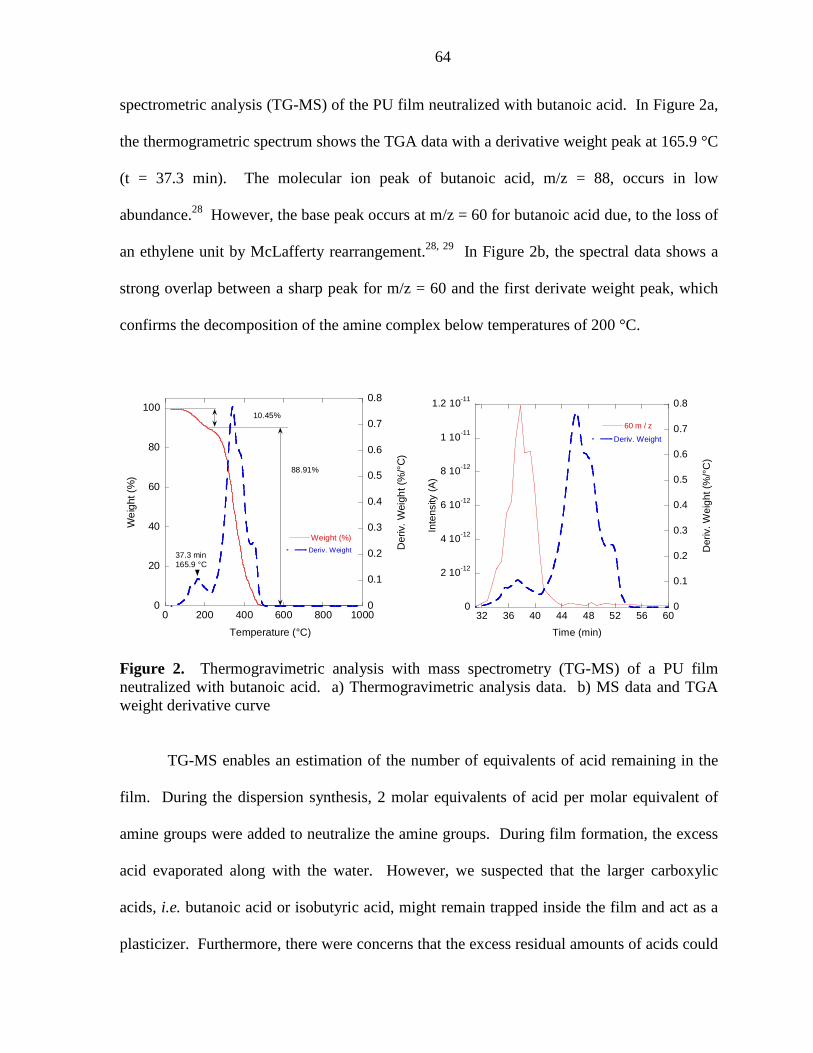
64
spectrometric analysis (TG-MS) of the PU film neutralized with butanoic acid. In Figure 2a,
the thermogrametric spectrum shows the TGA data with a derivative weight peak at 165.9 °C
(t = 37.3 min). The molecular ion peak of butanoic acid, m/z = 88, occurs in low
abundance.28 However, the base peak occurs at m/z = 60 for butanoic acid due, to the loss of
an ethylene unit by McLafferty rearrangement.28, 29 In Figure 2b, the spectral data shows a
strong overlap between a sharp peak for m/z = 60 and the first derivate weight peak, which
confirms the decomposition of the amine complex below temperatures of 200 °C.
Figure 2. Thermogravimetric analysis with mass spectrometry (TG-MS) of a PU film neutralized with butanoic acid. a) Thermogravimetric analysis data. b) MS data and TGA weight derivative curve
TG-MS enables an estimation of the number of equivalents of acid remaining in the
film. During the dispersion synthesis, 2 molar equivalents of acid per molar equivalent of
amine groups were added to neutralize the amine groups. During film formation, the excess
acid evaporated along with the water. However, we suspected that the larger carboxylic
acids, i.e. butanoic acid or isobutyric acid, might remain trapped inside the film and act as a
plasticizer. Furthermore, there were concerns that the excess residual amounts of acids could
0
20
40
60
80
100
0
0.1
0.2
0.3
0.4
0.5
0.6
0.7
0.8
0 200 400 600 800 1000
Weight (%)Deriv. Weight D
eriv
. Wei
ght (
%/°
C)
Temperature (°C)
88.91%
10.45%
37.3 min165.9 °C
Wei
ght (
%)
0
2 10-12
4 10-12
6 10-12
8 10-12
1 10-11
1.2 10-11
0
0.1
0.2
0.3
0.4
0.5
0.6
0.7
0.8
32 36 40 44 48 52 56 60
60 m / z
Deriv. WeightIn
tens
ity (A
)
Time (min)
Der
iv. W
eigh
t (%
/°C
)
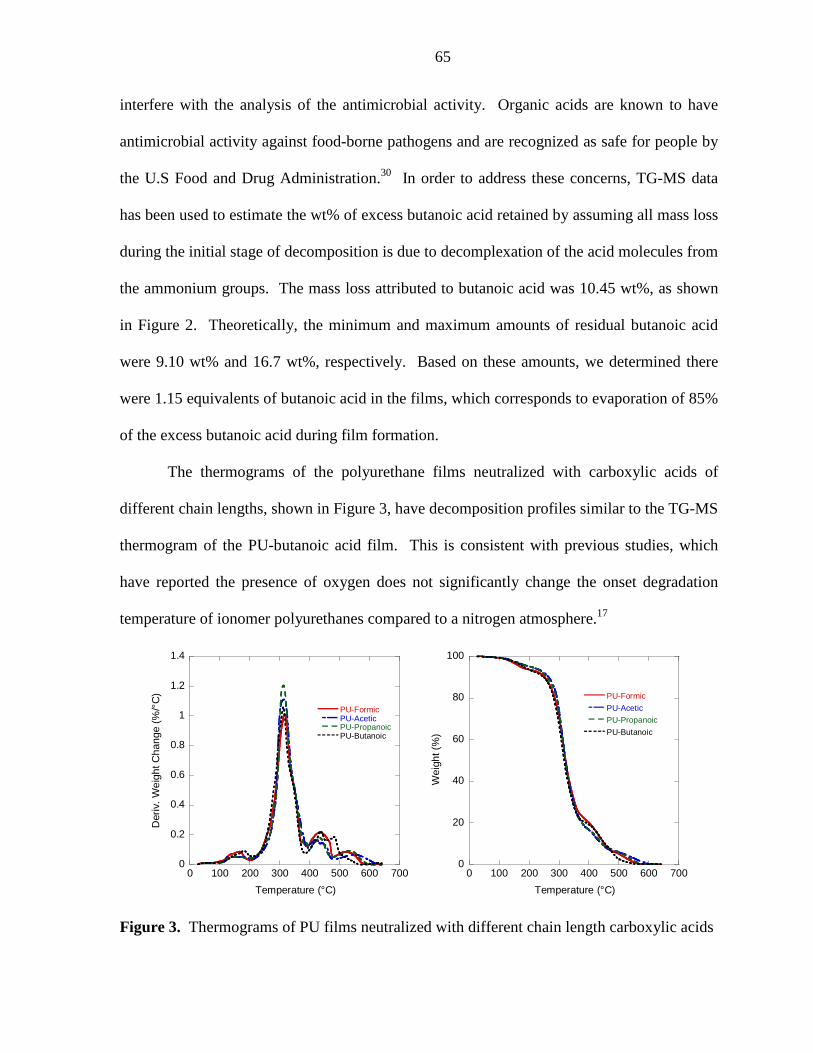
65
interfere with the analysis of the antimicrobial activity. Organic acids are known to have
antimicrobial activity against food-borne pathogens and are recognized as safe for people by
the U.S Food and Drug Administration.30 In order to address these concerns, TG-MS data
has been used to estimate the wt% of excess butanoic acid retained by assuming all mass loss
during the initial stage of decomposition is due to decomplexation of the acid molecules from
the ammonium groups. The mass loss attributed to butanoic acid was 10.45 wt%, as shown
in Figure 2. Theoretically, the minimum and maximum amounts of residual butanoic acid
were 9.10 wt% and 16.7 wt%, respectively. Based on these amounts, we determined there
were 1.15 equivalents of butanoic acid in the films, which corresponds to evaporation of 85%
of the excess butanoic acid during film formation.
The thermograms of the polyurethane films neutralized with carboxylic acids of
different chain lengths, shown in Figure 3, have decomposition profiles similar to the TG-MS
thermogram of the PU-butanoic acid film. This is consistent with previous studies, which
have reported the presence of oxygen does not significantly change the onset degradation
temperature of ionomer polyurethanes compared to a nitrogen atmosphere.17
Figure 3. Thermograms of PU films neutralized with different chain length carboxylic acids
0
0.2
0.4
0.6
0.8
1
1.2
1.4
0 100 200 300 400 500 600 700
PU-FormicPU-AceticPU-PropanoicPU-Butanoic
Der
iv. W
eigh
t Cha
nge
(%/°
C)
Temperature (°C)
0
20
40
60
80
100
0 100 200 300 400 500 600 700
PU-FormicPU-AceticPU-PropanoicPU-Butanoic
Wei
ght (
%)
Temperature (°C)
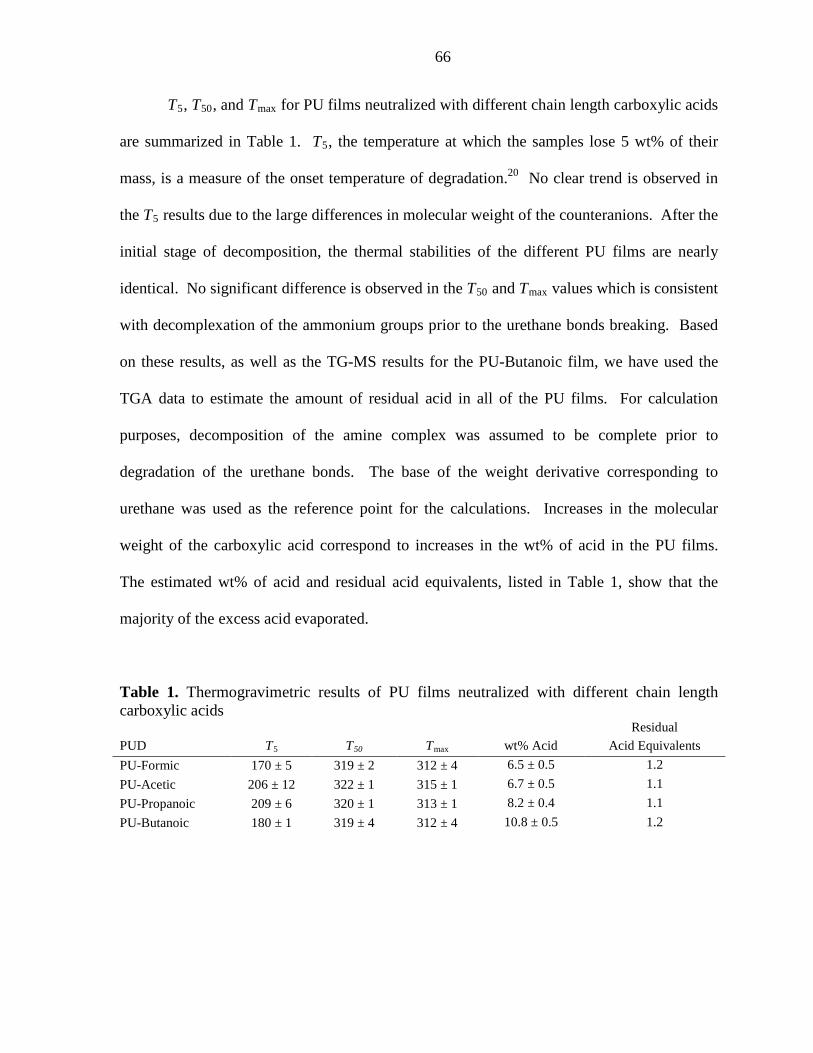
66
T5, T50, and Tmax for PU films neutralized with different chain length carboxylic acids
are summarized in Table 1. T5, the temperature at which the samples lose 5 wt% of their
mass, is a measure of the onset temperature of degradation.20 No clear trend is observed in
the T5 results due to the large differences in molecular weight of the counteranions. After the
initial stage of decomposition, the thermal stabilities of the different PU films are nearly
identical. No significant difference is observed in the T50 and Tmax values which is consistent
with decomplexation of the ammonium groups prior to the urethane bonds breaking. Based
on these results, as well as the TG-MS results for the PU-Butanoic film, we have used the
TGA data to estimate the amount of residual acid in all of the PU films. For calculation
purposes, decomposition of the amine complex was assumed to be complete prior to
degradation of the urethane bonds. The base of the weight derivative corresponding to
urethane was used as the reference point for the calculations. Increases in the molecular
weight of the carboxylic acid correspond to increases in the wt% of acid in the PU films.
The estimated wt% of acid and residual acid equivalents, listed in Table 1, show that the
majority of the excess acid evaporated.
Table 1. Thermogravimetric results of PU films neutralized with different chain length carboxylic acids
PUD T5
T50 Tmax
wt% Acid Residual
Acid Equivalents PU-Formic 170 ± 5 319 ± 2 312 ± 4 6.5 ± 0.5 1.2 PU-Acetic 206 ± 12 322 ± 1 315 ± 1 6.7 ± 0.5 1.1 PU-Propanoic 209 ± 6 320 ± 1 313 ± 1 8.2 ± 0.4 1.1 PU-Butanoic 180 ± 1 319 ± 4 312 ± 4 10.8 ± 0.5 1.2

67
Substituents on the carbon chain of the carboxylic acids have a more pronounced
impact on the initial thermal stabilities and residual acid content of the PU films than the
chain length of the carboxylic acid chains. The thermograms of the PU films with different
substituents on the carboxylic acid carbon chains are shown in Figure 4 and the
thermogravimetric data is summarized in Table 2. For this series of acids, the T5 results can
be used to compare onset temperatures since the range of molecular weights between
propanoic acid, acrylic acid, isobutyric acid is smaller (74 g/mol for propanoic acid to 90
g/mol for lactic acid). The initial thermal stability and onset temperature of the PU-Lactic
and PU-Acrylic films are significantly lower than those of the PU-Propanoic film. These
observations are not explained by differences in molecular weight alone, as evidenced by the
higher amounts of residual acid. For the PU-Lactic film, hydrogen bonding between the
hydroxyl group on the lactic acid molecules and the polymer chain is a likely factor. Also,
the sharp increase in the derivative weight peak around 100 °C indicates that the PU-Lactic
film retained more water than other films. For the PU-Acrylic film, the carbon-carbon
double bond makes acrylic acid more rigid than propanoic acid, which could explain the
increased retention of acid in the corresponding PU film.

68
Figure 4. Thermograms of polyurethane films neutralized with carboxylic acids containing different substituents
Table 2. Thermograms of polyurethane films neutralized with carboxylic acids containing different substituents
PUD T5
T50 Tmax
wt% Acid
Residual Acid Equivalents
PU-Propanoic 209 ± 6 320 ± 1 313 ± 1 8.2 ± 0.4 1.1 PU-Acrylic 172 ± 1 328 ± 3 323 ± 4 10.0 ± 0.3 1.3 PU-Lactic 151 ± 3 311 ± 1 323 ± 4 15.8 ± 0.3 1.5
PU-Isobutyric 180 ± 3 320 ± 1 313 ± 1 10.8 ± 0.2 1.2
Dynamic Mechanical Analysis. The mechanical properties of all of the PU films have been
investigated by dynamic mechanical analysis. For PU films neutralized with different chain
length carboxylic acids, the resulting storage modulus (E’) and tan delta curves are shown in
Figure 5a and 4b, respectively. At low temperatures, the cationic coatings are glassy. The
storage modulus decreases rapidly in the temperature range from 20 – 50 °C. The tan delta
peaks are recorded as Tg values in Table 3. Generally, the storage modulus at room
temperature (Table 3) and Tg decreases as the carboxylic acid chain length increases.
0
20
40
60
80
100
0 100 200 300 400 500 600 700
PU-PropanoicPU-AcrylicPU-LacticPU-Isobutyric
Wei
ght (
%)
Temperature (°C)
0
0.2
0.4
0.6
0.8
1
1.2
1.4
0 100 200 300 400 500 600 700
PU-PropanoicPU-AcrylicPU-LacticPU-Isobutyric
Der
iv. W
eigh
t Cha
nge
(%/°
C)
Temperature (°C)

69
Figure 5. DMA curves for PU films neutralized with different chain length carboxylic acids. a) Storage modulus versus temperature, and b) Tan delta versus temperature.
Table 3: DSC and DMA data for PU films neutralized with different chain length carboxylic acids
PU Film Tga (°C)
Tg
b (°C) E’ at 25 °C
(MPa) PU-Formic 39.7 4.4 132.5 PU-Acetic 40.1 2.4 242.6 PU-Propanoic 36.8 -2.8 57.9 PU-Butanoic 33.7 -2.9 44.6
a Glass transition temperature obtained from DMA analysis. b Glass transition temperature obtained from DSC analysis
Figure 6 shows the storage modulus-temperature curves and the tan delta curves for
PU films neutralized with carboxylic acids containing different substituents. The DMA data
is summarized in Table 4. The values for the storage modulus at room temperature indicate
that the sharp drop in the storage modulus for the PU-Lactic and PU-Acrylic films is shifted
to higher temperatures. The PU-Lactic and PU-Acrylic films also exhibit higher Tg values
than the PU-Propanoic film. The increased Tg value for the PU-Lactic film is consistent with
0.1
1
10
100
1000
104
-60 -40 -20 0 20 40 60
PU-FormicPU-AceticPU-PropanoicPU-Butanoic
Sto
rage
Mod
ulus
(MP
a)
Temperature (°C)
0
0.2
0.4
0.6
0.8
1
1.2
1.4
1.6
-60 -40 -20 0 20 40 60
PU-FormicPU-AceticPU-PropanoicPU-Butanoic
Tan
Del
ta
Temperature (°C)

70
the presence of hydrogen bonding by the counterion. The Tg value for the PU-Isobutyric
film is slightly lower than the Tg for the PU-Propanoic film, which can be attributed to steric
contributions of the counterion.
Figure 6. DMA curves for PU films neutralized with carboxylic acids containing different substituents. a) Storage modulus versus temperature and b) Tan delta versus temperature
Table 4. DSC and DMA data for PU films neutralized with carboxylic acids containing different substituents.
PU Film
Tga (°C) Tg
b (°C) E' at 25 °C
(MPa) PU-Isobutyric 36.32 -3.2 45.9 PU-Propanoic 36.82 -2.8 57.9 PU-Acrylic 48.1 2.0 139.1 PU-Lactic 44.4 10.5 517.8
a Glass transition temperature obtained from DMA analysis. b Glass transition temperature obtained from DSC analysis
Differential Scanning Calorimetry. The Tg values obtained by DSC analyses are lower
than those obtained from the DMA tan delta peaks due to inherent differences in the two
0.1
1
10
100
1000
104
-60 -40 -20 0 20 40 60
PU-PropanoicPU-AcrylicPU-LacticPU-Isobutyric
Sto
rage
Mod
ulus
(MP
a)
Temperature (°C)
0
0.5
1
1.5
2
-60 -40 -20 0 20 40 60
PU-PropanoicPU-AcrylicPU-LacticPU-Isobutyric
Tan
Del
ta
Temperature (°C)

71
techniques.31 The Tg values obtained from DSC follow the same general trends as observed
by DMA for all of the PU films. The Tg values for PU films neutralized with different chain
length carboxylic acids and for PU films neutralized with carboxylic acids containing
different substituents are listed in Tables 3 and 4, respectively. The DSC curves for all of the
PU films are shown in Figure 7.
-80 -40 0 40 80
PU-FormicPU-AceticPU-PropanoicPU-Butanoic
0.5 W / g
Rel
ativ
e H
eat F
low
(W/g
) E
xo
Temperature (°C)
-80 -40 0 40 80
PU-PropanoicPU-AcrylicPU-LacticPU-Isobutanoic
Rel
ativ
e H
eat F
low
(W/g
) E
xo
Temperature (°C)
0.5 W / g
Figure 7. DSC curves for a) PU films neutralized with different chain length carboxylic acids and b) PU films neutralized with carboxylic acids containing different substituents
Conclusions
Castor oil-based cationic polyurethane dispersions (PUDs) have been prepared by
neutralizing the intermediate amines with seven different carboxylic acids. Increases in the
chain length of the counterions slightly decrease the Tg values of the PU films. Substituents
on the counterion appear to have a larger impact than the carbon chain length. In particular,
hydrogen bonding increased the Tg. value and storage modulus at room temperature of the
PU-Lactic films. After initial decomposition, the thermal stabilities of all of the PU films

72
were very similar. However, the PU-Lactic film exhibited significantly lower initial thermal
stability due to excess water and residual acid in the film. Promising results from the
preliminary antimicrobial testing conducted (data not shown) indicate that selection of the
counterion plays a role in the antimicrobial properties of the cationic PU films. This work
will be submitted for publication after the antimicrobial testing is completed.
Acknowledgements
We gratefully acknowledge financial support from the Consortium for Plant
Biotechnology Research (CPBR) and the Archer Daniels Midland (ADM) Company. We
also thank Dr. Quentin Lineberry of the Institute for Combustion Science & Environmental
Technology at Western Kentucky University for his assistance with the TG-MS
measurement.
References
1. D.-K. Lee, H.-B. Tsai, H.-H. Wang and R.-S. Tsai, J. Appl. Polym. Sci., 2004, 94, 1723. 2. B. K. Kim, T. K. Kim and H. M. Jeong, J. Appl. Polym. Sci., 1994, 53, 371. 3. K.-L. Noble, Prog. Org. Coat., 1997, 32, 131. 4. A. Overbeek, J. Coat. Technol. Res., 2010, 7, 1. 5. Y. S. Kwak, S. W. Park and H. D. Kim, Colloid Polym. Sci., 2003, 281, 957. 6. H. Rajan, P. Rajalingam and G. Radhakrishnan, Polym. Commun., 1991, 32, 93. 7. B. K. Kim, Colloid Polym. Sci., 1996, 274, 599. 8. I. W. Cheong, M. Nomura and J. H. Kim, Macromol. Chem. Phys., 2000, 201, 2221. 9. J.-E. Yang, J.-S. Kong, S.-W. Park, D.-J. Lee and H.-D. Kim, J. Appl. Polym. Sci., 2002,
86, 2375. 10. J. Bullermann, S. Friebel, T. Salthammer and R. Spohnholz, Prog. Org. Coat., 2013,
76, 609. 11. B. K. Kim and Y. M. Lee, Colloid Polym. Sci., 1992, 270, 956. 12. G. N. Mahesh, P. Banu and G. Radhakrishnan, J. Appl. Polym. Sci., 1997, 65, 2105. 13. G. N. Manvi and R. N. Jagtap, J. Disper. Sci. Technol., 2010, 31, 1376. 14. O. Jaudouin, J. J. Robin, J. M. Lopez-Cuesta, D. Perrin and C. Imbert, Polym. Int.,
2012, 61, 495.

73
15. D. J. Hourston, G. D. Williams, R. Satguru, J. C. Padget and D. Pears, J. Appl. Polym. Sci., 1999, 74, 556.
16. Y. Chen and Y.-L. Chen, J. Appl. Polym. Sci., 1992, 46, 435. 17. K. Mequanint, R. Sanderson and H. Pasch, Polym. Degrad. Stabil., 2002, 77, 121. 18. H. A. Al-Salah, K. C. Frisch, H. X. Xiao and J. A. McLean, J. Polym. Sci. Pol. Chem.,
1987, 25, 2127. 19. F. Chen, J. Hehl, Y. Su, C. Mattheis, A. Greiner and S. Agarwal, Polym. Int., 2013. 20. Y. Xia, Z. Zhang, M. R. Kessler, B. Brehm-Stecher and R. C. Larock, ChemSusChem,
2012, 5, 2221. 21. Y. Gao and I. L. Kyratzis, J. Appl. Polym. Sci., 2012, 125, E71. 22. X. H. Yan, Y. X. Ji and T. He, Prog. Org. Coat., 2013, 76, 11. 23. A. G. Charnetskaya, G. Polizos, V. I. Shtompel, E. G. Privalko, Y. Y. Kercha and P.
Pissis, Eur. Polym. J., 2003, 39, 2167. 24. P. Krol and B. Krol, Colloid Polym. Sci., 2008, 286, 1111. 25. B. Krol and P. Krol, Colloid Polym. Sci., 2009, 287, 189. 26. T. F. Garrison, Z. Zhang, D. Mitra, Y. Xia, D. P. Pfister, B. F. Brehm-Stecher, R. C.
Larock and M. R. Kessler, unpublished work. 27. Z. S. Petrović, Z. Zavargo, J. H. Flyn and W. J. Macknight, J. Appl. Polym. Sci., 1994,
51, 1087. 28. NIST Mass Spec Data Center and S. E. Stein, in NIST Chemistry WebBook, NIST
Standard Reference Database Number 69, eds. P. J. Linstrom and W. G. Mallard, National Institute of Standards and Technology, Gaithersburg, MD, 2011.
29. P. Crews, J. Rodriguez and M. Jaspars, Organic Structure Analysis, Oxford University Press, Oxford, 1998.
30. Y.-W. In, J.-J. Kim, H.-J. Kim and S.-W. Oh, J. Food Safety, 2013, 33, 79. 31. Y. Lu, L. Weng and X. Cao, Carbohyd. Polym., 2006, 63, 198.
74
CHAPTER 5. GRAFTED HYBRID LATEXES FROM CASTOR OIL-BASED WATERBORNE POLYURETHANES
A paper to be submitted to Macromolecular Rapid Communications
Thomas F. Garrison1, Daniel P. Pfister1, Mahendra Thunga2, Michael R. Kessler*2,3, and Richard C. Larock*1 1 Department of Chemistry, Iowa State University, Ames, Iowa 2 Department of Materials Science and Engineering, Iowa State University, Ames, Iowa 3Ames Laboratory, US Dept. of Energy, Ames, Iowa.
Abstract
In this article, recent developments of grafted hybrid latexes are reviewed. We also
report our recent investigation of using 2-hydroxyethyl acrylate (HEA) to introduce graft
sites for the synthesis of grafted hybrid latexes from castor oil-based waterborne
polyurethane dispersions by emulsion graft copolymerization of vinyl monomers. The
thermo-physical properties have been investigated using dynamic mechanical analysis and
differential scanning calorimetry. Increased ratios of HEA in the grafted hybrid latexes,
increase the elongation at break and glass transition temperature. The morphologies of the
grafted hybrid latex particles examined by transmission electron microscopy exhibit a hybrid
structure instead of a core-shell structure. The elastic properties of the materials were also
modeled with Mooney-Rivlin plots to determine cross-link density.
Introduction
Conventional solvent-borne polyurethanes have been widely adopted commercially
because of their appearance and high performance characteristics, such as high tensile
strength, abrasion resistance, chemical resistance, and toughness.1,2 One drawback of
conventional solvent-borne polyurethanes is due to environmental impact from emissions of

75
volatile organic compounds (VOCs) both during processing and during the application
lifetime.1
Waterborne polyurethane dispersions are widely used polymers with a diverse range
of applications, including paints, inks, coatings, adhesives, paper and textiles.3,4
Polyurethane dispersions are an effective method of reducing the emission of volatile organic
compounds generated by organic solvents.1,3,4 Although this approach has been used
commercially since the late 1960s, waterborne polyurethane dispersions is still a very active
area of research.5-10 In comparison with other waterborne coatings, polyurethane dispersions
have the lowest amounts of organic solvent emissions with amounts as low as 3 wt %. In
fact, the low organic solvent emissions of polyurethane dispersions are comparable to the low
emission levels typical of powder coatings, which typically range from 0.1 to 4 wt%.11
Polyurethane dispersions offer other advantages, including excellent processability and good
film forming properties. One particularly important property for processing is the fact that
the viscosity of polyurethane dispersions is almost independent of the molecular weight of
the polymer.3,12 This allows for the preparation of dispersions with high solid content
loadings of high molecular weight polymers, yielding good coatings by physical drying
processes.13 However, polyurethane dispersions are not without disadvantages, which include
high cost, slow drying rates, and poor water and alkali resistance.12,14
Another drawback of conventional solvent-borne polyurethanes is their dependence
on a petroleum-based polymers and solvents. In response to the dual concerns about
dwindling petroleum reserves and VOC emissions, waterborne polyurethane dispersions have
been prepared using biorenewable-based polyols, such as vegetable oils or fatty acids.[6,15-18]

76
Hybrid polymeric materials have been synthesized as strategy of overcoming the
aforementioned deficienices of polyurethane dispersions and other polymers. Often, hybrid
polymers refer to polymers covalently bonded to inorganic materials or polymers with
encapsulated nanoparticles.19-21 However, hybrid polymer systems can also include two or
more different types of polymers that are normally incompatible, such as thermosets and
thermoplastics.19 Of particular interest, are hybrid latexes made from polyurethanes and
acrylics.22 The combination of polyurethane dispersions and acrylic latexes results in
siginficant improvements compared to either individual type of polymer.13 Acrylic resins
have a number of advantages, including good weatherability, chemical resistance, gloss, and
affinity to pigments.23 However, acrylic resins often exhibit poor toughness, elongation,
mar-resistance, and adhesion.23 Hybrid polyurethane latexes offer the potential of combining
the advantages of both acrylic latexes and waterborne polyurethane dispersion systems, while
offering lower cost and good affinity to pigments.23,24
A number of different approaches exist for making hybrid materials. Blending is the
simplest route and most common method used industrially, where mixtures of polyurethanes
and acrylic polymers are not covalently bonded to each other.13,22,25 However, the improved
performance is obtained when the different polymers are covalently attached together. This
has been achieved by cross-linking, mini-emulsion, and seeded emulsion.22,25,26 Hybrid
latexes prepared from mini-emulsion and seeded emulsion polymerization have been
reviewed extensively.19,27 In mini-emulsion, polycondensate or polyaddition polymers, such
as polyesters, alkyd resins, or polyurethanes, are dissolved in radically polymerizable
monomer(s).19 In seeded emulsion polymerization, a modified polycondensate polymer first
77
forms a latex in the presence of water, and this latex is used as a seed in an emulsion
polymerization of suitable monomers.19,23,24,28
Waterborne polyurethane hybrid latexes is an area of particular interest in waterborne
coatings research.14,16-18,29-31 These materials are formed by seeded emulsion, by first
preparing polyurethane dispersions (step-growth thermosets), followed by polymerization of
vinyl monomers (chain growth thermoplastics). Previously, our group has reported the
synthesis of vegetable oil-based urethane-acrylic latexes.9,16,32 In one study, acrylic polymer
chains were grafted onto the polyurethane chains by reacting them with the carbon-carbon
double bonds in the fatty acids.16 In another study, grafted latexes were prepared using
acrylated epoxidized soybean oil to introduce vinyl groups into the polyurethane chains for
subsequent emulsion graft copolymerization with mixtures of butyl acrylate and methyl
methacrylate.32 More recently, our group reported curing castor oil-based waterborne
polyurethane dispersions with an aziridine-based crosslinker.33
In the present work, 2-hydroxyethyl acrylate (HEA) has been incorporated into castor
oil-based polyurethane dispersions as a precursor to making grafted hybrid latex dispersions
from waterborne castor oil-based polyurethane dispersions.34 It is well known that HEA can
be used used to introduce hydroxyl groups for cross linking sites in acrylic latexes.13
However, the objective of this work is to investigate the use of HEA as a means of
introducing vinyl groups for grafting in the preparation of castor oil-based grafted hybrid
latexes (GHL). The advantage of using castor oil and HEA over acrylated soybean oil is that
it eliminates the need for additional processing of soybean oil oil by epoxidation and ring
opening with acylated groups. The effect of different molar ratios of vinyl monomers
(styrene and butyl acrylate) on the resulting GHL was also examined. Recently, styrene and

78
butyl acrylate were used to prepare hybrid polyurethane latexes from polyester-based
polyurethanes, which showed excellent properties as a paper surface sizing agent in
papermaking.35 The morphology and properties of these GHLs have subsequently been
investigated using transmission electron microscopy, mechanical testing, dynamic
mechanical analysis, differential scanning calorimetry, and thermogravimetry. Mooney
Rivlin plots were used to determine molecular weight between cross-links.
Experimental
Materials. Castor oil, dimethylolpropionic acid (DMPA), hexamethylene diisocyanate
(HDI), dibutyltin dilaurate (DBTDL), 2-hydroxyethyl acrylate (HEA), butyl acrylate, and
styrene were purchased from Aldrich Chemical Company (Milwaukee, WI, USA). Glacial
acetic acid, methyl ethyl ketone, triethylamine, and potassium persulfate (KPS) were
purchased from Fisher Scientific Company (Fair Lawn, NJ, USA). All materials were used
as received.
Synthesis of the castor oil-based grafted hybrid latexes. Scheme 1 illustrates the synthesis
of our castor oil-based grafted hybrid latexes. HDI, dimethylolpropionic acid, castor oil, and
one drop of DBTDL were added to a three-necked flask equipped with a mechanical stirrer,
condenser, and a thermometer. The molar ratio between the NCO groups of IPDI, the OH
groups of castor oil, the OH groups of DMPA, and the OH groups of HEA is listed in Table
1. The reaction was heated at 80 °C for 1 h. HEA was added to end-cap the polyurethane
chains with vinyl groups and methyl ethyl ketone (50 wt % based on the total reactants) was
added to reduce the viscosity. After 3 h of additional reaction, the reactants were cooled to
room temperature and triethylamine (1.5 equivalents) was added, followed by dispersion at
high speed with distilled water to produce anionic, vinyl-containing PUDs with a solid

79
content of ca. 10 wt % after removal of the methyl ethyl ketone under vacuum. The molar
ratio of NCO groups from HDI and the molar ratio of OH groups from DMPA were held
constant. As the molar ratio of OH groups from castor oil was decreased, the molar ratio of
OH groups from HEA was correspondingly increased.
OH
O
NEt3
DMPA
OH OH
Castor Oil
O
OO
O O
O
4
Water
COOH
O
OO
O O
O
OHOH
NC
ON
CO
HDI
O
44
3
4
3
O
OH
O
O
OOH
HEA
HN
ONH
O
O
O
NH
O HN
OO COOH
Polyvinyl chain
O
OO
O O
O
4
CO2NH(Et)3
O
4
3
O
O HN
ONH
O
O
O
NH
O HN
OO CO2NH(Et)3
KPS
Vinyl-containing PU dispersion
Vinyl Monomers, Water
O
OO
O O
O
4
CO2NH(Et)3
O
4
3
O
O HN
ONH
O
O
O
NH
O HN
OO CO2NH(Et)3
Grafted hybrid latex
80 oC
Scheme 1. Synthesis of castor oil-based grafted hybrid latexes

80
Table 1. Chemical composition of PU and GHL films
Molar Ratio Vinyl Monomers
Sample NCO (IPDI) OHa OHb OHc (wt %) PU-0.0 2.0 1.0 0.99 0.0 0 PU-0.1 2.0 0.9 0.99 0.1 0 PU-0.2 2.0 0.8 0.99 0.2 0 PU-0.3 2.0 0.7 0.99 0.3 0
GHL-0.0 2.0 1.0 0.99 0.0 30 GHL-0.1 2.0 0.9 0.99 0.1 30 GHL-0.2 2.0 0.8 0.99 0.2 30 GHL-0.3 2.0 0.7 0.99 0.3 30
a Hydroxyl molar ratio of the castor oil, b Hydroxyl molar ratio of the DMPA, c Hydroxyl molar ratio of the HEA
To prepare the grafted hybrid latexes, the vinyl monomers and distilled water were
added to the vinyl-containing polyurethanes and stirred under argon gas for 2 h. After
flushing with argon, potassium persulfate was added and the reaction mixture was heated to
80 °C. The reaction was allowed to proceed for 4 h before cooling to room temperature. The
composition of the grafted hybrid latex was 70 wt % polyurethane and 30 wt % vinyl
monomers (butyl acrylate and styrene). Unless otherwise mentioned, the ratio of butyl
acrylate : styrene was held at 1 : 1. In order to determine the effect of varying the vinyl
monomer ratio on the thermal properties of the resulting GHLs, butyl acrylate : styrene ratios
of 3 : 1 and 1 : 3 were also investigated.
The PU films are identified as PU-0.0, PU-0.1, PU-0.2, and PU-0.3, where the
number represents the molar ratio of HEA. The grafted hybrid latex films are identified as
GHL-0.0, GHL-0.1, GHL 0.2, and GHL-0.3, where the number corresponds to the molar
ratio of HEA. The corresponding vinyl-containing polyurethane films and GHL films have
been obtained by drying the resulting dispersions at room temperature in polystyrene petri
dishes.
81
Characterization. The grafted hybrid latex particle morphology has been studied under a
transmission electron microscope (JEOL-2100). The latexes were diluted with deionized
water, and one drop of the diluted emulsion was placed on the coated side of a 200-mesh
nickel grid in a petri dish. After drying, the samples were stained with osmium tetroxide and
characterized. The mechanical properties of the vinyl-containing polyurethanes and grafted
hybrid latex films were determined using an Instron universal testing machine (Model-4502).
The crosshead speed was set at 100 mm/min. Average stress-strain data gained from five
rectangular specimens (70 mm × 10 mm) were used. The dynamic mechanical behavior of
the vinyl-containing polyurethanes and grafted hybrid latex films was determined using a
dynamic mechanical analyzer (TA Instruments DMA Q800, New Castle, DE) in tensile mode
at 1 Hz. The samples were heated from −80 to 100 °C at a rate of 5 °C/min. The glass
transition temperatures (Tg) were obtained from the tan δ peaks. Differential scanning
calorimetry (DSC) was performed using a differential scanning calorimeter (TA Instruments
DSC Q20, USA). The samples were heated from 25 to 100 °C at a rate of 20 °C/min to erase
their thermal history, cooled to −70 °C, and heated again to 150 °C at a heating rate of
20 °C/min. The sample mass was approximately 5 mg. A thermogravimetric analyzer (TA
Instruments TGA Q50, USA) was used to measure the weight loss of the vinyl-containing
polyurethanes and grafted hybrid latex films in an air atmosphere. The samples were heated
from 30 to 650 °C at a heating rate of 20 °C/min. The mass of the samples used for TGA
analysis was approximately 8 mg.

82
Results and Discussion
TEM Microscopy. The transmission electron microscopy images of the polyurethane
particles and grafted hybrid latex particles, shown in Figure 1, illustrate the change in particle
morphology based on HEA ratio. For the PUDs, the particles were spherical or oblong and
relatively hard to observe in comparison to the grafted hybrid latex particles (Figure 1a). In
contrast, the grafted hybrid latexes with HEA molar ratios 0.2 or less (Figure 1b), showed
clearly defined spherical particles typically larger than 200 nm in size. However, the GHL-
0.3 particles (Figure 1c) were much smaller (less than 100 nm), exhibited more irregular
shapes, and were more disperse than those observed for GHL-0.2. The transition in
observed morphology from GHL-0.2 to GHL-0.3 indicates a change in polymer structure,
which can possibly be attributed to a decreased molecular weight of the polyurethane
backbone due to an excess of HEA. When HEA is incorporated into a step growth polymer,
it also acts as a chain terminator, in addition to being a graft site for the subsequent grafting
of acrylic polymer chains. The observed morphology changes are consistent with the results
of the themomechanical testing.
Figure 1. TEM microphotographs of particles from the PU-0.0 dispersion (a) and grafted latexes of GHL-0.2 (b) and GHL-0.3 (c).

83
The morphology of the GHL-0.2 particles also exhibits a hybrid structure, instead of a
core-shell structure. In a core-shell structure, there are clearly defined layers with a
hydrophobic core and a hydrophilic shell.[9] However, in the GHL-0.2 particles, the broad
distribution of osmium tetroxide stain indicates that the grafted latex particles have a hybrid
structure, instead of a core-shell structure. The osmium tetroxide preferentially reacts with
the carbon-carbon double bonds that are only found in the castor oil-based polyurethane
chains. This indicates that the particle interior is a hybrid mixture of grafted polyvinyl chains
and polyurethane chains, whereas the particle surface is covered with the hydrophilic
anionomer groups incorporated into the polyurethane chains.
Mechanical Properties. The tensile test results for the vinyl-containing polyurethanes and
the grafted hybrid latex films are summarized in Table 2. For the vinyl-containing
polyurethane films, the tensile strength decreased, while the elongation at break increased as
the molar ratio of HEA increased from 0.0 to 0.2. PU-0.3 had a higher Young’s modulus and
toughness compared to the other vinyl-containing polyurethane films, as well as greater
variability in the toughness and elongation at break. For the grafted hybrid latex films, the
tensile strength decreased from 2.56 MPa to 1.21 MPa as the HEA increased from 0.0 to 0.3,
but it improved relative to the corresponding vinyl-containing polyurethane. The Young’s
modulus of the grafted latexes increased from 1.79 to 4.39 MPa as the HEA molar ratio
increased from 0.0 to 0.3. The elongation at break remained relatively constant as the HEA
increased, but decreased slightly as the HEA molar ratio increased from 0.2 to 0.3. It
should be noted that for both the vinyl-containing polyurethanes and the grafted hybrid
latexes, the decrease in break strength and elongation at break observed as the HEA molar
increased from 0.2 to 0.3 is consistent with the changes in particle morphology.

84
Table 2. Summary of engineering stress data
Film HEA Molar Ratio
σb (MPa)a)
E (MPa)b)
Toughness (MPa)
εb (%)c)
PU
0.0 1.57 ± 0.10 1.01 ± 0.19 2.31 ± 0.17 319 ± 12 0.1 1.49 ± 0.21 0.97 ± 0.11 2.97 ± 0.47 435 ± 34 0.2 0.88 ± 0.06 1.01 ± 0.13 2.16 ± 0.10 560 ± 19 0.3 1.16 ± 0.11 1.75 ± 0.11 3.85 ± 0.68 539 ± 69
GHL
0.0 2.56 ± 0.17 1.79 ± 0.10 4.61 ± 0.39 396 ± 18 0.1 2.10 ± 0.17 2.50 ± 0.20 3.98 ± 0.34 396 ± 14 0.2 1.61 ± 0.06 2.50 ± 0.32 3.08 ± 0.13 401 ± 10 0.3 1.21 ± 0.10 4.39 ± 0.27 3.08 ± 0.24 364 ± 13
a) σb is break strength, b) E is Young’s modulus, c) εb is the strain at break
The Mooney-Rivlin equation, as shown in Equation 1, can be used to estimate the
molecular weight between crosslinks (Mc) from the stress-strain behavior as shown in
Equation 2, where σ is the tensile stress, λ is the stretch ratio, C1 and C2 are experimentally
determined parameters, ρ is the density of the polymer, R is the gas constant, and T is the
absolute temperature.[36, 37]
Equation 1.
Equation 2:
The tensile data conforms to Equation 1, as shown in Figure 2. The values for Mc are
listed in Table 3. The crosslink density is inversely proportional to Mc. For the vinyl-
containing polyurethane films, Mc increased with increasing amounts of HEA, whereas for
the grafted hybrid latex films, Mc did not change as the HEA molar ratio increased from 0.2
to 0.3. The model was not applied to the samples PU-0.3 and GHL-0.3 with the highest
21 2
2 12 CCσ λλ λ
= + −
12c
RTCM
ρ=

85
amounts of HEA, because of changes in the morphology and behavior. Figure 2 illustrates
that there was an absence of a rubbery plateau for PU-0.3.
0
0.2
0.4
0.6
0.8
0.1 0.2 0.3 0.4 0.5 0.6 0.7 0.8
PU 0.2
PU 0.1
PU 0.3
PU 0.0
σ / (
λ −
1/ λ
2 ) (M
Pa)
1 / λ
Figure 2. Mooney-Rivlin plot for PU films with different molar ratios of HEA.
Table 3. Molecular weight between crosslinks (Mc) estimated from Mooney-Rivlin plots
PU Film Mc
(kg / mol) GHL Film
Mc (kg / mol)
PU 0.0 5.9 GHL 0.0 4.8 PU 0.1 9.3 GHL 0.1 8.2 PU 0.2 16.1 GHL 0.2 8.1 PU 0.3 n/a GHL 0.3 n/a
Thermal Properties. The storage modulus (E’) of both the vinyl-containing polyurethanes
and the grafted hybrid latex films are shown in Figure 3 and 4, respectively. The storage

86
modulus of the vinyl-containing polyurethanes decreased as the ratio of HEA increased. This
can be attributed to HEA causing more chain termination, leading to more dangling chains.
The decrease in storage modulus also results from the decreased cross-link density. In
contrast, the storage modulus increased for the grafted latexes as the ratio of HEA increased,
which can be explained by the relative decrease in castor oil, which makes the polymer
chains less flexible.
PU 0.1
0.1
1
10
100
1000
104
-40 -20 0 20 40 60
Sto
rage
Mod
ulus
(M P
a)
Temperature (°C)
PU 0.0
PU 0.3
PU 0.2
Figure 3. Storage modulus as a function of temperature for polyurethane films with different amounts of HEA

87
0.1
1
10
100
1000
104
-40 -20 0 20 40 60
GHL 0.3GHL 0.2GHL 0.1GHL 0.0
Sto
rage
Mod
ulus
(M P
a)
Temperature (°C)
Figure 4. Storage modulus as a function of temperature for grafted hybrid latex films with different amounts of HEA
The glass transition temperatures, Tg’s, of both the vinyl-containing polyurethanes
and the grafted hybrid latexes have been determined using DMA and DSC, as summarized in
Table 4. With DMA, the tan δ peak corresponds to the relaxation processes of the polymers
and is a measure of Tg. DSC determines the Tg by measuring changes in the heat capacity
between the glassy and rubbery states. Both methods exhibit similar trends. However, the Tg
determined by DSC is lower than the Tg determined by the tan δ peak in the DMA. The Tg
of the vinyl-containing polyurethanes decreased as the ratio of the HEA increased from 0.0 to
0.2 and then increased only slightly as the ratio of the HEA increased from 0.2 to 0.3. In
contrast, the Tg of the grafted hybrid latexes increased as the ratio of the HEA increased,
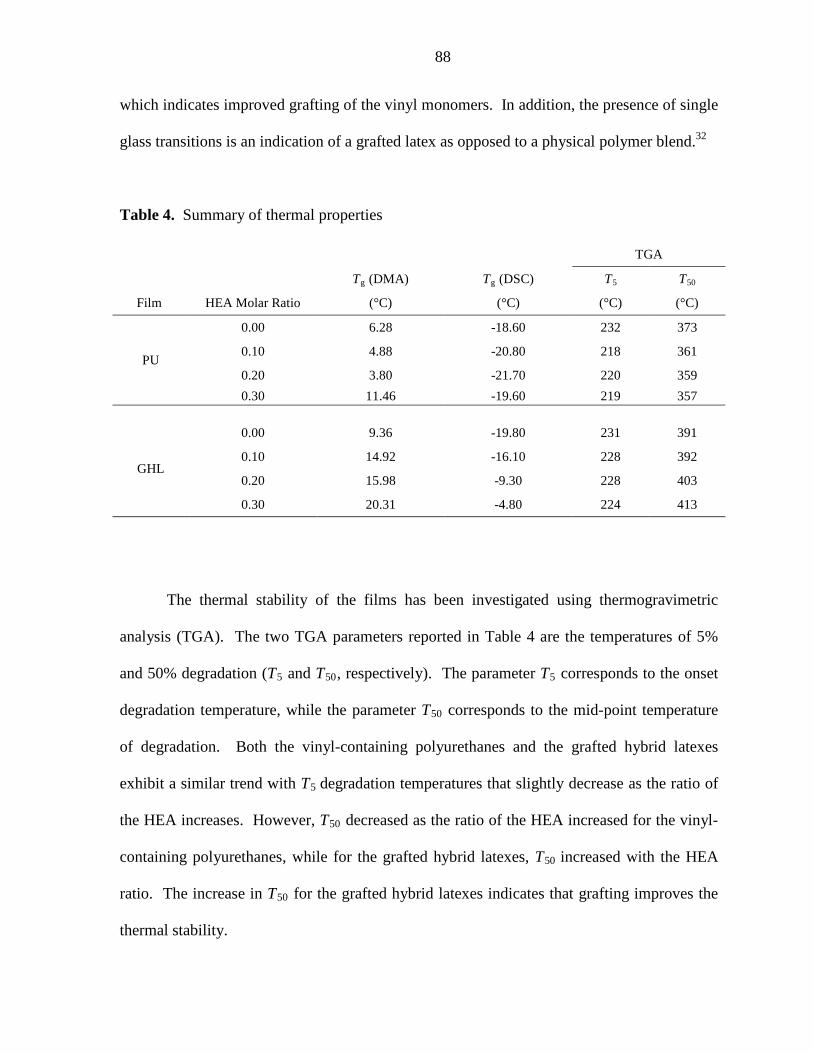
88
which indicates improved grafting of the vinyl monomers. In addition, the presence of single
glass transitions is an indication of a grafted latex as opposed to a physical polymer blend.32
Table 4. Summary of thermal properties
TGA
Tg (DMA) Tg (DSC) T5 T50
Film HEA Molar Ratio (°C) (°C) (°C) (°C)
PU
0.00 6.28 -18.60 232 373
0.10 4.88 -20.80 218 361
0.20 3.80 -21.70 220 359 0.30 11.46 -19.60 219 357
GHL
0.00 9.36 -19.80 231 391
0.10 14.92 -16.10 228 392
0.20 15.98 -9.30 228 403
0.30 20.31 -4.80 224 413
The thermal stability of the films has been investigated using thermogravimetric
analysis (TGA). The two TGA parameters reported in Table 4 are the temperatures of 5%
and 50% degradation (T5 and T50, respectively). The parameter T5 corresponds to the onset
degradation temperature, while the parameter T50 corresponds to the mid-point temperature
of degradation. Both the vinyl-containing polyurethanes and the grafted hybrid latexes
exhibit a similar trend with T5 degradation temperatures that slightly decrease as the ratio of
the HEA increases. However, T50 decreased as the ratio of the HEA increased for the vinyl-
containing polyurethanes, while for the grafted hybrid latexes, T50 increased with the HEA
ratio. The increase in T50 for the grafted hybrid latexes indicates that grafting improves the
thermal stability.

89
Vinyl monomer composition. Styrene and butyl acrylate are two common monomers used
in the synthesis of commercial latex emulsions. Styrene is typically used to reduce cost and
impart hardness to the dried film, whereas butyl acrylate is used to add flexibility. For the
grafted hybrid latexes, the thermal properties of two additional monomer compositions have
been examined, namely butyl acrylate : styrene ratios of 3 : 1 and 1 : 3, in addition to the 1 : 1
data presented above. As expected, the butyl acrylate-rich grafted hybrid latex exhibits a
lower storage modulus owing to more flexible segments, while the styrene-rich grafted
hybrid latex is more rigid, as shown in Figure 5. The vinyl monomer composition did not
significantly influence the Tg (data not shown).
ST-BA 50-50
0.1
1
10
100
1000
104
-40 -20 0 20 40 60
Sto
rage
Mod
ulus
(M P
a)
Temperature (°C)
ST-BA 75-25
ST-BA 25-75
Figure 5. Storage modulus as a function of temperature for GHL-0.3 films with different vinyl monomer compositions

90
Conclusions
Vinyl-containing waterborne PUDs have been successfully synthesized from castor
oil, where HEA has been used to introduce vinyl groups for subsequent grafting. The grafted
hybrid latexes prepared exhibit improved thermal and mechanical properties over the vinyl-
containing polyurethanes. However, excessive amounts of HEA relative to castor oil
significantly change both the morphology and the properties of the grafted hybrid latexes.
Generally, it was observed that as the molar ratio of HEA increases from 0.2 to 0.3 and as the
molar ratio of castor oil simultaneously decreases, there is a significant change in the particle
size, morphology, thermal properties, and mechanical properties. Two competing
phenomena likely contribute to the results. Castor oil acts as both a cross-linker and a soft
chain supplier, whereas HEA acts as both a chain terminator and as a graft site for polyvinyl
chains. Consequently, changes in the relative composition of HEA and castor oil
significantly impact the properties of the films.
For the grafted hybrid latexes, increases in the ratio of the HEA improve the
properties of the materials. It is also observed that changing the vinyl monomer composition
changes the properties of the materials. From these observations, we conclude that both the
HEA and vinyl monomer ratios can be tuned to improve the properties of grafted hybrid
latexes.
Acknowledgements
We gratefully acknowledge financial support from the Consortium for Plant
Biotechnology Research (CPBR) and the Archer Daniels Midland (ADM) Company. We
also thank Ms. Tracey M. Pepper of the Microscopy and NanoImaging Facility (MNIF) at
Iowa State University for her assistance with the TEM analysis.

91
References
1. K.-L. Noble, Prog. Org. Coat., 1997, 32, 131. 2. A. Overbeek, J. Coat. Technol. Res., 2010, 7, 1. 3. B. K. Kim, Colloid Polym. Sci., 1996, 274, 599. 4. S. Y. Lee, J. S. Lee and B. K. Kim, Polym. Int., 1997, 42, 67. 5. S. K. Lee and B. K. Kim, J. Colloid Interf. Sci., 2009, 336, 208. 6. A. Patel, C. Patel, M. G. Patel, M. Patel and A. Dighe, Prog. Org. Coat., 2010, 67,
255. 7. Y. Lu and R. C. Larock, ChemSusChem, 2010, 3, 329. 8. Y. Lu and R. C. Larock, Prog. Org. Coat., 2010, 69, 31. 9. Y. Lu, Y. Xia and R. C. Larock, Prog. Org. Coat., 2011, 71, 336. 10. V. D. Athawale and R. V. Nimbalkar, J. Disper. Sci. Technol., 2011, 32, 1014. 11. K. Dören, W. Freitag and D. Stoye, Water-Borne Coatings: The Environmentally-
friendly Alternative, Hanser Publishers, Munich, 1994. 12. Y. Lu and R. C. Larock, in Green Polymer Chemistry: Biocatalysis and Biomaterials,
American Chemical Society, 2010, vol. 1043, pp. 87-102. 13. Z. W. Wicks, Jr., F. N. Jones, S. P. Pappas and D. A. Wicks, Organic Coatings:
Science and Technology, John Wiley & Sons, Inc., Hoboken, NJ, 2007. 14. H. Fu, H. Huang, Q. Wang, H. Zhang and H. C. HQ, J. Disper. Sci. Technol., 2009,
30, 634. 15. Y. Lu and R. C. Larock, Biomacromolecules, 2008, 9, 3332. 16. Y. Lu and R. C. Larock, Biomacromolecules, 2007, 8, 3108. 17. Y. Xia and R. C. Larock, Green Chem., 2010, 12, 1893. 18. United States Pat., US 6,166,150, 2000. 19. A. Guyut, K. Landfester, F. J. Schork and C. Wangd, Prog. Polym. Sci., 2007, 32,
1439. 20. C. K. Weiss and K. Landfester, in Hybrid Latex Particles, eds. A. M. VanHerk and K.
Landfester, 2010, vol. 233, pp. 185-236. 21. A. P. Zhu, Q. P. Rong and R. Chen, J. Adhes. Sci. Technol., 2010, 24, 267. 22. A. Lopez, E. Degrandi-Contraires, E. Canetta, C. Creton, J. L. Keddie and J. M.
Asua, Langmuir, 2011, 27, 3878. 23. M. Hirose, F. Kadowaki and J. Zhou, Prog. Org. Coat., 1997, 31, 157. 24. M. Hirose, J. Zhou and K. Nagai, Prog. Org. Coat., 2000, 38, 27. 25. M. Li, E. S. Daniels, V. Dimonie, E. D. Sudol and M. S. El-Aasser, Macromolecules,
2005, 38, 4183. 26. L. Ragupathy, U. Ziener, G. Robert and K. Landfester, Colloid Polym. Sci., 2011,
289, 229. 27. A. M. VanHerk and K. Landfester, eds., Hybrid Latex Particles, Springer-Verlag
Berlin, Berlin, 2010. 28. J. Nicolas, B. Charleux, O. Guerret and S. Magnet, Angewandte Chemie, 2004, 116,
6312. 29. C. Zhang, X. Zhang, J. Dai and C. Bai, Prog. Org. Coat., 2008, 63, 238. 30. M. Goikoetxea, Y. Reyes, C. M. de las Heras Alarcón, R. J. Minari, I. Beristain, M.
Paulis, M. J. Barandiaran, J. L. Keddie and J. M. Asua, Polymer, 2012, 53, 1098. 31. V. D. Athawale and R. V. Nimbalkar, Pigm. Resin. Technol., 2011, 40, 181.

92
32. Y. Lu and R. C. Larock, J. Appl. Polym. Sci., 2011, 119, 3305. 33. Y. Xia and R. C. Larock, Macromol. Mater. Eng., 2011, 296, 703. 34. X. B. Jiang, X. L. Zhu, Z. G. Zhang, X. Z. Kong and Y. B. Tan, Chem. Res. Chin.
Univ., 2011, 27, 154. 35. Y. H. Guo, S. C. Li, G. S. Wang, W. Ma and Z. Huang, Prog. Org. Coat., 2012, 74,
248. 36. M. Mooney, J. Appl. Phys., 1940, 11, 582. 37. M. Thunga, A. Das, L. Häußler, R. Weidisch and G. Heinrich, Compos. Sci. Technol.,
2010, 70, 215.

93
CHAPTER 6. GENERAL CONCLUSIONS
This dissertation discusses the synthesis and characterization of polyurethane
dispersions and films produced from vegetable oil-based polyols. A variety of vegetable oils
have been used to prepare bio-based polyols for the preparation of polyurethanes.
Applications of the environmentally-friendly coatings include paint binders, adhesives, paper
coatings, and textile sizings. Polyurethane dispersions, like other waterborne coatings, are
environmentally-friendly due to the reduction of hazardous volatile organic compounds
emissions compared to conventional solvent-borne coatings.
In Chapter 2, the effects of residual unsaturation and different ring opening methods
on vegetable oil-based anionic polyurethane dispersions have been investigated. Different
vegetable oils (peanut, soy, corn, and linseed oil) were partially epoxidized and then
completely ring-opened to produce vegetable oil-polyols with approximately 2.7 hydroxyl
groups per molecule. The residual unsaturation of the resulting polyols ranged from 0.4 to
3.5 carbon-carbon double bonds per triglyceride molecule. Increasing the residual
unsaturation improves the break strength, Young’s modulus, and toughness of the
polyurethane films. The fatty acid composition of the vegetable oils also impacts the
properties of the polyurethanes by changing the distribution of the hydroxyl groups.
The focus of Chapter 3 is on the thermal, mechanical and antimicrobial properties of
soybean oil-based cationic polyurethane dispersions. The molar ratio of hydroxyl groups
contributed by N-methyl diethanolamine was varied relative to the molar ratio of hydroxyl
groups from the soybean polyols. Higher ratios of ammonium cations, which were
synthesized by neutralization of the N-methyl diethanolamine, showed increased

94
antimicrobial activity of the polyurethane films against three food-borne pathogens:
Salmonella typhimurium, Listeria monocytogenes, and Staphylococcus aurues.
Chapter 4 continues our investigation into cationic polyurethane dispersions by
examining the effects of counterions on the thermal and mechanical properties of the
resulting PU films. Previous research into the effect of counterions on cationic polyurethane
dispersions has been limited to anionic polyurethane dispersions. Both chain length and
chain substituents impact the initial thermal stability, glass transition temperature, and
storage modulus of the polyurethane films. After decomposition of the ammonium group,
the thermal profiles of all of the polyurethane films were very similar.
Chapter 5 explores the use of 2-hydroxyethyl acrylate as means of introducing graft
sites for the synthesis of grafted hybrid latexes from polyurethane dispersions. The elastic
properties of the materials have been characterized by tensile testing and the tensile
stress/strain curves modeled by the Mooney-Rivlin equation for rubber elasticity revealed the
influence of the 2-hydroxyethyl acrylate on the crosslink density. Increased ratios of 2-
hydroxyethyl acrylate in the grafted hybrid latexes improved the grafting of the vinyl
monomers. Higher ratios of 2-hydroxyethyl acrylate produced films with increased
elongation at break and higher glass transition temperatures.
While the vegetable oil-based polyurethane dispersions described in this dissertation
show promise for future applications, some challenges remain. Specifically, the percent
solids content of these dispersions needs to be higher for a number of applications.
Compatibility testing with pigments and additives, as well as adhesion testing to specific
substrates, will likely reveal additional hurdles and limitations for these materials. Economic

95
competitiveness with existing petroleum-based coatings is likely the most significant
challenge to the use of bio-based polyurethane coatings.
Long term, the future remains bright for bio-based polyurethanes. These materials
can be adapted for uses in higher value products like pressure sensitive adhesives. New
approaches to increase the bio-content in polyurethanes are being pursued by the
development of bio-based isocyanates. The residual unsaturation of vegetable oil-based
polyols can be used either for additional functionalization or UV curing. Demand for
inexpensive antimicrobial coatings for food packaging applications will continue to grow.
While bio-based polyurethanes will not completely replace petroleum-based coatings, these
materials will continue to find uses in a wide range of applications.
96
ACKNOWLEDGEMENTS
I would like to express my deepest appreciation to my co-major advisors,
Distinguished Professor Emeritus Richard C. Larock and Professor Michael R. Kessler, who
have guided me through my Ph.D. studies. I am very grateful for their guidance, support,
and encouragement.
I sincerely appreciate my Program of Study committee members; Dr. Malika Jeffries-
El, Dr. Arthur Winter, and Dr. Keith Woo for their valuable time and support during my
studies at Iowa State University.
I want to thank my many colleagues in Dr. Larock’s group and in Dr. Kessler’s
group, past and present, for their friendship. In particular, I thank Dr. Yongshang Lu, Dr.
Ying Xia, Dr. Dan Pfister, Dr. Rafael Quirino, Dr. Anton Dubrovsky, Dr. Peter Hondred, and
Daniel Vennerberg for their assistance and insightful discussions. I have enjoyed working
with all of you.
I would like to thank my friends and family. I have been blessed with wonderful
friends and relatives who have aided me through the years with kind words of
encouragement. Finally, I thank my wife Andrea, because I could not have done this without
her steadfast love and support.
This research was funded in part by the CPBR and Archer Daniels Midland. I
received financial support from a U.S. Department of Education GAANN Fellowship and
from a National Science Foundation Graduate STEM Fellowship in K-12 Education.