synthesis and characterization of substituted
TRANSCRIPT
i
SYNTHESIS AND CHARACTERIZATION OF SUBSTITUTED
DITHIOCARBAMATES LIGANDS AND COMPLEXES AS SOURCE OF
METAL (Pb, Ni & Co) SULPHIDE NANOPARTICLES
A Dissertation
By
Selaelo Christabel Thangwane
210076259
Submitted to the Faculty of Applied and Computer Science in fulfilment of the requirements
for the degree of Masters in Chemistry
Department of Chemistry
Vaal University of Technology
Private Bag X021
Vanderbijlpark
1900
Supervisor : Dr T. Xaba (PhD Chemistry) (VUT)
Co-supervisor : Prof M. J. Moloto (PhD Chemistry) (VUT)

ii
DECLARATION
I declare that this work contains no material which has been accepted for the awards of any
other degree in any university. To the best of my knowledge, this work contains no material
previously published except where the reference has been made in text.
CS Thangwane (210076259)
…………………………………………..Date……………………………………….…..
Supervisor: Dr T. Xaba
…………………………………………...Date……………………………………………

iii
DEDICATION
This dissertation is dedicated to my younger brother (Ramotho-motho) and my cousin
(Fulufhelo) who were always supported me from day one of my Masters registration. Without
their love and support, none of this would have been possible.

iv
ACKNOWLEDGEMENTS
I would like to pass my words of gratitude to my supervisors Dr T. Xaba and Prof M. J. Moloto
for their guidance, support and motivation during this times. I would also like to be thankful of
all the opportunities that they directed to me. I learned a lot working with these great people. I
also thank NCAP group for guidance while I was struggling with the research. I am grateful to
have been part of such a supportive, hardworking, and inspiring group of research associates,
graduate students and post-doctoral fellows in NCAP group at the Vaal University of
Technology. The course of my research I have been fortunate enough to work with a truly
outstanding group. I am grateful to Vaal University of Technology for allowing me to do my
studies at their school; it has been a real pleasure researching in this university. Sincere thanks
to national research foundation (NRF) for their generous financial support. I would like to thank
my family and everyone who has interacted with me during 2014-2017 of my academic
development even though the development was very slow. Above all, I would like to thank the
God of the mount Zion that provided me with spiritual support.
v
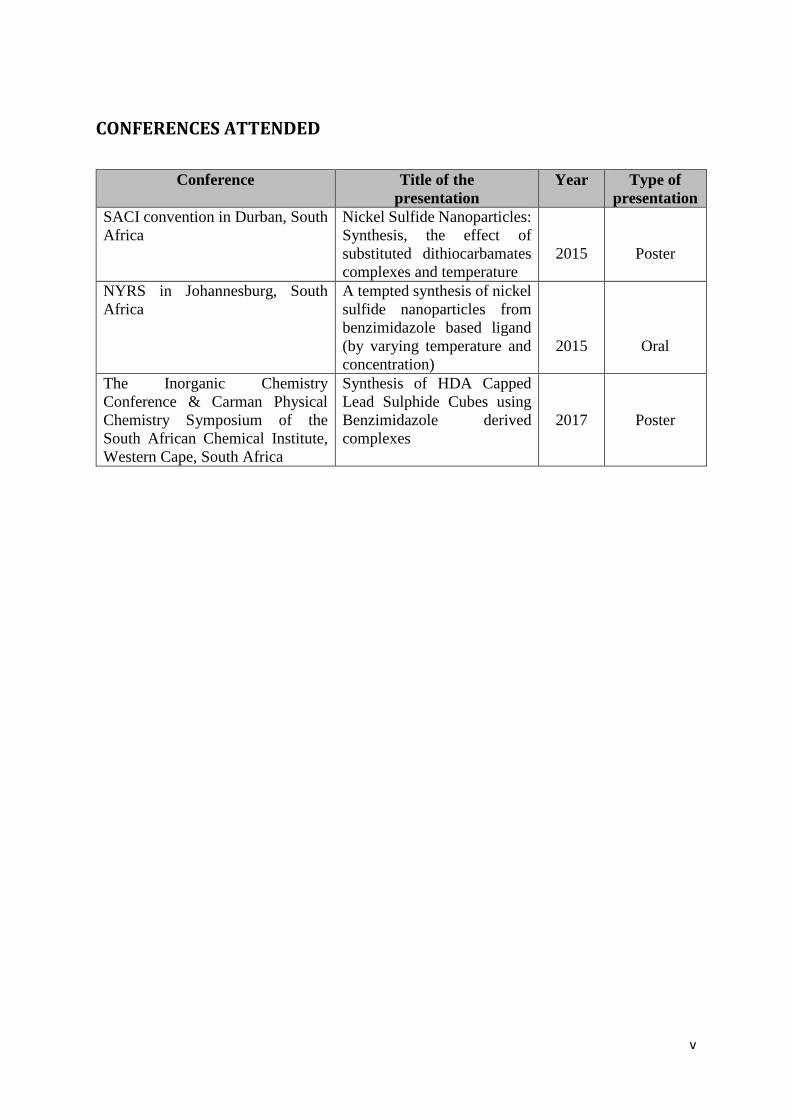
CONFERENCES ATTENDED
Conference Title of the
presentation
Year Type of
presentation
SACI convention in Durban, South
Africa
Nickel Sulfide Nanoparticles:
Synthesis, the effect of
substituted dithiocarbamates
complexes and temperature
2015
Poster
NYRS in Johannesburg, South
Africa
A tempted synthesis of nickel
sulfide nanoparticles from
benzimidazole based ligand
(by varying temperature and
concentration)
2015
Oral
The Inorganic Chemistry
Conference & Carman Physical
Chemistry Symposium of the
South African Chemical Institute,
Western Cape, South Africa
Synthesis of HDA Capped
Lead Sulphide Cubes using
Benzimidazole derived
complexes
2017
Poster

vi
LIST OF PUBLICATIONS
1. C. S. Thangwane, T. Xaba and M. J. Moloto, The formation of the mixed morphology
of nickel sulfide nanoparticles derived from substituted benzimidazole
dithiocarbamate nickel (II) complexes, Chalcogenide Letters, Vol. 14, No. 9, 2017,
407 - 417
2. C. S. Thangwane, T. Xaba and M. J. Moloto, Influence of Temperature and Capping
Molecules on the Synthesis of Cubic Structured Lead Sulfide Nanoparticles from
Substituted Benzimidazole Dithiocarbamate Complex, Asian Journal of Chemistry;
Vol. 29, No. 12 (2017), 2711 - 2716
vii
ABSTRACT
Lead, nickel and cobalt dithiocarbamates complexes were synthesized using methanol and
water as solvents. All complexes were refluxed at 60 °C, cooled at room temperature, washed
with methanol to remove the impurities and dried under the fume hood. A combination of
Fourier transformer infrared (FTIR), elemental analysis (EA) and thermogravimetric analysis
(TGA) were used to characterize these complexes. There was shifting of bands from low to
high frequencies of the dithiocarbamates complexes compared to benzimidazole derivatives.
The absence of the N-H band and the presence of new C=S bands confirmed that the complexes
can be used in the preparation of metal sulphide nanoparticles. Elemental analysis showed that
there was a percentage mismatch for the complexes I, III, IV and V. Complexes II and VI
calculated percentages were within the limits with the found percentages except for sulphur
which was low. The TGA curves decomposed to form a mixture of metal and metal sulphides
for complex I, II, III and IV except for complex VI which gave metal sulphide only. All
benzimidazole complexes decomposed at higher temperatures and were considered as stable
complexes.
Lead sulphide (PbS) is an important group IV-VI metal chalcogenide semiconductor. It has a
direct narrow band gap of 0.41 eV at 300K and a large excitonic Bohr radius of 18 nm. Lead
sulphide absorption band can be tuned to anywhere between near IR to UV (0.4μm) covering
the entire visible spectrum, while achieving the quantum confinement region. The synthesis of
lead sulphide nanoparticles was conducted by varying the effect of the reaction conditions such
as the type of capping agents and temperature. Lead dithiocarbamate complex derived from
benzimidazole, [Pb(S2N2C8H5)2] was thermolysed in hexadecylamine (HDA) and
trioctylphosphine oxide (TOPO) at different reaction temperatures (140, 160 and 180 °C) to
produce HDA and TOPO capped PbS nanoparticles. The nanoparticles were characterized
using X-ray diffraction (XRD) for structural analysis, transmission electron microscopy (TEM)
for shape and size, Ultraviolet visible (UV/Vis) and Photoluminescence (PL) spectroscopy for
optical properties. An increase in temperature gave a decrease in the sizes of the nanoparticles when
using the HDA capped lead benzimidazole dithiocarbamate complex. The observed morphology
was cubes. TOPO capped lead benzimidazole dithiocarbamate complex gave no specific trend
when temperature was varied. A cross-like layer with quasi spherical particles on top was
observed at 160 °C. At 180 °C, the cross-like layer decomposed into rods- like materials with
viii
quasi spherical particles on top for TOPO capped PbS nanoparticles. For lead 2-
methylbenzimidazole [Pb(S2N2C9H7)2] dithiocarbamate complex, TOPO capped PbS produced
agglomerated cubic morphology at low temperature but as the temperature was increased
agglomerated cylindrical shapes were observed. HDA capped PbS produced polydispersed
nanocubes which were increasing in size when the temperature was increased. Nanoparticles
displayed a blue shift in band edges with good photoluminescence behaviour which was red
shifted from their respective band edges all temperatures and capping agents. XRD confirmed
the crystal structure of cubic phase (galena) of PbS at all temperatures except for HDA capped
PbS nanoparticles at 140 °C from lead benzimidazole dithiocarbamate complex which
confirmed the crystal structure of face-centred cubic phase of PbS nanoparticles.
Nickel sulphide has much more complicated phase diagram than cobalt sulfides and iron
sulfides. Their chemical composition has many crystalline phases such as α-NiS, β=NiS, NiS2,
Ni3S2, Ni3S4, Ni7S6 and Ni9S8. Ni3S2 phase has shown potential as a low-cost counter electrode
material in dye sensitised solar cells, while the α-NiS phase has been applied as a cathode
Material in lithium-ion batteries. The synthesis of nickel sulphide nanoparticles was done by
varying the effect of the reaction conditions such concentration and temperature. Nickel
benzimidazole dithiocarbamate [Ni(S2N2C8H5)2] and nickel 2-methylbenzimidazole [Ni
(S2N2C9H7)2] dithiocarbamates complexes were thermolysed in hexadecylamine (HDA) at
different reaction temperatures (140, 160 and 180 °C) and precursor concentrations (0.30, 0.35
and 0.40 g) to produce HDA capped NiS nanoparticles. It was observed that increasing both
temperature and precursor concentration increased the size of the nanoparticles. Anisotropic
particles were observed for both complexes when varying precursor concentration and
temperature. Nickel benzimidazole dithiocarbamate complex produced stable shapes (spheres
and cubes) of nickel sulphide nanoparticles. Nickel 2-methylbenzimidazole dithiocarbamate
complex produced a mixture of spheres, cubes, triangles and rods nickel sulphide nanoparticles
at all concentrations. But when varying temperature, it only produced that mixture at 160 °C.
The optical measurements supported the presence of smaller particles at all temperatures and
concentrations. XRD showed the presence of C7OS8 and pure nickel as impurities. However,
the crystal structure of cubic Ni3S4 was observed at low temperatures and an introduction of
monoclinic NixS6 at high temperature (180 °C) when varying temperature for both complexes.
When varying concentration using nickel benzimidazole dithiocarbamate complex, XRD
showed the presence of NiSO4.6H2O impurities at high temperatures. At 160 °C a mixture of
ix
hexagonal NiS and cubic Ni3S4 was observed. At low temperatures only nickel as a metal was
found as an impurity and the crystal structure of cubic Ni3S4 was observed. When nickel 2-
methylbenzimidazole complex was used, C7OS8 and pure nickel were found as impurities but
the crystal structure of cubic Ni3S4 was observed.
Cobalt sulphide (CoS) belongs to the family of group II-IV compounds with considerable
potential for application in electronic devices. They have a complex phase diagram and their
chemical composition have many phases such as Co4S3, Co9S8, CoS, Co1-xS, Co3S4, Co2S3 and
CoS2. The synthesis of cobalt sulphide nanoparticles was conducted by varying the effect of
temperature on size and shape of the nanoparticles. Nickel benzimidazole dithiocarbamate,
[Ni(S2N2C8H5)2] and nickel 2-methylbenzimidazole [Ni(S2N2C9H7)2] complexes were
thermolysed in hexadecylamine (HDA) at different reaction temperatures (140, 160 and 180
°C) to produce HDA capped CoS nanoparticles. Cobalt benzimidazole dithiocarbamate
complex produced close to spherical shapes nanoparticles at all temperatures. The images
showed that as temperature was increased, the size of the particles decreased. All the
main reflection peaks were indexed to face-centred cubic Co3S4 and there were some impurities
of C7OS8 at all temperatures. The optical measurements supported the presence of smaller
particles at all temperatures. Cobalt 2-methylbenzimidazole dithiocarbamate complex
produced big and undefined morphology. The optical properties were also featureless and XRD
only showed impurities of C7OS8. The impurity is thought to be generated from a side reaction
between benzimidazole and carbon disulphide to give this persistent organic moiety.

x
TABLE OF CONTENTS
TITLE PAGE……………………………………….……………………………………..…..i
DECLARATION ....................................................................................................................... ii
DEDICATION ......................................................................................................................... iii
ACKNOWLEDGEMENTS ...................................................................................................... iv
CONFERENCES ATTENDED ................................................................................................. v
LIST OF PUBLICATIONS ...................................................................................................... vi
ABSTRACT ............................................................................................................................. vii
TABLE OF CONTENTS ........................................................................................................... x
LIST OF FIGURES ................................................................................................................ xiv
LIST OF TABLES ................................................................................................................. xvii
LIST OF EQUATIONS ........................................................... Error! Bookmark not defined.
LIST OF REACTION SCHEMES ......................................................................................... xix
SYMBOLS AND CONSTANTS ............................................................................................ xx
LIST OF ABBREVIATIONS ................................................................................................. xxi
DISSERTATION OUTLINE................................................................................................. xxii
Chapter 1 .................................................................................................................................... 1
Background and literature review .............................................................................................. 1
1.1 Nanoparticles .................................................................................................................... 1
1.2 Preparative methods for the synthesis of nanoparticles ................................................... 2
1.2.1 Colloidal route ........................................................................................................... 3
1.2.2 Synthesis in confined matrices .................................................................................. 4
1.2.3 Metal-organic routes .................................................................................................. 5
1.2.4 Single-source precursor method ................................................................................ 6
1.3 Metal sulphides used: their applications and literature review ........................................ 7
1.3.1 Lead sulphide nanoparticles ...................................................................................... 8

xi
1.3.2 Nickel sulphide nanoparticles .................................................................................... 9
1.3.3 Cobalt sulphide nanoparticles .................................................................................. 11
1.4 Reaction conditions ........................................................................................................ 12
1.4.1Effect of temperature ................................................................................................ 12
1.4.2 Effect of additive type ............................................................................................. 12
1.4.3 Effect of concentration ............................................................................................ 13
1.4.4 Ostwald ripening...................................................................................................... 13
1.5 Dithiocarbamates ............................................................................................................ 14
1.6 Transition metal dithiocarbamates complexes ............................................................... 15
1.7 Synthetic methods .......................................................................................................... 15
1.7.1 Direct ligand addition .............................................................................................. 15
1.7.2 One-pot synthesis of dithiocarbamates metal complexes. ....................................... 16
1.7.3 Other methods.......................................................................................................... 18
1.8 Binding modes................................................................................................................ 19
1.9 Structural features of dithiocarbamates .......................................................................... 20
1.10 Problem statement ........................................................................................................ 21
1.11 Purpose of the study ..................................................................................................... 22
1.12 Aim and objectives of the study ................................................................................... 22
Chapter 2 .................................................................................................................................. 23
Experimental section ................................................................................................................ 23
2.1. Materials ........................................................................................................................ 23
2.2 Experimental procedures ................................................................................................ 23
(a) Preparation of lead benzimidazole dithiocarbamate complex (I) ............................... 23
(b) Preparation of lead 2-methylbenzimidazole dithiocarbamate complex (II) ............... 24
(c) Preparation of nickel benzimidazole dithiocarbamate complex (III) .......................... 24
(d) Preparation of nickel 2-methylbenzimidazole dithiocarbamate complex (IV) ........... 24
xii
(e) Preparation of cobalt benzimidazole dithiocarbamate complex (V) ........................... 24
(f) Preparation of cobalt benzimidazole dithiocarbamate complex (VI) .......................... 25
2.3 Synthesis of nanoparticles .............................................................................................. 25
(a) Synthesis of lead sulphide nanoparticles using complex I and II .......................... 25
(b) Synthesis of nickel sulphide nanoparticles using complex III and IV .................. 25
(c) Synthesis of cobalt sulphide nanoparticles using complex V and VI .................... 26
2.4 Instrumentation............................................................................................................... 26
(a) FT-IR spectroscopy ..................................................................................................... 26
(b) Microanalysis .............................................................................................................. 26
(c) Thermogravimetry analysis ......................................................................................... 26
(d) Optical characterization .............................................................................................. 27
(e)Transmission Electron microscopy .............................................................................. 27
(f) X-ray diffraction analysis .......................................................................................... 27
Chapter 3 .................................................................................................................................. 28
Characterization of benzimidazoledithiocarbamate and 2-methyldithiocarbamate complexes
of lead, nickel and cobalt ......................................................................................................... 28
3.1Background of the specific ligands prepared and their complexes ................................. 28
3.2 Spectroscopic and thermogravimetric analysis .............................................................. 30
3.3 Conlusions ...................................................................................................................... 35
Characterization of lead sulphide nanoparticles using benzimidazoledithiocarbamate and 2-
methyldithiocarbamate complexes ........................................................................................... 36
4.1 HDA/TOPO capped PbS nanoparticles.......................................................................... 36
4.1.1 (a) HDA-PbS Nanoparticles prepared using complex I(Temp variation) ............... 37
(b) TOPO-PbS Nanoparticles prepared using complex I (Temp variation) ..................... 41
(c) HDA-PbS Nanoparticles prepared using complex II (Temp variation) ...................... 45
(d)TOPO-capped PbS Nanoparticles prepared using complex II(Temp variation) ......... 49
4.2 Conclusions .................................................................................................................... 53

xiii
Chapter 5 .................................................................................................................................. 55
Characterization of HDA-capped nickel sulphide nanoparticles using
benzimidazoledithiocarbamate and 2-methyldithiocarbamate complexes .............................. 55
5.1HDA capped nickel sulphide nanoparticles .................................................................... 55
5.1.1 (a) HDA-nickel sulphide Nanoparticles prepared using complex III (Temperature
variation) ........................................................................................................................... 55
(b) HDA-Ni3S4 Nanoparticles prepared using complex IV (Temperature variation) ...... 59
(c) HDA-nickel sulphide nanoparticles prepared using complex III (Conc variation) ....... 63
(d) HDA-nickel sulphide Nanoparticles prepared using complex IV (Conc variation) ... 67
5.2 Conclusions .................................................................................................................... 71
Chapter 6 .................................................................................................................................. 73
Characterization of HDA capped cobalt sulphide nanoparticles using
benzimidazoledithiocarbamate and 2-methyldithiocarbamate as ligands................................ 73
6.1HDA capped cobalt sulphide nanoparticles .................................................................... 73
6.1.1 (a) HDA- cobalt sulphide Nanoparticles prepared using complex V (Temp
variation) .......................................................................................................................... 73
6.1.1 (b) HDA- cobalt sulphide Nanoparticles prepared using complex VI(Temp
variation) .......................................................................................................................... 78
6.2 Conclusions .................................................................................................................... 81
Chapter 7 .................................................................................................................................. 82
General conclusions and recommendations ............................................................................. 82
7.1 Overall conclusions ........................................................................................................ 82
7.2 Recommendations .......................................................................................................... 85
7.3 References ................................................................................................................. 86
xiv
LIST OF FIGURES
Figure 1: Expected complex of lead benzimidazole dithiocarbamate complex ...................... 31
Figure 2: IR spectra for (a) benzimidazole and its complexes I(b), III(c), and V(d). ............. 32
Figure 3: IR spectra for (a) 2-methylbenzimidazole and its complexes II(b), IV(c), and VI(d).
.................................................................................................................................................. 32
Figure 4: TGA curves for complexes I(a),II(b),III(c), IV(d), V(e) and VI(f). ......................... 34
Figure 5: UV-VIS spectra of PbS nanoparticles prepared with 0.3 g of complex I with 6 g of
HDA at (a) 140 °C, (b) 160 °(C) and 180 °C. .......................................................................... 37
Figure 6: PL spectra of PbS nanoparticles prepared with 0.3 g of complex I with 6 g of HDA
at (a) 140 °C, (b) 160 °(C) and 180 °C. ................................................................................... 38
Figure 7: TEM images and their histograms of PbS nanoparticles prepared with 0.3 g of
complex I with 6.0 g of HDA at (a) 140 °C, (b) 160 °C and 180 °C. ...................................... 40
Figure 8: Powder X-ray diffractogram of PbS nanoparticles synthesized from 0.3 g complex 1
in 6 g HDA from (a) 140 °C, b) 160 °C and (c) 180 °C. ......................................................... 41
Figure 9: UV-VIS spectra of PbS nanoparticles prepared with 0.3 g of complex I with 6 g of
TOPO at (a) 140 °C, (b) 160 °(C) and 180 °C. ........................................................................ 42
Figure 10: PL spectra of PbS nanoparticles prepared with 0.30 g of complex I with 6.0 g of
TOPO at (a) 140 °C, (b) 160 °(C) and 180 °C. ........................................................................ 43
Figure 11: TEM images and their histograms of PbS nanoparticles prepared with 0.3 g of
complex I with 6.0 g of TOPO at (a) 140 °C, (b) 160 °C and 180 °C. .................................... 44
Figure 12: Powder X-ray diffractogram of PbS nanoparticles synthesized from 0.3 g complex
I in 6 g TOPO from (a) 140 °C, (b) 160 °C and (c) 180 °C. .................................................... 45
Figure 13: UV-VIS spectra of PbS nanoparticles prepared with 0.30 g of complex II with 6.0
g of HDA at (a) 140 °C, (b) 160 °(C) and 180 °C. .................................................................. 46
Figure 14: PL spectra of PbS nanoparticles prepared with 0.3.0 g of complex II with 6.0 g of
HDA at (a) 140 °C, (b) 160 °(C) and 180 °C. .......................................................................... 47
Figure 15: TEM images and their histograms of PbS nanoparticles prepared with 0.30 g of
complex II with 6.0 g of HDA at (a) 140 °C, (b) 160 °C and 180 °C. .................................... 48
Figure 16: Powder X-ray diffractogram of PbS nanoparticles synthesized from 0.30 g
complex II in 6.0 g HDA from a) 140 °C, b) 160 °C and C) 180 °C....................................... 49
Figure 17: UV-VIS spectra of PbS nanoparticles prepared with 0.3 g of complex II with 6 g
of TOPO at (a) 140 °C, (b) 160 °(C) and 180 °C. ................................................................... 50
xv
Figure 18: PL spectra of PbS nanoparticles prepared with 0.30 g of complex II with 6.0 g of
TOPO at (a) 140 °C, (b) 160 °(C) and 180 °C. ........................................................................ 51
Figure 19: TEM images and their histograms of PbS nanoparticles prepared with 0.30 g of
complex II with 6.0 g of TOPO at (a) 140 °C, (b) 160 °C and 180 °C. ................................... 52
Figure 20: Powder X-ray diffractogram of PbS nanoparticles synthesized from 0.30 g
complex II in 6.0 g TOPO from a) 140 °C, b) 160 °C and C) 180 °C. .................................... 53
Figure 21: UV-VIS spectra of Ni3S4 nanoparticles prepared with 0.30 g of complex III with
6.0 g of HDA at (a) 140 °C, (b) 160 °(C) and 180 °C. ............................................................ 56
Figure 22: PL spectra of Ni3S4 nanoparticles prepared with 0.30 g of complex III with 6.0 g
of HDA at (a) 140 °C, (b) 160 °(C) and 180 °C. ..................................................................... 57
Figure 23: TEM images and their histograms of Ni3S4 nanoparticles prepared with 0.30 g of
complex III with 6.0 g of HDA at (a) 140 °C, (b) 160 °C and 180 °C .................................... 58
Figure 24: Powder X-ray diffractogram of Ni3S4, ■NixS6 nanoparticles and ●C7OS8
synthesized from 0.3 g complex III in 6 g HDA at a) 140 °C, b) 160 °C and C) 180 °C ........ 59
Figure 25: UV-VIS spectra of Ni3S4 nanoparticles prepared with 0.30 g of complex IV with
6.0 g of HDA at (a) 140 °C, (b) 160 °(C) and 180 °C. ............................................................ 60
Figure 26: PL spectra of Ni3S4 nanoparticles prepared with 0.30 g of complex IV with 6.0 g
of HDA at (a) 140 °C, (b) 160 °(C) and 180 °C. ..................................................................... 61
Figure 27: TEM images and their histograms of Ni3S4 nanoparticles prepared with 0.30 g of
complex IV with 6.0 g of HDA at (a) 140 °C, (b) 160 °C and 180 °C. ................................... 62
Figure 28: Powder X-ray diffractogram of Ni3S4, ■NixS6 nanoparticles and ●C7OS8
nanoparticles synthesized from 0.3 g complex IV in 6 g HDA at a) 140 °C, b) 160 °C and C)
180 °C. ..................................................................................................................................... 63
Figure 29: UV/Vis spectra of nickel sulphide nanoparticles prepared from (a) 0,30 g, (b) 0,35
g and (c) 0,40 g of complex III with 6.0 g of HDA at 160 °C. ................................................ 64
Figure 30: PL spectra of nickel sulphide nanoparticles prepared from (a) 0,30 g, (b) 0,35 g
and (c) 0,40 g of complex III with 6.0 g of HDA at160 °C. .................................................... 65
Figure 31: TEM images and their histograms of nickel sulphide nanoparticles prepared from
(a) 0, 30 g, (b) 0, 35 g and (c) 0,40 g of complex III with 6 g of HDA at160 °C. ................... 66
Figure 32: XRD patterns of nickel sulphide Ni3S4, ●NiS and NiSO4.6H2O prepared from (a)
0, 3 g, (b) 0, 35 g and (c) 0, 4 g of complex III with 6 g of HDA at160 °C. ........................... 67
Figure 33: UV/Vis spectra of Ni3S4 nanoparticles prepared from (a) 0, 3 g, (b) 0, 35 g and (c)
0, 4 g of complex IV with 6.0 g of HDA at160 °C. ................................................................. 68

xvi
Figure 34: PL spectra of Ni3S4 nanoparticles prepared from (a) 0, 3 g, (b) 0, 35 g and (c) 0, 4
g of complex IV with 6.0 g of HDA at 160 °C. ....................................................................... 69
Figure 35: TEM images and their histograms of Ni3S4 nanoparticles prepared from (a) 0, 3 g,
(b) 0, 35 g and (c) 0, 4 g of complex IV with 6.0 g of HDA at160 °C. ................................... 70
Figure 36: XRD patterns of Ni3S4 nanoparticles and ● C7OS8 prepared from (a) 0, 3 g, (b) 0,
35 g and (c) 0, 4 g of complex IV with 6.0 g of HDA at160 °C. ............................................. 71
Figure 37: UV-VIS spectra of cobalt sulphide nanoparticles prepared with 0.30 g of complex
V with 6.0 g of HDA at (a) 140 °C, (b) 160 °(C) and 180 °C. ................................................ 75
Figure 38: PL spectra of cobalt sulphide nanoparticles prepared with 0.30 g of complex V
with 6.0 g of HDA at (a) 140 °C, (b) 160 °(C) and 180 °C. .................................................... 76
Figure 39: TEM images and their histograms of cobalt sulphide nanoparticles prepared with
0.30 g of complex V with 6.0 g of HDA at (a) 140 °C, (b) 160 °C and 180 °C ...................... 77
Figure 40: Powder X-ray diffractogram of Co3S4 nanoparticles, ●C7OS8 and sample holder
synthesized from 0.3 g complex V in 6 g HDA at a) 140 °C, b) 160 °C and C) 180 °C. ........ 78
Figure 41: UV-VIS spectra of nanoparticles prepared with 0.30 g of complex VI with 6 g of
HDA at (a) 140 °C, (b) 160 °(C) and 180 °C. .......................................................................... 79
Figure 42: PL spectra of cobalt nanoparticles prepared with 0.30 g of complex VI with 6 g of
HDA at (a) 140 °C, (b) 160 °(C) and 180 °C. .......................................................................... 79
Figure 43: TEM images and their histograms of nanoparticles prepared with 0.30 g of
complex VI with 6.0 g of HDA at (a) 140 °C, (b) 160 °C and 180 °C. ................................... 80
Figure 44: Powder X-ray diffractogram of ●C7OS8 and ▲sample holder synthesized from
0.30 g complex VI in 6 g HDA at a) 140 °C, b) 160 °C and c) 180 °C. .................................. 81
xvii
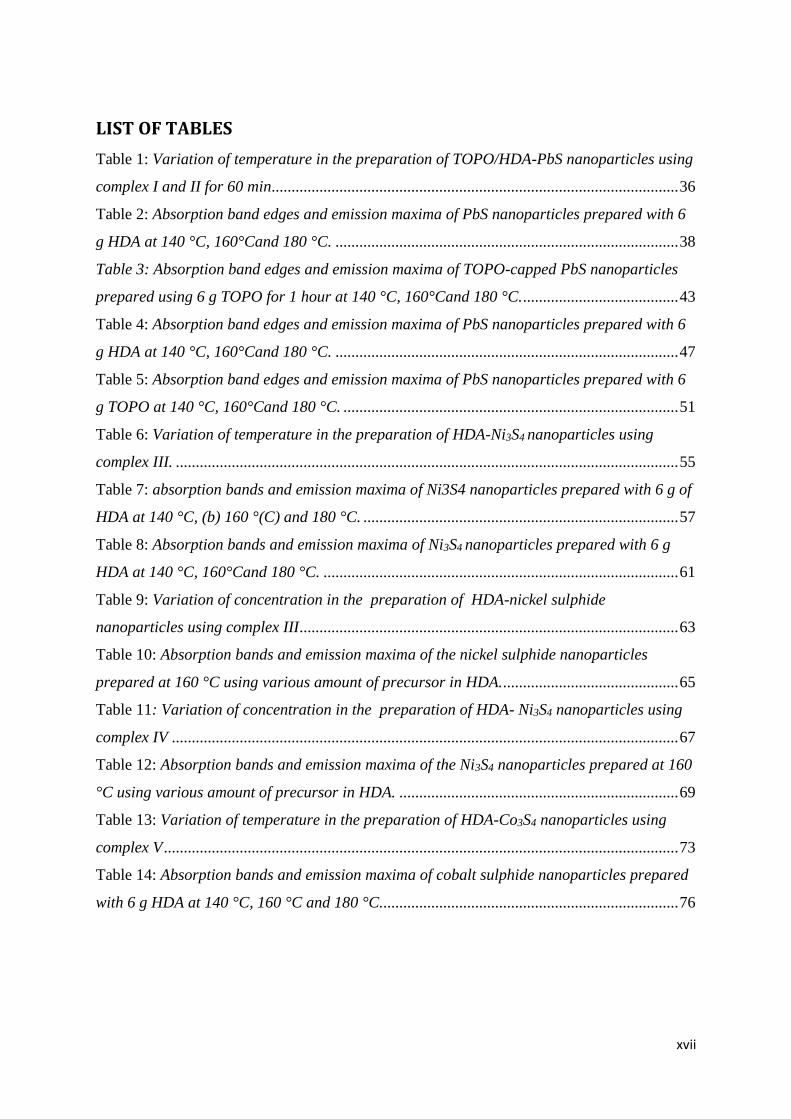
LIST OF TABLES
Table 1: Variation of temperature in the preparation of TOPO/HDA-PbS nanoparticles using
complex I and II for 60 min...................................................................................................... 36
Table 2: Absorption band edges and emission maxima of PbS nanoparticles prepared with 6
g HDA at 140 °C, 160°Cand 180 °C. ...................................................................................... 38
Table 3: Absorption band edges and emission maxima of TOPO-capped PbS nanoparticles
prepared using 6 g TOPO for 1 hour at 140 °C, 160°Cand 180 °C. ....................................... 43
Table 4: Absorption band edges and emission maxima of PbS nanoparticles prepared with 6
g HDA at 140 °C, 160°Cand 180 °C. ...................................................................................... 47
Table 5: Absorption band edges and emission maxima of PbS nanoparticles prepared with 6
g TOPO at 140 °C, 160°Cand 180 °C. .................................................................................... 51
Table 6: Variation of temperature in the preparation of HDA-Ni3S4 nanoparticles using
complex III. .............................................................................................................................. 55
Table 7: absorption bands and emission maxima of Ni3S4 nanoparticles prepared with 6 g of
HDA at 140 °C, (b) 160 °(C) and 180 °C. ............................................................................... 57
Table 8: Absorption bands and emission maxima of Ni3S4 nanoparticles prepared with 6 g
HDA at 140 °C, 160°Cand 180 °C. ......................................................................................... 61
Table 9: Variation of concentration in the preparation of HDA-nickel sulphide
nanoparticles using complex III ............................................................................................... 63
Table 10: Absorption bands and emission maxima of the nickel sulphide nanoparticles
prepared at 160 °C using various amount of precursor in HDA. ............................................ 65
Table 11: Variation of concentration in the preparation of HDA- Ni3S4 nanoparticles using
complex IV ............................................................................................................................... 67
Table 12: Absorption bands and emission maxima of the Ni3S4 nanoparticles prepared at 160
°C using various amount of precursor in HDA. ...................................................................... 69
Table 13: Variation of temperature in the preparation of HDA-Co3S4 nanoparticles using
complex V ................................................................................................................................. 73
Table 14: Absorption bands and emission maxima of cobalt sulphide nanoparticles prepared
with 6 g HDA at 140 °C, 160 °C and 180 °C........................................................................... 76

xviii
LIST OF EQUATIONS
Equation 1: One-pot synthesis of DTC metal complexes……………….…………………..17
Equation 2: Preparation of benzimidazole..............................................................................17
Equation 3: Debye-Scherer equation………………………….……………….....................52

xix
LIST OF REACTION SCHEMES
Scheme 1: Resonance structures of dithiocarbamate ligand. ................................................... 14
Scheme 2: Preparation of metal complexes by direct ligand addition. .................................... 16
Scheme 3: Amine structures .................................................................................................... 18
Scheme 4: Dithiocarbamates coordination modes ................................................................... 20
Scheme 5: Structural arrangements of dithiocarbamates complexes ....................................... 21
Scheme 6: Targeted complex reaction equation of lead benzimidazole dithiocarbamate ....... 30
xx
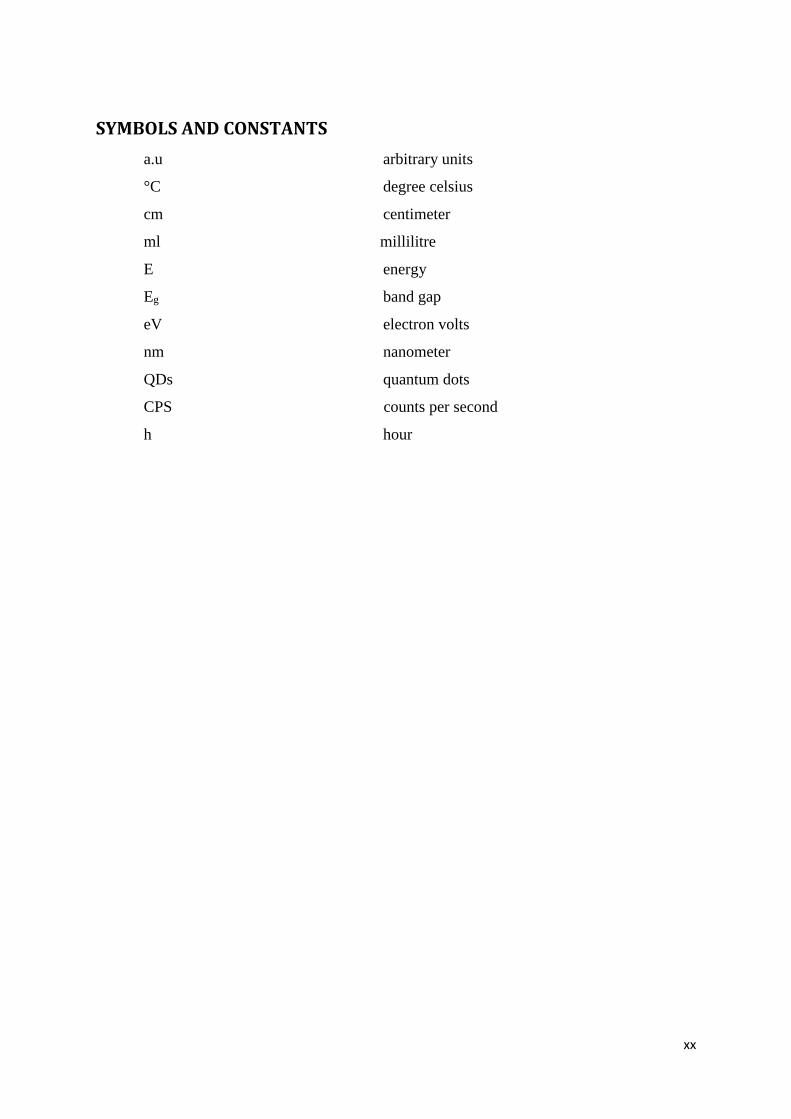
SYMBOLS AND CONSTANTS
a.u arbitrary units
°C degree celsius
cm centimeter
ml millilitre
E energy
Eg band gap
eV electron volts
nm nanometer
QDs quantum dots
CPS counts per second
h hour

xxi
LIST OF ABBREVIATIONS
FT-IR Fourier transformer infrared
UV/vis Ultraviolet visible
EA Elemental analysis
PL photoluminescence
TEM transmission electron microscopy
TGA thermogravimetric analysis
XRD X-ray diffraction
DTC dithiocarbamates
HDA hexadecylamine
TOP tri-octylphosphine
TOPO tri-n-octylphosphine oxide

xxii
DISSERTATION OUTLINE
Chapter 1
This chapter focuses on the introduction of the nanoparticles and dithiocarbamate complexes.
It also focuses on their applications, literature reports on the methods of synthesis on
dithiocarbamates and nanoparticles. Aim, objectives, problem statement and purpose of study
are also described.
Chapter 2
This chapter deals with the experimental and analytical procedures used in the preparation of
ligands, complexes and nanoparticles. The characterization techniques are reviewed.
Chapter 3
This chapter focuses on the findings of the complexes; results obtained from different
techniques such as FTIR spectroscopy, elemental analysis and TGA are interpreted, discussed
and concluded.
Chapter 4
This chapter focuses on the findings of HDA and TOPO capped PbS nanoparticles from
different complexes. Results obtained from different techniques are interpreted and discussed.
The synthetic parameters such as temperature and type of capping agents are studied for their
influence on the size, structure, composition and arrangement of lead sulphide nanoparticles.
Chapter 5
This chapter focuses on the findings of HDA capped NiS nanoparticles from different
complexes. The reaction conditions such as temperature and precursor concentration are
studied for their influence on size and shape of the nanoparticles. Results obtained from
different techniques are interpreted and discussed.
Chapter 6
This chapter focuses on the findings of HDA capped CoS nanoparticles from different
complexes. Temperature is studied for its influence on size and shape of the nanoparticles.
Results obtained from different techniques are interpreted and discussed.

xxiii
Chapter 7
General conclusions based on the interpretation of data are drawn. Recommendations for the
future work are also put forward in this chapter.

1
Chapter 1
Background and literature review
1.1 Nanoparticles
Nanotechnology and nanoscience deal with matter at the scale of 1 billionth of a meter (i.e., 10
− 9 m = 1 nm), and these also deals with the manipulation of matter at the atomic and molecular
scale. In simple terms, it can be defined as engineering at a very small scale. It is an exciting
area of scientific development which promises more for less. It offers the ability to both
improve the existing technologies and create smaller, cheaper, lighter and faster devices that
can do more and cleverer things, use less raw materials and consume less energy. It can be
applied to many research and development areas such as medicine, manufacturing, computing,
textiles and cosmetics. Nanoparticles are the most vital components in the fabrication of a
nanostructures, and are far smaller than the world of everyday objects that are described by
Newton’ s laws of motion, but bigger than an atom or a simple molecule that are governed by
quantum mechanics. One of the major challenges that concerns nanoparticles synthesis and
potential applications containing nanoparticles is the controlled design of such systems. They
must be synthesized to possess desired surface properties, composition, geometry, and the
structure and must be arranged properly for specific applications containing them to work.
Nanocrystals are crystals with at least one dimension between 1 and 100 nm which have a finite
number of atoms (~100 to ~10,000 atoms) (Fahlman, 2007). In 1857, It was recognised that
dyes consist of tiny amounts of metals (Faraday, 1857). A century later, semiconductor
nanocrystals were discovered (Brus, 1984). The colloidal particles display a remarkable
tendency to remain single-crystalline and later they were named as nanocrystals. Nanocrystals
have high surface area and a large fraction of the atoms are on its surface. A small nanocrystal
of 1 nm diameter will have as much as 30% of its atoms on the surface, while a larger
nanocrystal of 10 nm will have approximately 15% of its atoms on the surface (Rao et al.,
2002). Nanocrystals are characterized by a single-domain crystalline lattice. Interest in
nanocrystals has been growing gradually due to their unique properties as a bridge between
2
atoms and bulk solids as well as their potential applications (Halperin W. P., 1986). In
principle, the electron confinement by a nanocrystal provides the most powerful means to
manipulate the electronic, optical, and magnetic properties of a solid material. This is an
explanation why nanocrystals have been the primary source for discovering and studying
quantum size effects, with examples of quantized excitation (Murray et al., 2000), Coulomb
blockade (Maheshwari et al., 2008), metal-insulator transition (Markovich et al., 1999), and
super-paramagnetism (Jeong et al., 2007). It has been discovered that size and shape of
nanocrystals are key elements for the determination of their unique chemical and physical
properties. Bulk materials have their own characteristics and innate properties such as colour
band-gap energy and phase transition temperature. Semiconductors with reduced dimension
display unique electronic, optical, magnetic and photochemical properties that significantly
differ from their bulk materials (Sangeetha et al., 2014). This is due to their high surface area
to volume ratios and quantum confinement (Roco, 1999). It has been reported that crystal
morphology plays an important role due to the size and shapes of the crystal and it is one of
the desired goals in material science to understand exact control of the morphology of
semiconductor materials (Quadri et al., 1996). Quantum confinement region can be achieved
by tuning the optical properties of the semiconducting materials (Shinji et al., 1998). Quantum
confinement is observed when size of the nanoparticles is below Bohr radius. To reduce the
size of the particles below Bohr radius, the surface of the particles needs to be passivated at the
time of formation (Soo et al., 1994). And to achieve the quantum confinement regime,
introduction of capping agents plays an important role in the synthesis of nanoparticles.
Capping agents such as amines (Huixiang et al., 2005) and thiols (Aparna et al., 2008) are very
good capping molecules that produce semiconductor nanoparticles below the Bohr radius.
1.2 Preparative methods for the synthesis of nanoparticles
Different methods for the synthesis of nanoparticles have been reported, which generally
follow two routes; precipitation from solution, often at room temperature and often involving
the reduction of a metal salt and the decomposition of molecular precursors at high temperature
in either the solid, liquid (solution) or vapour phase. The chemical methods for the production
of nanoparticles are discussed as follows;

3
1.2.1 Colloidal route
The first routes to be reported to the small particles involved the controlled precipitation of
dilute colloidal solutions and the cessation of growth immediately after nucleation. Particles
were typically monomeric in the early years thereafter nucleation and growth were properly
inspected. Furthermore small crystals which are less stable dissolve, and then recrystallize on
larger and more stable crystals and the process is called Ostwald ripening. The colloidal
stability can be upgraded by using solvents with a low dielectric constant. For this route to be
effective nanoparticles must have low solubility. It can be achieved by the correct choice of
solvent, temperature, passivating agent and pH. Highly monodispersed particles are obtained
if nucleation and growth processes are distinctly separate. The particles prepared by this route
are not adequately stable at higher temperatures before annealing without agglomeration
(Rossetti et al., 1985). Brus have made important contributions to this field, especially in the
studies of CdS. An aqueous solution of ammonium sulphide and cadmium sulphate were used
to prepare CdS nanoparticles (Rossetti et al., 1984), reported by Brus and co-workers. The
synthesised stable CdS nanoparticles were achieved by using acetonitrile as the solvent in the
presence of a styrene or maleic anhydride copolymer (Rossetti et al., 1984). CdS and ZnS
nanoparticles have also been synthesized from aqueous and methanolic solution with organic
capping agent (Rossetti et al., 1984). Hines reported the synthesis of PbS nanocrystalline
quantum dots using this route. Photoluminescence spectra exhibited strong emission peaks
near-infrared (Hines and Scholes, 2003). Jun reported shape control of semiconductor and
metal oxide nanocrystals using nonhydrolytic colloidal routes, the observed morphology
observed were polyhedrons, rods, wires, plates, prisms, branched rods, stars, inorganic
dendrites and dumbbells (Jun et al., 2006). Spherical CuS nanoparticles have been synthesized
via a simple colloidal synthesis route, using copper acetate monohydrate and thiourea as copper
and sulphur sources. XRD patterns displayed the hexagonal phase of CuS (Dutta and Dolui,
2008). Romano-Trujillo reported lead selenide nanoparticles using this route. Extran
(Na5P3O10, NaOH and H2O) was used as surfactant and the size of PbSe nanoparticles was
varied by changing the molar concentration of Pb: Se. The observed particles size was found
to be between 14 and 20 nm as calculated from the XRD patterns and it was in good agreement
with sizes from SEM and TEM (Romano-Trujillo et al., 2012 ). Monodispersed cubic ZnS and
hexagonal CdS nanoparticles were synthesized via the colloidal-route and N-butyl aniline was
used as a surfactant. The average diameters obtained were 4 nm and 6 nm respectively
(Onwudiwe and Strydom, 2013). Orthorhombic AgGaS2 nanocrystals were synthesized using

4
this route. These orthorhombic AgS nanocrystals displayed great potential in visible-light-
driven photocatalysis (Fan et al., 2014).
1.2.2 Synthesis in confined matrices
Different matrices such as molecular sieves (Johnson and La Mer, 1947, Wang and Herron,
1987), gels (Petit et al., 1994, Towey et al., 1990), glasses (Gao et al., 1994),
micelles/microemulsions (Abe et al., 1995, Watkze and Fendler, 1997) and zeolites (Green and
O’Brien, 1998) have been used for the preparation of semiconductor nanoparticles to restrict
growth with diameters ranging from 13 to 125 Å. In determining the properties of the particles
and the properties of the system, which include internal/external surface properties of zeolites
and the liability, the matrix may also play a role. The growth of particles in the internal cavities
of zeolites limits the particle size of the material to less than 20 nm. Reports show 13 Å of the
smallest particles to be molecular in nature and they exhibit discrete absorption bands in their
optical spectra. Two theoretical methods were proposed, which take into account the effect of
non-parabolicity, to explain the observed size-dependent optical shifts for PbS nanocrystals. It
was reported that the effective mass approximation fails for PbS nanocrystals. Phenyl capped
cadmium and zinc chalcogenides nanoparticles produced 13 micelle solutions where silyl
chalcogenide was reacted with a microemulsion containing the metal ion to form nanoparticles.
The crystal surface composition was interesting due to its ability to react further with other silyl
groups owing to excess Cd2+ sites effectively growing larger and developing a different surface
capping (Steigerwald et al., 1988). CdS has been synthesized in two different zeolites by ion
exchange from the sodium cationic form to the cadmium cationic form, followed by exposure
to H2S gas. Different particles sizes were found depending on the amount of cadmium ions
used (Green and O’Brien, 1998). Nanoclusters size could be controlled by either using the
potassium or sodium resin, which changed pore diameters. Lee studied the optimization of Ge
nanoparticles confined in a carbon matrix for lithium battery anode material. Different sizes of
Ge nanoparticles confined in a carbon matrix were obtained from XRD and TEM which
showed that Ge nanoparticles' size increased from 8 to 100 nm as the annealing temperature of
the as-prepared samples increased from 400 to 800 °C (Lee et al., 2007). Spherical copper
sulphide nanoparticles embedded in PVA matrix was reported (Nath and Kalita, 2012). The
thin films were deposited on glass substrates at room temperature using same volumes and
moles of copper acetate and thiourea in an alkali medium. UV-visible absorption and PL

5
measurements showed an enhancement of band gap. MoS2 nanocrystals confined in a DNA
Matrix were reported (Goswami et al., 2013), the average size of highly crystalline nanocrystals
was ∼5 nm. UV–vis studies along with band gap calculations confirmed the quantum
confinement of the nanocrystals (Goswami et al., 2013). Deng and co-workers reported a
strategy to stabilize single-atom coordinative unsaturated iron sites by embedding highly
dispersed FeN4 centres in the graphene matrix at room temperature. FeN4 centre was highly
dispersed and well stabilized by the graphene matrix, which then enhanced the activity and
stability for the oxidation of benzene to phenol (Deng et al., 2015).
1.2.3 Metal-organic routes
(Murray et al., 1993) first reported a popular method for preparing high quality, crystalline
monodispersed nanoparticles. Volatile metal alkyl (dimethylcadmium) and a chalcogen source
TOPSe (trioctylphosphine selenide) were mixed in tri-n-octylphosphine (TOP) and injected
into hot TOPO (tri-n-octylphosphine oxide), a polar coordinating Lewis base solvent at high
temperatures (120-300 °C). Thermolysis of precursors in high boiling point coordinating
solvent such as TOPO was reported to be an effective method not only for II-VI, but also for
Ill-V nanomaterials, which are difficult to prepare because of their increased covalent nature,
highly toxic reagents used and fast oxidation (Murray et al., 1993, Revaprasadu et al., 1999a).
During the preparation CdSe nanoparticles, nucleation was achieved by the introduction of
concentrated reagents resulting in immediate supersaturation and the formation of the nuclei
followed by slow growth and annealing, consistent with Ostwald ripening. Afterward the
solvent was added to a cooled solution, thereby increasing the barriers to flocculation.
Nanoparticles were then separated from decomposition by-products in the centrifuge, and they
were dissolved in a solvent (e.g. toluene) followed by centrifugation to dispose the by-products
resulting in an optically clear solution of TOPO-capped nanoparticles. The coordinating
solvent plays a significant role in stabilizing the nanocrysta1line colloidal dispersions and
passivating the nanoparticles surface. The advantage of this method over other methods is not
only the production of monodispersed particles but the gram scales of materials can be
produced. The group III-V nanomaterials were also prepared using a similar approach as above
by thermolysis of single molecular source precursors at 167 °C in 4-ethylpyridine acting both
as a solvent and a capping agent. Nanoparticles of high quality were produced showing distinct
quantum size effects in their optical properties (Revaprasadu et al., 1999a). Similar approach

6
was used (Murray et al., 1993) to synthesise TOPO capped InP nanoparticles which was reacted
with P (SiMe3)3 in hot TOPO with subsequent annealing of the particles in the presence of a
surfactant such as dodecylamine (Guzelian et al., 1996). The use of hazardous compounds such
as dimethylcadmium, Cd(CH3)2 in this method is one of limitations especially at high
temperatures. To overcome this problem, the use of single molecule precursors, a single
compound containing all the elements is required for the formation of nanocrystal, such as
alkyldiseleno- or alkyldithiocarbamato complexes (Trinidade and O`Brien, 1997, Trinidade
and O’Brien, 1996). Nanometric particles of InP are readily prepared by the decomposition of
the complex In(PBu2)3 at 167 °C in 4-ethylpyridine; the resulting materials show marked
quantum confinement effects, and was investigated using optical absorption and
photoluminescence spectroscopies and transmission electron microscopy. Mourdikoudis
reported anisotropic growth of a highly symmetrical crystal structure using this route. Reaction
conditions such as precursors, solvents, temperature, reducing agents, reaction time, and types
and ratios of surfactants, such as alkyl amines, carboxylic acids, and phosphine oxides yielded
anisotropic particles of Fcc Ni nanoparticles (Mourdikoudis et al., 2013).
1.2.4 Single-source precursor method
The single source or ‘one-pot’ method involves the thermolysis of the precursor in a high
boiling point coordinating solvent such as tri-n-noctylphosphine oxide (TOPO) or
hexadecylamine (HDA). In this method the metal-chalcogenide bond is present at the complex
stage and it has proven to be a very efficient route to high-quality nanoparticles. This method
has an advantage over the other methods of preparation because it avoids the use of volatile,
pyrophoric and toxic decomposition by-products. In this method the resulting precursors are
air and moisture stable. The use of this method reduces the chances of incorporating impurities
into the nanoparticles, and low deposition rates are possible. Revaprasadu reported the use of
this method in preparing InS and InSe nanoparticles using metal thio- and se1eno- precursors
(Revaprasadu et al., 1999b). Nair reported the synthesis of CdS nanocrysta1s using [Cd
(NH2NHNH2)2Cl2] as a single-source precursor and anisotropic shaped particles were found.
The observed rods displayed a very slight blue shift in relation to bulk CdS (Nair et al., 2002).
The synthesis of CdS nanoparticles from the complex of cadmium with dithiothiurea was also
reported (Nair et al., 2003). Cai reported the synthesis of hexadecylamine (HDA)-capped CdS
nanoparticles prepared by the single-source precursor method. Parameters such as reaction

7
temperature, monomer concentration and reaction time affected the size and shape of the
nanoparticles (Cai et al., 2008). Mthethwa reported the synthesis of HDA capped CdS
nanoparticles prepared from CdS heterocyclic cadmium dithiocarbamates as single source
precursors and it was found precursor concentrations have an effect in the production of
quantum dots as the presence of anisotropic particles were observed at lower concentration
(Mthethwa et al., 2009). Ramasamy and co-workers reported Co4S3 phase in a monodispersed
form using single-molecule precursor-based approach. Parameters such as reaction temperature
precursor concentration affected the size and shape of the nanoparticles yielding different
phases of cobalt sulphide (Ramasamy et al., 2010). Nyamen also used the similar approach by
synthesizing TOPO and HDA capped ZnS from Zn (II) heterocyclic piperidine and
tetrahydroquinoline dithiocarbamates as precursors. Both complexes gave close to spherical
and elongated particles of ZnS when passivated by HDA at different reaction temperatures and
the thermolysis in TOPO produced spherical particles only (Nyamen et al., 2014). Rofney
reported phase control during the synthesis of nickel sulphide nanoparticles from
decomposition of the iso-butyl derivative dithiocarbamate precursors. It was found that there
was temperature-dependence of the phase of the nickel sulphide formed. At low temperatures
(150 °C), pure α-NiS was formed. Upon raising the temperature, increasing amounts of β-NiS
were produced and at 280 °C pure form was formed (Roffey et al., 2016). High quality close
to spherical SnS nanoparticles using single molecular precursor route were reported. HRTEM
and XRD analysis revealed the orthorhombic crystal phase. It was also reported that the
oriented attachment mechanism could have been the reason for the anisotropic SnS
nanoparticle growth formed (Pullabhotla and Mabila, 2016).
1.3 Metal sulphides used: their applications and literature review
Since nanoparticles are not stable, their properties (electrical, optical, chemical, mechanical,
magnetic, etc.) can be selectively controlled by engineering the size, morphology, and
composition of the particles. These new substances will have improved properties from their
parent material. Nanoparticles can make metals stronger and harder, gives ceramics enhanced
formability and ductility, enables normally insulating materials to conduct heat or electricity,
and make protective coatings transparent. Hence industries can re-engineer many products and
design novel product or processes to function at unprecedented levels. Nanoparticles are being
used in many fields such as in manufacturing, medicine material and the environment.

8
1.3.1 Lead sulphide nanoparticles
Lead sulphide with the chemical formula PbS, is an inorganic compound. It is also known as
galena, which is the principal ore and important compound of lead. It is one of the earliest
materials to be used as a semiconductor as it tends to crystallize in sodium chloride. When
heated to decomposition lead sulphide becomes toxic and forms lead and sulphur oxides. The
crystal structure most commonly used for PbS is the face-centered cubic galena structure. PbS
is an important group IV-VI metal chalcogenide semiconductor. It has direct narrow band gap
of 0.41 eV at 300K and a large excitonic Bohr radius of 18 nm (Mousa, 2011b). Lead sulphide
absorption band can be tuned to anywhere between near IR to UV (0.4μm) covering the entire
visible spectrum, while achieving the quantum confinement region (Wang et al., 1987). It can
be used in different fields, such as fabrication of solar cells, IR detectors, light emitting diodes,
optical communications and tunable IR lasers (Karami et al., 2013). Due to the above properties
and its applications being carried out, it has attracted considerable attention in recent years.
Different methods such as solvothermal, electrodeposition, chemical methods, microwave
irradiation, etc. have been used to synthesise PbS nanoparticles. Moloto and co-workers
reported TOPO capped PbS and CuxSy nanoparticles from alkylthiourea lead and copper
complexes using a single source precursor method which showed quantum confinement effects
with a blue shift in their absorption spectra (Moloto et al., 2005). Yang reported PbS nanobelts
(width 50-120 nm and length over 3 μm) which were self-assembled in a simple reverse micelle
solvent system containing the surfactant of polyoxyethylene dodecyl ether (C12E9)(Yang et al.,
2006). A wet chemical route was used by Navaneethan in the synthesis of N-Methylaniline (N-
MA) capped lead sulphide (PbS) nanoparticles, the observed morphology was spherical
nanoparticles with the particle size around 5 nm (Navaneethan et al., 2009). Mousa reported
different sizes of aggregated quantum dots of PbS synthesized using lead oxide as lead source
and bis(tri methylsilyl) sulphide as sulphur source (Mousa, 2011a). Wattoo and co-workers
reported the preparation of lead sulphide nanoparticles from N, N-dialkyl amine
dithiocarbamate using a single source precursor and dual sources methods. The composites
were fabricated by stabilizing chemically synthesized semiconductor PbS nanocrystals into
lauryl methacrylate and ethyleneglycol dimethacrylate matrix in the presence of tri-n-
octylphosphine. It was found that incorporation of the PbS nanoparticles showed the stability
and functionality into the tailored polymerix matrix and TEM revealed that nanoparticles are

9
almost cubical in morphology (Wattoo et al., 2012). Nabiyouni and co-workers synthesized
PbS nanoparticles at room temperature via a simple chemical reaction where thiophenol was
used as the capping agent and sodium sulfide was used as a sulfur source. It was found that
electronic absorption spectra as well as particle sizes depend on the used capping agents
(Nabiyouni et al., 2012). Borhade did a comperative study on PbS and Co doped PbS
nanoparticles and their catalytic activities using hydrothermal methods. XRD revealed cubic
structure of PbS nanoparticles with particle size of 31 nm (Borhade and Uphade, 2012). PbS
nanowires were prepared by chemical precipitation method. In this method, sodium sulfide and
lead acetate concentration, type and concentration of synthesis additive, pH, bath temperature,
and ultrasonic wave radiation were effective parameters that can changed the morphology and
the particle sizes (Karami et al., 2013). Sangeetha reported the synthesis of PbS in aqueous
medium at room temperature and it was found that the as-prepared PbS semiconductor
nanoparticle was monodisperse and have a very narrow size distributions and narrow band gap
than other semiconductor chalcogenide (Sangeetha et al., 2014). The result showed that the
obtained nanoparticle is cubic in nature with average grain size of 11 nm (Sangeetha et al.,
2014). Sakthivel also studied lead sulphide nanoparticles using hydrothermal methods. The
structural and microscopic investigations of the sample showed formation of clustered cubic
PbS nanoparticles with cubic crystal structure (Sakthivel et al., 2014).
1.3.2 Nickel sulphide nanoparticles
Transition metal sulfides exhibit interesting electronic, optical, thermoelectric and
photoelectric properties (Friemelt et al., 1993, Oviedo-Roa R. et al., 2006, Srivastava and
Avasthi, 1992). Nickel sulphide is an important member in the family of transition metal
sulfides. These nanoparticles are desirable materials to produce due to many applications they
find in alternative energy. Nickel sulphide has much more complicated phase diagram than
cobalt sulfides and iron sulfides. Their chemical composition have many crystalline phases
such as α-NiS, β=NiS, NiS2, Ni3S2, Ni3S4, Ni7S6 and Ni9S8(Kullerud and A., 1962). Ni3S2
phase has shown potential as a low cost counter electrode material in dye sensitised solar cells
(Mulmudi et al., 2011), while the α-NiS phase has been applied as a cathode Material in
lithium-ion batteries(Han et al., 2003).It is a p- type semiconductor with a narrow band gap of
0.4eV. Numerous methods have been used to synthesize NiS nanoparticles. A sonochemical
method (Wang et al., 2002) and a micro-emulsion system (Khiew et al., 2004) were used to

10
synthesize NiS nanoparticles. Zhang and Ghezelbash reported the synthesis urchin-like NiS
using solvothermal method (Ghezelbash and Korgel, 2005, Zhang et al., 2005). Hu reported
the synthesis of NiS hollow nanospheres via ɤ-irradiation method (Hu et al., 2003). Ghezelbash
reported the solventless thermolysis of a nickel alkylthiolate molecular precursor which
produced nanorods and triangular nanoprisms of NiS (Ghezelbash et al., 2004). Ni3S4
nanocrystal was synthesised by the thermal decomposition of NiCl2 and elemental sulphur in
oleylamine (Ghezelbash and Korgel, 2005). A template-promoted growth was reported by
Morris and co-workers (Barry et al., 2010) for NiS nanoparticles, where NiS nanoparticles were
grown on an anodic alumina templates by decomposing nickel xanthate complex in
supercritical CO2 at 450 °C. Furthermore hollow spheres of NiS were synthesized using silica
nanospheres as templates (Zhu et al., 2011). In addition another method deploying Na2SO4 or
Na2S was used to sulfurize Ni(OH)2 in a Teflon-lined autoclave at 180 °C for the synthesis of
NiS hollow spheres (Wang et al., 2011). Tatsumisago and co-workers (Aso et al., 2011)
reported a thermal decomposition method for different stoichiometries of NiS nanocrystals.
Thermal decomposition of single-source precursors such as alkyl xanthates (Pradhan et al.,
2003) and their pyridine adducts (Alam et al., 2008), mercaptobenzothiazole (Geng et al.,
2007), (tetramethylethylenediamine) Ni(SCOC6H5) (Tian et al., 2009), 1,1,5,5-tetra-iso-
propyl-2- thiobiuret (Abdelhady et al., 2012) and polysulfide [Ni(N-methylimidazole)6]S8
(Beal et al., 2010) in a hot coordinating solvent formed a mixture of rods and spheres of NiS,
ellipsoidal NiS nanoparticles, alpha or beta NiS nanocrystals, and NiS2 or Ni1-xS nanocrystals,
respectively. Wilton-Ely and co-workers (Wilton-Ely et al., 2008) prepared multimetallic
assemblies using piperazine-based dithiocarbamate building block and Ni(dppe)Cl2. These
systems have been used to functionalise gold nanoparticles (Knight et al., 2009). Banerjee
reported a simple chemical route of preparing pure and copper doped NiS Nanoparticles, the
nanoparticles were found to be nanocrystalline with rhombohedral phase and the crystallite
size of NiS nanoparticles was found to be 43.09 nm (Banerjee et al., 2013). Chauhan reported
the preparation of [Ni(S2CN (CH2)4CHOH) (dppe)] +X-as a single-source precursor for the
nickel sulfides nanoparticles (Chauhan et al., 2014 ). Roffey reported the solvothermal
decomposition of a nickel dithiocarbamate in primary amine, it was found that there is
temperature-dependence of phase of the nickel sulphide formed: At low temperatures (150 °C),
pure α-NiS was formed but Upon raising the temperature, increasing amounts of β-NiS were
produced and at 280 °C this was formed in pure form (Roffey et al., 2016). To the best of our
11
knowledge and findings, [Ni(S2N2C8H5)2] and [Ni(S2N2C9H7)2] species have never been
explored as possible single-source precursor for the nickel sulfides nanoparticles.
1.3.3 Cobalt sulphide nanoparticles
Semiconductor nanocrystals are promising candidates for future electronic and photonic
devices. They have unique physical and chemical properties (Zhou et al., 2005). CoS is a
semiconductor has a band gap energy equal to 0.90 eV. Cobalt sulphide (CoS) belongs to the
family of group II-IV compounds with considerable potential for application in electronic
devices (Ramasamy et al., 2010). They have a complex phase diagram and their chemical
composition have many phases such as Co4S3, Co9S8, CoS, Co1-xS, Co3S4, Co2S3 and CoS2
(Rao and Pisharody, 1976). They can be used as ultra-high density magnetic recording
(Whitney et al., 1993), in solar energy as absorbers (Smith et al., 1980), anodes for Li-ion
batteries (Yue et al., 2007), , and catalysts for hydrodesulphurization and dehydrode-
aromatization (Feng et al., 2008). Cobalt sulphide is also used in selective coatings and solar
cells, temperature sensors, optical filters, optical wave guides and IR detectors (Cruz-Vazquez
et al., 2000, Deshmukh and Mane, 2011, Donald Okli and Cecilia okoli, 2012, Ezema and
Osuji, 2007, Nnabuchi and Chinedu, 2010, Sifuentes et al., 2000, Yu et al., 2002). The
properties of cobalt sulphide strongly depend on the particle size, shape, distribution and
surface. It is notable that various synthetic routes affected the properties, morphologies and
stochiometric compositions (Khaorapapong and Ogawa, 2011). Literature has shown a lot of
reports on the synthesis of cobalt sulfides micro- and nanocrystals with various morphologies,
such as Co9S8 and CoS2 nanoparticles (Qian et al., 1999), CoS nanowires (Bao et al., 2008a,
Ge and Li, 2003), thin film (Srouji et al., 2005), sea urchinlike Co9S8 (Liu, 2005) and Co3S4
octahedron (Bao et al., 2008c). Yin and co-workers reported the colloidal synthesis of hollow
cobalt sulphide nanocrystals based on the Kirkendall effect (Yin et al., 2006). Chen reported
Co3S4 nanotubes also based on the Kirkendall effect (Chen et al., 2007).Ramasamy and co-
workers reported Co4S3 phase in a nanodispersed form using single-molecule precursor-based
approach. Parameters such as reaction temperature precursor concentration affected the size
and shape of the nanoparticles yielding different phases of cobalt sulphide (Ramasamy et al.,
2010). Hierarchical structured Co1-xS microrods have been first fabricated in a high yield by
one pot-surfactant-assisted hydrothermal method (Liu et al., 2012).The synthesis of amorphous
12
CoS nanorods has been made by simple chemical precipitation method (Ariponnammal and
Srinivasan, 2013).
1.4 Reaction conditions
During the synthesis of nanoparticles, reaction conditions such as temperature, precursor
concentration, capping agents were varied.
1.4.1 Effect of temperature
Temperature is one of the major factors that contribute significantly on size and shape of the
nanoparticles. The final morphology of nanoparticles is governed by the preferred growth
regime of the reaction which can proceed in either a thermodynamic or a kinetic growth regime
(Peng et al., 2000a, Peng and Peng, 2002). Thermodynamically, all nanocrystals will grow
toward a shape that has the lowest energy at equilibrium and low monomer concentration,
yielding stable, isotropic-shaped nanocrystals (e.g., dots, cubes). In contrast, non-equilibrium
kinetic conditions are facilitated by low reaction temperatures and high monomer concentration
yielding selective anisotropic structures (e.g., rods, tetrapod’s) (Hu et al., 2001, Peng, 2003,
Peng et al., 2000b). Sibokoza and co-workers reported the effect of temperature on synthesis of
cobalt sulphide nanoparticles using cobalt diethyldithiocarbamate complex. The temperature was
varied at 80, 145 and 210 °C. The observed morphology of cobalt sulphide nanoparticles was
spherical in shape. It was observed that low temperature produced agglomerated particles. At
high temperatures, mono-dispersed particles were observed (Sibokoza et al., 2017).
1.4.2 Effect of additive type
Capping agents have chemical group with an affinity for either cation or the anion. The
complexing properties of the coordinating molecules play a significant role under the growth
conditions of the semiconductor nanocrystals. The nanocrystal grows inside a shell of capping
agents. The final particle size is determined by the growth kinetics. If bonding with the surface
atoms of the quantum dot is too weak there will be uncontrolled growth of the semiconductor
beyond the quantum size regime but if the bonding is too strong the particle growth will be
controlled. To produce quantum dots of the desired size, the growth conditions have to be
selected such that the binding of the capping agents is neither too strong nor too weak. Capping

13
agents are used as improving agents in nanomaterials synthesis to control the mechanism and
kinetics of the reaction. They can affect the morphology and particle sizes of the final product
(Phuruangrat et al., 2008). The size distribution of the nanoparticles can be controlled by adding
capping agents (Lelong et al., 2008). Different surfactants have been employed in the synthesis
of nanoparticles. Among the synthesis parameters, the additive type had more effects on
morphology of the synthesized PbS samples. In this study, the effects of HDA and TOPO were
investigated on the morphology and particle sizes of PbS nanoparticles by varying temperature,
and the amounts of the other parameters of synthesis were kept constant
1.4.3 Effect of concentration
The concentration of the precursor plays an important role on both size and shape of the
nanoparticles. The concentration of the precursor has a profound effect on the size with high
concentration favouring large size (Cheng et al., 2010). The growth process of nanoparticles is
directed by the balance between kinetic and thermodynamic control. The concentration of the
precursor affects the shape of the nanoparticle. The effect of the concentration on shape is quite
complex, but it have been proposed that chemical potential of nanoparticle are related to the
formation of nanoparticles with different size and morphology (Sakthivel et al., 2014). The
chemical potential of the reaction is mainly determined by monomer concentration at fixed
temperature.
1.4.4 Ostwald ripening
Particle ripening occurs after particle growth. This can either focus or defocus the particle size
distribution as there is an exchange of monomer from particle to particle in solution. It is
thermodynamically more favourable for small particles to lose monomer and for large particles
to gain, growing at the former’s expense during Ostwald ripening. This process is driven by
the favourable reduction of the percentage of surface particles with hanging bonds, therefore
increasing the monomer coordination and reducing particle surface energy. This process leads
to the larger particles growing faster than the smaller particles which are decreasing further in
diameter, overall defocussing the particle size. Eventually this leads to the total dissolution of
the smaller particles, thereby reducing the total number of particles in the system. The process
14
can be prevented by the use of capping agents, lowering the reaction temperature or by adding
more monomer (Kwon and Hyeon, 2011).
1.5 Dithiocarbamates
Carbon disulphide has been proven to be a versatile ligand (Baird and Wilkinson, 1967) with
a great tendency to react with various amines resulting in the formation of an important class
of compounds known as dithiocarbamates. Dithiocarbamates have attracted more academic
interest due to their synthetic flexibility and dual nature of acting as monodentate, bidentate
chelating or bridging ligands (Sharma et al., 2012) coordinating through both sulphur atoms
and both tetra and hexa-coordinated complexes of many transition metal ions have been
isolated(El-Masry et al., 2000, Pawar et al., 2011). These compounds are known to bind
strongly to many metal ions through sulphur atoms. They are being applied in chemical
processes, such as vulcanization, antimicrobial activity (Pawar et al., 2011) pharmaceutical
industry (El-Masry et al., 2000) medicine etc. They have interesting electrochemical and
optical properties owing to their redox behaviour and strong coordination ability (Lou et al.,
2006). Dithiocarbamates (DTC) ligands readily form chelates with all transition metal ions
through its two donor sulphur atoms. Sulphur atoms of dithiocarbamate ligands possess δ-
donor and π-back-donation characteristics of the same order of magnitude. These ligands are
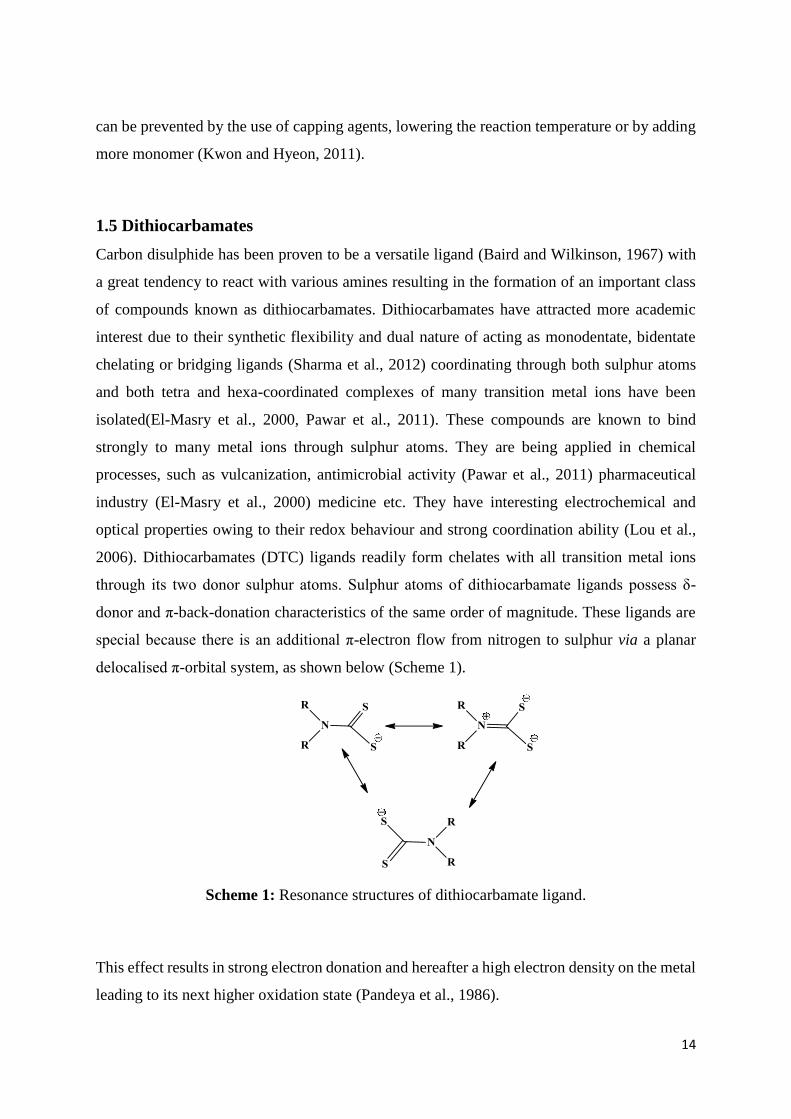
special because there is an additional π-electron flow from nitrogen to sulphur via a planar
delocalised π-orbital system, as shown below (Scheme 1).
Scheme 1: Resonance structures of dithiocarbamate ligand.
This effect results in strong electron donation and hereafter a high electron density on the metal
leading to its next higher oxidation state (Pandeya et al., 1986).

15
1.6 Transition metal dithiocarbamates complexes
Dithiocarbamates (DTC) form complexes with all transition metals. Their ability to form
complexes with all metals is related to the presence of sulphur atoms and delocalization of a
positive charge from a metal to the periphery of the complex. Transition metal dithiocarbamate
complexes were first reported in 1900 and since then DCT complexes have been extensively
studied. Bhatt and co-workers studied the reactions of mono and bis(cyclopentadienyl)
hafnium(IV) chloride with potassium salts of dithiocarbamic acids in 1:1 and 1:2 molar ratios
in refluxing tetrahydrofuran. The complexes were monomeric, non-electrolyte in nature and
have showed the bidentate behaviour of ligands (Bhatt et al., 2001). Das synthesized
(dithiocarbamato) -Ph-benzyl-2-(arylazo) imidazolepalladium (ii) perchlorates and studied
their redox reactions. Electrochemical studies revealed azo group reduction (Das and Sinha,
1998).
1.7 Synthetic methods
Transition metal dithiocarbamates can be synthesised using different methods. The most used
method is the direct addition of the dithiocarbamates salt to the metal salt.
1.7.1 Direct ligand addition
This method has few limitations; several researchers have used this method to prepare a large
number of complexes (Karlin, 2005). Most of the transition metal complexes have been
prepared using this method. From literature, a number of Pd and Pt DTC complexes have been
prepared using this method (Manav et al., 2004, Manav et al., 2006). Different ratios have been
used in the slow addition of a solution of the metal salt to a solution of DTC ligand. The desired
complex precipitate while stirring the mixture for few hours at room temperature (Jian et al.,
2002) or under reflux (Mohamed et al., 2009). Purification of the products is always achieved
by recrystallization. This method is not suitable for complexes that are not air stable. Prakasam
and co-workers reported the synthesis, NMR spectral and single crystal X-ray structural studies
on Ni(II) dithiocarbamates with NiS2PN, NiS2PC, NiS2P2 chromophores using direct ligand
addition method (Prakasam et al., 2007). Tarique extensively studied the first series transition
metals with different nitrogen and sulphur containing ligands using this method (Tarique, 2011,
Tarique, 2012, Tarique, 2015, Tarique and Aslam, 2008c, Tarique and Aslam, 2008b, Tarique
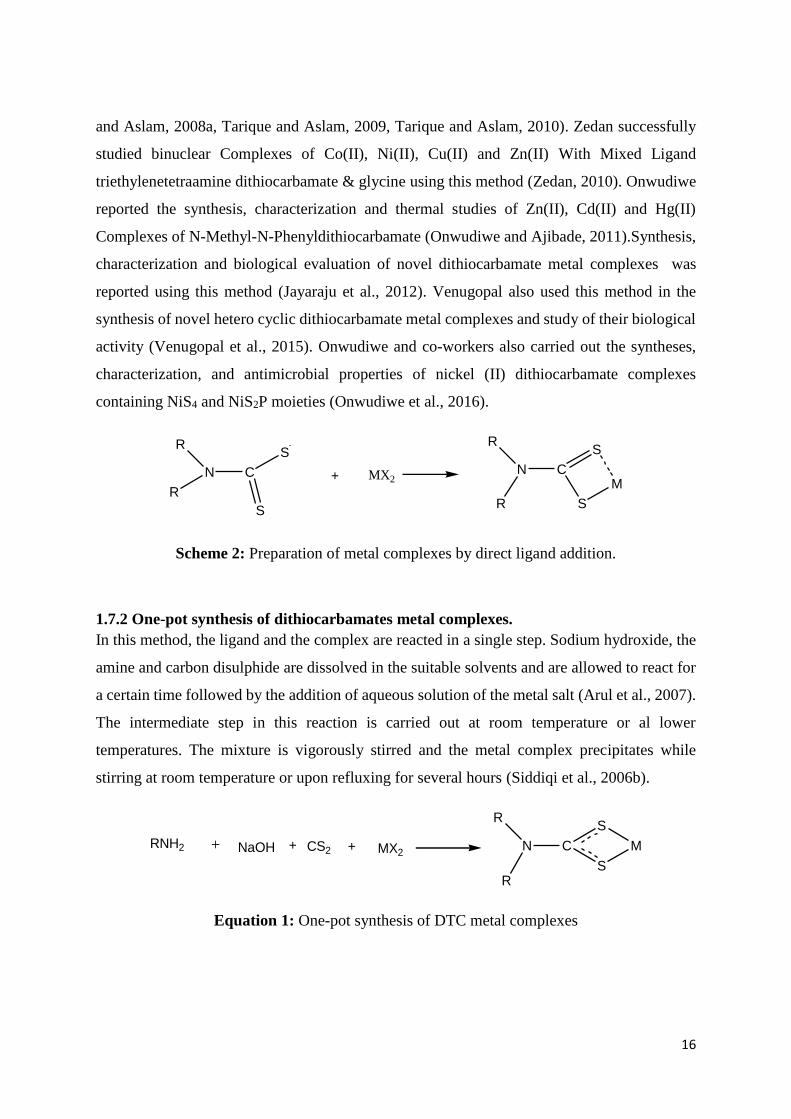
16
and Aslam, 2008a, Tarique and Aslam, 2009, Tarique and Aslam, 2010). Zedan successfully
studied binuclear Complexes of Co(II), Ni(II), Cu(II) and Zn(II) With Mixed Ligand
triethylenetetraamine dithiocarbamate & glycine using this method (Zedan, 2010). Onwudiwe
reported the synthesis, characterization and thermal studies of Zn(II), Cd(II) and Hg(II)
Complexes of N-Methyl-N-Phenyldithiocarbamate (Onwudiwe and Ajibade, 2011).Synthesis,
characterization and biological evaluation of novel dithiocarbamate metal complexes was
reported using this method (Jayaraju et al., 2012). Venugopal also used this method in the
synthesis of novel hetero cyclic dithiocarbamate metal complexes and study of their biological
activity (Venugopal et al., 2015). Onwudiwe and co-workers also carried out the syntheses,
characterization, and antimicrobial properties of nickel (II) dithiocarbamate complexes
containing NiS4 and NiS2P moieties (Onwudiwe et al., 2016).
R
N
R
C
S
+ MX2
R
N
R
C
S
S
M
S
Scheme 2: Preparation of metal complexes by direct ligand addition.
1.7.2 One-pot synthesis of dithiocarbamates metal complexes.
In this method, the ligand and the complex are reacted in a single step. Sodium hydroxide, the
amine and carbon disulphide are dissolved in the suitable solvents and are allowed to react for
a certain time followed by the addition of aqueous solution of the metal salt (Arul et al., 2007).
The intermediate step in this reaction is carried out at room temperature or al lower
temperatures. The mixture is vigorously stirred and the metal complex precipitates while
stirring at room temperature or upon refluxing for several hours (Siddiqi et al., 2006b).
RNH2 + NaOH CS2 MX2
R
N
R
C
S
S
M+ +
Equation 1: One-pot synthesis of DTC metal complexes
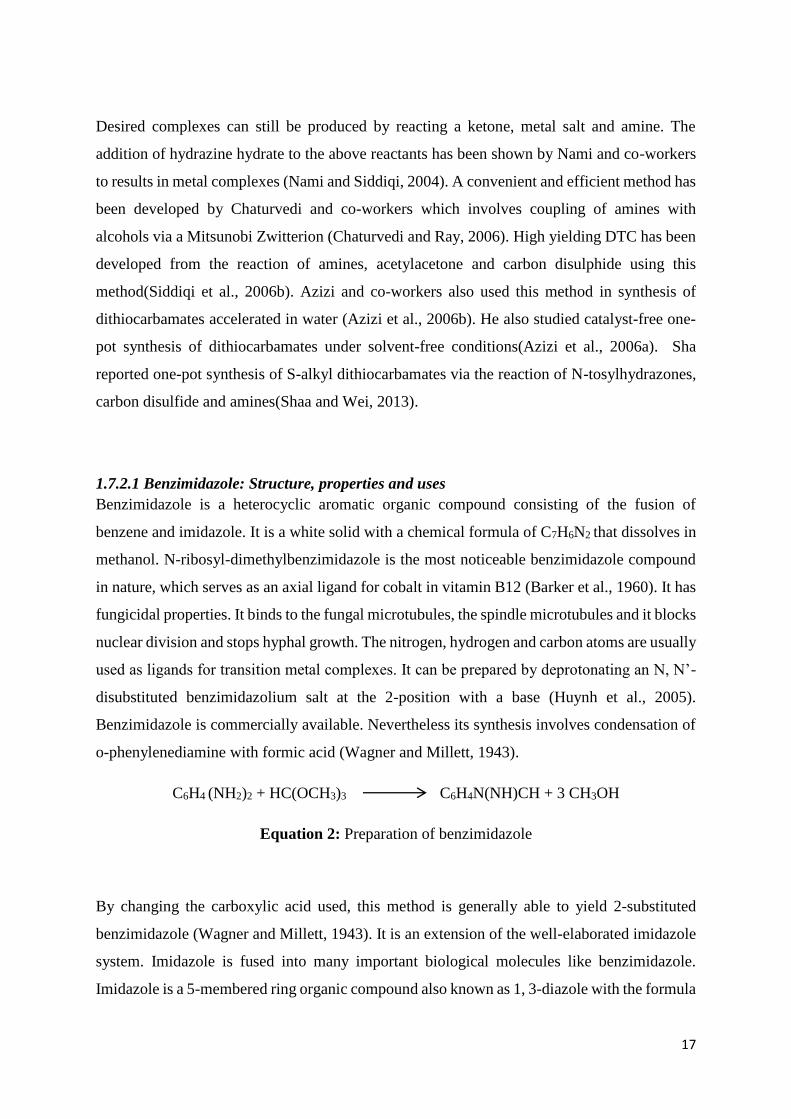
17
Desired complexes can still be produced by reacting a ketone, metal salt and amine. The
addition of hydrazine hydrate to the above reactants has been shown by Nami and co-workers
to results in metal complexes (Nami and Siddiqi, 2004). A convenient and efficient method has
been developed by Chaturvedi and co-workers which involves coupling of amines with
alcohols via a Mitsunobi Zwitterion (Chaturvedi and Ray, 2006). High yielding DTC has been
developed from the reaction of amines, acetylacetone and carbon disulphide using this
method(Siddiqi et al., 2006b). Azizi and co-workers also used this method in synthesis of
dithiocarbamates accelerated in water (Azizi et al., 2006b). He also studied catalyst-free one-
pot synthesis of dithiocarbamates under solvent-free conditions(Azizi et al., 2006a). Sha
reported one-pot synthesis of S-alkyl dithiocarbamates via the reaction of N-tosylhydrazones,
carbon disulfide and amines(Shaa and Wei, 2013).
1.7.2.1 Benzimidazole: Structure, properties and uses
Benzimidazole is a heterocyclic aromatic organic compound consisting of the fusion of
benzene and imidazole. It is a white solid with a chemical formula of C7H6N2 that dissolves in
methanol. N-ribosyl-dimethylbenzimidazole is the most noticeable benzimidazole compound
in nature, which serves as an axial ligand for cobalt in vitamin B12 (Barker et al., 1960). It has
fungicidal properties. It binds to the fungal microtubules, the spindle microtubules and it blocks
nuclear division and stops hyphal growth. The nitrogen, hydrogen and carbon atoms are usually
used as ligands for transition metal complexes. It can be prepared by deprotonating an N, N’-
disubstituted benzimidazolium salt at the 2-position with a base (Huynh et al., 2005).
Benzimidazole is commercially available. Nevertheless its synthesis involves condensation of
o-phenylenediamine with formic acid (Wagner and Millett, 1943).
C6H4 (NH2)2 + HC(OCH3)3 C6H4N(NH)CH + 3 CH3OH
Equation 2: Preparation of benzimidazole
By changing the carboxylic acid used, this method is generally able to yield 2-substituted
benzimidazole (Wagner and Millett, 1943). It is an extension of the well-elaborated imidazole
system. Imidazole is fused into many important biological molecules like benzimidazole.
Imidazole is a 5-membered ring organic compound also known as 1, 3-diazole with the formula

18
(CH)2N(NH)CH. It has two equivalent tautomeric nitrogen atoms because the proton can be
located on either of the two nitrogen atoms. It is a highly polar compound which is proved by
a calculated dipole of 3.61D. It is classified as aromatic due to the presence of a sextet of π-
electrons, consisting of a pair of electrons from the protonated nitrogen atom and one from
each of the remaining four atoms of the ring. Imidazole is amphoteric meaning it can function
as both an acid and as a base. An alkyl group attached to imidazole ring was used to check how
it will affect the coordination of the complexes and the shape and size of the nanoparticles.
Due to the increasing interest in the study of sulphur and nitrogen containing ligands, this
communication describes the preparation and characterization of complexes of Ni, Co and Pb
transition metals with benzimidazole and 2-methylbenzimidazoledithiocarbamate (Scheme 2)
with the aim to observe the coordination behaviour of the dithiocarbamate moiety using one-
pot synthesis method.
NH
N
NH
N
CH3
Benzimidazole 2-methylbenzimidazole
Scheme 3: Amine structures
1.7.3 Other methods
Transition metal dithiocarbamates can also be prepared by oxidative-addition of thiurams
disulphides to metal centres. DTC moiety can be incorporated in this method by reductive
scission of the S-S bond of the thiurum disulphide (Victoriano, 2000a). Victoriano reported the
scission of S-C bond of monosulphides to DTCs or dithiocarbamate-thiocarboxamido
complexes (Victoriano, 2000b). Addition of carbon disulphide to metal amides normally yields
metal DTCs. Transition metals that can form stable amide complexes such as Ti, Zr and Hf
(Karlin, 2005) are favoured by this method. Horgarth reviewed the method where the S-C bond
of organic isothiocynsnste has been inserted to metal-bound thiolates (Karlin, 2005). Transition
metal DTC complexes have been formed through the reaction of primary or secondary amines
with metal bound xanthates (Karlin, 2005).

19
1.8 Binding modes
The ligation forms of DTC are presented in Scheme 3. One ligand can accommodate one to
four metal atoms in different ways (Cotton et al., 1996). The DTC moiety can form complexes
where both S atoms are coordinated to the same metal atom forming a four coordinate ring
chelate. The most common form of bonding is the simple chelating bidentate binding mode
Scheme 3(A) and is normal for all transition metals in all accessible oxidation states (Cotton et
al., 1996, Karlin, 2005). The bidentate coordination can be symmetrical Scheme 3(A1) and
unsymmetrical Scheme 3(A2). The unsymmetrical bidentate coordination is known as the
anisobidentate (Karlin, 2005). The DTC ligand can also act as a monodentate ligand Scheme
3(B) (Cotton et al., 1996, Yilmaz et al., 2003). This binding mode is formed when there is no
room for bidentate coordination (Karlin, 2005). In a solution they can be an interconversion
between the bidentate and the monodentate. After the interconversion the monodentate is
highly asymmetric and is referred as the anisobidentate mode Scheme 3(H) (Karlin, 2005). It
is difficult to differentiate between the anisobidentate and the monodentate binding modes.
Furthermore DTCs can accommodate more than one metal atom acting as a bridging ligand. A
number of ways have been reported where the dithiocarbamates ligand can bridge two metal
centres Scheme 3(C-E) (Karlin, 2005, Nami and Siddiqi, 2004). The sulphur atoms can bind to
different metals or to each metal centre Scheme 3(C2) and ŋ1-ŋ1-manner Scheme 3(C1). One
sulphur atom can bridge two metal centres such that the three M-S interactions are equivalent
Scheme 3(D). Moreover both sulphur atoms can bridge two metal centres in different ways
Scheme 3(E, F) (Karlin, 2005). Three (F) to four (G) metals can also be accommodated by the
ligand even though both binding modes are rare and limited to the late transition metals.

20
N C
S
S
M
A1
N C
S
S
M
A2
N C
S MB
S
N C
S
S
M
M
C1
N C
S
S
M
MC2
S
M
S
S
M
S
D
S
M M
S
E
N C
S
S
M
MM
F
N C
S
S
M
M
M M
G
R2N C
S
S
Ag L
H
(Anisobidentate)
Scheme 4: Dithiocarbamates coordination modes
1.9 Structural features of dithiocarbamates
DTC complexes can assume four structural geometries (Scheme 4) when no other coordinating
ligands are present; namely the square planar coordination geometry (A), octahedral
coordination geometry (B), four coordinate dimer (C) and the five coordinate dimer (D). The
most common structural arrangements are the square planar and octahedral geometries. Bis
(dithiocarbamate) complexes such as Ni(II) and Pt(II) exhibit the square planar
structures(Manav et al., 2004). The dimeric structures (C, D) are prevalent in the Cu and Zn
complexes. Complexes of general structure M(DTC)2X2; where X= Cl, Br and I form
octahedral geometry (Plyusnin et al., 1997).

21
N C
S
S
M
S
SC N
N C
S
S
M
S
S
S
C
S
C N
N
N C
S
S
M
S
S
C N
M
S
S
C N
S
S
CN
N CH
S
S
M
S
S
CH N
M
S
S
CH N
S
S
CHN
A B
C D
Scheme 5: Structural arrangements of dithiocarbamates complexes
1.10 Problem statement
A lot of emphasis has been put on the production of nanoparticles of the highest quality,
controlling the size distribution and shape of semiconductor has been very challenging to
chemists, engineers and nanotechnologists. One of the difficulties in the preparation of
nanoparticles is to develop suitable methods for achieving specific morphologies by controlling
the growth of the nanoparticles. In this research a single-source molecular precursor route will
be used since it avoids problems encountered by employing the organometallic route, the metal
chalcogenide bond is already in place in this route and also avoids the use of volatile,
sometimes toxic precursors.
It was also established the type of the ligands also affects the morphology of the nanoparticles
so this work interest also lies in studying the behaviour and binding of the substituted
benzimidazole molecules to metal atoms such as Pb, Co and Ni. The binding of substituted
dithiocarbamates ligand through the S atom of the CS group suggests that these compounds
could be used as precursors in the preparation of the nanoparticles. Dithiocarbamates
complexes are interesting hybrid complexes, with both hard nitrogen and soft sulphur donor
atoms and are able to coordinate to a wide range of metal centres.
22
1.11 Purpose of the study
Generally metal chalcogenide nanoparticles are prepared by using a conventional route in
which metal salt and sources of chalcogens such as thiourea, thioacetamide, sodium sulphide,
thiosulfate, and others are dissolved in solution and stirred with factors such as concentration,
time and temperature being controlled. This route provides particles with generally larger sizes
closer to 20 nm whereas the alternative single-source precursor route produces particles with
smaller sizes but with the general problem of polydispersity in size and shape. An effort was
made by general synthesis and design of the ligand based on benzimidazole. It was reacted
with metal to make precursor complexes to generate desirably particles which are generally
smaller in size and shape.
1.12 Aim and objectives of the study
(a) The aim of the study was to synthesize metal sulphide (PbS, NiS, CoS) nanoparticles by
using dithiocarbamates as complexes.
(b) Objectives
To prepare and characterize metal complexes using FTIR spectroscopy, elemental analysis
(EL), Thermogravimetric analysis (TGA).
To study the effect of concentration of precursors (0.3, 0.35 and 0.4 g) on the size and
shape of nanoparticles.
To synthesize and characterize the metal sulphide (CoS, NiS and PbS) nanoparticles from
dithiocarbamate metal complexes using TEM, XRD, PL, UV-vis spectroscopy.
To study the effect of temperature (140, 160 and 180 °C) on size and shape of the
nanoparticles.
To study the effect of the capping agents (HDA and TOPO) on the size and shape of the
nanoparticles.

23
Chapter 2
Research methodology
Experimental section
2.1. Materials
Lead acetate trihydrate (99.5 %), cobalt chloride hexahydrate (98 %), trioctylphosphine (97
%), hexadecylamine (90 %), Benzimidazole (98 %), 2-methylbenzimidazole (98 %), carbon
disulphide (99 %), sodium hydroxide (99.86 %), were purchased from Sigma Aldrich and used
without any purification. Solvents such as methanol (99.5 %) of analytical grade were also
purchased from Sigma Aldrich. Distilled water was used as a solvent as well.
2.2 Experimental procedures
(a) Preparation of lead benzimidazole dithiocarbamate complex (I)
The ligands and complexes were synthesized according to a method previously reported by
(Siddiqi et al., 2006a) and was modified as follows.
Sodium hydroxide (0.78 g, 0.02 mol) was dissolved in 40 ml of distilled water and added to
benzimidazole (2.36 g, 0.02 mol); the mixture was cooled under stirring in an ice bath for an
hour. Carbon disulphide (1.52 ml, 0.02 mol) was added dropwise to the suspended mixture and
it was stirred for overnight at 25 °C. Lead (II) acetate (3.79 g, 0.01mol) was dissolved in 40 ml
of distilled water and it was added drop-wise to the corresponding solution of the
dithiocarbamate ligand. The mixture was refluxed for 4 hours at 60 °C in a water bath. The
reaction mixture was left for three days to complete under the fume hood. The precipitate
formed was filtered, washed with excess distilled water and dried with excess methanol. The
black colour was observed for benzimidazole-dithiocarbamates complex. Percentage yield:
60.36 %. CHNS analysis: Calculated: C, 32.37; H, 1.7; N, 9.44; S, 21.6. Found: C, 35.77; H,
2.38; N, 8.80; S, 2.25%.

24
(b) Preparation of lead 2-methylbenzimidazole dithiocarbamate complex (II)
The complex was synthesised following the same method as with 2.2(a), with the exception
that 2-methylbenzimidazole (2.64 g, 0.02 mol) was used. Percentage yield: 45.36 %.CHNS
analysis: Calculated: C, 34.77; H, 2.27; N, 9.01; S, 20.63. Found: C, 35.36; H, 2.57; N, 8.34;
S, 8.91%.
(c) Preparation of nickel benzimidazole dithiocarbamate complex (III)
Sodium hydroxide (0.78 g, 0.02 mol) was dissolved in 40 ml of distilled water and added to
benzimidazole (2.36 g, 0.02 mol); the mixture was cooled under stirring in an ice bath for an
hour. Carbon disulphide (1.52 ml, 0.02mol) was added dropwise to the suspended mixture and
it was stirred for overnight at 25 °C. Nickel (II) chloride (2.37 g, 0.01 mol) was dissolved in
40 ml of distilled water and it was added drop-wise to the corresponding solution of the
dithiocarbamate ligand. The mixture was refluxed for 4 hours at 60 °C in a water bath. The
reaction mixture was left for three days to complete under the fume hood. The precipitate
formed was filtered, washed with excess distilled water and dried with excess methanol. The
green-black colour was observed for benzimidazole dithiocarbamates complex. Percentage
yield: 52.63 %.CHNS analysis: Calculated: C, 43.16; H, 2.26; N, 12.58; S, 28.81. Found: C,
46.45; H, 3.46; N, 11.88; S, 7.17%.
(d) Preparation of nickel 2-methylbenzimidazole dithiocarbamate complex (IV)
The complex was synthesised following the same method as with 2.2(c), with the exception
that 2-methylbenzimidazole (2.64 g, 0.02 mol) was used. The green- black colour was observed
for 2-methylbenzimidazole dithiocarbamates complex. Percentage yield: 35.88 %.CHNS
analysis: Calculated: C, 45.68; H, 2.98; N, 11.84; S, 27.1. Found: C, 22.34; H, 2.49; N, 2.25;
S, 9.06%
(e) Preparation of cobalt benzimidazole dithiocarbamate complex (V)
Sodium hydroxide (0.78 g, 0.02 mol) was dissolved in 40 ml of distilled water and added to
benzimidazole (2.36 g, 0.02 mol), the mixture was cooled under stirring in an ice bath. Carbon
disulphide (1.52 ml, 0.02mol) was added drop-wise to the suspended mixture and it was stirred
for overnight at 25 °C. Nickel (II) chloride (2.37 g, 0.01 mol) was dissolved in 40 ml of distilled

25
water and it was added dropwise to the corresponding solution of the dithiocarbamate ligand.
The mixture was refluxed for 4 hours at 60 °C in a water bath. The reaction mixture was left
for three days to complete under the fumehood. The precipitate formed was filtered, washed
with excess distilled water and dried with excess methanol. The black colour was observed for
benzimidazole dithiocarbamates complex. Percentage yield: 42.28 %.CHNS analysis:
Calculated: C, 43.14; H, 2.26; N, 12.58; S, 28.79. Found: C, 19.56; H, 2.62; N, 4.33; S, 1.99%.
(f) Preparation of cobalt benzimidazole dithiocarbamate complex (VI)
The complex was synthesised following the same method as with 2.2(e), with the exception
that 2-methylbenzimidazole (2.64 g, 0.02 mol) was used. The blue-black colour was observed
for 2-methylbenzimidazole dithiocarbamates complex. Percentage yield: 47.31 %.CHNS
analysis: Calculated: C, 45.66; H, 2.98; N, 11.83; S, 27.09. Found: C, 46.71; H, 3.12; N, 10.88;
S, 11.94%.
2.3 Synthesis of nanoparticles
(a) Synthesis of lead sulphide nanoparticles using complex I and II
Lead (II) sulphide nanoparticles were synthesized at different reaction temperatures and
different capping agents. The complex (0.3 g) was dissolved in 5 ml of tri-octylphosphine
(TOP). The solution was injected into 6.0 g of hot hexadecylamine (HDA) and (TOPO) in a
three-necked flask at different temperatures (140 oC, 160 oC and oC 180 oC). The reaction was
allowed to stabilize at the desired temperature for an hour. After an hour the reaction was
allowed to cool to 70 oC then excess methanol was added flocculate the particles. The black
precipitate or nanoparticles formed was separated by centrifugation and washed three times
with methanol.
(b) Synthesis of nickel sulphide nanoparticles using complex III and IV
Nickel nanoparticles were synthesized at different reaction temperatures and different
precursor concentrations. The complex (0.3, 0.35 and 0.4 g) was dissolved in 5 ml of tri-
octylphosphine (TOP). The solution was injected into 6 g of hot hexadecylamine (HDA) in a
three-necked flask at different temperatures (140 oC, 160 oC and oC 180 oC). The reaction was
allowed to stabilize at the desired temperature for an hour. After an hour the reaction was

26
allowed to cool to 70 oC then excess methanol was added flocculate the particles. The black
precipitate or nanoparticles formed was separated by centrifugation and washed three times
with methanol.
(c) Synthesis of cobalt sulphide nanoparticles using complex V and VI
Cobalt sulphide nanoparticles were synthesized at different reaction temperatures and different
capping agents. The complex (0.3 g) was dissolved in 5 ml of tri-octylphosphine (TOP). The
solution was injected into 6 g of hot hexadecylamine (HDA) in a three-necked flask at different
temperatures (140 oC, 160 oC and oC 180 oC). The reaction was allowed to stabilize at the
desired temperature for an hour. After an hour the reaction was allowed to cool to 70 oC then
excess methanol was added flocculate the particles. The dark purple precipitate or nanoparticles
formed was separated by centrifugation and washed three times with methanol.
2.4 Instrumentation
(a) FT-IR spectroscopy
FTIR spectroscopy was used to study the functional groups in order to determine the molecular
structure. Infrared spectra were recorded on FT-IR Perkin Elmer 400 spectrometer. Spectra
were collected over the range from 650 to 4000 cm-1.
(b) Microanalysis
Elemental analysis was used to check the percentage composition of C-H-N-S.The C, H, N, S
elemental analysis was carried out with Leco-CHNS 932 analyzer. Roughly 2.0 mg of sample
was introduced into Ag capsule and was placed in a furnace, which was maintained at 800 °C.
The products of combustion in the CHNS analysis (CO2, H2O and SOx gases) were carried
through the system by the He carrier. Adjustments for blank, calibration and weights were
applied to the final integrated signal and the results were displayed as weight percentage of
carbon, hydrogen, nitrogen and sulfur.
(c) Thermogravimetric analysis
Thermogravimetric analysis (TGA) records weight loss as a function of temperature.
Thermogravimetric analysis was carried out using Perkin Elmer Pyris 6 manager TGA under

27
an inert atmosphere of dry nitrogen, and at a heating rate of 20 °C.min-1. The sample
preparation for thermogravimetric analysis was done by weighing 13 mg of the complexes.
These complexes were decomposed at temperature range of 30 to 800 °C.
(d) Optical characterization
UV/Vis and PL spectroscopy were used to determine the optical properties. Absorption spectra
of the particles were measured using a Perkin Elmer Lambda 20 UV-VIS Spectrophotometer.
The samples were place in quartz cuvettes (1-cm path length) with toluene as the solvent.
Emission spectra of the particles were recorded on a Perkin Elmer LS 45 PL spectrometer with
a xenon lamp at room temperature. The samples were placed in glass cuvettes (1 cm) with
toluene as solvent.
(e)Transmission Electron microscopy
TEM was used to determine the morphology of the particles. Analyses were done on a LEO
JEM 912electron microscope with an acceleration voltage of 120 KW and a tungsten wire
filament. The samples were prepared by placing a drop of dilute solution of sample in toluene
on to a copper grid. The sample was allowed to dry completely at room temperature.
(f) X-ray diffraction analysis
XRD was used to reveal the crystalline nature of the nanoparticles. X-ray diffraction (XRD)
patterns on powdered samples were carried out in the 2θ on a D8 diffractometer. Samples were
placed in silicon zero background sample holder. Measurements were taken using a glancing
angle of incidence detector at an angle of 2°using CuKa1 source, for 2θ values over 20° – 90°
in steps of 0.05° with a scan speed of 0.01°2θ.s-1.
RESULTS AND DISCUSSION
28
Chapter 3
Characterization of benzimidazoledithiocarbamate
and 2-methyldithiocarbamate complexes of lead,
nickel and cobalt
3.1 Background of the specific ligands prepared and their complexes
The ligands and the complexes were prepared separately before one-pot synthesis method was
used. Benzimidazole was reacted with carbon disulphide and sodium hydroxide to form the
ligand. Then it was washed, dried, dissolved in methanol and then added to the metal chlorides
to form the complexes. Different reaction temperatures were used in the preparation of the
ligand which was 0, 25, 30, 60 and 70 °C. Sodium hydroxide or potassium hydroxide was
reacted with carbon disulfide and benzimidazole in a 1:1 mole ratio under different reaction
times ranging from 1 to 3 days. The prepared ligand was recrystallized with dichloromethane-
methanol binary solvent (50:50 – v: v) and kept in an ice-cold environment (0 °C). FTIR
spectroscopy and elemental analysis of the ligands prepared at higher temperatures (30, 60 and
70 °C) showed characteristic peaks of benzimidazole (NH vibration band), which made the
reaction unsuccessful. The ligands prepared at low temperatures from 0 and 25 °C shown
expected IR bands immediately after recrystallization before drying and the complex was
prepared in the ratio of 2:1 at lower temperatures. FTIR spectra of the complexes showed that
most of the functional groups have shifted to higher frequencies but sulfur atom was absent.
Elemental analysis also gave evidence of no sulfur found in the resulting products and in some
scenarios percentages were found to either higher or lower than the expected. Therefore it was
observed that the ligand forms in the preparation but after washing and drying it reverts back
to benzimidazole. The ligands were not stable to moisture and heat. The products were kept
under vacuum and at low temperature (0 °C). Even under these conditions of preventing higher
temperatures and atmosphere free of oxygen the product reverts back to benzimidazole or 2-
methylbenzimidazole. The approach of using the starting materials based on benzimidazole

29
and its alkyl derivative was changed to a one pot synthesis of the ligand in situ formation
followed by the introducing the metal salt.
From elemental analysis, sulfur was present but in lower percentages in all complexes. The
possible reason could be due to the volatility of carbon disulphide, which means a lot of it
evaporated before it was added or in the addition process leading to unreliable values. The two
complexes, I and III showed values that appear dimeric as confirmed by both elemental analysis
and FTIR spectroscopy. The FTIR spectra exhibited the doublet C=S band at 1058 and 1040
cm-1 region. For complex II and VI, the calculated percentages were within the limits and
conform to the molecular structure formulated for the products. Complex IV and V showed
that the leaving groups such as the chlorides and hydroxides are still present in the complexes
as impurities as evident from elemental Analysis calculations. These complexes showed that
oxygen was also present as an impurity and this was also confirmed by FTIR spectroscopy
which showed C=O as an impurity from the preparation of benzimidazole. From the found
percentages, these complexes also showed that there were some of the unreacted metals (lead,
nickel and cobalt) and this was confirmed by TGA and XRD. The TGA curves showed a
mixture of metal and metal sulphides after decomposing in all metals from complex I, II, III
and IV except for cobalt from Complex VI which decomposed to form only metal sulphide and
this was confirmed by final residue calculations. XRD displayed the presence of nickel and
lead peaks when different conditions were varied. XRD for cobalt and nickel nanoparticles
depicted some impurities of C7OS8. This indicates that carbon dioxide reacted with
benzimidazole to give side reactions of sulphur rich organic molecules as impurities picked up
by XRD and this made it difficult to correlate the elemental analysis data obtained with those
calculated. These complexes were not stable to moisture and heat. The complexes were
amorphous powder, soluble in tri-octylphosphine (TOP) only.

30
2
N
N
N
N
H2O bath @ 25 0C for 1 hr
2
Pb2+
-
-
Pb(CH3.COO)2.3H2O
Reflux for 4 hrs
Na+
H2O bath @ 60 0C
H2O
N
NNaOH
+ CS2
+
Benzimidazole Benzimidazole DTC ligand
Pb benzimidazole DTC complex
HC
S
S
C S
S
Scheme 6: Targeted complex reaction equation of lead benzimidazole dithiocarbamate
3.2 Spectroscopic and thermogravimetric analysis
FTIR spectroscopy was used to determine the functional groups and formation of any new
bonds in the complexes prepared. Fig. 2 and 3 shows FTIR spectra of benzimidazole and 2-
methylbenzimidazole derived metal complexes I-VI. Dithiocarbamates ligands are capable of
forming bonds with the metal through sulphur atom. They are known to display absorption
bands in the 800 - 1550 cm-1 region. The significant IR bands are shown in Table 1 These
complexes exhibited bands at 1200 - 1080,1080 – 1040, 1474 - 1412 and 3260-3382 cm-1 which
were due to the contribution of v(C-N), v(C=S) weak bands, v(C=N) strong bands and v(OH)

31
vibration respectively. These complexes act as mono- or bi-dentate. When they act as a bi-
dentate, the v(C=S) bands are displayed as singlet. But, for a monodentate behaviour v(C=S)
bands are displayed as a doublet. The absence ofv(N-H) absorption bands at 3116 and 1624
cm-1 and the presence ofv(C-N), v(C=S) in the complexes confirmed that there was a reaction
between the ligands and the metals. The presence of v(OH) absorption bands in some of the
complexes indicates the presence of water molecules present in the compounds which is
confirmed later by TGA. It was observed that all the significant bands were present but they
were some impurities of C=O at the frequency of 1710 cm-1 for complex I and V which is also
an impurity from benzimidazole. The impurity as evident from FTIR of unreacted
benzimidazole conforms to the percentage of elemental analysis of the same complexes that
shows these impurities. This is such that the percentages of complex I changed drifting away
from the calculated ones with the increase in C and increase in H.
N
N
N
N
C
S
S
Pb
S
S
C
Figure 1: Expected complex of lead benzimidazole dithiocarbamate complex
Table 1: FTIR spectral data for complexes I to VI
Assignment/s Frequencies (cm-1)
I II III IV V VI
C=N Stretching 1443 1451 1450 1452 1458 1455
C=S Stretching 1058 1080 1040 1080 1043 1078
C-N (aliphatic),
Stretching
1100
1152 1100 1174 1088 1175
O-H, Stretching 3382 - 3310 - - 3260
NCSS bending mode - - 1505 - - -

32
Figure 2: IR spectra for (a) benzimidazole and its complexes I(b), III(c), and V(d)
Figure 3: IR spectra for (a) 2-methylbenzimidazole and its complexes II(b), IV(c), and VI(d)

33
Thermal decomposition of the complexes often leads to the confirmation of the significant
bonding between the metal centre and sulphide from the dithiocarbamate ligand formation.
Figure 4(a-f) shows TGA spectra of complex I-VI respectively. Complex I (Fig. 4(a)) displayed
that up to 112 °C, there was 3% loss in weight and it was due to removal of water molecules.
From 112 °C to 265 °C the decomposition was due to benzimidazole dithiocarbamate ligands.
These spectrum shows that there was a mixture of PbS2 and Pb nanoparticles within 255 °C-
800 °C region and this was confirmed by XRD which showed the mixture of Pb and PbS
nanoparticles at low temperature. The PbS2 nanoparticles decomposed above 800 °C and
displayed a large loss of weight. Complex II (Fig. 4(b)) displayed three decomposition steps.
The first decomposition step was due to methyl groups and evaporation of benzene groups
from 90-137 °C by 17%. The second decomposition step was due to imidazole molecules from
137-217 °C by 7%. These spectrum shows that PbS2 nanoparticles were stable within 235-800
°C region. The PbS2 nanoparticles decomposed above 800 °C. Complex III indicated two-step
decomposition of nickel dithiocarbamate complex. The decomposition trend of nickel
dithiocarbamate complex III displayed the first decomposition temperature from 30-135 °C
which was due to evaporation of methanol and water; the second decomposition step was due
to the loss of benzimidazole molecules from 135-456 °C(Fig. 4(c)). The third decomposition
step was due to the sulphides present in the complex from 541-757 °C.
The observed final residue was 39.00 %, which is comparable with theoretical of 40.77 %
nickel sulphide (Ni3S4). The observed final residue had a mixture of nickel sulphide and nickel
as a metal and this was confirmed by XRD which showed the presence of nickel as a metal.
Complex IV (Fig. 4(d)) indicated two-step decomposition of nickel dithiocarbamate complex.
The decomposition rate was faster compared to the one of complex III (Fig. 4(c)), because of
weak Van der Waal’s forces between the substituted methyl group and benzimidazole. The
decomposition trend of nickel dithiocarbamate complex displayed the first decomposition
temperature from 66-135 °C which was due to the methyl group present in the complex,
methanol and water molecules present in the complex; the second decomposition step was due
to the loss of benzimidazole molecules and sodium chloride (impurity) from 137 °C to 374 °C
and this was confirmed by elemental analysis which showed less abundant percentages because
of impurities found in the complex. The final residue showed a mixture of nickel sulphide and
nickel as a metal and this was also confirmed by XRD which showed the presence of the metal.
The observed final residue was 33.00 %, which is comparable with theoretical of 36.14 %
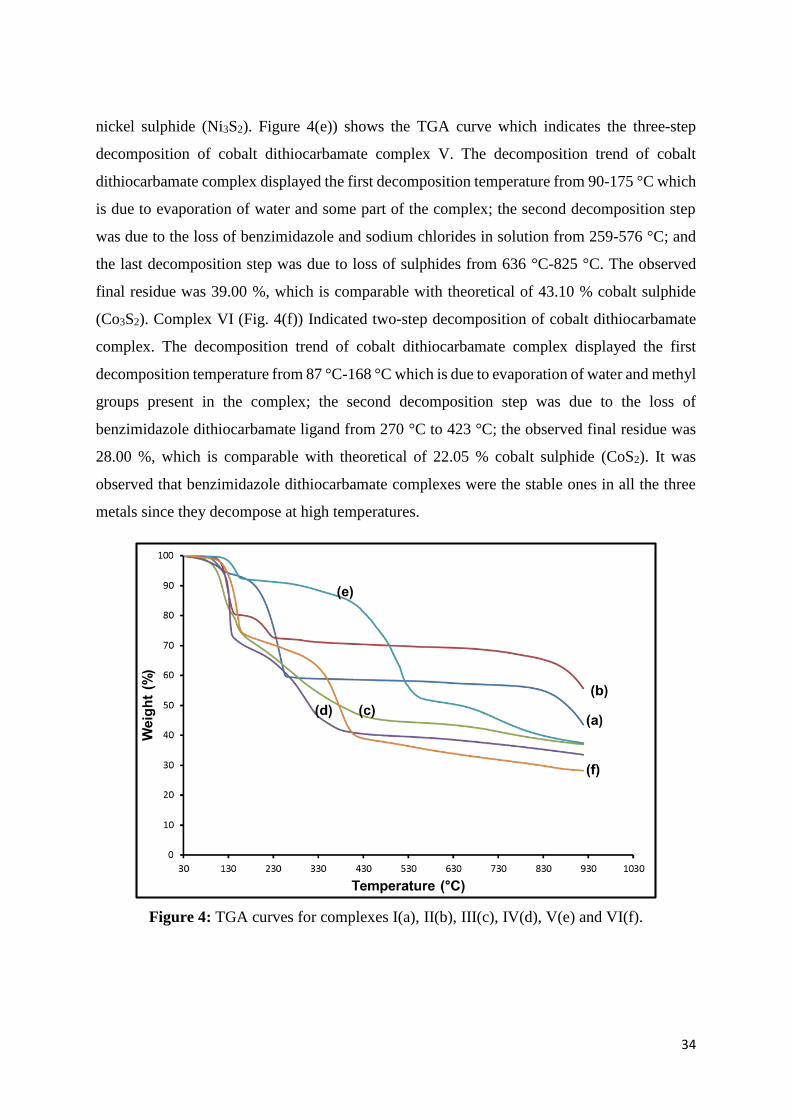
34
nickel sulphide (Ni3S2). Figure 4(e)) shows the TGA curve which indicates the three-step
decomposition of cobalt dithiocarbamate complex V. The decomposition trend of cobalt
dithiocarbamate complex displayed the first decomposition temperature from 90-175 °C which
is due to evaporation of water and some part of the complex; the second decomposition step
was due to the loss of benzimidazole and sodium chlorides in solution from 259-576 °C; and
the last decomposition step was due to loss of sulphides from 636 °C-825 °C. The observed
final residue was 39.00 %, which is comparable with theoretical of 43.10 % cobalt sulphide
(Co3S2). Complex VI (Fig. 4(f)) Indicated two-step decomposition of cobalt dithiocarbamate
complex. The decomposition trend of cobalt dithiocarbamate complex displayed the first
decomposition temperature from 87 °C-168 °C which is due to evaporation of water and methyl
groups present in the complex; the second decomposition step was due to the loss of
benzimidazole dithiocarbamate ligand from 270 °C to 423 °C; the observed final residue was
28.00 %, which is comparable with theoretical of 22.05 % cobalt sulphide (CoS2). It was
observed that benzimidazole dithiocarbamate complexes were the stable ones in all the three
metals since they decompose at high temperatures.
Figure 4: TGA curves for complexes I(a), II(b), III(c), IV(d), V(e) and VI(f).
35
3.3 Conclusions
Benzimidazole and 2-methylbenzimidazole complexes of lead, nickel and cobalt were
synthesized for their use as precursors in the preparation of lead, nickel and cobalt sulphide
nanoparticles. Techniques such as microanalysis, FTIR spectroscopy and TGA were used to
characterize the complexes. There was a percentage mismatch from elemental analysis for the
complexes I, III, IV and V. Complexes II and VI calculated percentages were within the limits
with the found percentages except for sulphur. The found percentages on complex I and III
showed that the formed complexes were dimers and this was confirmed by FTIR spectroscopy
which exhibited the doublet C=S band. Complex IV and V showed that the leaving groups such
as the sodium chlorides and hydroxides were still present in the complexes as impurities. FTIR
spectroscopy confirmed the presence of v(C=S) singlet peak in all four complexes which
indicates completely symmetrical bonding of the dithiocarbamate ligand to metal in a bidentate
mode except for complex I and III which displayed a doublet peak which indicates
monodentate coordination mode (dimeric molecules). The TGA curves decomposed to form a
mixture of metal and metal sulphides for complex I, II, III and IV except for Complex VI. All
benzimidazole complexes decomposed at higher temperatures and were considered as the
most stable complexes.

36
Chapter 4
Characterization of lead sulphide nanoparticles
using benzimidazoledithiocarbamate and 2-
methyldithiocarbamate complexes
4.1 HDA/TOPO capped PbS nanoparticles
This chapter focuses on the synthetic parameters studied for their influence on the size,
structure, composition and arrangement of lead sulphide nanoparticles. The synthetic
procedure followed was thermal decomposition of benzimidazole dithiocarbamate and 2-
methyldithiocarbamate complexes of lead in an inert environment in the presence of
trioctylphosphine (solvent), capping agents-tri-octylphosphine oxide (TOPO) and
hexadecylamine (HDA). The reaction condition such as reaction temperature and type of
capping agents were varied in order to determine their influence on the properties of
nanoparticles. Temperature was varied from 140, 160 to 180 °C using lead benzimidazole
dithiocarbamate complex I while keeping other parameters constant. HDA is an organic amine
with terminal NH2 group whereas TOPO contains the P=O used for interfacial bonding to the
nanoparticles. The synthetic conditions (Table 2) for both capping agents were kept the same
in order to establish the influence of temperature as well as the capping molecule used.
Table 1: Variation of temperature in the preparation of TOPO/HDA-PbS nanoparticles
using complex I and II for 60 min
Surfactant
(HDA/TOPO)
mass (g)
Complex I / II
mass (g)
Temperature
(°C)
6.0 0.3 140
6.0 0.3 160
6.0 0.3 180

37
4.1.1 (a) HDA-PbS Nanoparticles prepared using complex I(Temperature variation)
Table 2 shows reaction conditions for the preparation of HDA capped PbS nanoparticles by
varying reaction temperatures using complex I, while keeping all the other parameters the
same. UV visible spectroscopy has been widely used to characterize the semiconductor
nanoparticles. As the particle size decrease, absorption wavelength will be shifted to shorter
wavelength, since the band gap increases for the nano sized particles. This is the quantum
confinement effect of the semiconductor nanoparticles. The absorption co-efficient of the bulk
PbS is 3020 nm. UV/Vis spectra of HDA capped PbS nanoparticles prepared at different
reaction temperatures from complex I are shown in Fig. 5(a-c). These spectra showed
featureless features and this were confirmed by PL which showed the emission maxima at the
same wavelength. There was no observable trend. The absorption band observed at 650 nm
was for surface-modified particles, especially by the organic groups; it is related to the in-
homogeneity of the radii and the phonon broadening and is attributed to the lower energy side
of the transitions 1Se–1Sh. Moloto reported similar scenario but the difference is this absorption
is narrow. This indicates that the capping group has an influence on the optical properties of
PbS nanoparticles (Moloto et al., 2005).
Figure 5: UV-VIS spectra of PbS nanoparticles prepared with 0.3 g of complex I with 6 g of
HDA at (a) 140 °C, (b) 160 °(C) and 180 °C.
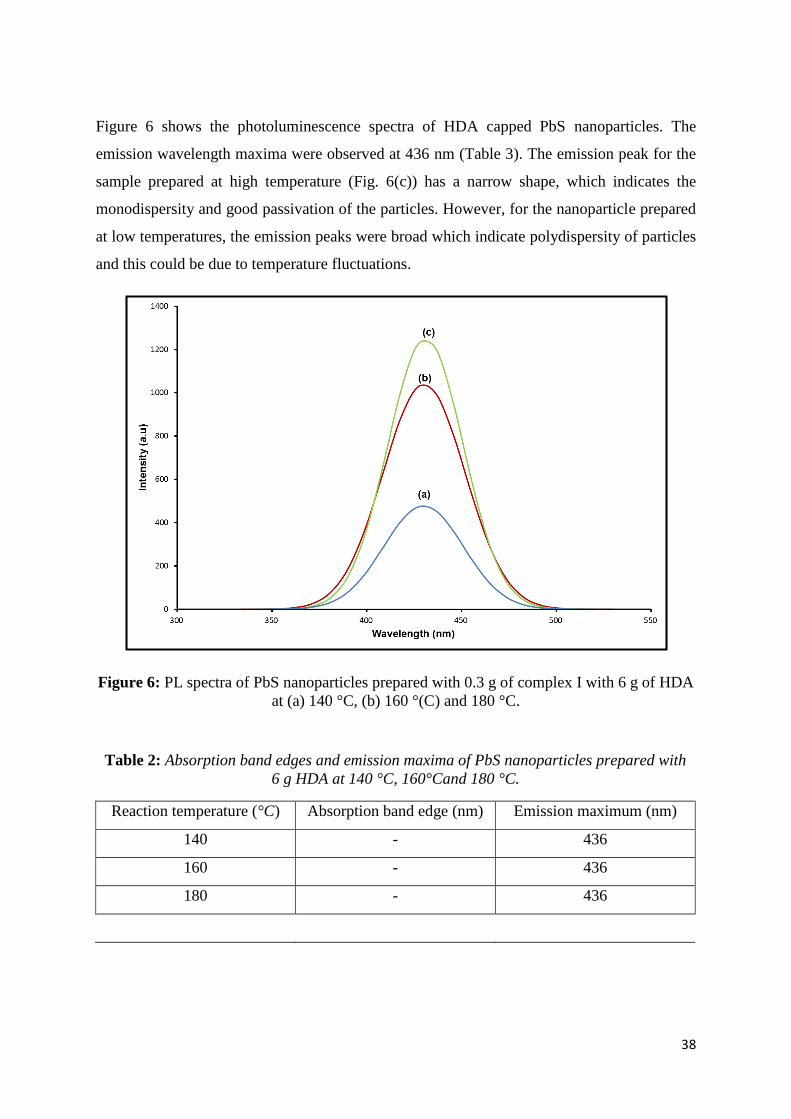
38
Figure 6 shows the photoluminescence spectra of HDA capped PbS nanoparticles. The
emission wavelength maxima were observed at 436 nm (Table 3). The emission peak for the
sample prepared at high temperature (Fig. 6(c)) has a narrow shape, which indicates the
monodispersity and good passivation of the particles. However, for the nanoparticle prepared
at low temperatures, the emission peaks were broad which indicate polydispersity of particles
and this could be due to temperature fluctuations.
Figure 6: PL spectra of PbS nanoparticles prepared with 0.3 g of complex I with 6 g of HDA
at (a) 140 °C, (b) 160 °(C) and 180 °C.
Table 2: Absorption band edges and emission maxima of PbS nanoparticles prepared with
6 g HDA at 140 °C, 160°Cand 180 °C.
Reaction temperature (°C) Absorption band edge (nm) Emission maximum (nm)
140 - 436
160 - 436
180 - 436
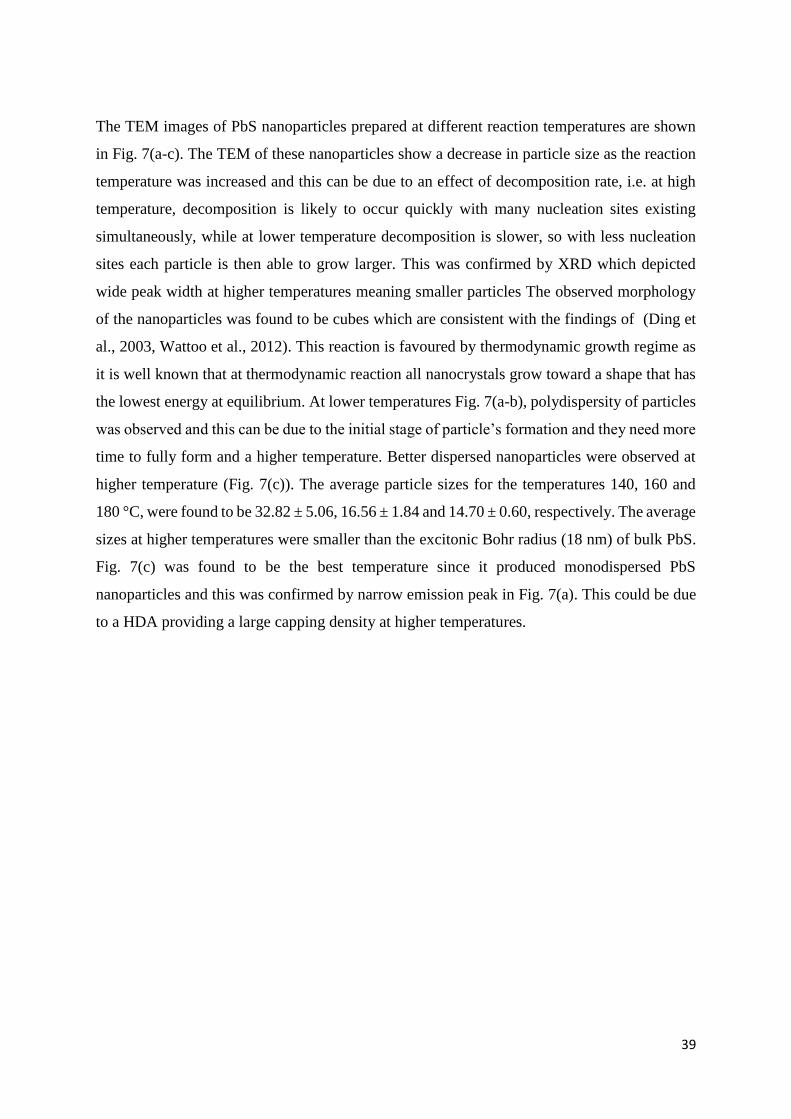
39
The TEM images of PbS nanoparticles prepared at different reaction temperatures are shown
in Fig. 7(a-c). The TEM of these nanoparticles show a decrease in particle size as the reaction
temperature was increased and this can be due to an effect of decomposition rate, i.e. at high
temperature, decomposition is likely to occur quickly with many nucleation sites existing
simultaneously, while at lower temperature decomposition is slower, so with less nucleation
sites each particle is then able to grow larger. This was confirmed by XRD which depicted
wide peak width at higher temperatures meaning smaller particles The observed morphology
of the nanoparticles was found to be cubes which are consistent with the findings of (Ding et
al., 2003, Wattoo et al., 2012). This reaction is favoured by thermodynamic growth regime as
it is well known that at thermodynamic reaction all nanocrystals grow toward a shape that has
the lowest energy at equilibrium. At lower temperatures Fig. 7(a-b), polydispersity of particles
was observed and this can be due to the initial stage of particle’s formation and they need more
time to fully form and a higher temperature. Better dispersed nanoparticles were observed at
higher temperature (Fig. 7(c)). The average particle sizes for the temperatures 140, 160 and
180 °C, were found to be 32.82 ± 5.06, 16.56 ± 1.84 and 14.70 ± 0.60, respectively. The average
sizes at higher temperatures were smaller than the excitonic Bohr radius (18 nm) of bulk PbS.
Fig. 7(c) was found to be the best temperature since it produced monodispersed PbS
nanoparticles and this was confirmed by narrow emission peak in Fig. 7(a). This could be due
to a HDA providing a large capping density at higher temperatures.

40
Figure 7: TEM images and their histograms of PbS nanoparticles prepared with 0.3 g of
complex I with 6 g of HDA at (a) 140 °C, (b) 160 °C and 180 °C.
Figures 8(a-c) shows XRD pattern of HDA capped PbS nanoparticles. The strong and sharp
peaks suggest that the as-obtained products were well crystalline. All the diffraction can be
indexed to face-centered cubic phase of PbS and it was in good agreement with the standard
value (JCPSS file no. 5-592). But at low temperature, Fig. 8(a) there were some impurities of
lead observed shown by a star sign and this indicates that the reaction was incomplete at that
temperature. The presence of the mixture Pb and PbS was also confirmed by TGA.
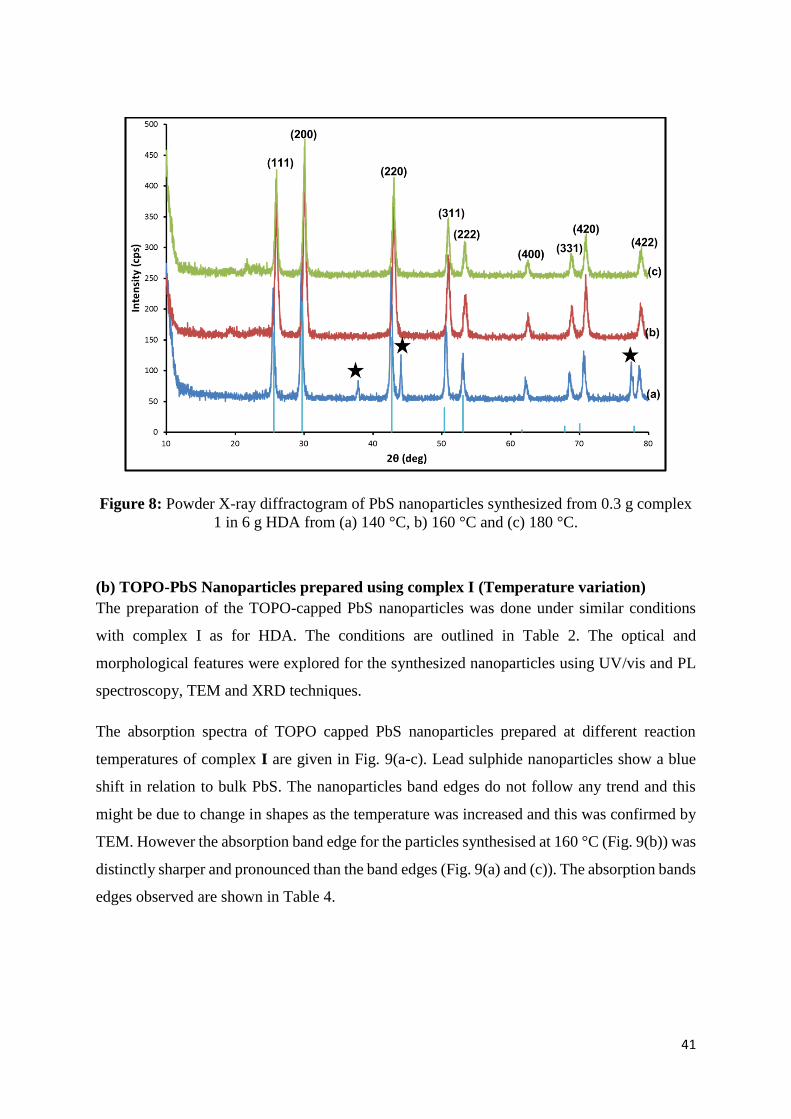
41
Figure 8: Powder X-ray diffractogram of PbS nanoparticles synthesized from 0.3 g complex
1 in 6 g HDA from (a) 140 °C, b) 160 °C and (c) 180 °C.
(b) TOPO-PbS Nanoparticles prepared using complex I (Temperature variation)
The preparation of the TOPO-capped PbS nanoparticles was done under similar conditions
with complex I as for HDA. The conditions are outlined in Table 2. The optical and
morphological features were explored for the synthesized nanoparticles using UV/vis and PL
spectroscopy, TEM and XRD techniques.
The absorption spectra of TOPO capped PbS nanoparticles prepared at different reaction
temperatures of complex I are given in Fig. 9(a-c). Lead sulphide nanoparticles show a blue
shift in relation to bulk PbS. The nanoparticles band edges do not follow any trend and this
might be due to change in shapes as the temperature was increased and this was confirmed by
TEM. However the absorption band edge for the particles synthesised at 160 °C (Fig. 9(b)) was
distinctly sharper and pronounced than the band edges (Fig. 9(a) and (c)). The absorption bands
edges observed are shown in Table 4.

42
Figure 9: UV-VIS spectra of PbS nanoparticles prepared with 0.3 g of complex I with 6 g of
TOPO at (a) 140 °C, (b) 160 °(C) and 180 °C.
Figure 10 shows the emission spectra of TOPO capped PbS nanoparticles at different
temperatures. The emission peaks shows red shift in relation to the absorption band edges in
Fig. 9. The emission peaks for the sample prepared at low temperature have a narrow shape,
which indicates narrow size distribution of the particles. However, for the nanoparticles
prepared at high temperatures, broad peaks indicate polydispersity of the particles and this was
confirmed by TEM which shows anisotropic particles. The emission spectrum at 140 °C (Fig
10 (a)) was blue shifted from other emission spectra which indicate the smaller particle sizes
or narrow size distribution and this was confirmed by XRD which showed wide diffraction
peaks widths. The emission maxima are shown in Table 4.

43
Figure 10: PL spectra of PbS nanoparticles prepared with 0.3 g of complex I with 6 g of
TOPO at (a) 140 °C, (b) 160 °(C) and 180 °C.
Table 3: Absorption band edges and emission maxima of TOPO-capped PbS nanoparticles
prepared using 6 g TOPO for 1 hour at 140 °C, 160°Cand 180 °C.
Reaction temperature (°C) Absorption band edge (nm) Emission maximum (nm)
140 355 433
160 365 474
180 360 474
Figures 11(a-c) shows TEM images of the TOPO capped PbS nanoparticles. At low
temperature Fig. 11(a) TEM clearly shows that the particles are aggregated. As the temperature
was increased to 160 °C a cross-like layer was observed with quasi spherical particles on top.
Further increasing the temperature to 180 °C, the cross-like layer decomposed into rods-like
materials with quasi spherical particles on top. The average diameter of quasi spherical
particles was found to be 5.263 ± 0.67 nm (Fig. 11(b)) shown by the distribution curve. The
average diameter of quasi spherical particles at 180 °C was 2.56 ± 1.085 nm Fig. 11(c) shown

44
by the distribution curve. There is no specific trend observed and this is due to the change in
shape of cross like layer to rod-like materials or anisotropic particles observed.
Figure 11: TEM images and their histograms of PbS nanoparticles prepared with 0.3 g of
complex I with 6 g of TOPO at (a) 140 °C, (b) 160 °C and 180 °C.
Samples were analysed by XRD for further study, Fig. 12(a-c) shows the XRD patterns of these
samples at different temperatures. There were eight peaks in the XRD pattern as seen in this
Figure, related to each sample that are characteristic of PbS compound. The sharp peaks of the
XRD pattern indicate that the synthesized PbS nanoparticles are well crystalline. All the
diffraction can be indexed to the cubic phase of PbS and it was in good agreement with the
standard value (JCPDS file no.03-065-2935). No peaks due to impurities were found. It was
noticed that at low temperature, the widths of diffraction peaks are wider than those observed
at high temperatures suggesting that the particles at low temperature are small. In addition,
there was no significant change in the position of the peaks therefore it shows that temperature
only arrests the nanoparticle growth and does not introduce any phase change.
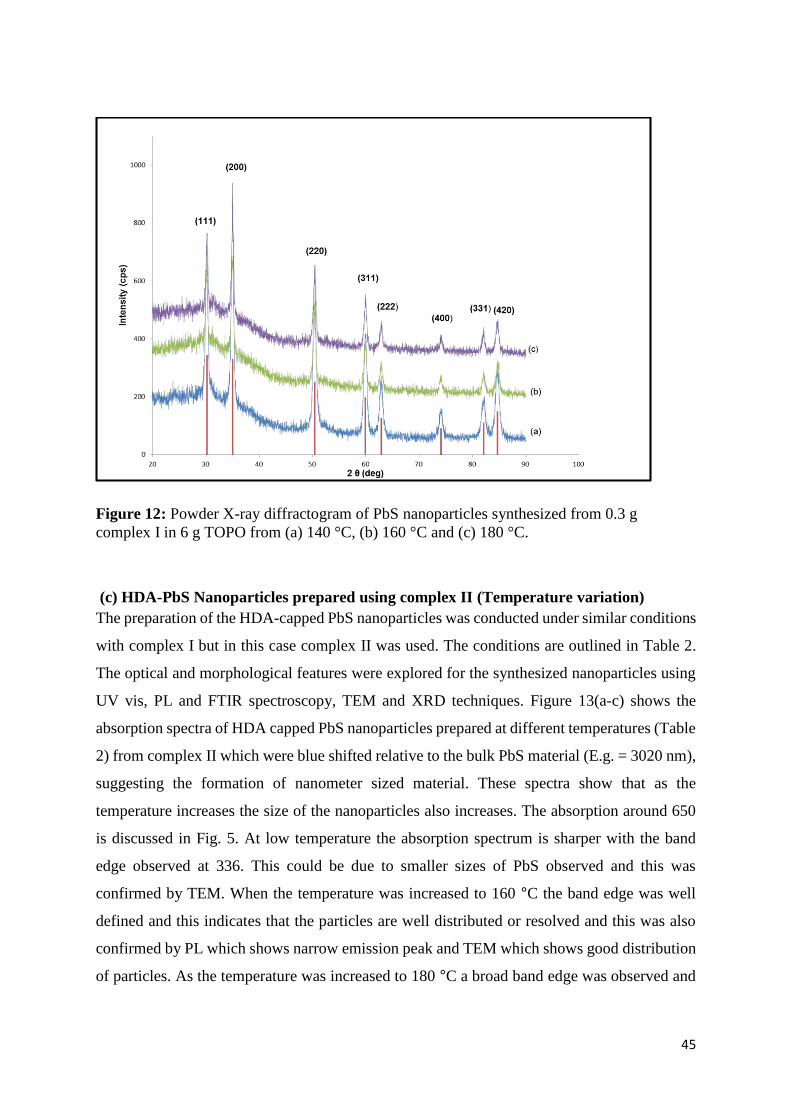
45
Figure 12: Powder X-ray diffractogram of PbS nanoparticles synthesized from 0.3 g
complex I in 6 g TOPO from (a) 140 °C, (b) 160 °C and (c) 180 °C.
(c) HDA-PbS Nanoparticles prepared using complex II (Temperature variation)
The preparation of the HDA-capped PbS nanoparticles was conducted under similar conditions
with complex I but in this case complex II was used. The conditions are outlined in Table 2.
The optical and morphological features were explored for the synthesized nanoparticles using
UV vis, PL and FTIR spectroscopy, TEM and XRD techniques. Figure 13(a-c) shows the
absorption spectra of HDA capped PbS nanoparticles prepared at different temperatures (Table
2) from complex II which were blue shifted relative to the bulk PbS material (E.g. = 3020 nm),
suggesting the formation of nanometer sized material. These spectra show that as the
temperature increases the size of the nanoparticles also increases. The absorption around 650
is discussed in Fig. 5. At low temperature the absorption spectrum is sharper with the band
edge observed at 336. This could be due to smaller sizes of PbS observed and this was
confirmed by TEM. When the temperature was increased to 160 °C the band edge was well
defined and this indicates that the particles are well distributed or resolved and this was also
confirmed by PL which shows narrow emission peak and TEM which shows good distribution
of particles. As the temperature was increased to 180 °C a broad band edge was observed and

46
this indicates polydispersity of the particles and this was confirmed by PL which shows a broad
emission peak.
Figure 13: UV-VIS spectra of PbS nanoparticles prepared with 0.3 g of complex II with 6 g
of HDA at (a) 140 °C, (b) 160 °(C) and 180 °C.
The emission spectra of the samples prepared at different temperatures are given in Fig. 14 (a-
c). The emission maxima of the samples were slightly red shifted from their respective band
edges of the absorption spectra. The emission peaks for the sample prepared at 160 °C have a
narrow shape, which indicates good passivation of the particles. However, the nanoparticles
prepared at high temperature (180 °C) show the broad emission peak which indicates that the
particles are polydispersed or agglomerated. The emission maximum shift to lower wavelength
as the temperature was decreased. The emission peaks maxima are shown in Table 5. The
difference between the absorption and emission peak wavelength at low temperatures is very
small. This indicates the emission associated with the transition of electrons from trap state to
conduction band (Navaneethan et al., 2009).

47
Figure 14: PL spectra of PbS nanoparticles prepared with 0.3 g of complex II with 6 g of
HDA at (a) 140 °C, (b) 160 °(C) and 180 °C.
Table 4: Absorption band edges and emission maxima of PbS nanoparticles prepared with
6 g HDA at 140 °C, 160°Cand 180 °C.
Reaction temperature (°C) Absorption band edge (nm) Emission maximum (nm)
140 335 336
160 345 364
180 346 405
The TEM images of HDA capped PbS nanoparticles synthesized at different temperatures are
shown in Figure 15(a-c). The observed morphology of HDA capped PbS nanoparticles was
found to be cubes. It was observed that when the temperature increases the size of the
nanoparticles also increases and this can be due to Ostwald ripening. The estimated average
particle sizes were found to be 16.89 ± 8.02 nm, 22.089 ± 7.53 nm and 27.91 ± 6.949 nm for
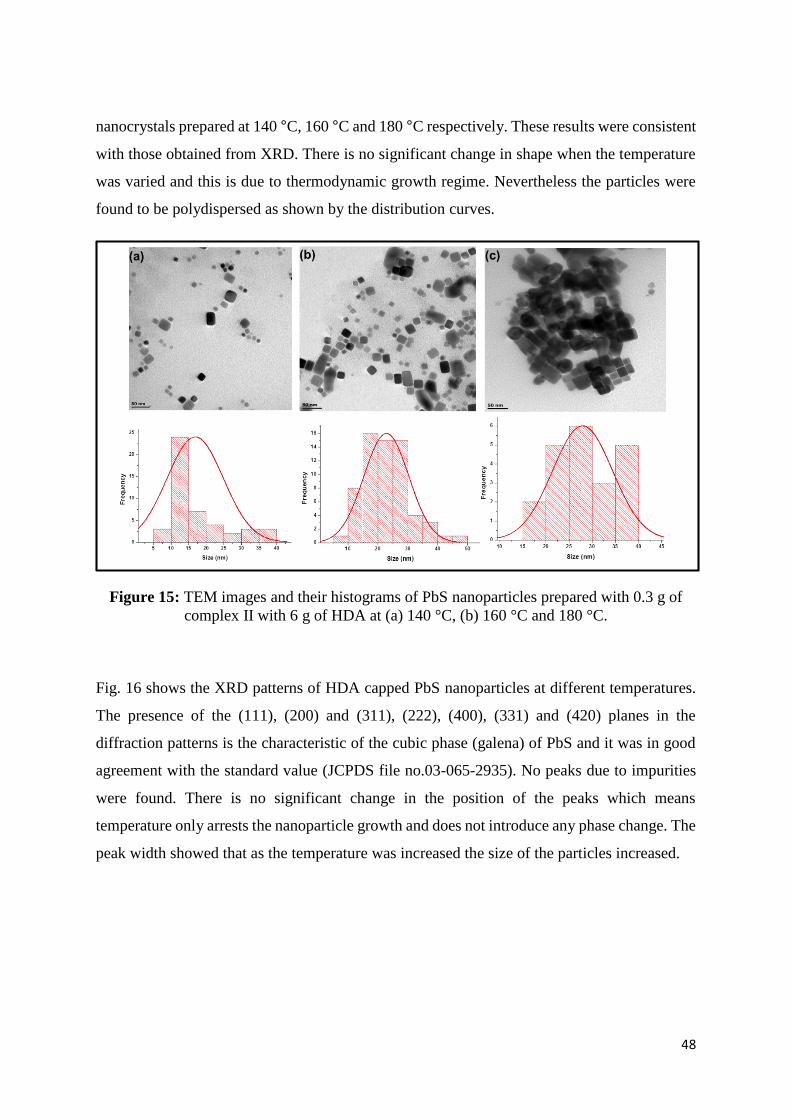
48
nanocrystals prepared at 140 °C, 160 °C and 180 °C respectively. These results were consistent
with those obtained from XRD. There is no significant change in shape when the temperature
was varied and this is due to thermodynamic growth regime. Nevertheless the particles were
found to be polydispersed as shown by the distribution curves.
Figure 15: TEM images and their histograms of PbS nanoparticles prepared with 0.3 g of
complex II with 6 g of HDA at (a) 140 °C, (b) 160 °C and 180 °C.
Fig. 16 shows the XRD patterns of HDA capped PbS nanoparticles at different temperatures.
The presence of the (111), (200) and (311), (222), (400), (331) and (420) planes in the
diffraction patterns is the characteristic of the cubic phase (galena) of PbS and it was in good
agreement with the standard value (JCPDS file no.03-065-2935). No peaks due to impurities
were found. There is no significant change in the position of the peaks which means
temperature only arrests the nanoparticle growth and does not introduce any phase change. The
peak width showed that as the temperature was increased the size of the particles increased.

49
Figure 16: Powder X-ray diffractogram of PbS nanoparticles synthesized from 0.3 g
complex II in 6 g HDA from a) 140 °C, b) 160 °C and C) 180 °C.
(d)TOPO-capped PbS Nanoparticles prepared using complex II (Temperature
variation)
The preparation of the TOPO-capped PbS nanoparticles was conducted under similar
conditions with complex I but in this case complex II was used. The conditions are outlined in
Table 2. The optical and morphological features were explored for the synthesized
nanoparticles using UV/vis and PL spectroscopy, TEM and XRD techniques. Absorption
spectra of TOPO capped PbS nanoparticles prepared at different temperature are shown in Fig.
17. The absorption band edges show no specific trend. The absorption band edges show a blue
shift in relative to the bulk PbS of 3020 nm and this conforms the quantum size effect of PbS.
The broadening of the band edges at higher temperatures is an indication of a broader size
distribution or the presence of larger elongated particles as confirmed by TEM which showed
the presence of cylindrical shapes. The absorption band edges are shown in Table 6.

50
Figure 17: UV-VIS spectra of PbS nanoparticles prepared with 0.3 g of complex II with 6 g
of TOPO at (a) 140 °C, (b) 160 °(C) and 180 °C.
Figure 18 shows emission spectra of TOPO capped PbS nanoparticles prepared at different
temperatures from complex II. The corresponding photoluminescence spectra shows broad
emission peaks with the maxima at 436 nm, 417 nm and 427 nm from low temperature to high
temperature and this is an indication of large size distribution or bigger particles. The emission
spectra show red shift in relative to the absorption spectra. Spectrum at 160 °C shows a blue
shift from emission spectrum at 140 °C, this can be due to change of shape and this was
confirmed by TEM.
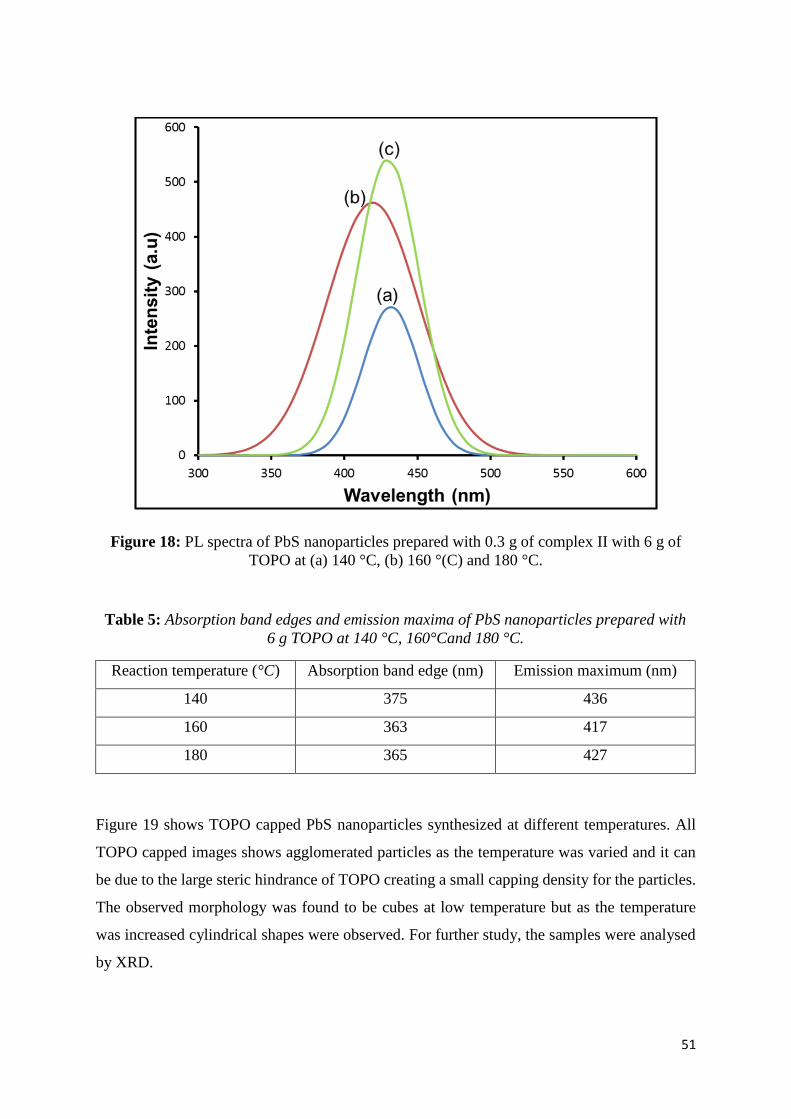
51
Figure 18: PL spectra of PbS nanoparticles prepared with 0.3 g of complex II with 6 g of
TOPO at (a) 140 °C, (b) 160 °(C) and 180 °C.
Table 5: Absorption band edges and emission maxima of PbS nanoparticles prepared with
6 g TOPO at 140 °C, 160°Cand 180 °C.
Reaction temperature (°C) Absorption band edge (nm) Emission maximum (nm)
140 375 436
160 363 417
180 365 427
Figure 19 shows TOPO capped PbS nanoparticles synthesized at different temperatures. All
TOPO capped images shows agglomerated particles as the temperature was varied and it can
be due to the large steric hindrance of TOPO creating a small capping density for the particles.
The observed morphology was found to be cubes at low temperature but as the temperature
was increased cylindrical shapes were observed. For further study, the samples were analysed
by XRD.
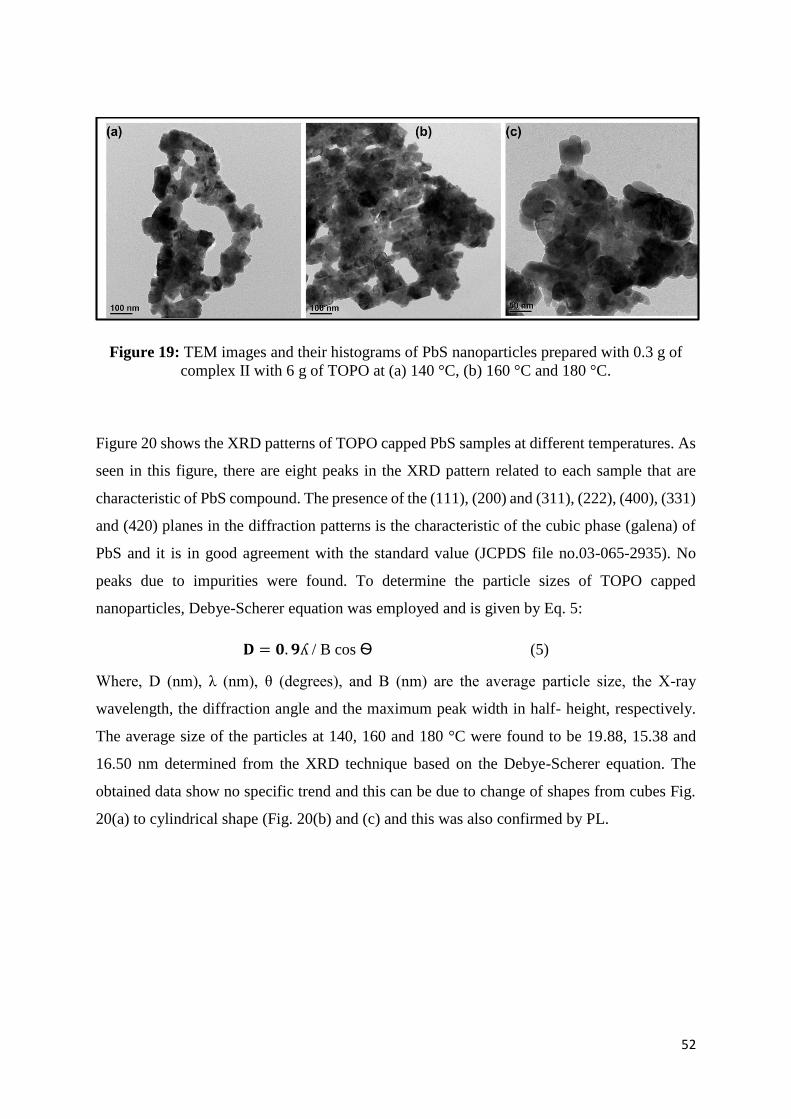
52
Figure 19: TEM images and their histograms of PbS nanoparticles prepared with 0.3 g of
complex II with 6 g of TOPO at (a) 140 °C, (b) 160 °C and 180 °C.
Figure 20 shows the XRD patterns of TOPO capped PbS samples at different temperatures. As
seen in this figure, there are eight peaks in the XRD pattern related to each sample that are
characteristic of PbS compound. The presence of the (111), (200) and (311), (222), (400), (331)
and (420) planes in the diffraction patterns is the characteristic of the cubic phase (galena) of
PbS and it is in good agreement with the standard value (JCPDS file no.03-065-2935). No
peaks due to impurities were found. To determine the particle sizes of TOPO capped
nanoparticles, Debye-Scherer equation was employed and is given by Eq. 5:
𝐃 = 𝟎. 𝟗ʎ / B cos Ѳ (5)
Where, D (nm), λ (nm), θ (degrees), and B (nm) are the average particle size, the X-ray
wavelength, the diffraction angle and the maximum peak width in half- height, respectively.
The average size of the particles at 140, 160 and 180 °C were found to be 19.88, 15.38 and
16.50 nm determined from the XRD technique based on the Debye-Scherer equation. The
obtained data show no specific trend and this can be due to change of shapes from cubes Fig.
20(a) to cylindrical shape (Fig. 20(b) and (c) and this was also confirmed by PL.

53
Figure 20: Powder X-ray diffractogram of PbS nanoparticles synthesized from 0.3 g
complex II in 6 g TOPO from a) 140 °C, b) 160 °C and C) 180 °C.
4.2 Conclusions
Lead (II) sulphide nanoparticles were synthesized from lead complexes of benzimidazole
dithiocarbamate (I) and 2-methylbenzimidazole dithiocarbamate (II). The effect of temperature
and type of capping agent were studied. The optical measurements support the presence of
smaller particles for both capping agents. HDA gave better resolved particles than TOPO at all
temperatures and it was considered as the best capping agent. It also exhibited cubic
morphology at all temperatures for both complex I and II. TOPO displayed anisotropic shapes
at all temperatures. From HDA-PbS nanoparticles using complex I, UV/vis depicted featureless
spectra and this was confirmed by PL which depicted PL maxima at the same wavelength.
TEM showed that as the temperature was increased the size of the particles decreased and this
was confirmed by XRD which followed the same trend. Nanoparticles at 180 °C were
monodispersed and this was supported by PL which showed narrow emission peak and XRD
which depicted wide peak width, therefore it was considered as the best temperature. The
optical properties for TOPO capped PbS nanoparticles using complex I and II showed no
specific trend and this was confirmed by TEM and XRD which gave no specific trend. TEM
showed undefined morphology at low temperature but showed a cross-like particle with squasi
spheres on top at 160 °C and a mixture of rods-like material with squasi spheres. It also showed
54
well dispersed particles at 160 °C and this was supported by UV/Vis which showed pronounced
band edge and this was considered as the best temperature. Optical properties for HDA capped
PbS nanoparticles using complex II showed that as the temperature was increased the size of
the particles increased and this was confirmed by TEM and XRD which followed the same
trend. TEM showed better dispersity of particles at low temperatures and it was supported by
optical measurements which showed pronounced absorption band edges and narrow emission
peaks. TOPO capped PbS nanoparticles from complex II displayed agglomerated particles and
gave no specific trend on optical properties, TEM and XRD. The cubic morphology was
observed at low temperature but as the temperature was increased cylindrical shapes were
observed. XRD patterns for all temperatures were well crystalline and matched cubic phase of
PbS (Galena) except for HDA capped PbS from complex I at low temperature which matched
face centred cubic phase. There was no significant change in the position of the peaks which
means temperature only arrests the nanoparticle growth and does not introduce any phase
change for both complexes except complex 1 at low temperature which introduced a new phase.

55
Chapter 5
Characterization of HDA-capped nickel sulphide
nanoparticles using benzimidazoledithiocarbamate
and 2-methyldithiocarbamate complexes
5.1HDA capped nickel sulphide nanoparticles
This chapter focuses on the modification of synthetic parameters in order to influence the size,
structure, composition and arrangement of nickel sulphide nanoparticles. The synthetic
procedure followed was thermal decomposition of benzimidazole dithiocarbamate and 2-
methyldithiocarbamate complexes of nickel in an inert environment in the presence of
trioctylphosphine (solvent) and hexadecylamine (capping agent). The reaction condition such
as precursor concentration and temperature of the reaction were varied in order to determine
their influence. Temperature was varied from 140,160 to 180 °C using 0.3 g of complex III and
IV while keeping other parameters constant. The best temperature was chosen (160 °C) and
the amount of precursor concentration was varied from 0.3, 0.35 to 0.4 g while keeping other
parameters constant.
5.1.1 (a) HDA-nickel sulphide Nanoparticles prepared using complex III (Temperature
variation)
Table 6 shows reaction conditions for the preparations of Ni3S4 nanoparticles at different
temperatures using complex III, while keeping all the other parameters the same.
Table 6: Variation of temperature in the preparation of HDA-Ni3S4 nanoparticles using
complex III.
Surfactant (HDA)
mass (g)
Complex III
mass (g)
Temperature
(°C)
6 0.3 140
6 0.3 160
6 0.3 180

56
UV-Vis spectral analysis has been widely used to characterize semiconductor nanoparticles.
As the particle size decreases, the absorption edge shifts to shorter wavelength, due to the band
gap increase of the smaller particles (Deyu et al., 2003).The absorption bands are blue shifted
from the bulk nickel sulphide and this indicates quantum size effect. Absorption spectra for the
nickel sulphide nanoparticles synthesized at different temperatures from complex III are shown
in Fig. 21(a-c).All the spectra show one major absorption peak. The absorption bands were
observed at a) 365 nm, b) 370 nm and c) 380 nm respectively (Table 8). These spectra indicate
that as the temperature increases the size of the particles also increases and this is confirmed
by PL and TEM images.This trend is expected, as it is well known that high temperature
generate a large number of nuclei, which in turn leads to the formation of large particles by
Ostwald ripening.
Figure 21: UV-VIS spectra of Ni3S4 nanoparticles prepared with 0.3 g of complex III with 6
g of HDA at (a) 140 °C, (b) 160 °(C) and 180 °C.
The emission spectra for the nickel sulphide nanoparticles synthesized at different temperatures
from complex III is shown in Fig. 22(a-c).The entire spectra show one major emission peak.
The emission peaks are red shifted in relation to the absorption peaks. The corresponding
photoluminescence spectra were observed with the strong emission peaks centred at 698 nm

57
when excited at 520 nm. The sharp emission peaks observed are an indication of narrow size
distribution and this was confirmed by distribution curves. As the temperature was increased
the emission peaks also broadens and this shows that the particles sizes are getting bigger.
Figure 22: PL spectra of Ni3S4 nanoparticles prepared with 0.3 g of complex III with 6 g of
HDA at (a) 140 °C, (b) 160 °(C) and 180 °C.
Table 7: absorption bands and emission maxima of Ni3S4 nanoparticles prepared with 6 g of
HDA at 140 °C, (b) 160 °(C) and 180 °C.
Reaction temperature (°C) Absorption bands (nm) Time (Minutes)
140 365 60
160 370 60
180 380 60
The TEM images of particles prepared from complex III at different temperatures are shown
in Fig. 23(a-c). When the temperature was increased to 180 °C, the particle size was also
increasing this can be due to Ostwald ripening effect. At all temperatures, a mixture of spheres
and cubes were observed with the average diameter of 2.926 ± 0.719 nm, 5.813 ± 1.312 nm
and 7.891± 3.581 nm respectively. At low temperature the particles are not clearly resolved

58
and this could be due to incomplete reaction. It was observed that particles were well dispersed
and well resolved at 160 °C fig. 23(b). This reaction is favoured by thermodynamic growth
regime as it is well known that at thermodynamic reaction all nanocrystals grow toward a shape
that has the lowest energy at equilibrium. These results are in good agreement with absorption
spectra results shown in Fig. 22.
Figure 23: TEM images and their histograms of Ni3S4 nanoparticles prepared with 0.3 g of
complex III with 6 g of HDA at (a) 140 °C, (b) 160 °C and 180 °C.
Fig. 24 shows XRD pattern of particles synthesized at different temperatures from complex III.
Low (140 °C) and high (180 °C) temperatures show some impurities of C7OS8 (peaks marked
by a sphere) and pure nickel and this was confirmed by TGA which showed a mixture of nickel
and nickel sulphide at the final residue and also some impurities of oxygen. However middle
temperature (160 °C) only shows Ni as an impurity. The presence of these impurities can be
due to incomplete reaction time or that the particles were not washed enough. Four major peaks
were observed and they were indexed to cubic Ni3S4 with 2θ values at 26 °, 37 °, 64 ° & 77 °.
These diffraction peaks matches well with the standard XRD pattern (JCPDS No. 00-043-
1469). At high temperature an introduction of monoclinicNixS6 phase was observed (marked

59
by a square) and this indicates that temperature does not only arrests the nanoparticle growth
it also introduced phase change.
Figure 24: Powder X-ray diffractogram of Ni3S4, ■NixS6 nanoparticles and ●C7OS8
synthesized from 0.3 g complex III in 6 g HDA at a) 140 °C, b) 160 °C and C) 180 °C.
(b) HDA-Ni3S4 Nanoparticles prepared using complex IV (Temperature variation)
The preparation of the HDA-capped Ni3S4 nanoparticles was done under similar conditions
with complex III but in this case complex IV was used. The conditions are outlined in Table 7.
The optical and morphological features were explored for the synthesized nanoparticles using
UV/vis and PL spectroscopy, TEM and XRD techniques.
The absorption spectra for the nickel sulphide nanoparticles synthesized at different
temperatures from complex IV are shown in Fig. 25(a-c)). Nickel sulphide nanoparticles show
a blue shift in relative to bulk NiS (495 nm). It was observed that as the temperature was
increased the size of the particles also increased and this could be due to Ostwald ripening
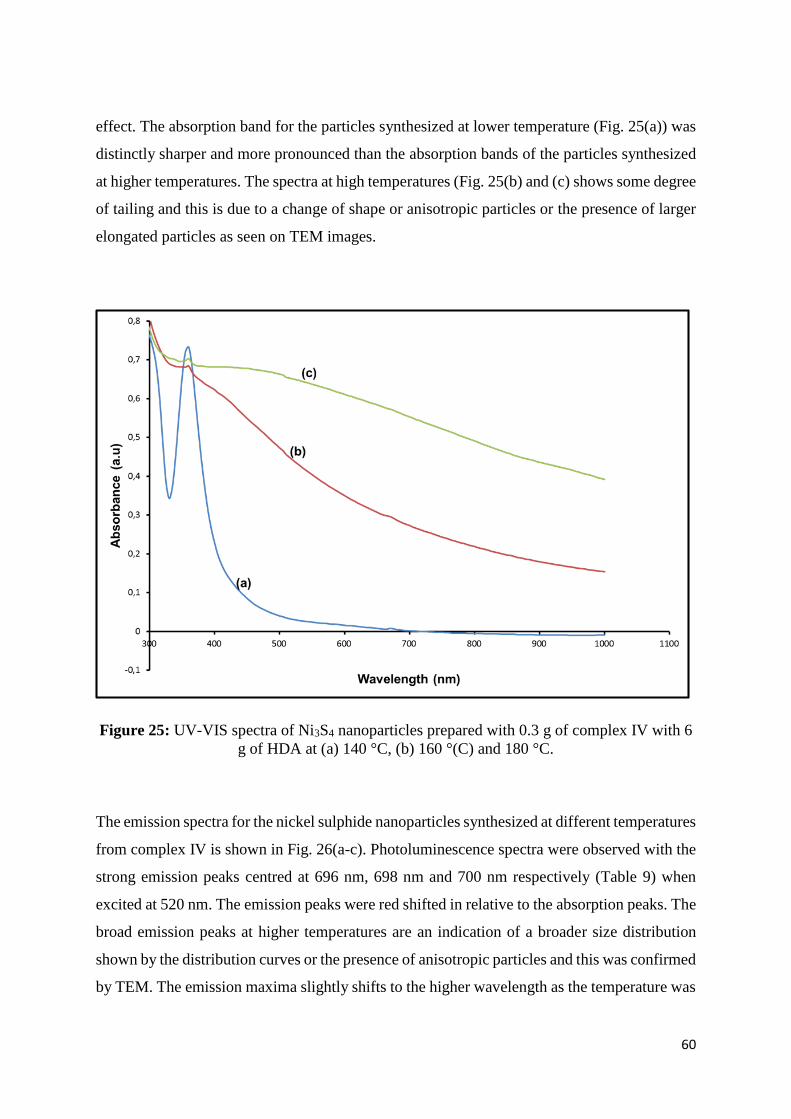
60
effect. The absorption band for the particles synthesized at lower temperature (Fig. 25(a)) was
distinctly sharper and more pronounced than the absorption bands of the particles synthesized
at higher temperatures. The spectra at high temperatures (Fig. 25(b) and (c) shows some degree
of tailing and this is due to a change of shape or anisotropic particles or the presence of larger
elongated particles as seen on TEM images.
Figure 25: UV-VIS spectra of Ni3S4 nanoparticles prepared with 0.3 g of complex IV with 6
g of HDA at (a) 140 °C, (b) 160 °(C) and 180 °C.
The emission spectra for the nickel sulphide nanoparticles synthesized at different temperatures
from complex IV is shown in Fig. 26(a-c). Photoluminescence spectra were observed with the
strong emission peaks centred at 696 nm, 698 nm and 700 nm respectively (Table 9) when
excited at 520 nm. The emission peaks were red shifted in relative to the absorption peaks. The
broad emission peaks at higher temperatures are an indication of a broader size distribution
shown by the distribution curves or the presence of anisotropic particles and this was confirmed
by TEM. The emission maxima slightly shifts to the higher wavelength as the temperature was

61
increased or they are slightly red shifted to each other and this indicates that the particles are
growing bigger as the temperature was increased.
Figure 26: PL spectra of Ni3S4 nanoparticles prepared with 0.3 g of complex IV with 6 g of
HDA at (a) 140 °C, (b) 160 °(C) and 180 °C.
Table 8: Absorption bands and emission maxima of Ni3S4 nanoparticles prepared with 6 g
HDA at 140 °C, 160°Cand 180 °C.
Reaction temperature
(°C)
Absorption bands
(nm)
Emission maximum
(nm)
140 360 696
160 365 698
180 380 700
The TEM images of particles prepared from complex IV at different temperatures are shown
in Fig. 27(a-c). The images show that as the temperature was increased the size of the particles
also increased. There was a shape transformation from isotropic to anisotropic shaped particles
and that means the reaction is favoured by kinetic growth regime. There is an evolution of
shape from spherical particles Fig. 27(a) to a mixture of cubes, rods, spheres and triangles Fig.

62
27(b) shaped particles with an increase in temperature and this can be due to methyl group
attached. Nair and Scholes reported that anisotropic particle growth could be due to oriented
attachment (Nair and Scholes, 2006). As the temperature was increased to 180 °C the particles
became aggregated. The estimated average size at 140 °C was 4.21±1.33 nm and for cubes at 160 °C
since they are dominant was 8.86±1.48 nm. It was observed that the particles are well dispersed
and well resolved at 160 °C.
Figure 27: TEM images and their histograms of Ni3S4 nanoparticles prepared with 0.3 g of
complex IV with 6 g of HDA at (a) 140 °C, (b) 160 °C and 180 °C.
Fig. 28 shows XRD pattern of particles synthesized at different temperatures from complex IV.
Low (140 °C) and high (180 °C) temperatures show some impurities of C7OS8 (peaks marked
by a sphere) and pure nickel and this was confirmed by TGA final residue which showed the
mixture of nickel and nickel sulphide. However middle temperature (160 °C) only shows Ni as
an impurity. Five major peaks were observed and they were indexed to cubic Ni3S4 with 2θ
values at 16 °, 26 °, 37 °, 64 °C and 77 °. These diffraction peaks matches well with the standard
XRD pattern (JCPDS No. 00-043-1469). The wideness of the peaks indicates the presence of
smaller particles and this was confirmed by TEM. At high temperature an introduction of

63
monoclinic NixS6 phase was observed (marked by a square) and this indicates that temperature
does not only arrests the nanoparticle growth it also introduced phase change.
Figure 28: Powder X-ray diffractogram of Ni3S4, ■NixS6 nanoparticles and ●C7OS8
nanoparticles synthesized from 0.3 g complex IV in 6 g HDA at a) 140 °C, b) 160 °C and C)
180 °C.
(c) HDA-nickel sulphide nanoparticles prepared using complex III (Conc variation)
Table 10 shows the reaction parameters for the preparation of nickel sulphide nanoparticles by
using various concentrations of complex III, while no other parameters were changed.
Table 9: Variation of concentration in the preparation of HDA-nickel sulphide
nanoparticles using complex III
Surfactant (HDA)
mass (g)
Complex III
mass (g)
Temperature
(°C)
Time
(Minutes)
6.0 0.3 160 60
6.0 0.35 160 60
6.0 0.4 160 60

64
The absorption spectra of nickel sulphide nanoparticles from complex III is shown in Fig.
29(a-c). The absorption bands were observed at a) 365 nm, b) 485 nm and c) 390 nm
respectively and were blue shifted from the bulk nickel sulphide. The spectra show that as the
concentration was increased the size of the particles also increased shown in Table 11. The first
absorption peaks around 350 nm was due to instrumental error (the glass curvets were reading
those peaks) at higher concentrations. The absorption band at low concentration was shifted to
lower wavelength and that indicate the presence of smaller particles and this was confirmed by
TEM.
Figure 29: UV/Vis spectra of nickel sulphide nanoparticles prepared from (a) 0,3 g, (b) 0,35
g and (c) 0,4 g of complex III with 6 g of HDA at 160 °C.
The emission spectra of nickel sulphide nanoparticles from complex III is shown in Fig. 30 (a-
c). The emission maxima of the samples were red shifted from their respective absorption
bands. The emission maxima were observed at 677 nm, 688 nm and 657 nm from low
concentration to high concentration. The emission peaks shows no specific trend and this can
be due to change of shapes and this was confirmed by TEM. The emission peaks for the sample
prepared at low concentration have a narrow shape which indicates good passivation of
particles. However, for the nanoparticle prepared at high concentrations (Fig. 30(b) and c)), the
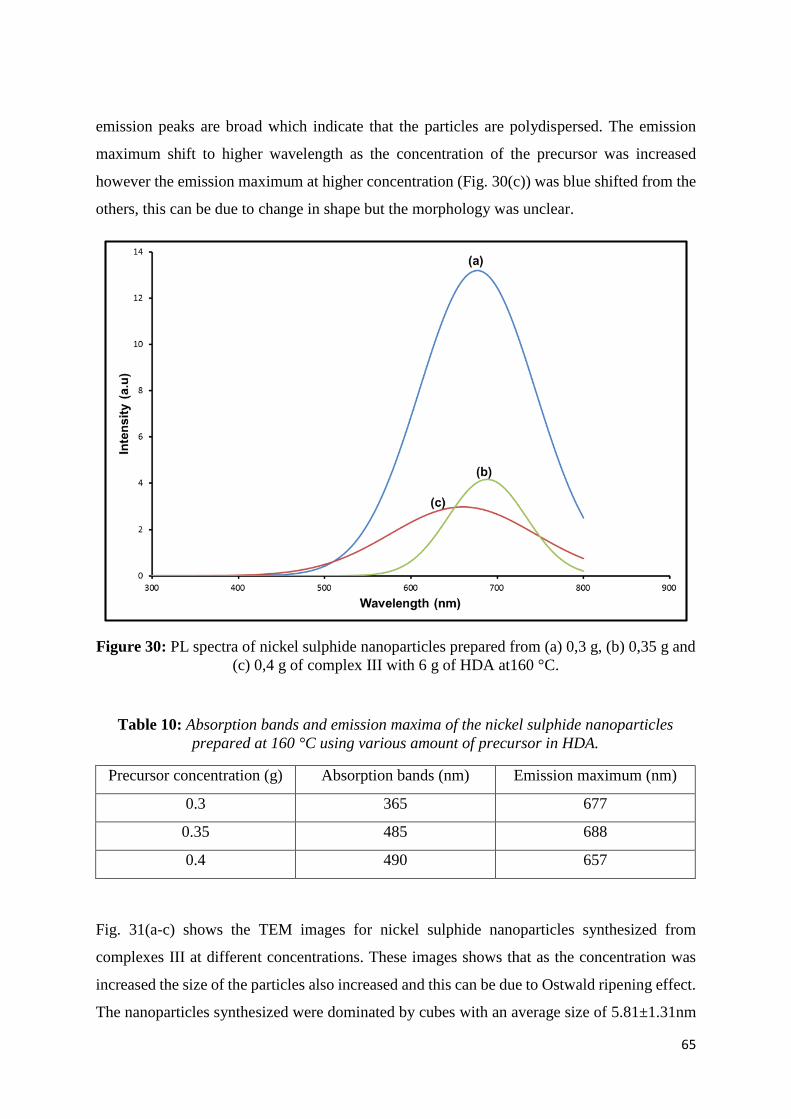
65
emission peaks are broad which indicate that the particles are polydispersed. The emission
maximum shift to higher wavelength as the concentration of the precursor was increased
however the emission maximum at higher concentration (Fig. 30(c)) was blue shifted from the
others, this can be due to change in shape but the morphology was unclear.
Figure 30: PL spectra of nickel sulphide nanoparticles prepared from (a) 0,3 g, (b) 0,35 g and
(c) 0,4 g of complex III with 6 g of HDA at160 °C.
Table 10: Absorption bands and emission maxima of the nickel sulphide nanoparticles
prepared at 160 °C using various amount of precursor in HDA.
Precursor concentration (g) Absorption bands (nm) Emission maximum (nm)
0.3 365 677
0.35 485 688
0.4 490 657
Fig. 31(a-c) shows the TEM images for nickel sulphide nanoparticles synthesized from
complexes III at different concentrations. These images shows that as the concentration was
increased the size of the particles also increased and this can be due to Ostwald ripening effect.
The nanoparticles synthesized were dominated by cubes with an average size of 5.81±1.31nm

66
at low concentration Fig. 31(a). By further increasing the concentration Fig. 31(b) under similar
reaction conditions the shape of the particles changes to stacked sheets with small cubes ontop
with the average size of 11.21±3.36 for cubes and 106.91±29.22 nm for sheets. At a higher
concentration the particles are agglomerated and the morphology is unclear.
Figure 31: TEM images and their histograms of nickel sulphide nanoparticles prepared from
(a) 0, 3 g, (b) 0, 35 g and (c) 0,4 g of complex III with 6 g of HDA at 160 °C.
Fig. 32 shows XRD pattern of particles synthesize from complex III (a-c) by varying
concentration. The pattern shows sides’ reactions of NiSO4.6H2O (marked by a star) at high
concentrations. However at 0.35 g a peak for hexagonal NiS and was observed marked by a
sphere. The miller index (044) was also observed and this indicates that there was a mixture of
phases at 0.35 g. Four major peaks were observed at low concentration Fig. 32(a) and they
were indexed to cubic Ni3S4 with 2θ values at 26°, 37°, 64° and 77°. The diffraction peaks
matches well with the standard XRD pattern (JCPDS No. 00-043-1469). Nickel peak was also
observed as an impurity at low concentration.

67
Figure 32: XRD patterns of nickel sulphide Ni3S4, ●NiS and NiSO4.6H2O prepared from
(a) 0, 3 g, (b) 0, 35 g and (c) 0, 4 g of complex III with 6 g of HDA at 160 °C.
(d) HDA-nickel sulphide Nanoparticles prepared using complex IV (Conc variation)
Table 12 shows the reaction parameters for the preparation of Ni3S4 nanoparticles by using
various concentrations of complex IV, while no other parameters were changed
Table 11: Variation of concentration in the preparation of HDA- Ni3S4 nanoparticles
using complex IV
Surfactant(HDA)mass(g) ComplexIV
mass(g)
Temperature (°C) Time (Minutes)
6 0.3 160 60
6 0.35 160 60
6 0.4 160 60
The absorption spectra of Ni3S4 nanoparticles from complex IV are shown in Fig. 33 (a-c). The
absorption bands were blue shifted in relative to the bulk nickel sulphide of 495 nm.The

68
absorption bands at low and high concentrations were observed at a) 320 and c) 360 nm, the
absorption spectrum at 0.35 g (b) was featureless. The tailing of absorption spectra at low and
high concentrations indicates the presence of anisotropic particles and this was confirmed by
TEM.
Figure 33: UV/Vis spectra of Ni3S4 nanoparticles prepared from (a) 0, 3 g, (b) 0, 35 g and (c)
0, 4 g of complex IV with 6 g of HDA at160 °C.
The emission spectra of Ni3S4 nanoparticles from complex IV are shown in Fig. 34 (a-c). The
emission maxima of the samples were red shifted from their respective absorption bands. The
emission maxima were observed at 698 nm, 698 nm and 688 nm from low concentration to
high concentration excited at 520 nm (Table 13). The photoluminescence spectra for complex
IV show broad emissions peaks which are an indication of polydispersed particles. The
emission maximum shift to lower wavelength at higher concentration and this can be due to
change of shapes. The narrow emission peak at low concentration is an indication of smaller
sizes.

69
Figure 34: PL spectra of Ni3S4 nanoparticles prepared from (a) 0, 3 g, (b) 0, 35 g and (c) 0, 4
g of complex IV with 6 g of HDA at 160 °C.
Table 12: Absorption bands and emission maxima of the Ni3S4 nanoparticles prepared at
160 °C using various amount of precursor in HDA.
Precursor concentration (g) Absorption bands (nm) Emission maximum (nm)
0.3 320 698
0.35 - 698
0.4 360 688
Fig. 35 (a-c) shows the TEM images for nickel sulphide nanoparticles synthesized from
complexes IV at different concentrations. The images show that as the concentration of the
particles was increased the size of the particles also increased and this was promoted by the
amount of precursor provided in the nucleation and growth of particles. The images show that
particles were dominated by cubes and spheres moreover rods and triangles also present at all
concentrations. At low concentration the particles were well resolved but as the concentration
was increased the particles joined other forming long rods and bigger cubes, further increasing
the concentration the particles were losing shapes forming squasi spheres. The average sizes
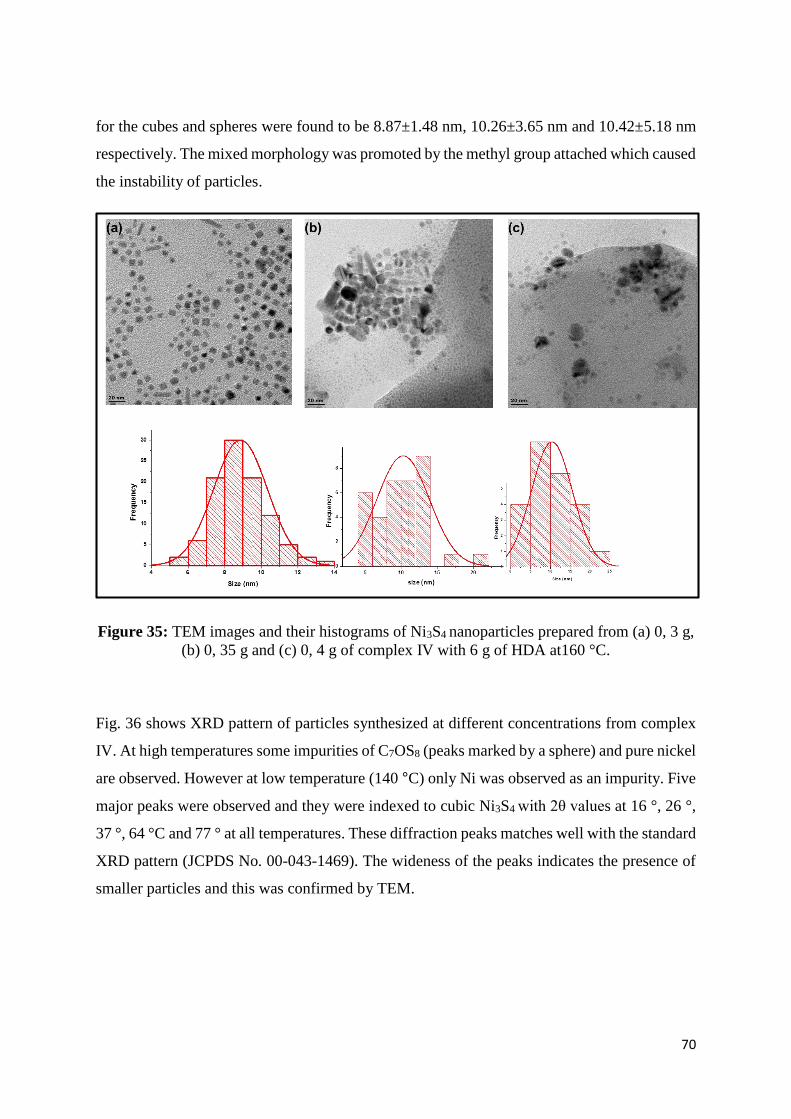
70
for the cubes and spheres were found to be 8.87±1.48 nm, 10.26±3.65 nm and 10.42±5.18 nm
respectively. The mixed morphology was promoted by the methyl group attached which caused
the instability of particles.
Figure 35: TEM images and their histograms of Ni3S4 nanoparticles prepared from (a) 0, 3 g,
(b) 0, 35 g and (c) 0, 4 g of complex IV with 6 g of HDA at160 °C.
Fig. 36 shows XRD pattern of particles synthesized at different concentrations from complex
IV. At high temperatures some impurities of C7OS8 (peaks marked by a sphere) and pure nickel
are observed. However at low temperature (140 °C) only Ni was observed as an impurity. Five
major peaks were observed and they were indexed to cubic Ni3S4 with 2θ values at 16 °, 26 °,
37 °, 64 °C and 77 ° at all temperatures. These diffraction peaks matches well with the standard
XRD pattern (JCPDS No. 00-043-1469). The wideness of the peaks indicates the presence of
smaller particles and this was confirmed by TEM.

71
Figure 36: XRD patterns of Ni3S4 nanoparticles and ● C7OS8 prepared from (a) 0, 3 g, (b) 0,
35 g and (c) 0, 4 g of complex IV with 6 g of HDA at160 °C.
5.2 Conclusions
Nickel sulphide nanoparticles were synthesized by the thermal decomposition of
benzimidazole and 2-methylbenzimidazole dithiocarbamate complexes (III and IV) in the
presence of hexadecylamine capping agent. Optical properties and TEM revealed that the study
of reaction temperature have more effect on the size and shape of the nanoparticles. This was
confirmed by the increase in the band edges and the change in shape of the nanoparticle
prepared when increasing the reaction temperature. The optical measurements also supported
the presence of smaller particles for all complexes. TEM showed better dispersity of the
particles at 160 °C for all complexes and it was considered as the best temperature. Complex
III was considered as the best because it showed most stable shapes (spheres and cubes) of
nanocrystals. Complex IV displayed a mixture of spheres, cubes, triangles and rods at 160 °C.
All complexes at different temperatures exhibited anisotropic shapes of particles. XRD for both
complexes exhibited cubic phase of Ni3S4 at all temperatures however there was an
introduction of a monoclinic phase of NixS6 at 180 °C. Complex VI showed a mixture of more

72
than two shapes and this was due to the orientated attachment (methyl group).The nature of the
precursor was found to have an influence on the shape of the nanoparticles particles.
Nickel sulphide nanoparticles were synthesized by thermal decomposition of benzimidazole
and 2-methylbenzimidazole dithiocarbamate complexes (III and IV) in the presence of
hexadecylamine capping agent by varying the amount of the precursor. The optical
measurements supported the presence of smaller particles at all concentrations except for
complex III at higher concentrations. This was confirmed by TEM which exhibited a mixture
of cubes and bigger sheets at high concentrations and a mixture of spheres and cubes at low
concentration. It was also in line with XRD which showed broad peak width. Complex IV
exhibited a mixture of spheres, cubes, triangles, squasi spheres (0.4 g) and rods. TEM showed
better dispersity of particles at low concentration (0.3 g) for all complexes and it was considered
as the best concentration. XRD for complex III showed cubic Ni3S4at low concentration, a
mixture of cubic Ni3S4 and hexagonal NiS when the concentration was raised to 0.35 g and
impurities of NiSO4.6H2O at higher concentrations. XRD for complex IV displayed cubic
phase of Ni3S4 at all concentrations and impurities of C7OS8 at higher concentrations.

73
Chapter 6
Characterization of HDA capped cobalt sulphide
nanoparticles using benzimidazoledithiocarbamate
and 2-methyldithiocarbamate as ligands
6.1HDA capped cobalt sulphide nanoparticles
The synthetic procedure followed was thermal decomposition of benzimidazole
dithiocarbamate and 2-methyldithiocarbamate complexes of cobalt in an inert environment in
the presence of trioctylphosphine (solvent) and hexadecylamine (capping agent). The reaction
condition such as temperature was varied to determine its effect on size and shape of the
nanoparticles. Complex V and VI were used in this chapter and temperature was varied from
140, 160 to 180 °C while keeping other parameters constant. The reaction parameter such as
temperature of the reaction has showed a profound effect on the size and morphology.
6.1.1 (a) HDA- cobalt sulphide Nanoparticles prepared using complex V (Temperature
variation)
Table 14 shows reaction conditions for the preparations of cobalt sulphide nanoparticles at
different temperatures using complex V, while keeping all the other parameters the same.
Table 13: Variation of temperature in the preparation of HDA-Co3S4 nanoparticles using
complex V
Surfactant (HDA)
mass (g)
Complex V
mass (g)
Temperature
(°C)
Time
(Minutes)
6 0.3 140 60
6 0.3 160 60
6 0.3 180 60

74
Figure 37(a-c) shows the absorption spectra of Co3S4 synthesized from complex V at different
temperatures. The bulk band edge of cobalt sulphide was reported to 1127.27 nm with a cubic
structure (Bao et al., 2008b). The absorption spectra displayed three excitonic peaks and they
were blue shifted in relative to the bulk cobalt sulphide. Cobalt sulphide bulk is composed of
a conduction bands and a continuous valence resulting in a fixed energy band with a single
absorption peak. The discrete atomic-like states with energies that are determined by the
properties of the nanoparticles ascend as the cobalt sulphide becomes quantized. Thus, the
observed three peaks of cobalt sulphide nanoparticles in the absorption spectra were due to the
1S, 1P and 1D transition, with the third excitonic peak categorized as the band gap of the
material. Cobalt sulphide nanoparticles prepared at low temperature (Fig. 37(a) exhibited three
major absorption peaks, two excitonic peaks at 610 nm, 430 nm and a maximum peak at 320
nm. A fourth absorption shoulder or absorption peak was observed at 880 nm. This peak maybe
attributed to absorption from a subset of larger particles and this was confirmed by TEM which
showed a mixture of small and bigger particles. At 160 °C the spectrum displayed three
excitonic peaks positioned at 605 nm, 425 nm and a maximum peak at 305 nm. At high
temperature, cobalt sulphide also displayed three absorption peaks positioned at 600 nm, 415
nm and a maximum peak at 310 nm respectively. Table 15 clearly shows that as the temperature
was increased, the size of the particles decreased. The pronounced excitonic peaks at high
temperatures as well as high energy absorption feature indicate a stable and narrow size
distribution and this was confirmed by PL which showed narrow emission peaks at high
temperatures.

75
Figure 37: UV-VIS spectra of cobalt sulphide nanoparticles prepared with 0.3 g of complex
V with 6 g of HDA at (a) 140 °C, (b) 160 °(C) and 180 °C.
The emission spectra of the samples prepared at different temperatures are given in Fig. 38.
The emission maxima of the samples were red shifted from their respective absorption bands.
This red shift in relation to the absorption bands was generally observed in II-VI semiconductor
nanoparticles (Malik et al., 2000). The photoluminescence spectra at high temperatures (Fig.
38(b) and (c)) exhibited narrow emission peaks and this indicates narrow size distribution. The
emission peak for the sample prepared at low temperature (Fig. 38(a)) has a broad shape, which
indicates polydispersity of the particles and this was confirmed by TEM which showed a
mixture of big and small particles. The emission maxima are shown in Table. 15. The samples
were excited at 520 nm.

76
Figure 38: PL spectra of cobalt sulphide nanoparticles prepared with 0.3 g of complex V
with 6 g of HDA at (a) 140 °C, (b) 160 °(C) and 180 °C.
Table 14: Absorption bands and emission maxima of cobalt sulphide nanoparticles
prepared with 6 g HDA at 140 °C, 160 °C and 180 °C.
Reaction temperature
(°C)
Absorption bands
(nm)
Emission maximum
(nm)
140 430 698
160 425 698
180 415 698
Figure 39 (a-c) show TEM images of HDA capped cobalt sulphide nanoparticles prepared at
different temperatures. The images show that as temperature was increased, the size of the
particles decreased and this can be due to effect of decomposition rate. The morphology
observed was close to spherical shapes. The average sizes were found to be 10±3.89 nm,
5.45±1.08 nm and 3.03±1.90 nm respectively. Particles at low temperature were polydispersed
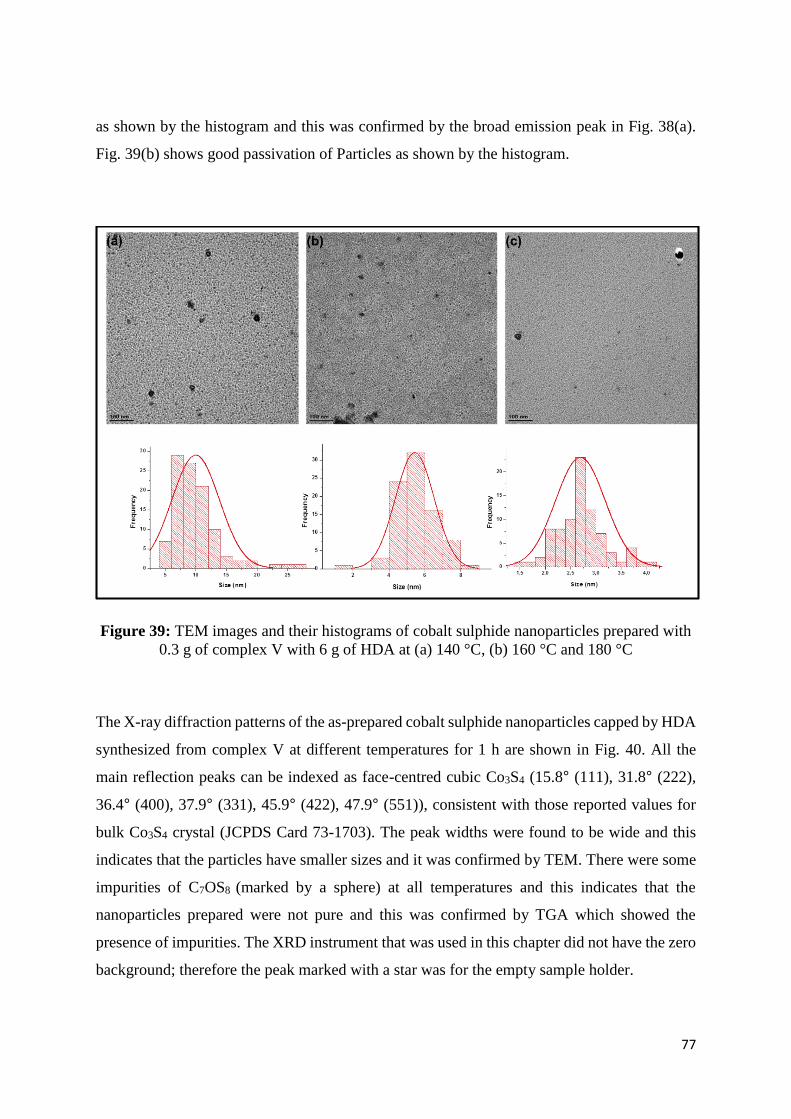
77
as shown by the histogram and this was confirmed by the broad emission peak in Fig. 38(a).
Fig. 39(b) shows good passivation of Particles as shown by the histogram.
Figure 39: TEM images and their histograms of cobalt sulphide nanoparticles prepared with
0.3 g of complex V with 6 g of HDA at (a) 140 °C, (b) 160 °C and 180 °C
The X-ray diffraction patterns of the as-prepared cobalt sulphide nanoparticles capped by HDA
synthesized from complex V at different temperatures for 1 h are shown in Fig. 40. All the
main reflection peaks can be indexed as face-centred cubic Co3S4 (15.8° (111), 31.8° (222),
36.4° (400), 37.9° (331), 45.9° (422), 47.9° (551)), consistent with those reported values for
bulk Co3S4 crystal (JCPDS Card 73-1703). The peak widths were found to be wide and this
indicates that the particles have smaller sizes and it was confirmed by TEM. There were some
impurities of C7OS8 (marked by a sphere) at all temperatures and this indicates that the
nanoparticles prepared were not pure and this was confirmed by TGA which showed the
presence of impurities. The XRD instrument that was used in this chapter did not have the zero
background; therefore the peak marked with a star was for the empty sample holder.
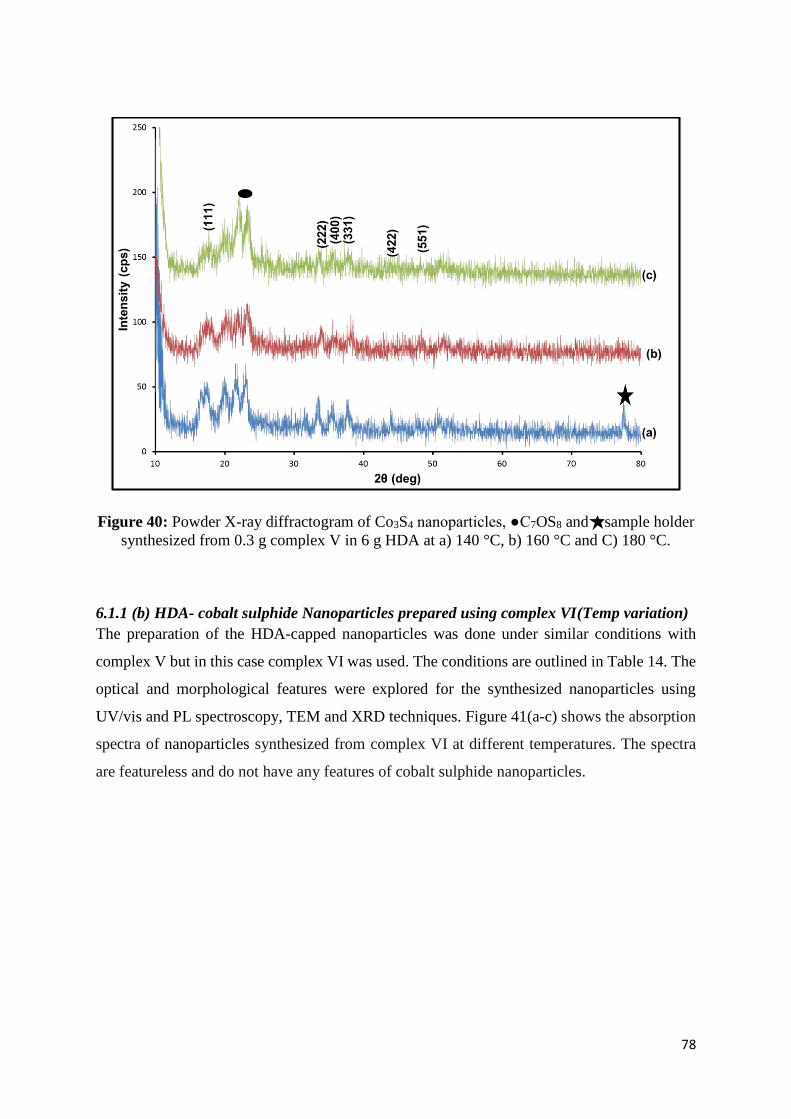
78
Figure 40: Powder X-ray diffractogram of Co3S4 nanoparticles, ●C7OS8 and sample holder
synthesized from 0.3 g complex V in 6 g HDA at a) 140 °C, b) 160 °C and C) 180 °C.
6.1.1 (b) HDA- cobalt sulphide Nanoparticles prepared using complex VI(Temp variation)
The preparation of the HDA-capped nanoparticles was done under similar conditions with
complex V but in this case complex VI was used. The conditions are outlined in Table 14. The
optical and morphological features were explored for the synthesized nanoparticles using
UV/vis and PL spectroscopy, TEM and XRD techniques. Figure 41(a-c) shows the absorption
spectra of nanoparticles synthesized from complex VI at different temperatures. The spectra
are featureless and do not have any features of cobalt sulphide nanoparticles.

79
Figure 41: UV-VIS spectra of nanoparticles prepared with 0.3 g of complex VI with 6 g of
HDA at (a) 140 °C, (b) 160 °(C) and 180 °C.
The emission spectra of the samples prepared at different temperatures are given in Fig. 42.
The emission maxima of the samples were centred at 698 nm when excited at 520 nm. The
emission peaks were broad and this is an indication of broad size distribution and this was
confirmed by TEM which showed bigger particles.
Figure 42: PL spectra of cobalt nanoparticles prepared with 0.3 g of complex VI with 6 g of
HDA at (a) 140 °C, (b) 160 °(C) and 180 °C.

80
Figure 43(a-c) show TEM images of nanoparticles prepared at different temperatures.
The images show that the morphology of the particles was undefined and the sizes were
not calculated and this was confirmed by UV/vis spectra which also exhibited featureless
spectra.
Figure 43: TEM images and their histograms of nanoparticles prepared with 0.3 g of
complex VI with 6 g of HDA at (a) 140 °C, (b) 160 °C and 180 °C.
The X-ray diffraction patterns of the nanoparticles capped by HDA synthesized from complex
VI at different temperatures for 1 h are shown in Fig. 6.1.8. The patterns exhibited some
impurities of C7OS8 (marked by a sphere) at all temperatures. There was no any peak related
to cobalt or cobalt sulphide and this could be due to that the time these nanoparticles were
synthesized, the complexes had already decomposed. The peaks marked by triangles belong to
the empty sample holder.

81
Figure 44: Powder X-ray diffractogram of ●C7OS8 and ▲sample holder synthesized from
0.3 g complex VI in 6 g HDA at a) 140 °C, b) 160 °C and c) 180 °C.
6.2 Conclusions
Cobalt sulphide nanoparticles were synthesized from complex V at different temperatures.
Close to spherical shapes were observed at all temperatures for complex V. The absorption
spectra showed a decrease in absorption maxima and band gap as the temperature was
increased. This decrease in absorption maxima and band gap is associated to a decrease in
particle size as the temperature was increased. At high temperatures (160 and 180 °C) smaller
particles or good passivation of nanoparticles was observed and it was supported by optical
measurements which showed narrow absorption and emission bands. Low temperature showed
bigger particles which was supported by PL which showed broad emission peak. The XRD
patterns confirmed face-centered cubic phase of Co3S4 and also confirmed the presence of
smaller particles at higher temperatures with wide peak width. Complex VI showed featureless
optical measurement, undefined bigger particles morphology and C7OS8 phase at all
temperatures and it was concluded that the nanoparticles were synthesised using a decomposed
complex.

82
Chapter 7
General conclusions and recommendations
7.1 Overall conclusions
Lead, nickel and cobalt sulphide nanoparticles were synthesized from lead, nickel and cobalt
complexes of benzimidazole dithiocarbamate (I, III and V) and 2-methylbenzimidazole
dithiocarbamate (II, IV and VI). The effect of nature of the precursor, temperature, amount of
precursor concentration and type of capping agent were studied. Techniques such as
microanalysis, FTIR spectroscopy and TGA were used to characterize the complexes. There
was a percentage mismatch from elemental analysis for complexes I, III, IV and V. However
complex II and VI calculated percentages were within the limits with the found percentages
except for sulphur percentages which had low values. The found percentages on complexes I
and III showed that the formed complexes were dimers and this was in line with FTIR
spectroscopy which exhibited the doublet C=S band. Complexes IV and V showed that the
leaving groups such as the sodium chlorides and hydroxides were still present in the complexes
as impurities. FTIR spectroscopy confirmed the presence of v(C=S) singlet peak in all four
complexes which indicates completely symmetrical bonding of the dithiocarbamate ligand to
metal in a bidentate mode except for complex I and III which displayed a doublet peak which
indicates monodentate coordination mode (dimeric molecules). The TGA curves decomposed
to form a mixture of metal and metal sulphides for complex I, II, III and IV and this was
confirmed by XRD which showed the presence of Pb and Ni metals in the patterns except for
complexes V and VI. All benzimidazole complexes (I, III and V) decomposed at higher
temperatures and were considered as the most stable complexes and this was confirmed by
TEM which showed most stable shapes (spheres and cubes) of nanocrystals.
The effect of type of capping agent (HDA and TOPO) was studied by varying reaction
temperature using complexes I and II on lead sulphide nanoparticles. From complexes I and II,
HDA was found to be the stable capping agent with a larger capping density since it produced
only cubic morphology and well resolved lead sulphide nanoparticles. TOPO capped lead
sulphide nanoparticles from complexes I and II depicted anisotropic particles. The optical
measurements supported the presence of smaller particles for both capping agents. TEM and
83
XRD for complex I showed that as the reaction temperature was increased the size of the
particles decreased and this was due to effect of decomposition rate. The optical properties for
TOPO capped PbS nanoparticles using complex I and II showed no specific trend and this was
confirmed by TEM and XRD which also gave no specific trend. HDA capped PbS
nanoparticles formed using complex I at 180 °C were monodispersed and it was considered as
the best temperature. TOPO capped PbS nanoparticles formed using complex I at 160 °C were
well resolved and the combination of optical and morphological properties proved that it was
best temperature. HDA capped PbS nanoparticles formed using complex II at 140 °C were well
resolved and it was considered as the best temperature. TOPO capped nanoparticle from
complex II were agglomerated under all temperature conditions used. XRD patterns for all
temperatures were well crystalline and matched cubic phase of PbS (Galena) except for HDA
capped PbS from complex I at low temperature which matched face centred cubic phase. There
was no significant change in the position of the peaks which means temperature only arrests
the nanoparticle growth and does not introduce any phase change for both complexes except
complex 1 at low temperature which introduced a new phase.
The temperature was observed to be affecting size, morphology and the composition of the
nanoparticles on nickel sulphide nanoparticles. The study of temperature revealed the increase
in band edges of nickel sulphide nanoparticles prepared by gradually increasing the reaction
temperature. This suggests that the particles size of the nanoparticles was increasing in size
with an increase in reaction temperature as a result of Oswald ripening. The TEM images
confirmed a mixture of spheres and cubes with particle sizes increasing with an increase in
temperature for complex III and a mixture of spheres, cubes, rods and triangles with cubes
being dominant at 160 °C for complex IV. This is expected as the rate of the reaction increases
with temperatures. XRD for both complexes exhibited cubic phase of Ni3S4 and impurities of
C7OS8 at all temperatures however there was an introduction of a monoclinic phase of NixS6 at
180 °C. Complex III was considered as the best since it gave stable shapes of nanocrystals 160
°C was considered as the best temperature since it gave well resolved particles.
The study of the concentration depicted that an increase in the amount of precursor increases
the size of the nanoparticles. But, the band edges of the nanoparticles did not show any specific
trend hence they were blue shifted from their bulk. This was due to change in shapes and it was

84
also confirmed by PL spectra which did not show any trend. Complex III depicted a mixture
of spheres and cubes at low concentrations, a mixture of cubes and sheets at high
concentrations. Complex IV depicted a mixture of spheres, cubes, triangles and rods with cubes
being dominant at all concentrations. XRD for complex III showed cubic Ni3S4at low
concentration, a mixture of cubic Ni3S4 and hexagonal NiS when the concentration was raised
to 0.35 g and impurities of NiSO4.6H2O at higher concentrations. XRD for complex IV
displayed cubic phase of Ni3S4 at all concentrations and impurities of C7OS8 at higher
concentrations. And also nickel as a metal was observed and this observation was in line with
the TGA which showed the residue of nickel sulphide plus nickel. The XRD pattern confirmed
that the amount of the precursor has a significant effect on the composition of the nanoparticles
as there were different phases observed as the amount of the precursor was varied. The capping
molecule and the amount of the precursor have a profound effect on the growth of the
nanoparticles.
Temperature was observed to be affecting size but did not have any significant effect on the
morphology and the composition of the nanoparticles on cobalt sulphide nanoparticles. The
absorption spectra from complex V showed a decrease in absorption maxima and band gap as
the temperature was increased. This decrease in absorption maxima and band gap was
associated to a decrease in particle size as the temperature was increased. At high temperatures
(160 and 180 °C) smaller particles or good passivation of nanoparticles was observed and it
was supported by optical measurements which showed narrow absorption and emission bands.
Low temperature showed bigger particles which was supported by PL which showed broad
emission peak. The morphology observed was close to spherical shapes. The XRD patterns
confirmed face-centred cubic phase of Co3S4 and also confirmed the presence of smaller
particles at higher temperatures with wide peak width. Complex VI showed featureless optical
measurement, undefined bigger particles morphology and C7OS8 phase at all temperatures and
it was concluded that the nanoparticles were synthesised using a decomposed complex. Nickel
sulphide nanoparticles gave narrow size distribution at all concentrations and temperatures as
compared to cobalt and lead sulphide nanoparticles.

85
7.2 Recommendations
Based on the results obtained and the conclusions provided in each section, the following
recommendations were made;
1. The complexes based on both benzimidazole derivatives should be prepared using one-pot
synthesis method and should be washed more than three times and then be recrystallized to
remove impurities.
2. The more bulky ligands can be used and if successful they can also be explored using X-
ray crystallography.
3. Dithiocarbamates complexes should be purchased to avoid the instability problems.
Alternatively, the modification of the alkyl or aryl groups must be extended to relatively
bulkiness to bring stability.
4. TOPO capped nickel and cobalt sulphide nanoparticles on the growth of nanoparticles
should be investigated using complex III, IV, V and VI to understand their chemistry more.
5. Temperature above 200 °C should be investigated to understand the formation of
anisotropic particles when TOPO was used as a capping agent and for the HDA capped
nickel sulphide nanoparticles.
6. Variation of reaction time intervals is recommended in the preparation of nanoparticles.
7. During the synthesis of the ligands further organic separation techniques must be used such
as column to understand fully the extent of the formation of the desired organic ligands.
86
7.3 References
ABDELHADY, A. L., MALIK, M. A., O’BRIEN, P. & TUNA, F. 2012. Journal of Physical
Chemistry C 116, 2253–2259.
ABE, T., TACHIBANA, Y., UEMATSU, T. & LWAMOTO, M. 1995. Journal of the
Chemical Society, Chemical Communications 1617-1618
ALAM, N., HILL, M. S., KOCIOK-KOHN, G., ZELLER, M., MAZHAR, M. & MOLLOY,
K. C. 2008. Journal of Chemistry of Materials, 20, 6157-6162.
APARNA, D. C., SASHI SIGH, B., MAJID KAZEMIAN, A., REME, P. & KULKARNI, S.
K. 2008. Journal of Materials Letters, 62, 3803-3805
ARIPONNAMMAL, S. & SRINIVASAN, T. 2013. Research Journal of Recent Sciences, 2,
102-105
ARUL, B. P., RAMALINGAM, K., BASKARAN, R., BOCELLI, G. & CANTONI, A. 2007.
Polyhedron, 26, 1133-1138.
ASO, K., KITAURA, H., HAYASHI, A. & TATSUMISAGO, T. 2011. Journal of Materials
Chemistry, 21, 2987-2990
AZIZI, N., ARYANASAB, F. & SAIDI, M. R. 2006a. Journal of Organic Letters, 8, 5275–
5277.
AZIZI, N., ARYANASAB, F., TORKIYAN, L., ZIYAEI, A. & SAIDI, M. R. 2006b.
Journal of Organic Chemistry, 71, 3634-3635.
BAIRD, M. C. & WILKINSON, G. J. 1967. Journal of the Chemical Society A, 865-872
BANERJEE, M., CHONGAD, L. & SHARMA, A. 2013. Journal of Recent Sciences, 2,
326-329.
BAO, S. J., LI, C. M., GUO, C. X. & QIAO, Y. 2008a. Journal of Power Sources, 180, 676–
681.
BAO, S. J., LI, Y. B., LI, C. M., BAO, Q. L., LU, Q. & GUO, J. 2008b. Journal of Crystal
Growth & Design, 8, 3745–3749.
BAO, S. J., LI, Y. B., LI, C. M., BAO, Q. L., LU, Q. & GUO, J. 2008c. Journal of Crystal
Growth & Design, 8, 3745–3749.
BARKER, H. A., SMYTH, R. D., WEISSBACH, H., TOOHEY, J. I., LADD, J. N. &
VOLCANI, B. E. 1960. Journal of Biological Chemistry, 235, 480-488.
BARRY, L., HOLMES, J. D., OTWAY, D. J., COPLEY, M. P., KAZAKOVA, O. &
MORRIS, M. A. 2010. Journal of Physics: Condensed Matter, 22, 76001-76005.

87
BEAL, J. H. L., ETCHEGOIN, P. G. & TILLEY, R. D. 2010. Journal of Physical Chemistry
C 114, 3817-3821.
BHATT, A., SENGUPTA, S. K. & PANDEY, D. P. 2001. Journal of Chemistry, 40A, 994-
998.
BORHADE, A. V. & UPHADE, B. K. 2012. Journal of Chalcogenide Letters, 9, 299 - 306.
BRUS, L. E. 1984. Journal of Chemical Physics, 80, 4403-4407.
CAI, W., LI, Z. & SUI, J. 2008. Journal of Nanotechnology, 19, 1-6.
CHATURVEDI, D. & RAY, S. 2006. Tetrahedron Letters, 47, 1307-1309.
CHAUHAN, R., TRIVEDI, M., SINGH, J., MOLLOY, K. C., KOCIOK-KÖHN, G.,
MULIK, U. P., AMALNERKAR, D. P. & KUMAR, A. 2014. Journal of Inorganica
Chimica Acta 415 69–74.
CHEN, X. Y., ZHANG, Z. J., QIU, Z. G., SHI, C. W. & LI, X. L. 2007. Journal of Colloid
and Interface Science, 308, 271–275.
CHENG, Z., WANG, S., WANG, Q. & GENG, B. 2010. Journal of Crystal Engineering
Communications, 12, 144-149.
COTTON, F. A., WILKSON, G., MURILLO, C. A. & BOCHMANN, M. 1996. Advanced
inorganic chemistry, 6th ed., John Wiley and Sons, Inc, New York
CRUZ-VAZQUEZ, C., INOUE, M., INOUE, M. B., BERNAL, R. & ESPINZA
_BELTRAN, F. J. 2000. Journal of Thin Solid Films, 373, 1 -5
DAS, D. & SINHA, C. 1998. Journal of Chemistry, 37, 531-534
DENG, D., CHEN, X., YU, L., WU, X., LIU, Q., LIU, Y., YANG, H., TIAN, H., HU, Y.,
DU, P., SI, R., WANG, J., CUI, X., LI, H., XIAO, J., XU, T., DENG, J., YANG, F.,
DUCHESNE, P. N., ZHANG, P., ZHOU, J., SUN, L., LI, J., PAN, X. & BAO, X.
2015. Journal of Science Advances, 1, 1-9.
DESHMUKH, L. P. & MANE, S. T. 2011. Digest Journal of Nanomaterials and
Biostructures, 6, 931-936
DEYU, L., YIYING, W., PHILIP, K., LI, S., PEIDONG, Y. & ARUN, M. 2003. Journal of
Applied Physics Letters, 83, 2934-2936.
DING, T., ZHANG, J., LONG, S. & ZHU, J. 2003. Journal of Microelectronic Engineering
66, 46–52.
DONALD OKLI, N. & CECILIA OKOLI, N. 2012. Journal of Natural Sciences, 2, 5-8
DUTTA, A. & DOLUI, S. K. 2008. Materials Chemistry and Physics, 112, 448–452.

88
EL-MASRY, A. H., FAHMY, H. H. & ABDELWAHED, S. H. A. 2000. Journal of
Molecules, 5, 1429-1438.
EZEMA, F. I. & OSUJI, R. U. 2007. Journal of Chalcogenide Letters, 4, 69 -75.
FAHLMAN, B. 2007. Springer: Mount Pleasant, Michigan. Journal of Materials Chemistry,
1, 282-283.
FAN, C., REGULACIO, M. D., YE, C., LIM, S. H., ZHENG, Y., XU, Q., XU, A. & HAN,
M. 2014. Journal of Chemical Communications, 50, 7128-7131.
FARADAY, M. 1857. Journal of Philosophical Transactions of the Royal Society of London,
147, 145-181.
FENG, Y. G., HE, T. & ALONSO-VANTE, N. 2008. Journal of Chemistry of Materials, 20,
26-28
FRIEMELT, K., LUX-STEINER, M. C. & BUCHER, E. 1993. Journal of Applied Physics,
74, 5266-5268.
GAO, M., YANG, Y., YANG, B., BIAN, F. & SHEN, J. 1994. Journal of the Chemical
Society, Chemical Communications, 2779-2780
GE, J. P. & LI, Y. D. 2003. Journal of Chemical Communications, 2498–2499.
GENG, G., LIU, X., MA, J. & DU, Q. 2007. Journal of Materials Science and Engineering
145 17-22.
GHEZELBASH, A. & KORGEL, B. A. 2005. Journal of Langmuir, 21 9451–9456.
GHEZELBASH, A., SIGMAN, M. B. & KORGEL, B. A. 2004. Journal of Nano Letters, 4,
537-542.
GOSWAMI, N., GIRI, A. & PAL, S. K. 2013. Journal of Langmuir, 29, 11471–11478.
GREEN, M. & O’BRIEN, P. 1998. Journal of Chemical Communications, 22, 2459-2460
GUZELIAN, A. A., KATARI, J. E. B., KADAVANICH, A. V., BANIN, U., HAMAD, K.,
JUBAN, E. & ALIVISATOS, A. P. 1996. Journal of Physical Chemistry, 100, 7212–
7219.
HALPERIN W. P. 1986. Reviews of Modern Physics, 58, 533-533.
HAN, S., KIM, K., AHN, H., AHN, J. & J., L. 2003. Journal of Alloys and Compounds, 361,
247-251.
HINES, M. A. & SCHOLES, G. D. 2003. Journal of Advanced Materials, 15, 1844–1849
HU, J., LI, L. S., WANG, L. W., MANNA, L. & ALIVISATOS, A. 2001. Journal of
Science, 292, 2060-2063.
89
HU, Y., CHEN, J., CHEN, W., LIN, X. & LI, X. 2003. Journal of Advanced Materials, 15,
726-729.
HUIXIANG, J., MI, Y., HUI, Z., MINGZHE, X. & DEREN, Y. 2005. Journal of materials
Letters, 59, 1024-1027.
HUYNH, H. V., HO, J. H. H., NEO, T. C. & KOH, L. L. 2005. Journal of Organometallic
Chemistry, 690 3854–3860.
JAYARAJU, A., AHAMAD, M. M., RAO, R. M. & SREERAMULU, J. 2012. Journal of
Der Pharma Chemica, 4 1191-1194.
JEONG, U., TENG, X., WANG, Y., YANG, H. & XIA, Y. 2007. Journal of Advanced
Materials, 19, 33–60
JIAN, F., BEI, F., ZHAO, P., WANG, X., FUN, H. & CHINNAKALI, K. 2002. Journal of
Coordination Chemistry, 55, 429-437.
JOHNSON, I. & LA MER, V. K. 1947. Journal of the American Chemical Society 69, 1184-
1192.
JUN, Y., CHOI, J. & CHEON, J. 2006. Journal of the Gesellschaft Deutscher, 45, 3414–
3439
KARAMI, H., GHASEMI, M. & MATINI, S. 2013. Journal of International
Electrochemical Science, 8, 11661-11679.
KARLIN, K. D. 2005. Progress in Inorganic Chemistry. John Wiley and Sons, 53, 71-71.
KHAORAPAPONG, N. & OGAWA, A. O. M. 2011. Journal of Applied Clay Science, 51,
182 -186.
KHIEW, P. S., HUANG, N. M., RADIMAN, S. & AHMAD, M. S. 2004. Journal of
Materials Letters, 58, 762-767.
KNIGHT, E. R., LEUNG, N. H., THOMPSON, A. L., HOGARTH, G. & WILTON-ELY, J.
D. E. T. 2009. Journal of Inorganic Chemistry, 48, 3866–3874.
KULLERUD , G. & A., Y. R. 1962. Journal of petrol, 3, 126-175.
KWON, S. G. & HYEON, T. 2011. Journal of Nano Micro Small, 7, 2685-2702.
LEE, H., KIM, H., DOO, S. & CHO, J. 2007. Journal of the Electrochemical Society 154,
A343-A346.
LELONG, G., BHATTACHARYYA, S., KLINE, S., CACCIA GUERRA, T., GONZALEZ,
M. A. & SABOUNGI, M. L. 2008. Journal of Physical Chemistry, C 112, 10674-
10680.

90
LIU, J., XING, Y., LIU, X., YU, X. & SU, Z. 2012. Journal of Materials Characterization,
67 112–118.
LIU, X. H. 2005. Journal of Materials Science and Engineering B, 119, 19–24.
LOU, W., CHEN, M., WANG, X., ZHANG, Y. & LIU, W. 2006. Journal of Chemistry
Letters, 35, 850-857.
MAHESHWARI, V., KANE, J. & SARAF, R. F. 2008. Journal of Advanced Materials, 20,
284-287.
MALIK, M., A.,, OBRIEN, P. & REVAPRASADU, N. 2000. South African Journal of
Science, 96, 55-60.
MANAV, N., MISHRA , A. K. & KAUSHIK, N. K. 2004. Journal of Spectrochimica Acta
Part A: Molecular and Biomolecular Spectroscopy, 60, 3087–3092.
MANAV, N., MISHRA, A. K. & KAUSHIK, N. K. 2006. Spectrochimica Acta Part A 65,
32–35.
MARKOVICH, G., COLLIER, C. P., HENRICHS, S., REMACLE, F., LEVINE, R. D. &
HEATH, J. R. 1999. Accounts of Chemical Research., 32, 415-423.
MOHAMED, G. G., IBRAHIM, N. A. & H.E.A, A. 2009. Journal of Spectrochimica Acta
Part A: Molecular and Biomolecular Spectroscopy, 72, 610–615.
MOLOTO, M. J., REVAPRASADU, N., KOLAWOLEA, G. A., O’BRIEN, P. & MALIK,
M. A. 2005. South African Journal of Science 101, 463-465.
MOURDIKOUDIS, S., COLLIE, V., AMIENS, C., FAU, P. & KAHN, M. L. 2013.
Langmuir, 29, 13491−13501.
MOUSA, A. 2011a. Synthesis and Charactarization of PbS Quantum Dots. Dissertation, 15-
16.
MOUSA, A. 2011b. Synthesis and Characterization of PbS Quantum Dots. Dissertation, 6-6.
MTHETHWA, T., PULLABHOTLA, V. S. R., MDLULI, P. S., SMITH, J. W. &
REVAPRASADU, N. 2009. POLYHEDRON, 28, 2977–2982.
MULMUDI, H. K., BATABYAL, S. K., RAO, M., PRABHAKAR, R. R., MATHEWS, N.,
LAM, Y. M. & MHAISALKAR, S. G. 2011. Journal of Physical Chemistry
Chemical Physics, 13, 19307-19309.
MURRAY, C. B., KAGAN, C. R. & BAWENDI, M. G. 2000. Annual Review of Materials
Science, 30, 545-610.
MURRAY, C. B., NORRIS, D. J. & BAWENDI, M. G. 1993. Journal of the American
Chemical Society, 115, 8706–8715.

91
NABIYOUNI, G., MOGHIMI, E., HEDAYATI, K. & JALAJERDI, R. 2012. Journal of
Main Group Metal Chemistry, 35, 173–178.
NAIR, P. S., RADHAKRIHSNAN, T., REVAPRASADU, N., KOLAWOLE, G. A. &
O'BRIEN, P. 2003. POLYHEDRON, 22, 3129-3135.
NAIR, P. S., RADHAKRIHSNAN, T., REVAPRASADU, N., KOLAWOLE, G. A. & P., O.
B. 2002. Journal of Chemical Communications, 564-565.
NAIR, P. S. & SCHOLES, G. D. 2006. Journal of Materials Chemistry, 16, 467-473.
NAMI, S. A. A. & SIDDIQI, K. S. 2004. Journal of Inorganic and Metal-Organic
Chemistry, 34, 1581–1590.
NATH, S. K. & KALITA, P. K. 2012. Journal of Nanoscience and Nanotechnology, 2, 8-12.
NAVANEETHAN, M., NISHA, K. D., PONNUSAMY, S. & MUTHAMIZHCHELVAN, C.
2009. Reviews on Advanced Materials Science, 21, 217-224.
NNABUCHI, M. N. & CHINEDU, E. E. 2010. Journal of Chalcogenide Letters, 7, 31-38.
NYAMEN, L. D., NEJO, A. A., PULLABHOTLA, V. S. R., NDIFON, P. T., MALIK, M.
A., AKHTAR, J., O’BRIEN, P. & REVAPRASADU, N. 2014. POLYHEDRON, 67,
129–135.
ONWUDIWE, D. C. & AJIBADE, P. A. 2011. International Journal of Molecular Sciences,
12, 1964–1978. .
ONWUDIWE, D. C., EKENNIA, A. C. & HOSTEN, E. 2016. Journal of Coordination
Chemistry, 69, 2454–2468.
ONWUDIWE, D. C. & STRYDOM, C. A. 2013. Journal of Materials Letters, 92, 71–74.
OVIEDO-ROA R., MARTINEZ-MAGADAN J. M. & ILLAS F. 2006. Journal of Physical
Chemistry B, 110, 7951-7966.
PANDEYA, K. B., SINGH, R., MATHUR, P. K. & P., S. R. 1986. Journal of Transition
Metal Chemistry, 11, 340-344.
PAWAR, V., JOSHI, S. & V., U. 2011. Journal of Chemical and Pharmaceutical Research,
3, 169-175.
PENG, X. 2003. Journal of Advanced Materials, 15, 459-463.
PENG, X. G., MANNA, L., YANG, W. D., WICKHAM, J., SCHER, E., KANDAVICH, A.
& ALIVISATOS, A. P. 2000a. Journal of Science, 404, 59-62.
PENG, X. G., MANNA, L., YANG, W. D., WICKHAM, J., SCHER, E., KANDAVICH, A.
& ALIVISATOS, A. P. 2000b. Nature, 404, 59-61.
PENG, Z. & PENG, X. 2002. Journal of the American Chemical Society, 124, 3343-3353.

92
PETIT, C., JAIN, T. K., BILLOUDET, F. & PILENI, M. P. 1994. Langmuir, 10, 4446–4450.
PHURUANGRAT, A., THONGTEM, T. & THONGTEM, S. 2008. Journal of Applied
Surface Science, 254, 7553-7558.
PLYUSNIN, V. F., GRIVIN, V. P. & LARIONOV, S. V. 1997. Coordination Chemistry
Reviews, 159, 121-133.
PRADHAN, N., KATZ, B. & EFRIMA, S. 2003. Journal of Physical Chemistry B, 107,
13843–13854.
PRAKASAM , B. A., RAMALINGAM, K., BASKARAN, R., BOCELLI, G. & CANTONI,
A. 2007. POLYHEDRON 26 1133–1138.
PULLABHOTLA, V. S. R. R. & MABILA, M. W. 2016. Journal of Materials Letters 183,
30–33.
QIAN, X. F., ZHANG, X. M., WANG, C., XIE, Y. & QIAN, Y. T. 1999. Journal of
Inorganic Chemistry, 38, 2621–2623.
QUADRI, S. B., YANG, J., RATNA, B. R., SKELTON, E. F. & 1996. Journal of Applied
Physics Letters, 69, 2205-2207.
RAMASAMY, K., MANEERPRAKORN, W., MALIK, M. A. & O’ BRIEN, P. 2010.
Journal of Philosophical Transactions of the Royal Society A, 368, 4249-4260.
RAO, C. N. R., KULKARNI, G. U., THOMAS, P. J. & EDWARDS, P. P. 2002. Journal of
Chemistry: European, 8, 28-35.
RAO, C. N. R. & PISHARODY, K. P. R. 1976. Journal of Progress in Solid State Chemistry
10, 267–270.
REVAPRASADU, N., MALIK, M. A., CARSTENS, J. & O'BRIEN, P. 1999a. Journal of
Materials Chemistry 9, 2885-2888
REVAPRASADU, N., MALIK, M. A., CARTENS, J. & O'BRIEN, P. 1999b. Journal of
Materials Chemistry, 9, 2885-2888
ROCO, M. C. 1999. Journal of Nanoparticle Research, 1, 1-6.
ROFFEY, A., HOLLINGSWORTH, N., ISLAM, H., MERCY, M., SANKAR, G.,
CATLOW, C. R. A., HOGARTH, G. & LEEUWA, N. H. 2016. Journal of the Royal
Society of Chemistry, 8, 11067–11075.
ROMANO-TRUJILLO, R., ROSENDO, E., ORTEGA, M., MORALES-SÁNCHEZ, A.,
GRACIA, J. M., DÍAZ, T., NIETO, G., GARCÍA, G., LUNA-LÓPEZ, J. A. &
PACIO, M. 2012 Journal of Nanotechnology, 23, 185602-185607.
93
ROSSETTI, R., ELLISON, J. L., GIBSON, J. M. & BRUS, L. E. 1984. Journal of Chemical
Physiccs, 80, 4464-4464.
ROSSETTI, R., HULL, R., GIBSON, J. M. & BRUS, L. E. 1985. Journal of Chemical
Physics 82, 552-557.
SAKTHIVEL, P., TAMILSELVI, S. S., MARY, T. A. & JESUDURAI, J. 2014.
International Journal of Scientific & Engineering Research, 5, 152-155.
SANGEETHA, S., PRIYADHARSINI, N., VAIRAM, S. B. & THAMILSELVAN, T. 2014.
Journal of NanoScience and NanoTechnology, 2, 400-403.
SHAA, Q. & WEI, Y. 2013. Journal of Organic & Biomolecular Chemistry 11, 5615-5620
SHARMA, M., SHARMA, A. & SACHAR, R. 2012. Journal of Chemistry-E, 9, 1929-1940.
SHINJI, O., YODHIHIKO, K., HIROJI, H. & KEI, M. 1998. Journal solid state
communications, 105, 7-10.
SIBOKOZA, S., B.,, MOLOTO, M., J.,, MOLOTO, N. & SIBIYA, P., N. 2017. Journal of
Chalcogenide Letters, 14, 69 - 78.
SIDDIQI, K. S., SHAHAB A. A. NAMI, S. A. A., CHEBUDE, L. & CHEBUDE, Y. 2006a.
Journal of the Brazilian Chemical Society, 17, 107-112.
SIDDIQI, K. S., SHAHAB A. A. NAMI, S. A. A., CHEBUDE, L. & CHEBUDE, Y. 2006b.
Journal of the Brazilian Chemical Society, 17, 107-112.
SIFUENTES, C., YBARMENKOV, STRODUMOV, A., FILIPOV, V. & LIPOVSKII, A.
2000. Journal of Optical Engineering 39, 2182-2186
SMITH, G. B., IGNATIEV, A. & ZAJAC, G. 1980. Journal of Applied Physics, 51, 4186-
4197
SOO, Y. L., MING, Z. H., HUANG, S. W., KAO, Y. H., BHARGAVA, R. N. &
GALLAGHER, D. 1994. Journal of physical review, B 50, 7602-7602.
SRIVASTAVA, S. K. & AVASTHI, B. N. 1992. Journal of Materials Science, 27, 3693–
3705.
SROUJI, F., AFZAAL, M., WATERS, J. & O'BRIEN, P. 2005. Journal of Chemical Vapor
Deposition, 11, 91–94.
STEIGERWALD, M. L., ALIVISATOS, A. P., GIBSON, J. M., HARRIS, T. D., KORTAN,
R., MULLER, A. J., THAYER, A. M., DUNCAN, T. M., DOUGLASS, D. C. &
BRUS, L. E. 1988. Journal of American Chemical Society, 110, 3046-3046
TARIQUE, M. 2011. E-Journal of Chemistry, 8, 2020-2023.
TARIQUE, M. 2012. Journal of Chemical Science Transactions, 1, 257-260.
94
TARIQUE, M. 2015. International Journal of Chemical Concepts, 01, 34-37
TARIQUE, M. & ASLAM, M. 2008a. Oriental Journal of Chemistry, 24, 267-270.
TARIQUE, M. & ASLAM, M. 2008b. Journal of Biosciences Biotechnology Research Asia,
5, 833-837.
TARIQUE, M. & ASLAM, M. 2008c. Journal of Biosciences Biotechnology Research Asia,
5, 355-355.
TARIQUE, M. & ASLAM, M. 2009. The Asian Journal of Experimental Chemistry, 4, 46-
48.
TARIQUE, M. & ASLAM, M. 2010. Asian Journal of Chemistry, 22, 2465-2467.
TIAN, L., YEP, L. Y., ONG, T. T., YI, J., DING, J. & VITTAL, J. J. 2009. Journal of
Crystal Growth and Design, 9, 352-357.
TOWEY, T. F., KHAN-LODHI, A. & ROBINSON, B. H. 1990. Journal of the Chemical
Society, Faraday Transactions, 86 3757-3757.
TRINIDADE, T. & O`BRIEN, P. 1997. Journal of Chemistry of Materials, 9, 523–530.
TRINIDADE, T. & O’BRIEN, P. 1996. Journal of Advanced Materials, 8, 161–163
VENUGOPAL, K., JAYARAJU, A. & SREERAMULU, J. 2015. Journal of Pharmacy
Research, 9, 125-128.
VICTORIANO, L. I. 2000a. POLYHEDRON, 19, 2269-2275
VICTORIANO, L. I. 2000b. Coorniation Chemistry Reviews, 196, 383-398.
WAGNER, E. C. & MILLETT, W. H. 1943. Journal of Organic Syntheses, 2, 65-65.
WANG, H., ZHANG, J. R., ZHAO, X. N., XU, S. & ZHU, J. J. 2002. Journal of Materials
Letters 55, 253-258.
WANG, Y. & HERRON, N. 1987. Journal of Physical Chemistry 91, 257–260.
WANG, Y., SUNA, A., MAHLER, W. & KASOWSKI, R. 1987. Journal of Chemical
Physiccs, 87, 7315-7322.
WANG, Y., ZHU, Q., TAO, L. & X., S. 2011. Journal of Materials Chemistry, 21, 9248-
9254
WATKZE, H. J. & FENDLER, J. H. 1997. Journal of Physical Chemistry, 91, 854.
WATTOO, M. H. S., QUDDOS, A., WADOOD, A., KHAN, M. B., WATTOO, F. H.,
TIRMIZI, S. A. & MAHMOOD, K. 2012. Journal of Saudi Chemical Society, 16,
257–261.

95
WHITNEY, T. M., JIANG, J. S., SEARSON, P. & CHIEN, C. 1993. Journal of Science,
261, 1316-1319
WILTON-ELY, J. D. E. T., SOLANKI, D., KNIGHT, E. R., HOLT, K. B., THOMPSON, A.
L. & HOGARTH, G. 2008. Journal of Inorganic Chemistry, 47 9642–9653.
YANG, X., WU, Q., DING, Y. & LIU, J. 2006. Journal of Korean Chemical Society, 27,
377-377.
YILMAZ, V. T., YAZICILAR, T. K., CESUR, H., OZKANCA, R. & MARAS, F. Z. 2003.
Journal of Synthesis and Reactivity in Inorganic and Metal-Organic Chemistry, 33,
589–605.
YIN, Y. D., ERDONMEZ, C. K., CABOT, A., HUGHES, S. & ALIVISATOS, A. P. 2006.
Journal of Advanced Functional Materials 16, 1389–1399.
YU, Z., DU, J., GUO, S., ZHANG, J. & MATSUMOTO, Y. 2002. Journal of Thin Solid
Films, 415, 173-176.
YUE, G. H., YAN, P. X., FAN, X. Y., WANG, M. X., QU, D. M., WU, Z. G., LI, C. &
YAN, D. 2007. Journal of Electrochemical and Solid-State Letters, 10, 29-30.
ZEDAN, S. W. 2010. Journal of College of Basic Education Researchers 10, 530-542.
ZHANG, W., XU, L., TANG, K., LI, F. & QIAN, Y. 2005. European Journal of Organic
Chemistry, 2005, 653–656.
ZHOU, J., DING, Y., DENG, S. Z., GONG, L., XU, N. S. & WANG, L. Z. 2005. Journal of
Advanced Materials 17, 2107-2110.
ZHU, T., WANG, Z., DING, S., CHEN, J. S. & LOU, X. W. 2011. Journal of Rsc Advances,
1, 397-400.